
Mechanical Response of Pipeline Leakage to Existing Tunnel Structures: Insights from Numerical Modeling

Abstract
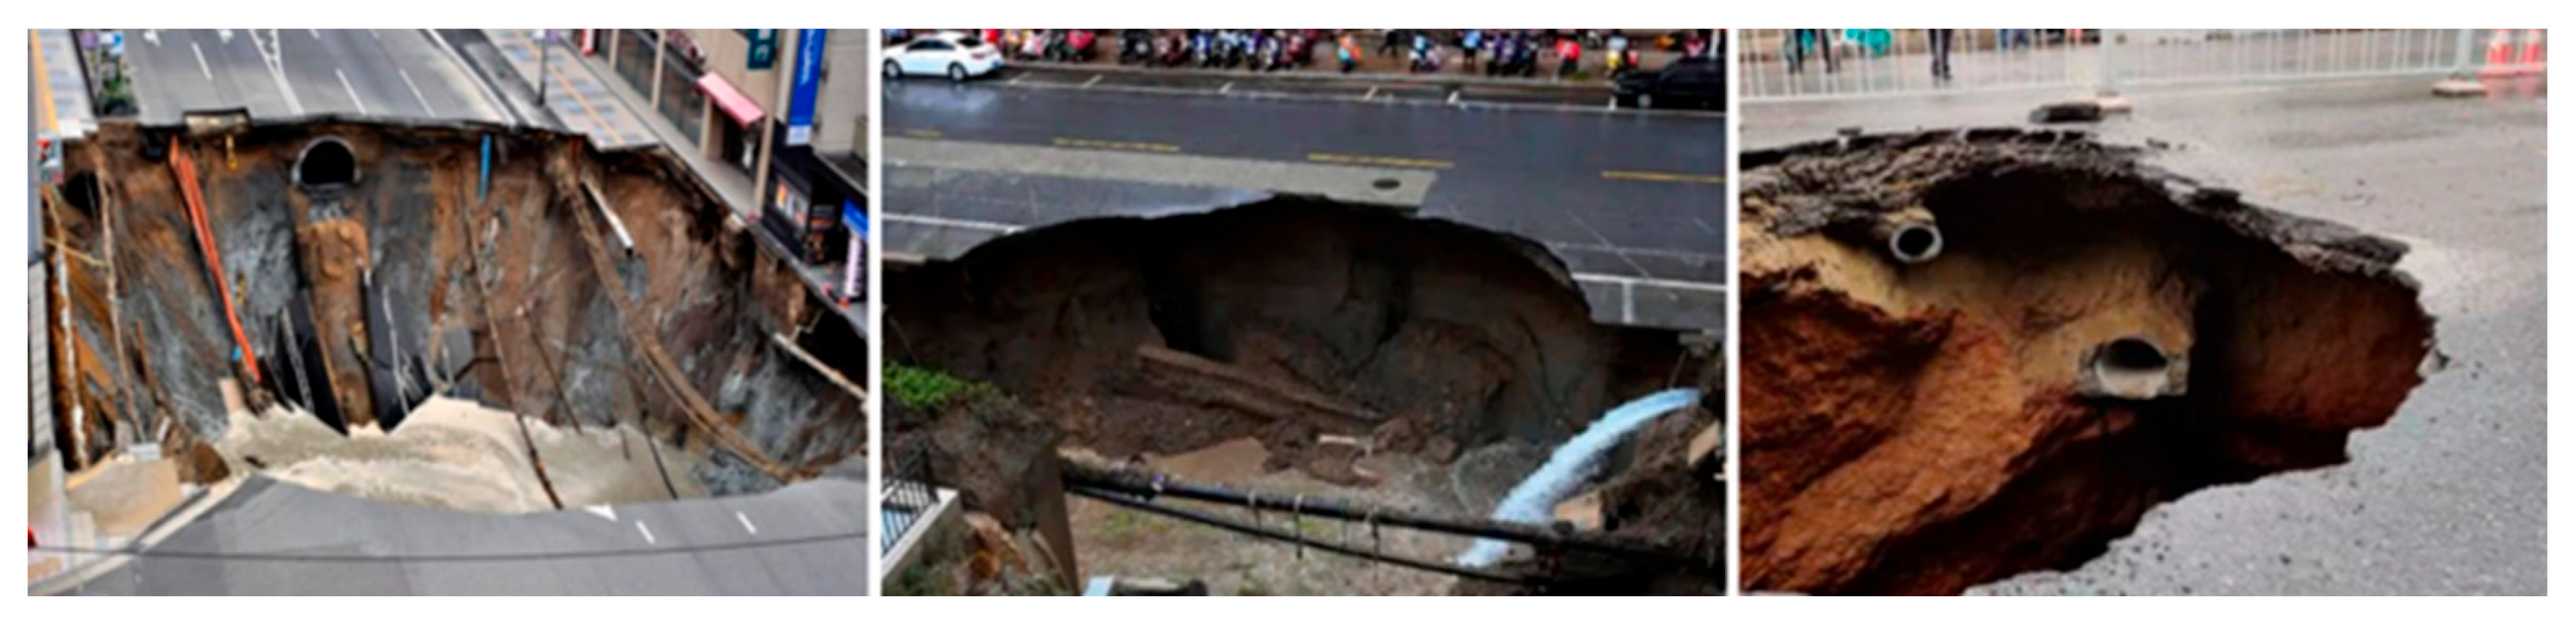
1. Introduction
2. Two-Dimensional Number Modeling
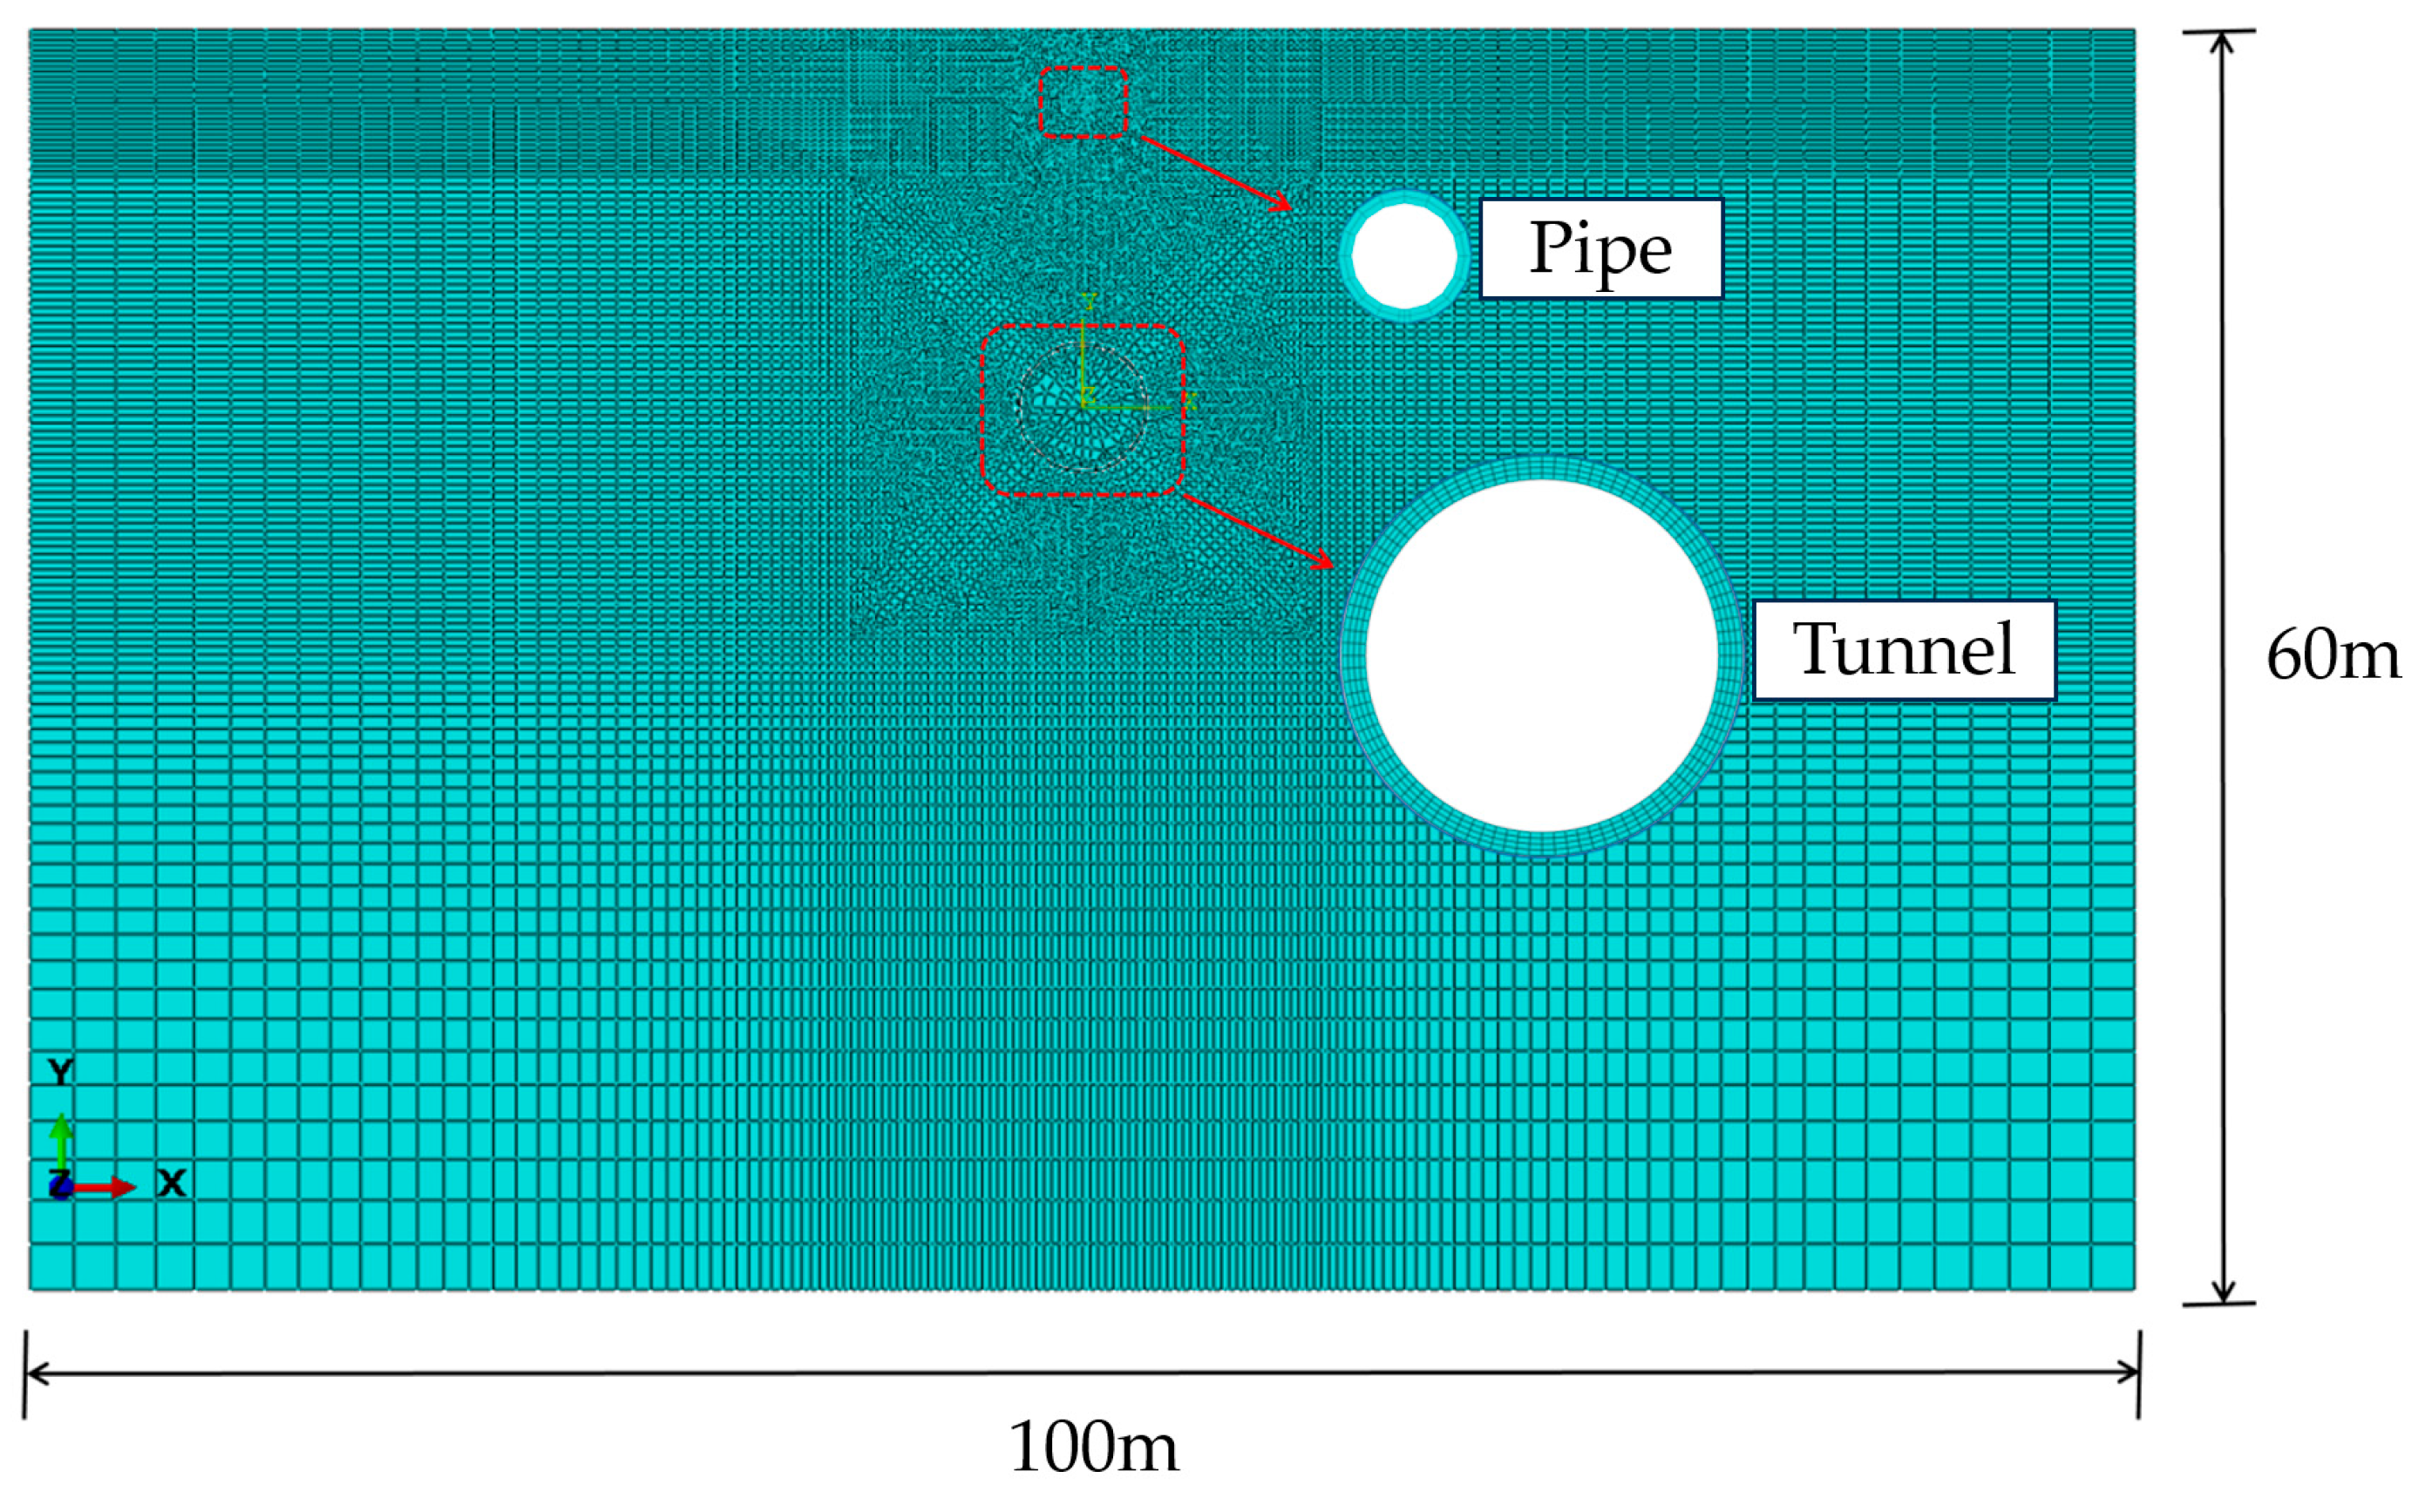
2.1. Overview of Two-Dimensional Numerical Model
2.2. Modeling of Tunnel Excavation
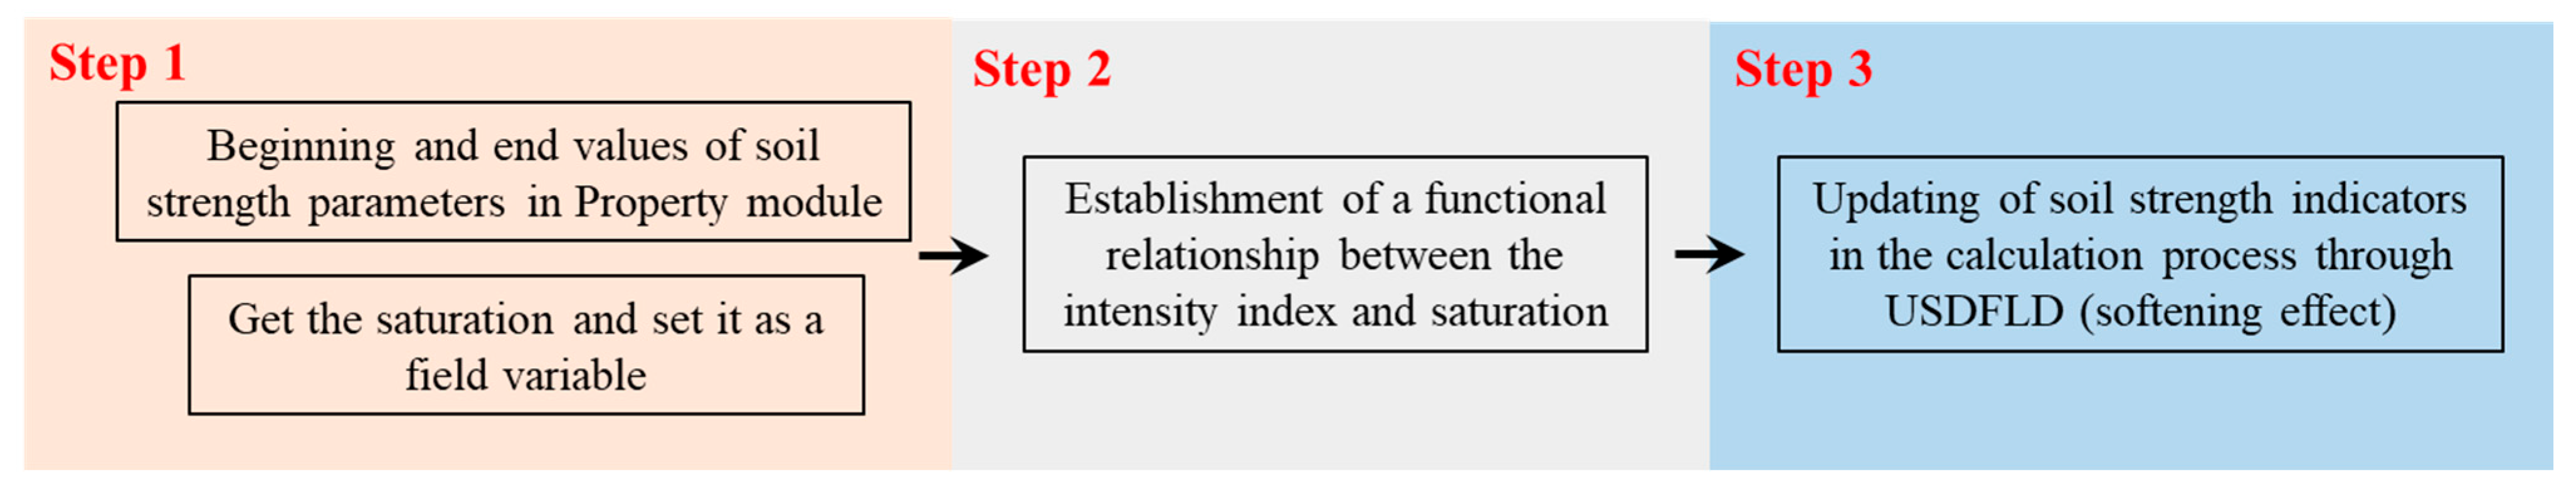
2.3. Modeling Fluid–Structure Coupling
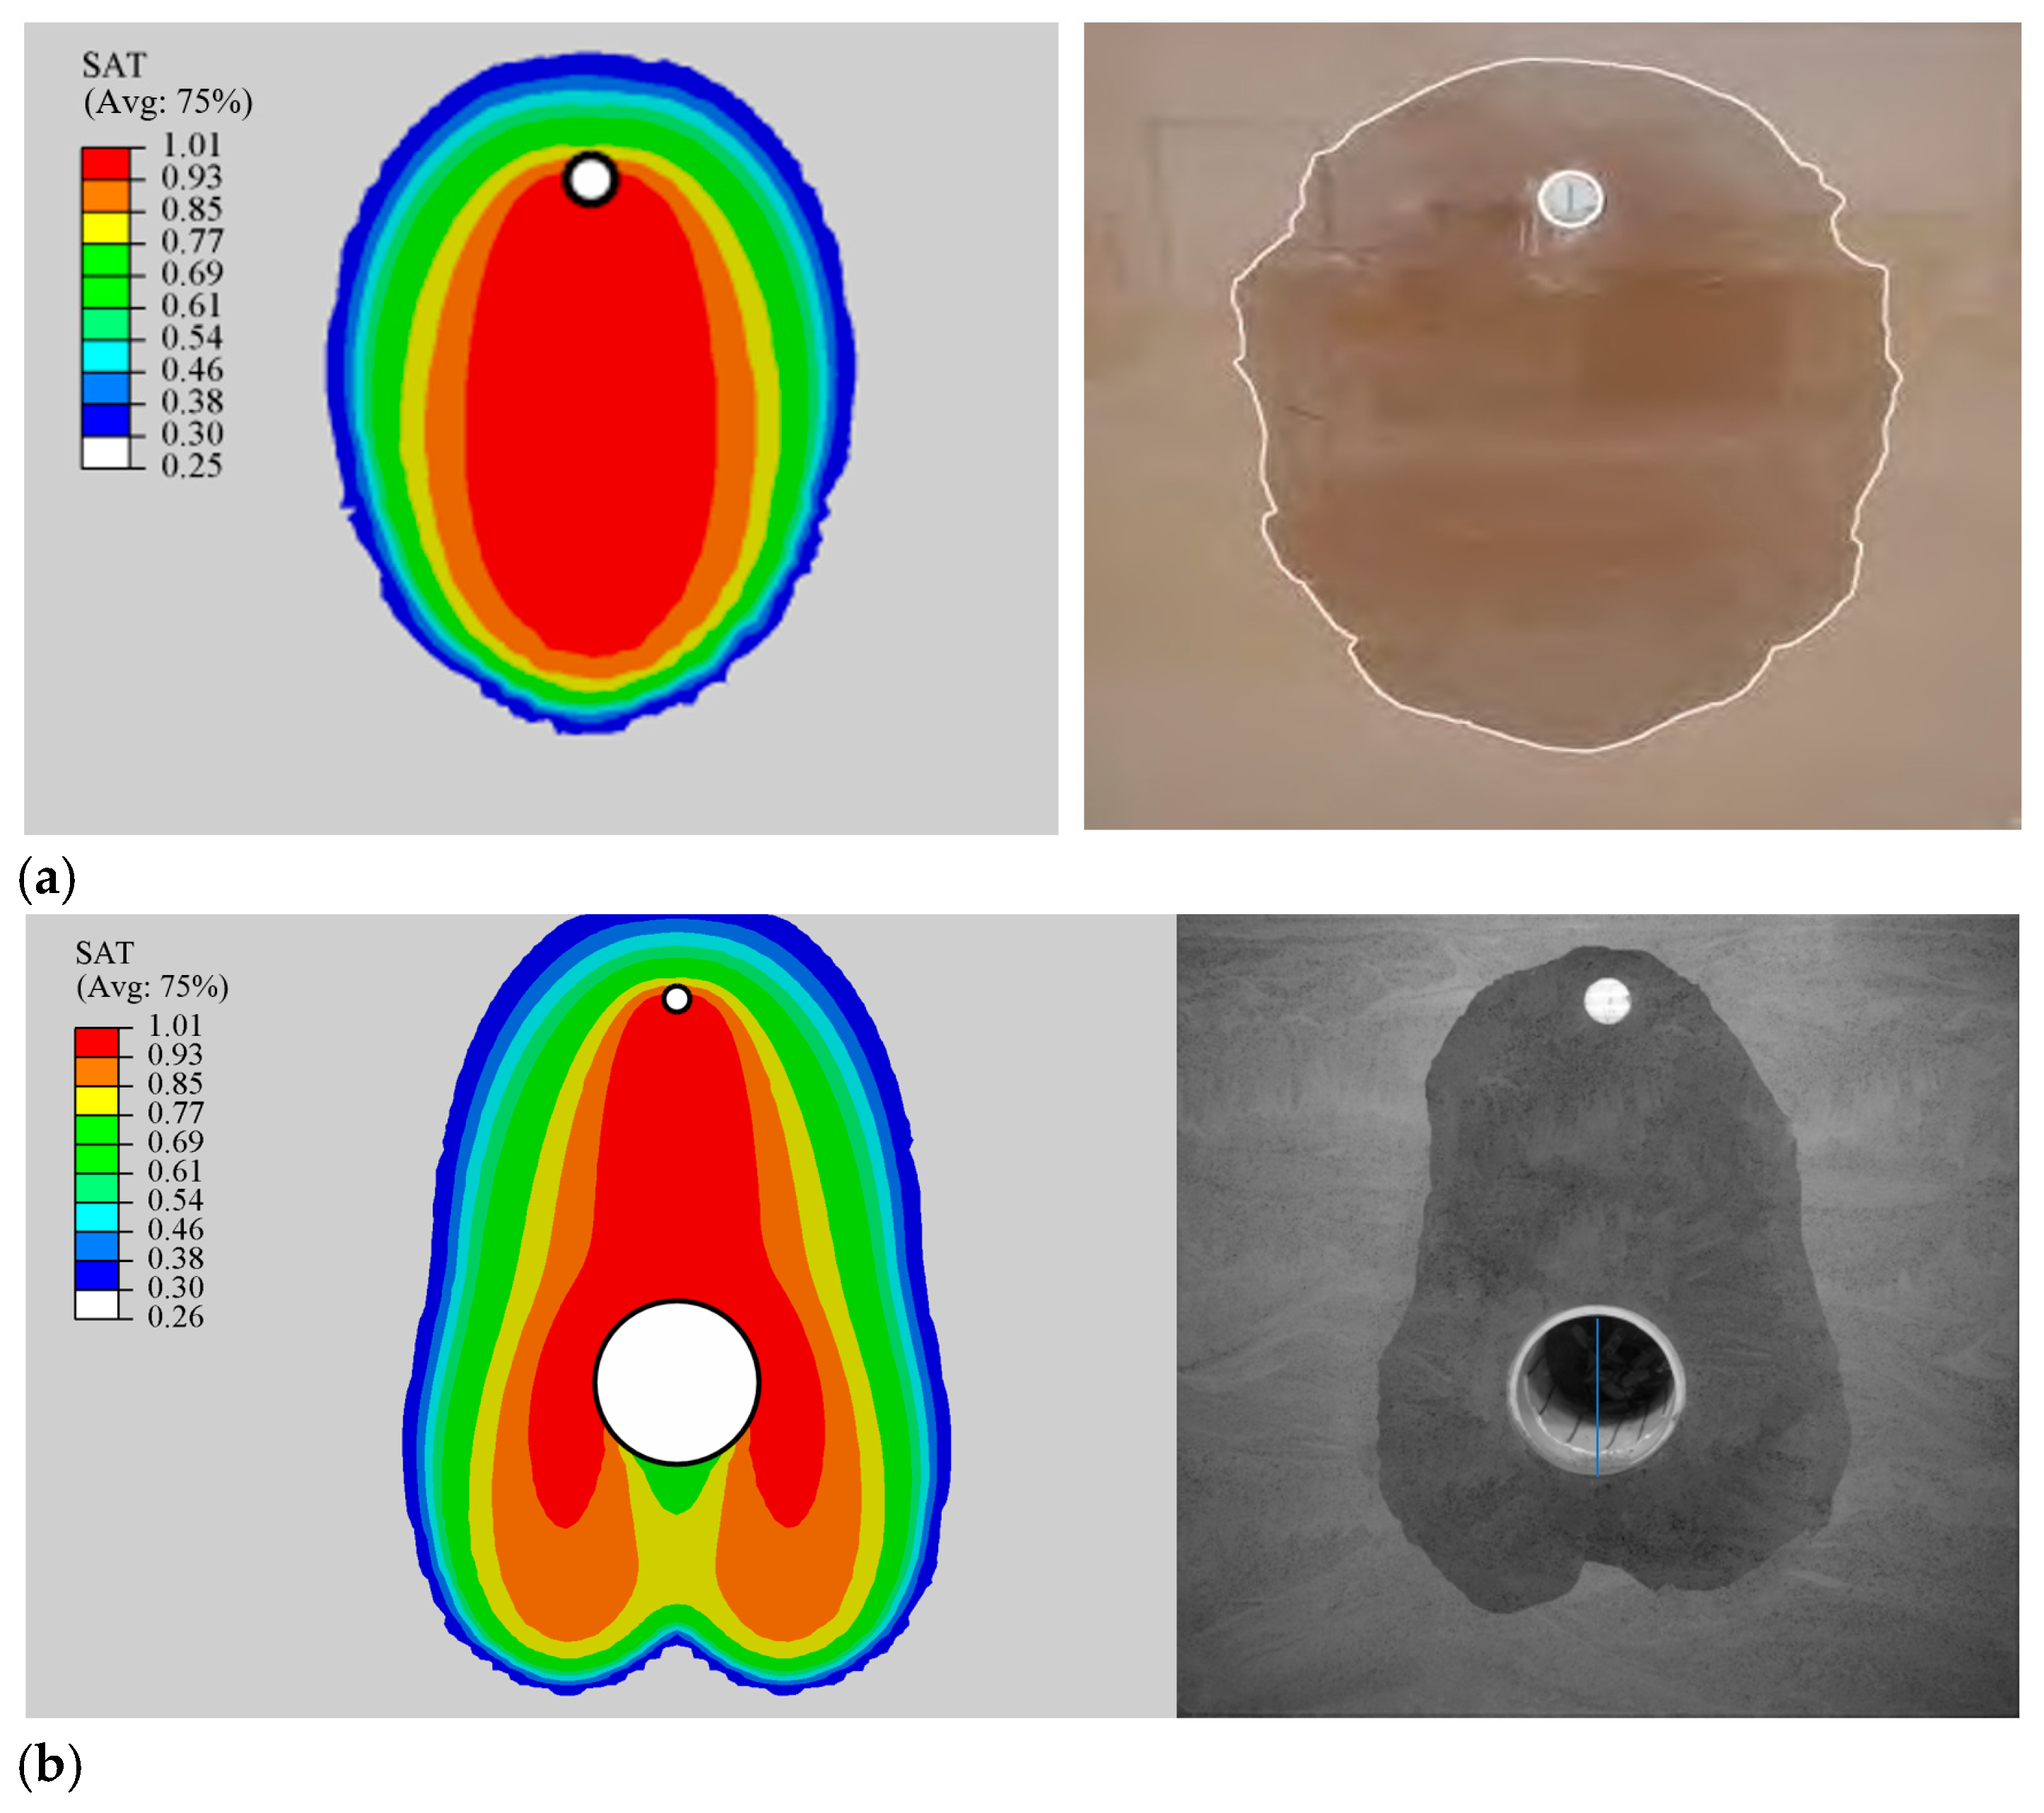
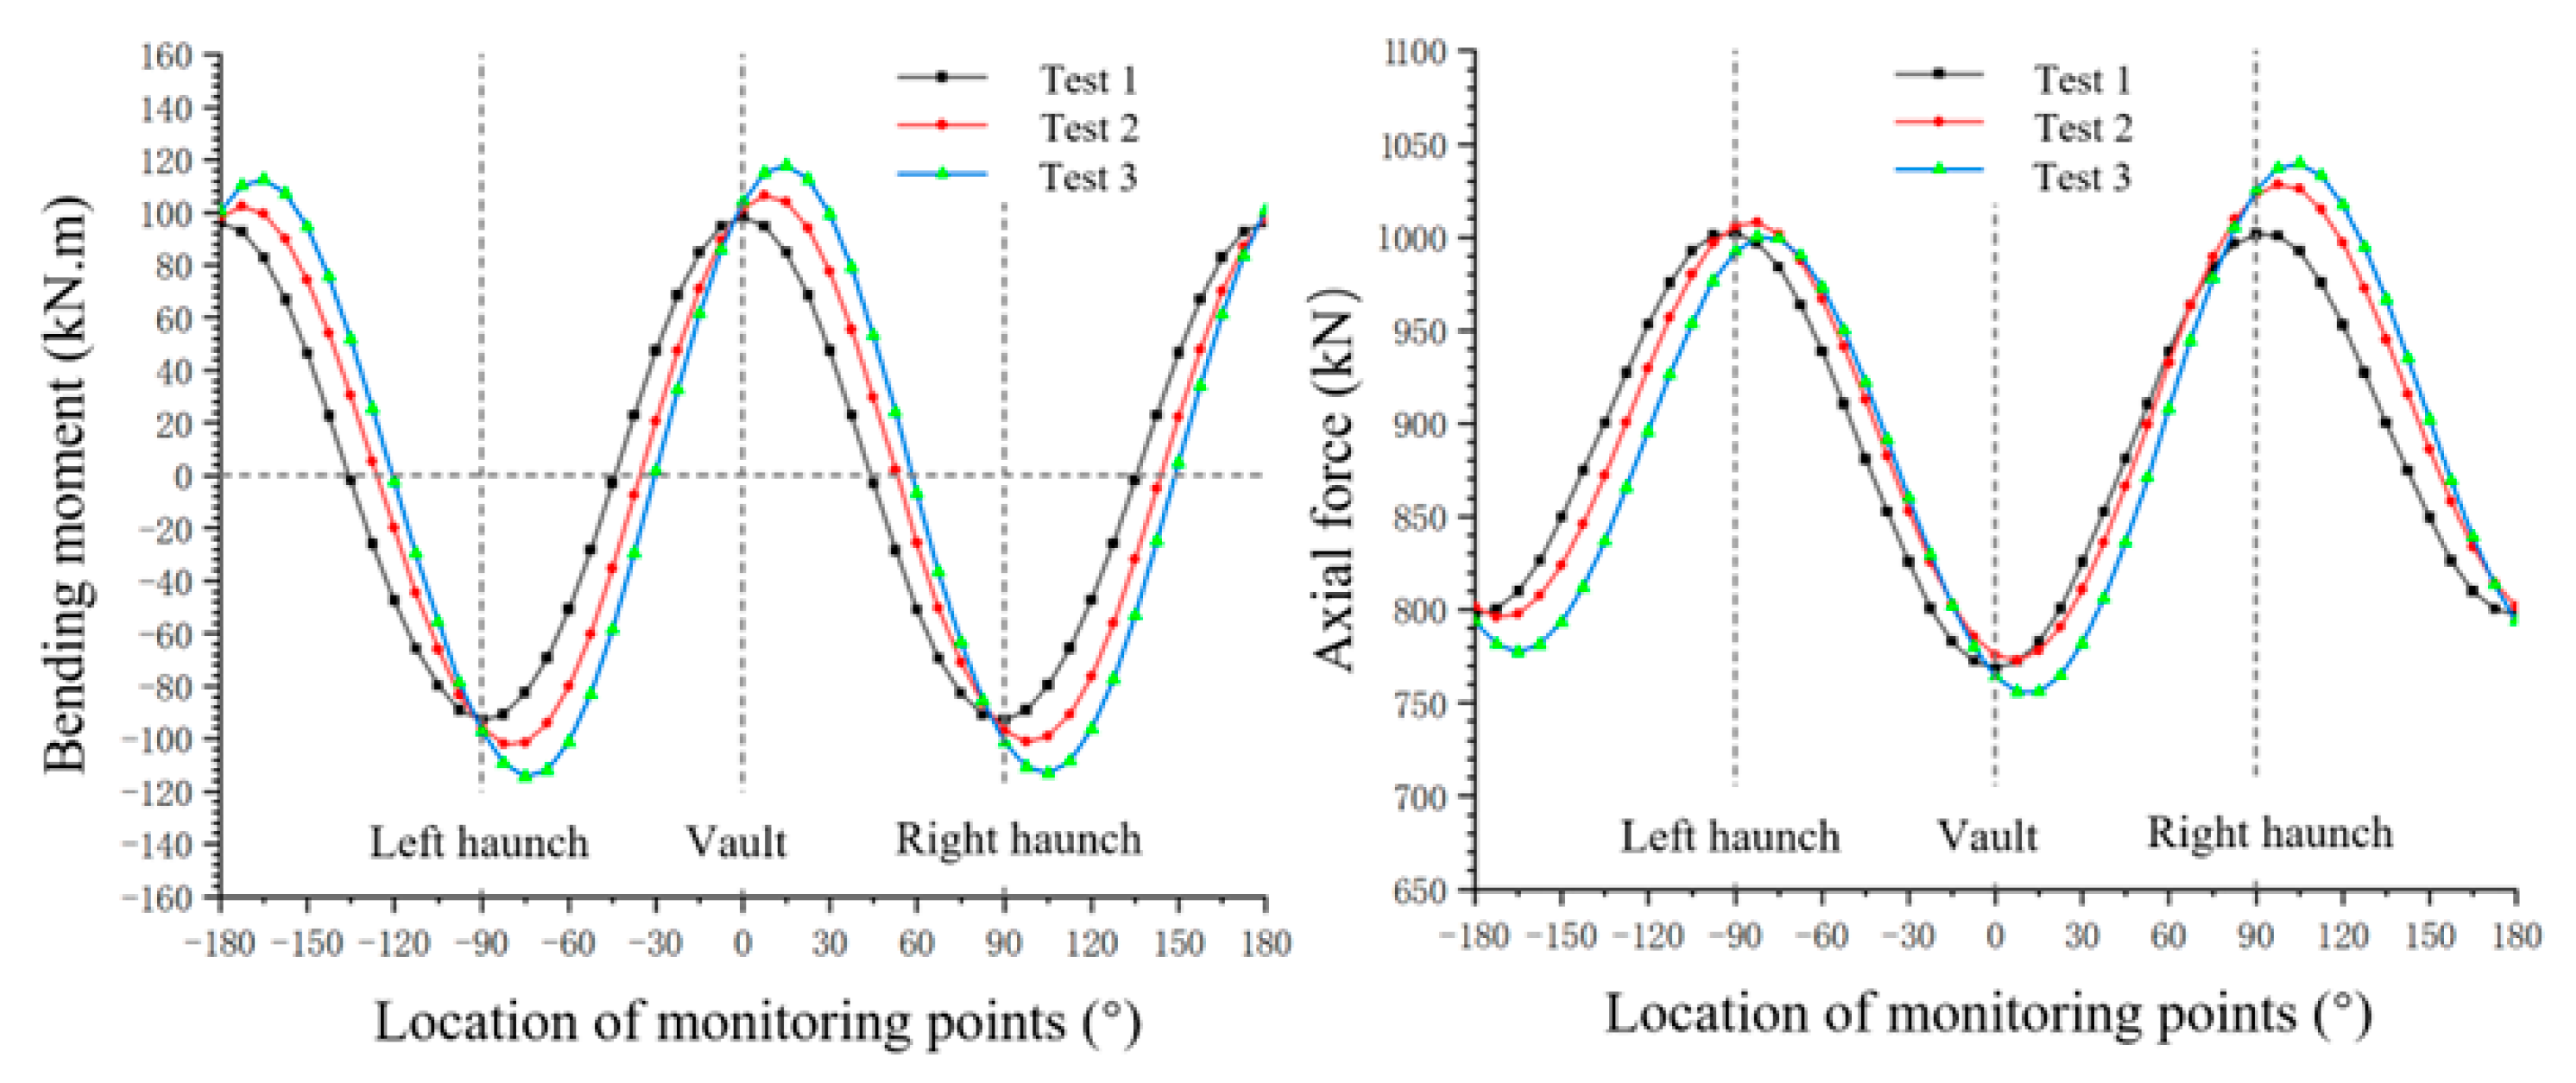
2.4. Validation Based on Case History
2.5. Analysis Cases
3. Results and Discussion
3.1. Influence of the Pipeline Leakage Process on the Strata
3.1.1. Analysis of Strata Infiltration Range
3.1.2. Analysis of Surface Displacement
3.2. Mechanical Response of the Lining Structure Under Segment Leakage Conditions
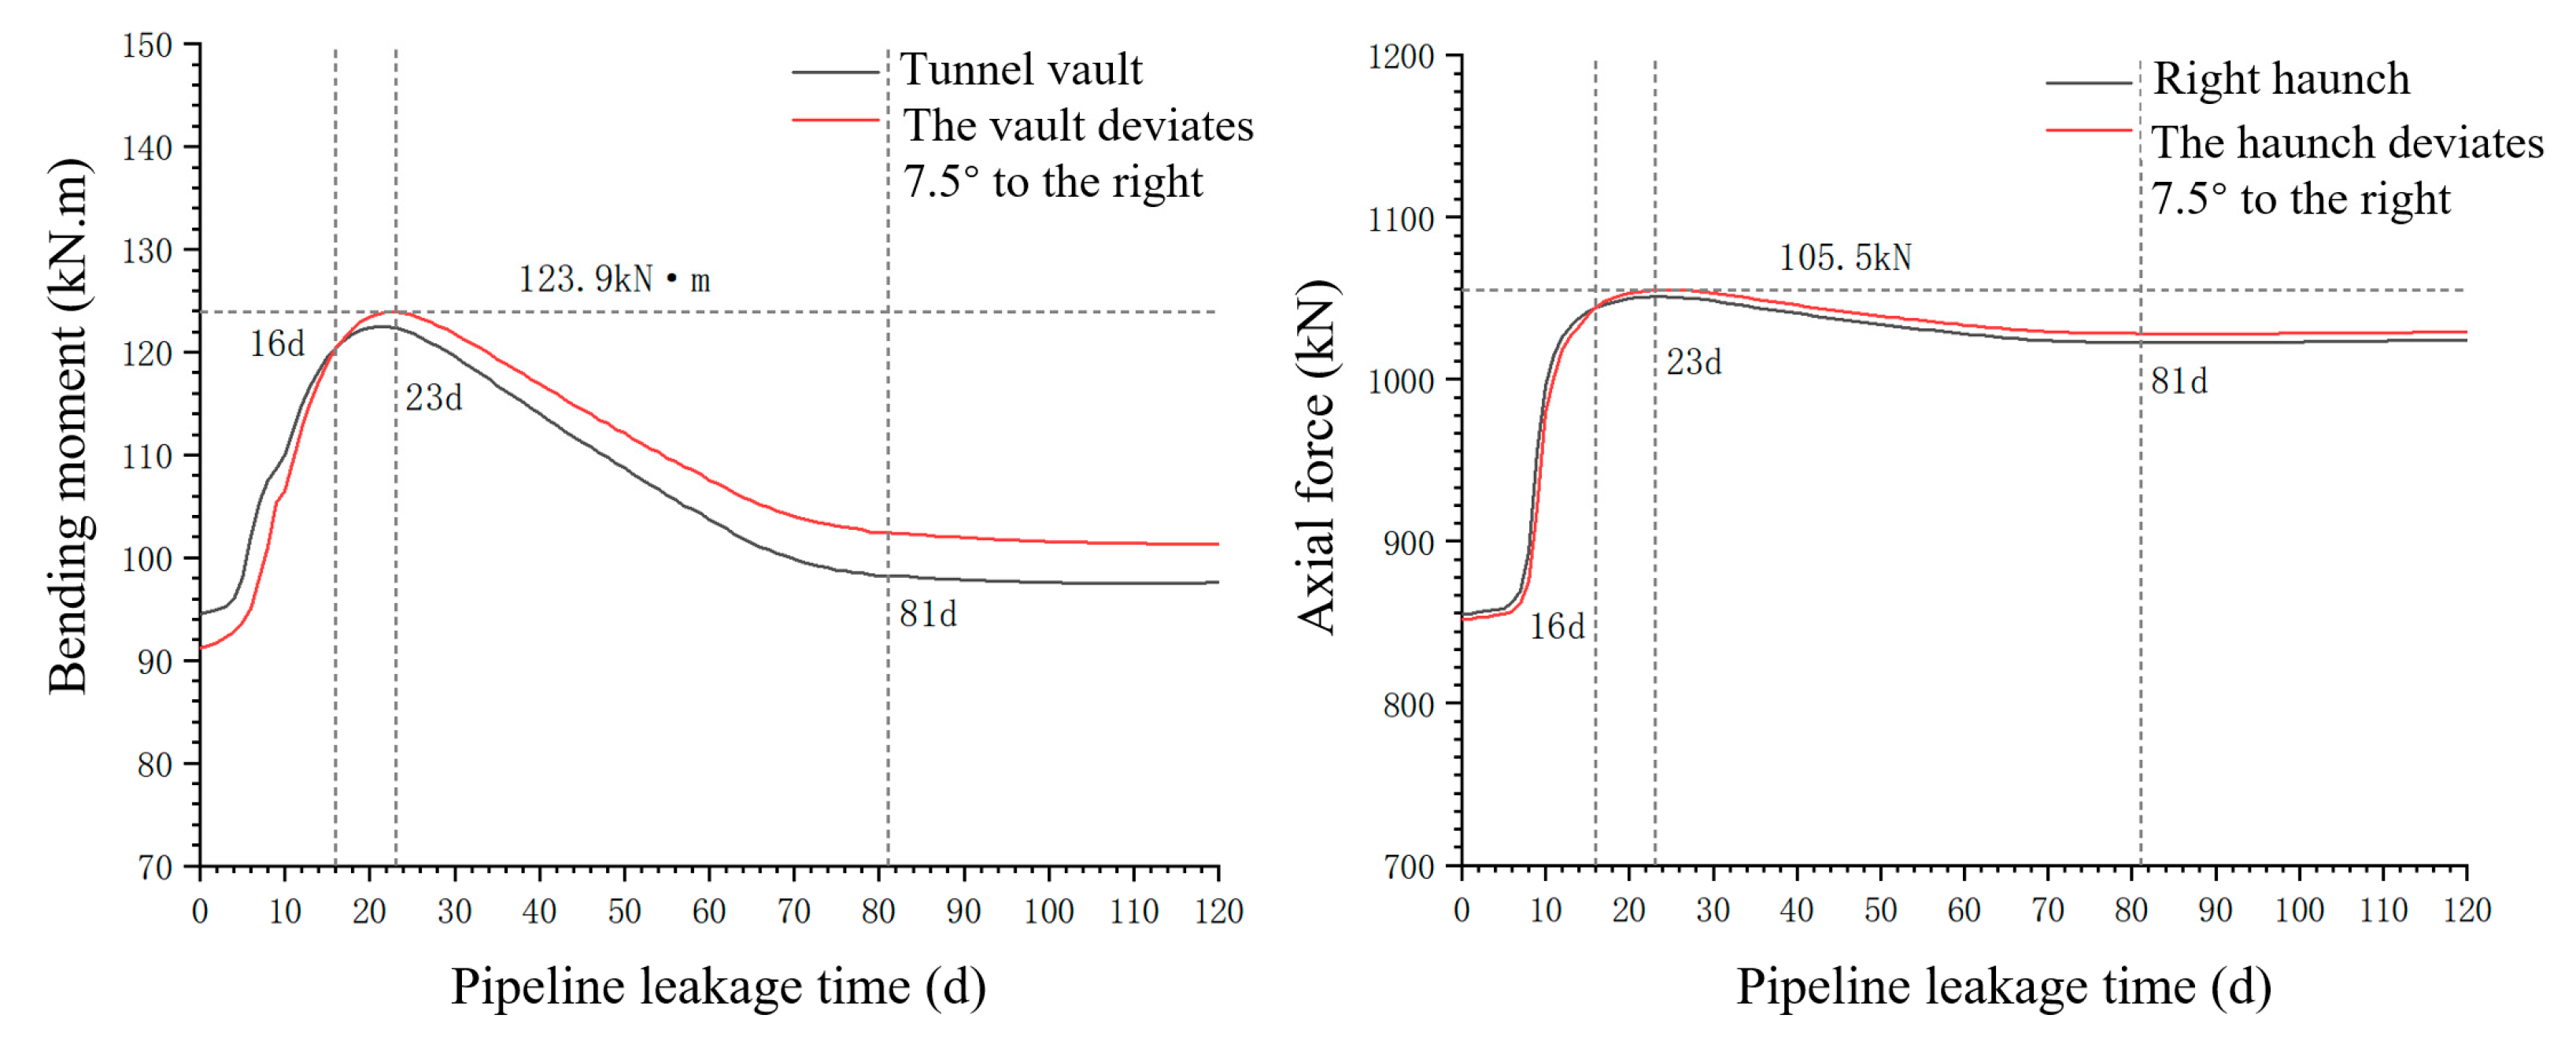
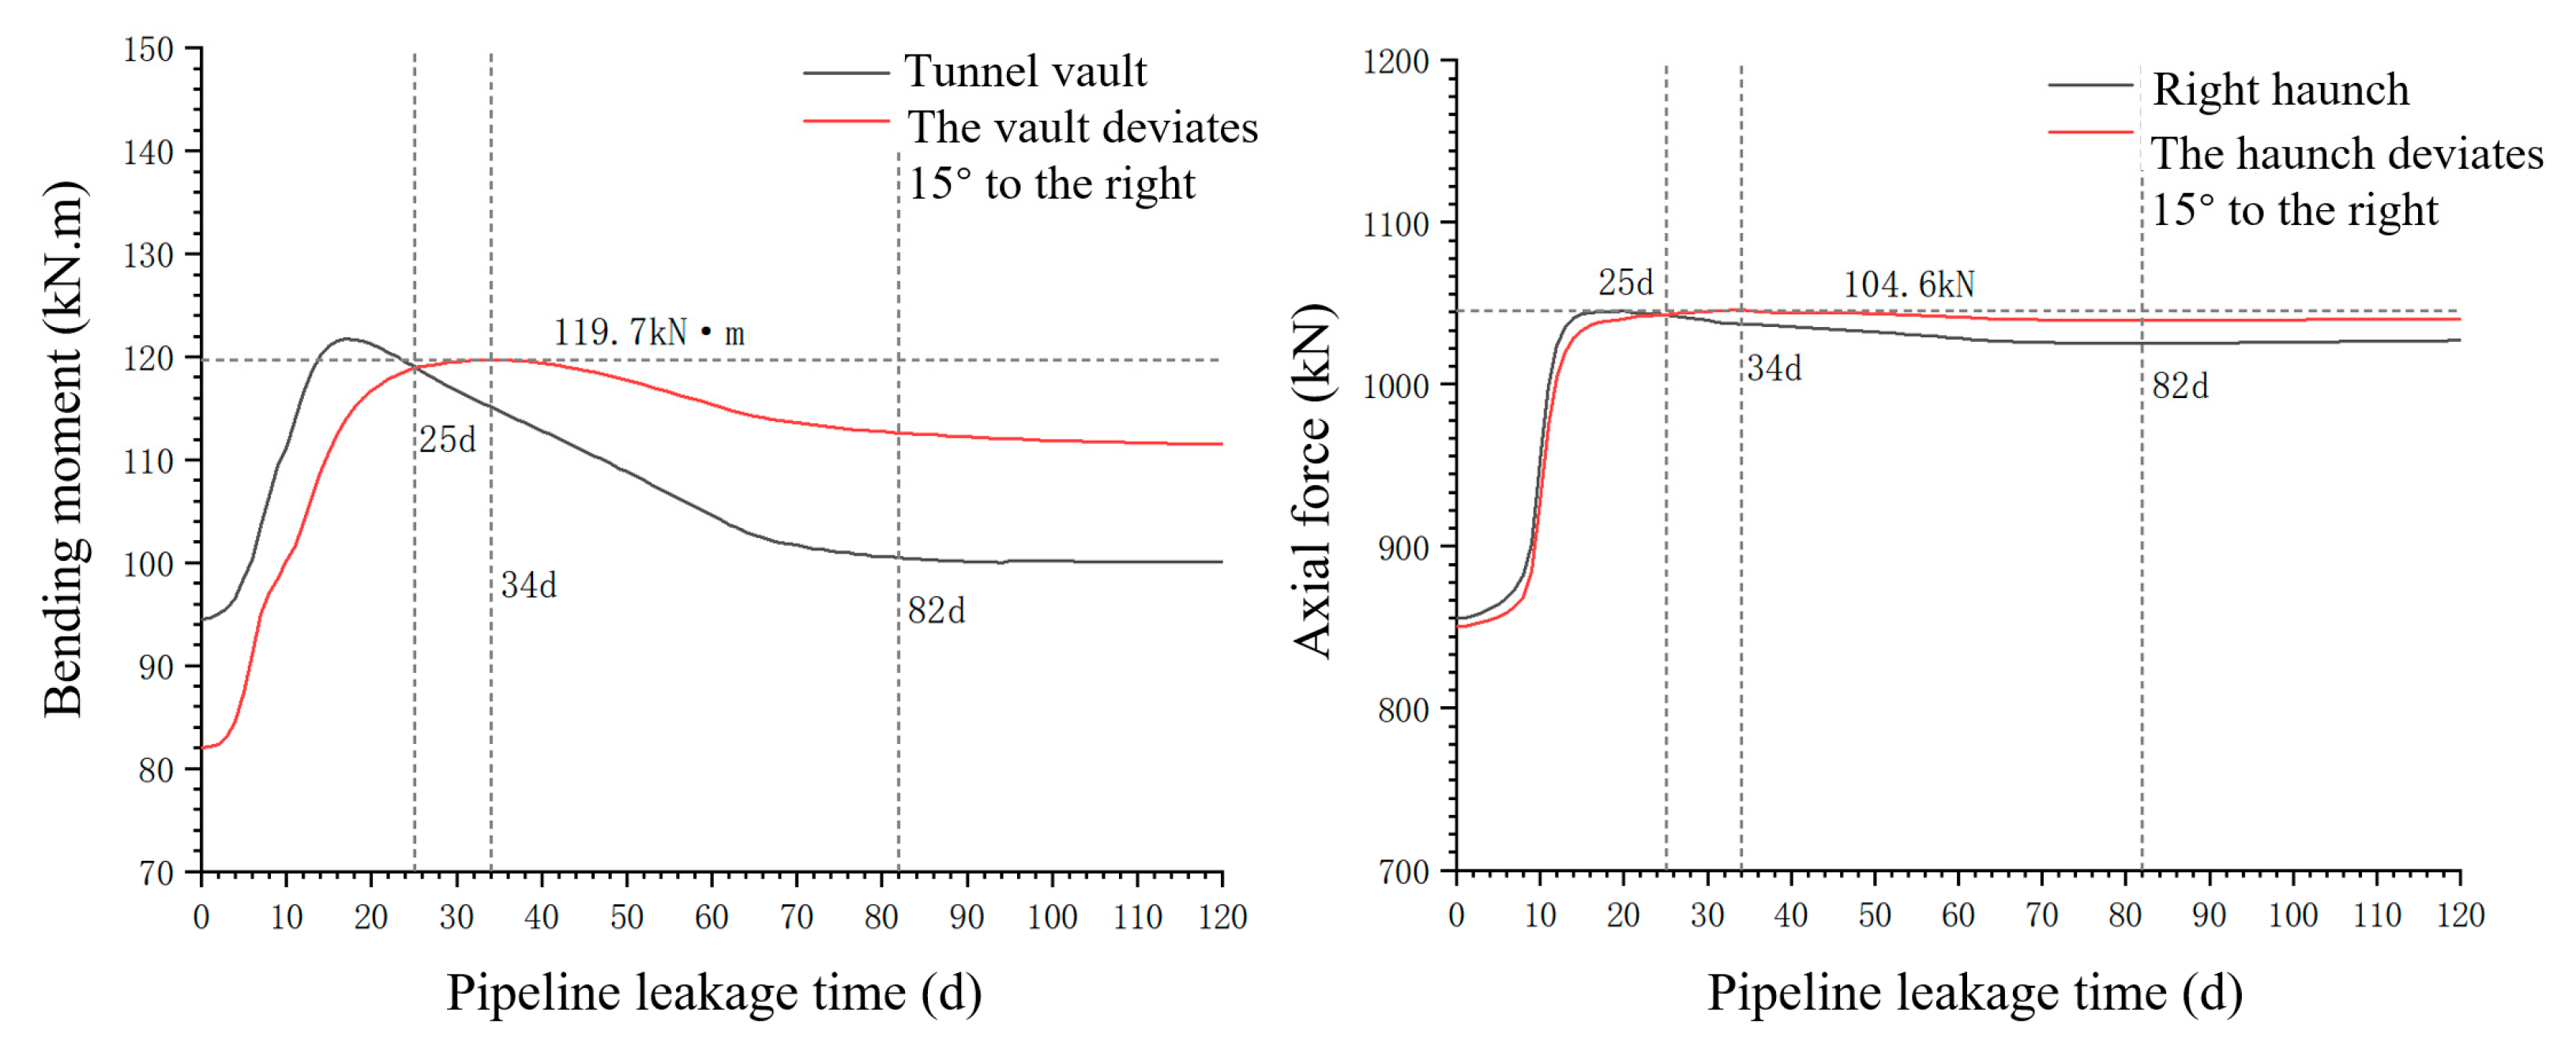
3.2.1. Analysis of the Positional Variation of the Maximum Internal Force Value
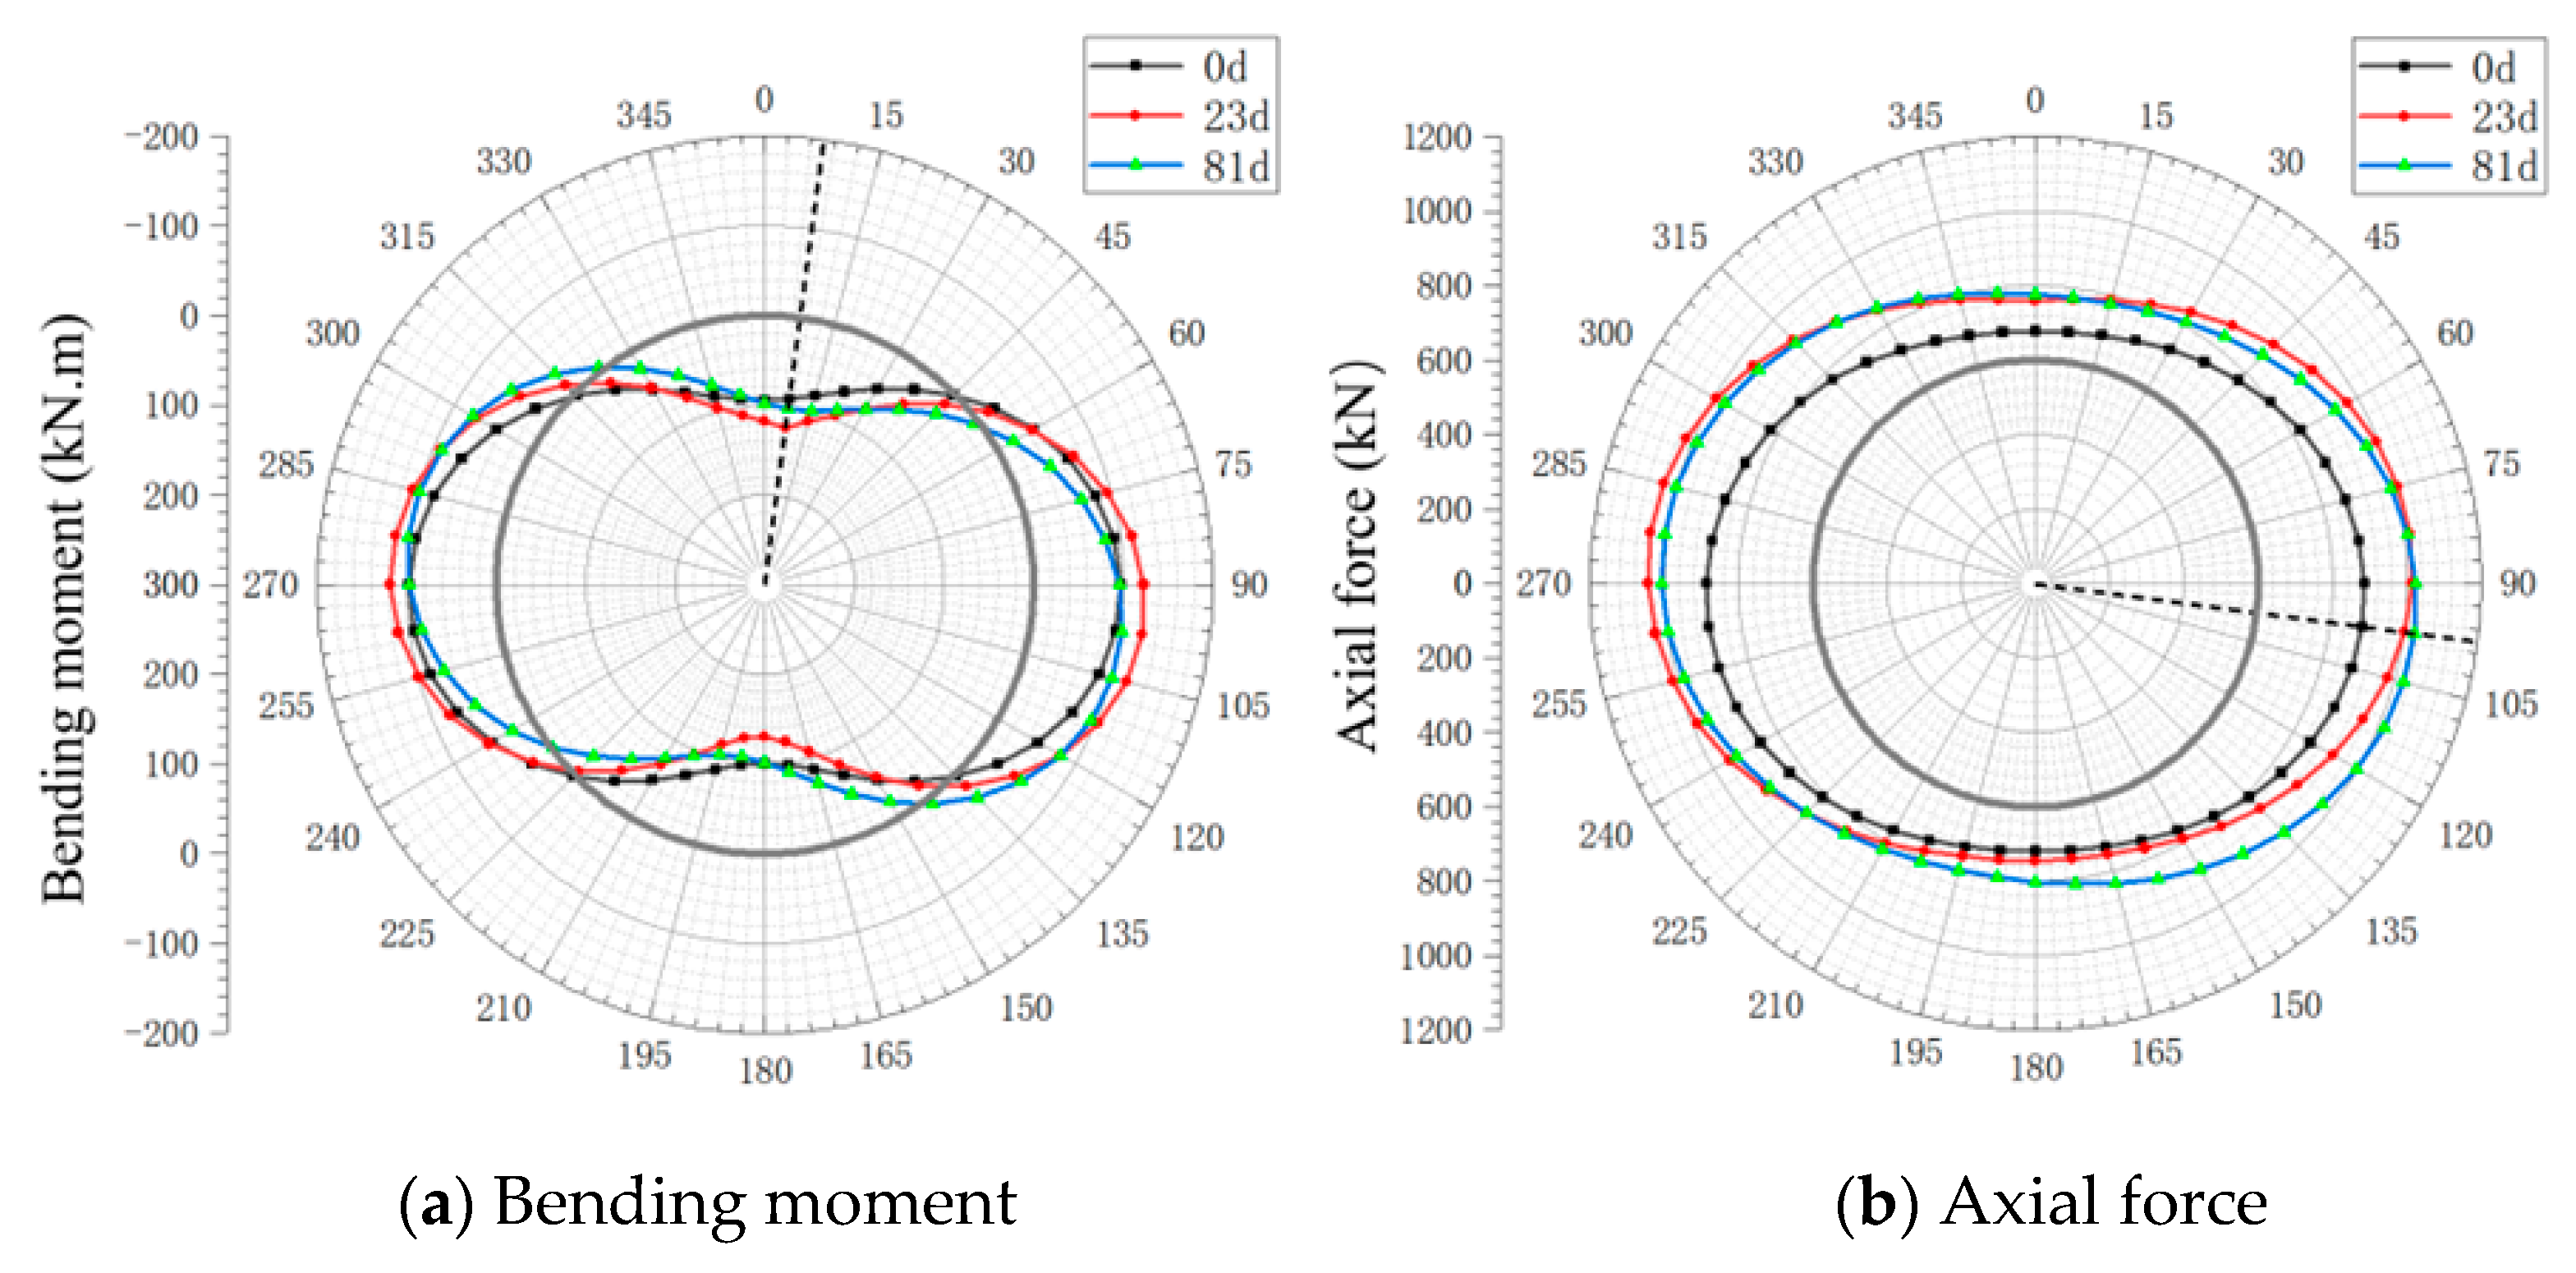
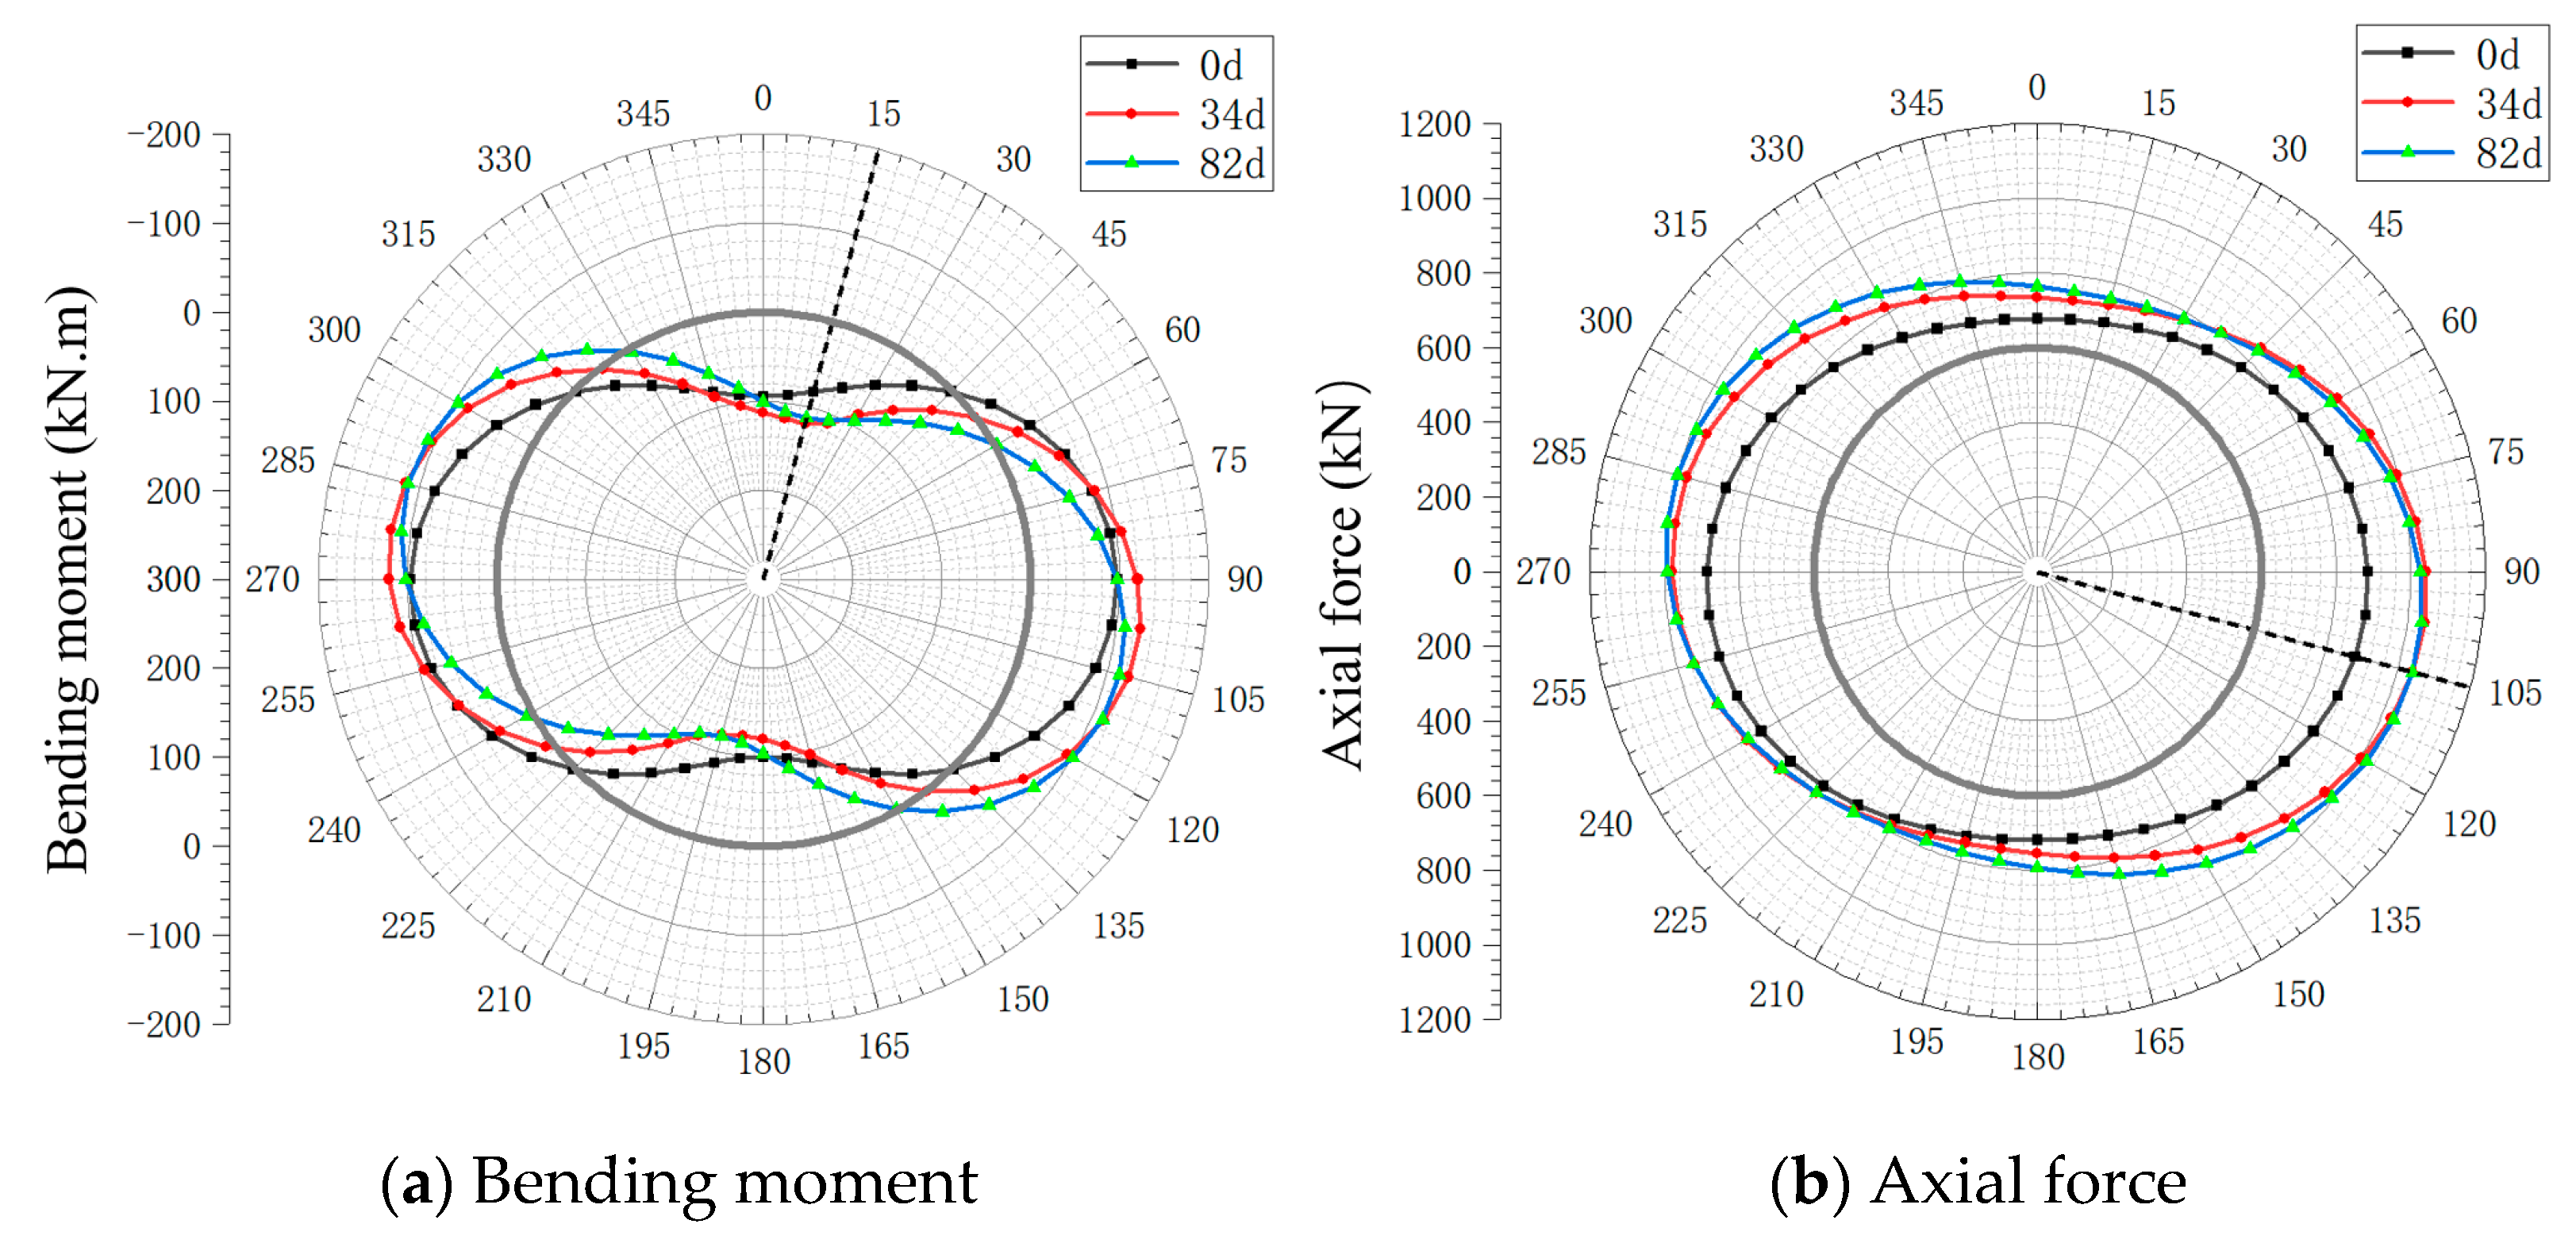
3.2.2. Analysis of the Overall Internal Force Variation of the Lining
4. Conclusions
- (1)
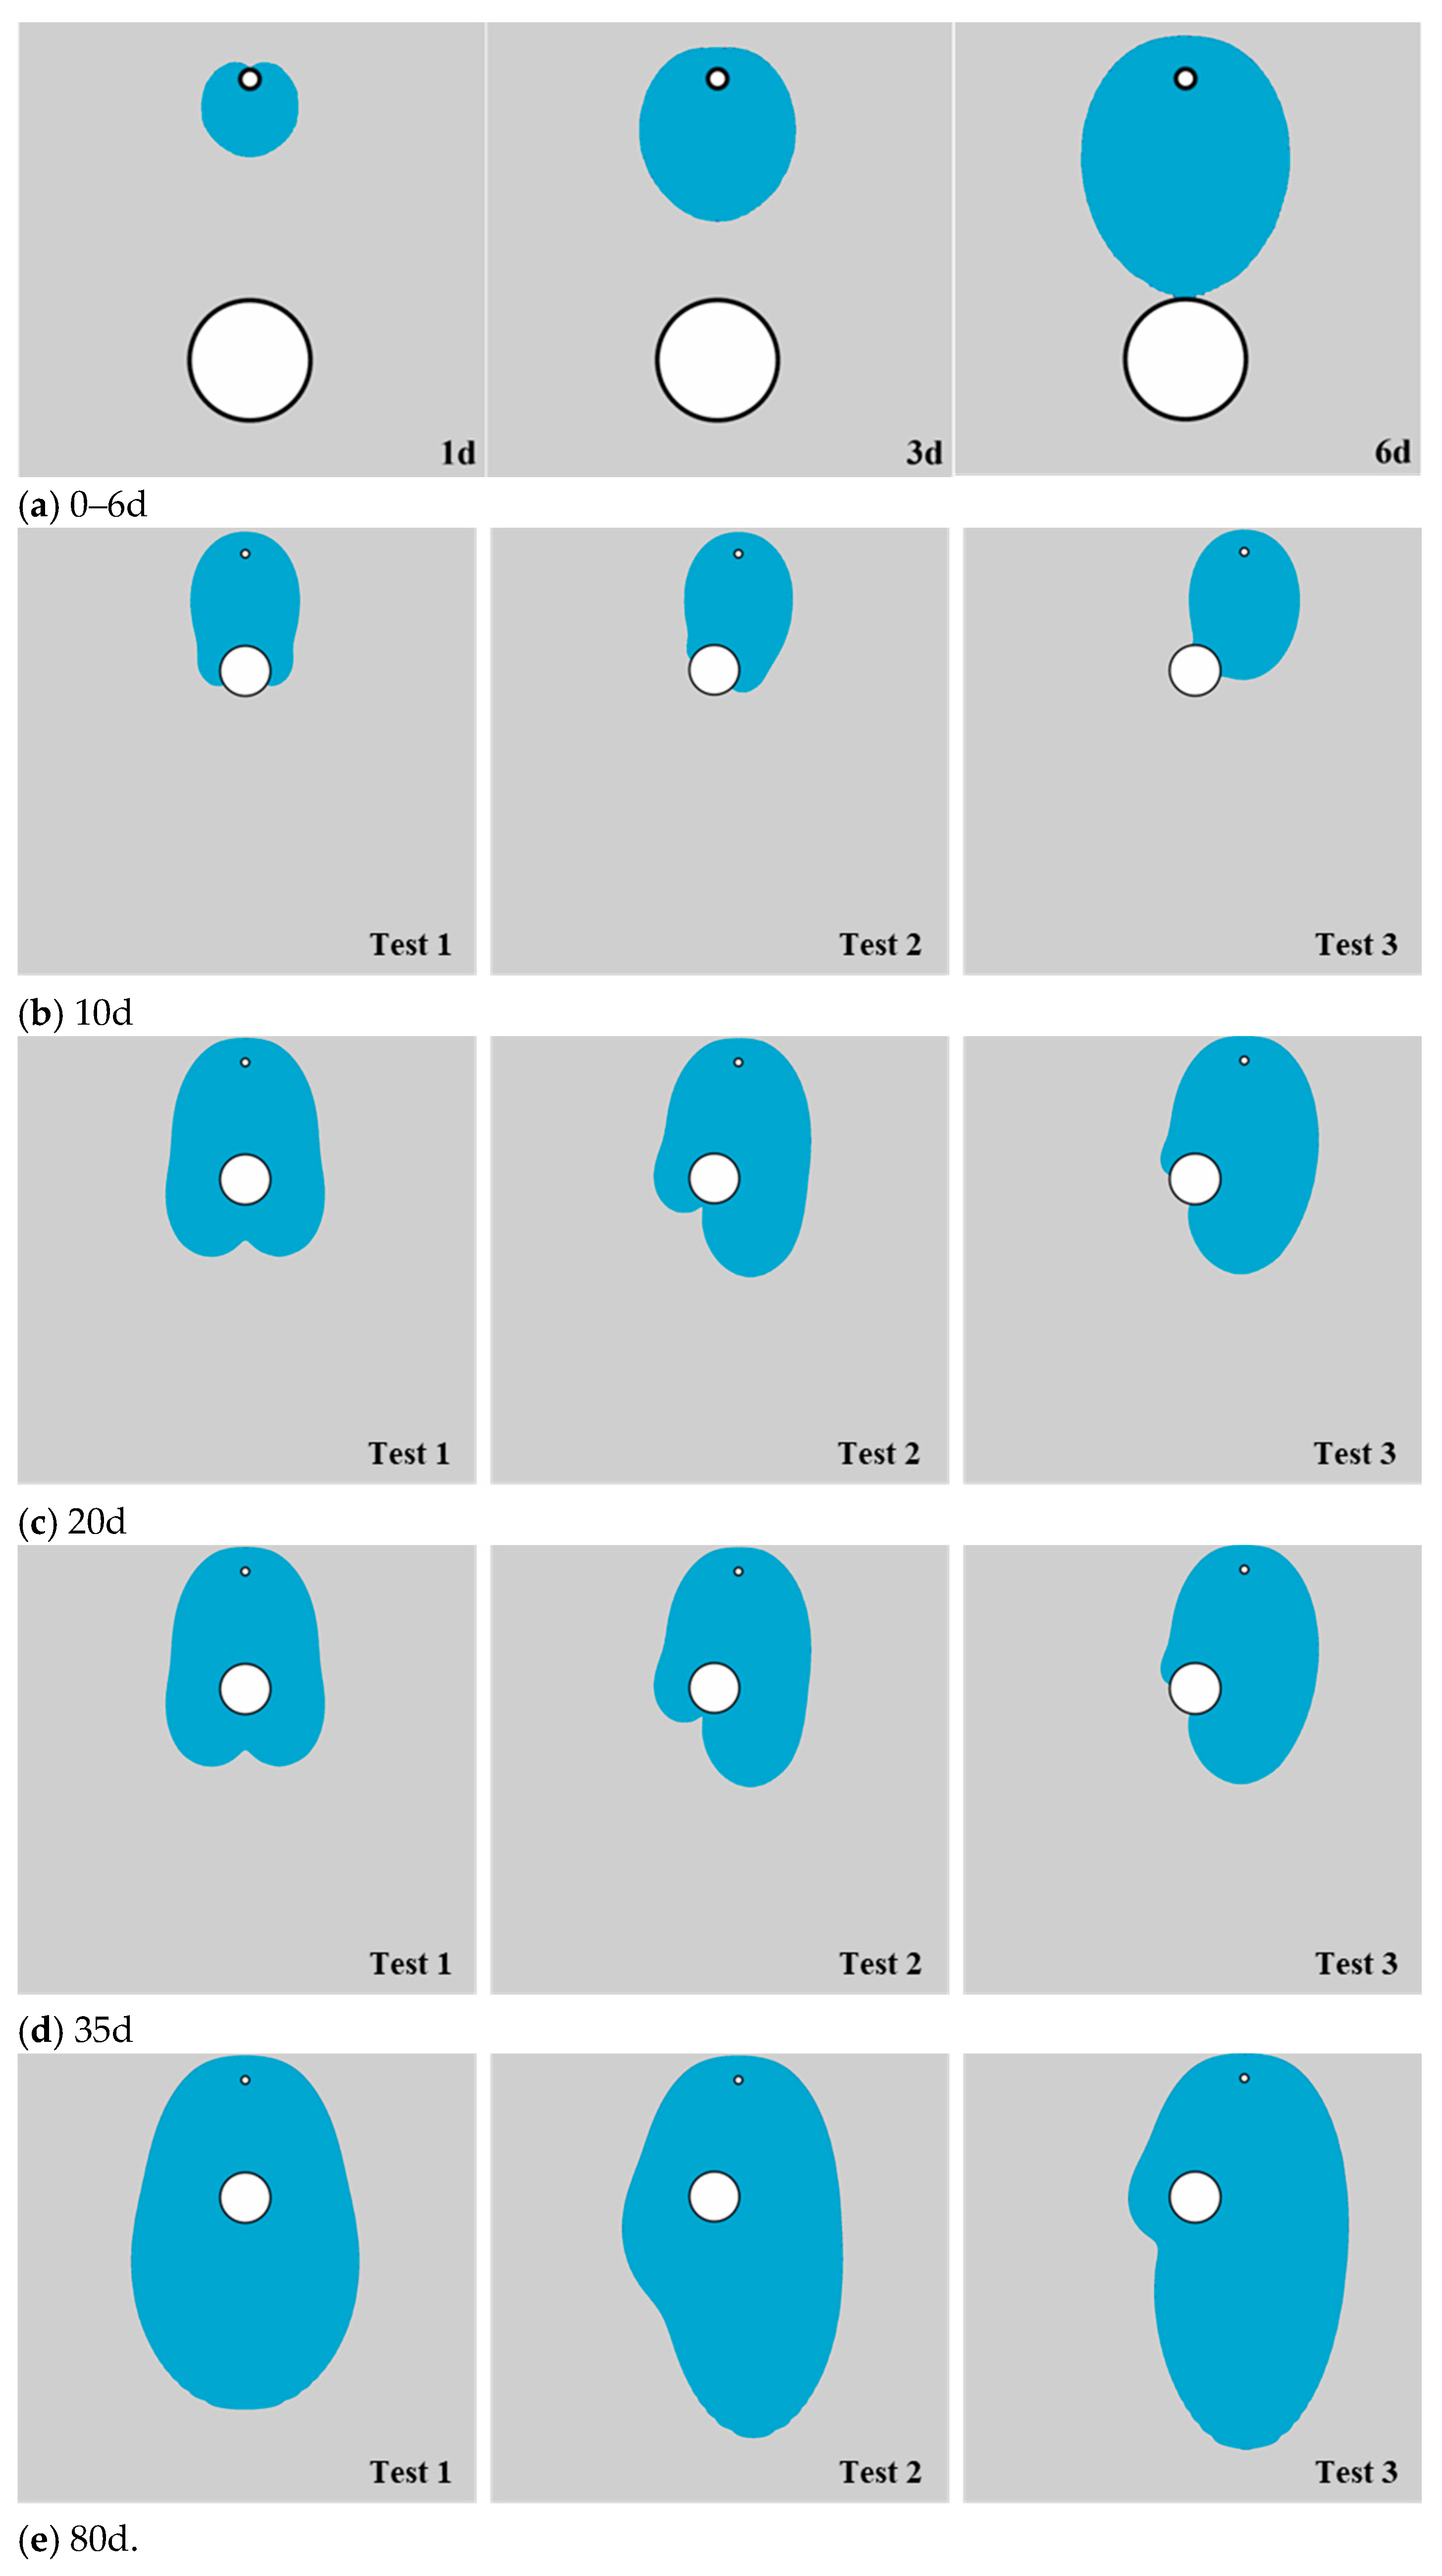
- This study reveals a “blockage threshold” effect in seepage–structure interactions, showing that horizontal pipe–tunnel offsets nonlinearly influence seepage evolution. Before reaching the tunnel crown, fluid diffusion follows radial patterns with negligible offset impact on leakage zone development. After contact, offsets control flow path lengths and contact areas, creating heterogeneous hydraulic gradients that produce divergent seepage velocities. Larger offsets significantly delay seepage progression: full encapsulation takes 16 days (0 m), 20 days (3 m), and 33 days (6 m), with corresponding 10-day contact ratios of 68.9%, 56.4%, and 30.6%.
- (2)
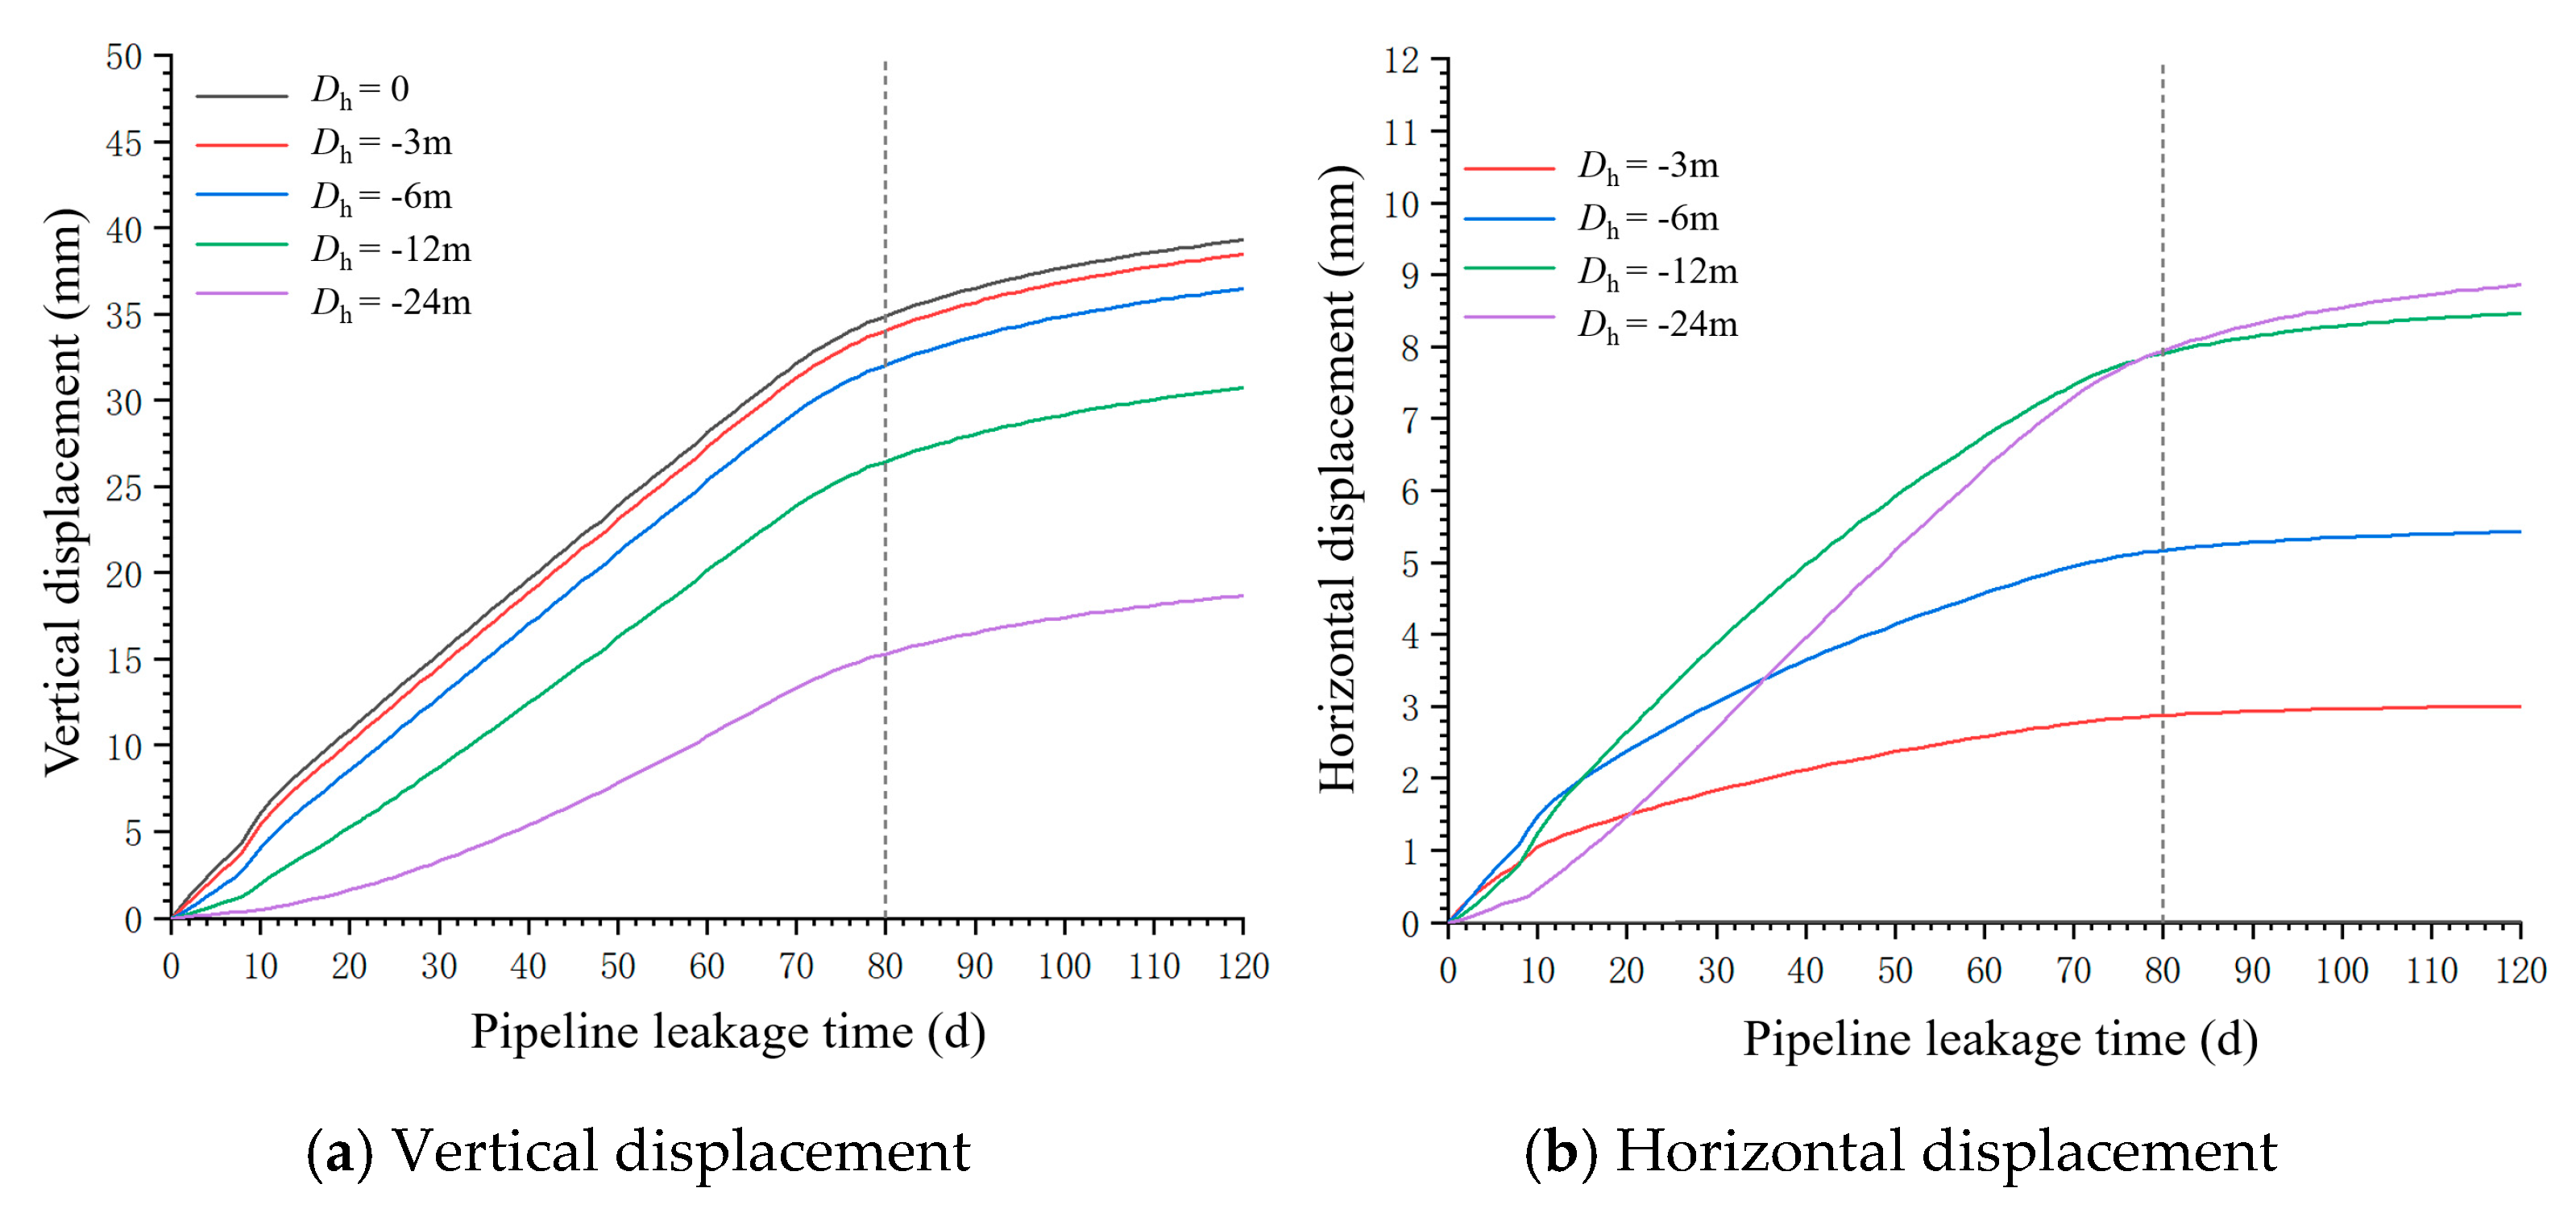
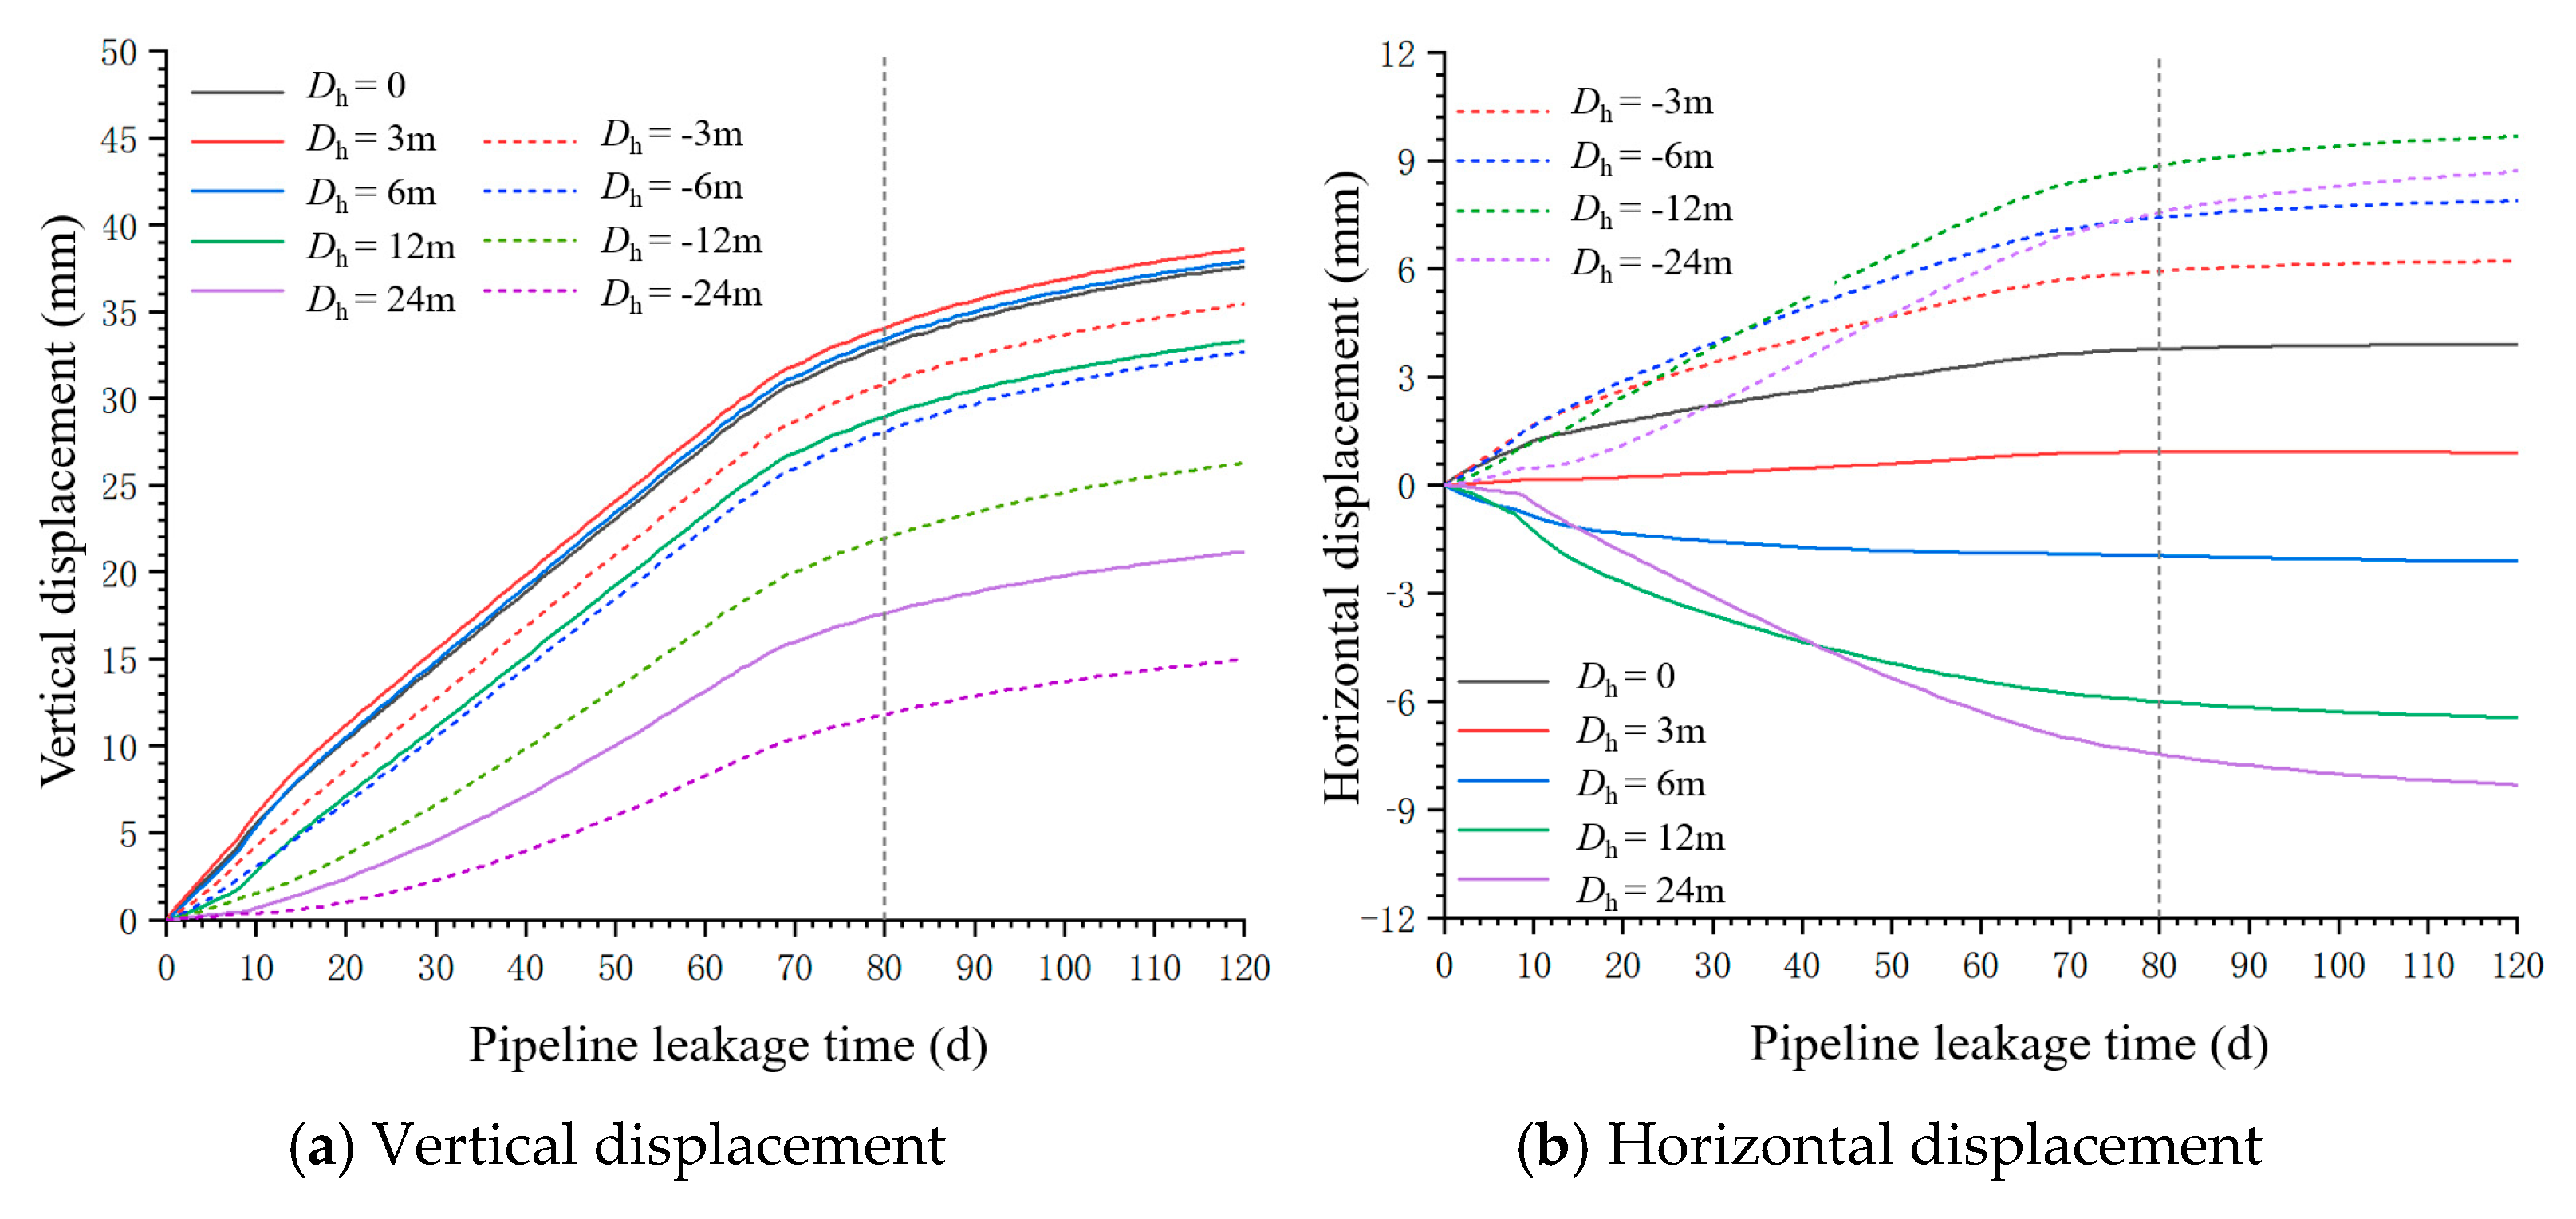
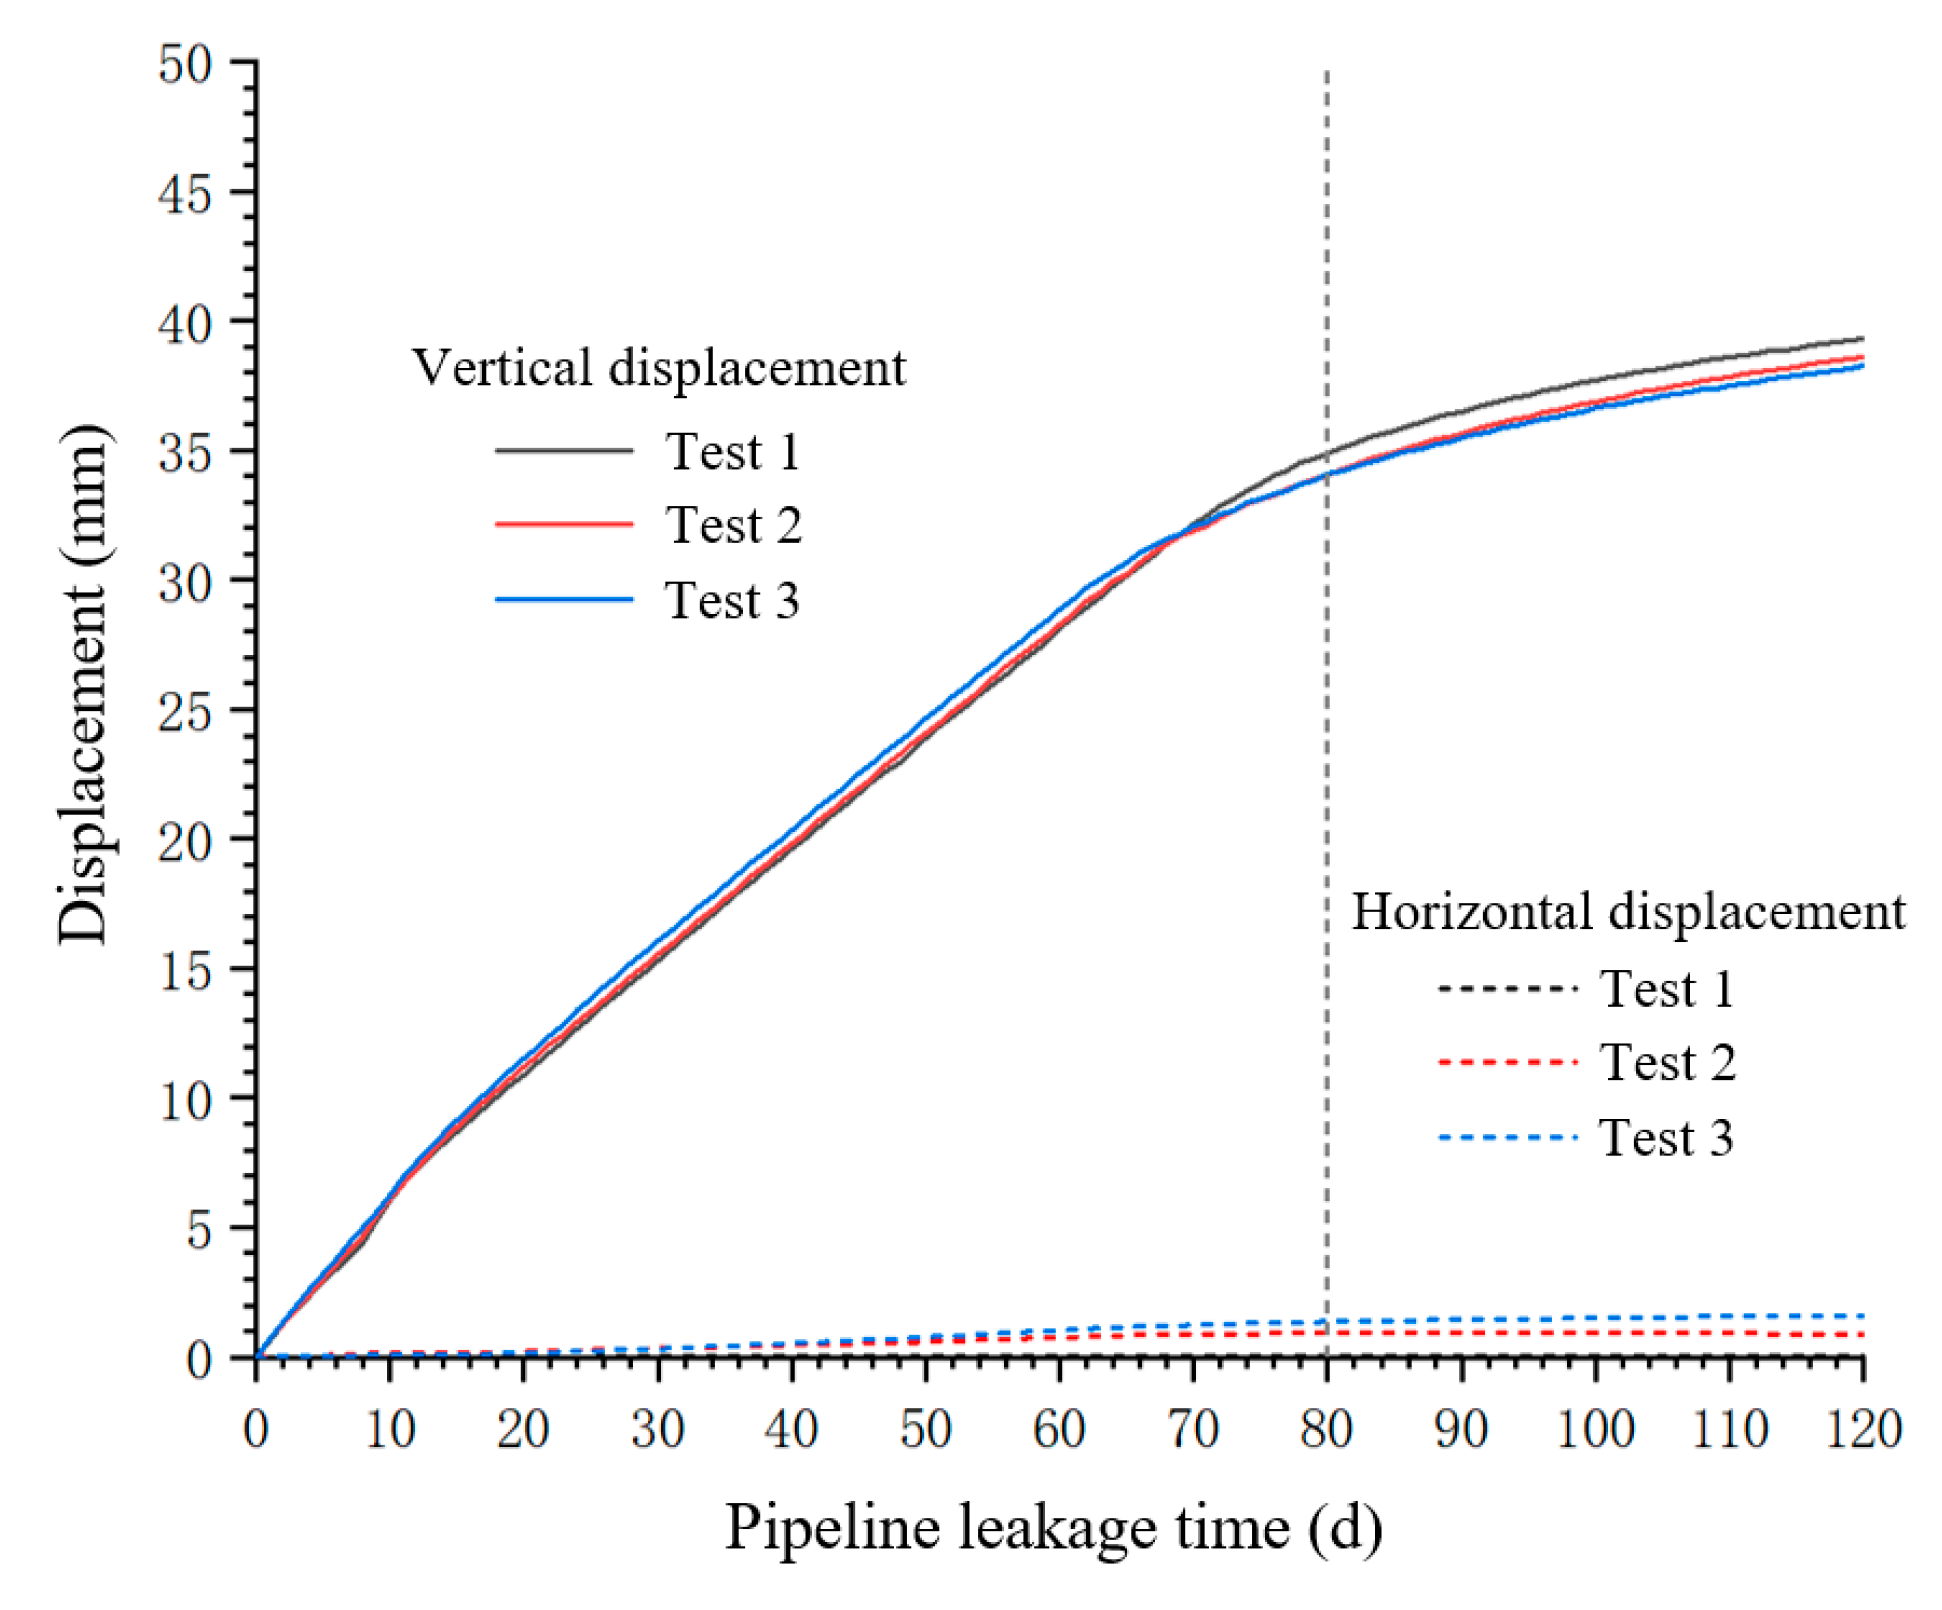
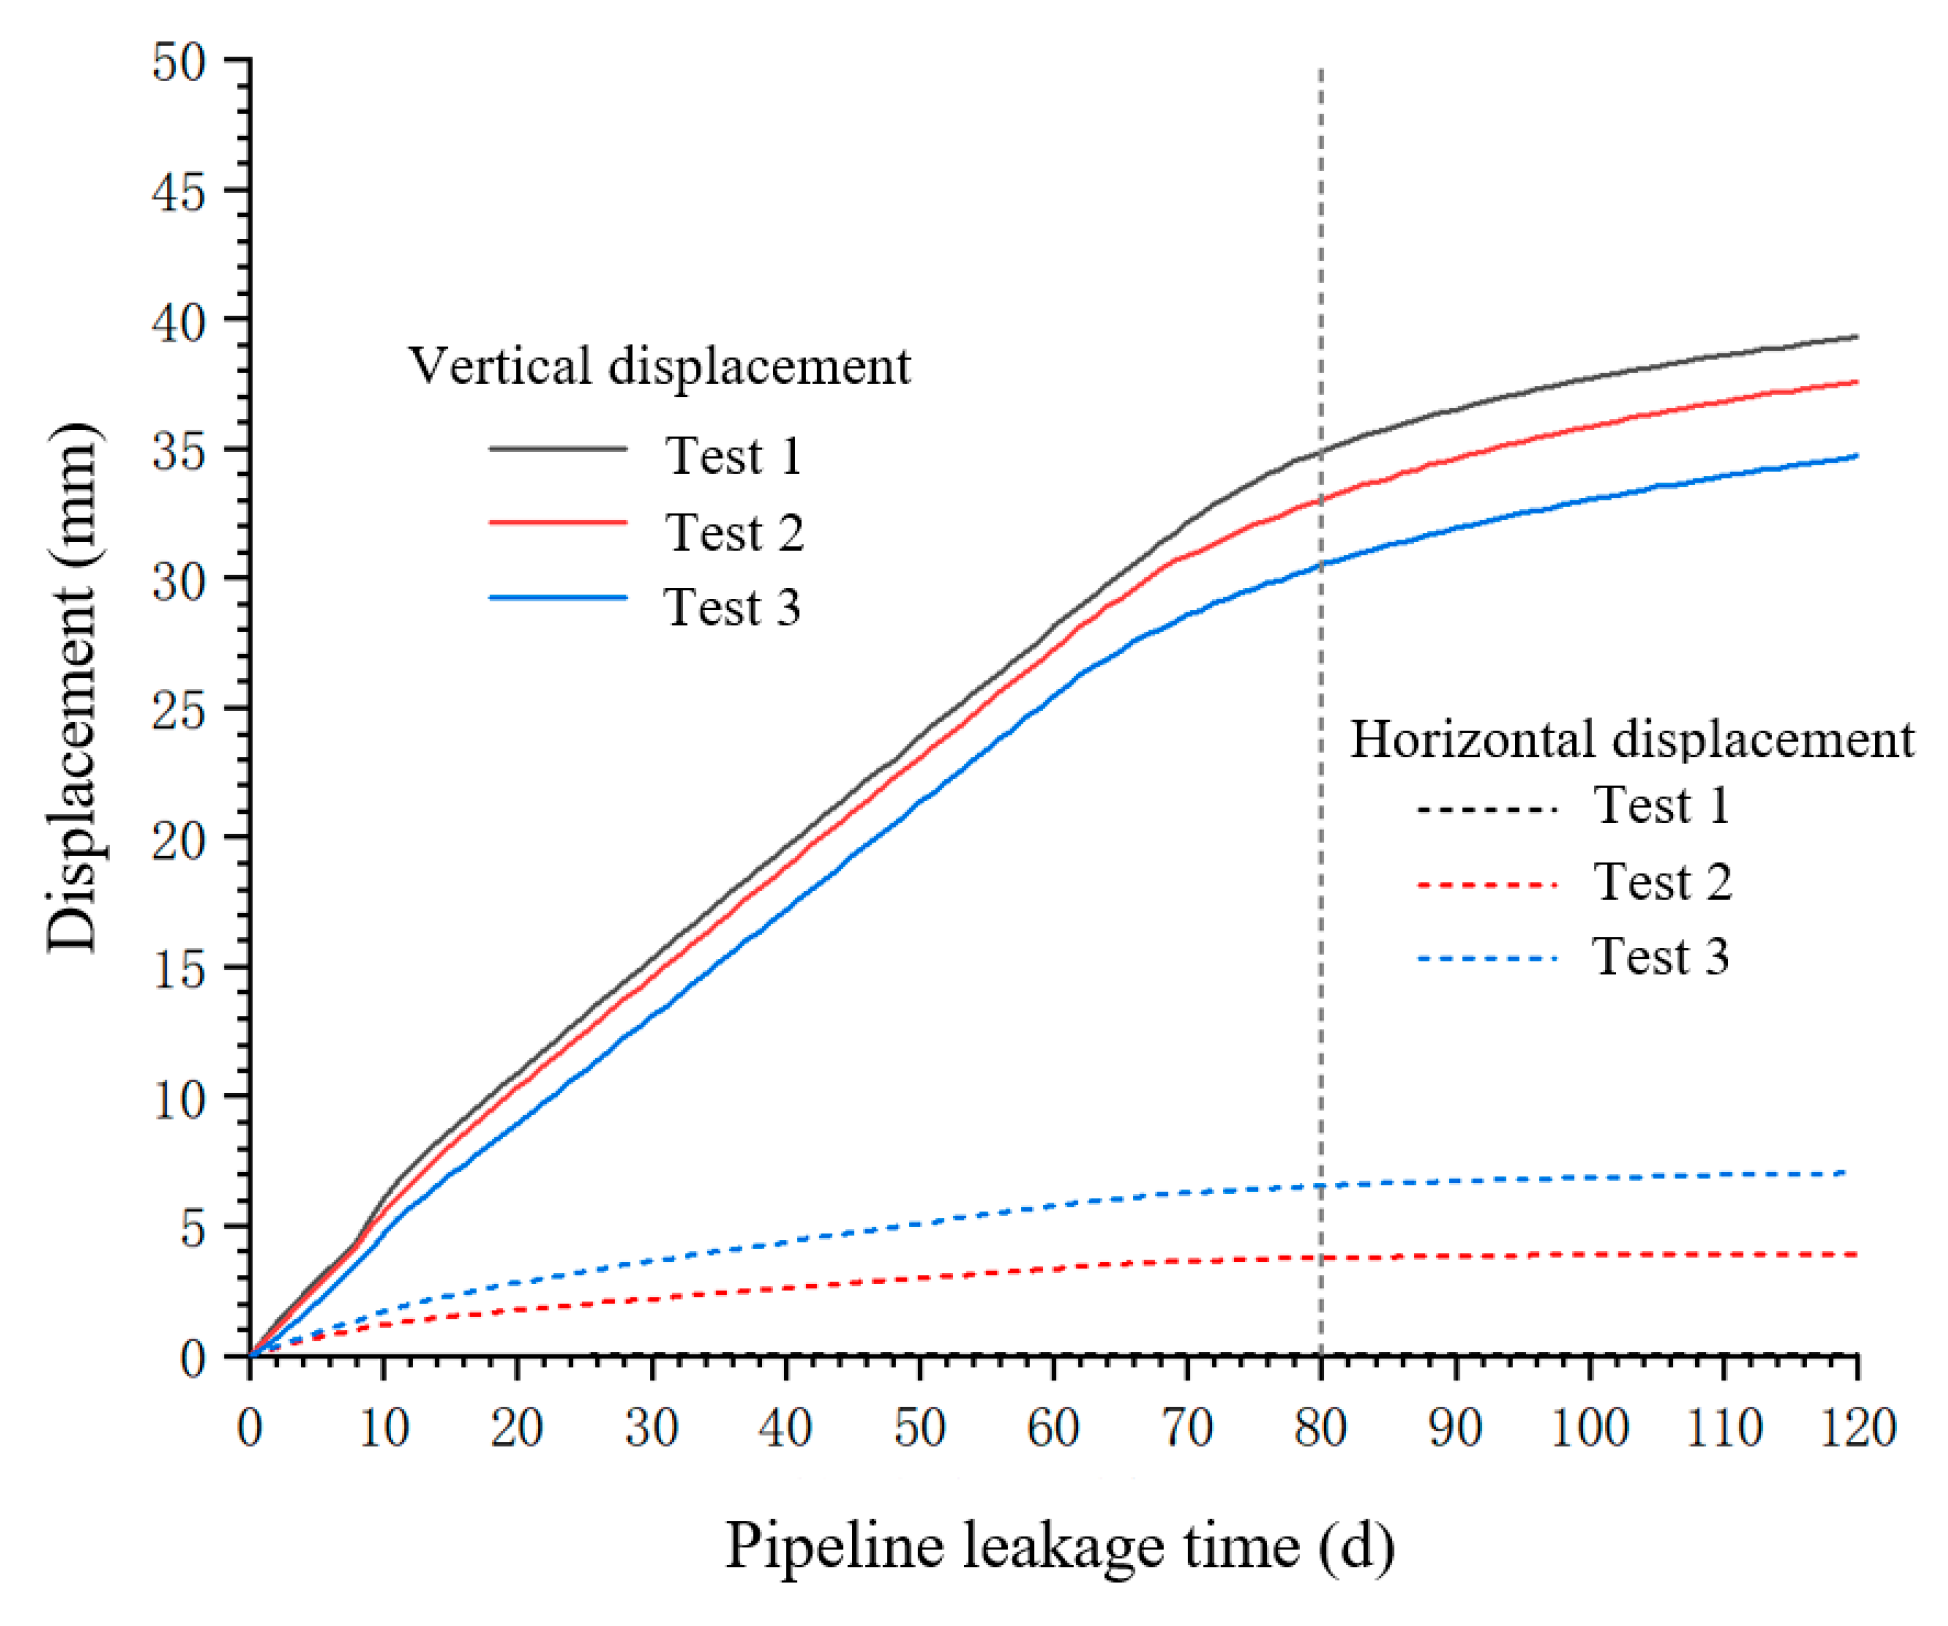
- This study reveals multiscale coupling mechanisms between seepage and deformation fields. Surface settlement patterns demonstrate how seepage-induced stratum softening governs deformation characteristics. Ground subsidence progressively intensifies over time in terms of both magnitude and affected area. Maximum settlements consistently occur directly above the pipeline centerline (reaching ~39 mm at 120 days) and decreased radially, confirming a “source-controlled” damage propagation mechanism.
- (3)
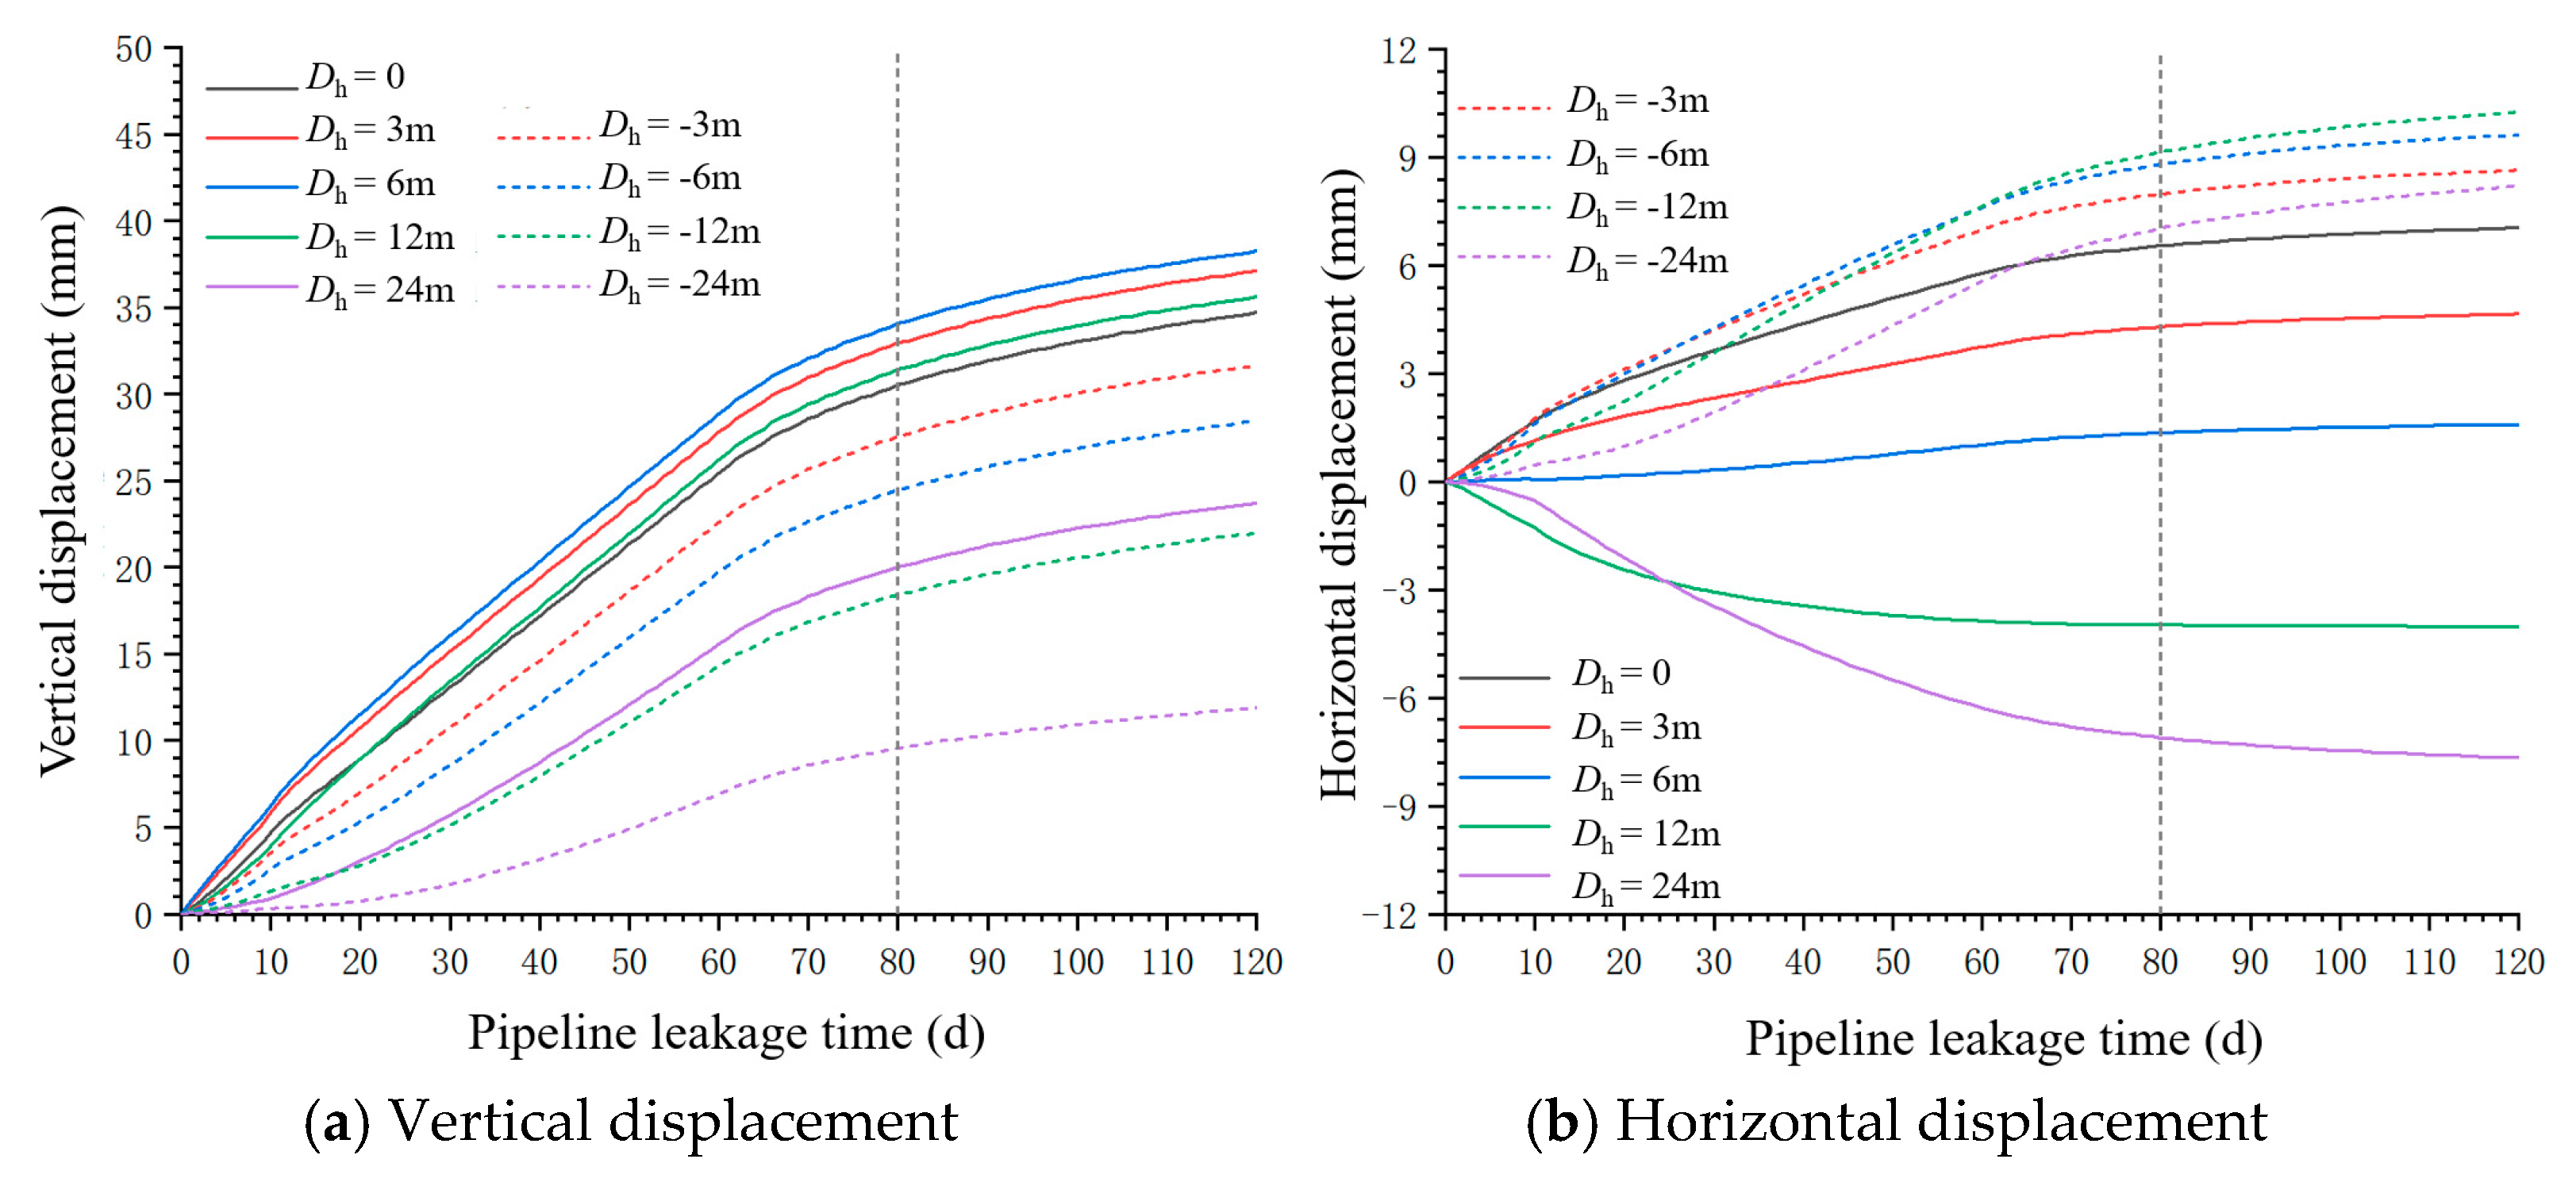
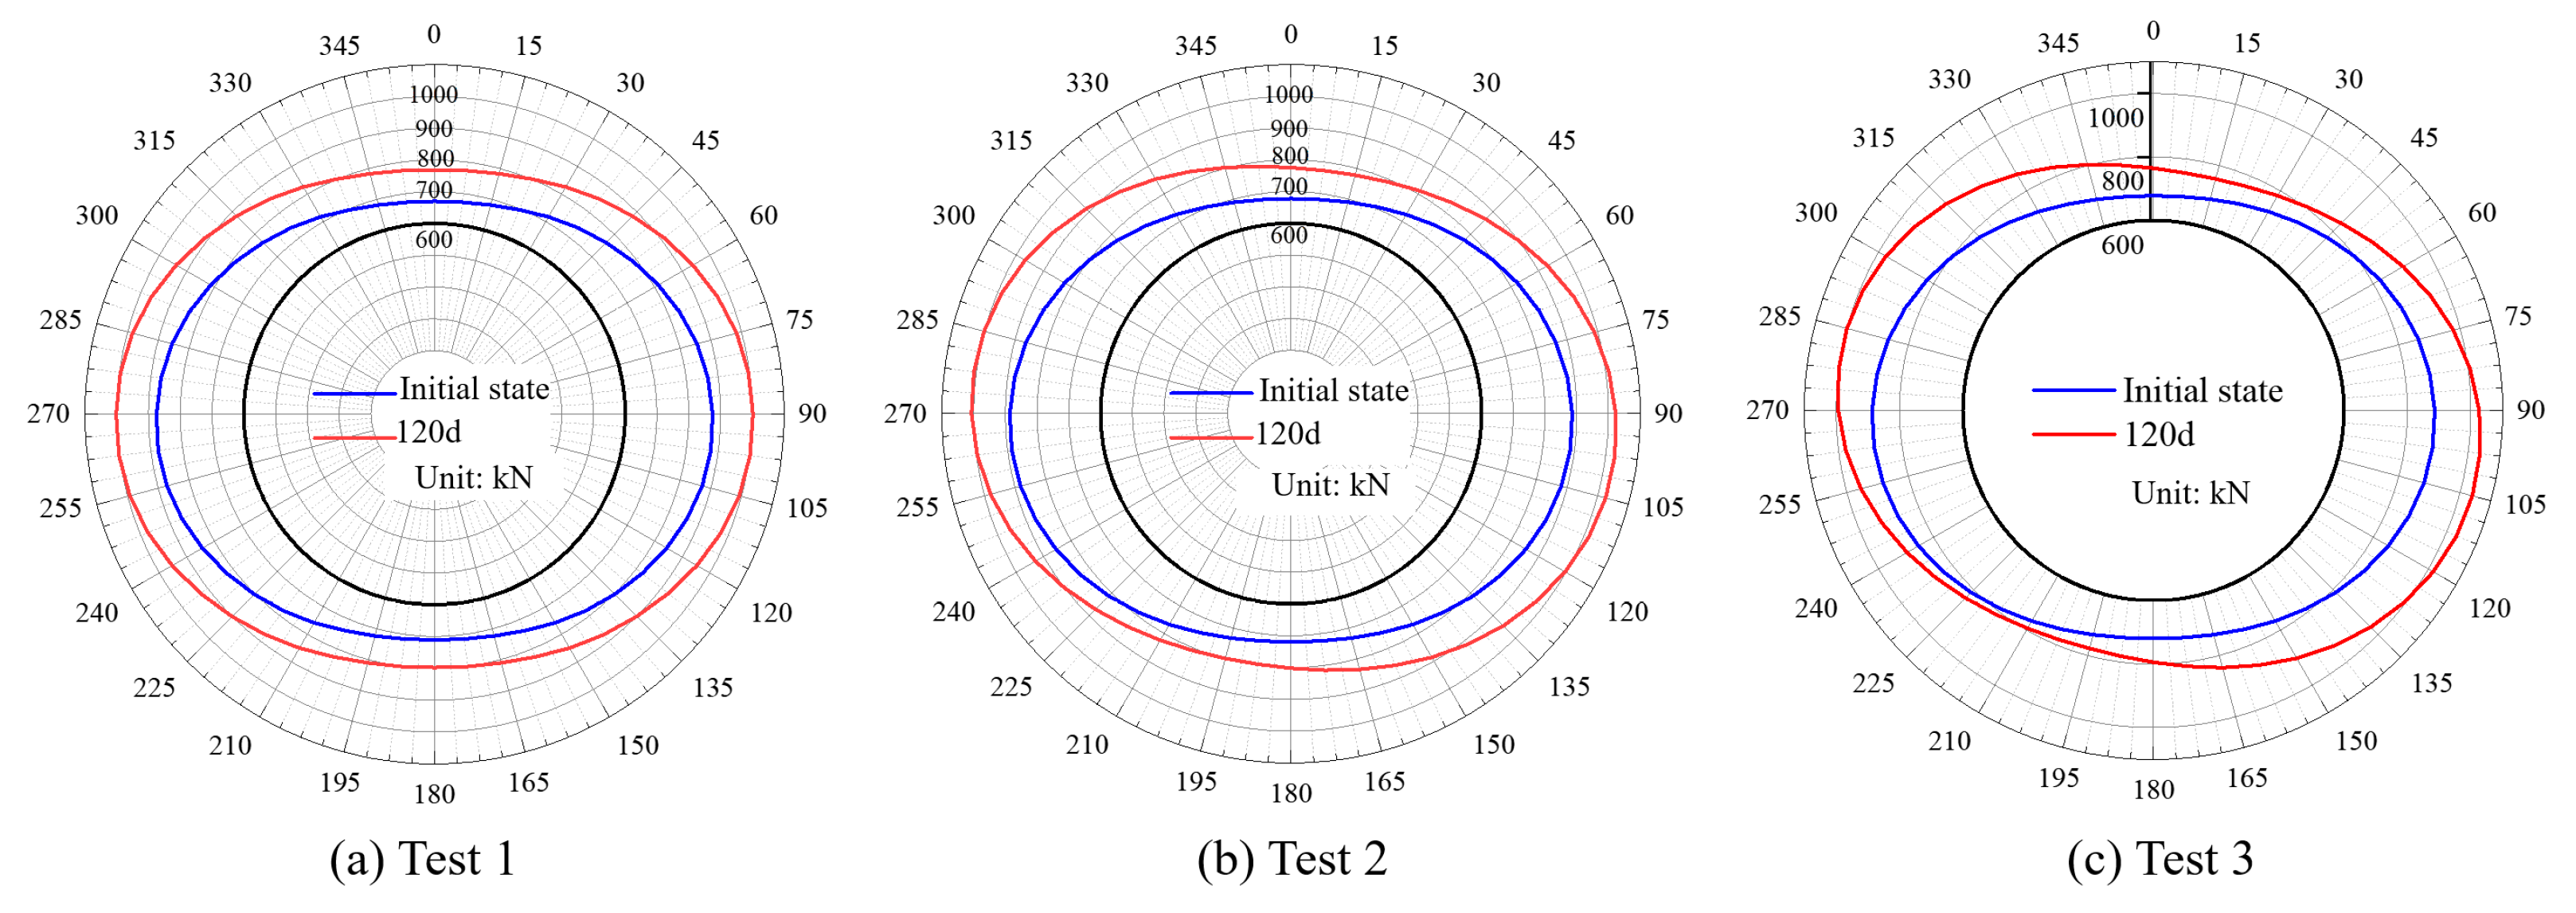
- This study reveals time-dependent correlations between structural responses and seepage damage. The analysis of the lining internal force redistribution shows how seepage erosion affects structural integrity. Pipeline–tunnel horizontal offsets significantly alter internal force distributions; at 3 m and 6 m offsets, maximum bending moments shift 7.5° and 15° clockwise from the crown, while peak axial forces move downward at corresponding angles from the haunch region. These findings demonstrate the spatial redistribution of structural stresses under seepage conditions.
Author Contributions
Funding
Data Availability Statement
Conflicts of Interest
References
- Chao, H.; Tan, Y.; Su, Z.K. Ground Failure and Soil Erosion Caused by Bursting of Buried Water Pipeline: Experimental and Numerical Investigations. Eng. Fail. Anal. 2025, 167, 108965. [Google Scholar] [CrossRef]
- Fang, H.; Li, B.; Wang, F.; Wang, Y.; Cui, C. The Mechanical Behaviour of Drainage Pipeline under Traffic Load before and after Polymer Grouting Trenchless Repairing. Tunn. Undergr. Space Technol. 2018, 74, 185–194. [Google Scholar] [CrossRef]
- Wang, X.; Zhao, Y.; Ariaratnam, S.T.; Yan, X. Study on the Impact of Ovality Defect on Structural Stability of CIPP Liner of Drainage Pipeline. Tunn. Undergr. Space Technol. 2023, 140, 105338. [Google Scholar] [CrossRef]
- Zhang, J.; Xie, R.; Zhang, H. Mechanical Response Analysis of the Buried Pipeline Due to Adjacent Foundation Pit Excavation. Tunn. Undergr. Space Technol. 2018, 78, 135–145. [Google Scholar] [CrossRef]
- Li, S.; Liu, R.; Zhang, Q.; Zhang, X. Protection against Water or Mud Inrush in Tunnels by Grouting: A Review. J. Rock Mech. Geotech. Eng. 2016, 8, 753–766. [Google Scholar] [CrossRef]
- Hou, Y.; Fang, Q.; Zhang, D.; Wong, L.N.Y. Excavation Failure Due to Pipeline Damage during Shallow Tunnelling in Soft Ground. Tunn. Undergr. Space Technol. 2015, 46, 76–84. [Google Scholar] [CrossRef]
- Hu, Q.; Zhang, S.; Zhang, X.; Wang, F. Enhancing Disaster Prevention and Structural Resilience of Tunnels: A Study on Liquid Hydrogen Leakage, Diffusion, and Explosion Mitigation. Tunn. Undergr. Space Technol. 2025, 162, 106626. [Google Scholar] [CrossRef]
- Du, X.; Fang, H.; Liu, K.; Li, B.; Wang, N.; Zhang, C.; Wang, S. Experimental and Practical Investigation of Reinforcement Mechanism on Permeable Polymer in Loose Area of Drainage Pipeline. Tunn. Undergr. Space 2023, 140, 105250, Corrigendum to Tunn. Undergr. Space Technol. 2024, 140, 106076. [Google Scholar] [CrossRef]
- Cao, L.; Lv, X.; Li, X.; Li, J. Sensitivity Analysis of Factors That Induce Road Collapses Due to Drainage Pipe Leakage and Traffic Load. Transp. Geotech. 2025, 52, 101554. [Google Scholar] [CrossRef]
- Zhou, Y.; Liu, H.; Cao, X.; Hu, J.; Wang, X. An Efficient Intelligent Detection Method for Water Pipeline Leakages Utilizing Homologous Multi-Modal Signal Fusion. Measurement 2025, 253, 117562. [Google Scholar] [CrossRef]
- Gu, Y.; Ai, Q.; Xu, Z.; Yao, L.; Wang, H.; Huang, X.; Yuan, Y. Cost-Effective Image Recognition of Water Leakage in Metro Tunnels Using Self-Supervised Learning. Autom. Constr. 2024, 167, 105678. [Google Scholar] [CrossRef]
- Tan, Y.; Long, Y.-Y. Review of Cave-In Failures of Urban Roadways in China: A Database. J. Perform. Constr. Facil. 2021, 35, 04021080. [Google Scholar] [CrossRef]
- Yuan, X.; Yan, Y.; Li, X.; Wang, T.; Ji, J. Discrete Element Simulation of Ground Collapse Induced by Buried Sewage Pipeline Breakage and Soil Leakage. Eng. Fail. Anal. 2025, 167, 108910. [Google Scholar] [CrossRef]
- Long, Y.Y.; Tan, Y. Soil Arching Due to Leaking of Tunnel Buried in Water-Rich Sand. Tunn. Undergr. Space Technol. 2020, 95, 103158. [Google Scholar] [CrossRef]
- Tang, H.; Ding, Y.; Qiu, G.; Liu, Z.; Deng, Z. Numerical Simulations for the Mechanical Behavior of a Type-B Sleeve under Pipeline Suspension. Processes 2024, 12, 1585. [Google Scholar] [CrossRef]
- Sato, M.; Kuwano, R. Influence of Location of Subsurface Structures on Development of Underground Cavities Induced by Internal Erosion. Soils Found. 2015, 55, 829–840. [Google Scholar] [CrossRef]
- Karoui, T.; Jeong, S.Y.; Jeong, Y.H.; Kim, D.S. Experimental Study of Ground Subsidence Mechanism Caused by Sewer Pipe Cracks. Appl. Sci. 2018, 8, 679. [Google Scholar] [CrossRef]
- Zhang, D.M.; Du, W.W.; Peng, M.Z.; Feng, S.J.; Li, Z.L. Experimental and Numerical Study of Internal Erosion around Submerged Defective Pipe. Tunn. Undergr. Space Technol. 2020, 97, 103256. [Google Scholar] [CrossRef]
- Kwak, T.Y.; Woo, S.I.; Kim, J.; Chung, C.K. Model Test Assessment of the Generation of Underground Cavities and Ground Cave-Ins by Damaged Sewer Pipes. Soils Found. 2019, 59, 586–600. [Google Scholar] [CrossRef]
- Liu, J.C.; Wang, Z.Y.; Tan, Y.; Cao, Y.C. Failure Evolution and Mechanism of Ground Collapse Due to Exfiltration of Shallowly Buried Water Pipeline. Eng. Fail. Anal. 2024, 162, 108390. [Google Scholar] [CrossRef]
- Chen, B.; Liu, C.; Li, Q.; Onyekwena, C.C. Experimental and Theoretical Investigations of Ground Settlement around Submerged Defective Pipelines. Transp. Geotech. 2024, 49, 101395. [Google Scholar] [CrossRef]
- Gao, X.; Li, P.; Zhang, M.; Ge, Z.; Chen, C. Experimental Investigation of Ground Collapse Induced by Soil-Water Leakage in Local Failed Tunnels. Tunn. Undergr. Space Technol. 2025, 157, 105950. [Google Scholar] [CrossRef]
- Shi, X.; Zheng, L.; Rong, C.; Cheng, H.; Cai, H.; Li, T. Study on the Rules of Ground Settlement and Pipeline Deformation Considering the Combined Effects of Pipeline Damage Leakage and Shield Tunneling Construction. Transp. Geotech. 2024, 49, 101367. [Google Scholar] [CrossRef]
- Yuan, S.; Feng, D.; Zhang, S.; Lin, R. Support Pressure Assessment of Tunnels in the Vicinity of Leaking Pipeline Using Unified Upper Bound Limit Analysis. Comput. Geotech. 2022, 144, 104662. [Google Scholar] [CrossRef]
- Park, D. Numerical Investigation on the Effect of Water Leakage on the Ground Surface Settlement and Tunnel Stability. Tunn. Undergr. Space Technol. 2024, 146, 105656. [Google Scholar] [CrossRef]
- Zhang, S.; Bao, T.; Liu, C. Model Tests and Numerical Modeling of the Failure Behavior of Composite Strata Caused by Tunneling under Pipeline Leakage Conditions. Eng. Fail. Anal. 2023, 149, 107287. [Google Scholar] [CrossRef]
- Zhang, Z.; Mao, M.; Pan, Y.; Zhang, M.; Ma, S.; Cheng, Z.; Wu, Z. Experimental Study for Joint Leakage Process of Tunnel Lining and Particle Flow Numerical Simulation. Eng. Fail. Anal. 2022, 138, 106348. [Google Scholar] [CrossRef]
- Hu, Y.; Lu, Y. Study on Soil-Rock Slope Instability at Mesoscopic Scale Using Discrete Element Method. Comput. Geotech. 2023, 157, 105268. [Google Scholar] [CrossRef]
- Zhang, D.M.; Gao, C.P.; Yin, Z.Y. CFD-DEM Modeling of Seepage Erosion around Shield Tunnels. Tunn. Undergr. Space Technol. 2019, 83, 60–72. [Google Scholar] [CrossRef]
- Shao, S.; Shao, S.; Wang, J. True Triaxial Mechanical Properties of Unsaturated Loess in Foundation Pit Engineering. Bull. Eng. Geol. Environ. 2021, 80, 4751–4772. [Google Scholar] [CrossRef]
- Liu, Y.; Yu, H.; Zhang, X.; Lan, X.; Li, X.; Sun, Y.; Yin, Z. Analysis of Pipeline Leakage in Unsaturated Stratum: A New Seepage-Diffusion Model. Tunn. Undergr. Space Technol. 2024, 149, 105814. [Google Scholar] [CrossRef]
- Ji, J.; Lai, J.H.; Fu, G.; Zhang, C.; Kodikara, J. Probabilistic Failure Investigation of Small Diameter Cast Iron Pipelines for Water Distribution. Eng. Fail. Anal. 2020, 108, 104239. [Google Scholar] [CrossRef]
- Ji, J.; Xia, J.; Zhang, Z.; Fu, G.; Kodikara, J. A Numerical Investigation and Probabilistic Analysis of Excavation Earth Retaining Wall Instability Caused by Underground Pipeline Leakage. Comput. Geotech. 2021, 139, 104431. [Google Scholar] [CrossRef]
- Thomoglou, A.K.; Rousakis, T.C.; Karabinis, A.I.; Thomoglou, A.; Rousakis, T.; Karabinis, A. Numerical Modeling of Shear Behavior of Urm Strengthened With Frcm or Frp Subjected To Seismic Loading. In Proceedings of the 16th European Conference on Earthquake Engineering, Thessaloniki, Greece, 18–21 June 2018. [Google Scholar]
- Song, Z.; Cao, Z.; Wang, J.; Wei, S.; Hu, S.; Niu, Z. Optimal Analysis of Tunnel Construction Methods through Cross Passage from Subway Shaft. Adv. Civ. Eng. 2018, 2018, 5181954. [Google Scholar] [CrossRef]
- Song, Z.; Wu, Y.; Zhang, Y.; Wang, K.; Tian, J.; Tian, X. Deformation Response of a Pipeline to Nearby Deep Foundation Pit Excavation: Numerical Simulations and Field Tests. Appl. Sci. 2023, 13, 6597. [Google Scholar] [CrossRef]
- Huang, W. Research on Mechanism and Treatment Technology Ofshield Tunnel Structures Affected by Submersion And collapse of Loess Layer. Master’s Thesis, Chang’an University, Xi’an, China, 2021. [Google Scholar]
- Hou, L.; Xue, H.; Zhou, Z.; Liu, H.; Pan, F. Research on the Strength Reduction FEM of the Slope by Applying the Secondary Development Platform of ABAQUS. J. Xi’an Univ. Technol. 2016, 32, 449–454+499. [Google Scholar] [CrossRef]
- Yao, Y.; Chen, G. Field Variable Controlling Soil Shear Strength Reduction method for Slope Stability Analysis. J. Hunan Univ. 2008, 11, 130–135. [Google Scholar]
- Cai, Q. Slope Seepage and Failure Mechanism of Landslide under Rainfall. Ph.D. Thesis, Southwest Jiaotong University, Chengdu, China, 2014. [Google Scholar]
- Yu, C.; Lu, X.; Chen, X.; Wang, S.; Zhang, S. Analysis of the Morphology and Influence Range of Leakage Areas in Urban Underground Sewage Pipelines. China Water Transp. 2023, 23, 66–68. [Google Scholar]
- Zhang, S.; Li, L.; Chen, X.; Liu, C.; Du, M.; Zhang, Y. Indoor Tests on the Mechanical Response of Tunnel Lining under the Influence of Pipeline Leakage. Eng. Fail. Anal. 2025, 174, 109501. [Google Scholar] [CrossRef]


| Parameters | Density (g/m3) | Permeability Coefficient (m/s) | Elastic Modulus (Gpa) | Poisson’s Ratio | Friction Angle (°) | Cohesion (kPa) |
|---|---|---|---|---|---|---|
| Surrounding rock | 2300 | 1.7 × 10⁻⁵ | 0.282 | 0.32 | 33 | 280 |
| Grouting layer | 2300 | 1 × 10⁻⁷ | 25.5 | - | - | - |
| Secondary lining | 2500 | 20.1 | 27.6 | - | - | - |
| Height | Width | |||||
|---|---|---|---|---|---|---|
| Numerical Simulation | Model Test | Error | Numerical Simulation | Model Test | Error | |
| Pipeline leakage area | 4.19D | 3.95D | 6% | 3.18D | 2.82D | 12% |
| Pipeline leakage area under the existing tunnel conditions | 3.86D | 3.98D | 3% | 2.91D | 3.59D | 18% |
Disclaimer/Publisher’s Note: The statements, opinions and data contained in all publications are solely those of the individual author(s) and contributor(s) and not of MDPI and/or the editor(s). MDPI and/or the editor(s) disclaim responsibility for any injury to people or property resulting from any ideas, methods, instructions or products referred to in the content. |
© 2025 by the authors. Licensee MDPI, Basel, Switzerland. This article is an open access article distributed under the terms and conditions of the Creative Commons Attribution (CC BY) license (https://creativecommons.org/licenses/by/4.0/).
Share and Cite
Zhao, R.; Li, L.; Chen, X.; Zhang, S. Mechanical Response of Pipeline Leakage to Existing Tunnel Structures: Insights from Numerical Modeling. Buildings 2025, 15, 1771. https://doi.org/10.3390/buildings15111771
Zhao R, Li L, Chen X, Zhang S. Mechanical Response of Pipeline Leakage to Existing Tunnel Structures: Insights from Numerical Modeling. Buildings. 2025; 15(11):1771. https://doi.org/10.3390/buildings15111771
Chicago/Turabian StyleZhao, Ruichuan, Linghui Li, Xiaofei Chen, and Sulei Zhang. 2025. "Mechanical Response of Pipeline Leakage to Existing Tunnel Structures: Insights from Numerical Modeling" Buildings 15, no. 11: 1771. https://doi.org/10.3390/buildings15111771
APA StyleZhao, R., Li, L., Chen, X., & Zhang, S. (2025). Mechanical Response of Pipeline Leakage to Existing Tunnel Structures: Insights from Numerical Modeling. Buildings, 15(11), 1771. https://doi.org/10.3390/buildings15111771