
Experimental Study on the Vertical Bearing Characteristic Model of Pile Groups in Complex Interactive Karst Pile Foundations
 ,
,
Abstract
1. Introduction
2. Methods
2.1. Experimental Assumptions
- (1)
- The pile body, the cap, the rock mass around the pile, and the soil are all continuous and a uniform single media;
- (2)
- The pile body and the cap are made of the same material, and the pile spacing is 2 d (d is the pile diameter);
- (3)
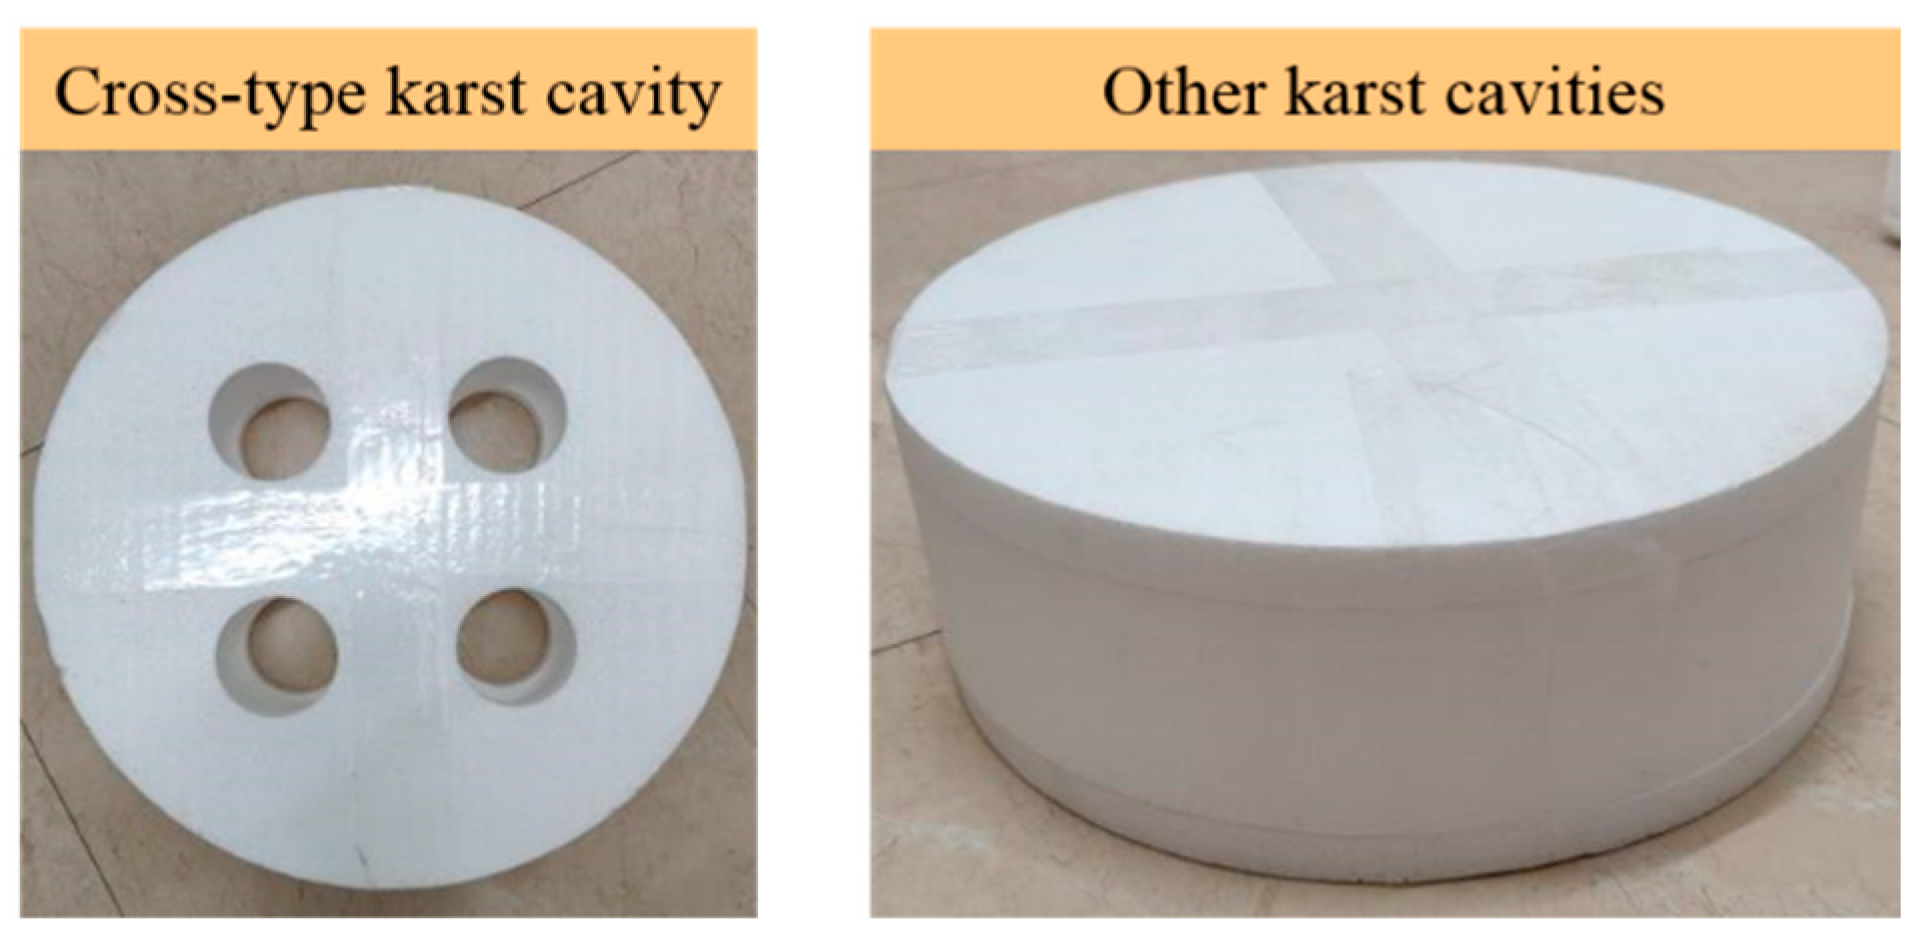
- The shape of the karst cavity is a regular cylinder. The filling of the karst cavity is not considered, and the interior of the karst cavity is regarded as a complete cavity;
- (4)
- The top plate of the karst cavity is complete and has a thickness of 2 d.
2.2. Similarity Relationship
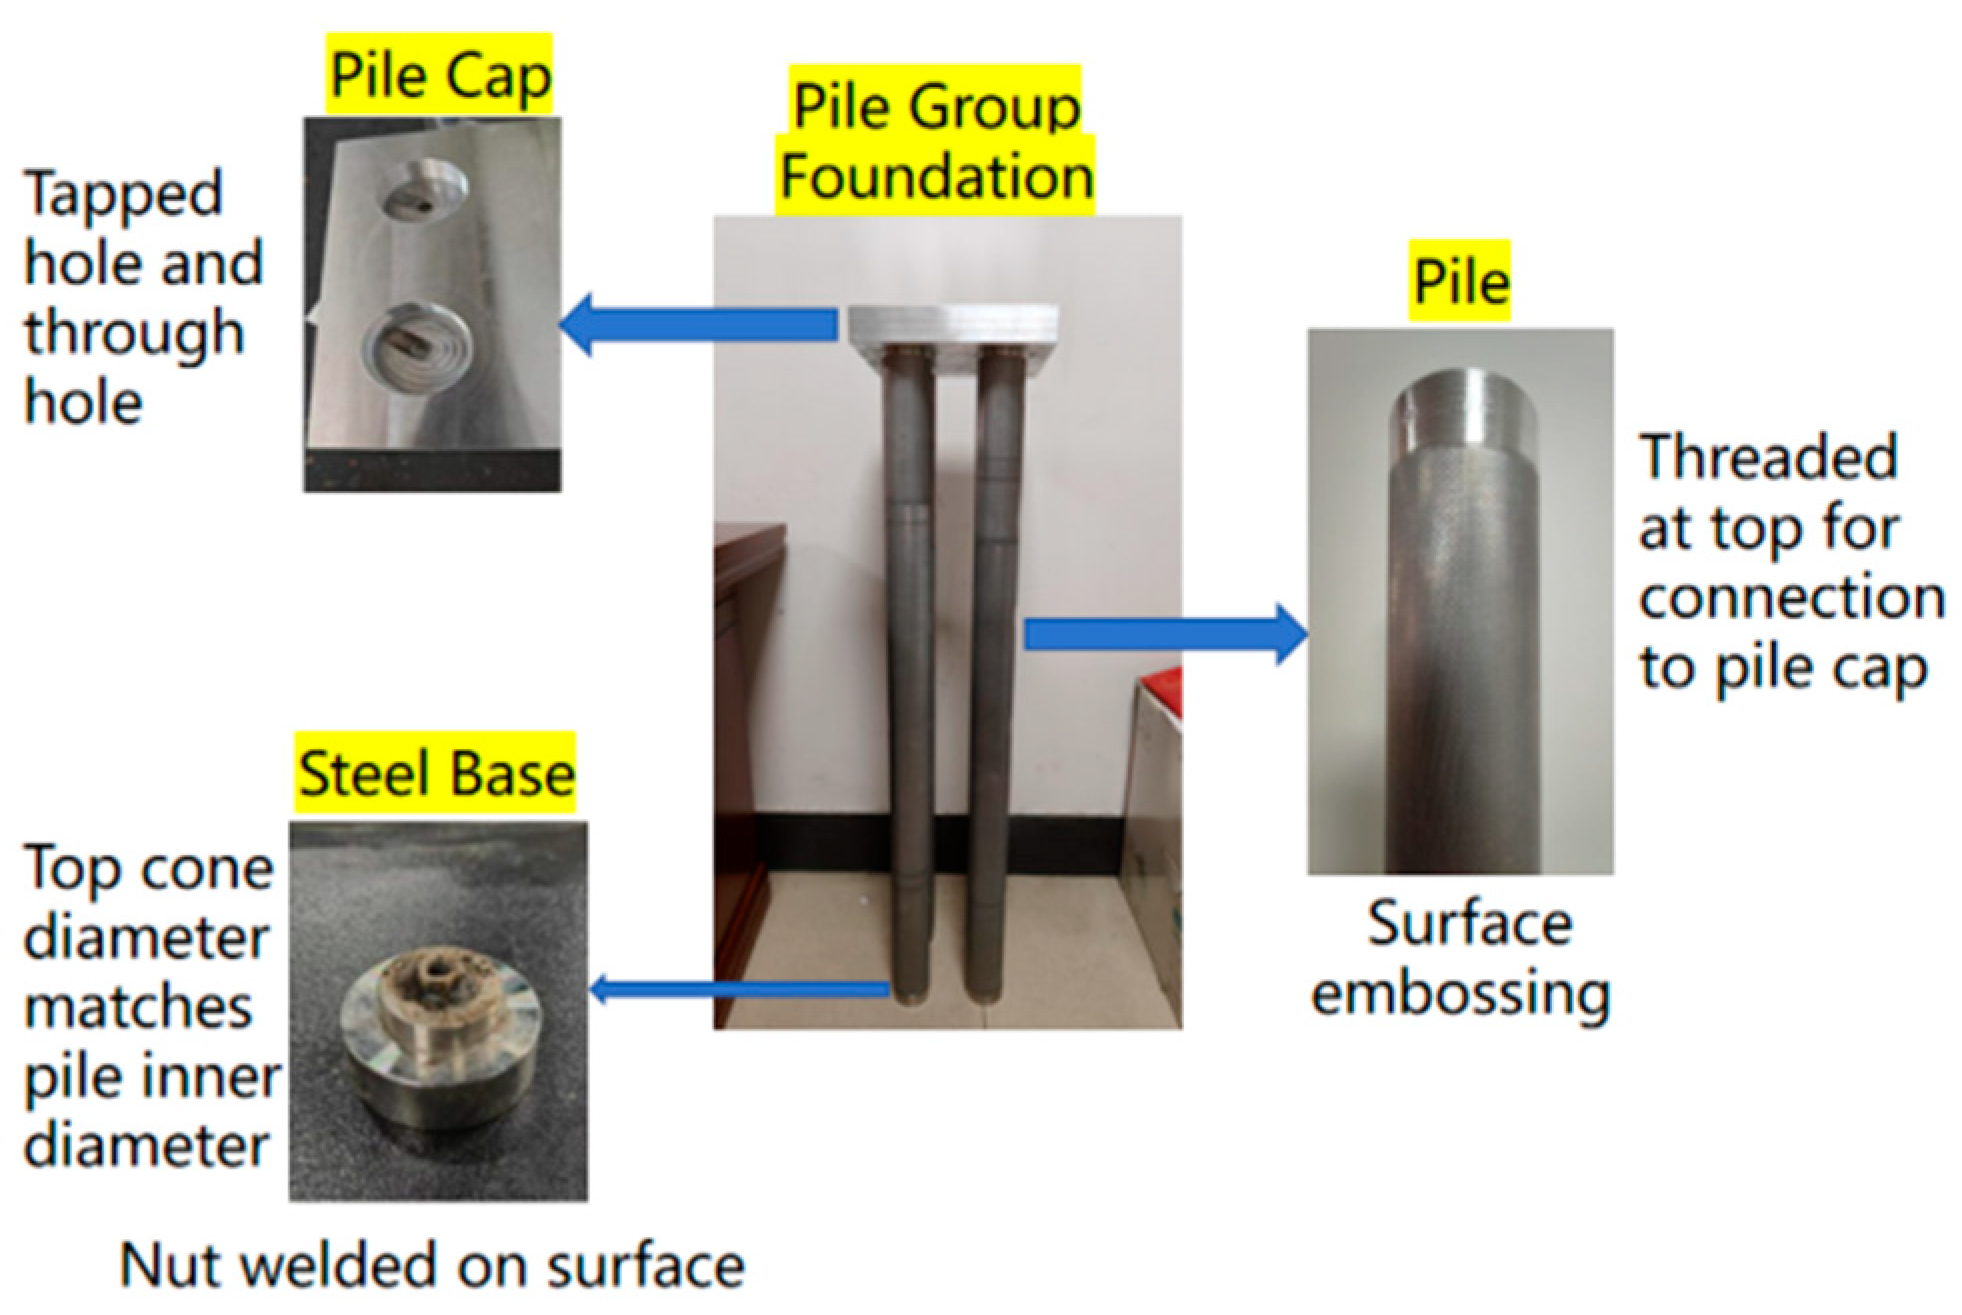
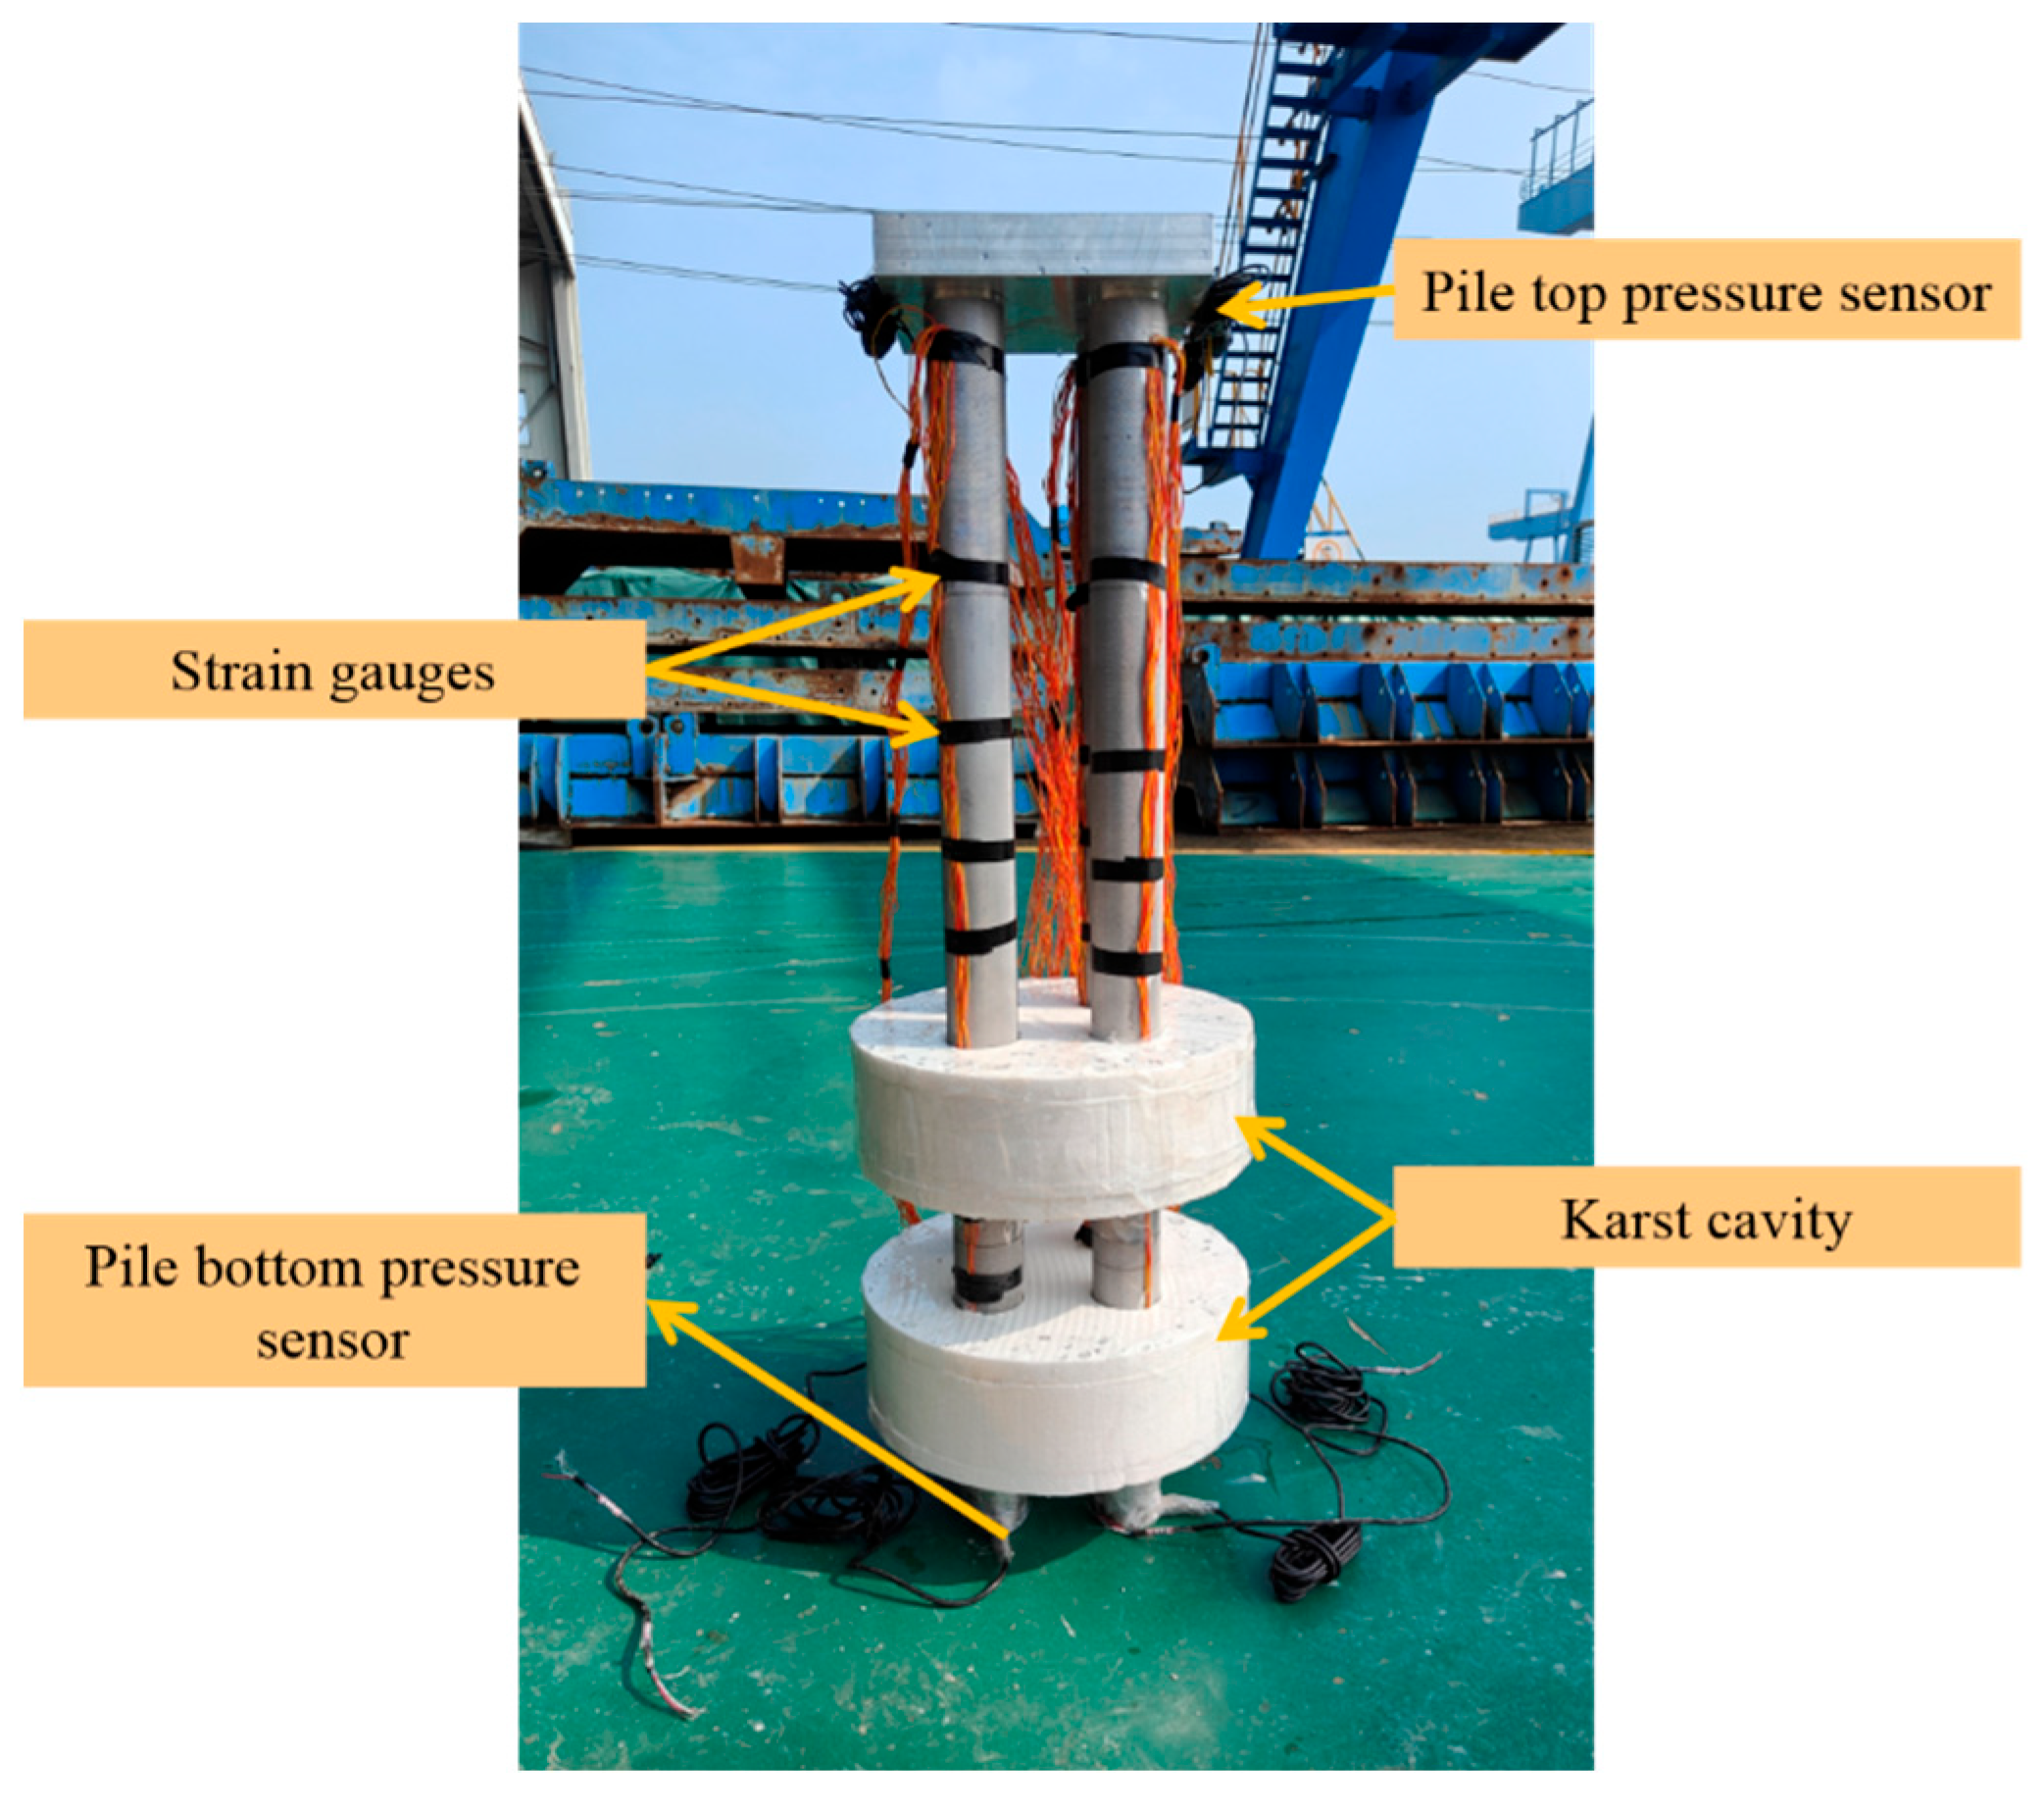
2.3. Model Pile Design
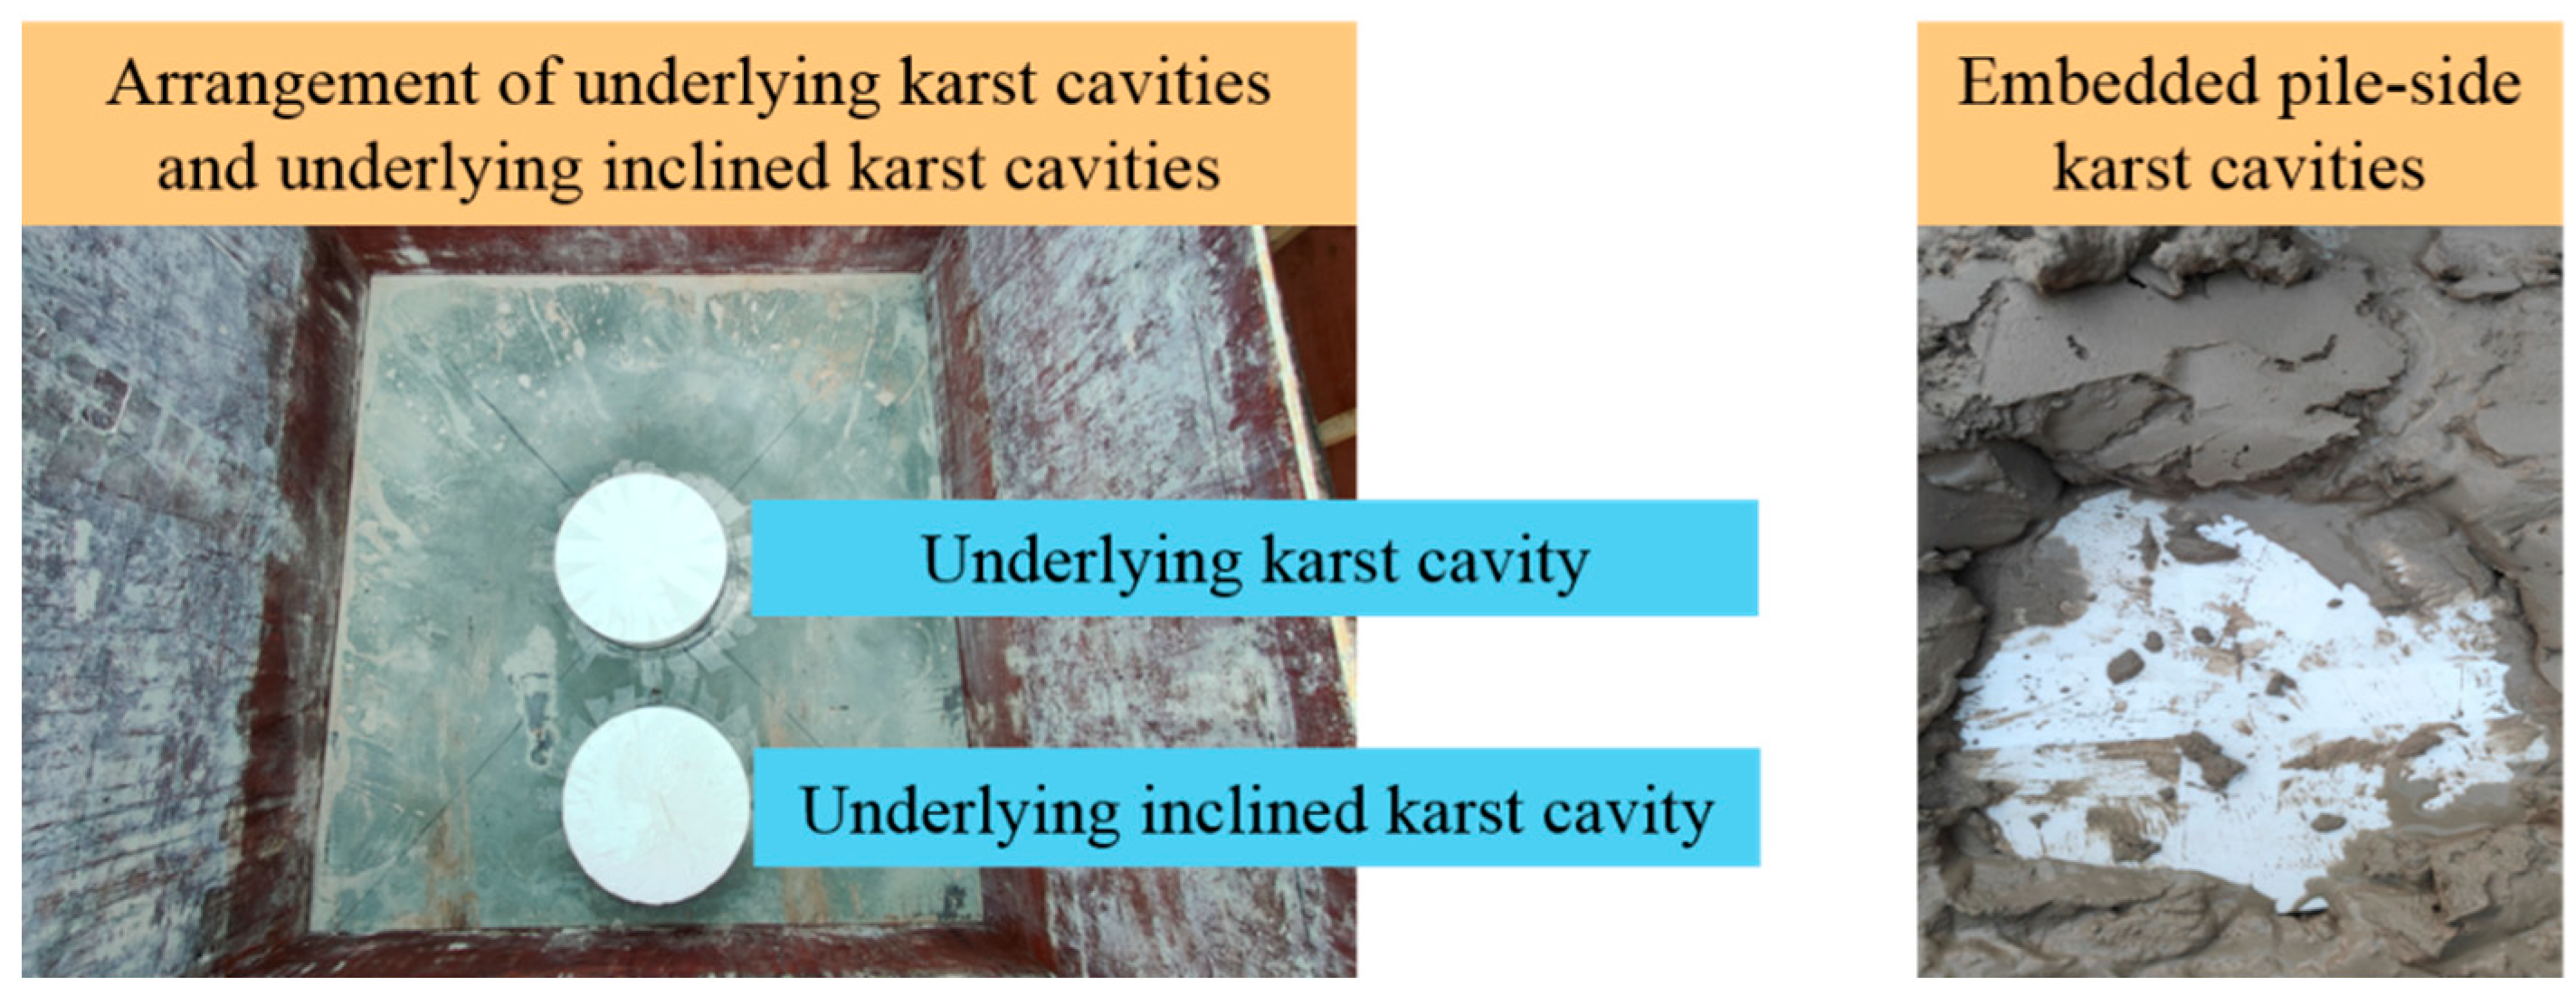
2.4. Karst Cavity Design
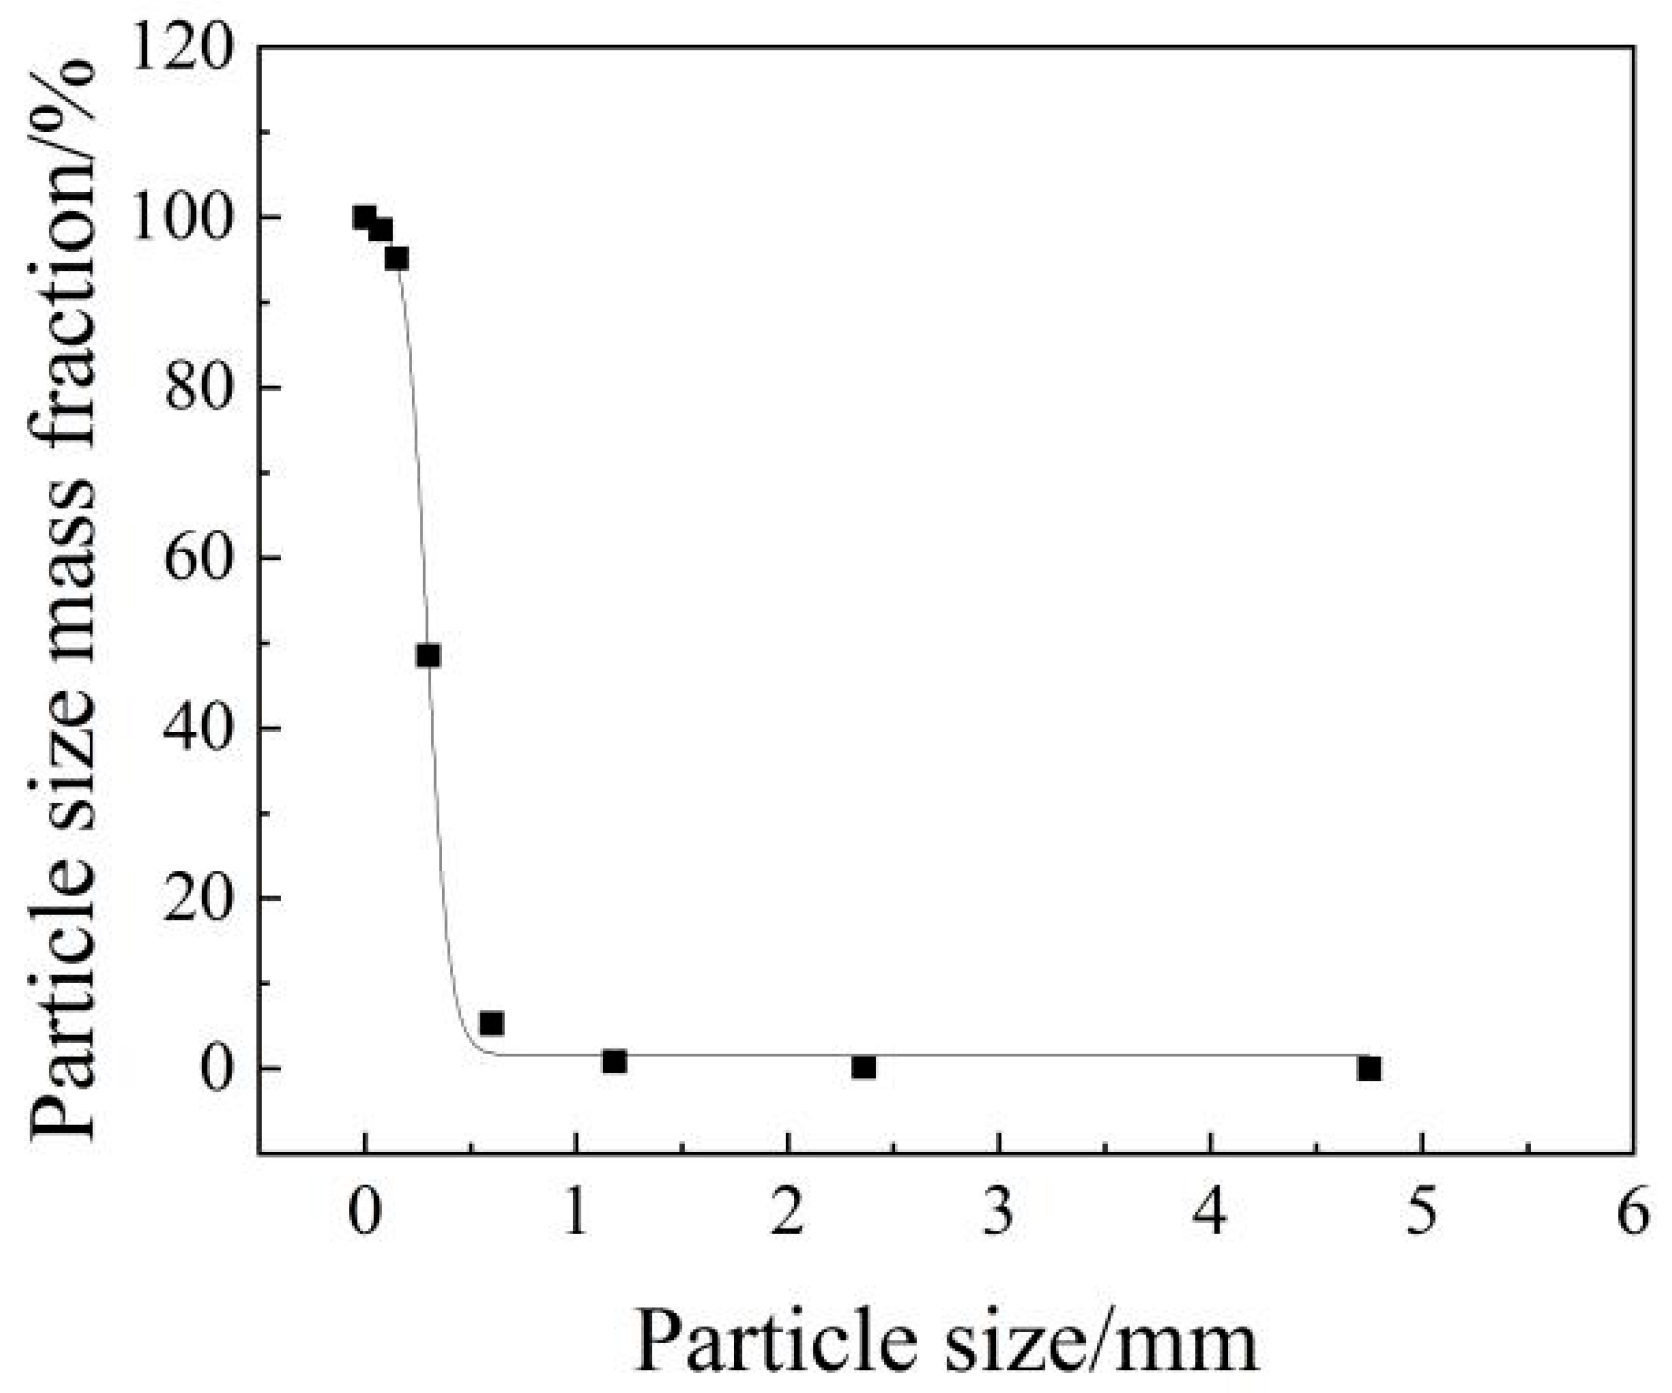
2.5. Rock and Soil Layer Design
2.6. Model Solution
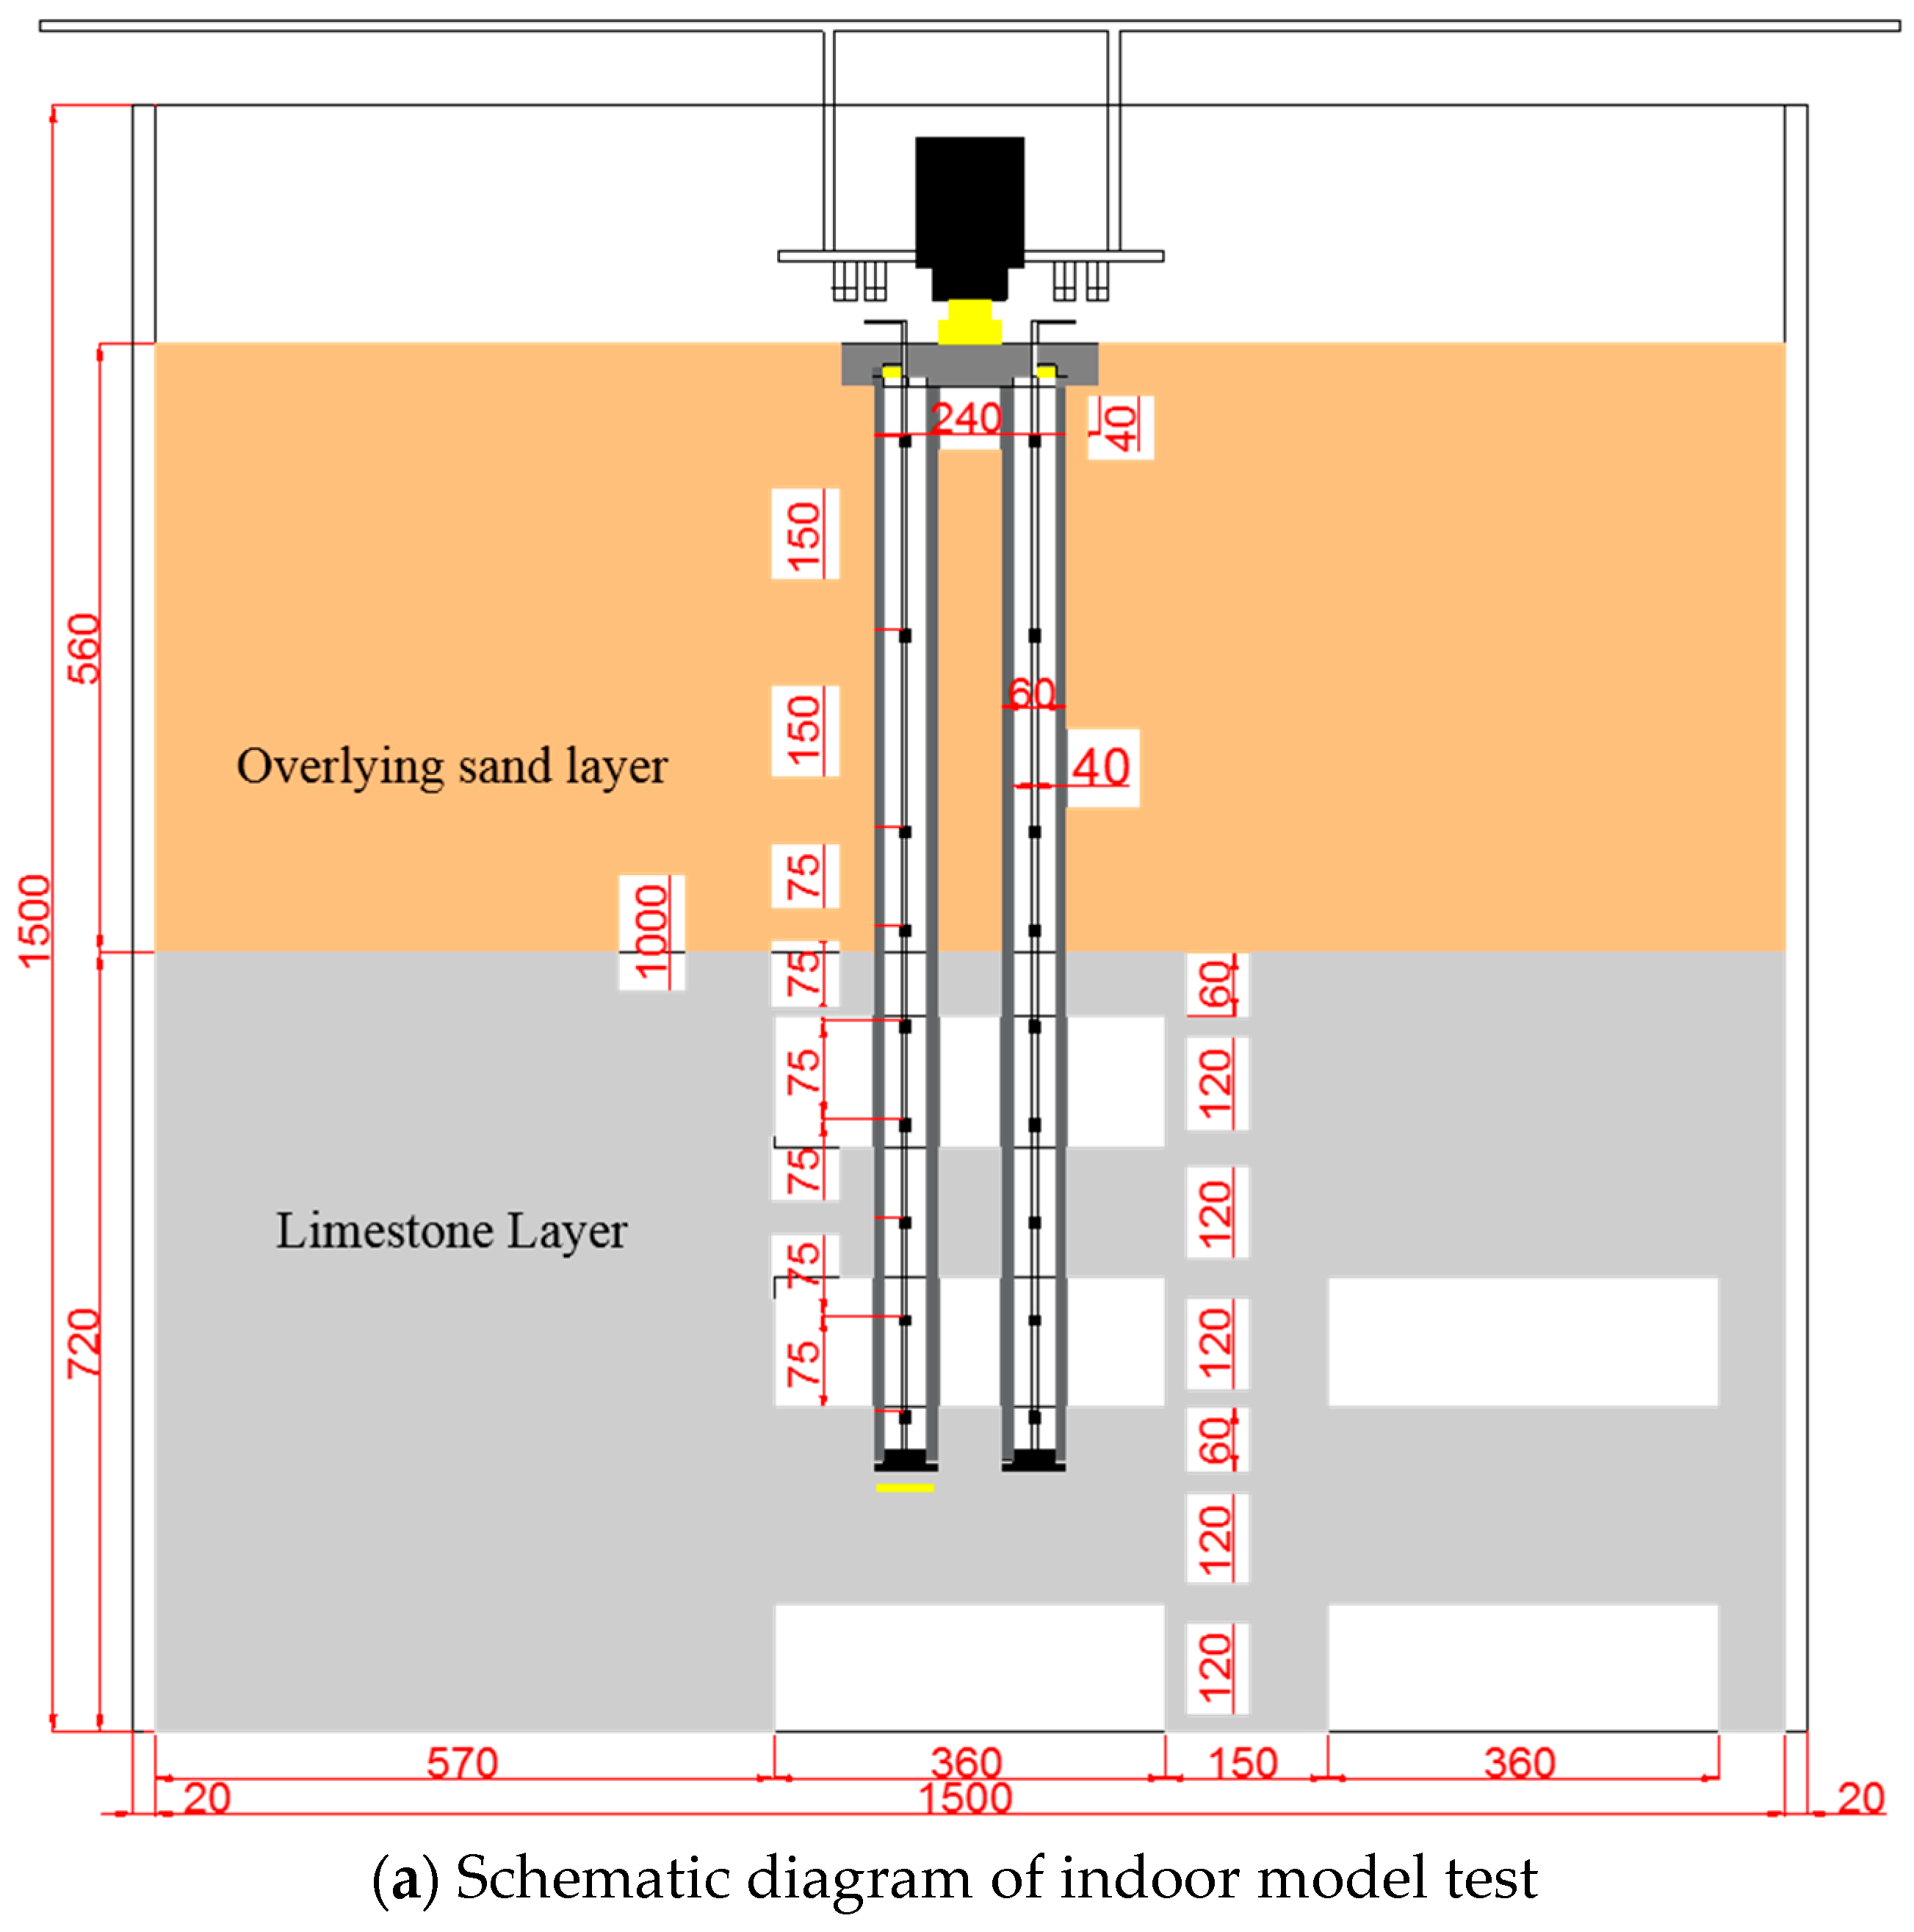
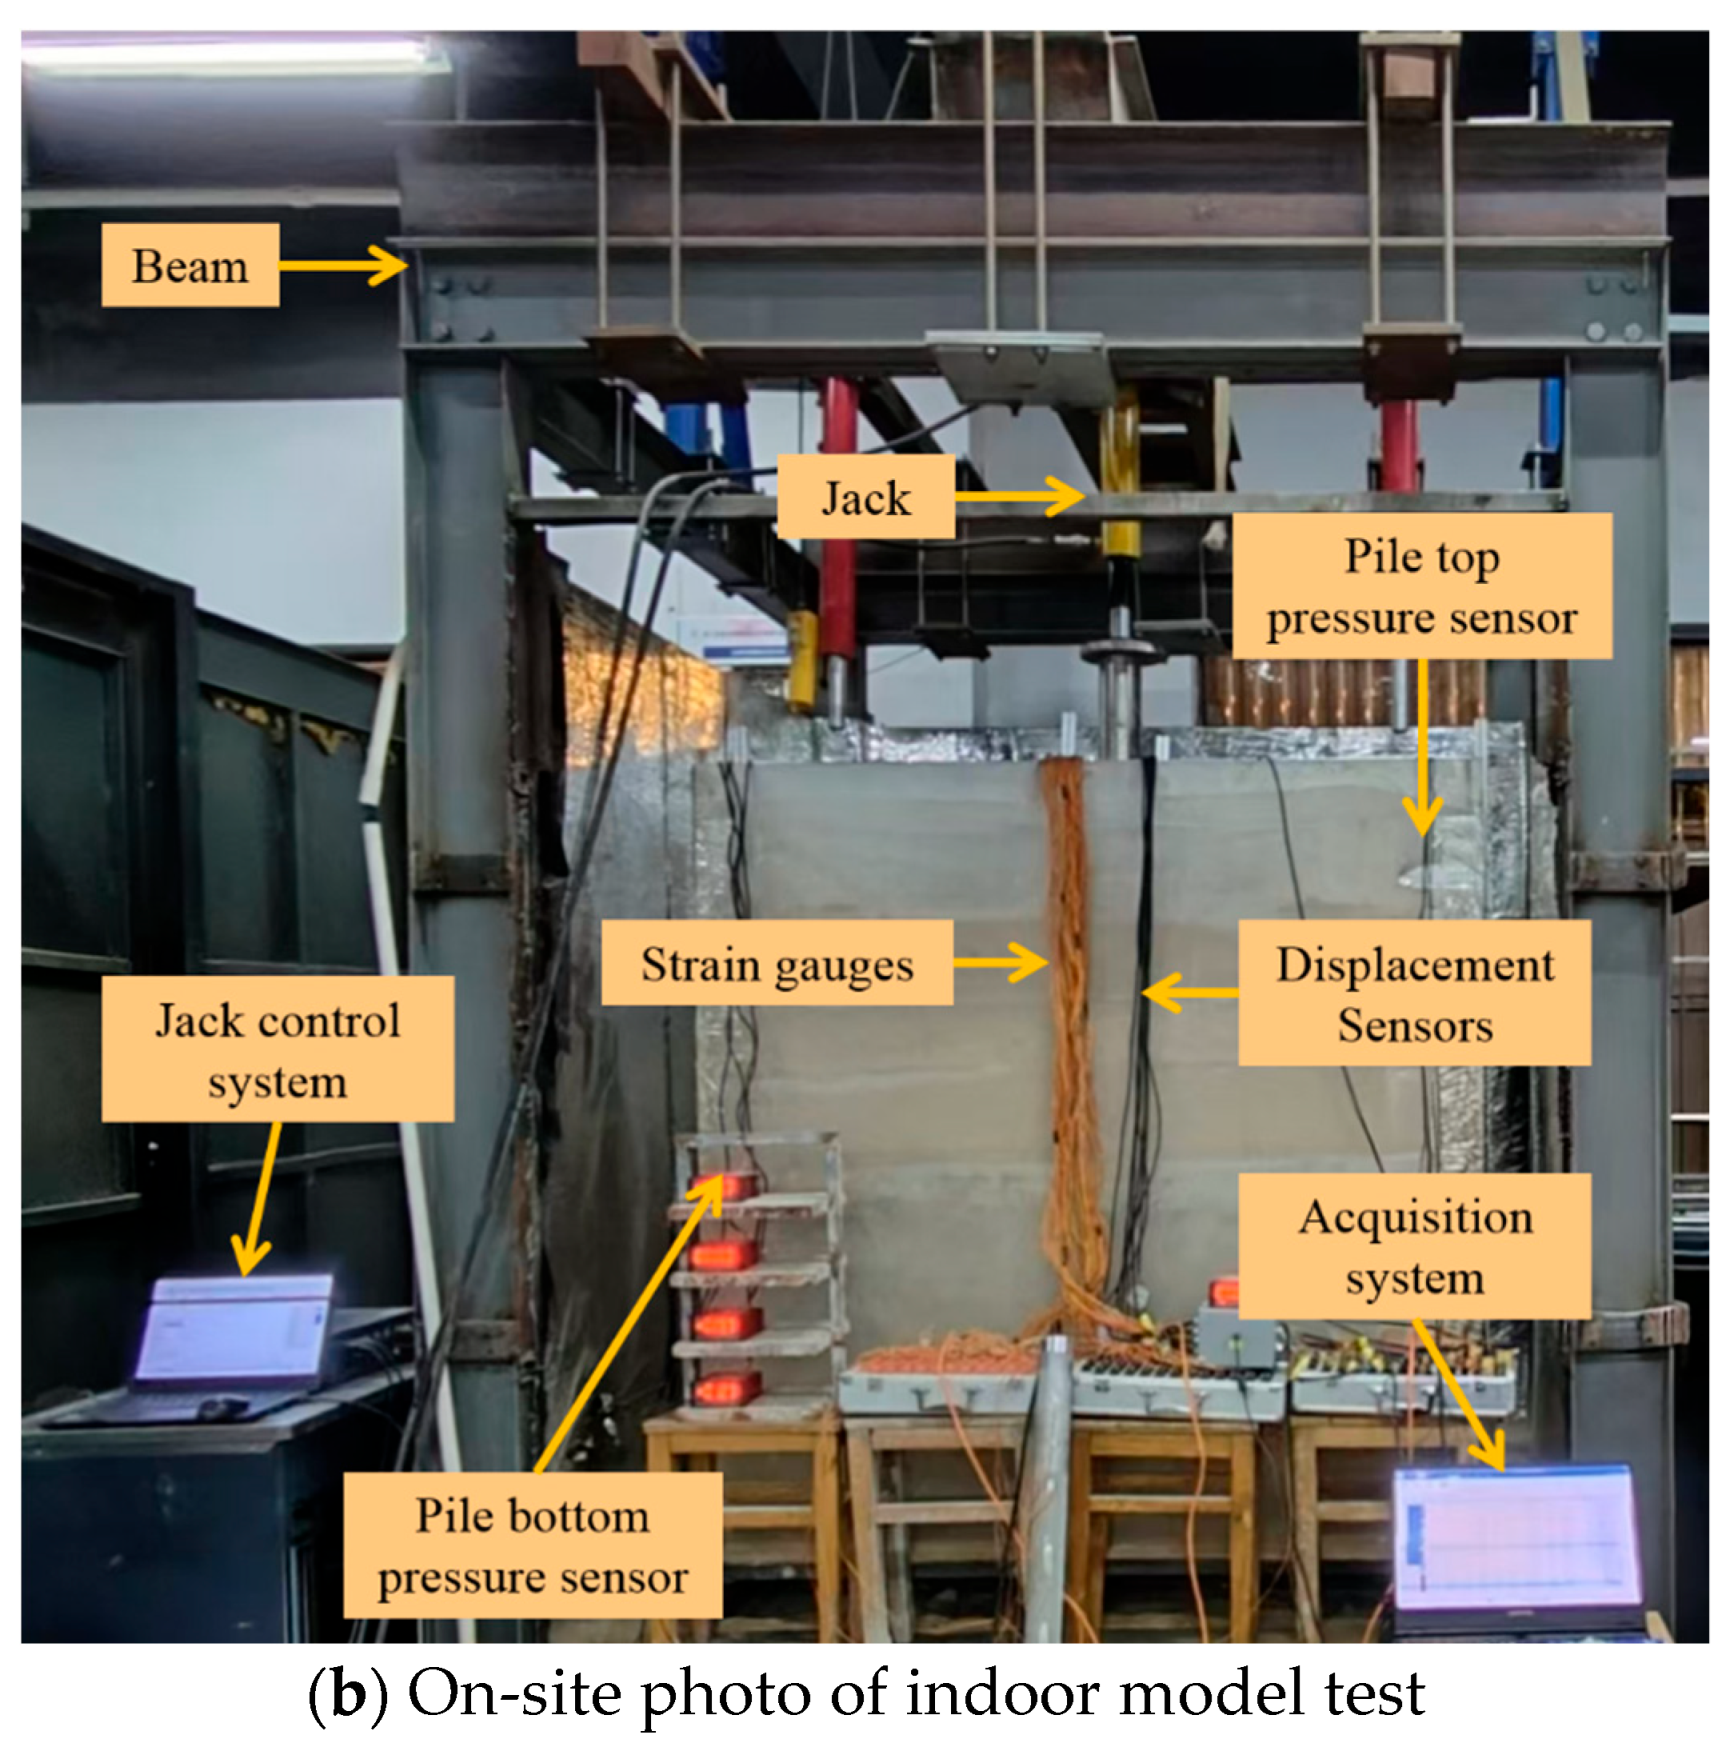
2.7. Loading and Testing System
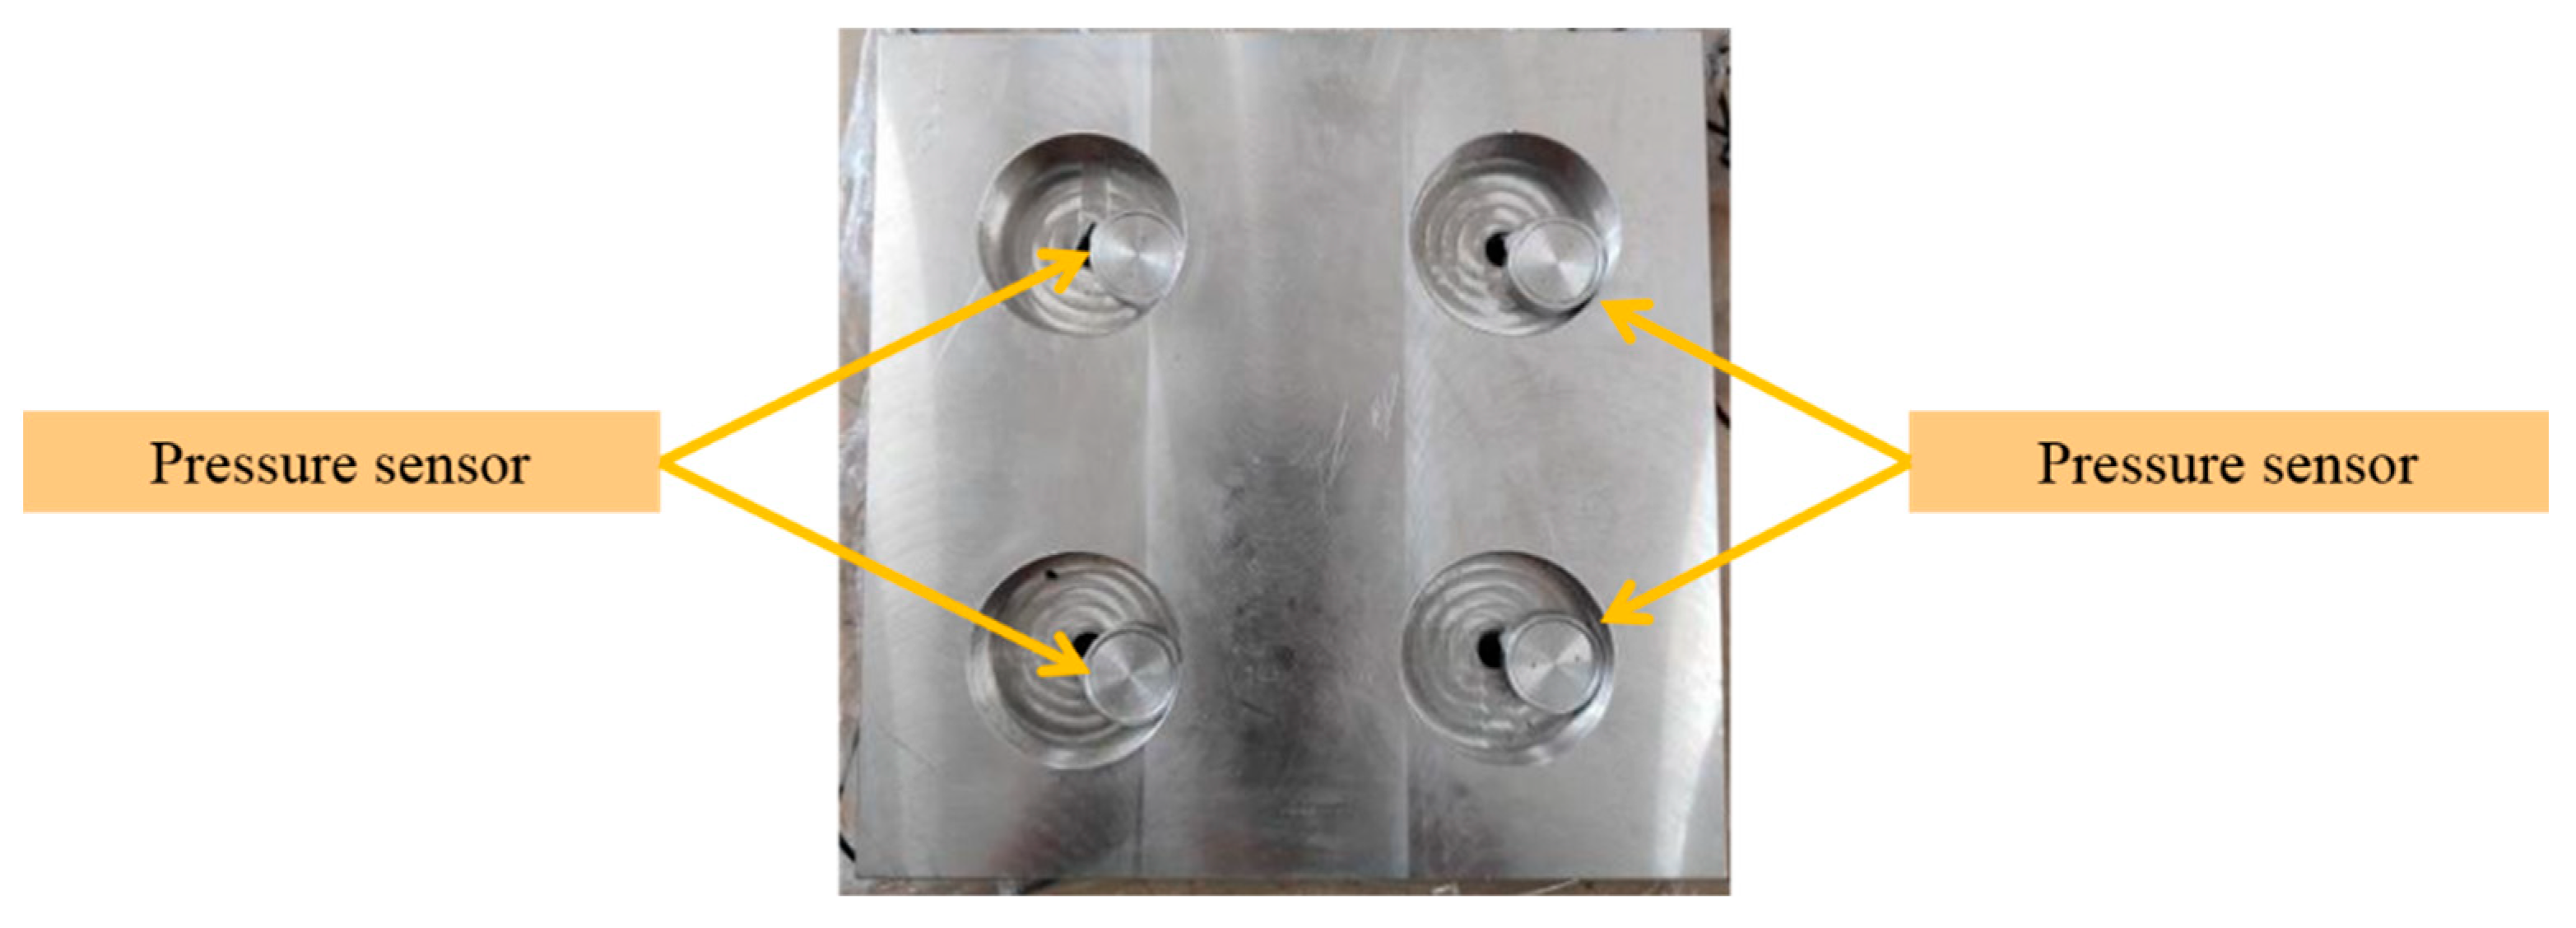
2.7.1. Measurement of Loads on the Cap, Pile Top and Pile Bottom
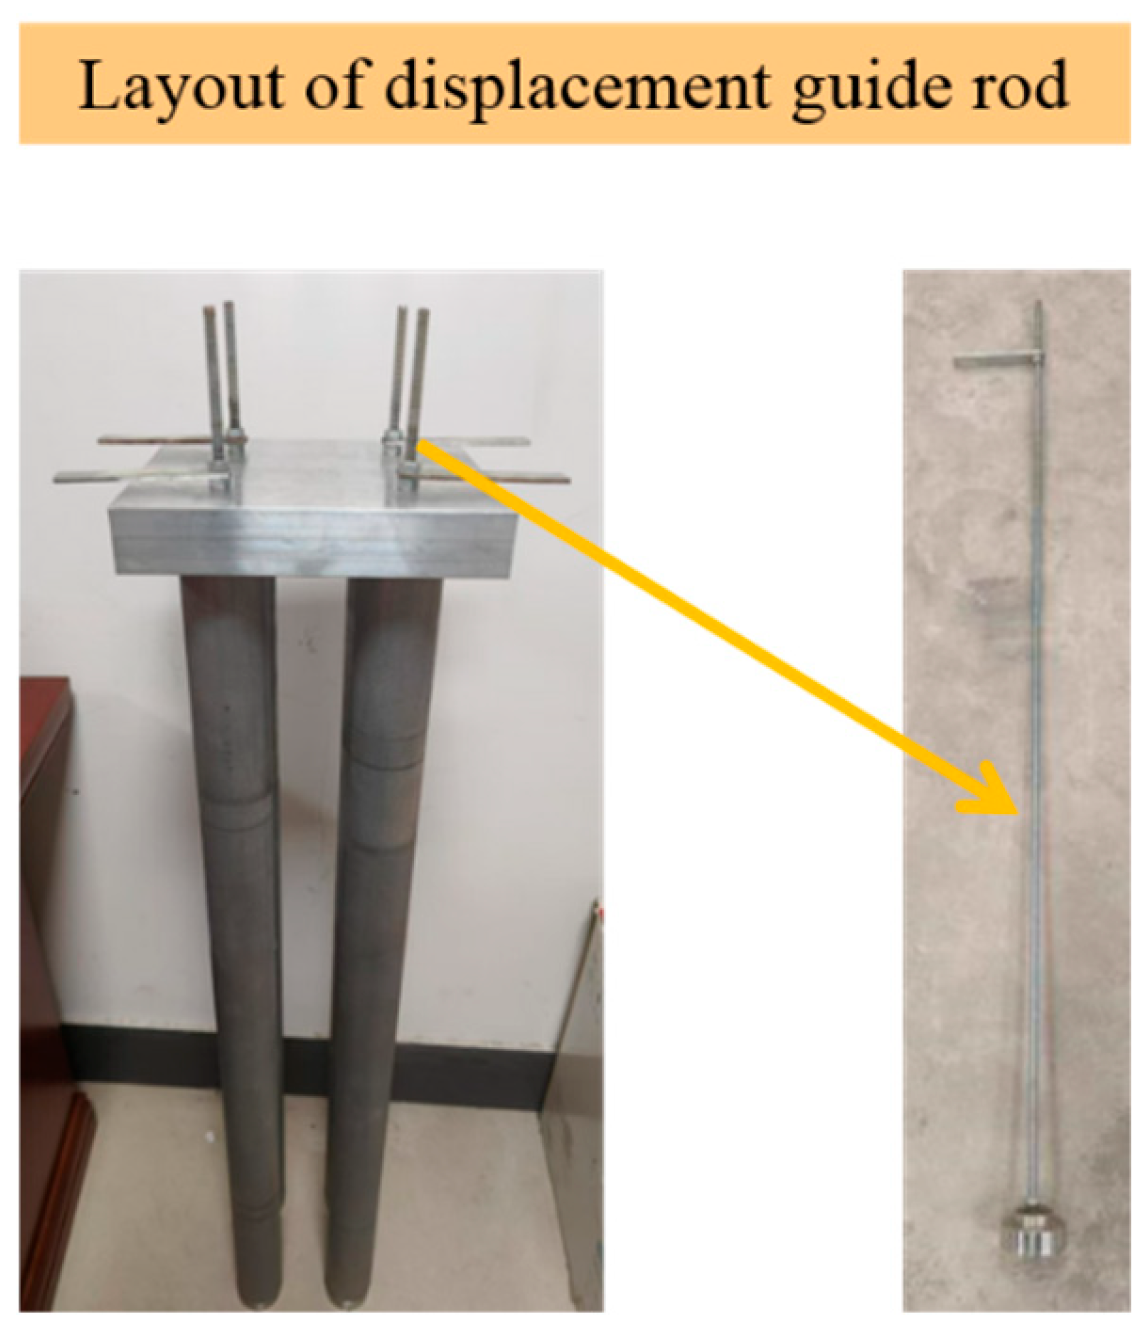
2.7.2. Measurement of Settlement on the Cap and Pile Bottom
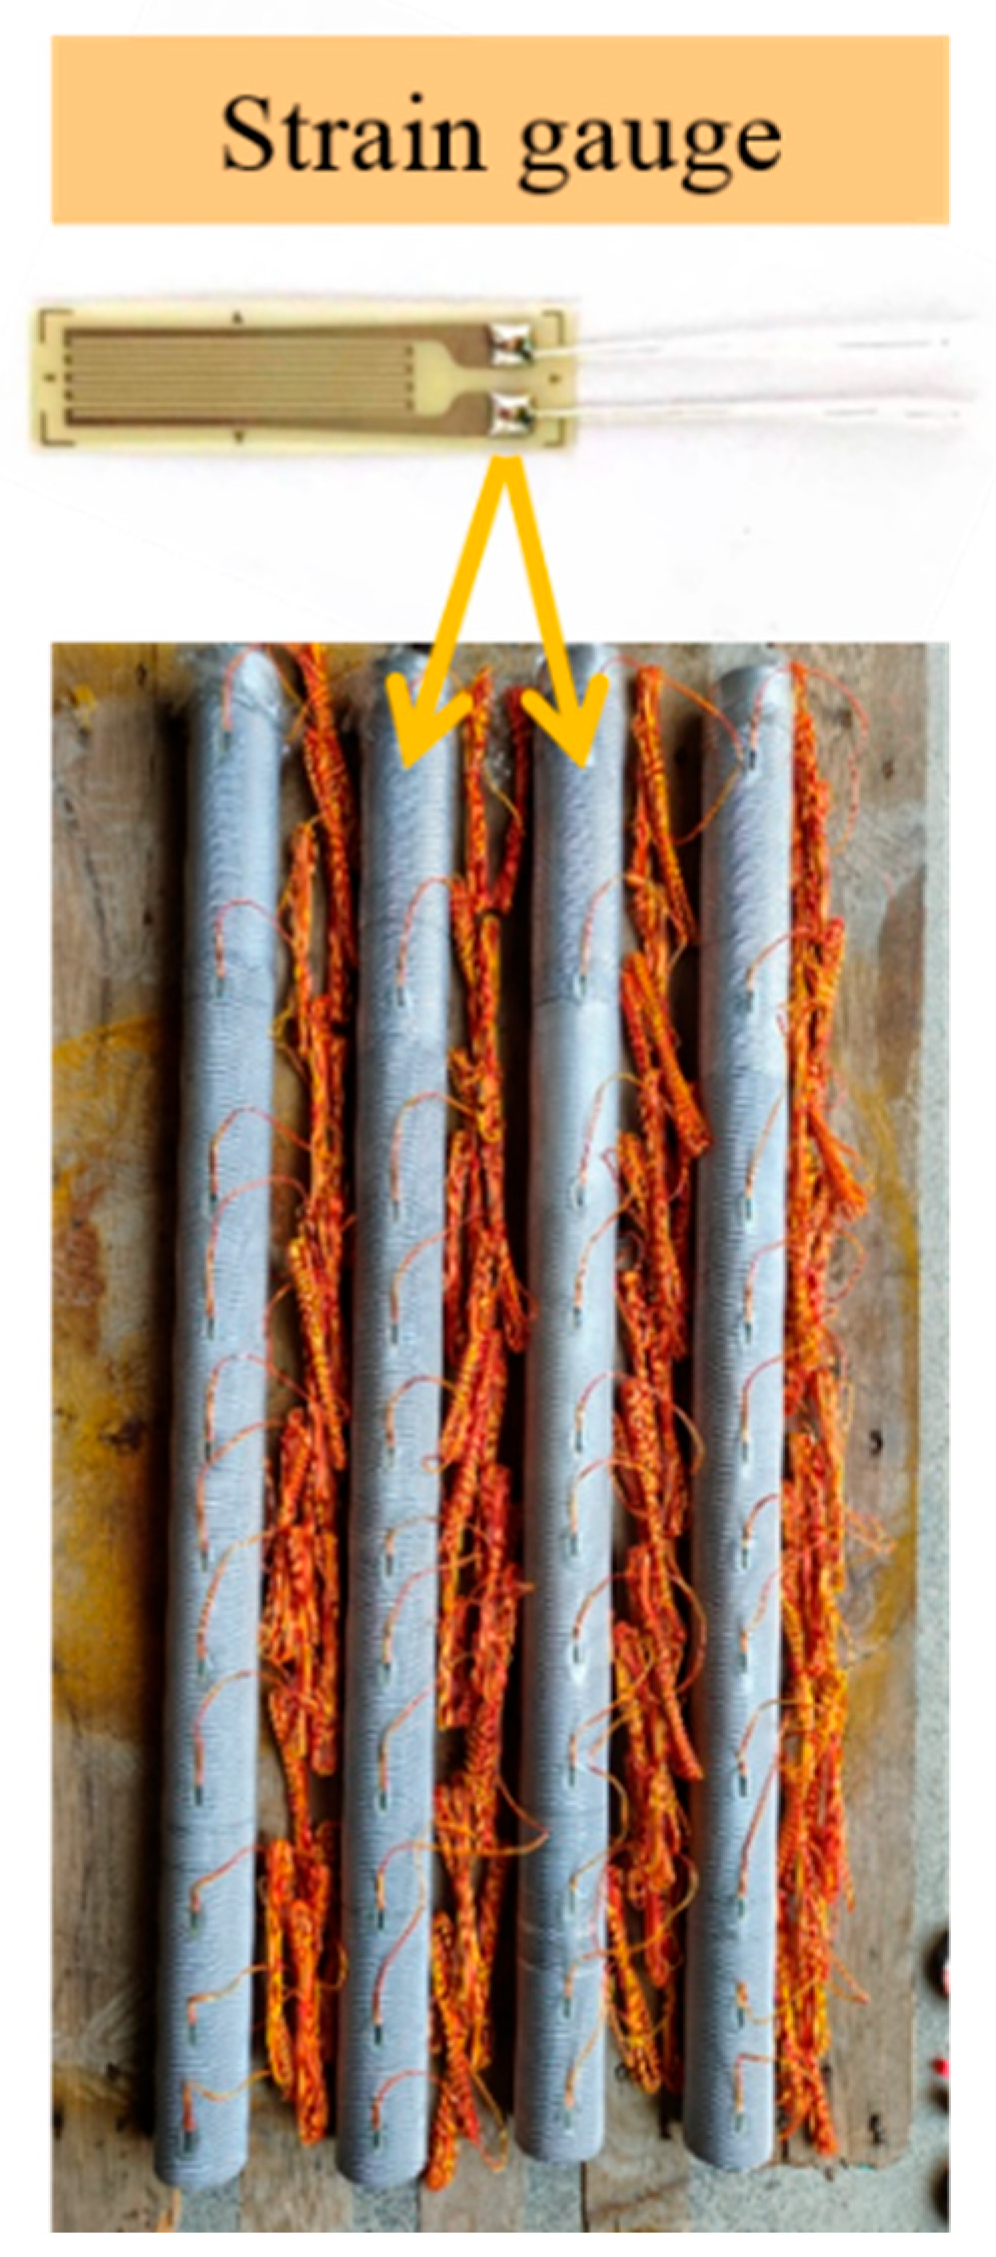
2.7.3. Measurement of Axial Force Along the Pile Shaft and Side Friction
2.8. Experimental Procedures
2.8.1. Model Preparation
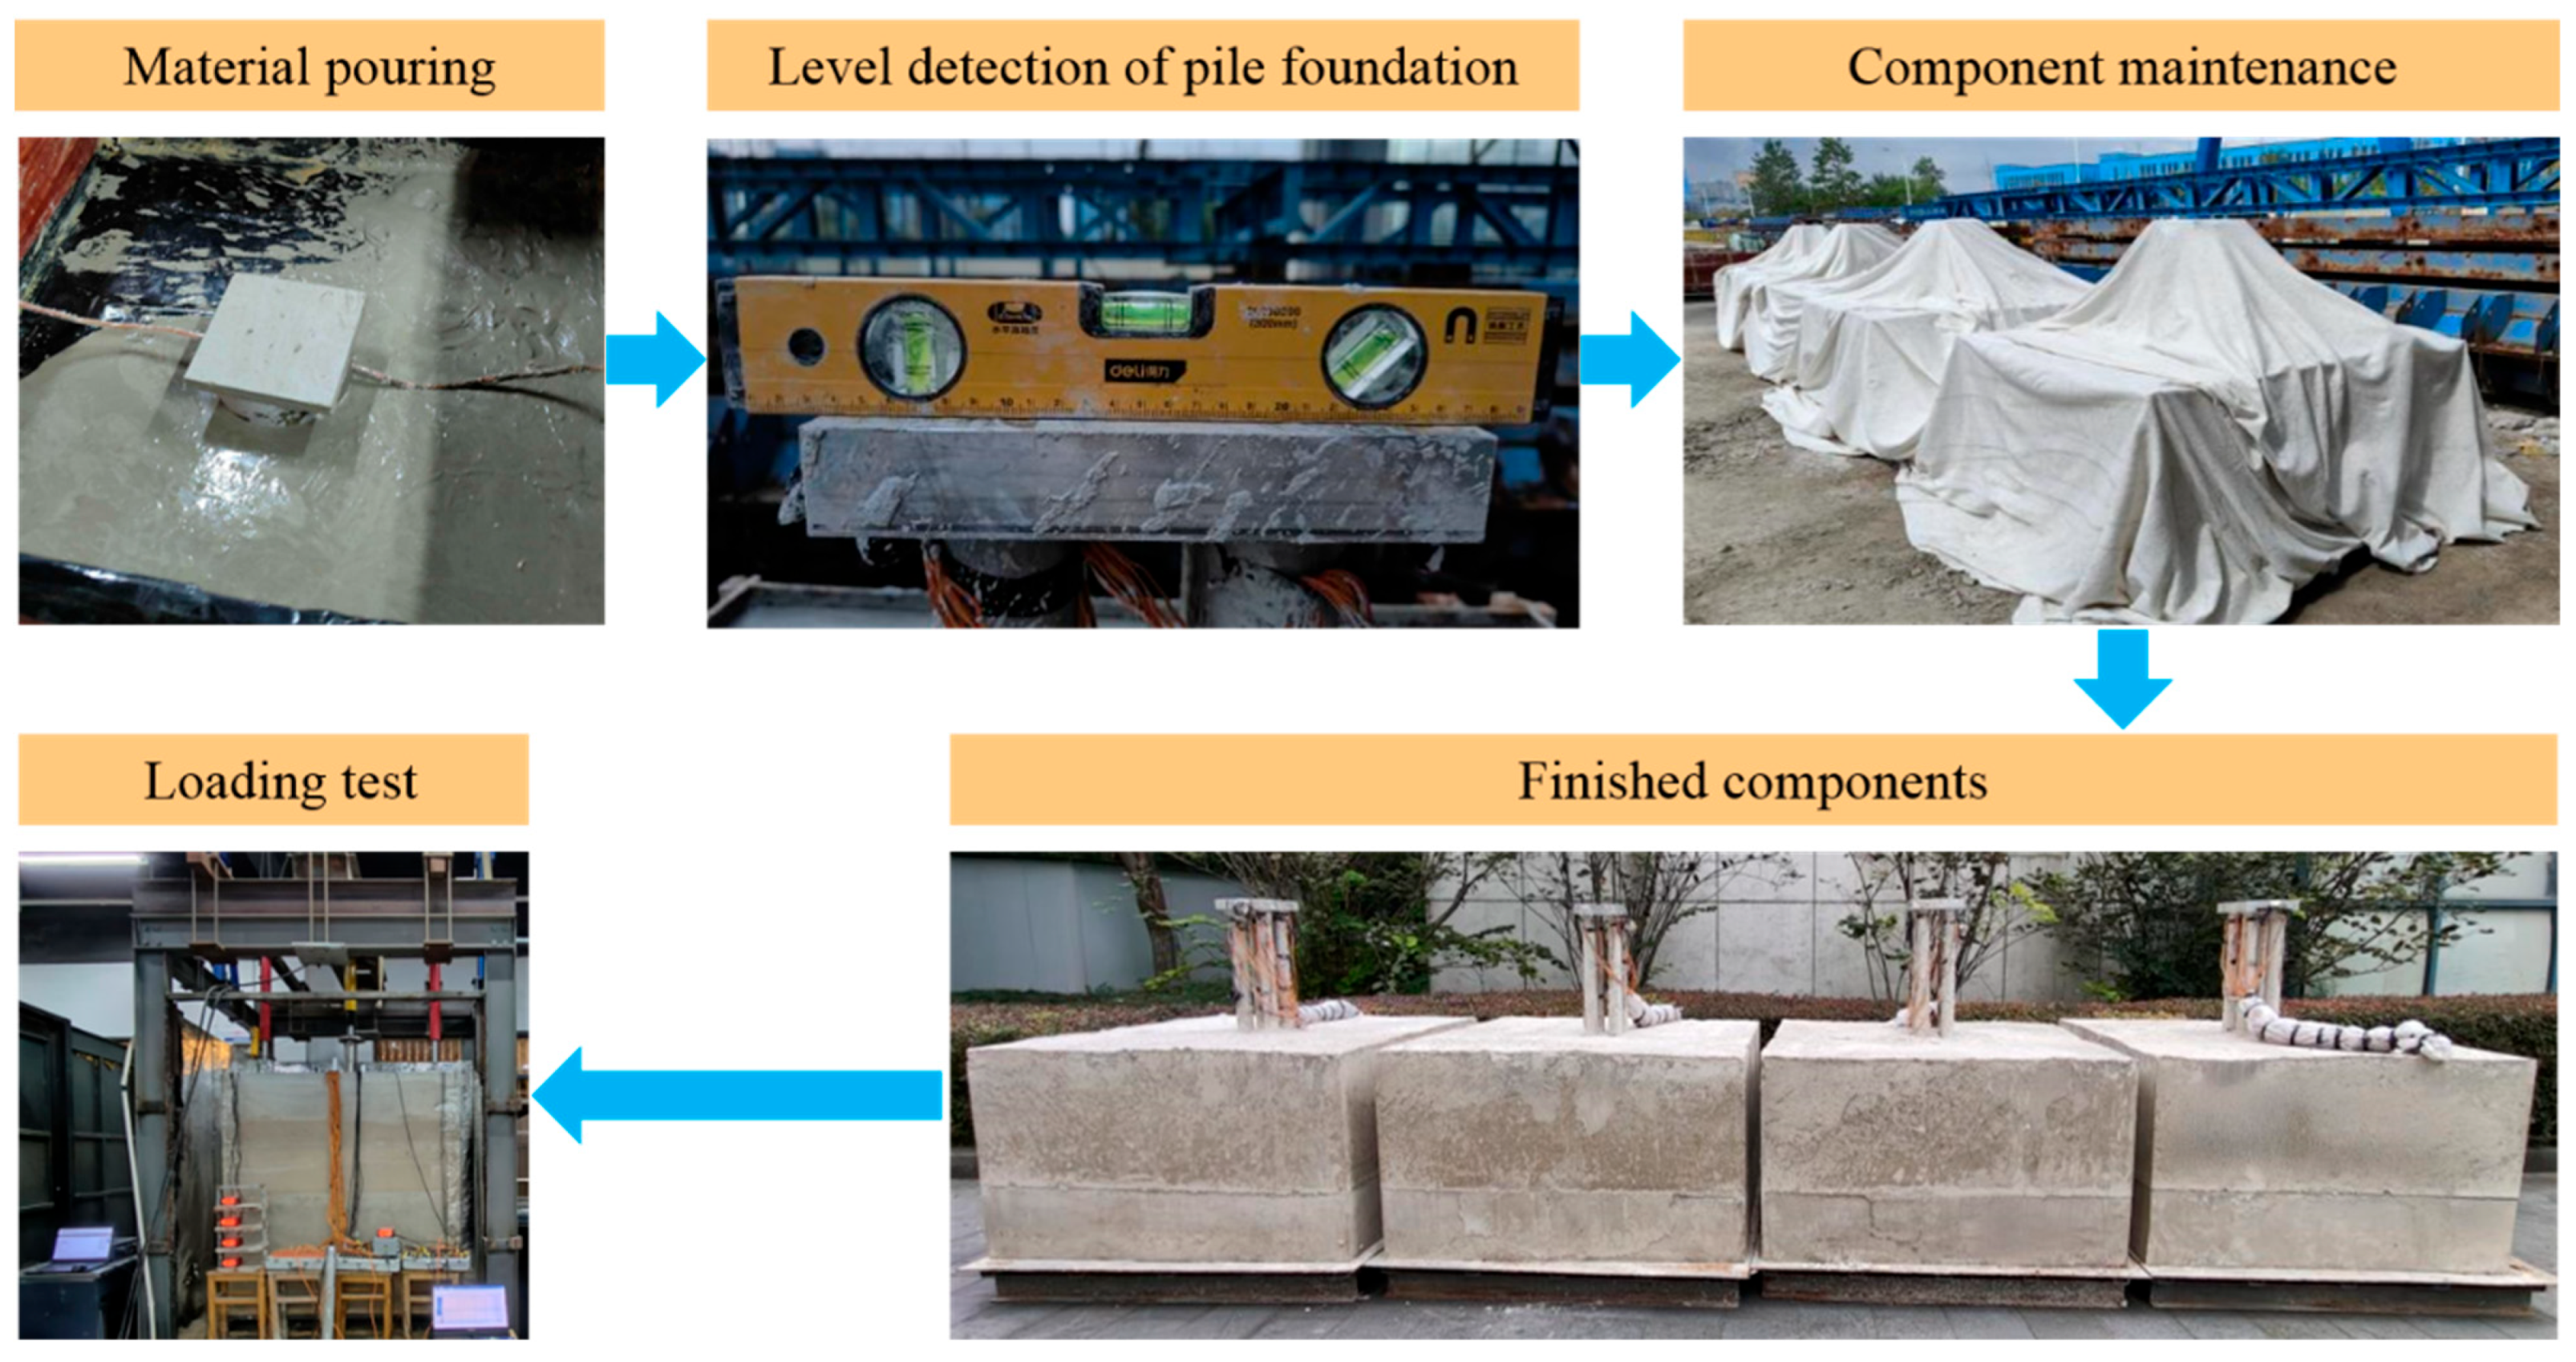
- (1)
- Pour fine sand, cement, gypsum, and light calcium carbonate into a mixer according to the proportion and add water to mix thoroughly.
- (2)
- After sufficient mixing, use a pump to pour the materials into a wooden model box, using a layered filling method, with each layer being 2 cm to ensure compaction.
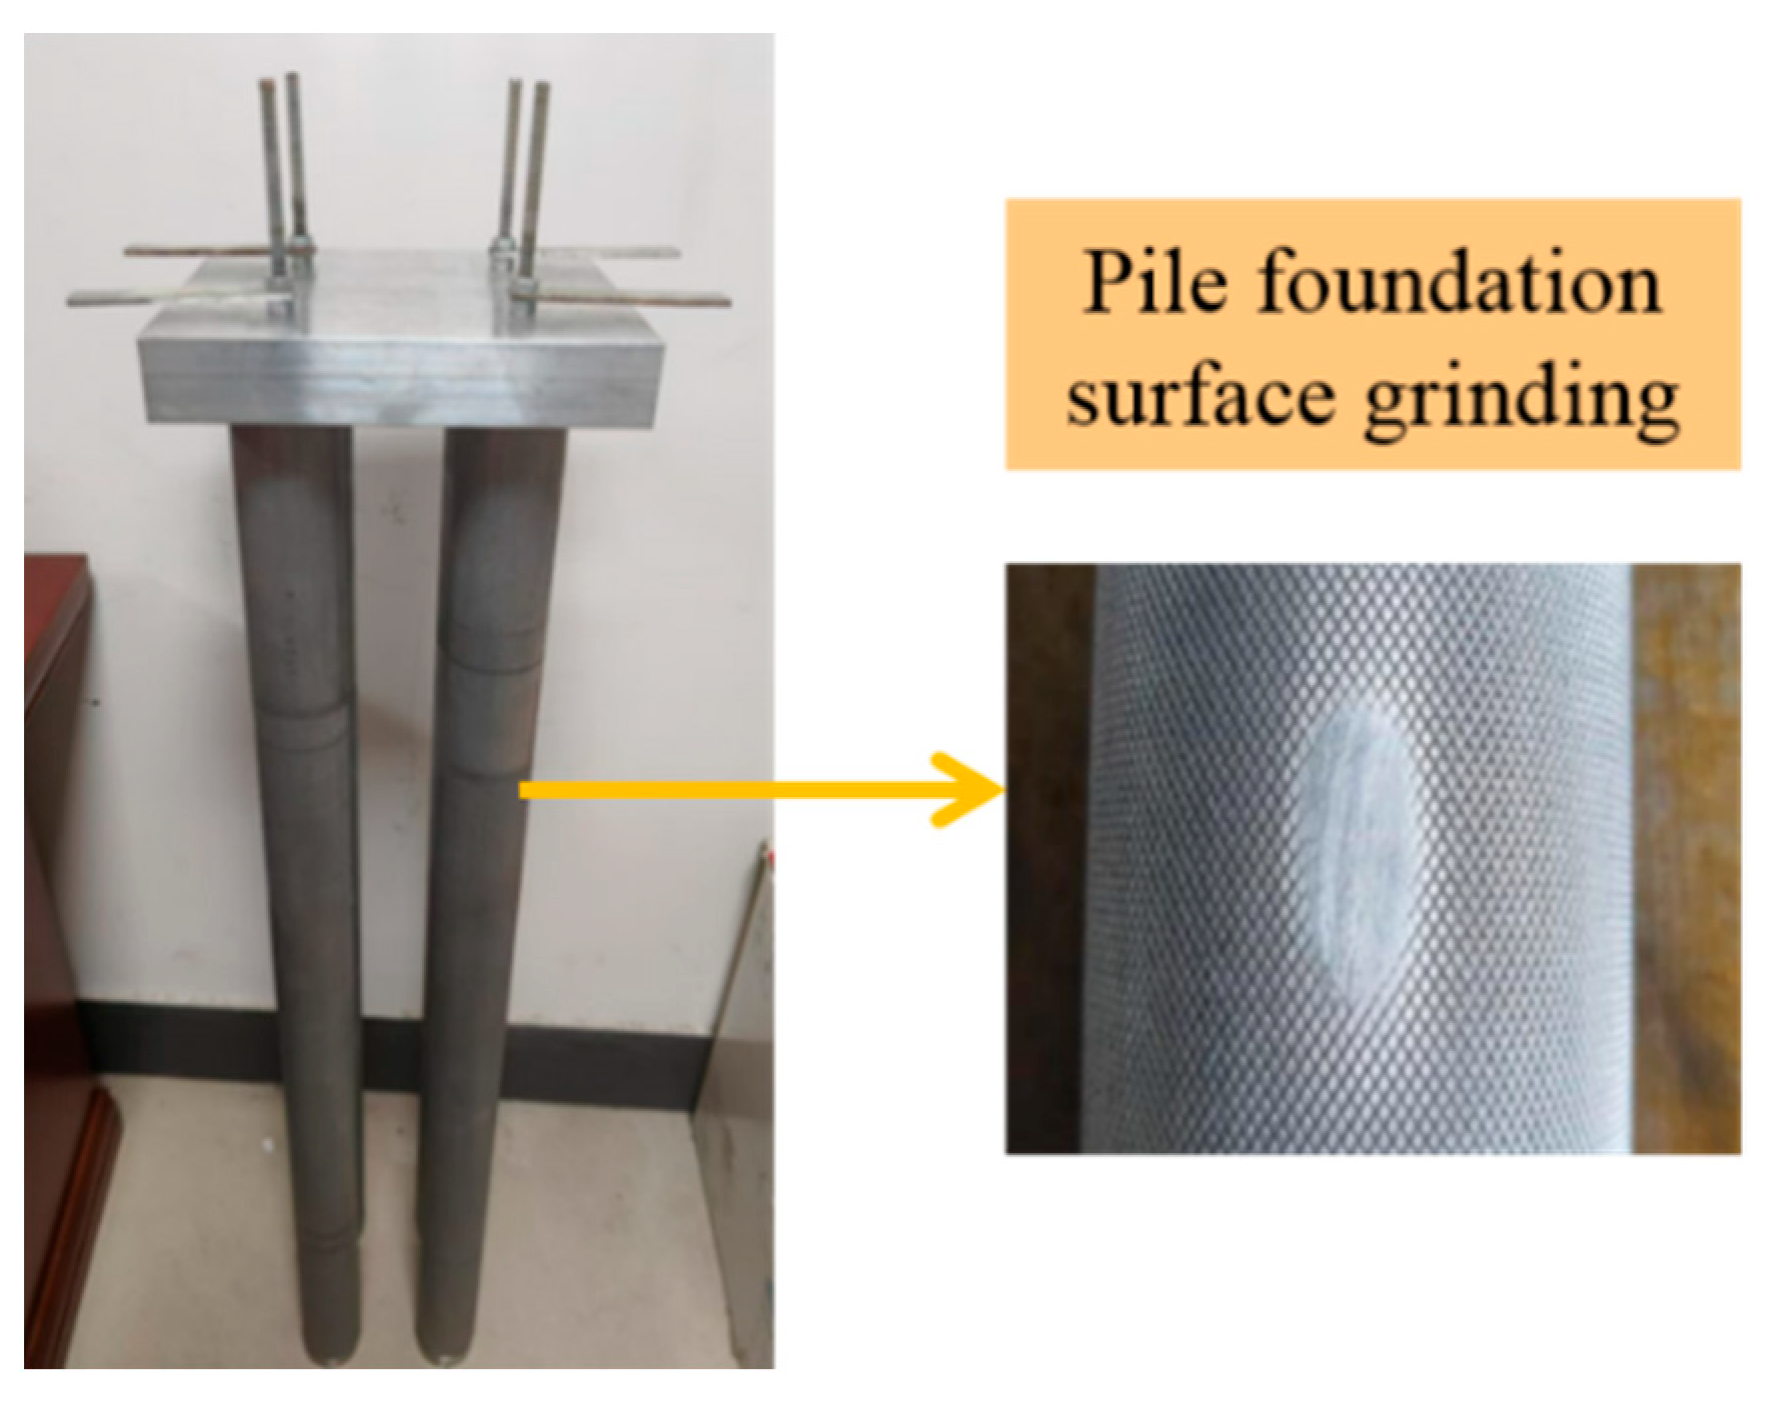
- (3)
- To ensure that the pile is vertical and will not tilt, first pour the part below the pile end, wait for it to have a little strength, place the model pile in the predetermined position, and then pour the embedded rock section. After pouring, check whether the foundation is level. After each pouring, check the position of the karst cavity, and adjust it in time if there is any deviation.
- (4)
- After pouring, remove the mold after it has reached a certain strength, cover it with geotextile, maintain a good curing environment, and water it every day. After 28 days of curing, conduct a test.
- (5)
- After curing, put the component in a detachable acrylic box, fill the upper part with fine river sand evenly to a predetermined height using a sand filling machine, and put it in the loading device for a loading test.
2.8.2. Test Operation and Loading Termination Criteria
2.9. Experimental Working Conditions
3. Results
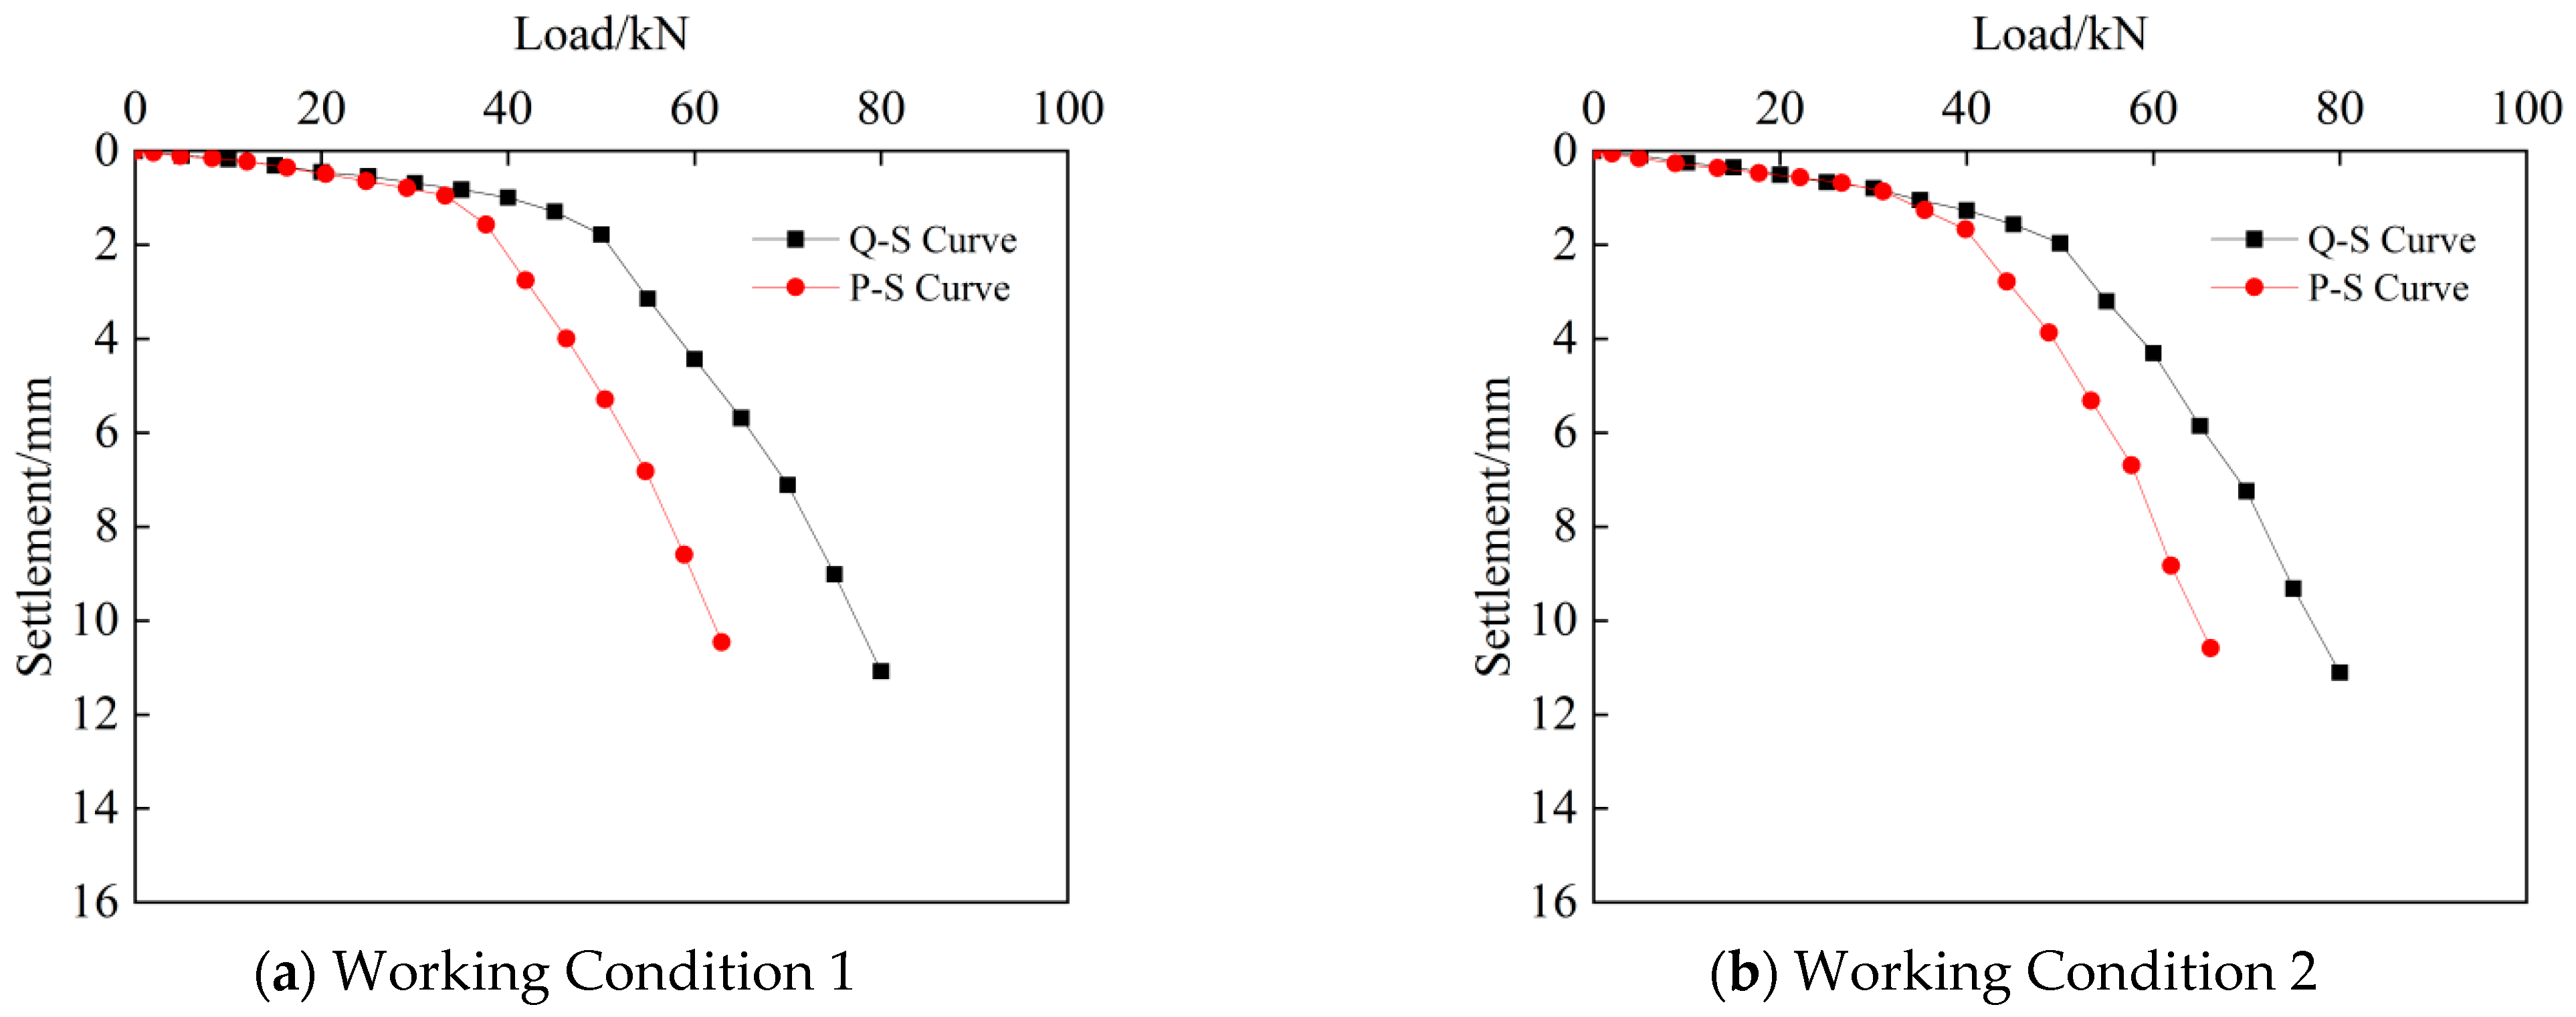
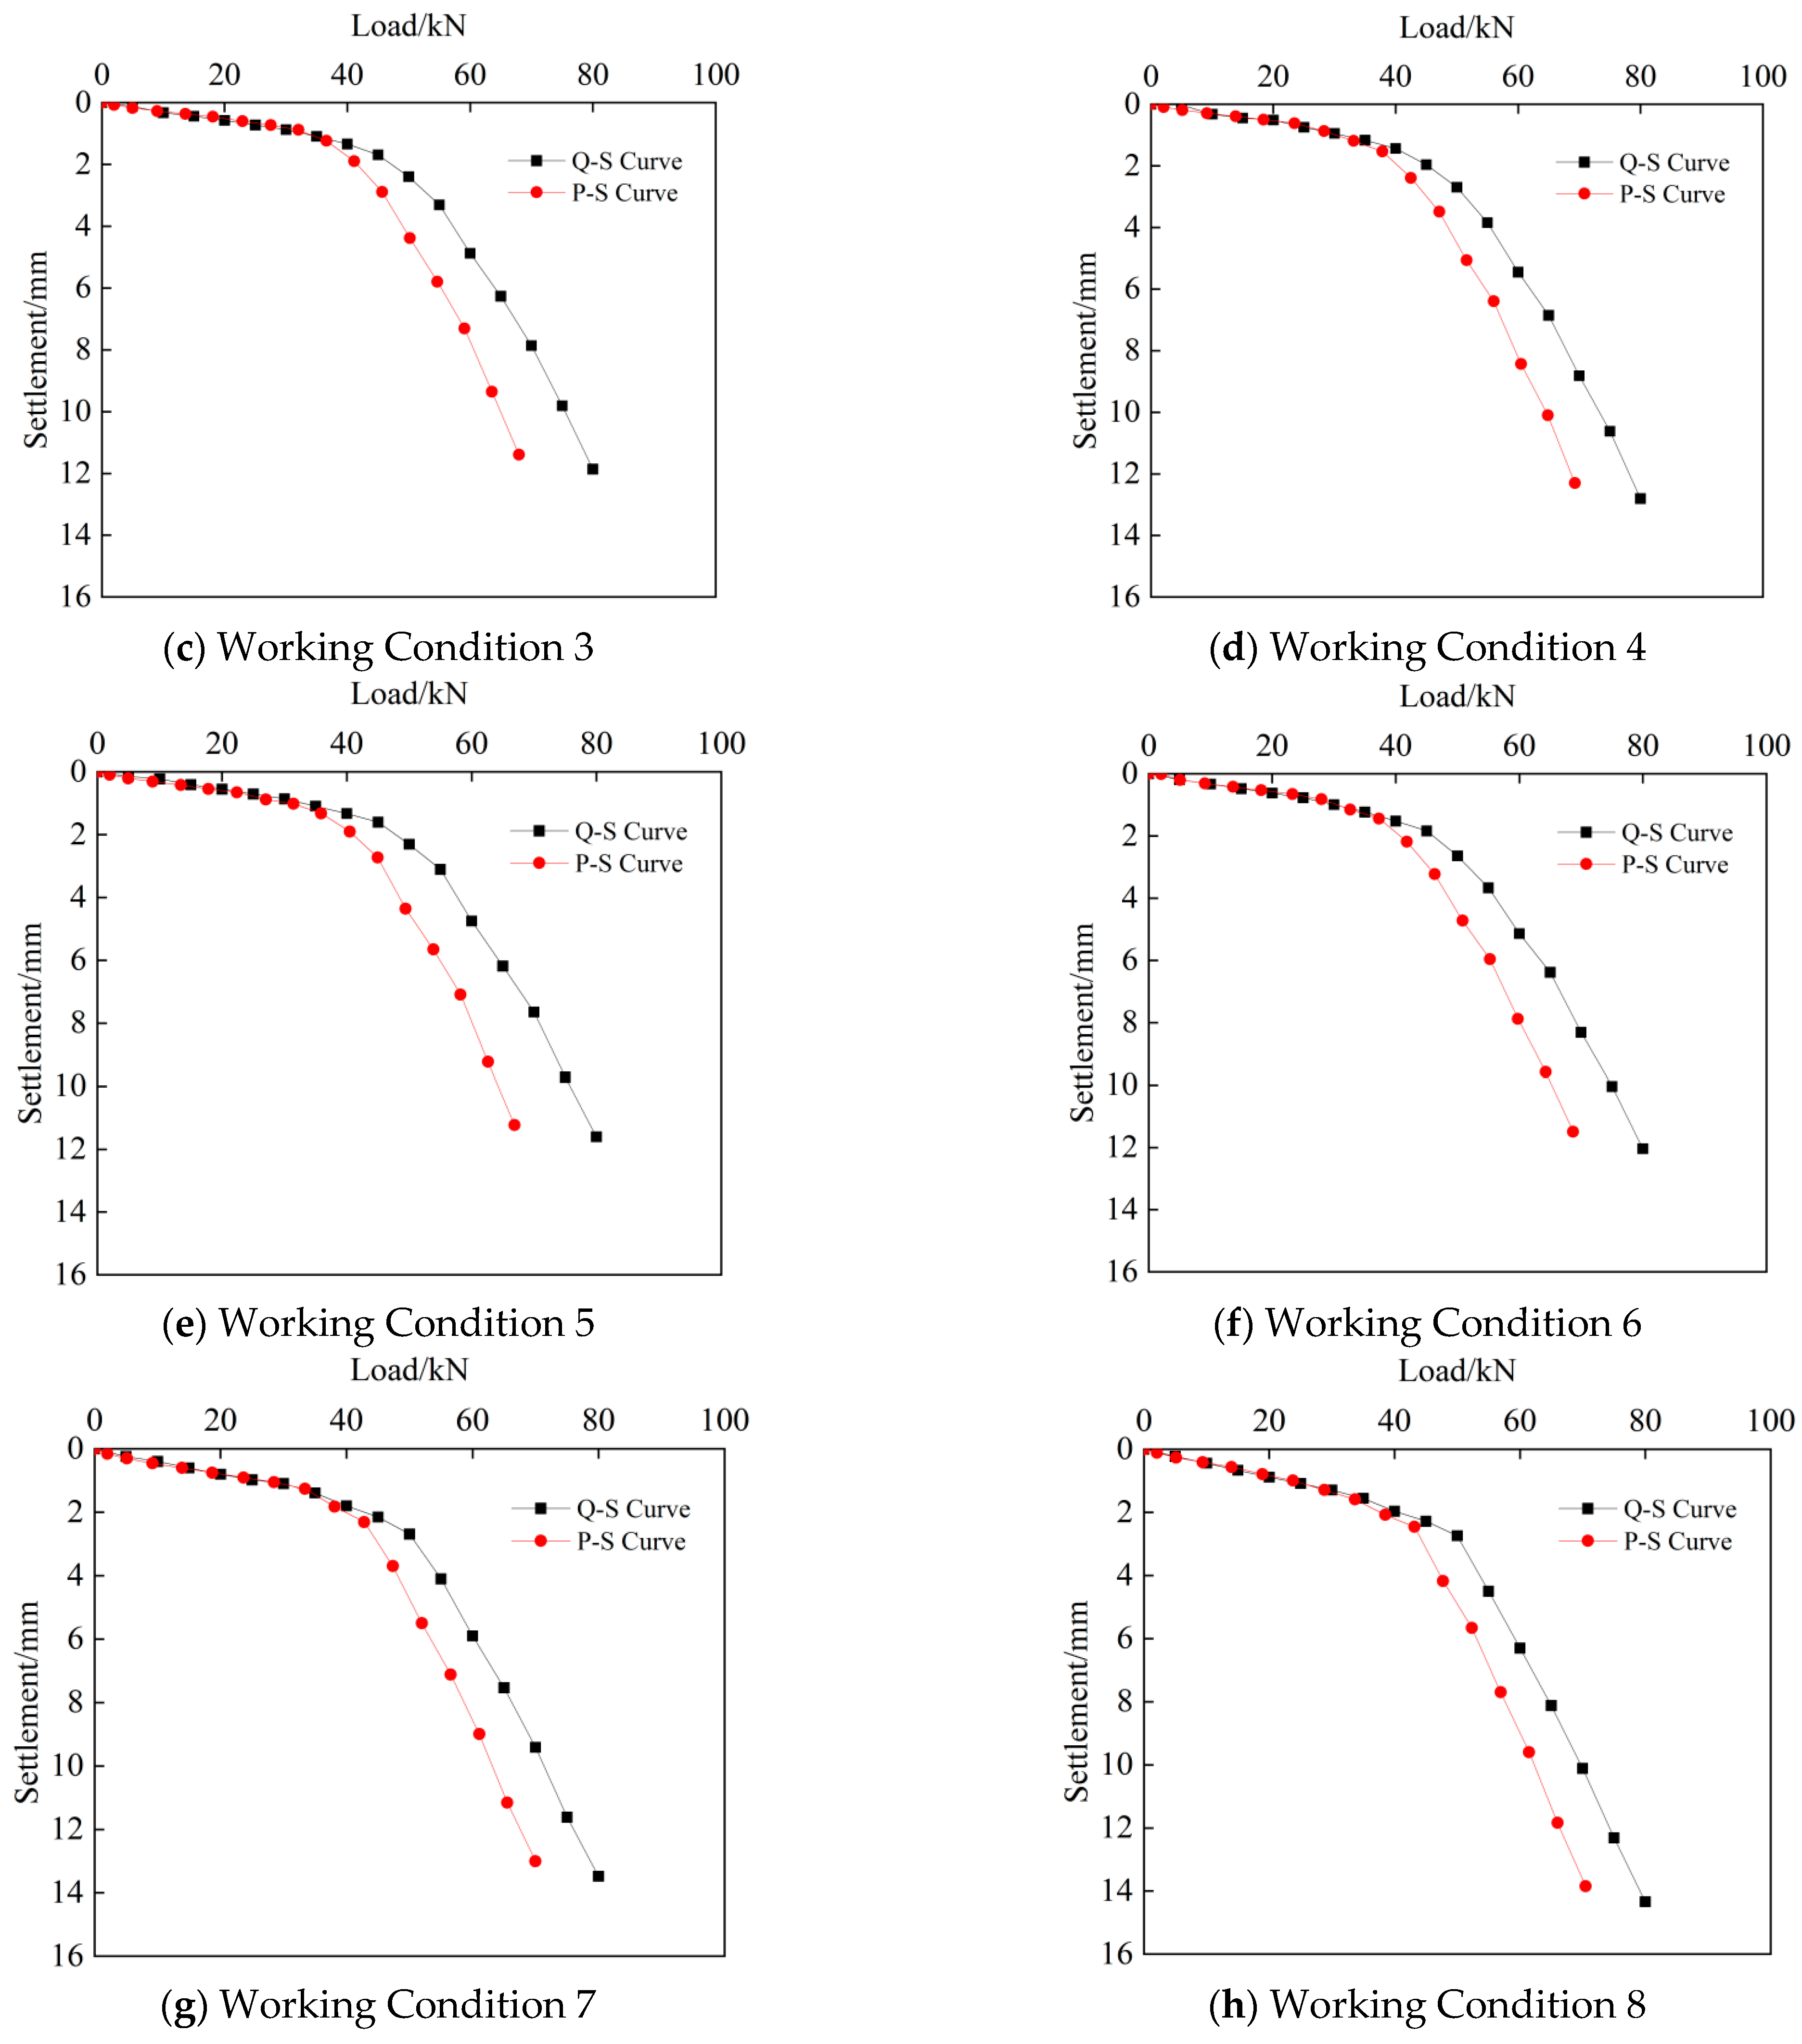
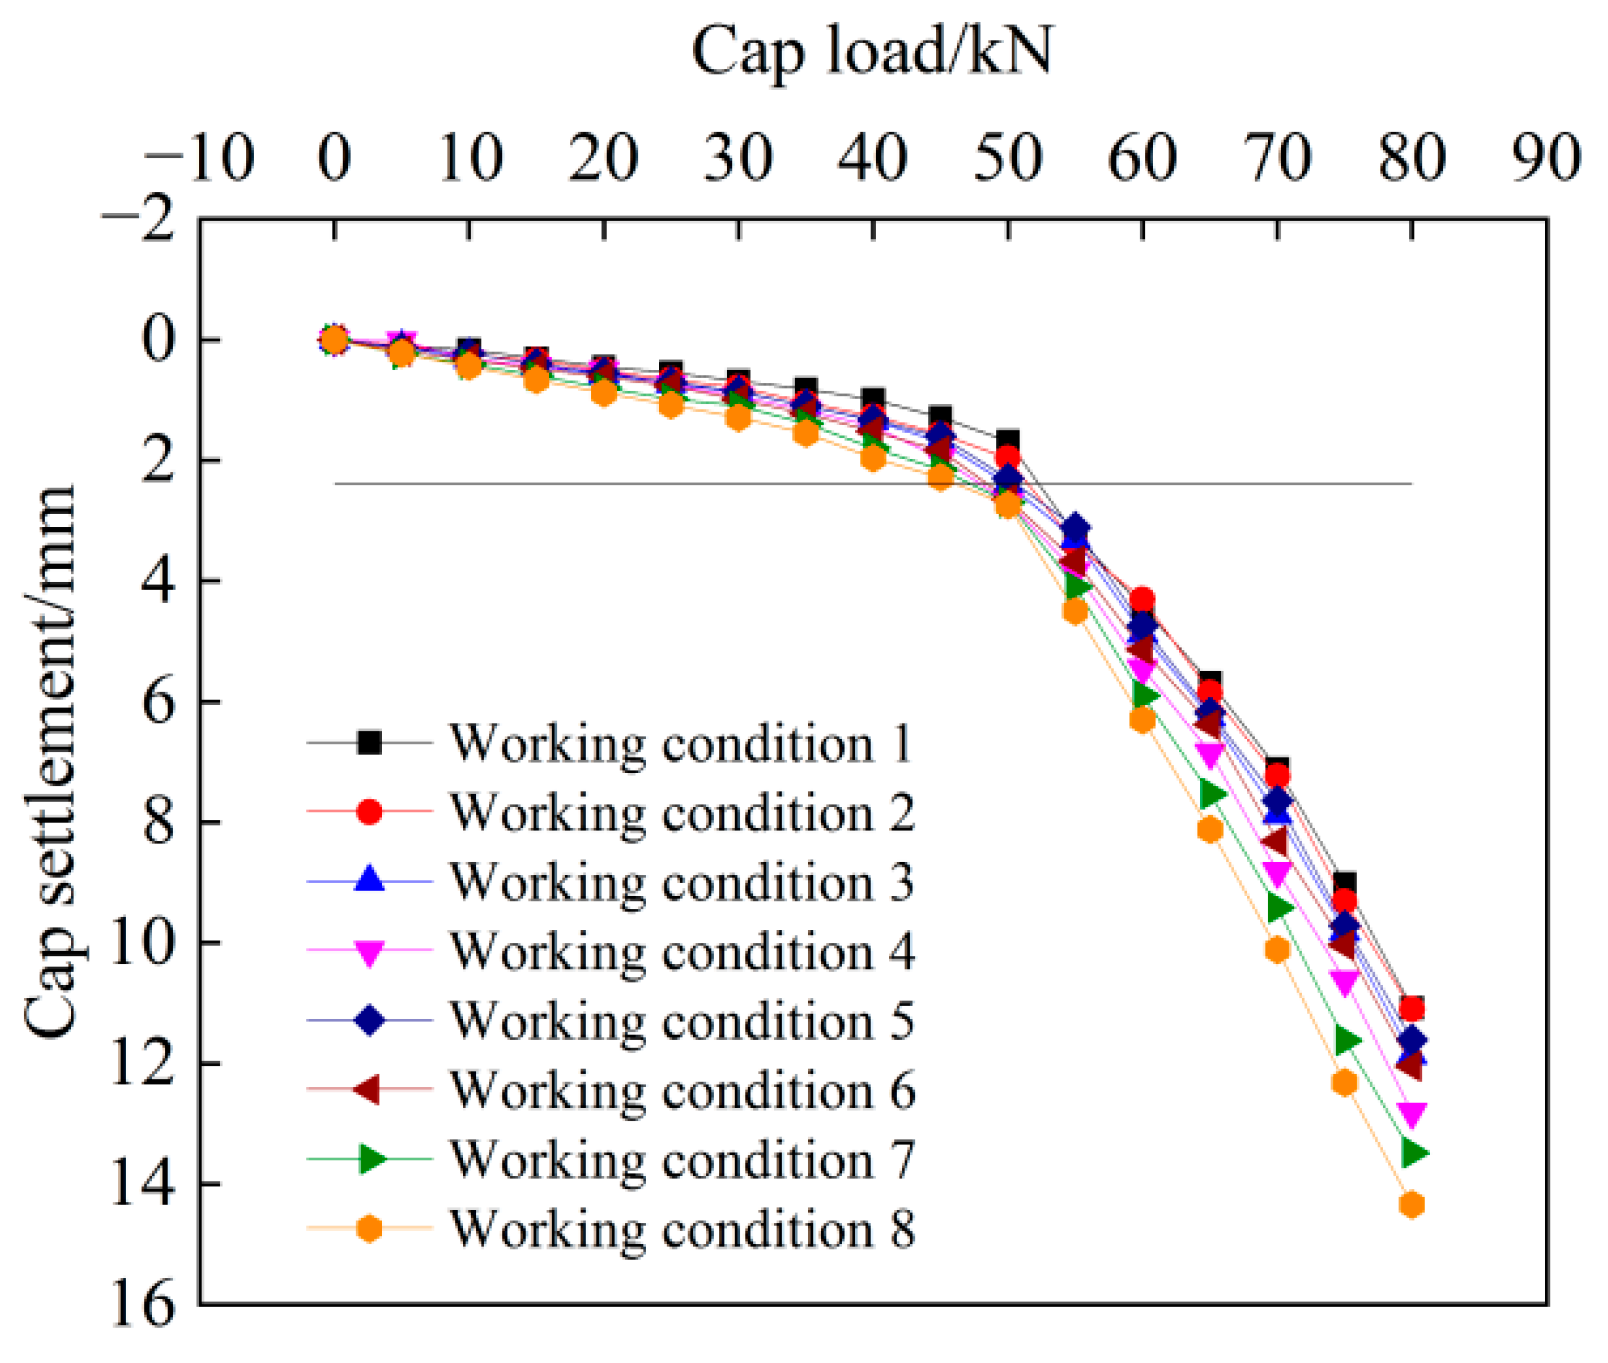
3.1. Vertical Bearing Capacity of Pile Groups
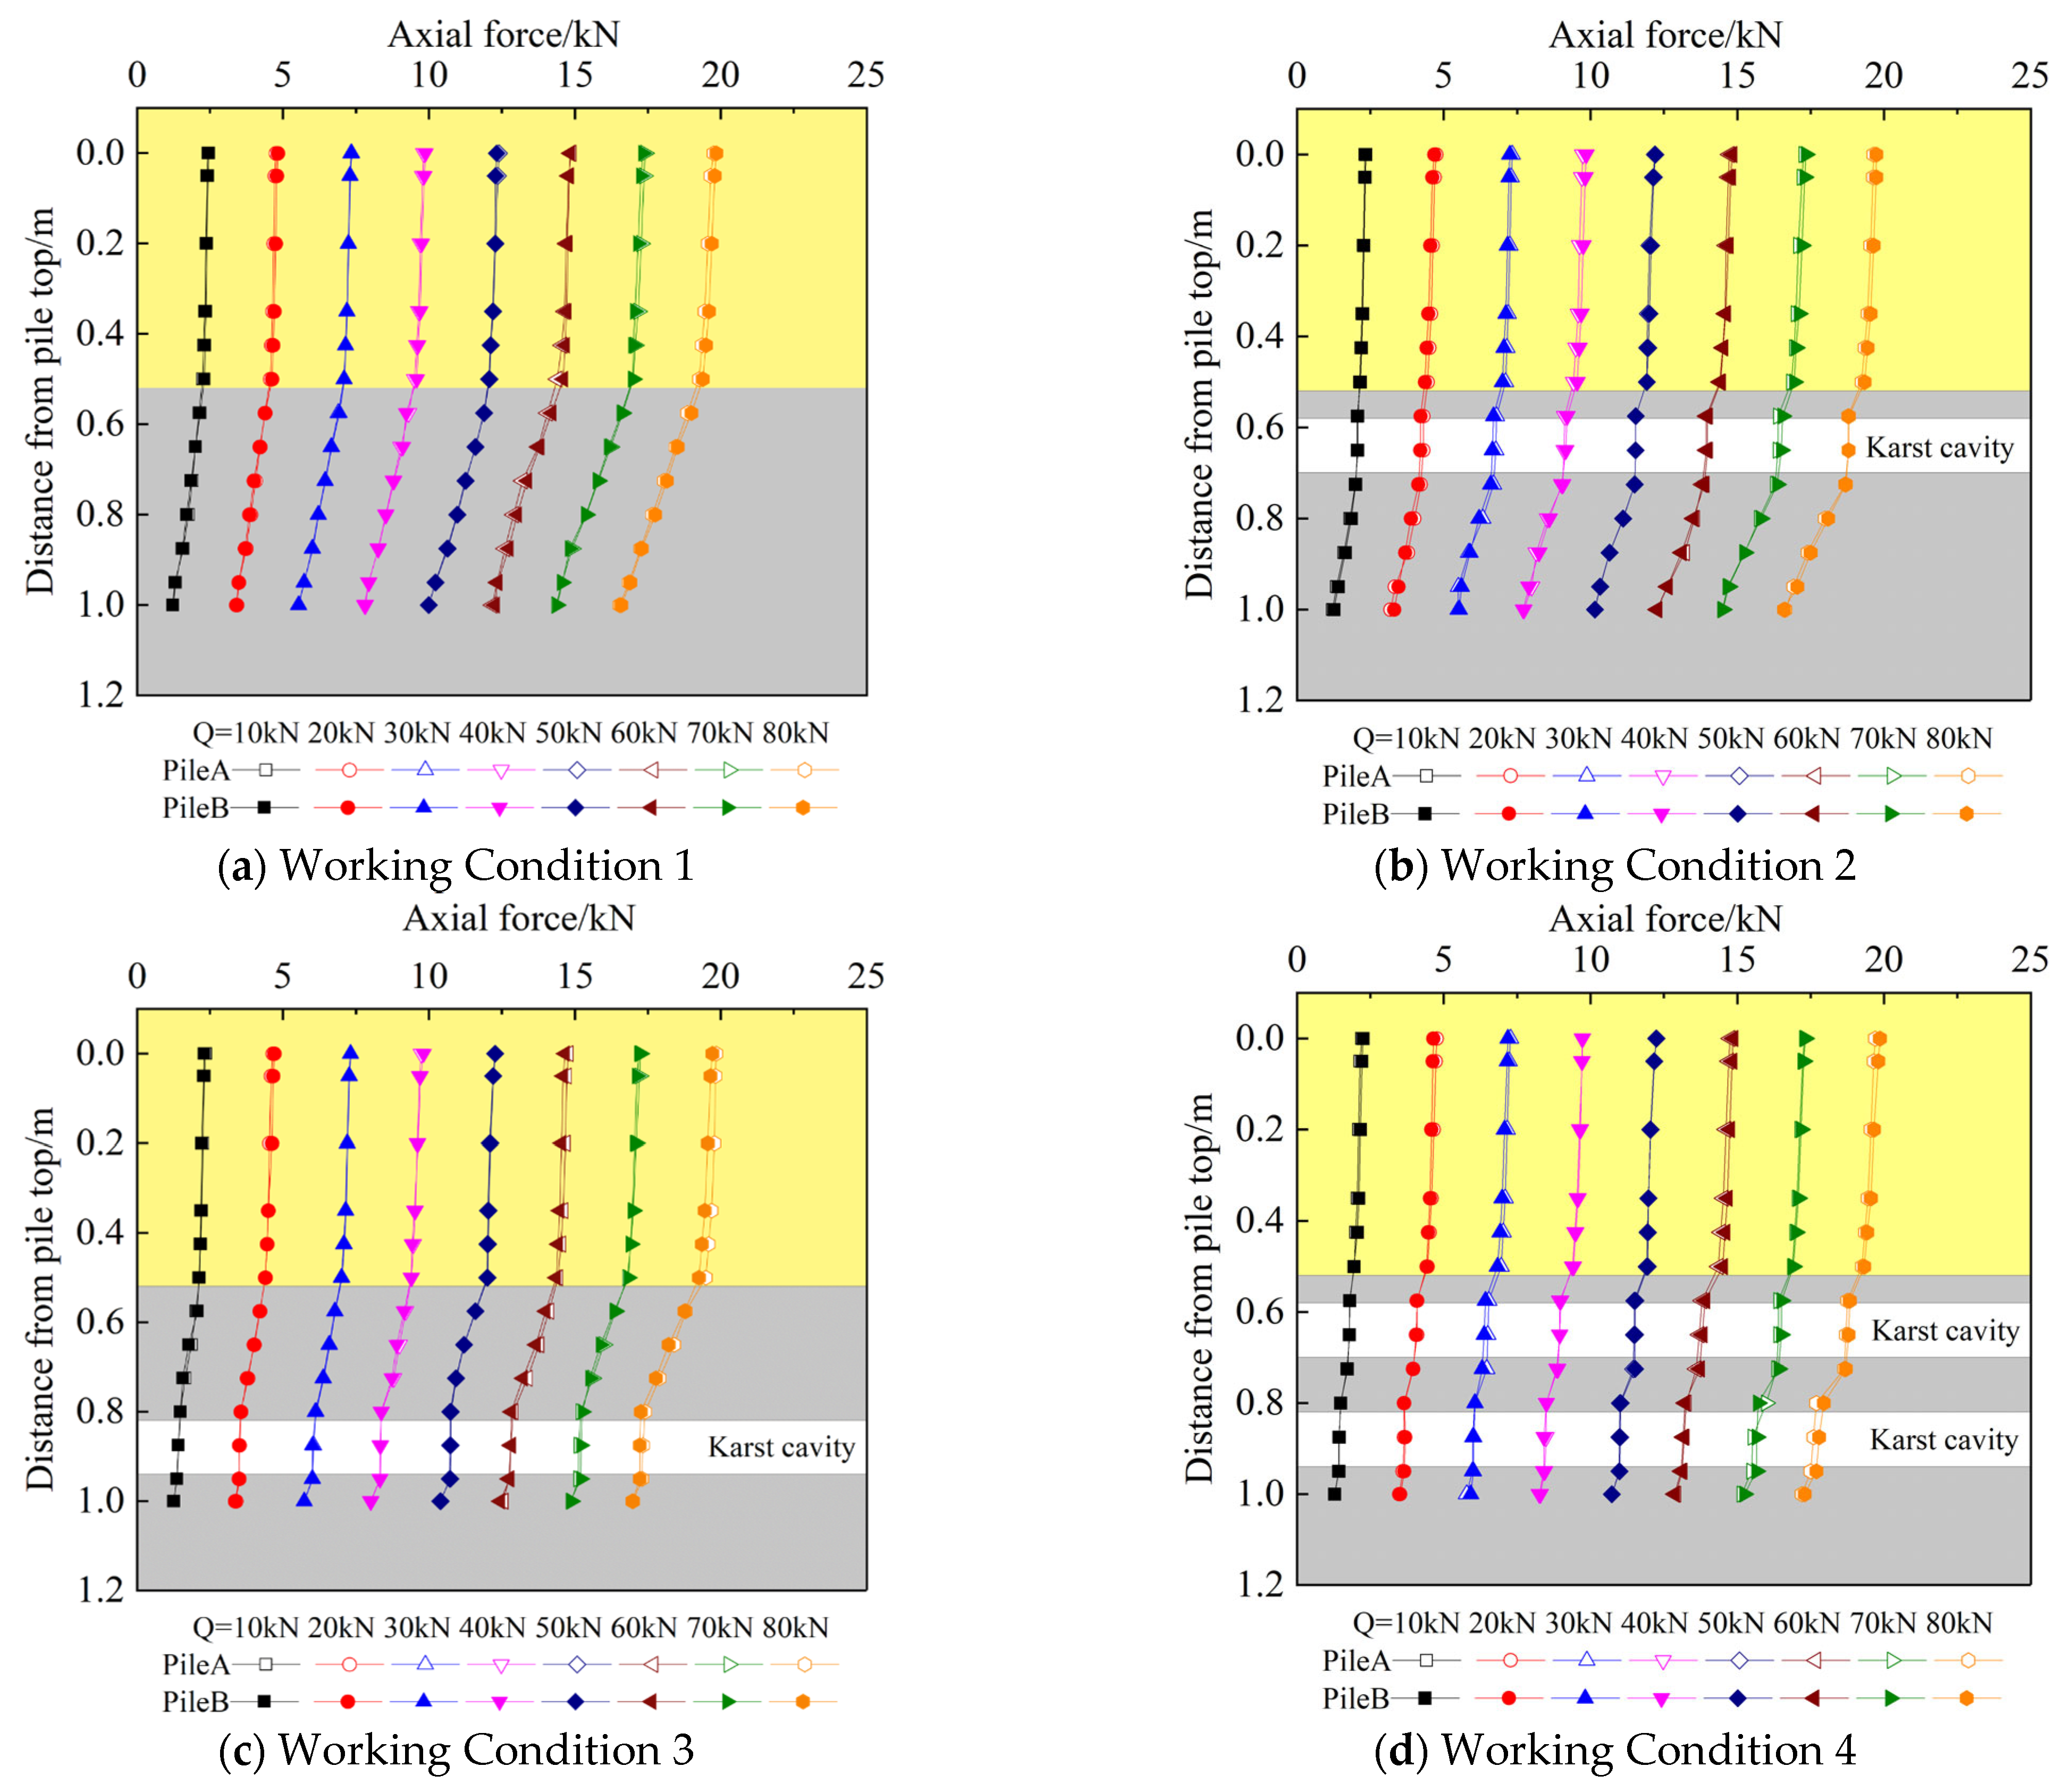
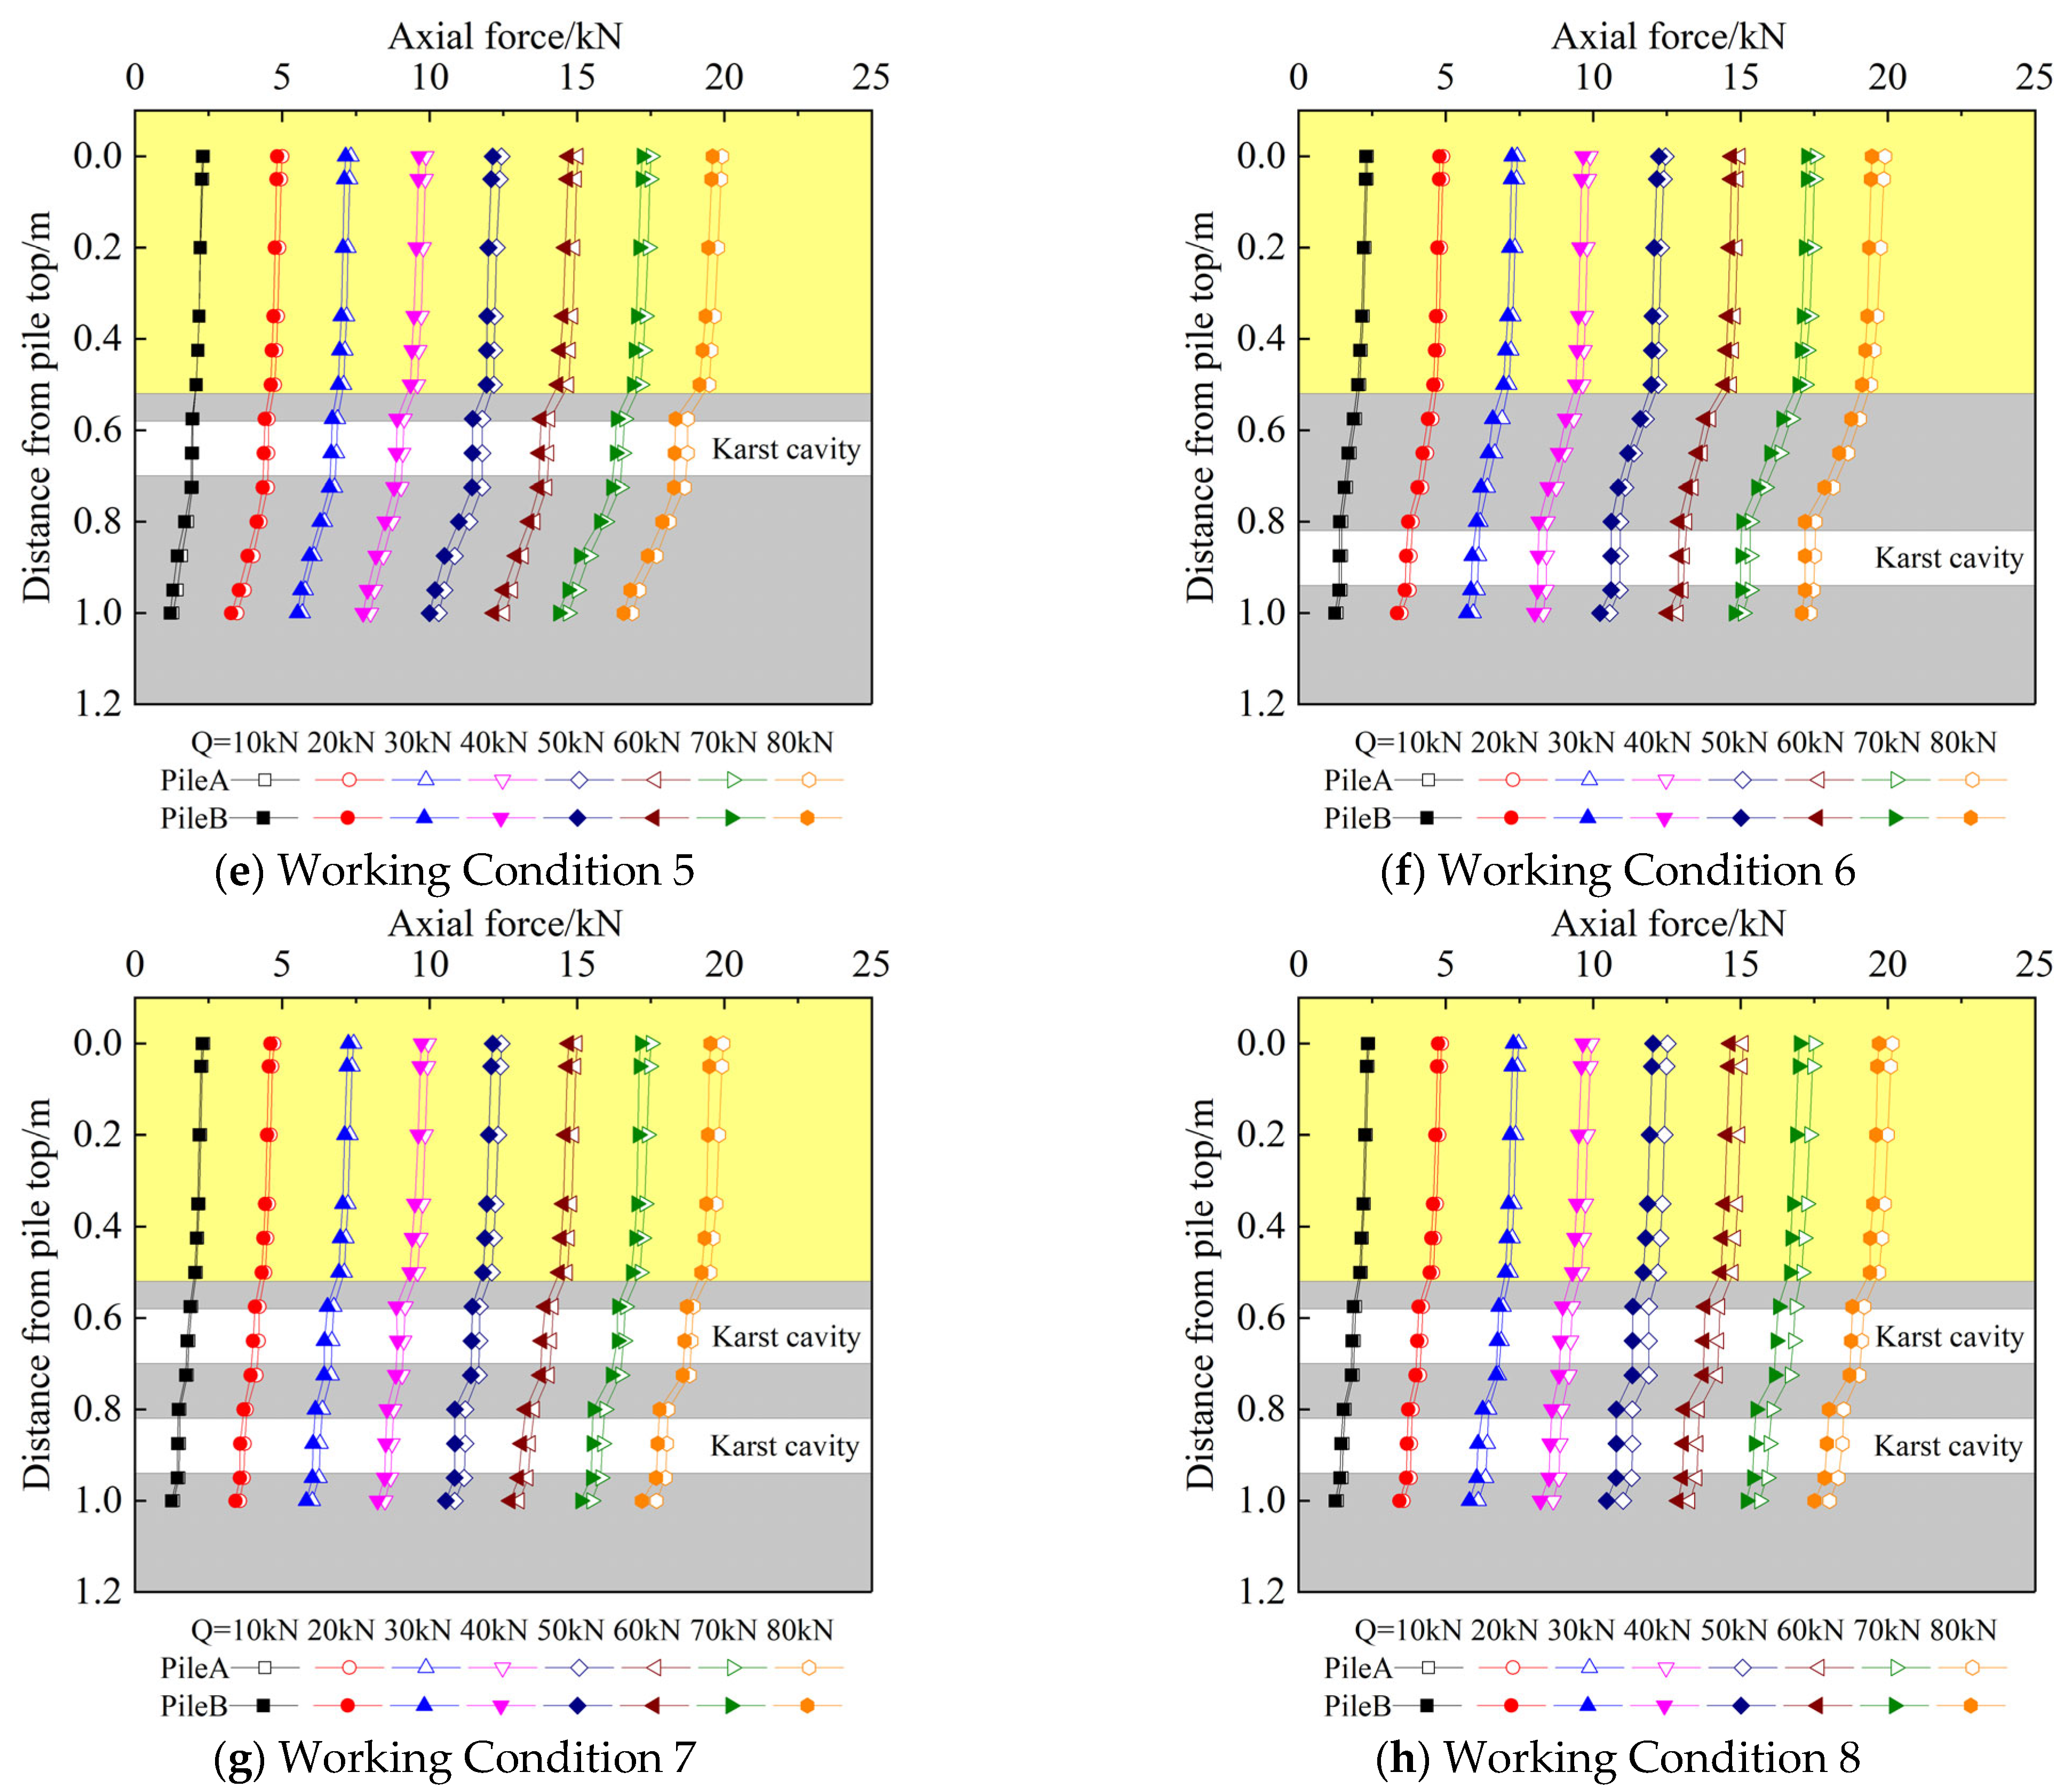
3.2. Axial Force Along the Pile Shaft
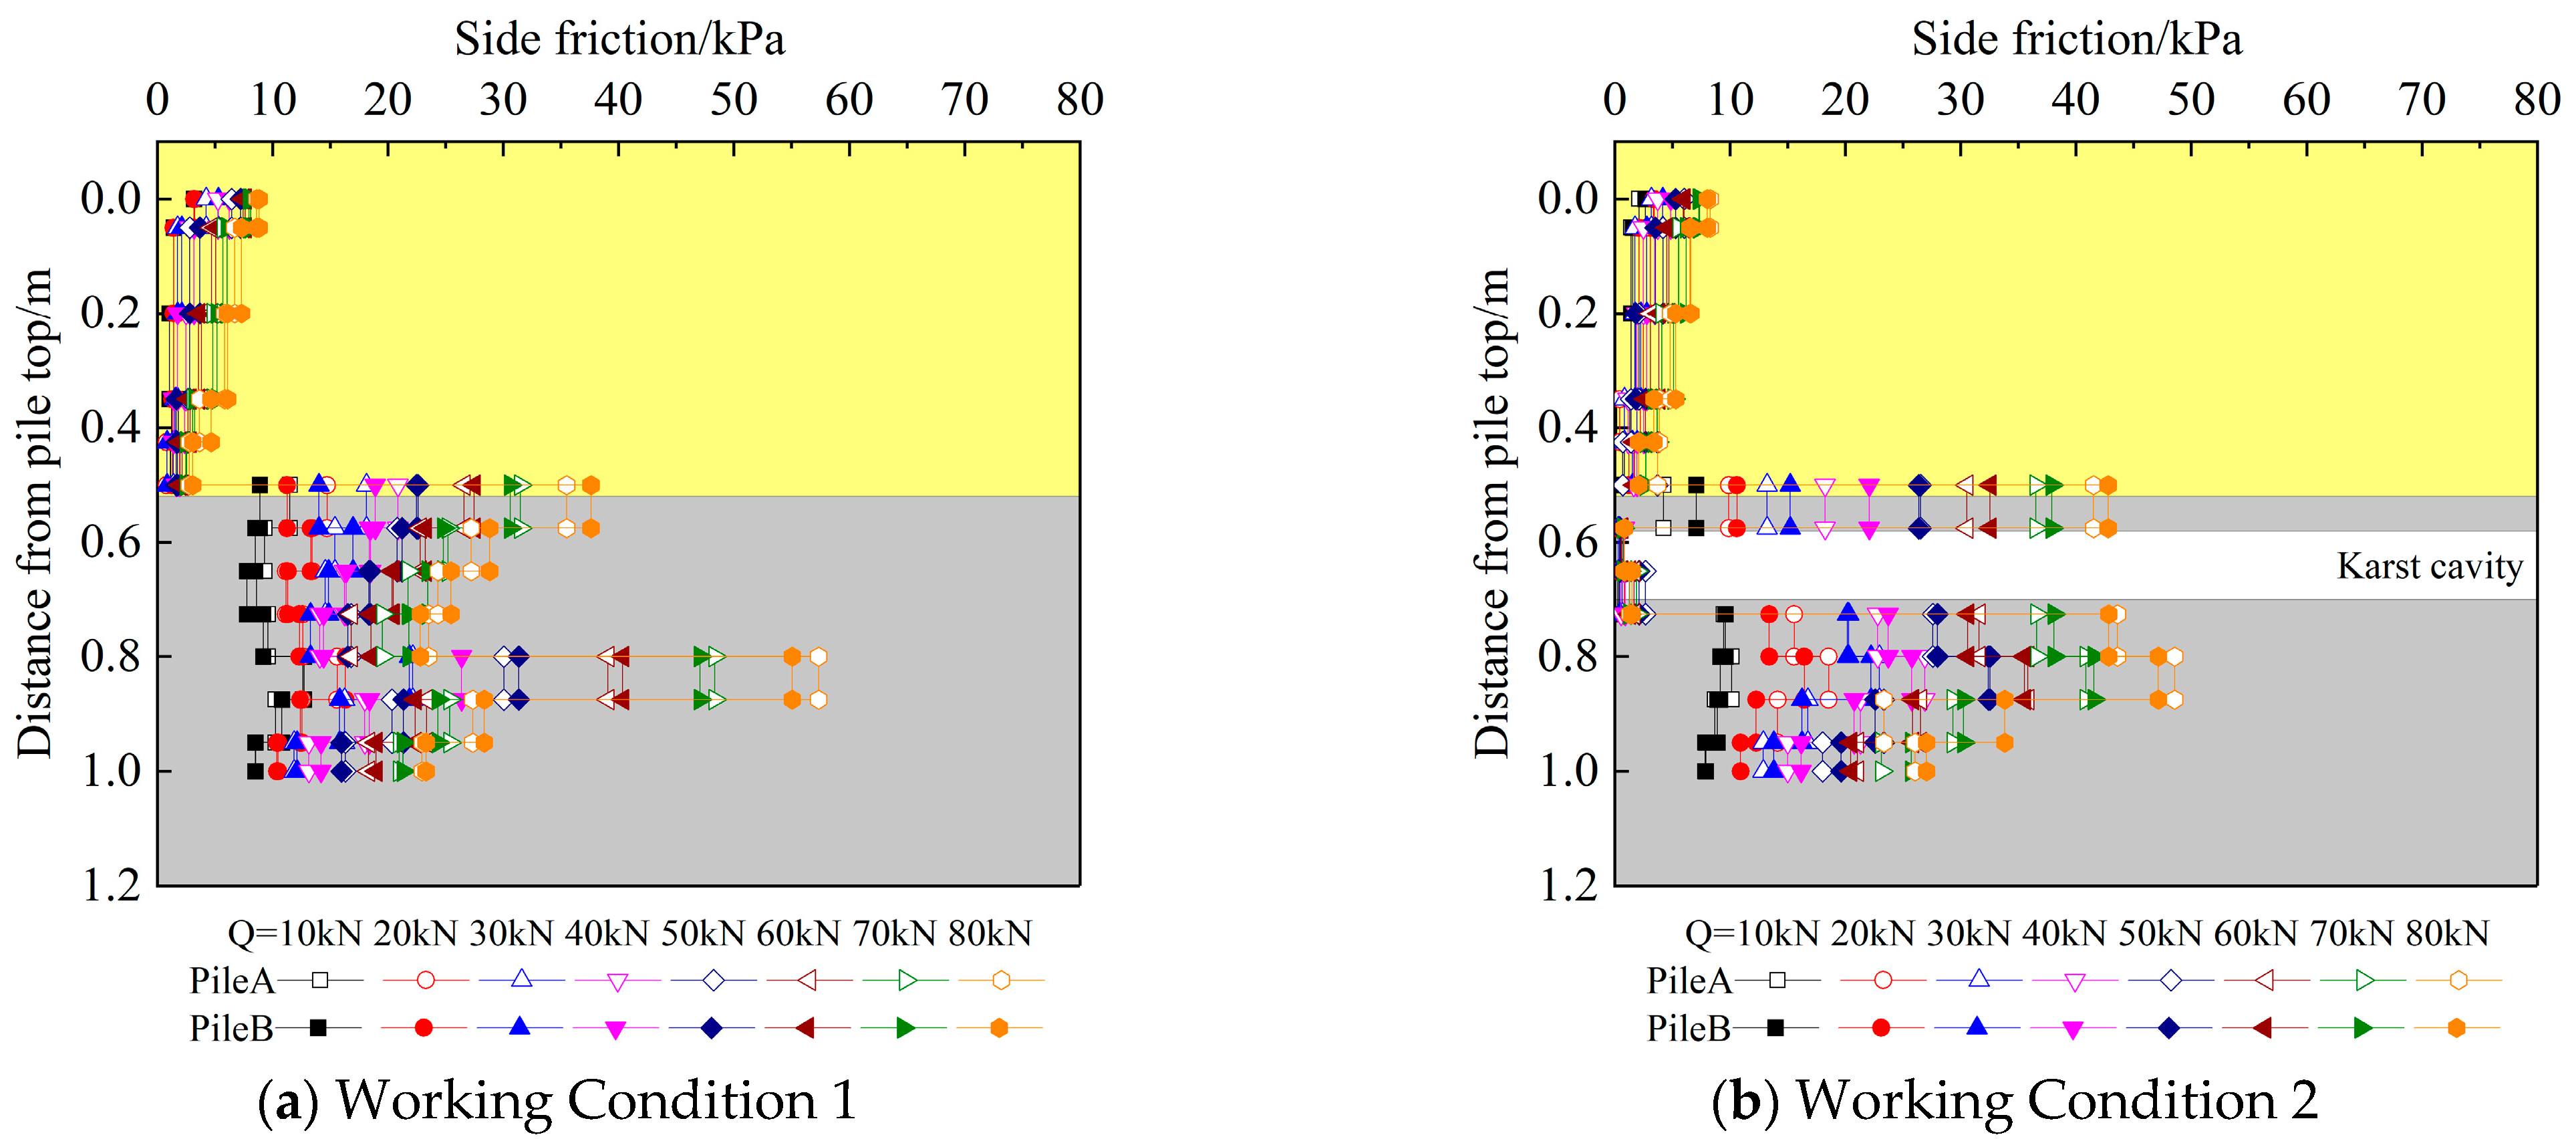
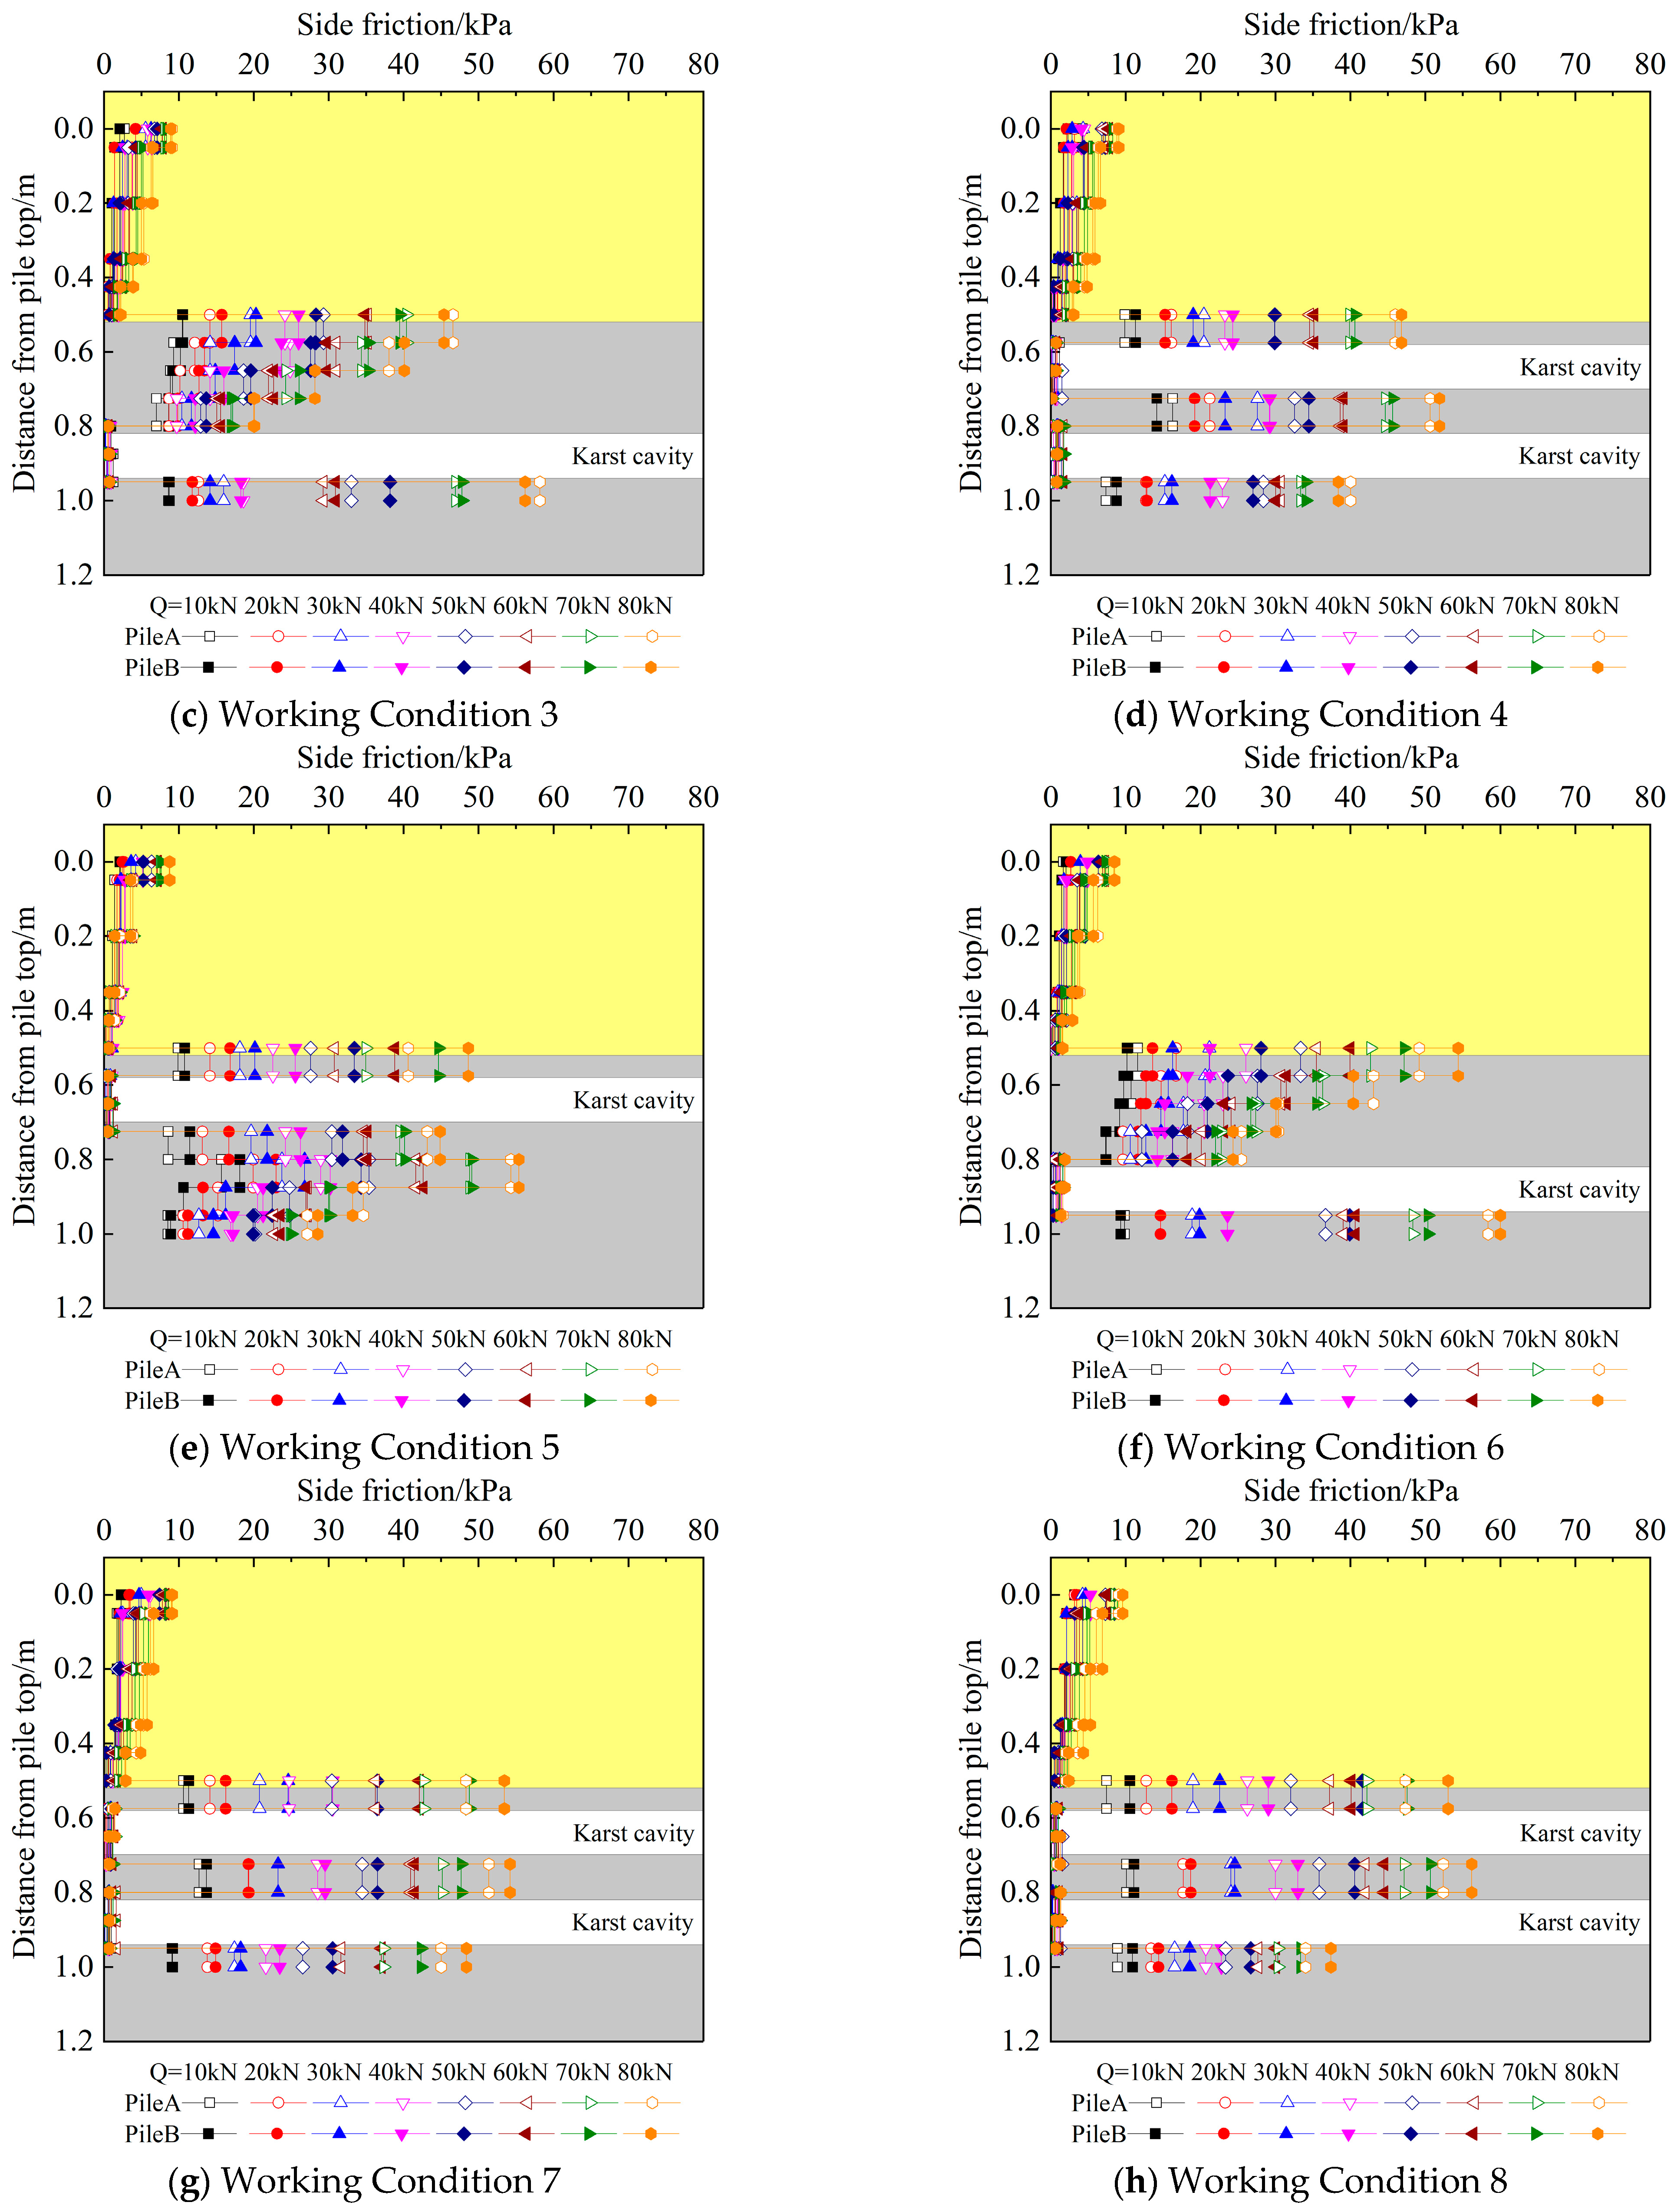
3.3. Side Friction Along the Pile Shaft
3.4. Variation in the Proportions of Pile End Resistance
4. Discussion
- (1)
- Conduct 3 × 3 or more pile group test studies and take into account parameters such as pile spacing and high (low) caps when designing the scheme to improve the engineering applicability of the results.
- (2)
- Use numerical simulation to establish a test scheme with the eccentricity of the underlying cave and the distance between the pile-side cave and the pile foundation as parameters, study the parameter mutation points of the cave effect, and supplement the conclusions of the model test in this paper.
- (3)
- It was determined that the influence of crossing caves is relatively large. In the future, a more in-depth comparative analysis of various parameters of crossing caves (cave height, cave type, and number of caves) will be carried out through numerical simulation and other means.
5. Conclusions
- (1)
- Due to the existence of underlying caves, the Q-S curves of pile groups are all steeply descending and show the characteristics of end-bearing piles. The influence of other caves is not obvious; the existence of beaded caves, lower through caves, underlying inclined caves, upper through caves, and pile-side caves will reduce the ultimate bearing capacity of pile groups.
- (2)
- When the pile body passes through the cave, the axial force changes slightly in the overburden layer, changes greatly in the limestone layer, and remains unchanged in the cave; under the same level of load, the axial force of piles close to the underlying inclined cave and the pile-side cave is smaller than that of piles farther away.
- (3)
- Under the same level of load, the lateral friction resistance of the pile foundation shows a decreasing trend in both the sand layer and the limestone layer. The friction resistance inside the sand layer is small. After entering the lime layer, the lateral friction resistance increases sharply. The lateral friction resistance is approximately 0 within the cave range. After passing through the cave, the lateral friction resistance increases sharply.
- (4)
- The underlying inclined cave and the pile-side cave do not affect the peak point position of the pile foundation. The existence of the through cave increases the peak point of the pile foundation at the exit of the cave. Under the same level of load, the side friction resistance of the pile close to the underlying inclined cave and the pile-side cave is greater than that of the pile farther away.
- (5)
- The existence of beaded caves, lower through caves, underlying inclined caves, upper through caves, and pile-side caves will increase the proportion of pile end resistance.
- (6)
- This study systematically analyzes the differences in the degree of influence of different types of caves (including through caves, underlying inclined caves, and pile-side caves) on the bearing characteristics of pile foundations under the condition of the existence of underlying caves. It is found that the beaded caves > lower through caves > underlying inclined caves > upper through caves > pile-side caves provide a priority decision basis for the optimal design of cave treatment schemes in engineering practice.
Author Contributions
Funding
Data Availability Statement
Conflicts of Interest
References
- Ma, J.; Guan, J.; Duan, J.; Huang, L.; Liang, Y. Stability analysis on tunnels with karst caves using the distinct lattice spring model. Undergr. Space 2021, 6, 469–481. [Google Scholar] [CrossRef]
- Han, G.; Zhang, H.; Wang, Z.; Wang, Y.; Geng, N.; Guo, P.; Li, X.; Zhao, Y.; Lin, H.; Wang, Y. Bearing behavior of rock socketed pile in limestone stratum embedded with a karst cavity beneath pile tip. Case Stud. Constr. Mater. 2023, 18, e02203. [Google Scholar] [CrossRef]
- Xia, C.; Shi, Z.; Kou, H.; Meng, S.; Liu, M. Sensitivity analyses of random cave groups on karst tunnel stability based on water–rock interaction using a novel contact dynamic method. Undergr. Space 2024, 18, 162–186. [Google Scholar] [CrossRef]
- Kong, G.-Q.; Cao, T.; Hao, Y.-H.; Zhou, Y.; Ren, L.-W. Thermomechanical properties of an energy micro pile-raft foundation in silty clay. Undergr. Space 2021, 6, 76–84. [Google Scholar] [CrossRef]
- Li, R.; Yin, Z.-Y.; He, S.-H. 3D reconstruction of arbitrary granular media utilizing vision foundation model. Appl. Soft Comput. 2025, 169, 112599. [Google Scholar] [CrossRef]
- Wang, K.; Cao, J.; Ye, J.; Qiu, Z.; Wang, X. Discrete element analysis of geosynthetic-reinforced pile-supported embankments. Constr. Build. Mater. 2024, 449, 138448. [Google Scholar] [CrossRef]
- Peng, Y.; Liu, H.; Li, C.; Ding, X.; Deng, X.; Wang, C. The detailed particle breakage around the pile in coral sand. Acta Geotech. 2021, 16, 1971–1981. [Google Scholar] [CrossRef]
- He, S.-H.; Yin, Z.-Y.; Ding, Z.; Li, R.-D. Particle morphology and principal stress direction dependent strength anisotropy through torsional shear testing. Can. Geotech. J. 2024, 62, 1–23. [Google Scholar] [CrossRef]
- Islam, M.R.; Turja, S.D.; Van Nguyen, D.; Forcellini, D.; Kim, D. Seismic soil-structure interaction in nuclear power plants: An extensive review. Results Eng. 2024, 23, 102694. [Google Scholar] [CrossRef]
- Wu, W.; Yang, Z.; Liu, X.; Zhang, Y.; Liu, H.; El Naggar, M.H.; Xu, M.; Mei, G. Horizontal dynamic response of pile in unsaturated soil considering its construction disturbance effect. Ocean Eng. 2022, 245, 110483. [Google Scholar] [CrossRef]
- Li, L.; Liu, X.; Liu, H.; Wu, W.; Lehane, B.M.; Jiang, G.; Xu, M. Experimental and numerical study on the static lateral performance of monopile and hybrid pile foundation. Ocean Eng. 2022, 255, 111461. [Google Scholar] [CrossRef]
- He, S.; Lai, J.; Li, Y.; Wang, K.; Wang, L.; Zhang, W. Pile group response induced by adjacent shield tunnelling in clay: Scale model test and numerical simulation. Tunn. Undergr. Space Technol. 2022, 120, 104039. [Google Scholar] [CrossRef]
- He, S.-H.; Yin, Z.-Y.; Ding, Z.; Sun, Y. The role of incremental stress ratio in mechanical behavior and particle breakage of calcareous sand. Acta Geotech. 2024, 20, 167–183. [Google Scholar] [CrossRef]
- Kong, G.; Fang, J.; Lv, Z.; Yang, Q. Effects of pile and soil properties on thermally induced mechanical responses of energy piles. Comput. Geotech. 2023, 154, 105176. [Google Scholar] [CrossRef]
- Liu, J.; Jin, Q.; Dong, Y.; Tian, L.; Wu, Z. Resilience-based seismic safety evaluation of pile-supported overhead transmission lines under depth-varying spatial ground motions. Reliab. Eng. Syst. Saf. 2025, 256, 110783. [Google Scholar] [CrossRef]
- Dai, G.; Kong, G.; Yan, Y.; Qu, X.; Yang, Q. Thermomechanical characteristics of a thermally inactive neighboring pile of an energy soldier pile during constraint changes. Tunn. Undergr. Space Technol. 2024, 154, 106112. [Google Scholar] [CrossRef]
- Jiang, C.; Liu, L.; Wu, J.-P. A new method determining safe thickness of karst cave roof under pile tip. J. Central South Univ. 2014, 21, 1190–1196. [Google Scholar] [CrossRef]
- Gu, Z.; Liu, Q.; Lu, Y.; Shi, Z.; Su, G.; Luan, D. Analysis and prevention of sinkhole collapses during the reconstruction and extension of Guang-Qing freeway, china. Environ. Earth Sci. 2016, 75, 1–7. [Google Scholar] [CrossRef]
- Feng, Z.; Hu, H.; Dong, Y.; Wang, F.; Jia, M.; Zhao, Y.; He, J. Effect of steel casing on vertical bearing characteristics of steel tube-reinforced concrete piles in loess area. Appl. Sci. 2019, 9, 2874. [Google Scholar] [CrossRef]
- Yacine, A.; Ridha, M.M.; Laid, H.M.; Abderahmane, B. Karst sinkholes stability assessment in Cheria Area, NE Algeria. Geotech. Geol. Eng. 2014, 32, 363–374. [Google Scholar] [CrossRef]
- He, Q.; Yu, Z.; Yue, W.; Tan, W.; Li, Z. Algorithm for vertical bearing capacity calculation of rock-socketed piles in karst area based on load transfer method. IOP Conf. Ser. Earth Environ. Sci. 2021, 719, 042073. [Google Scholar] [CrossRef]
- Gharsallaoui, H.; Jafari, M.; Holeyman, A. Pile end bearing capacity in rock mass using cavity expansion theory. J. Rock Mech. Geotech. Eng. 2020, 12, 1103–1111. [Google Scholar] [CrossRef]
- Gotman, N.Z.; Evdokimov, A.G. Calculation of Bridge-Support Pile Foundations Taking Karst Deformations Into Account in the Base. Soil Mech. Found. Eng. 2023, 60, 401–409. [Google Scholar] [CrossRef]
- Li, Z.; Lu, K.; Liu, W.; Wang, H.; Peng, P.; Xu, H. Bearing Capacity of Karst Cave Roof under Pile Foundation Load Using Limit Analysis. Appl. Sci. 2023, 13, 7053. [Google Scholar] [CrossRef]
- Wu, Y.; Huang, R.; Han, W. Stability evaluation method for karst cave roof based on fuzzy theory. In Proceedings of the International Conference on Transportation Engineering 2011, Chengdu, China, 23–25 July 2011; pp. 1792–1797. [Google Scholar]
- Feng, Z.; Chen, H.; Xia, C.; Li, S.; Cai, J.; He, J. Prediction of bearing capacity of pile foundation in karst area based on model of metabolic GM (1,1). IOP Conf. Ser. Earth Environ. Sci. 2018, 189, 042012. [Google Scholar] [CrossRef]
- He, J.; Feng, Z.; Dong, Y.; Chen, H.; Huang, Z. Grey theory study on the influence of karst-pile-soil coupling on the ultimate bearing capacity of pile foundation in karst development area. IOP Conf. Ser. Earth Environ. Sci. 2019, 218, 012025. [Google Scholar] [CrossRef]
- Feng, Z.; Guo, S.; He, J.; Dong, Y.; Huang, Z. Study on the Influence of Karst Size on the Vertical Bearing Capacity of Pile Foundation. In Proceedings of the 2019 2nd International Symposium on Traffic Transportation and Civil Architecture (ISTTCA 2019) (VOL.1), Chengdu, China, 13–15 December 2019; p. 6. [Google Scholar]
- Chen, H.Y.; Feng, Z.J.; Li, T.; Bai, S.F.; Zhang, C. Study on the vertical bearing performance of pile across cave and sensitivity of three parameters. Sci. Rep. 2021, 11, 1–14. [Google Scholar] [CrossRef]
- Wang, P.; Ding, H.; Zhang, P. Influence of Karst Caves at Pile Side on the Bearing Capacity of Super-Long Pile Foundation. Math. Probl. Eng. 2020, 2020, 1–13. [Google Scholar] [CrossRef]
- Olmeda, J.L.B.; Robles, J.M.; Pérez, E.S.; Marañón, C.O. Influence of natural cavities on the design of shallow foundations. Appl. Sci. 2020, 10, 1119. [Google Scholar] [CrossRef]
- Chen, H.; Feng, Z.; Wu, M.; Zhou, G.; Chen, L.; Zhang, C. Study on the vertical bearing performances of piles on karst cave. Sci. Rep. 2023, 13, 1–12. [Google Scholar] [CrossRef]
- Sheng, M.; Lu, F.; Jiang, N.; Guo, P.; Li, X.; An, R.; Wang, Y. Bearing behavior of pile foundation in karst region: Physical model test and finite element analysis. Appl. Rheol. 2024, 34, 20230115. [Google Scholar] [CrossRef]
- Li, L.; He, M.; Wang, A. Research on the Bearing Characteristics of Pile Groups Passing Through Bead Shaped Karst Areas. J. Chongqing Jiaotong Univ. (Nat. Sci.) 2024, 44, 1–8. (In Chinese) [Google Scholar]
- DBJ/T 15-60-2019; Code for Testing of Building Foundation. China Architecture & Building Press: Beijing, China, 2019.
- Shi, P. Pile Foundation Engineering Manual; People’s Communications Press: Beijing, China, 2015. [Google Scholar]
- Lei, Y.; Li, P.; Liu, Z.; Li, J.; Hu, W.; Chen, L.; Liu, Y. Experimental study on ultimate bearing capacity and failure mode of pile foundation crossing karst cave in karst areas. Chin. J. Appl. Mech. 2023, 40, 1343–1353. [Google Scholar]
- Zhang, Q.; Qiao, S.; Xing, Y.; Zhang, K.; Cui, W.; Wang, Z.; Chen, D. Study on Bearing Characteristics of Single Pile Crossing Unfilled Karst Cave. J. Hunan Univ. (Nat. Sci.) 2022, 49, 186–196. [Google Scholar]


| Physical Quantity | Similarity Ratio | Physical Quantity | Similarity Ratio |
|---|---|---|---|
| Length | 20 | Cohesion | 26 |
| Unit weight | 1.3 | Elastic modulus | 26 |
| Internal friction angle | 1 | Strain | 1 |
| Friction coefficient | 1 | Poisson’s ratio | 1 |
| Compressive strength | 26 | Compressive strength | 26 |
| Length (m) | Diameter (m) | Density (kg.m−3) | Elastic Modulus (E/GPa) | Poisson’s Ratio | |
|---|---|---|---|---|---|
| Model pile | 1 | 0.06 | 2.8 | 40 | 0.25–0.30 |
| Cohesion (Kpa) | Internal Friction Angle (°) | Poisson’s Ratio | Density (kg.m−3) | Elastic Modulus (MPa) | |
|---|---|---|---|---|---|
| Overlying sand layer | 1.2 | 26 | 0.25 | 1.8 | 28 |
| Limestone layer | 1.5 | 29 | 0.25 | 1.95 | 15,000 |
| Front View |  |  | 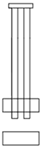 | 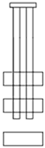 |
| Top View |  |  |  |  |
| a. Working Condition 1 | b. Working Condition 2 | c. Working Condition 3 | d. Working Condition 4 | |
| Front View |  | 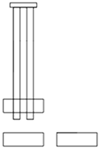 | 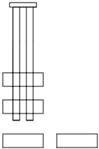 | 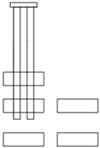 |
| Top View |  |  |  |  |
| e. Working Condition 5 | f. Working Condition 6 | g. Working Condition 7 | h. Working Condition 8 |
Disclaimer/Publisher’s Note: The statements, opinions and data contained in all publications are solely those of the individual author(s) and contributor(s) and not of MDPI and/or the editor(s). MDPI and/or the editor(s) disclaim responsibility for any injury to people or property resulting from any ideas, methods, instructions or products referred to in the content. |
© 2025 by the authors. Licensee MDPI, Basel, Switzerland. This article is an open access article distributed under the terms and conditions of the Creative Commons Attribution (CC BY) license (https://creativecommons.org/licenses/by/4.0/).
Share and Cite
Wang, X.; Tian, Y.; Hu, H.; Liu, C.; Chen, H.; Hong, J. Experimental Study on the Vertical Bearing Characteristic Model of Pile Groups in Complex Interactive Karst Pile Foundations. Buildings 2025, 15, 1772. https://doi.org/10.3390/buildings15111772
Wang X, Tian Y, Hu H, Liu C, Chen H, Hong J. Experimental Study on the Vertical Bearing Characteristic Model of Pile Groups in Complex Interactive Karst Pile Foundations. Buildings. 2025; 15(11):1772. https://doi.org/10.3390/buildings15111772
Chicago/Turabian StyleWang, Xinquan, Yongle Tian, Haibo Hu, Chen Liu, Haitao Chen, and Jun Hong. 2025. "Experimental Study on the Vertical Bearing Characteristic Model of Pile Groups in Complex Interactive Karst Pile Foundations" Buildings 15, no. 11: 1772. https://doi.org/10.3390/buildings15111772
APA StyleWang, X., Tian, Y., Hu, H., Liu, C., Chen, H., & Hong, J. (2025). Experimental Study on the Vertical Bearing Characteristic Model of Pile Groups in Complex Interactive Karst Pile Foundations. Buildings, 15(11), 1772. https://doi.org/10.3390/buildings15111772