Article

Impact of an Aged Green Roof on Stormwater Quality and First-Flush Dynamics

by
Thiago Masaharu Osawa
1,*,
Maria Cristina Santana Pereira
2,
Brenda Chaves Coelho Leite
3 and
José Rodolfo Scarati Martins
1
1
Department of Hydraulic and Environmental Engineering, University of Sao Paulo, Professor Almeida Prado Ave., 83 Jardim Universidade, Sao Paulo 05508-070, SP, Brazil
2
Institute of Advanced Studies, University of Sao Paulo, Professor Almeida Prado Ave., 83 Jardim Universidade, Sao Paulo 05508-070, SP, Brazil
3
Department of Civil Construction Engineering, University of Sao Paulo, Professor Almeida Prado Ave., 83 Jardim Universidade, Sao Paulo 05508-070, SP, Brazil
*
Author to whom correspondence should be addressed.
Buildings 2025, 15(11), 1763; https://doi.org/10.3390/buildings15111763
Submission received: 15 April 2025 / Revised: 9 May 2025 / Accepted: 15 May 2025 / Published: 22 May 2025
(This article belongs to the Special Issue Urban Building and Green Stormwater Infrastructure)

Abstract

Green roofs (GRs) are increasingly implemented for stormwater management, and retrofitting conventional roofs is emerging as a key strategy for climate change resilience. However, their impact on diffuse pollution, particularly regarding total organic carbon (TOC) and pollutant mass transport, remains insufficiently understood, especially in aged substrates. This study evaluated and compared the runoff quality from aged GRs and ceramic roofs (CRs) by analyzing TOC, pH, electrical conductivity (EC), first-flush occurrence and intensity, and pollutant release patterns. Results showed that GR retrofitting could help mitigate acid-rain effects due to its elevated pH. Despite higher TOC and EC concentrations in runoff, GRs remained within acceptable water quality limits and exhibited a more gradual release of organic matter over time compared with CRs. Statistical analysis revealed that pollutant concentrations in CR runoff followed Lognormal and Weibull distributions, while GR runoff was best described by Normal, Lognormal, and Weibull distributions. These findings reinforce GRs as a viable stormwater management strategy but highlight the need for full runoff treatment when used for rainwater harvesting. The results also emphasize the importance of tailored statistical models to enhance runoff predictions and optimize GR performance in urban water management. The results provide valuable insights for urban planners and policymakers by reinforcing the potential of GRs in stormwater quality management and supporting the development of incentives for green infrastructure. Future research should expand to different GR configurations, climates, and maintenance practices to enhance the understanding of long-term hydrological and water quality performance.

1. Introduction

Rapid urbanization combined with the expansion of impervious surfaces in urban areas is severely disrupting the natural water cycle, degrading water quality, and exacerbating the impact of climate change [1,2]. The increase in surface runoff promotes the rise in discharge of significant pollutant loads to receiving water bodies [3]. In response, green–blue infrastructure has emerged as an effective solution, offering various social and environmental benefits that support urban adaptation to these inevitable changes. Among green–blue infrastructure options, green roofs (GRs) stand out due to their ability to mitigate extreme weather, as rooftops may constitute 40–50% of impervious surfaces in cities [4]. Furthermore, GRs can be implemented in both new and existing buildings, making them a viable option for new construction and urban retrofitting.
GRs comprise multiple layers, including a drainage layer, engineered growth media, and vegetation, which collectively enhance stormwater retention and detention, reduce flood risks, and support the restoration of the natural water cycle [5]. Beyond hydrological benefits, they contribute to urban sustainability by improving air quality, mitigating the urban heat island effect, and enhancing energy efficiency [6]. However, despite these advantages, concerns have arisen regarding the leaching of organic matter from GR substrates. Organic matter, particularly in its dissolved form, is highly mobile and can interact with nutrients and heavy metals [7]. Excessive organic matter concentrations in runoff can deplete dissolved oxygen in water bodies, negatively impacting aquatic ecosystems and increasing the complexity of water treatment due to higher coagulant demand and the formation of disinfection byproducts, such as trihalomethanes [8].
Despite its environmental relevance, the role of total organic carbon (TOC) in GR runoff remains underexplored, particularly in long-term studies. TOC offers several advantages over traditional indicators, such as biochemical oxygen demand and chemical oxygen demand, including faster results, minimal interference from non-detectable substances, and the avoidance of toxic byproducts that can arise from chemical oxygen demand analysis. Additionally, TOC provides high accuracy and repeatability, making it a valuable tool for consistent water quality assessment [9]. Reflecting global water monitoring trends, CETESB (São Paulo State Environmental Company) recently adopted TOC as a regulatory parameter for assessing surface water quality in São Paulo [10]. However, few studies have assessed TOC in GR runoff, and even fewer have examined aged systems, where substrate composition and leaching behavior may change over time [11,12].
Existing literature has focused on newly installed commercial substrates, often overlooking the effects of aging. For instance, ref. [13] reported high TOC concentrations of 239.7 mg/L in runoff from new substrates, while much lower levels (6.65 mg/L) were found in natural soil substrates, likely due to lower organic content and the absence of fertilization. Over time, TOC concentrations tend to decline due to leaching processes, as observed by [14], who reported decreasing TOC levels over a nine-month period. Rainfall-induced leaching primarily mobilizes dissolved organic carbon from the substrate [15], and prolonged exposure to runoff can reduce organic matter content, leading to lower TOC levels [16]. However, some studies suggest that TOC may increase in older GRs due to organic matter accumulation in the substrate [11]. These contrasting findings highlight the need for long-term monitoring to better understand the mechanisms governing TOC dynamics in GR runoff.
The management of organic matter in GR runoff is crucial to minimizing stormwater contamination and facilitating water reuse. First-flush diversion—a common practice in rainwater harvesting—separates the initial, more polluted runoff from later flows, enhancing treatment efficiency [17]. Although well-documented for impermeable surfaces, the occurrence of first flush in GRs remains insufficiently studied, especially in relation to organic pollutants. Prior studies have primarily relied on concentration-based methods, which may overlook total pollutant loads [14,18,19,20]. As highlighted by [21], evaluating pollutant mass is essential for accurately characterizing runoff dynamics and optimizing treatment strategies. Notably, most available studies are over a decade old, underscoring the need for updated research that reflects current regulatory priorities and the behavior of maturing GR systems.
Despite growing recognition of the complex dynamics governing pollutant release in green–blue infrastructure systems, current predictive models remain inadequate for accurately representing the specific behaviors of GRs, especially under variable rainfall conditions. Conventional wash-off and pollutant transport models often rely on generalized parameter values that fail to capture the nuanced mobilization mechanisms unique to GR systems. The first-flush effect, in particular, is notoriously difficult to generalize due to its dependency on multiple, interacting factors [22]. In this context, probabilistic modeling emerges as a promising alternative by explicitly accounting for the stochastic nature of pollutant behavior [23,24]. Probabilistic characterization of key parameters can enhance model transferability, improve predictive performance, and support robust uncertainty quantification [25]. Nonetheless, such approaches remain largely underexplored in the context of GR water quality modeling.
To bridge these knowledge gaps—specifically, the limited understanding of pollutant dynamics in aged GRs, the scarcity of research focusing on total organic carbon (TOC) in runoff, and the lack of mass-based assessments of first-flush effects—this study evaluates how an aged green roof and a conventional roof (CR) influence runoff quality in a humid subtropical climate. We focus on TOC, electrical conductivity (EC), and pH, assessing both concentration and mass load to investigate the occurrence and magnitude of the first-flush phenomenon. A probabilistic framework is employed to characterize the statistical behavior of TOC and related parameters in GR and CR runoff.
This research makes three primary contributions:
(i)
It provides novel insights into TOC dynamics in an aged GR system, addressing a key gap associated with the influence of substrate aging.
(ii)
It introduces a mass-based approach to assess first-flush effects, establishing benchmark parameters specific to GR runoff conditions.
(iii)
It applies a probabilistic modeling approach to identify the event-scale probability distributions of TOC, enhancing the reliability and generalizability of water quality models for nature-based solutions.
The findings advance the scientific understanding of pollutant behavior in green roof systems, particularly as they age, and demonstrate that TOC and associated runoff metrics exhibit identifiable probabilistic patterns. This opens new pathways for integrating uncertainty-aware modeling techniques into the design, regulation, and maintenance of nature-based infrastructure. Additionally, the use of mass-based and distribution-based analyses strengthens the foundation for stormwater reuse guidelines and adaptive management strategies, especially in regions adopting TOC as a regulatory parameter. These approaches also enhance predictive models of runoff quality, potentially improving both hydrological and water quality modeling in urban environments.

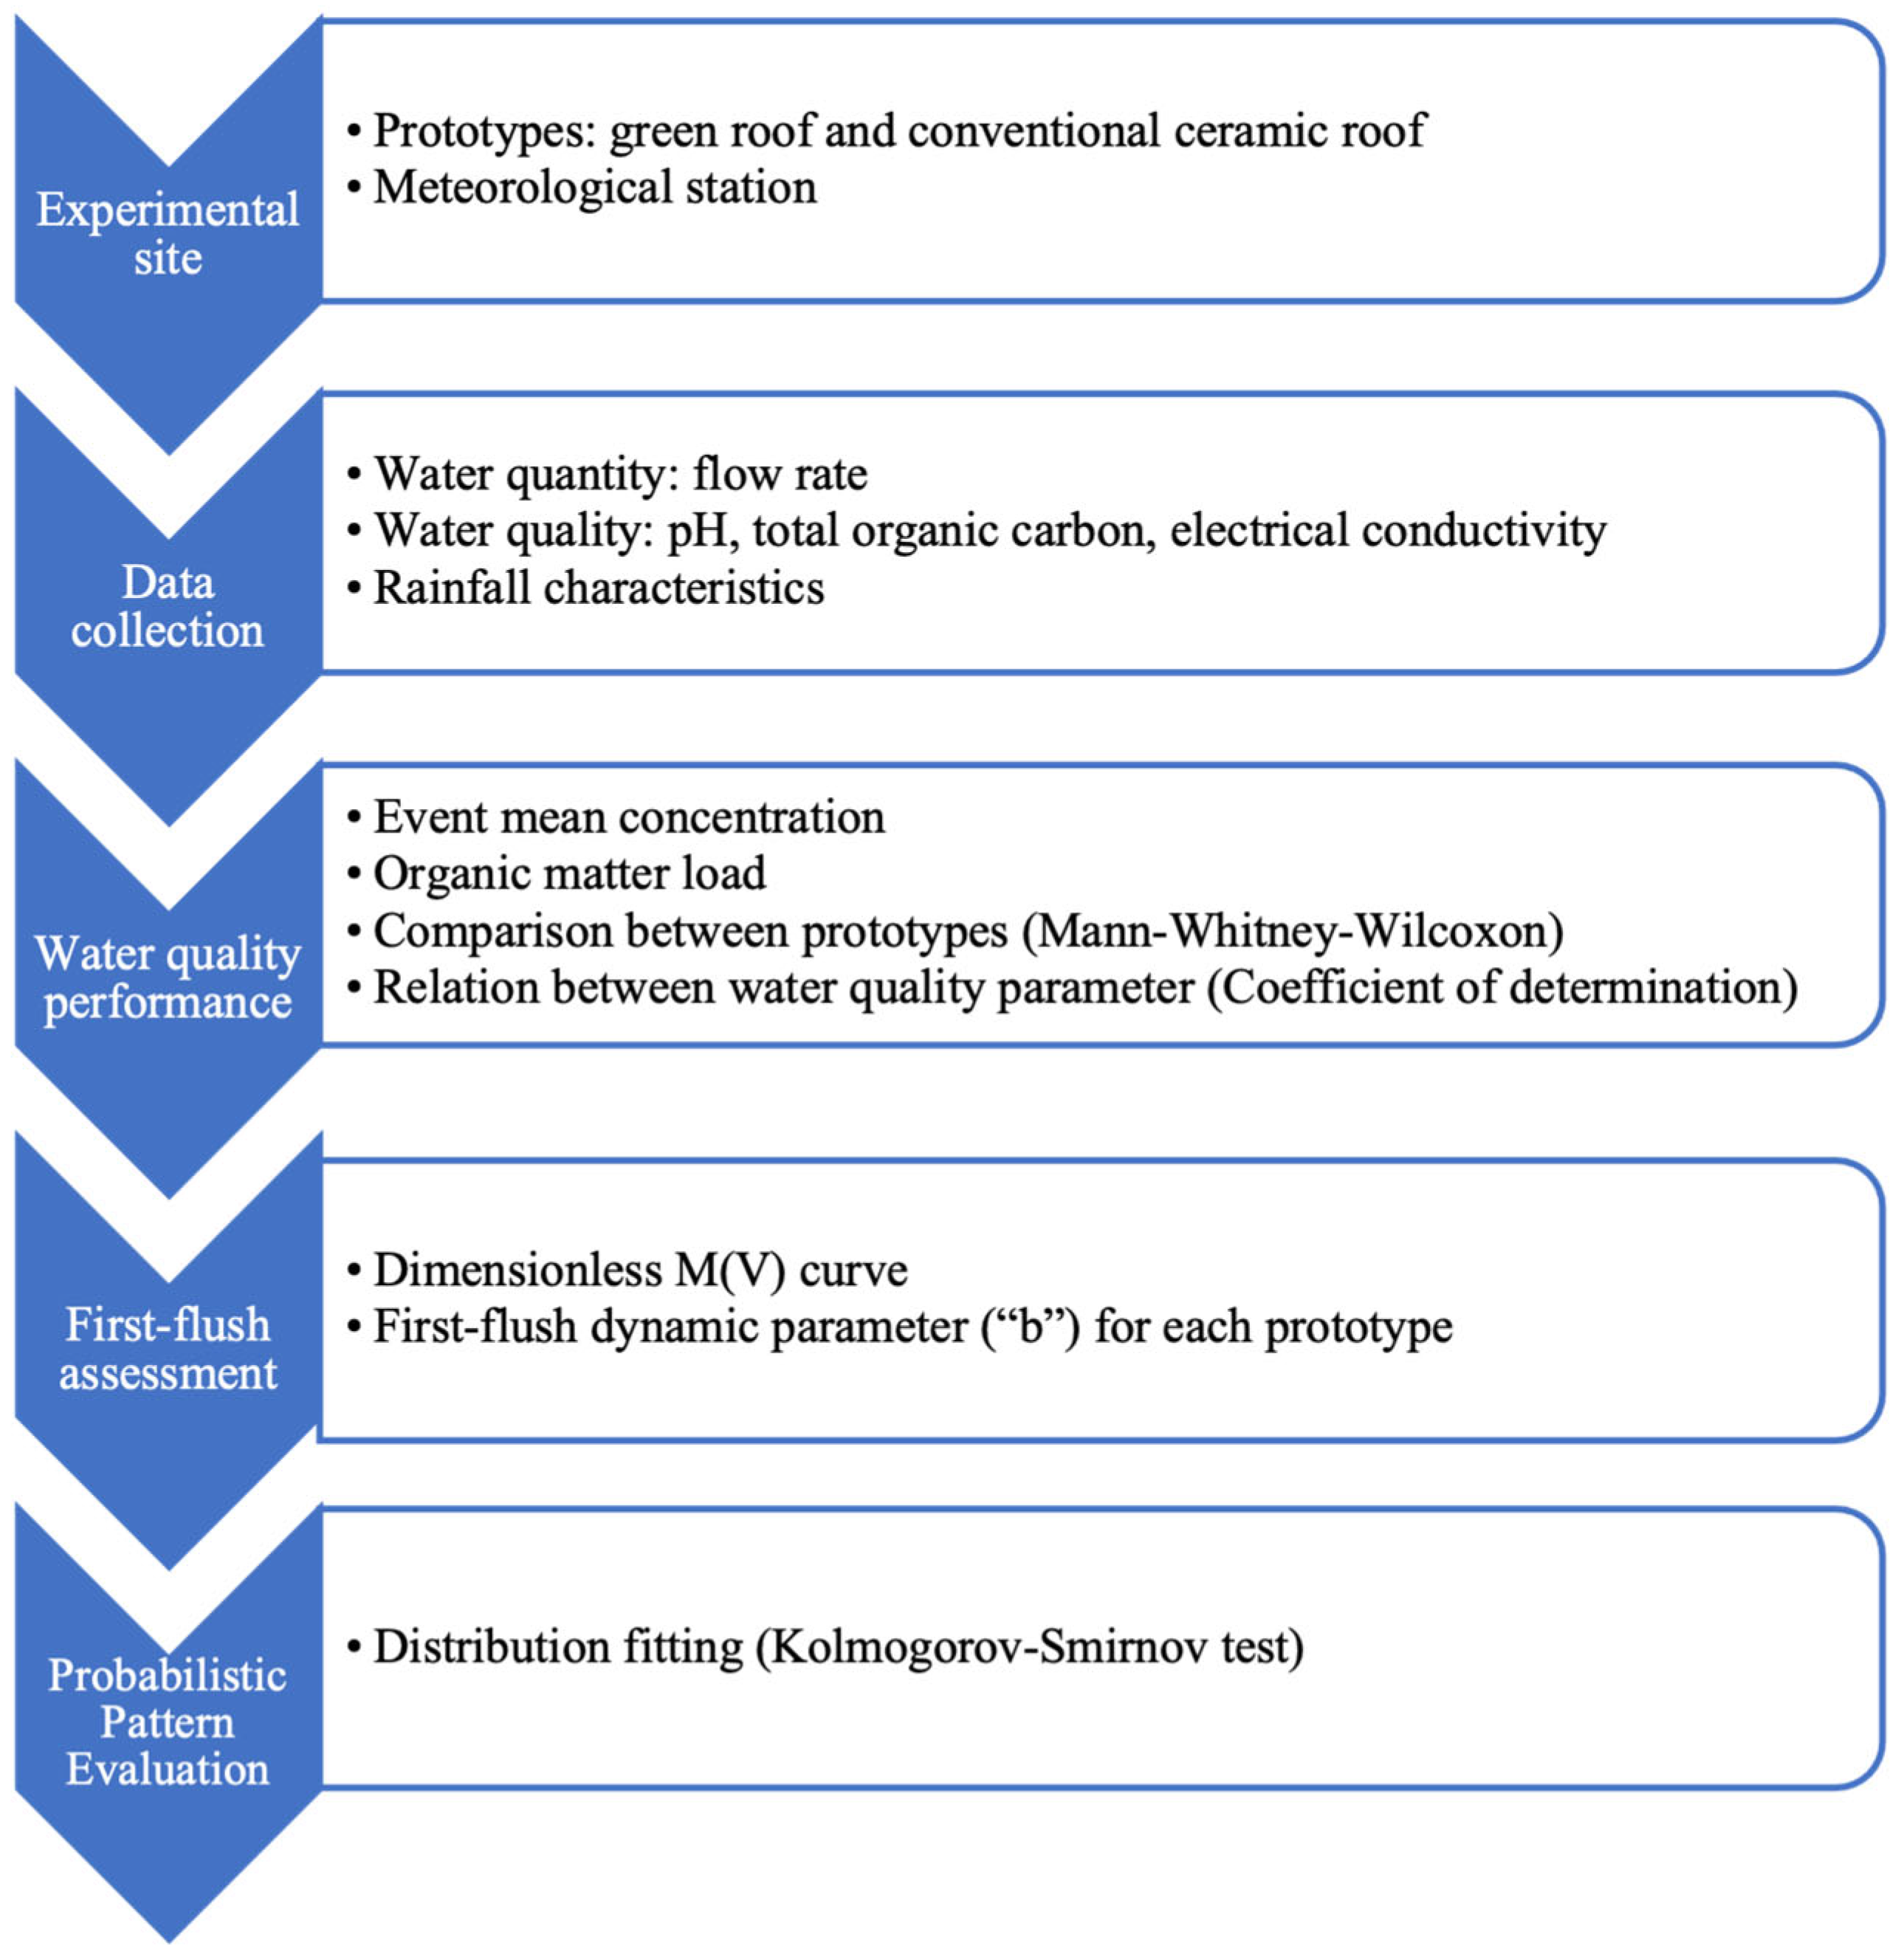
2. Materials and Methods

Figure 1 presents an overview of the methodology employed in this study. Runoff from both prototypes was monitored separately for flow and water quality, enabling a comprehensive evaluation of pollutant dynamics. This framework supported subsequent analyses, including first-flush characterization and statistical modeling. The following sections provide a detailed description of the experimental setup, data acquisition procedures, and analytical methods.

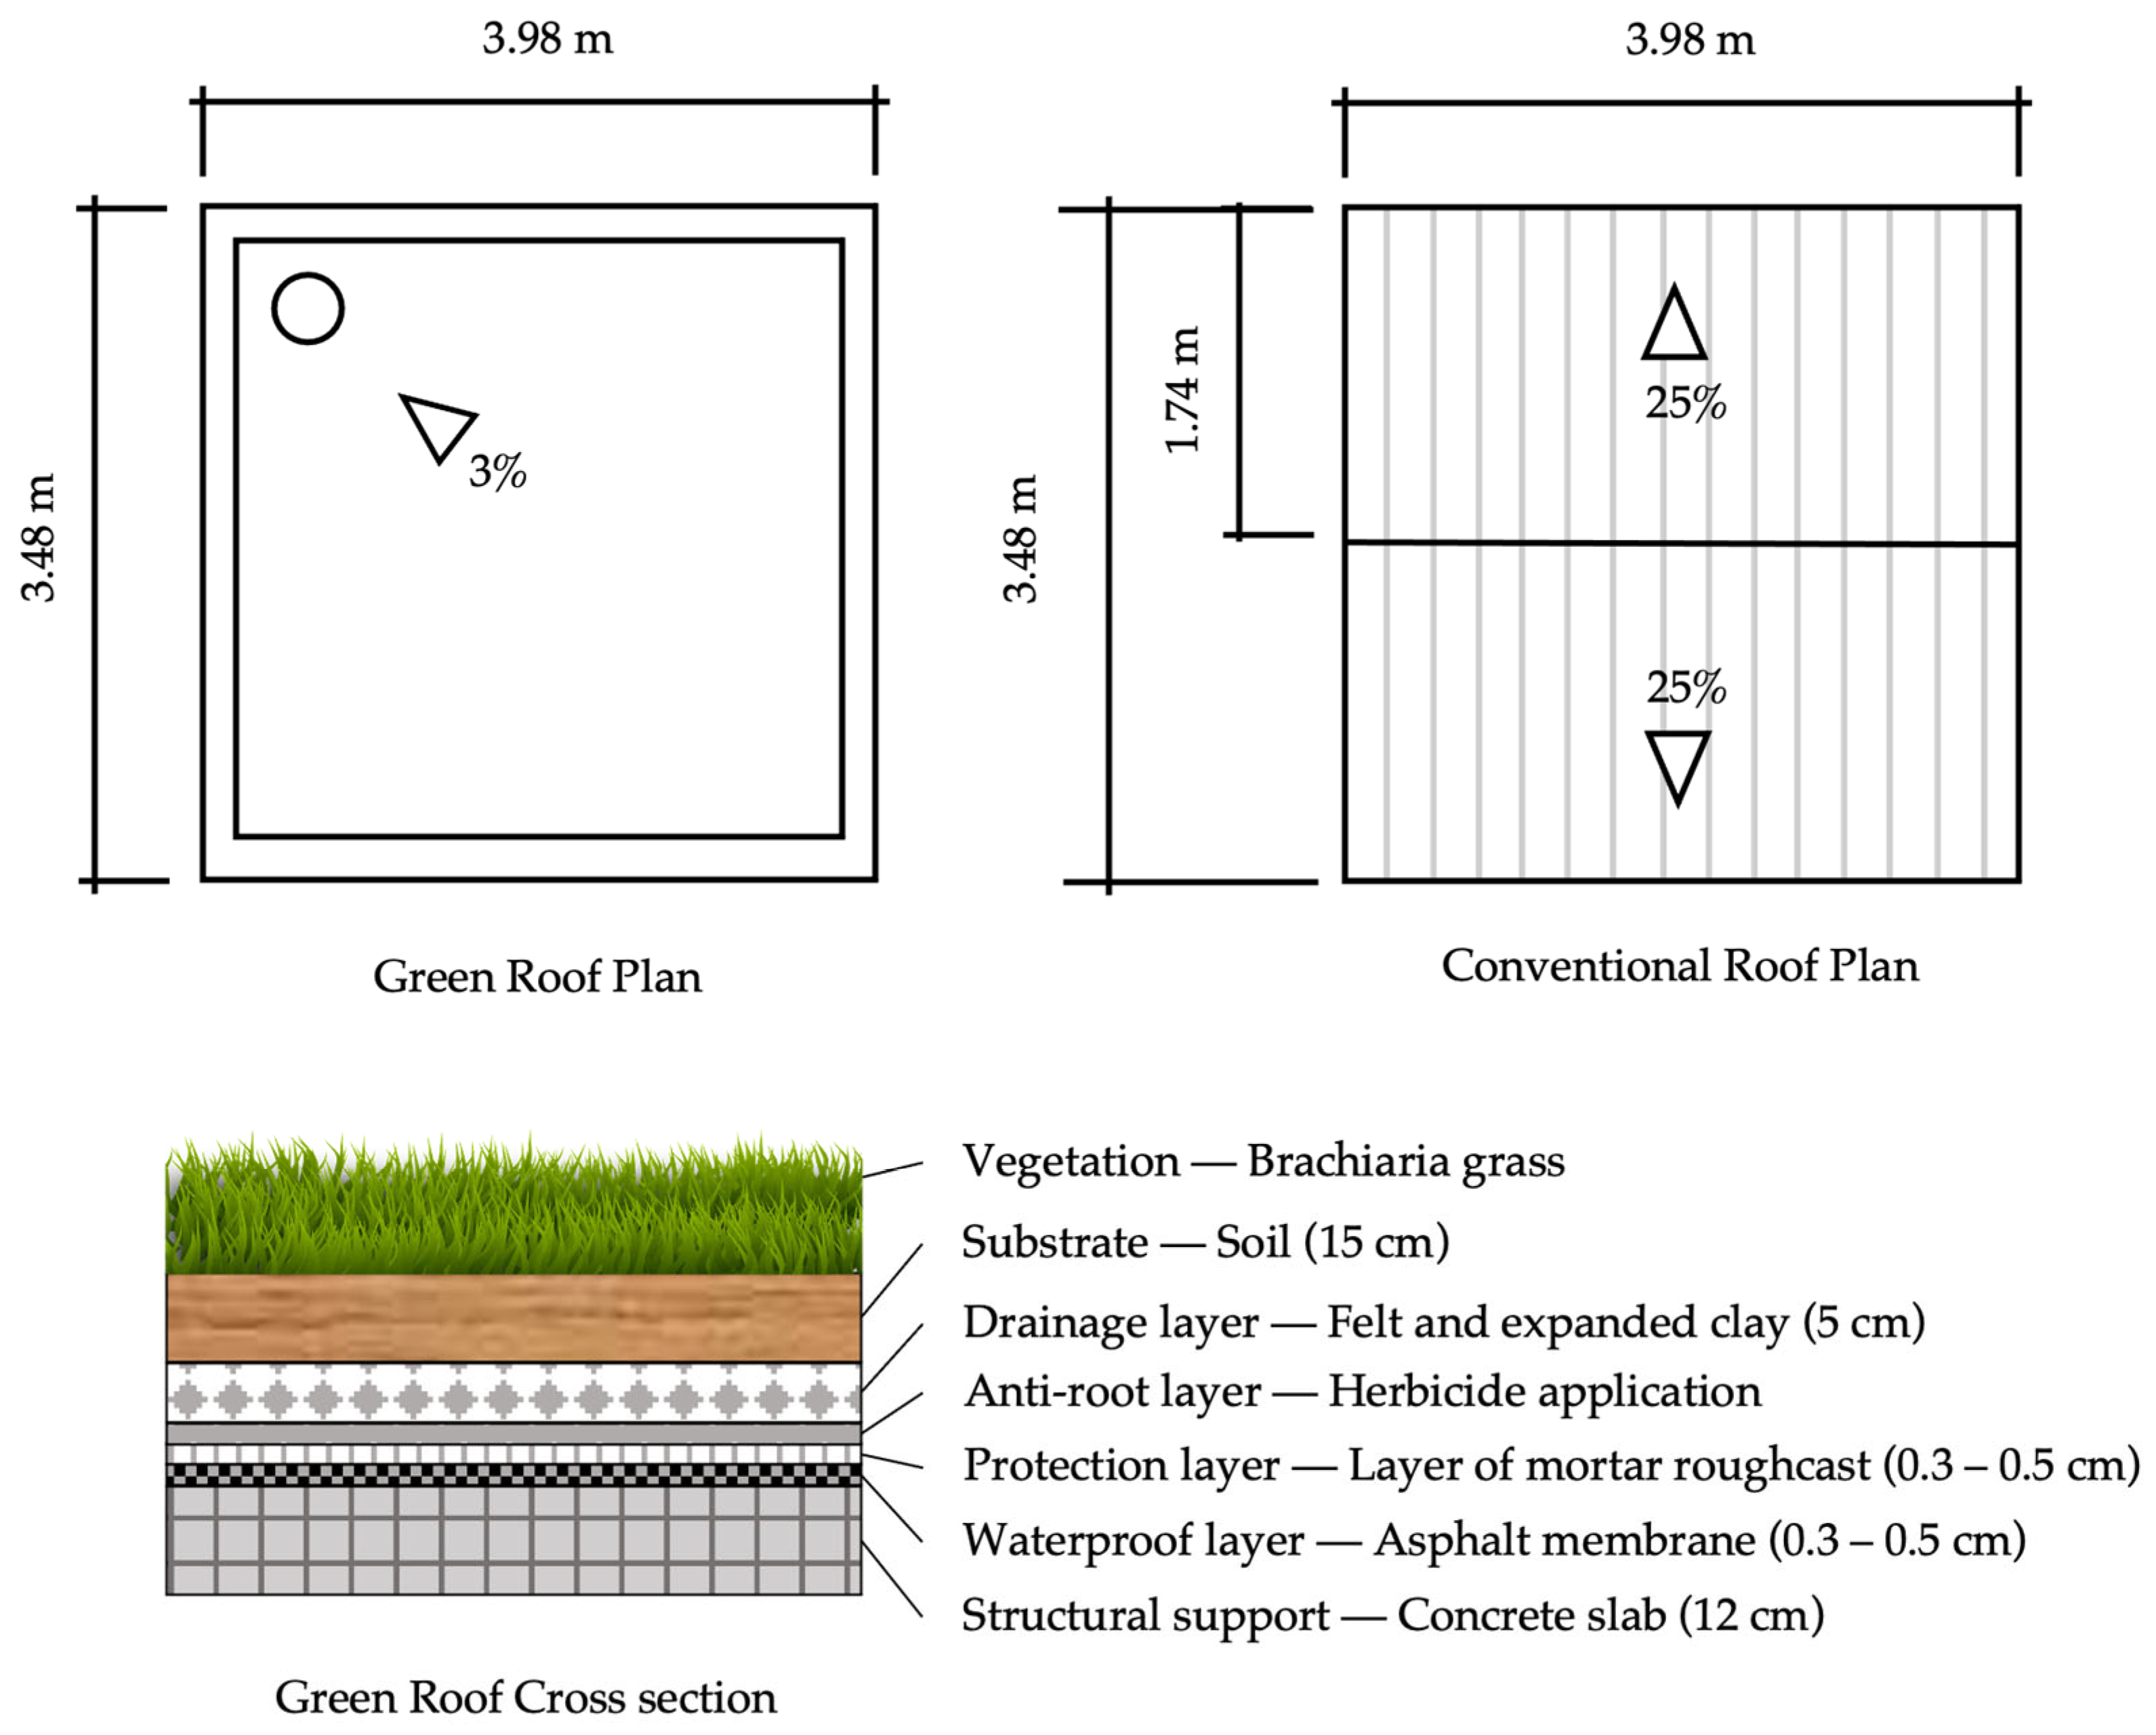
2.1. Green Roof and Conventional Roof Pilots

The experimental site is located at the University of São Paulo in São Paulo, Brazil, which experiences a humid subtropical climate of the Cwa type, according to the Köppen-Geiger classification [26]. This specific subtype is characterized by hot, wet summers and mild, dry winters, with well-defined seasonal patterns. Geographically, Cwa climates are relatively rare and found in select regions such as São Paulo, Auckland, and Hong Kong. These distinct climatic conditions create particular environmental settings that can strongly influence hydrological processes and pollutant dynamics. Climatological data from 1990 to 2020 [27] indicate an average annual relative humidity of 73.6% and total annual precipitation of 1654 mm, distributed over approximately 139 rainy days. The mean annual temperature is 20.4 °C, with seasonal variations ranging from an average minimum of 16.4 °C to a maximum of 26.1 °C. Precipitation is predominantly concentrated in the warmer months (October to March), while winter remains the driest season.
The GR pilot was constructed in 2011 and covers an area of 11.42 m2 with a 3% slope. Its roofing system comprises an asphalt waterproofing layer, a mechanical protection layer made of mortar and felt, an anti-root barrier, a drainage layer of expanded clay, and a 15 cm thick soil substrate (Figure 2). The substrate, initially composed of vegetable soil, was later enriched with worm humus to enhance organic content. The roof is vegetated with brachiaria grass (Brachiaria decumbens), a species well-adapted to subtropical climates due to its resilience to drought and high temperatures. The evapotranspiration rate of this vegetation is particularly significant during the rainy season, when temperatures are elevated [28]. Further construction details and photographs are available in [29].
The CR shares the same structural framework as the GR but is covered with ceramic tiles, a traditional roofing material widely used in Brazil. This prototype has a 25° slope and a plan area of 8.92 m2. Since runoff was collected from only one side of the sloped roof, the effective drainage area for the experiment was 4.46 m2.

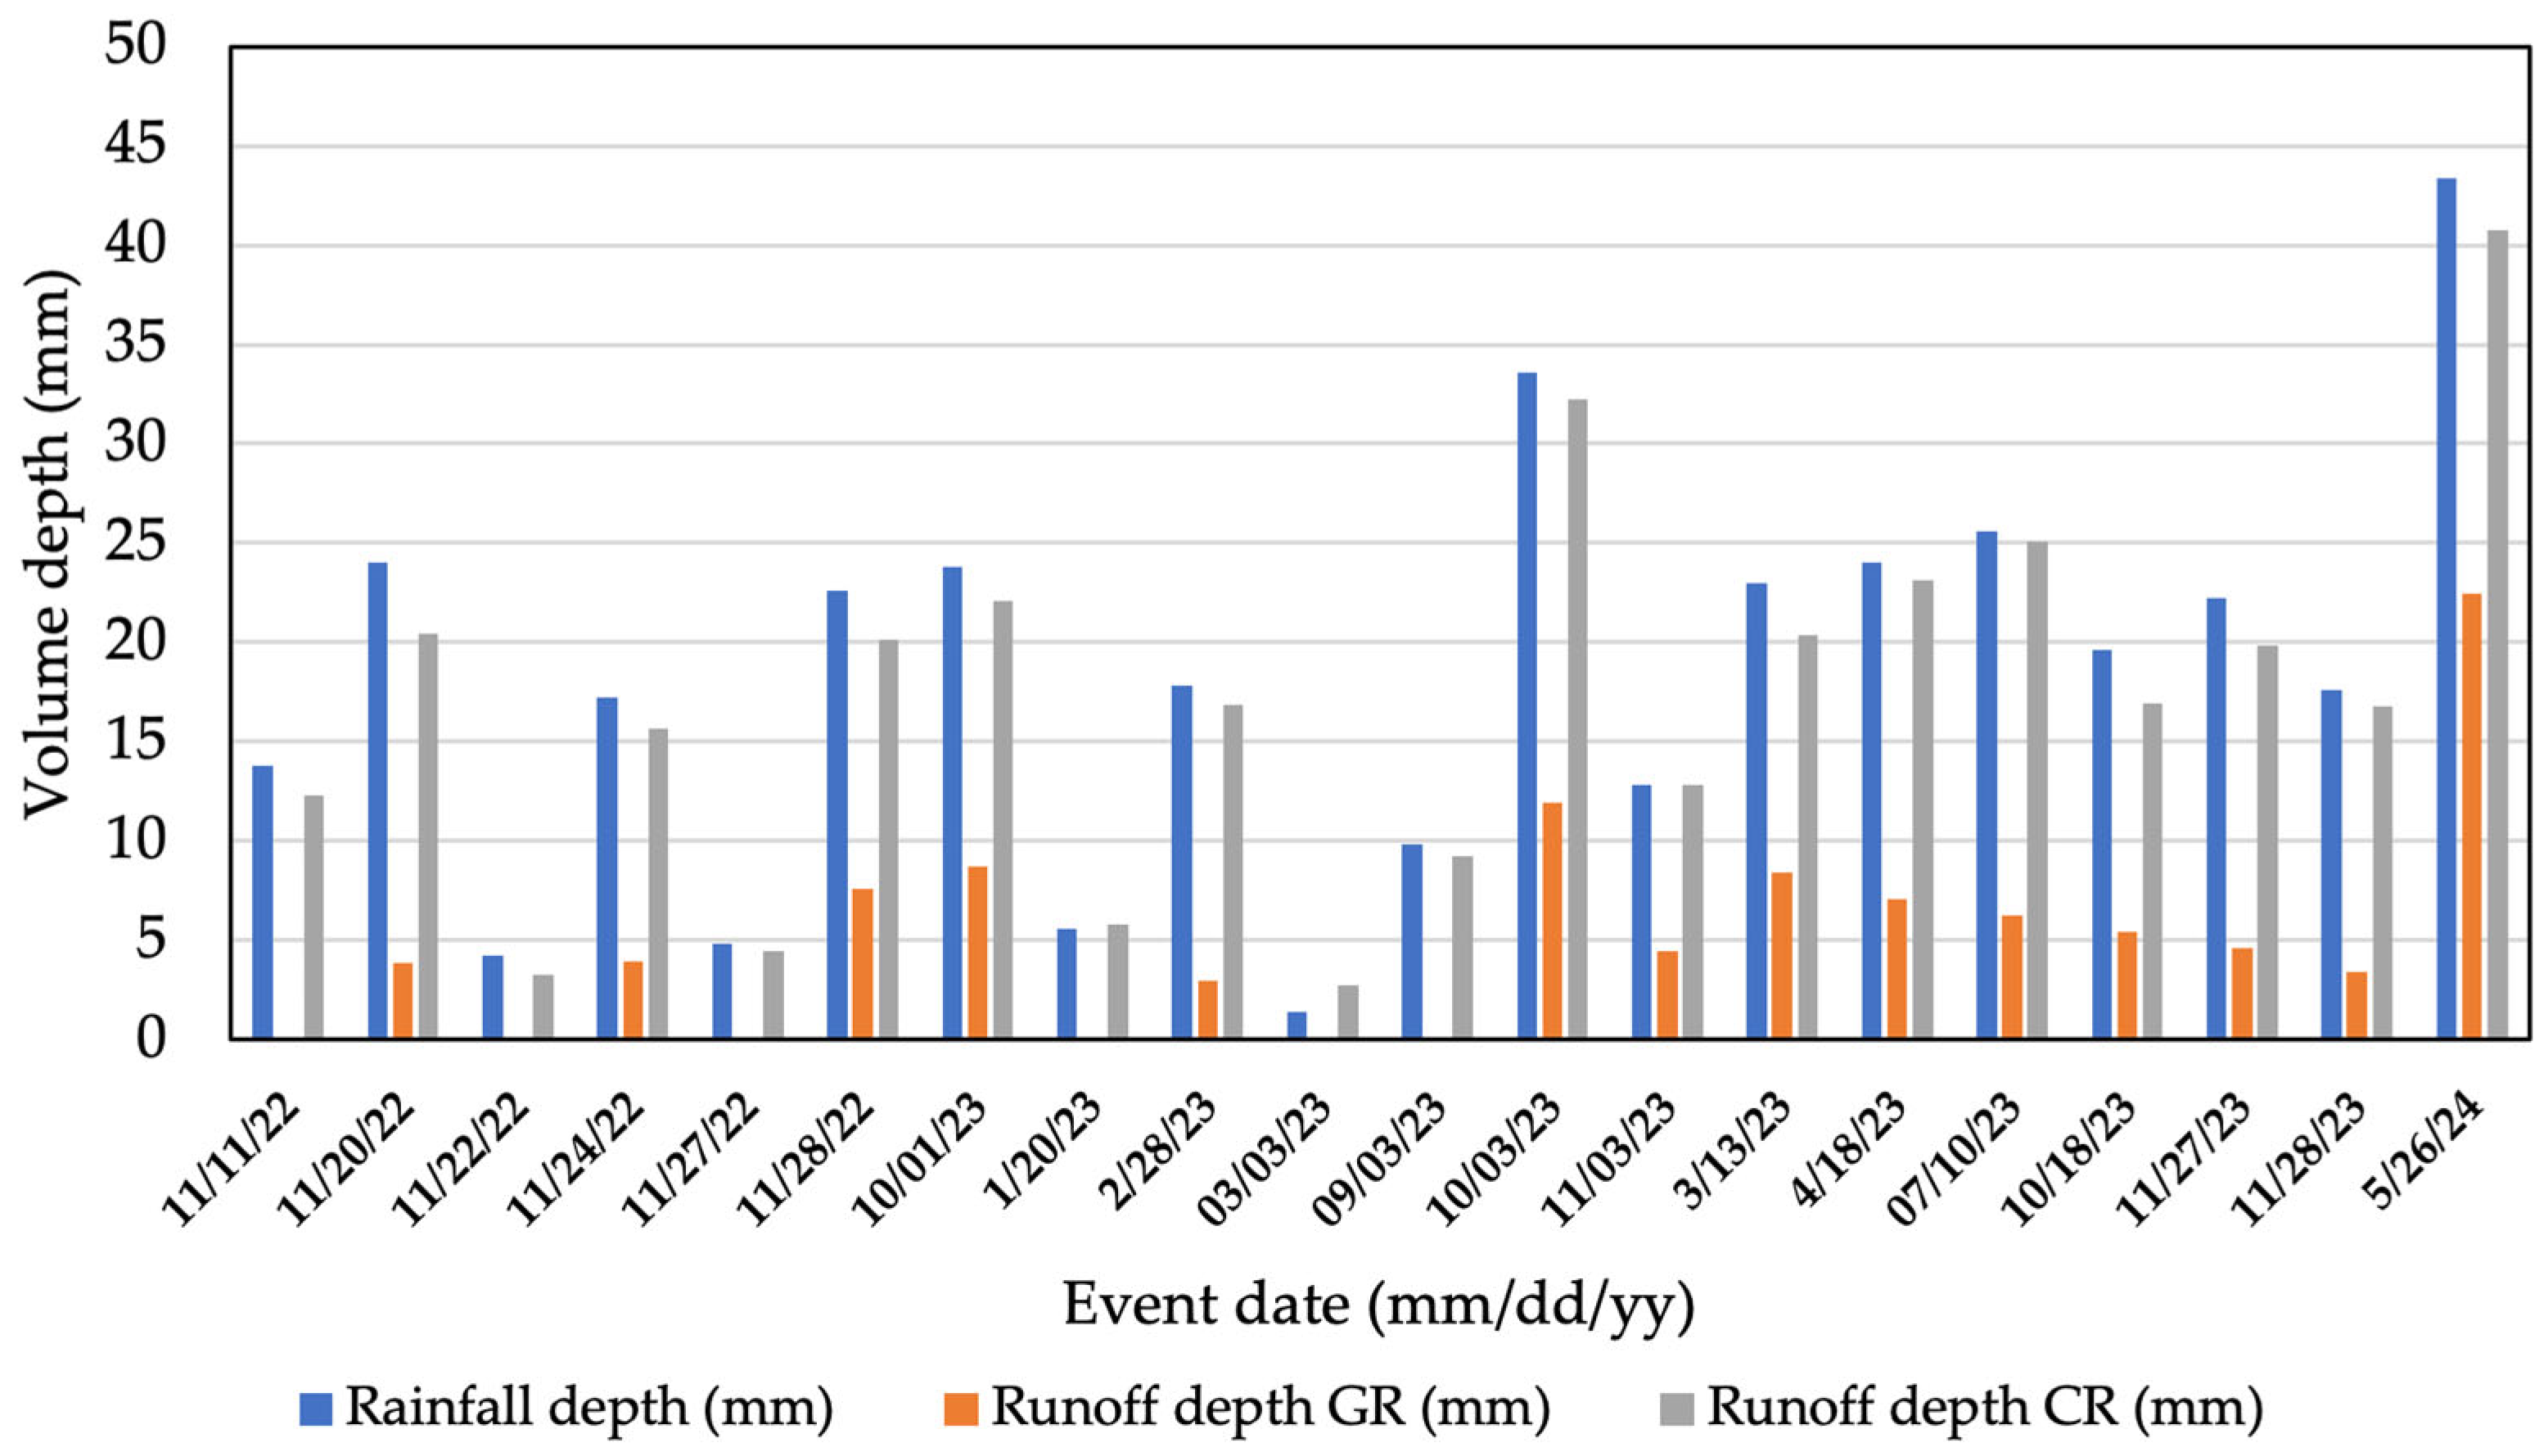
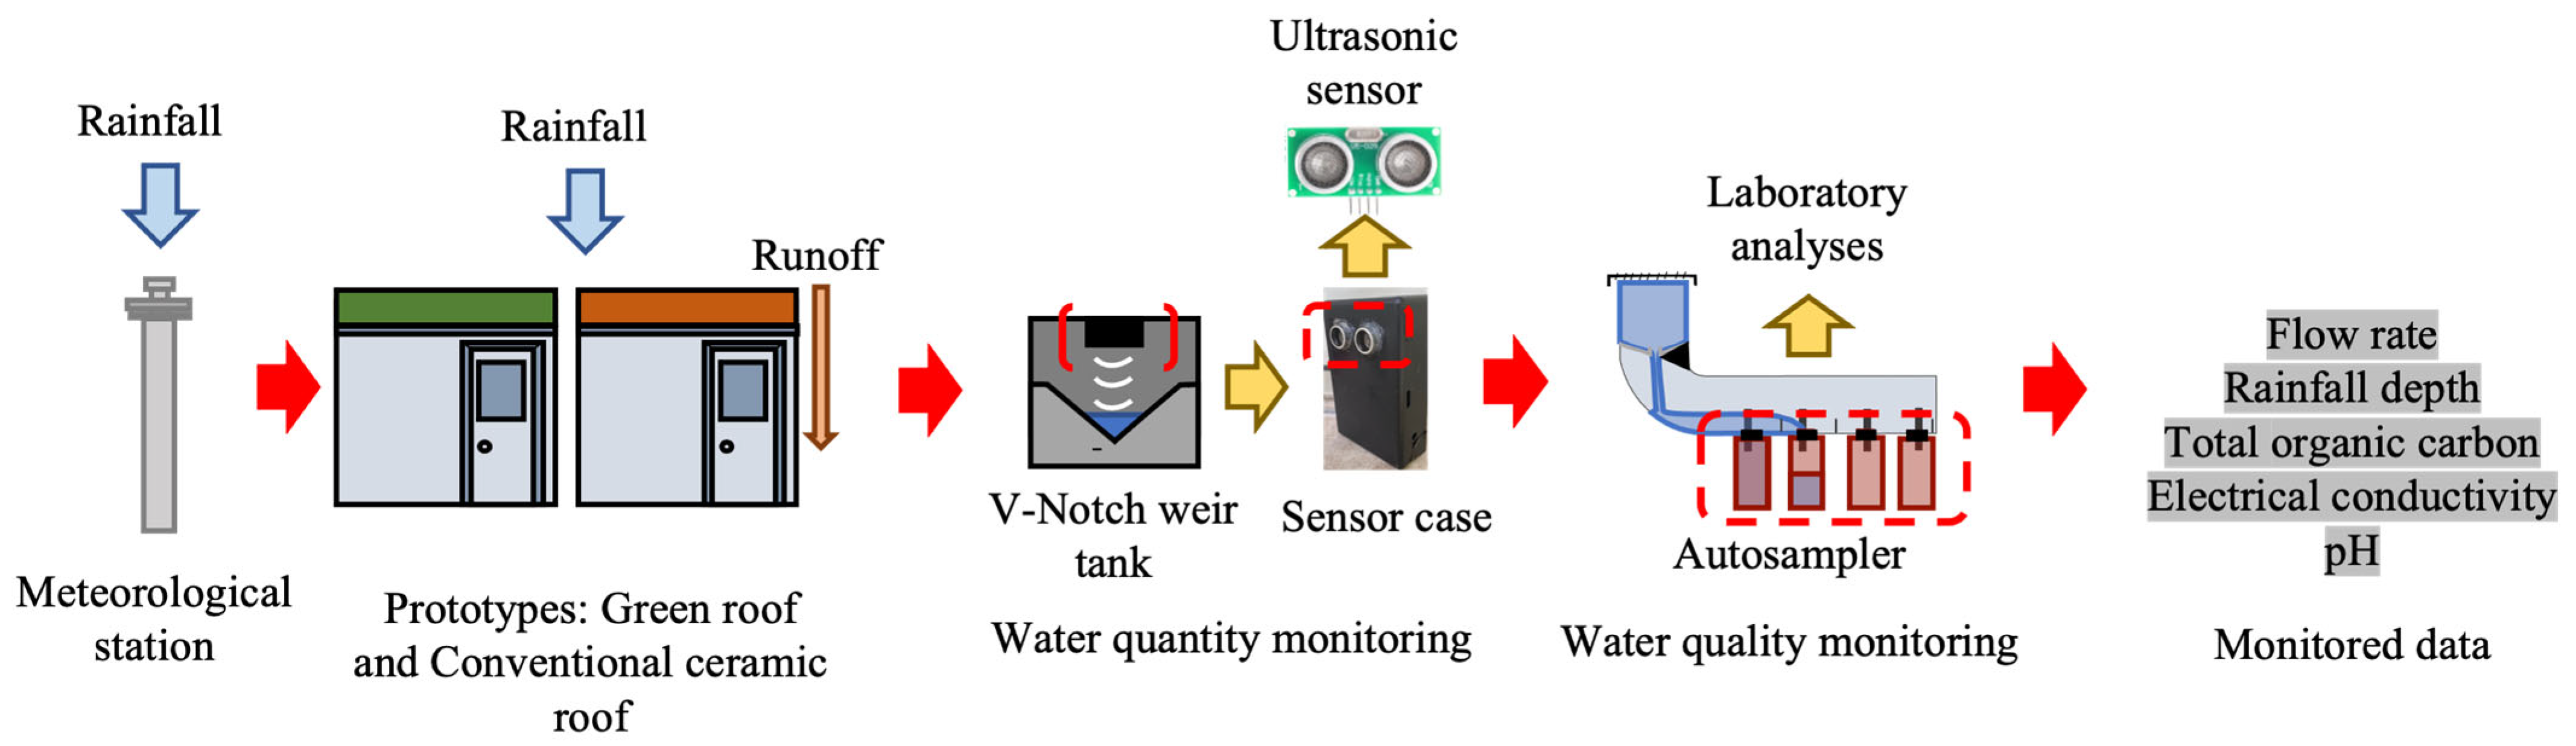
2.2. Data Collection

Data were collected from 20 natural rainfall events between November 2022 and May 2024 (Figure 3), with most events occurring during the wet season due to the scarcity of rainfall in the dry months. Rainfall intensity was recorded using a rain gauge located 470 m from the study site.
Runoff from both prototypes was measured using a triangular-notch weir tank equipped with an ultrasonic distance sensor (US-025). The weir discharge coefficient was calibrated in a controlled laboratory environment to ensure an accurate flow–discharge curve, particularly under low-flow conditions (<200 mL/s). To improve measurement accuracy, ultrasonic sensor data were corrected for air temperature variations, and a robust non-parametric statistical approach was applied to detect and remove outliers. A detailed description of the data processing methodology is available in [30]. Water samples were collected at 17-min intervals using a gravity-fed autosampler, following the methodology outlined in [31]. Water quality analyses were conducted for TOC, EC, and pH. The complete monitoring system and data collection workflow are illustrated in Figure 4.

2.3. Water Quality Analyses

The monitored water quality parameters included TOC, EC, and pH. The effluent quality of the GR and the CR was evaluated using the event mean concentration (EMC), organic matter load, and pollutant retention efficiency, following the approach recommended by [23]. These metrics were derived from runoff monitoring data. Organic loads were normalized by the drainage area of each prototype and expressed in mass per square meter. Although the GR and CR prototypes had slightly different surface areas, scale effects were assumed to be negligible due to their comparable orders of magnitude
The EMC is a widely used indicator for evaluating stormwater quality. It represents a flow-weighted average concentration and is calculated as the total pollutant mass discharged during a rainfall event divided by the total volume of runoff generated in the same event. EMC accounts for temporal variations in both pollutant concentration and flow rate and is calculated using Equation (1). In Equation (1), C(t) denotes the pollutant concentration at time t and Q(t) represents the corresponding runoff flow rate at the same instant. The integration is performed over the duration of the rainfall event t 0 . The variable dt represents the time interval used for numerical integration, which in this study was set to 10 s based on the flow rate measurement frequency. Water quality samples, collected every 17 min, were assumed constant within each interval and applied uniformly to the 10 s flow rate data.
E M C = P o l l u t a n t   M a s s R u n o f f   V o l u m e = 0 t 0 Q ( t ) × C t d t Q t d t
The TOC load ( M T O C ) transported by runoff during each event was calculated by integrating the product of the pollutant concentration, denoted as C(t), and the corresponding runoff flow rate, Q(t), over the entire duration of the rainfall event t 0 , as shown in Equation (2).
M T O C = 0 t 0 Q ( t ) × C t d t
The mass removal efficiency ( η m ) is determined by comparing the TOC load released in diffuse pollution by the GR ( M G R ) and the CR ( M C R ) . Mathematically, it can be calculated using Equation (3). A positive η m value indicates that the GR effectively reduces organic matter in diffuse pollution by retaining TOC. In contrast, a negative η m value suggests that the GR acts as a source of TOC, releasing higher loads into runoff compared with the CR.
η m ( % ) = 1 M G R M C R × 100 %

2.4. First-Flush Evaluation Method

The mass release patterns of TOC and EC were evaluated using dimensionless M(V) curves, which represent the cumulative distribution of pollutant mass relative to runoff volume, as proposed by [32]. These curves were approximated by fitting a power-law function, as described in [21], using Equation (4):
F X = X b
where the parameter b indicates the first-flush intensity. The parameter b represents the gap between the curve and the bisector. According to [21], the parameter b values are classified into Zones 1 through 6 (Table 1). Zone 1 corresponds to the lowest b values, indicating intense first flush, while Zone 6 corresponds to the highest values, indicating an intense last flush.

2.5. Statistical Data Analyses

Data analysis was conducted using R software (RStudio version 2021.09.2+382). To assess significant statistical differences in water quality parameters between the GR and the CR, the Mann–Whitney–Wilcoxon (U) test was applied at a 5% significance level. This test compared the runoff water quality between the two prototypes [33].
A data-driven approach using linear regression analysis was applied to examine the relationships between water quality parameters and climatic variables, as well as among the water quality parameters themselves. The coefficient of determination (R2) was calculated to assess the model fit and quantify the proportion of variance explained by the regression model [34].
The Kolmogorov–Smirnov (KS) test was used to assess the distribution of water quality parameters and the first-flush parameter (b). This test compared the empirical distribution with several theoretical distributions, including Normal, Lognormal, Gamma, Exponential, and Weibull distributions [25]. A p-value of less than 0.05 indicates a statistically significant deviation from the reference distribution.

3. Results and Discussion

3.1. Runoff Water Quality

Table 2 presents the statistical indicators for the analyzed water quality parameters from both GRs and CRs. It includes the average and median values for each parameter, the GR/CR ratio, and the results of the Mann–Whitney–Wilcoxon test. A p-value of less than 0.05 indicates a statistically significant difference between the two roof types. Complementarily, Figure 5 illustrates the distribution of these water quality parameters through boxplots, providing a visual comparison of variability and central tendency between GR and CR runoff.

3.1.1. Total Organic Carbon—EMC

The GR significantly increased the TOC concentration in runoff, with mean and median values rising by 3.9 and 4.3 times, respectively, compared with the CR (p = 0.000). This result aligns with previous studies [34,35], which also reported elevated TOC concentrations in GR runoff. The higher TOC levels can be attributed to the continuous release of organic matter from the substrate and the water retention capacity of the system, which concentrates TOC in the runoff.
Despite the increase in TOC concentration, the average value of 21.92 mg/L in GR runoff remains below the 25 mg/L threshold for river depollution established by CETESB [10]. This suggests that, while GRs contribute additional organic carbon to runoff, they still meet acceptable water quality standards.
Interestingly, the TOC concentrations observed in this study were lower than those reported in previous works [12,14,36], where values as high as 60 mg/L, 50 mg/L, or even 187 mg/L were documented in GRs with a 15 cm substrate layer. This discrepancy is likely due to the progressive mineralization of organic matter in the substrate, which gradually reduces its content over time and, consequently, the TOC leached into the runoff [37]. Additionally, the mineralization rate tends to be higher in warm and humid climates, further accelerating organic matter decomposition [16]. This trend aligns with the findings of [13], who observed a significant decrease in TOC concentrations in runoff within just nine months, attributed to the absence of fertilization and the low organic matter content in the substrate. Similarly, ref. [38] observed that organic matter leaching in bioretention outflows stabilized after the fifth simulated rainfall event, reinforcing the notion that leaching tends to decline with system maturation and reduced organic outputs.
Although retrofitting existing roofs into GRs increases TOC concentrations in diffuse pollution, substrate aging appears to mitigate this effect over time. The gradual stabilization of organic matter release ensures that runoff remains within acceptable water quality requirements, highlighting the potential for long-term water quality benefits associated with aged GR systems.

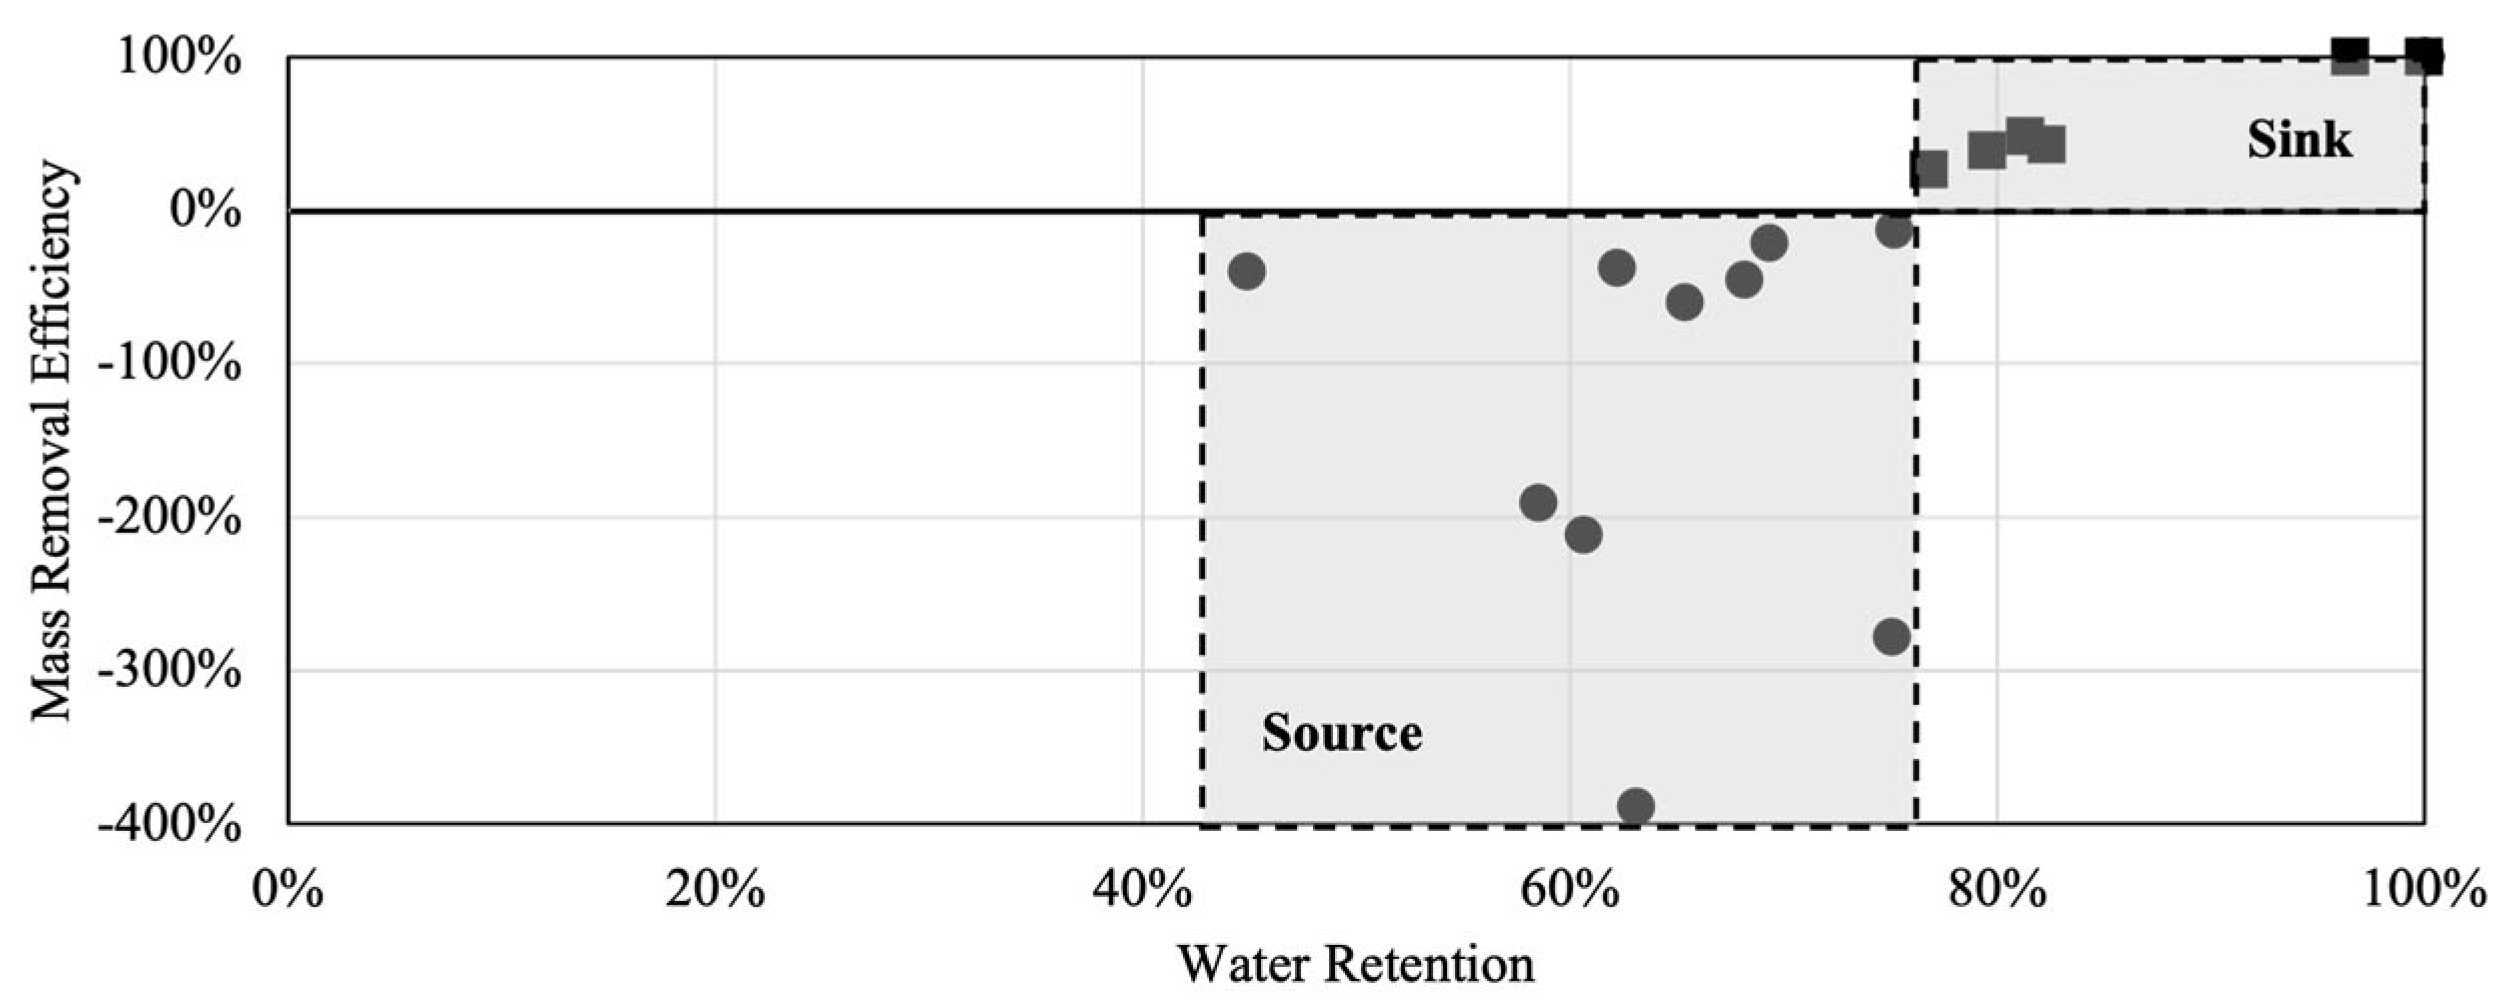
3.1.2. Total Organic Carbon—Load

The GR released an average of 202 mg/m2 of TOC per event, with a standard deviation of 205 mg/m2, indicating considerable variability. This variation is likely influenced by hydrological factors such as rainfall duration, depth, and intensity, which affect the mobilization of organic matter within the substrate [16]. Among these factors, rainfall depth showed the greatest explanatory power for TOC mass release, as reflected by a high coefficient of determination (R2 = 0.89) in the regression analysis (Figure 6). This suggests that rainfall depth accounts for a significant portion of the observed variation in TOC loads, indicating a gradual release pattern in which larger rainfall events result in greater TOC export.
On average, TOC load release from the GR was 2.1 times higher than from the CR, which had an average of 94 mg/m2. A clear relationship was observed between hydrological retention and TOC mass retention, as illustrated in Figure 7. During low retention events, the GR functioned as a TOC source, exhibiting negative efficiency rates. In contrast, events with high retention—mainly those with low rainfall depths—resulted in lower TOC loads, as the GR’s capacity to retain water effectively reduced overall runoff volumes. These findings align with previous research demonstrating that GRs can act as sources or sinks of organic carbon depending on hydrological conditions [39]. These results emphasize the influence of rainfall characteristics on TOC release from the GR, reinforcing the link between hydrological performance and runoff quality.
These findings have important implications for urban stormwater management. GR systems demonstrated better performance during more frequent, lower-intensity rainfall events, acting as effective sinks for TOC. This capacity is particularly relevant for mitigating diffuse pollution, where organic matter is often a significant component of urban runoff.

3.1.3. pH

The pH of GR runoff ranged from 6.8 to 7.4, with an average of 7.0. These values are consistent with studies by [33,40], who reported similar pH ranges for GR runoff. The observed pH values also comply with national standards for rainwater harvesting, supporting the potential for non-potable reuse applications [41].
Compared with CRs, the GR runoff had a higher pH, with the average pH rising from 5.9 in the CR to 7.0 in the GR. This pH elevation suggests that the GR may help neutralize acid-rain runoff, which is an important environmental benefit, particularly in metropolitan regions like São Paulo, where acid rain with pH values below 5 is common due to air pollution [42]. This neutralizing effect can reduce the environmental impact of acid rain and improve the quality of stormwater runoff.

3.1.4. Electrical Conductivity

The EC of GR runoff was approximately 5.5 times higher than that of CR runoff, with the GR showing an average conductivity of 122 μS/cm and a median of 130 μS/cm, although with a high variation, as observed in the boxplots in Figure 5. These results align with studies by [33], who also observed elevated EC in GR runoff.
However, there is considerable variation in EC values reported in the literature. For instance, ref. [43] reported values around 730 μS/cm, while ref. [44] observed values mostly between 100 and 300 μS/cm. The differences are likely due to variations in substrate composition and seasonal effects on runoff EC [12]. The composition of rainwater may also influence runoff conductivity, as suggested by [44].

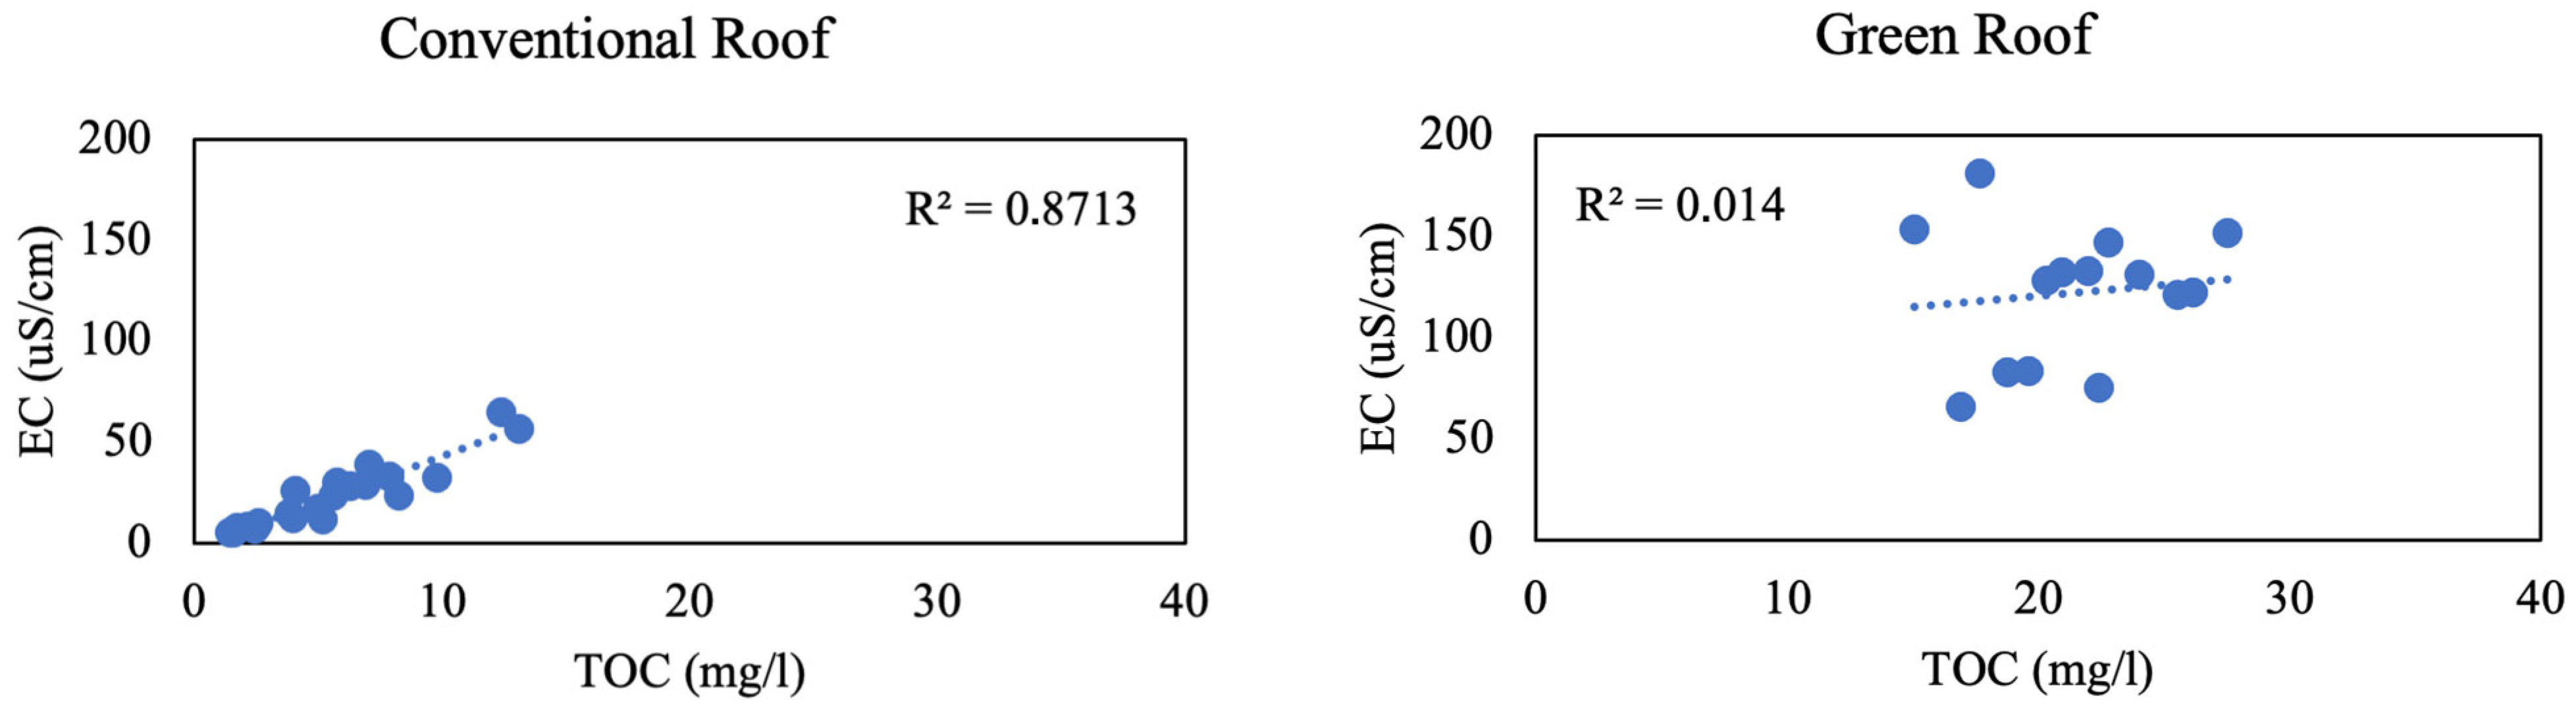
3.1.5. Relationship Between Parameters

A regression analysis was conducted to explore the relationships between water quality parameters in the runoff from each roof pilot (Figure 8). For the CR, a strong linear relationship was observed between EC, TOC, and pH, while other parameters presented weak coefficients of determination, indicating limited explanatory power in their linear associations.
The linear regression between TOC and EC in the CR showed a high coefficient of determination (R2 = 0.8713), indicating that approximately 87% of the variability in EC can be statistically explained by variations in TOC concentrations. This strong relationship suggests that a significant fraction of TOC in the runoff exists as dissolved organic anions, which contribute to the ionic load and thus to EC [45]. Such a connection underscores the role of wet deposition, with rainwater acting as the primary source of TOC [45,46]. This is further supported by studies showing that 72–81% of TOC in rainwater occurs in dissolved form [47], emphasizing precipitation as a key contributor to organic matter in roof runoff [48]. A secondary source of TOC is leaching from roof materials, which includes processes such as initial surface wash-off, diffusion driven by concentration gradients, and dissolution based on solubility [49].
Although the regression model indicates a strong fit, it is important to note that R2 alone does not establish causality. The model assumes a linear relationship and homoscedastic variance, and its reliability could be influenced by outliers or non-linear patterns. Therefore, while the strong fit supports the potential use of EC as a proxy indicator for TOC in CR runoff, this application remains site-specific, depending on local pollutant sources, atmospheric deposition rates, and the chemical nature of the organic matter.
The relationship between pH and EC in the CR runoff also revealed a moderate coefficient of determination (R2 = 0.4739), suggesting alkaline ions, such as bicarbonates or carbonates, may be present and contribute to both the increase in EC and the elevated pH values. This association may reflect chemical interactions between deposited atmospheric particles and roof surfaces [49], resulting in runoff enriched with weakly basic compounds.
To enhance water quality for reuse, post-treatment is essential for removing dissolved organic matter. Effective and cost-efficient methods include activated carbon filtration, which adsorbs organic molecules, and biofiltration, where microorganisms degrade dissolved organic matter in sand, charcoal, and gravel layers. These treatments improve water clarity, odor, and overall quality, making it suitable for irrigation and other non-potable uses [50].
In contrast, the absence of a strong coefficient of determination between TOC and EC in the GR indicates a distinct behavior in runoff composition compared with the CR. The weak explanatory power of the linear model suggests that TOC in GR runoff is primarily present in particulate rather than dissolved form. This particulate organic matter is likely more recalcitrant and less biodegradable, which limits its contribution to EC due to the low ionization potential. These observations are consistent with those by [35], who reported increased aromaticity in GR runoff, indicating organic compounds with greater resistance to microbial degradation.
The particulate organic matter in GR runoff likely originates from upper substrate layers, which contain partially decomposed plant residues, root fragments, and other organic detritus [51]. Microbial activity may further shape the composition and stability of these material processes [34]. From a water quality perspective, this behavior is relevant for diffuse pollution management, as leached organic matter from GR systems may persist in urban drainage pathways and receiving water bodies, potentially altering biogeochemical cycles [52].

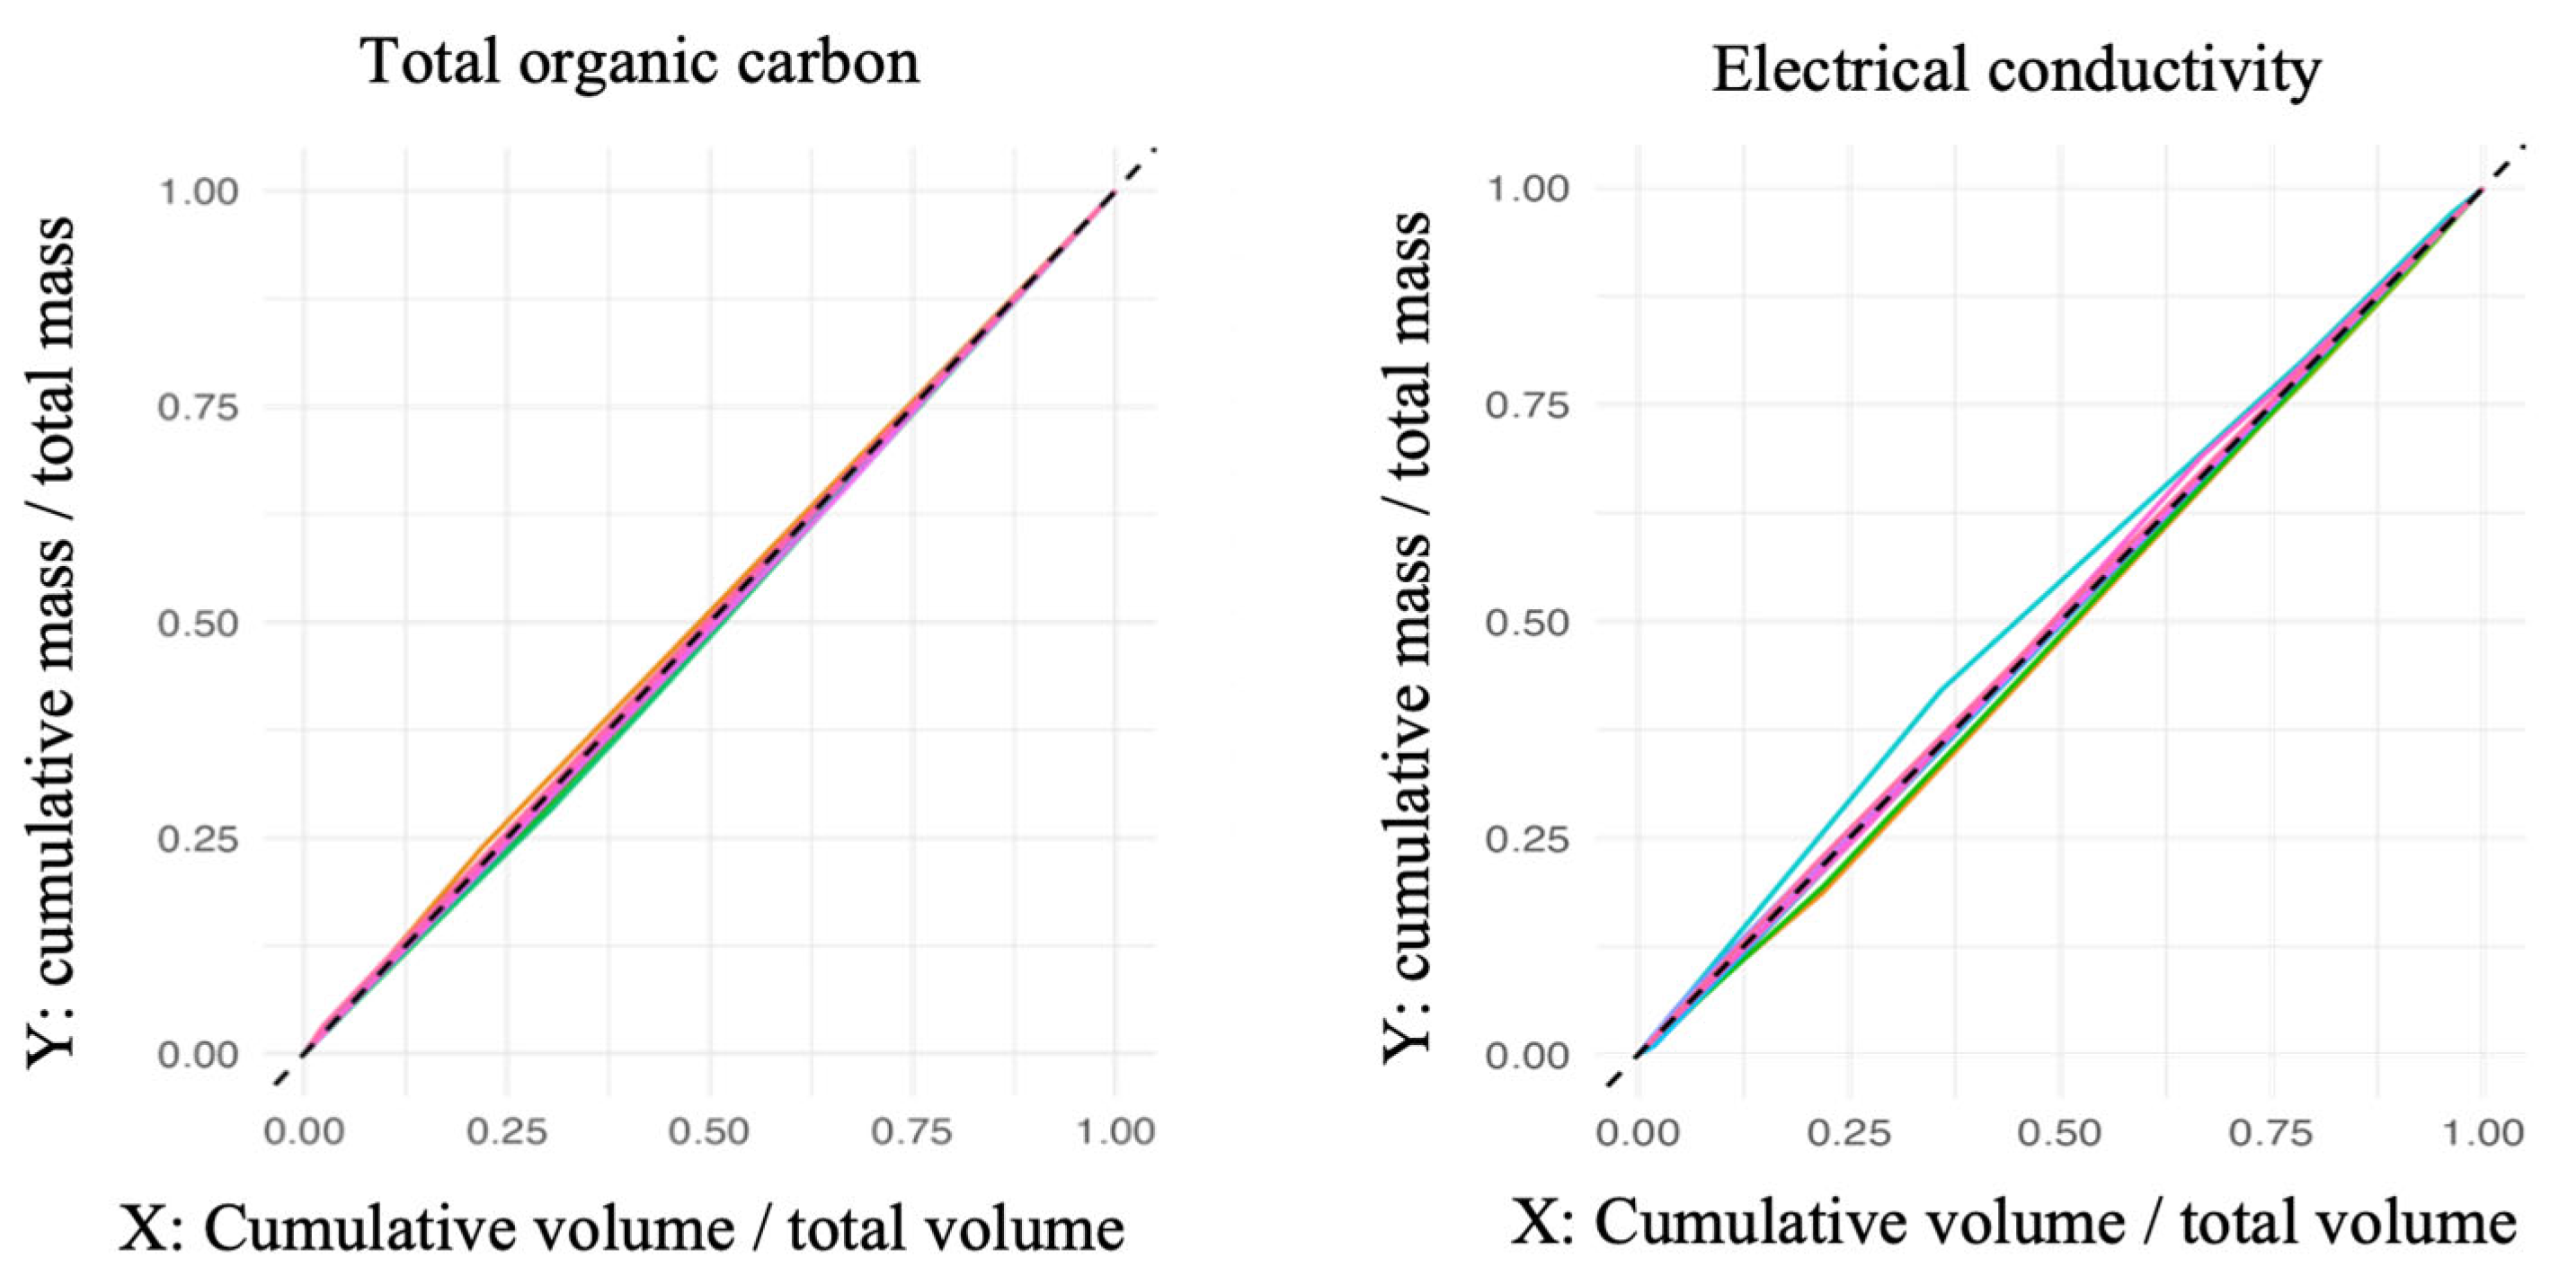
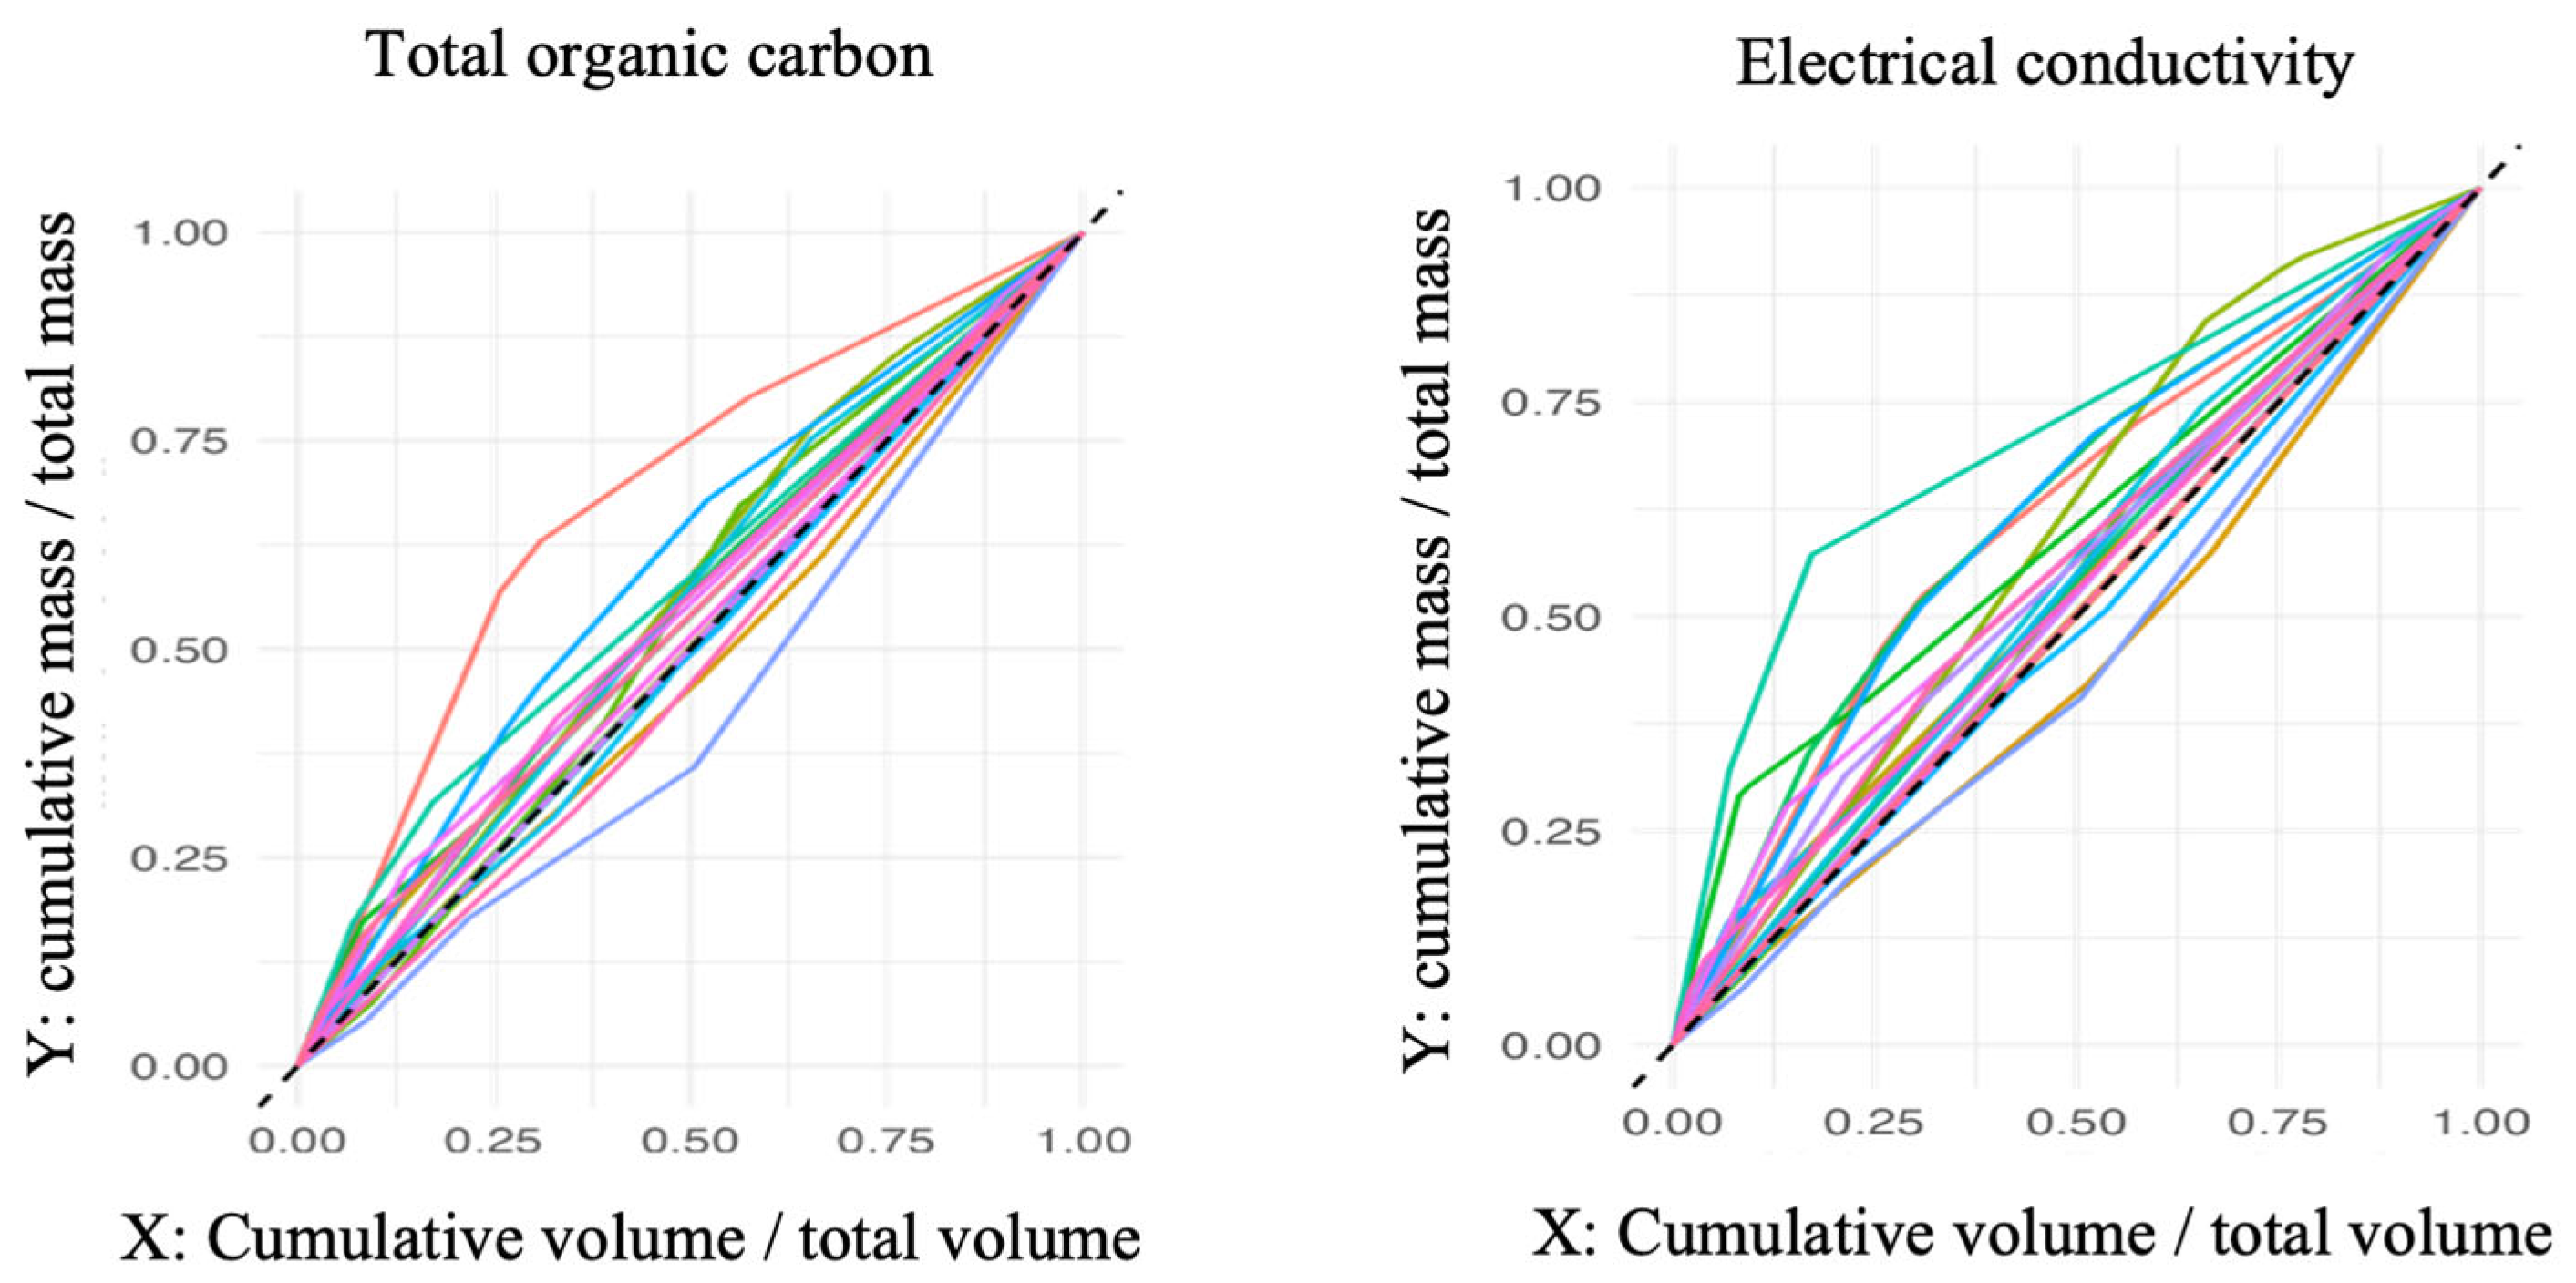
3.2. First-Flush Dynamics

Figure 9 and Figure 10 display the M(V) curves for TOC and EC for all GR and CR events. Table 3 shows the distribution of the parameter b across the six zones for the GR and the CR for both analyzed parameters.

3.2.1. First-Flush Green Roof

For GR events, the analyzed parameters in Figure 9 and Table 3 reveal dimensionless curves closely aligned with the bisector (b ≈ 1; Zones 3 and 4), indicating a proportional release of pollutant mass relative to the drained volume. The absence of a first-flush effect for TOC in GR runoff aligns with [38], which reported that organic matter released from bioretention tends to be distributed more uniformly over time; moreover, those studies found no significant difference in the first-flush parameter b based on the inflow first-flush strength.
Organic matter from atmospheric deposition, along with organic matter present in the soil, is gradually transported rather than being predominantly washed off at the beginning of the event. This pattern reinforces the role of the GR as a filtering medium, either by retaining organic matter or delaying its release. Instead of being discharged in abrupt pulses, organic matter is slowly leached from the substrate, leading to the GR functioning as a continuous source of TOC. This equalization effect may be particularly important for receiving water bodies, as it mitigates sudden peaks in pollutant loads, thereby reducing their potential impact on aquatic ecosystems [52].
For TOC specifically, the distribution of parameter b in GR runoff was predominantly concentrated in Zone 4 (71%), indicating that the initial mass release was lower than at later stages of runoff. A possible explanation for these results is that GR runoff contains fewer fine particles and a greater proportion of coarser particles. The transport of organic matter is closely linked to particle size distribution, as noted by [53]. The first-flush effect is typically stronger for fine particles, which are more easily mobilized by runoff, whereas coarser particles require sustained hydrological forcing for transport. Ref. [54] found that, for larger particles, parameter b values were typically greater than 1, indicating an increasing concentration of particulate matter as the event progressed.
Existing studies predominantly focus on concentration peaks, which do not fully capture total pollutant loads. This study is the first to evaluate organic matter transport from GR using a comprehensive mass-based approach rather than relying solely on concentration-based assessments. By bridging this methodological gap, it provides a more complete understanding of pollutant transport dynamics, which can inform the design of wastewater treatment systems for rainwater harvesting.
Given the absence of a first-flush effect in GR runoff, treating the entire runoff volume is recommended when harvesting rainwater for non-potable reuse. This approach ensures compliance with water quality standards and optimizes treatment efficiency, in line with previous recommendations [46]. Further research on the biodegradability of organic matter in GR runoff is needed in order to assess its long-term environmental impact and potential treatment strategies.

3.2.2. First-Flush Conventional Roof

For the CR, both pollutants exhibited a similar distribution of parameter b across zones, with Zone 3 being the most frequent, followed by Zones 2 and 4 (Table 3). This suggests that the release patterns of EC and TOC in CR runoff are comparable (Figure 10). Additionally, 88% of EC events and 76% of TOC events resulted in parameter b values below 1, indicating a predominance of decreasing mass release throughout the events.
Moreover, only 40% of EC events and 36% of TOC events fell into Zone 2, which corresponds to conditions where a small fraction of runoff carries a disproportionately high pollutant load, characteristic of a first-flush effect [21].
The occurrence of a first-flush effect in approximately 40% of CR runoff events highlights the importance of implementing effective treatment strategies to manage diffuse pollution. Since a significant portion of the pollutant load is transported in the early stages of runoff, first-flush treatment systems, such as filtration or detention mechanisms, can help capture and reduce contaminant concentrations before they reach receiving water bodies. Additionally, this pattern suggests that stormwater management practices should prioritize early runoff treatment to mitigate peak pollution loads. However, the variability in pollutant release across events reinforces the need for adaptive treatment approaches that account for site-specific conditions, rainfall characteristics, and roof material influences to optimize water quality improvement [55].

3.3. Probabilistic Pattern of the Conventional Roof Runoff Water Quality

To assess the best-fitting probability distribution for each runoff quality parameter, p-values obtained from the Kolmogorov–Smirnov test were analyzed. A higher p-value indicates a better goodness-of-fit, with a threshold of 0.05 commonly used to reject the null hypothesis that the data follow the tested distribution. Table 4 and Table 5 report the p-values for each tested distribution, allowing for a comparative ranking of their performance.
The distribution fitting analysis for water quality parameters on the CR indicates that no single distribution consistently outperforms the others across all variables. The Weibull distribution shows the best overall performance, achieving the highest p-values for parameters such as b E C (p = 0.532), b T O C (p = 0.779), E M C T O C (p = 0.920), and EC (p = 0.941). The Lognormal distribution provides the best fit for M T O C (p = 0.979) and pH (p = 0.863), while also ranking among the top three for several other parameters. The Gamma and Normal distributions yield moderate p-values and are competitive fits for most variables, but generally rank below Weibull and Lognormal. In contrast, the Exponential distribution consistently performs poorly, with low p-values for all parameters, indicating it is not suitable for modeling the distribution of runoff quality parameters from the CR.
For the GR, the goodness-of-fit analysis (Table 5) reveals that the Normal distribution performs particularly well for some parameters, achieving the highest p-values for E M C T O C (p = 0.999) and pH (p = 0.788). However, no single distribution consistently outperforms across all variables. The Lognormal distribution shows the best fit for M T O C (p = 0.503) and b E C (p = 0.420), while the Weibull distribution provides the best fit for b T O C (p = 0.680) and EC (p = 0.735). These results indicate that both Lognormal and Weibull are effective in modeling certain aspects of TOC and conductivity in GR runoff. The Gamma and Normal distributions offer competitive but generally lower p-values. As in the case of the CR, the Exponential distribution performs poorly, with p-values near zero for most parameters, indicating an inadequate fit for GR runoff data.
While the goodness-of-fit analysis provides valuable insights into the statistical behavior of runoff quality parameters, it is essential to acknowledge the limitations of this study. The results are based on a single GR design and a specific set of water quality parameters, which may not fully capture the variability found in other green infrastructure configurations or environmental settings. These constraints underscore the importance of extending this type of analysis to a broader range of GR designs, climates, and pollutant profiles to validate and refine the applicability of these statistical models.
Despite these limitations, the findings underscore the relevance of selecting appropriate statistical distributions to characterize pollutant behavior and runoff variability in both CRs and GRs. For the CR, the Lognormal and Weibull distributions emerged as the most effective for modeling key parameters such as TOC and EC. In contrast, for the GR, no single distribution dominated across all variables; rather, the Normal, Lognormal, and Weibull distributions each demonstrated superior performance depending on the parameter evaluated. These results support the adoption of flexible, parameter-specific modeling approaches to accurately represent the complex hydrological and water quality dynamics of GRs. Such tailored strategies are essential for optimizing GR design and performance, ultimately contributing to more effective stormwater management and pollutant retention in urban environments.

4. Conclusions

This study assessed the water quality impacts of runoff from an aged GR and a CR, focusing on TOC, pH, and EC, while also characterizing the probabilistic distribution of these parameters. Although the GR exhibited higher TOC and EC levels, its runoff remained within acceptable limits and demonstrated buffering capacity that may help mitigate acid-rain effects. Over time, substrate aging appeared to reduce TOC leaching, supporting the long-term viability of GRs for diffuse pollution control.
A key distinction was observed in the pollutant release patterns: the GR exhibited gradual leaching, whereas the CR showed a pronounced first-flush effect. This suggests that GR may help attenuate peak pollutant loads during frequent, low-intensity rainfall events. However, the persistent leaching of organic matter from the GR poses challenges for rainwater harvesting and reuse.
Statistical analysis revealed that GR runoff quality parameters followed Normal, Lognormal, and Weibull distributions, while CR runoff aligned more consistently with Lognormal and Weibull distributions. These results highlight the need for tailored statistical models in the design of stormwater treatment systems.
Overall, the study reinforces the dual role of GRs as both sources and sinks of pollutants, contingent on rainfall characteristics. While GRs contribute positively to urban stormwater management, optimizing substrate composition and implementing post-runoff treatment strategies are necessary to reduce long-term pollutant export.
This study is limited by its focus on a single GR design and a narrow set of water quality parameters, which may constrain the generalizability of the findings. Future research should explore diverse roof configurations, substrate types, and maintenance practices; monitor a broader range of pollutants; and consider watershed-scale assessments. Additionally, investigating treatment needs for rainwater reuse and modeling pollutant behavior under varying climatic conditions will be essential for advancing the effective implementation of green infrastructure in urban environments.

Author Contributions

Conceptualization, T.M.O.; methodology, T.M.O. and J.R.S.M.; software, T.M.O. and J.R.S.M.; validation, T.M.O., M.C.S.P. and J.R.S.M.; formal analysis, T.M.O.; investigation, T.M.O.; resources, J.R.S.M. and B.C.C.L.; data curation, T.M.O.; writing—original draft preparation, T.M.O. and M.C.S.P.; writing—review and editing, M.C.S.P. and J.R.S.M.; visualization, T.M.O. and M.C.S.P.; supervision, J.R.S.M. and B.C.C.L.; project administration, J.R.S.M.; funding acquisition, J.R.S.M. and B.C.C.L. All authors have read and agreed to the published version of the manuscript.

Funding

This research was funded by the University of Sao Paulo/FCTH, grant number Conv. #1014756, and the APC was funded by FCTH.

Data Availability Statement

The raw data supporting the conclusions of this article will be made available by the authors on request.

Acknowledgments

The authors gratefully acknowledge the research support provided by the Hydraulic Technological Center Foundation (FCTH) and the city of Sao Jose dos Campos.

Conflicts of Interest

The authors declare no conflicts of interest.

References

  1. Maniquiz-Redillas, M.; Robles, M.E.; Cruz, G.; Reyes, N.J.; Kim, L.H. First Flush Stormwater Runoff in Urban Catchments: A Bibliometric and Comprehensive Review. Hydrology 2022, 9, 63. [Google Scholar] [CrossRef]
  2. Meng, F.; Yuan, Q.; Bellezoni, R.A.; Puppim de Oliveira, J.A.; Hu, Y.; Jing, R.; Liu, G.; Yang, Z.; Seto, K.C. The Food-Water-Energy Nexus and Green Roofs in Sao Jose Dos Campos, Brazil, and Johannesburg, South Africa. NPJ Urban Sustain. 2023, 3, 12. [Google Scholar] [CrossRef]
  3. Kumar, S.; Kumar Vishwakarma, R.; Kumar Tyagi, V.; Kumar, V.; Kazmi, A.A.; Ghosh, N.C.; Sasidharan, S.; Nayak, P.C.; Maurya, N.S.; Hasan, R.; et al. Stormwater Runoff Characterization and Adaptation of Best Management Practices under Urbanization and Climate Change Scenarios. J. Hydrol. 2024, 635, 131231. [Google Scholar] [CrossRef]
  4. Stovin, V.; Vesuviano, G.; Kasmin, H. The Hydrological Performance of a Green Roof Test Bed under UK Climatic Conditions. J. Hydrol. 2012, 414–415, 148–161. [Google Scholar] [CrossRef]
  5. Li, Y.; Liu, J. Green Roofs in the Humid Subtropics: The Role of Environmental and Design Factors on Stormwater Retention and Peak Reduction. Sci. Total Environ. 2023, 858, 159710. [Google Scholar] [CrossRef] [PubMed]
  6. Farah, G.; Pérez, G.; Ballesta, A.; El Bachawati, M. Green Roof Substrates Influencing the Provision of Ecosystem Services: A Review. J. Environ. Chem. Eng. 2024, 12, 114795. [Google Scholar] [CrossRef]
  7. Chapelle, F. Dissolved Organic Carbon in Groundwater Systems; Groundwater Project: Toronto, ON, Canada, 2022; ISBN 9781774700167. [Google Scholar]
  8. Müller, A.; Österlund, H.; Marsalek, J.; Viklander, M. The Pollution Conveyed by Urban Runoff: A Review of Sources. Sci. Total Environ. 2020, 709, 136125. [Google Scholar] [CrossRef]
  9. Aguilar-Torrejón, J.A.; Balderas-Hernández, P.; Roa-Morales, G.; Barrera-Díaz, C.E.; Rodríguez-Torres, I.; Torres-Blancas, T. Relationship, Importance, and Development of Analytical Techniques: COD, BOD, and, TOC in Water—An Overview through Time. SN Appl. Sci. 2023, 5, 118. [Google Scholar] [CrossRef]
  10. CETESB. Relação Entre Carbono Orgânico Total e Demanda Bioquímica de Oxigênio na Avaliação da Qualidade das Águas Dos Corpos Hídricos do Estado de São Paulo. Available online: https://cetesb.sp.gov.br/aguas-interiores/wp-content/uploads/sites/12/2024/04/Relacao-entre-Carbono-Organico-Total-e-Demanda-Bioquimica-de-Oxigenio-na-Avaliacao-da-Qualidade-das-Aguas-dos-Corpos-Hidricos-do-Estado-de-Sao-Paulo.pdf (accessed on 16 May 2025).
  11. Hanumesh, M.; Claverie, R.; Séré, G. A Roof of Greenery, but a Sky of Unexplored Relations—Meta-Analysis of Factors and Properties That Affect Green Roof Hydrological and Thermal Performances. Sustainability 2021, 13, 10017. [Google Scholar] [CrossRef]
  12. Meng, R.; Zhang, Q.; Li, D.; Wang, H. Influence of Substrate Layer Thickness and Biochar on the Green Roof Capacity to Intercept Rainfall and Reduce Pollution in Runoff. Polish J. Environ. Stud. 2021, 30, 4085–4103. [Google Scholar] [CrossRef]
  13. Lim, H.S.; Segovia, E.; Ziegler, A.D. Water Quality Impacts of Young Green Roofs in a Tropical City: A Case Study from Singapore. Blue-Green Syst. 2021, 3, 145–163. [Google Scholar] [CrossRef]
  14. Harper, G.E.; Limmer, M.A.; Showalter, W.E.; Burken, J.G. Nine-Month Evaluation of Runoff Quality and Quantity from an Experiential Green Roof in Missouri, USA. Ecol. Eng. 2015, 78, 127–133. [Google Scholar] [CrossRef]
  15. Iqbal, H.; Garcia-Perez, M.; Flury, M. Effect of Biochar on Leaching of Organic Carbon, Nitrogen, and Phosphorus from Compost in Bioretention Systems. Sci. Total Environ. 2015, 521–522, 37–45. [Google Scholar] [CrossRef] [PubMed]
  16. Allory, V.; Séré, G.; Ouvrard, S. A Meta-Analysis of Carbon Content and Stocks in Technosols and Identification of the Main Governing Factors. Eur. J. Soil Sci. 2022, 73, e13141. [Google Scholar] [CrossRef]
  17. Thebuwena, A.C.H.J.; Samarakoon, S.M.S.M.K.; Ratnayake, R.M.C. On the Necessity for Improving Water Efficiency in Commercial Buildings: A Green Design Approach in Hot Humid Climates. Water 2024, 16, 2396. [Google Scholar] [CrossRef]
  18. Berndtsson, J.C.; Bengtsson, L.; Jinno, K. First Flush Effect from Vegetated Roofs during Simulated Rain Events. Hydrol. Res. 2008, 39, 171–179. [Google Scholar] [CrossRef]
  19. Bliss, D.J.; Neufeld, R.D.; Ries, R.J. Storm Water Runoff Mitigation Using a Green Roof. Environ. Eng. Sci. 2009, 26, 407–418. [Google Scholar] [CrossRef]
  20. Mendez, C.B.; Klenzendorf, J.B.; Afshar, B.R.; Simmons, M.T.; Barrett, M.E.; Kinney, K.A.; Kirisits, M.J. The Effect of Roofing Material on the Quality of Harvested Rainwater. Water Res. 2011, 45, 2049–2059. [Google Scholar] [CrossRef]
  21. Bertrand-Krajewski, J.L.; Chebbo, G.; Saget, A. Distribution of Pollutant Mass vs Volume in Stormwater Discharges and the First Flush Phenomenon. Water Res. 1998, 32, 2341–2356. [Google Scholar] [CrossRef]
  22. Perera, T.; McGree, J.; Egodawatta, P.; Jinadasa, K.B.S.N.; Goonetilleke, A. New Conceptualisation of First Flush Phenomena in Urban Catchments. J. Environ. Manage. 2021, 281, 111820. [Google Scholar] [CrossRef]
  23. Strecker, B.E.W.; Quigley, M.M.; Member, A.; Urbonas, B.R.; Jones, J.E.; Clary, J.K. Determining Urban Storm Water BMP Effecttiveness. J. Water Resour. Plan. Manag. 2001, 127, 144–149. [Google Scholar] [CrossRef]
  24. Dirckx, G.; Vinck, E.; Kroll, S. Stochastic Determination of Combined Sewer Overflow Loads for Decision-Making Purposes and Operational Follow-Up. Water 2022, 14, 1635. [Google Scholar] [CrossRef]
  25. Ekwule, O.R.; Agunwamba, J.C. Application of the NRCS-Curve Number Method in Humid Tropical Basins of Southeastern Nigeria: A Statistical Analysis. Environ. Syst. Res. 2024, 13, 52. [Google Scholar] [CrossRef]
  26. Alvares, C.A.; Stape, J.L.; Sentelhas, P.C.; De Moraes Gonçalves, J.L.; Sparovek, G. Köppen’s Climate Classification Map for Brazil. Meteorol. Zeitschrift 2013, 22, 711–728. [Google Scholar] [CrossRef]
  27. INMET. Climatological Normals of Brazil 1991–2020. Available online: https://portal.inmet.gov.br/normais (accessed on 16 May 2025).
  28. Pereira-Flores, M.E.; Justino, F.; Rodrigues, J.M.; Boehringer, D.; Melo, A.A.M.; Cursi, A.G.; da Costa Pereira, V.; Pereira, O.G.; Ruiz-Vera, U.M. Seasonal Climate Impact on Brazilian Pasture (Brachiaria Brizantha Cv Marandu): Growth Rate, CO2 Efflux, and Irrigation Strategies. Theor. Appl. Climatol. 2023, 151, 651–666. [Google Scholar] [CrossRef]
  29. Ferraz, I.L. The Thermal Performance of Green Roof System in Comparison to the Traditional Ceramic Tile Roof System. Master’s Thesis, University of Sao Paulo, Sao Paulo, Brazil, 2012. [Google Scholar]
  30. Osawa, T.M.; Pereira, M.C.S.; Martins, J.R.S. Error Processing of Water Level Data Measurements by a Low-Cost Ultrasonic Sensor. In Proceedings of the 17th IWA Conference on Small Water and Wastewater Systems (SWWS) and 9th IWA Conference on Resource Oriented Sanitation (ROS), Curitiba, Brazil, 10–14 November 2024; p. 4. [Google Scholar]
  31. Osawa, T.M.; Pereira, M.C.S.; Leite, B.C.C.; Martins, J.R.S. Low-Cost Diffuse Pollution Monitoring System for Nature-Based Solutions. In Proceedings of the XV Encontro Nacional de Águas Urbanas; ABRH: Recife, Brazil, 2024; pp. 1–10. [Google Scholar]
  32. Saget, A.; Chebbo, G.; Bertrand-Krajewski, J.-L. The First Flush in Sewer Systems. Water Sci. Technol. 1996, 33, 101–108. [Google Scholar] [CrossRef]
  33. Pessoa, J.O.; Piccilli, D.G.A.; Persch, C.G.; Tassi, R.; Georgin, J.; Franco, D.S.P.; Yamil, Y.L. Identifying Potential Uses for Green Roof Discharge Based on Its Physical–Chemical-Microbiological Quality. Environ. Sci. Pollut. Res. 2024, 31, 27221–27239. [Google Scholar] [CrossRef] [PubMed]
  34. Buffam, I.; Mitchell, M.E.; Durtsche, R.D. Environmental Drivers of Seasonal Variation in Green Roof Runoff Water Quality. Ecol. Eng. 2016, 91, 506–514. [Google Scholar] [CrossRef]
  35. Ouellet, V.; Khamis, K.; Croghan, D.; Hernandez Gonzalez, L.M.; Rivera, V.A.; Phillips, C.B.; Packman, A.I.; Miller, W.M.; Hawke, R.G.; Hannah, D.M.; et al. Green Roof Vegetation Management Alters Potential for Water Quality and Temperature Mitigation. Ecohydrology 2021, 14, e2321. [Google Scholar] [CrossRef]
  36. Zhang, Q.; Miao, L.; Wang, X.; Liu, D.; Zhu, L.; Zhou, B.; Sun, J.; Liu, J. The Capacity of Greening Roof to Reduce Stormwater Runoff and Pollution. Landsc. Urban Plan. 2015, 144, 142–150. [Google Scholar] [CrossRef]
  37. Bouzouidja, R.; Rousseau, G.; Galzin, V.; Claverie, R.; Lacroix, D.; Séré, G. Green Roof Ageing or Isolatic Technosol’s Pedogenesis? J. Soils Sediments 2018, 18, 418–425. [Google Scholar] [CrossRef]
  38. Zhang, W.; Tao, K.; Sun, H.; Che, W. Influence of Urban Runoff Pollutant First Flush Strength on Bioretention Pollutant Removal Performance. Water Sci. Technol. 2022, 86, 1478–1495. [Google Scholar] [CrossRef] [PubMed]
  39. Gnecco, I.; Palla, A.; Lanza, L.G.; La Barbera, P. The Role of Green Roofs as a Source/Sink of Pollutants in Storm Water Outflows. Water Resour. Manag. 2013, 27, 4715–4730. [Google Scholar] [CrossRef]
  40. Xiong, W.; Li, J.; Wang, H.; Wu, Y.; Li, D.; Xue, J. Biochar Addition and the Runoff Quality of Newly Constructed Green Roofs: A Field Study. Sustainability 2023, 15, 4081. [Google Scholar] [CrossRef]
  41. ABNT NBR 15.527:2007; Rainwater—Catchment of roofs in urban areas for non-potable purposes—Requirements. Brazilian Technical Standards Association: Sao Paolo, Brazil, 2007.
  42. Sosa Echeverría, R.; Alarcón Jiménez, A.L.; Torres Barrera, M.d.C.; Sánchez Alvarez, P.; Granados Hernandez, E.; Vega, E.; Jaimes Palomera, M.; Retama, A.; Gay, D.A. Nitrogen and Sulfur Compounds in Ambient Air and in Wet Atmospheric Deposition at Mexico City Metropolitan Area. Atmos. Environ. 2023, 292, 119411. [Google Scholar] [CrossRef]
  43. Santana, T.C.; Guiselini, C.; Cavalcanti, S.D.L.; Silva, M.V.d.; Vigoderis, R.B.; Santos Júnior, J.A.; Moraes, A.S.; Jardim, A.M.d.R.F. Quality of Rainwater Drained by a Green Roof in the Metropolitan Region of Recife, Brazil. J. Water Process Eng. 2022, 49, 102953. [Google Scholar] [CrossRef]
  44. Gomes, Y.R.M.; dos Santos, S.M.; de Macedo, P.M.T. Effects of Ecological Roofs in Water Quality: An Experimental Study over a Humid Tropical Climate. Sustain. Water Resour. Manag. 2023, 9, 17. [Google Scholar] [CrossRef]
  45. Ekanayake, D.; Aryal, R.; Hasan Johir, M.A.; Loganathan, P.; Bush, C.; Kandasamy, J.; Vigneswaran, S. Interrelationship among the Pollutants in Stormwater in an Urban Catchment and First Flush Identification Using UV Spectroscopy. Chemosphere 2019, 233, 245–251. [Google Scholar] [CrossRef]
  46. Gao, Z.; Zhang, Q.; Wang, Y.; Dzakpasu, M.; Wang, X.C. Contaminant Distribution and Migration in Roofing Rainwater: Implications for Sustainable Utilization and Pollution Control. J. Water Process Eng. 2024, 61, 105298. [Google Scholar] [CrossRef]
  47. Oduber, F.; Calvo, A.I.; Blanco-Alegre, C.; Castro, A.; Alves, C.; Cerqueira, M.; Lucarelli, F.; Nava, S.; Calzolai, G.; Martin-Villacorta, J.; et al. Towards a Model for Aerosol Removal by Rain Scavenging: The Role of Physical-Chemical Characteristics of Raindrops. Water Res. 2021, 190, 116758. [Google Scholar] [CrossRef]
  48. Gmach, M.R.; Cherubin, M.R.; Kaiser, K.; Cerri, C.E.P. Processes That Influence Dissolved Organic Matter in the Soil: A Review. Sci. Agric. 2020, 77, e20180164. [Google Scholar] [CrossRef]
  49. De Buyck, P.J.; Van Hulle, S.W.H.; Dumoulin, A.; Rousseau, D.P.L. Roof Runoff Contamination: A Review on Pollutant Nature, Material Leaching and Deposition; Springer: Dordrecht, The Netherlands, 2021; Volume 20, ISBN 0123456789. [Google Scholar]
  50. Zhang, Q.; Liu, W.; Gao, Z.; Geng, J.; Dzakpasu, M.; Wang, X.C. Advanced Treatment of First Flush Roof Runoff via a Dry-Wet Polymorphic Constructed Wetland System: Performance and Mechanistic Insights. Environ. Res. 2025, 269, 120918. [Google Scholar] [CrossRef]
  51. Boonrit, K.; Anusontpornperm, S.; Thanachit, S.; Jindaluang, W. Fractionated Organic Carbon in Relation to Soil Aggregates and Other Soil Properties in Humid, Tropical Lowland, Salt-Affected Soils. Agric. Nat. Resour. 2024, 58, 111–128. [Google Scholar] [CrossRef]
  52. McCabe, K.M.; Smith, E.M.; Lang, S.Q.; Osburn, C.L.; Benitez-Nelson, C.R. Particulate and Dissolved Organic Matter in Stormwater Runoff Influences Oxygen Demand in Urbanized Headwater Catchments. Environ. Sci. Technol. 2021, 55, 952–961. [Google Scholar] [CrossRef] [PubMed]
  53. Morgan, D.; Johnston, P.; Osei, K.; Gill, L. The Influence of Particle Size on the First Flush Strength of Urban Stormwater Runoff. Water Sci. Technol. 2017, 76, 2140–2149. [Google Scholar] [CrossRef] [PubMed]
  54. Zhang, W.; Qu, P.; Sun, H.; Che, W. Assessing the Characteristics of Different-Sized Particles in the First Flush of Roof Runoff. Water Sci. Technol. 2023, 87, 2265–2276. [Google Scholar] [CrossRef]
  55. Charlebois, B.; Wittbold, P.; Reckhow, D.; Kumpel, E. Effective First Flush Volumes in Experimental Household-Scale Rainwater Catchment Systems. Aqua Water Infrastructure, Ecosyst. Soc. 2023, 72, 814–826. [Google Scholar] [CrossRef]
Figure 1. Flowchart summarizing the experimental design and methodology, including rainfall and runoff monitoring, water quality sampling, and statistical analyses of pollutant dynamics and distribution patterns.
Buildings 15 01763 g001
Figure 2. Plan views of a green roof (GR) and a conventional roof (CR), showing their respective dimensions, slopes, and drainage layout. The schematic of the GR also illustrates the functional layers, including material composition and thicknesses (source: by the authors).
Buildings 15 01763 g002
Figure 3. Monitored rainfall events showing rainfall depth (blue), GR runoff depth (orange), and CR runoff depth (gray).
Buildings 15 01763 g003
Figure 4. Schematic representation of the data collection methodology applied to both prototypes, including water quantity and quality monitoring procedures and the types of data generated.
Buildings 15 01763 g004
Figure 5. Comparison of the distribution of water quality parameters between the GR and the CR using boxplots.
Buildings 15 01763 g005
Figure 6. Relationship between rainfall depth and TOC mass released in runoff from the GR.
Buildings 15 01763 g006
Figure 7. Relationship between GR hydrological retention and mass removal efficiency per event (1 M G R M C R ). Positive efficiency values indicate that the GR acted as a sink for TOC, whereas negative values suggest that the GR functioned as a source of TOC compared with the CR.
Buildings 15 01763 g007
Figure 8. Relationship between the EMC of water quality parameters in runoff from the GR and the CR, including the coefficient of determination between variables.
Buildings 15 01763 g008aBuildings 15 01763 g008b
Figure 9. Dimensionless curves for TOC and EC in rainfall events monitored at the GR.
Buildings 15 01763 g009
Figure 10. Dimensionless curves for TOC and EC in rainfall events monitored at the CR.
Buildings 15 01763 g010
Table 1. Classification of parameter b values into zones based on the relationship between pollutant mass and runoff volume.
ZoneParameter b
1<0.185
20.185–0.862
30.862–1
41–1.159
51.159–1.539
6>5.395
Table 2. Comparison of water quality parameters between GRs and CRs, including total organic carbon (TOC) mass (mgC/m2), TOC concentration (mgC/L), electrical conductivity (EC) (μS/cm), and pH. The table shows average and median values for both roof types, GR/CR ratios, and p-values for statistical significance based on the Mann–Whitney–Wilcoxon test.
Water Quality ParametersGRCR G R / C R Mann–Whitney—Wilcoxon Test (GR × CR)
AverageMedianAverageMedianAverageMedianp-ValueDifference
M T O C ( m g C / m 2 ) 20213894782.11.80.004Yes
E M C T O C ( m g C / L ) 21.9221.965.675.123.94.30.000Yes
Electrical
Conductivity
( μ S / c m )
12213022175.57.60.000Yes
pH7.07.05.95.8--0.000Yes
Table 3. Distribution of EC and TOC across parameter b zones for the CR and the GR. The percentage values indicate the proportion of observations for EC and TOC within each b range, categorized by roof type.
ZoneParameter bCR GR
ECTOC ECTOC
1<0.1850%0%0%0%
20.185–0.86240% 36%0%0%
30.862–148% 40%53%29%
41–1.15912%20%47%71%
51.159–1.5390%4%0%0%
Table 4. Ranking of probability distributions according to Kolmogorov–Smirnov test p-values for runoff quality parameters in the CR. Distributions are ranked from best to worst fit based on p-value magnitude. Higher p-values indicate better goodness-of-fit. Abbreviations: Norm = Normal, Lognorm = Lognormal, Gamma = Gamma, Exp = Exponential, Weib = Weibull.
Conventional Roof
ParameterDistribution probability (p-values)
1st
(Best Fit)
2nd3rd4th5th
(Worst Fit)
b E C Weib (0.532) Norm (0.431)Gamma (0.411)Lognorm (0.409)Exp (0.000)
b T O C Weib (0.779) Norm (0.734)Gamma (0.501)Lognorm (0.389)Exp (0.000)
M T O C Lognorm (0.979)Gamma (0.902)Weib (0.763)Exp (0.359) Norm (0.235)
E M C T O C Weib (0.920)Norm (0.918)Gamma (0.880)Lognorm (0.871)Exp (0.202)
ECWeib (0.941) Gamma (0.930)Lognorm (0.760)Norm (0.623)Exp (0.330)
pHLognorm (0.863) Gamma (0.859)Norm (0.851)Weib (0.471)Exp (0.000)
Table 5. Ranking of probability distributions according to Kolmogorov–Smirnov test p-values for runoff quality parameters in the GR. Distributions are ranked from best to worst fit based on p-value magnitude. Higher p-values indicate better goodness-of-fit. Abbreviations: Norm = Normal, Lognorm = Lognormal, Gamma = Gamma, Exp = Exponential, Weib = Weibull.
Green Roof
ParameterDistribution probability (p-values)
1st
(Best Fit)
2nd3rd4th5th
(Worst Fit)
b E C Lognorm (0.420)Norm (0.391)Gamma (0.410)Weib (0.235)Exp (0.000)
b T O C Weib (0.680)Norm (0.350) Gamma (0.346)Lognorm (0.344)Exp (0.000)
M T O C Lognorm (0.503)Exp (0.340) Gamma (0.195)Weib (0.213)Norm (0.037)
E M C T O C Norm (0.999)Lognorm (0.998)Gamma (0.998)Weib (0.983)Exp (0.001)
ECWeib (0.735)Norm (0.602)Gamma (0.365)Lognorm (0.277)Exp (0.008)
pHNorm (0.788)Gamma (0.788)Lognorm (0.787)Weib (0.552)Exp (0.000)
Disclaimer/Publisher’s Note: The statements, opinions and data contained in all publications are solely those of the individual author(s) and contributor(s) and not of MDPI and/or the editor(s). MDPI and/or the editor(s) disclaim responsibility for any injury to people or property resulting from any ideas, methods, instructions or products referred to in the content.

