
Experimental and Explicit FE Studies on Flexural Behavior of Superposed Slabs


 and
and 
Abstract
1. Introduction
2. Overview of Physical Test
2.1. Concrete Mixture Proportion and Concrete Stress Strain Curve
- (1)
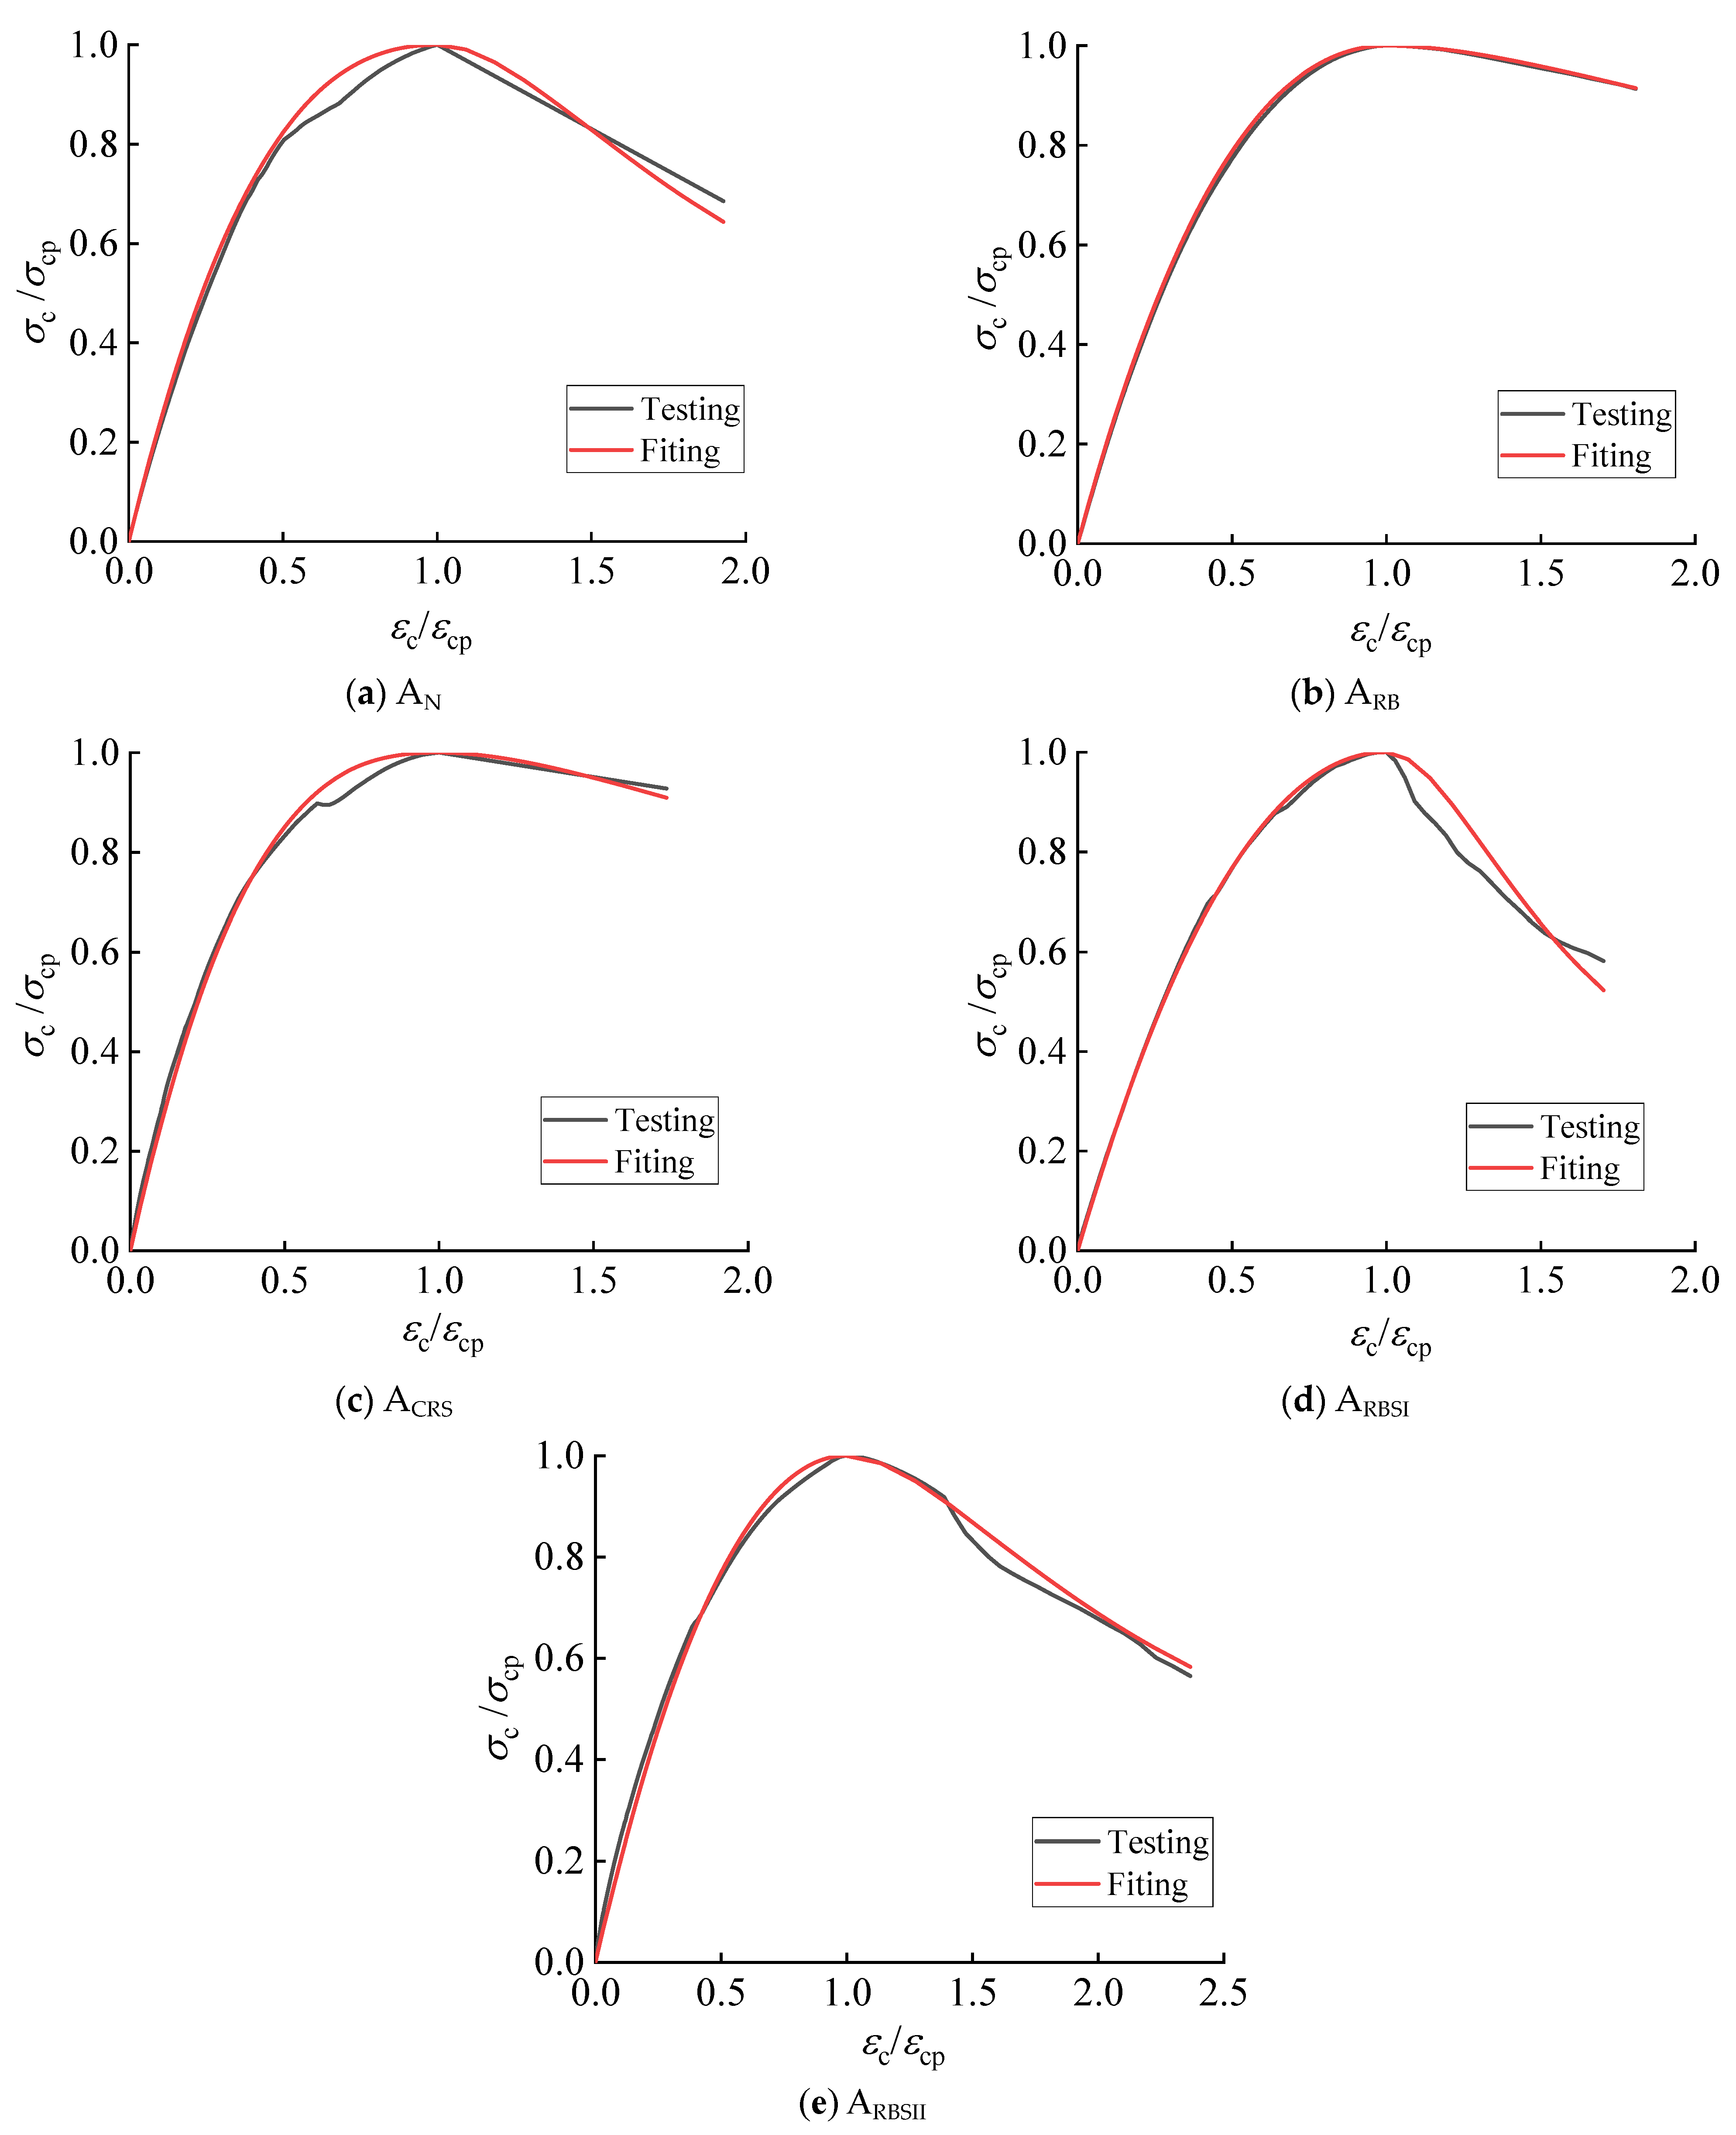
- testing curves. Four test curves were obtained for each type of material by uniaxial monotonic testing (refer to Figure 1), and the curves obtained after averaging are the ones labelled with the word “Testing” in Figure 2. The peak stress and the corresponding strain from each curve are tabulated in Table 2. Based on the (the superscript “i” is the wildcard denoting the mixing characteristic of the tested concrete), the compressive strength reduction index,was obtained for each type of concrete with the exception of ordinary concrete, as detailed in Table 2. The compressive strength reduction indexes of the four types of RMP concrete, along with the characteristics of the geometric shapes of the five testing curves clearly demonstrate that the uniaxial compressive performance of each RMP concrete studied closely aligns with that of ordinary concrete.
- (2)
- fitting curves. The testing curves were fitted using this stress-strain equationwhich is proposed by Guo [36]. In this equation, are the material coefficients to be fitted. Based on this fitting equation and the testing curve for each type of concrete, the values of and for each type were determined, as shown in Table 2, and the resulting fitted curves are labeled as “Fitting” in Figure 2. Each stress-strain relationship fitting function yields a coefficient of determination (), with a minimum value of 0.9908. This result demonstrates a highly accurate correlation between the models utilized in this study and the experimental data, thereby validating the reliability and robustness of the fitting functions.
2.2. Design of the Slab Specimens
- (1)
- (2)
- (3)
- The rebar configuration. Rebars were placed only during the fabrication of the prefabricated bottom layer, and their positions are detailed in Figure 3, and their level is the same as that of HRB400. The rebars can be categorized based on their functions into three types: longitudinal stressed rebars on the bottom of the precast layer (referred to as “l-rebar(s)” and indicated by blue lines in Figure 3), transverse unstressed rebars (indicated by green lines in Figure 3), and triangular rebar trusses each of which is composed of two bottom chord rebars, some web rebars, and a top chord rebar. The diameters and the mechanical properties of the abovementioned rebars are shown in Table 3.
- (4)
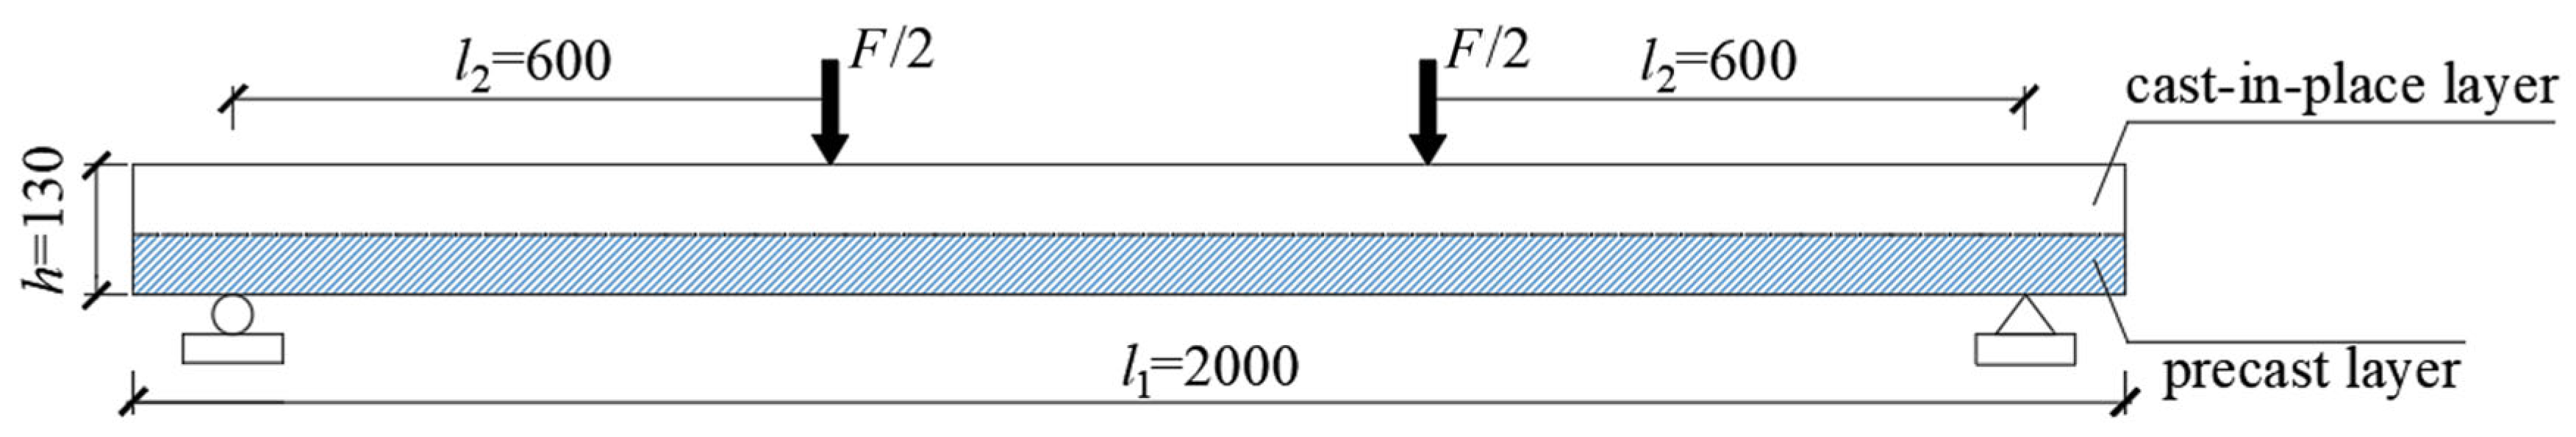
- The load-response law. The load-response law of all slabs is the same, with each slab being supported by two simple supports located on its bottom face, as depicted in Figure 4. Consequently, it is evident that the load-response law can be formulated using the same method applicable to simply supported members. Two symmetrically arranged and equally concentrated loads were applied on each studied slab, with their positions and other relevant details illustrated in Figure 4.

2.3. Testing Equipment, Measuring-Point Arrangement, and Loading Program
- (1)
- Testing equipment. Each studied slab was fixed on the supports within the reaction frame, as shown in Figure 5a. Two-point loading was applied with the help of a distribution steel beam, and the concentrated load was generated by a jack fixed to the top beam of the reaction frame.
- (2)
- Layout of the measuring points. During the test, data on the applied load and displacements in the thick direction were gathered. The load was measured using a force sensor positioned between the distribution beam and jack, as shown in Figure 5a. The collected displacements were measured using five dial gauges, with their positions shown in Figure 5b.
- (3)
- The loading program. The loading was performed using a load-displacement hybrid control loading scheme, which is divided into three sub-stages. ① During sub-stage I, the load was incrementally applied at about 10% of the cracking load until a specimen showed a visible crack. According to Figure 4, the bending cracking load can be calculated using the following formula: , where is the cracking moment. In this study, the determination of the cracking moment was based on the widely accepted assumption that concrete undergoes cracking when the tensile stress at the bottom-edge of the tension zone reaches the axial tensile strength , which can be determined using the plane section hypothesis regarding normal strain distribution. As proposed in the literature [37], the following formula,was adopted to estimate in this study, where is the axial compressive strength of the concrete. ② During sub-stage II, the commencement of which coincided with the appearance of a discernible crack, the load was increased incrementally by about 7% of the ultimate load until the total load was approximately 0.7. In addition, the ultimate load was calculated using the formula , where is the ultimate moment. The method for calculating can be found in a textbook on the fundamental principles of the concrete structure. The yield strength and the sectional area of l-rebars, both of which were used to calculate , are listed in Table 3, and the effective height of each slab . ③ During sub-stage III, whose starting point was the instant when , the loading style was switched to displacement control, and the load was increased incrementally, with each increment equaling about 30% of the mid-span displacement corresponding to , until the tested slab collapsed or the midspan deflection reached 1/50 of the calculated span length ). ④ The values of the two characteristic loads for all specimens can be calculated using the aforementioned methods, and as a result, yielding and , respectively, and it is worth noting that the cracking load of the BRBSII slabThe two values adopted to determine the consequent incremental loads for sub-stages I and II were estimated corresponding to the abovementioned two value ranges, as detailed in Table 4, where the controlled displacements for sub-stage III are also provided.
3. Overview of Simulation Experiment
3.1. Creation of FE Model
3.2. Discrete, Contact, and Boundary Settings
- (1)
- Element type determination. Slabs and steel pads were discretized using an eight-node linear incongruous element, whose number is C3D8I in the Abaqus element library, while the rebars were discretized using a 3D two-node linear element, whose number is T3D2.
- (2)
- Element size determination. Discretization was carried out through the utilization of a pertinent Graphical User Interface (GUI) labeled as “Global Seeds”. The detailed settings for all types of entities (concrete-zones, rebars, and steel pads) were the same as follows: the parameter “approximate global size” was set to 25 mm, the parameter “curvature control” was set to 0.1, and the item named minimum size control used a relative size mode with a value of 0.1.
- (3)
- Determination of the bonding performance between rebars and concrete. It was assumed that there was no bond slip between the rebars and concrete. Therefore, the “Embedded constraint” option was adopted to embed rebars within the concrete entities.
- (4)
- Determination of the contacting mode between the steel pad and the concrete entities. It was assumed that each region near a contact interface between a steel pad and its corresponding slab entity could be considered a continuous medium; consequently, the “Tie” constraint mode was employed to merge the contact interfaces.
- (5)
- Boundary condition determination. To simulate the boundary conditions, only the rotational freedom around the transverse direction was assigned to the bottom boundary surface of a slab near the right support, and both the rotational freedom around the transverse direction and translational freedom along the longitudinal direction were assigned to the bottom boundary surface near the left support. Figure 5b shows the specific details.
3.3. Constitutive Relationships
- (1)
- The concrete constitutive relationship in the regions near the concentrated forces (Region I, shown in red in Figure 6). The elastic constitutive relationship employed for the steel pads mentioned in the “(4)” below was assigned to Region I to prevent calculation of failure due to excessive stresses surpassing the predefined value of the adopted concrete damage constitutive relationship for the main body of the simulation slab.
- (2)
- The concrete constitutive relationship in regions except Region I. This relationship was formulated using the concrete damage plasticity model (CDP) developed by J. Lubliner (1989) et al. and J. Lee (1998) et al., which has been collected into the Abaqus material library [38,39,40]. CDP is widely utilized in structural simulations. Recent applications include its use in simulating the shear performance of concrete T-beams [41] and in modeling the collapse behavior of industrial roof systems [42]. According to references [29,40], the established parameters for determining the material behavior are limited to the following: initial (undamaged) elastic modulus and Poisson’s ratio ; ratio of initial equibiaxial yield stress to initial uniaxial compressive yield stress, and the ratio of the second stress invariant on the tensile meridian to that on the compressive meridian; eccentricity parameter , dilation angle factor , compressive stiffness recovery factor and tensile stiffness recovery factor ; viscosity parameter ; relation curve of uniaxial effective compressive cohesion stress to equivalent compressive plastic strain (- curve); and the relation curve of uniaxial effective tensile cohesion stress to equivalent tensile plastic strain (- curve). In this study, the values of these constitutive parameters were established as follows:
- ① The value of was determined by calculating the right derivative of the fitting curve at the point and the resulting value of for each type of concrete is listed in Table 2. Additionally, it is noted that the values of for all types of concrete were uniformly established at 0.2.
- ③ The value of was set to 0.005 for each type of concrete, as suggested in references [43,44]. Herein, it is worth noting that: firstly, in order to avoid potential convergence challenges arising from material softening, Abaqus offers the option of viscoplastic regularization of CDP constitutive equation when employing the implicit iterative algorithm to solve the FE equation set, and following this treatment, a viscosity coefficient is incorporated into the alternate stress-strain equation; secondly, the explicit algorithm was employed to approximate the solution of the FE equation set in this study, and unlike the implicit iterative algorithm, the explicit algorithm does not dictate convergence, leading us to believe that has no impact on simulation results. More comprehensive discussions on this topic are available in references [34,40].
- ④ When constructing - curve: the equivalent compressive plastic strainwhere is the material coefficient; the effective compressive cohesion stress . The functional relationship between and is shown in Equation (2) and Table 2. When doing quasi-static simulation, it is a common practice to adopt a simulation loading duration significantly shorter than the physical loading duration in order to reduce computational cost [45]. The duration utilized in this study is found in Section 3.4. During such an abbreviated simulation loading duration, there is naturally a great release of strain energy due to material strain softening. This released strain energy not only amplifies the inertia effect but also leads to unrealistic damage within the range of the inertia effect, ultimately resulting in unreasonable simulation results (Situation I). In order to mitigate the impact of Situation I as much as possible, in this study,was taken to reduce the amount of strain energy released.
- ⑤ Considering the fact that the influence caused by the tensile behavior of concrete on the simulation results, such as bearing capacity and cracking, is tiny, - curve, used in this study was determined based on the common values characterizing the properties of concrete under uniaxial monotonic loading, which are as follows: equivalent tensile plastic strain , where is a coefficient, and it was to take also to mitigate the impact of Situation I; uniaxial effective tensile cohesion stress . The functional relationship between and is in the following form suggested by the literature [36]where is the peak tensile stress and is the corresponding strain. In this study, the value of was determined using Equation (3), and was calculated as according to reference [36].
- (3)
- The constitutive relation of rebar. Before the slab fails, rebars within the slab typically exhibit either elastic or yield behavior, rather than strain-hardening behavior. Therefore, an ideal elastic-plastic model was selected to simulate the mechanical behaviors of rebars. The stress-strain curve of this model is represented aswhere denotes the rebar stress, is the corresponding strain, is the initial yield strain, is the elastic modulus, and is the yield stress. In this study, values for and for all types of rebars (depicted in Figure 3) are provided in Table 3; additionally, the Poison’s rates of them were uniformly established at 0.3.
- (4)
- The constitutive relation of the steel pad. According to the local influence principle, the impact of the selection of the constitutive model for the steel pads on the static behavior of a loaded slab is tiny, thus allowing for an assumption that the steel pads remain in a linear elastic state under static loading. The constitutive relation equation for this model iswhere is the Cauchy stress tensor, denotes the Cauchy strain tensor, and is the elastic stiffness tensor, which is dependent on both the elastic modulus and Poisson’s ratio . In this study, was set to 200 GPa and to 0.3.
3.4. Loading Strategy and Solving Algorithm Configuration
4. Results and Discussion
4.1. Time History Curve of Energy
- (1)
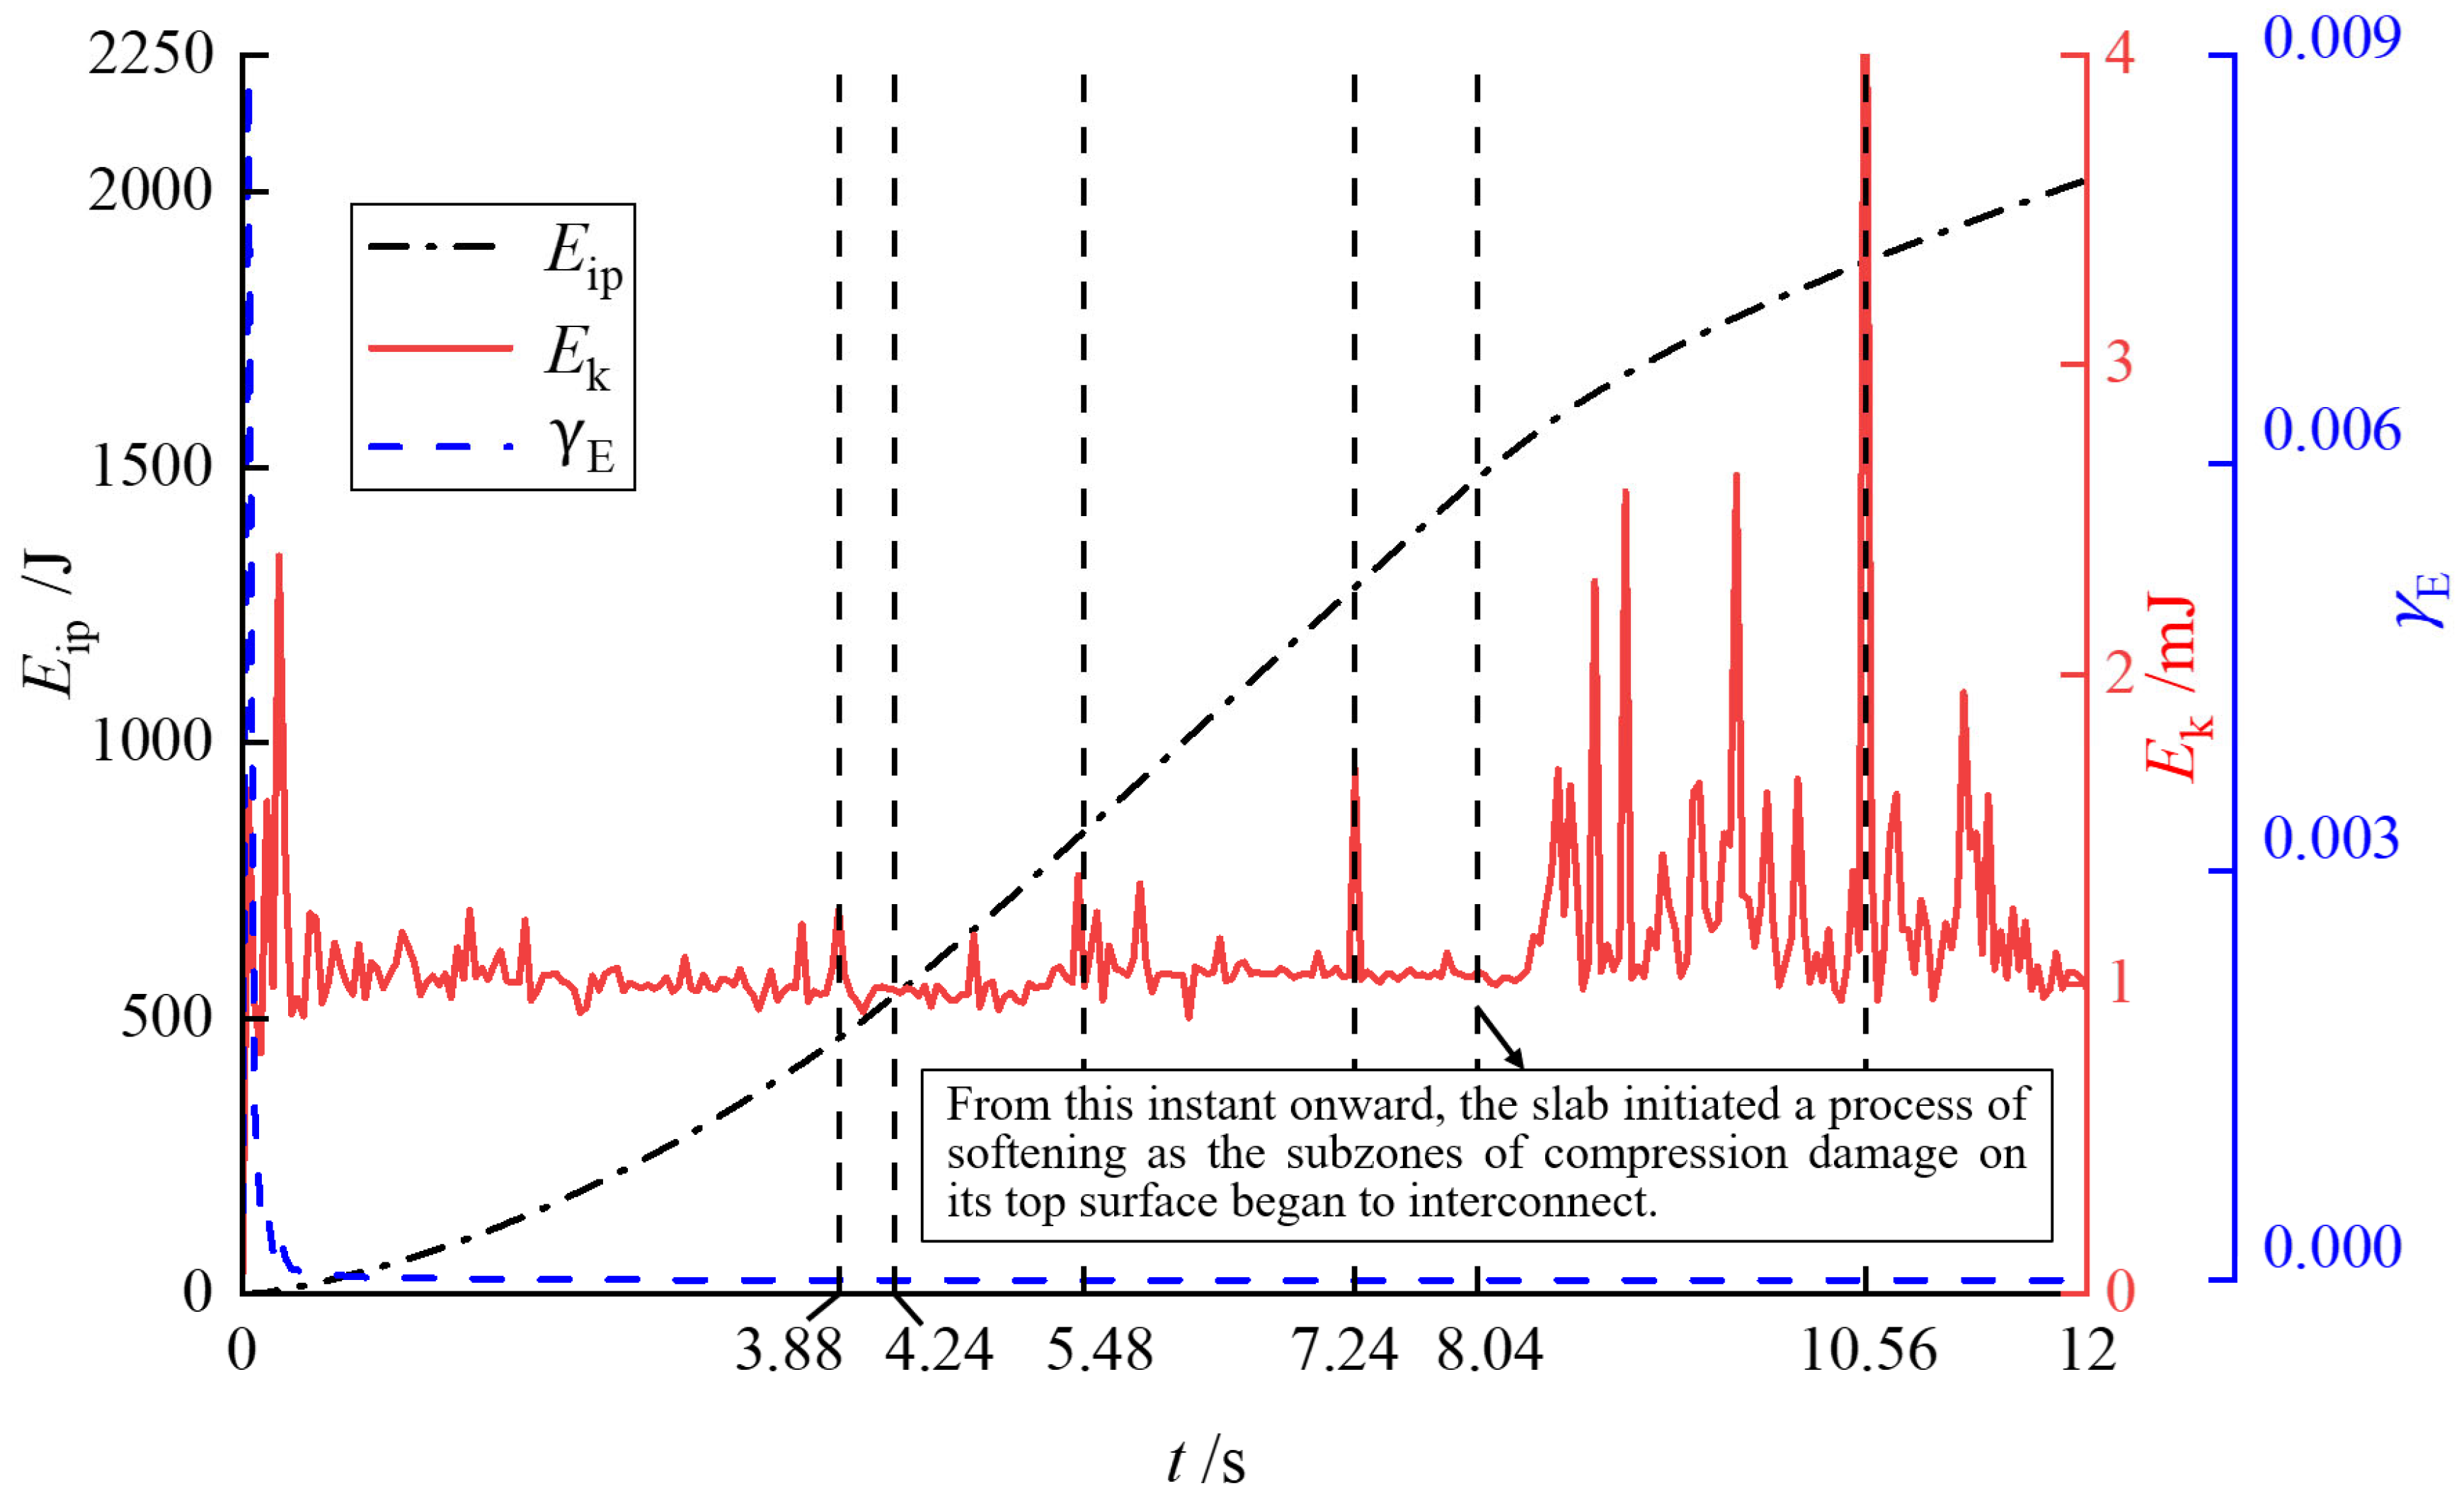
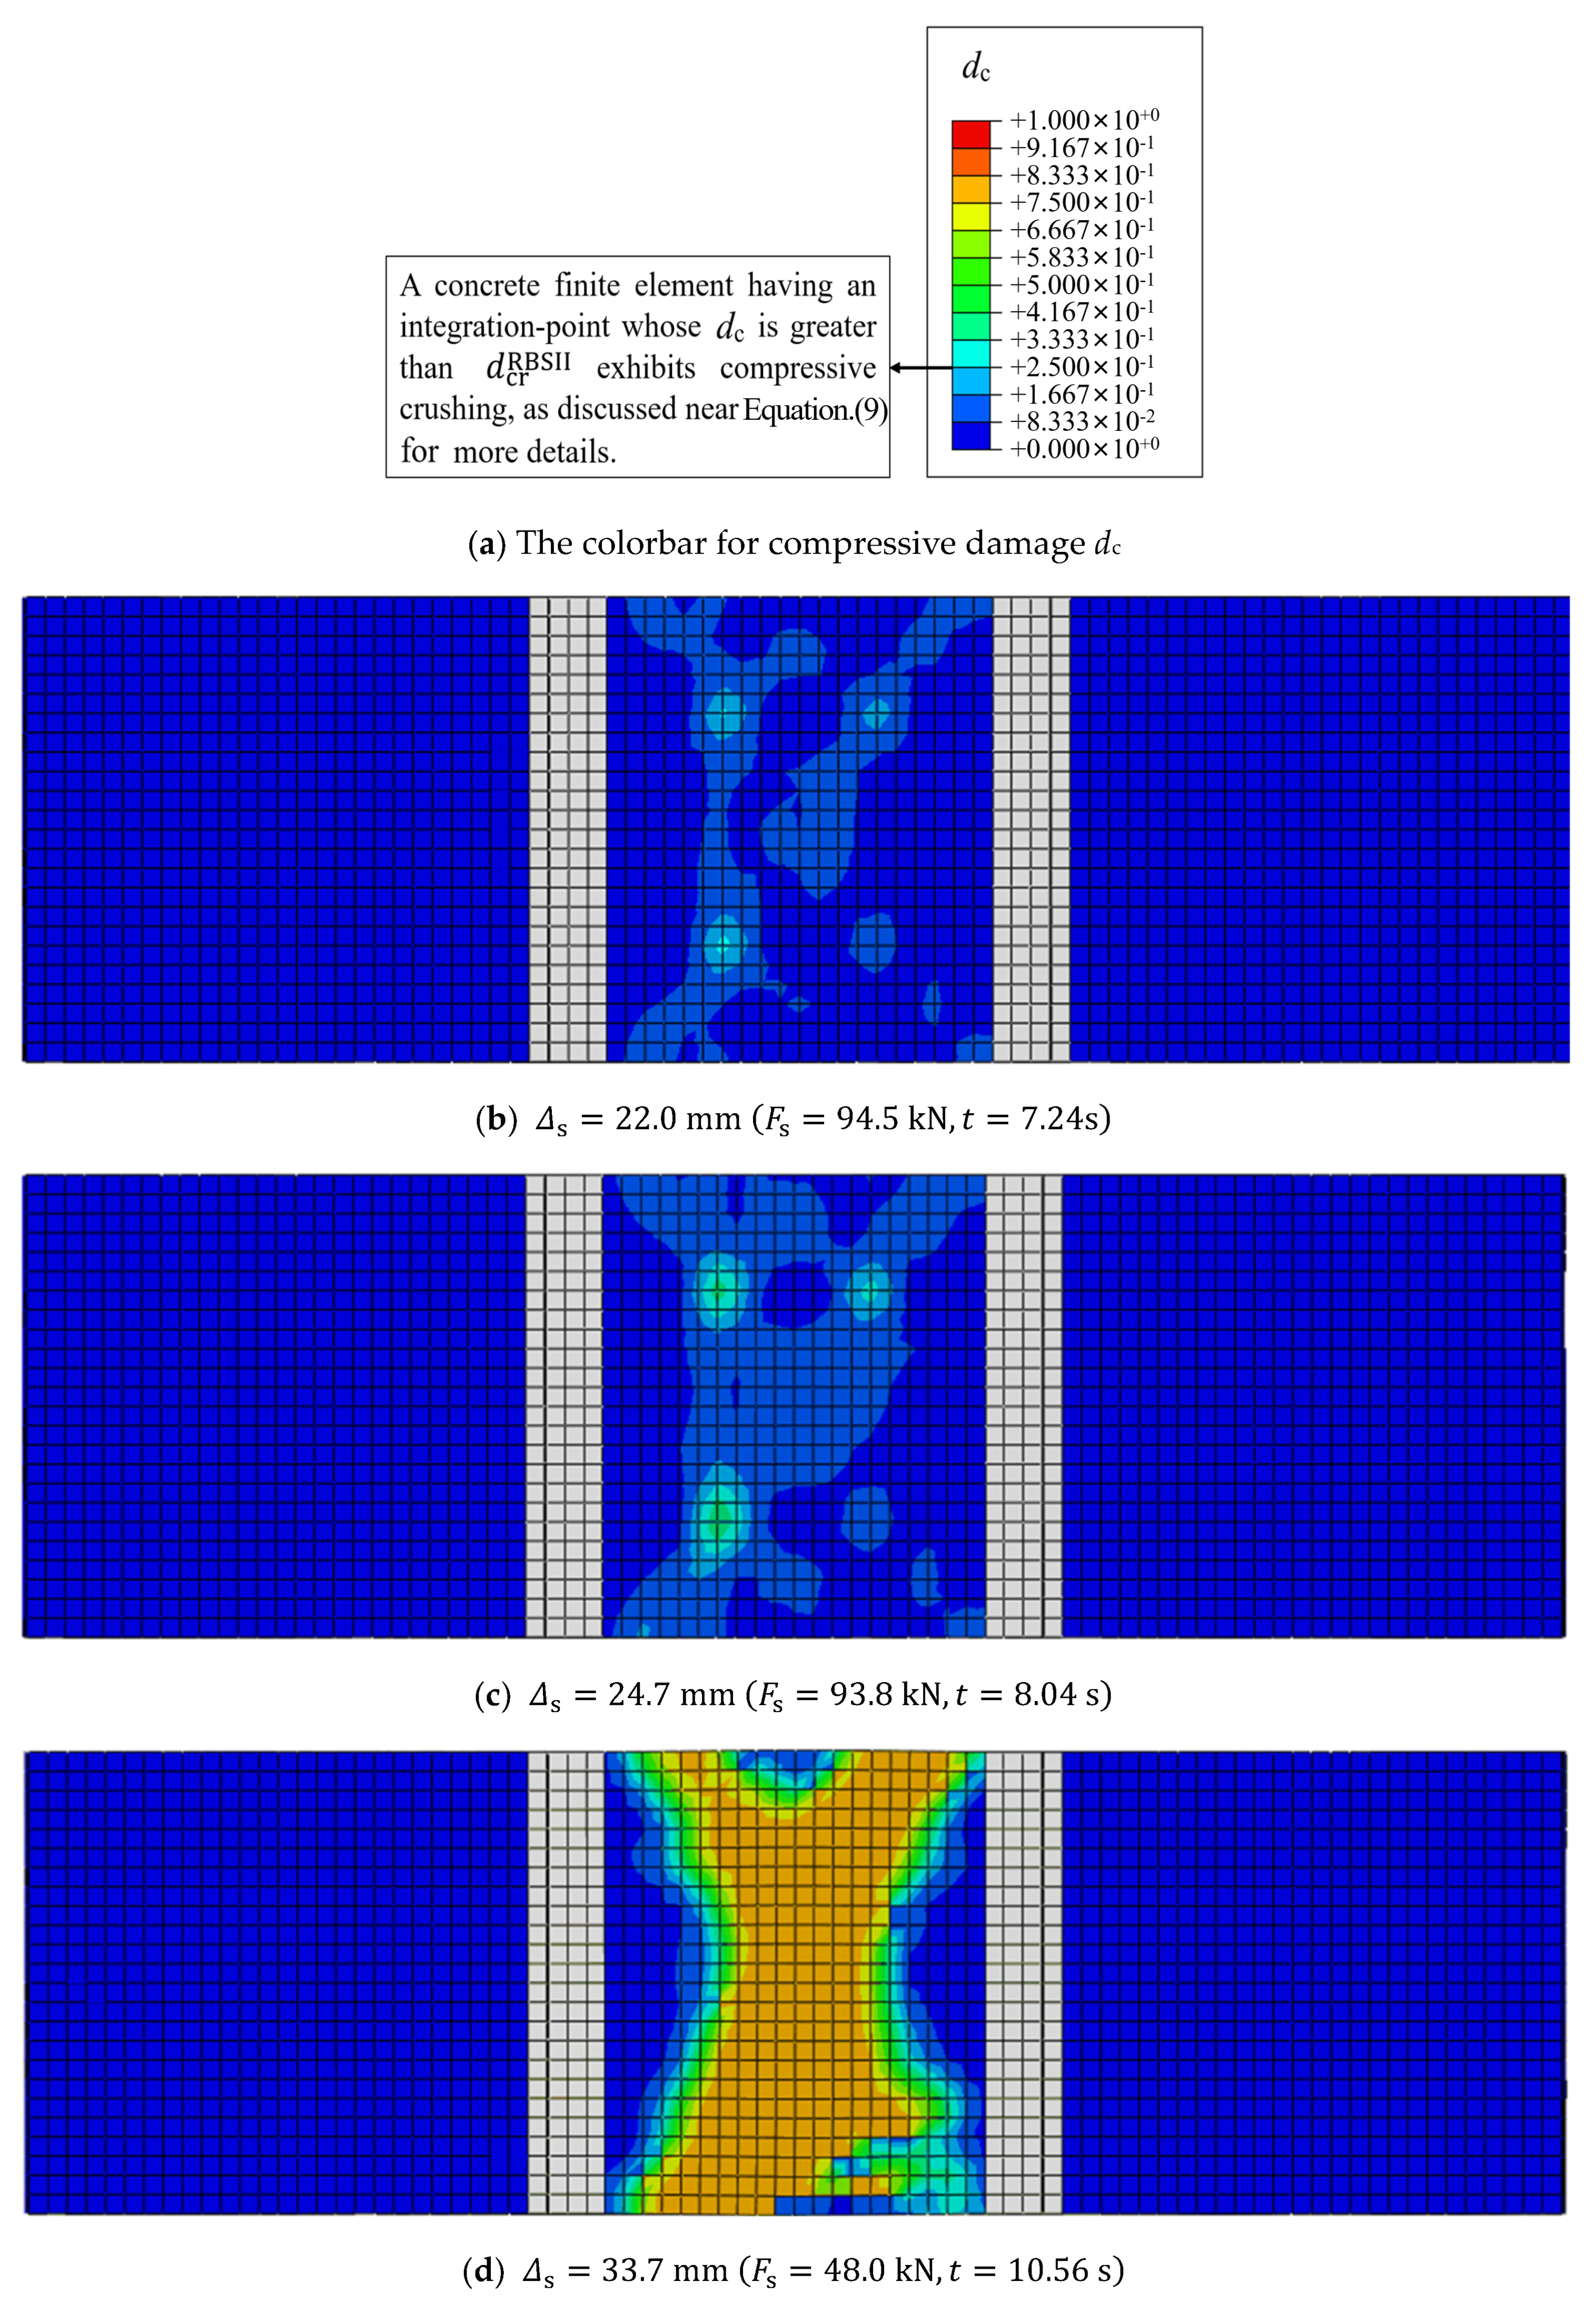
- The loading program adopted for the BRBSII slab and the cracking failure characteristics of the BRBSII slab can be reflected through the geometric characteristics of the and curves. ① According to the curve, it is evident that increases monotonically (Phenomenon A1) as a whole, with a higher rate in the time domain compared to the time domains and (Phenomenon A2). Similarly, analysis of the curve indicates a significant increase in noise intensity (Phenomenon B1) during , followed by a notable decrease in both amplitude and intensity of the noise (Phenomenon B2) within (Excluding the short time interval after the yielding of all l-rebars at , as detailed in Section 4.2.2), and ultimately culminating in a marked surge in both amplitude and intensity of the noise during (Phenomenon B3). It is clear that Phenomenon A1 confirms the loading program described in Section 3.4. ② BRBSII slab obviously underwent three mechanical processes. The first process denoted as Procedure C1 can be described as follows: the tensile zone on the bottom face of the studied slab (B-face), particularly in the pure bending section (see Figure 9b), would continuously experience cracking (see Section 4.2 below) due to the pronounced tensile brittleness of concrete, and as soon as a tensile crack emerged, the internal potential energy originally stored near this emerged crack dissipated irreversibly, accompanied by a natural conversion of to . The second process, denoted as Process C2, can be described as follows: the emerging frequency of fresh tensile cracks between two adjacent cracks had decreased gradually (see Section 4.2.2 below) due to the deformation localization effect at the cracks. The other process denoted as Process C3 can be described as follows: when crushing occurred on the top face of the studied slab (T-face), there was irreversible dissipation of , and it is evident that the strain energy released from crushing exceeded that released from tension cracking by a significant margin. ③ The evolution characteristics of damages formulated by Procedures C1, C2 and C3 can explain Phenomena A2, B1, B2 and B3. Specifically, as follows: firstly, Phenomenon A2 can be attributed to the fact that a greater amount of internal potential energy is dissipated through the frequent germination of tension fractures during the early loading period or compression fractures during the late period compared to the intermediate period; secondly, the emergence of a great numerous tension cracks in the initial phase causes a substantial and concentrated release of kinetic energy, naturally leading to the occurrence of Phenomenon B1; thirdly, Phenomenon B2 occurring during the intermediate phase attributes to both the reduced initiation of fresh cracks, leading to limited and intermittent release of kinetic energy, and the accelerated extending-rate of existing cracks in the thick direction within a short time interval following the yielding of all l-rebars, resulting in large and closely-spaced release of kinetic energy; lastly, the initiation of some fresh crushing areas caused by compression in the later stage, accompanied by the significant and concentrated release of kinetic energy, gives rise to Phenomenon B3.
- (2)
- The value-range characteristic of indicates that the BRBSII slab remained in a quasi-static state for the majority of the loading time. Analysis of the curve reveals thatduring the time interval , where is a slightly positive number greater than zero. And according to the quasi-static standard specified in reference [35], where ≤ 0.10, it can be concluded that the BRBSII slab was in a quasi-static state when . Consequently, it can be inferred that other results, presented in the subsequent sections, are statistically valid despite being produced by the explicit solver.
4.2. Cracking and Collapse of the Slab (Phenomena I) and Stress-Increasing Process of Longitudinal Rebars (Process II)
4.2.1. Phenomena I Given by Physical Test
- (1)
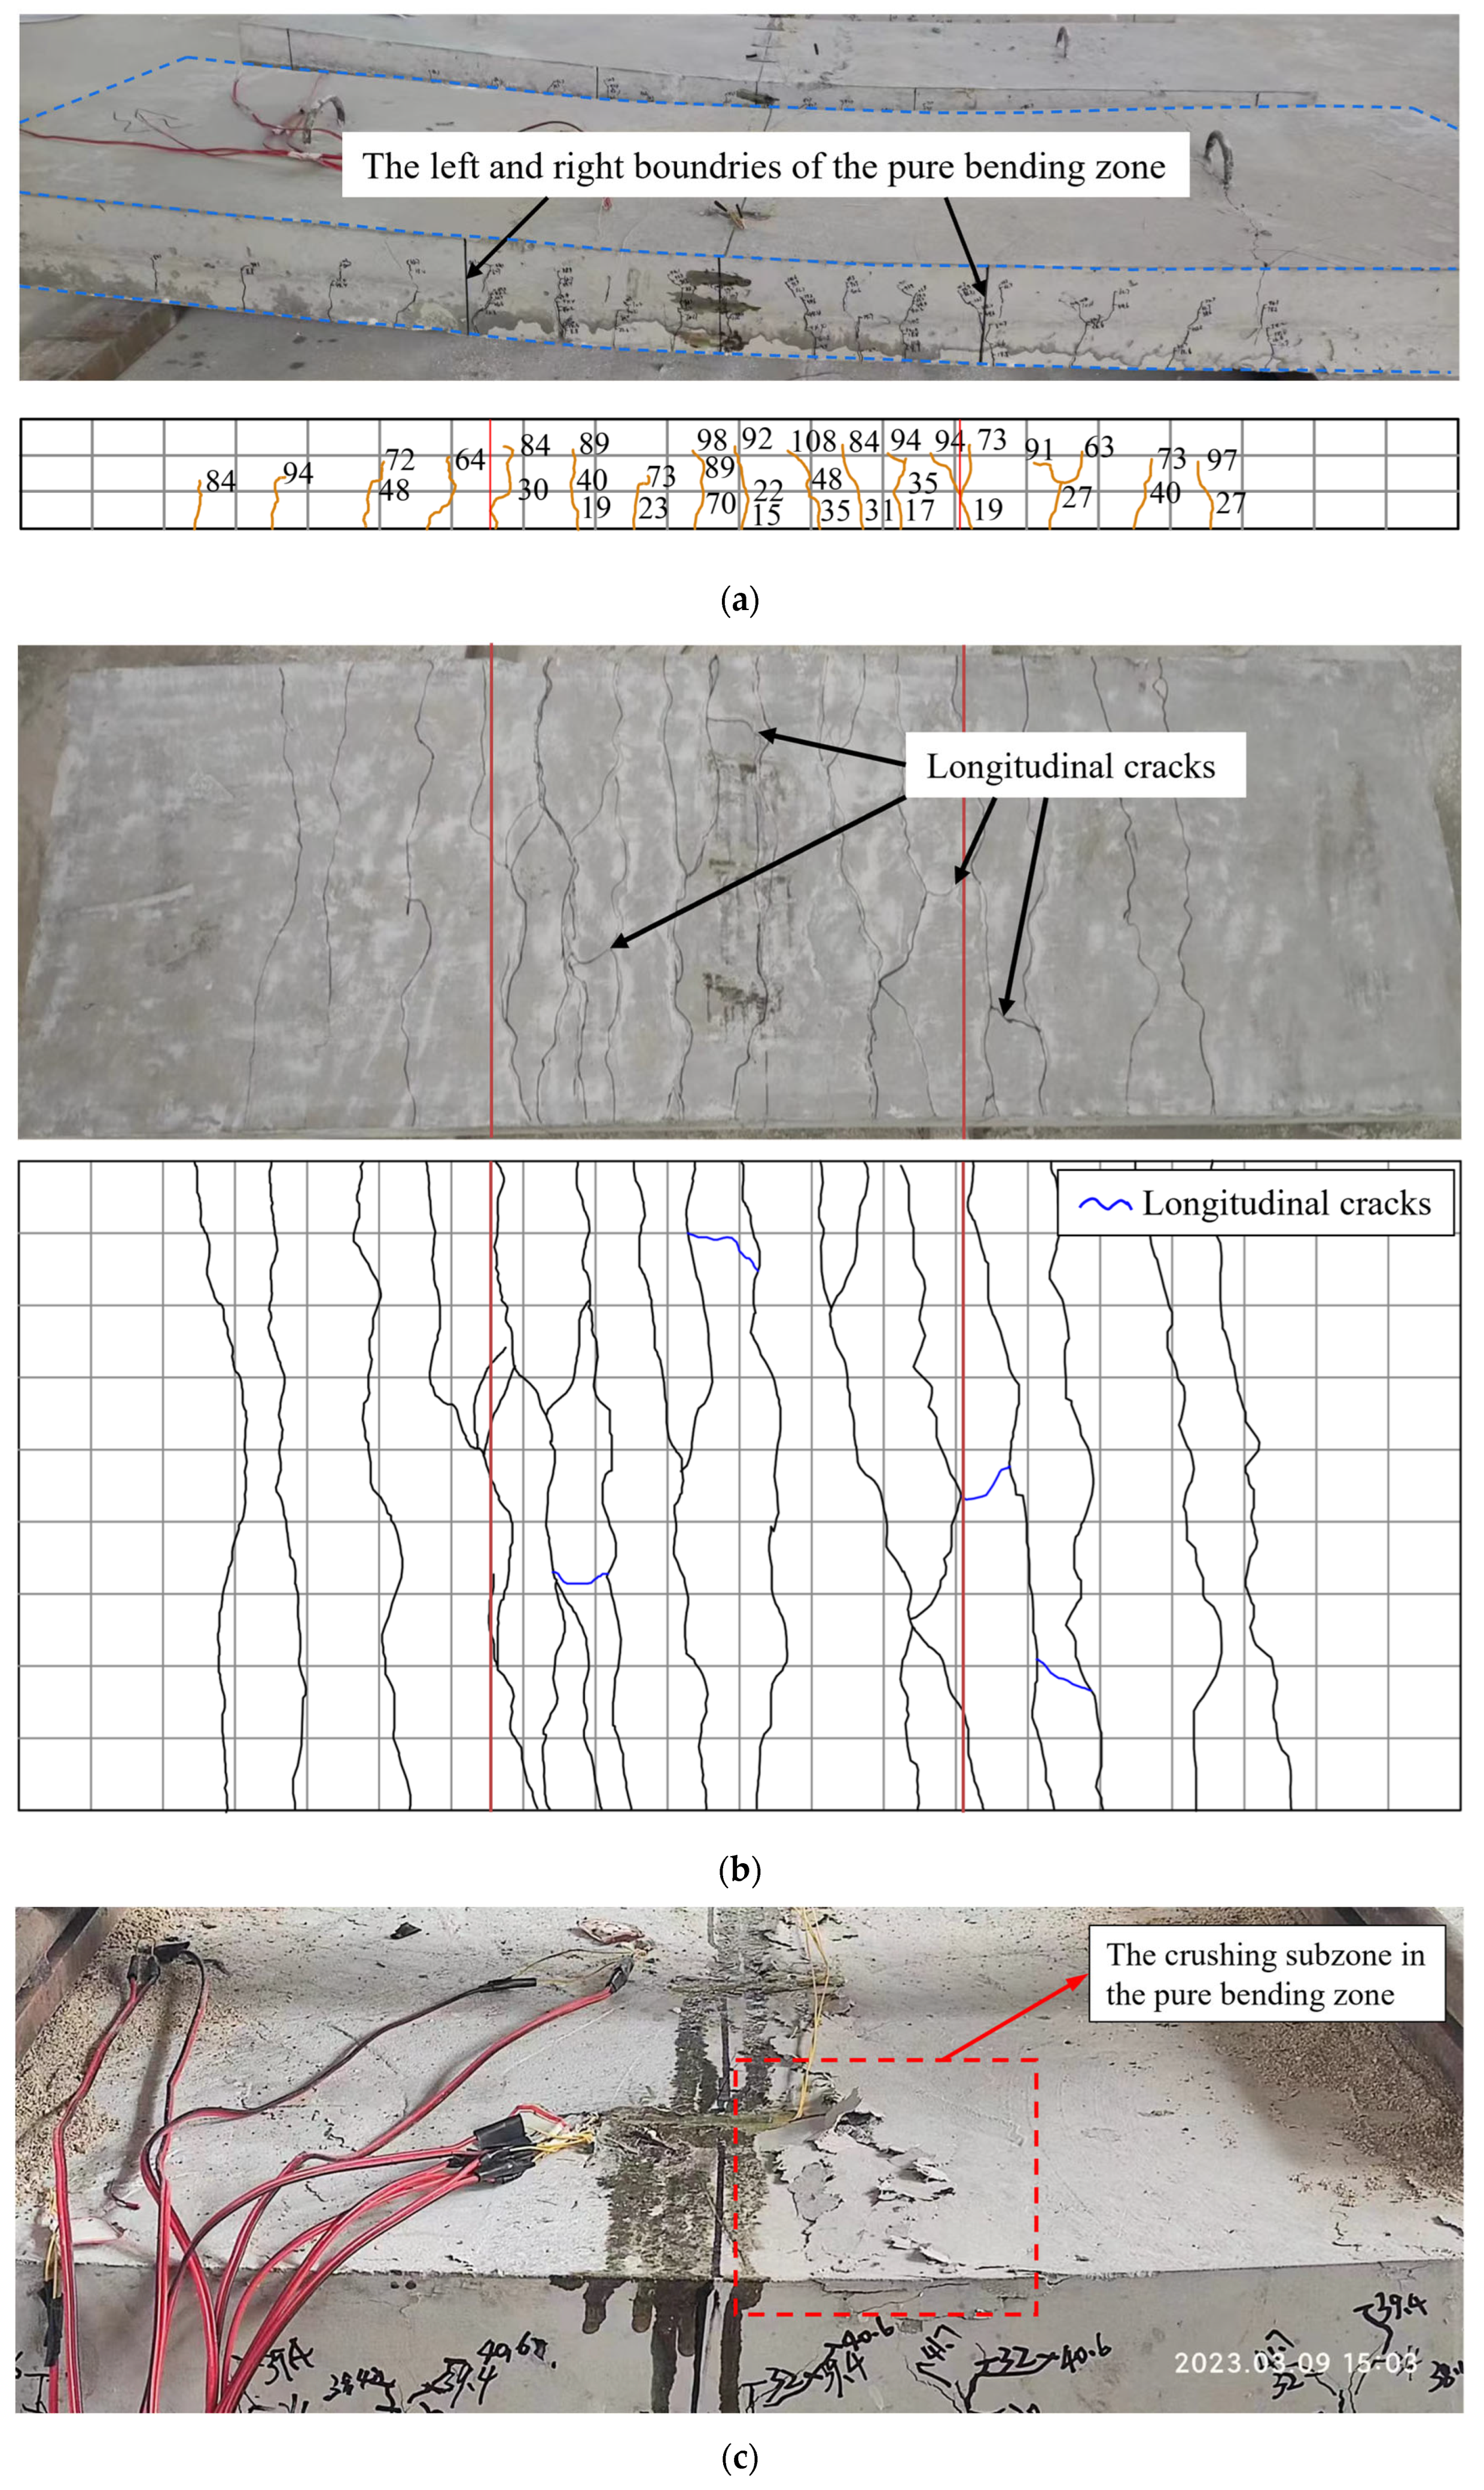
- The crack development illustrated by Figure 9a indicates the following three reasonable experimental facts. ① The initial crack originated on the B-face when , which closely approximates the estimated value obtained from the corresponding analysis method introduced in Section 2.3 and shown by expression (4). ② Fresh cracks progressively developed from the center of the slab towards both support ends, with pre-existing cracks extending in a thick direction as the applied load increased. ③ In the purely flexural section, the spacing between adjacent cracks exhibited statistically similarity, whereas in the flexural-shear section, there was an increase in crack spacing accompanied by a decrease in crack length.
- (2)
- The crack distribution on the B-face when the slab is crushed is illustrated by Figure 9b. It is evident that the distribution characteristic of the cracks is extremely similar to that of the cracks on the S-face as a whole. It is worth noting that on the B-face, a tiny number of longitudinal cracks had emerged, which had been driven out by the radial components of the forces caused by the extrusion between concrete and rebars.
- (3)
- The concrete crushing on T-face is depicted by Figure 9c.
- (4)
- In addition, there are two more points worth noting. Firstly, the absence of slippage between the precast layer and the cast-in-place layer throughout the entire loading process provides empirical support for treating the slab as a unified entity during simulation. Secondly, the yielding of all l-rebars could be deduced from the appearance of the second inflection point in the load-displacement curve (see Figure 12), corresponding to this special yielding load .
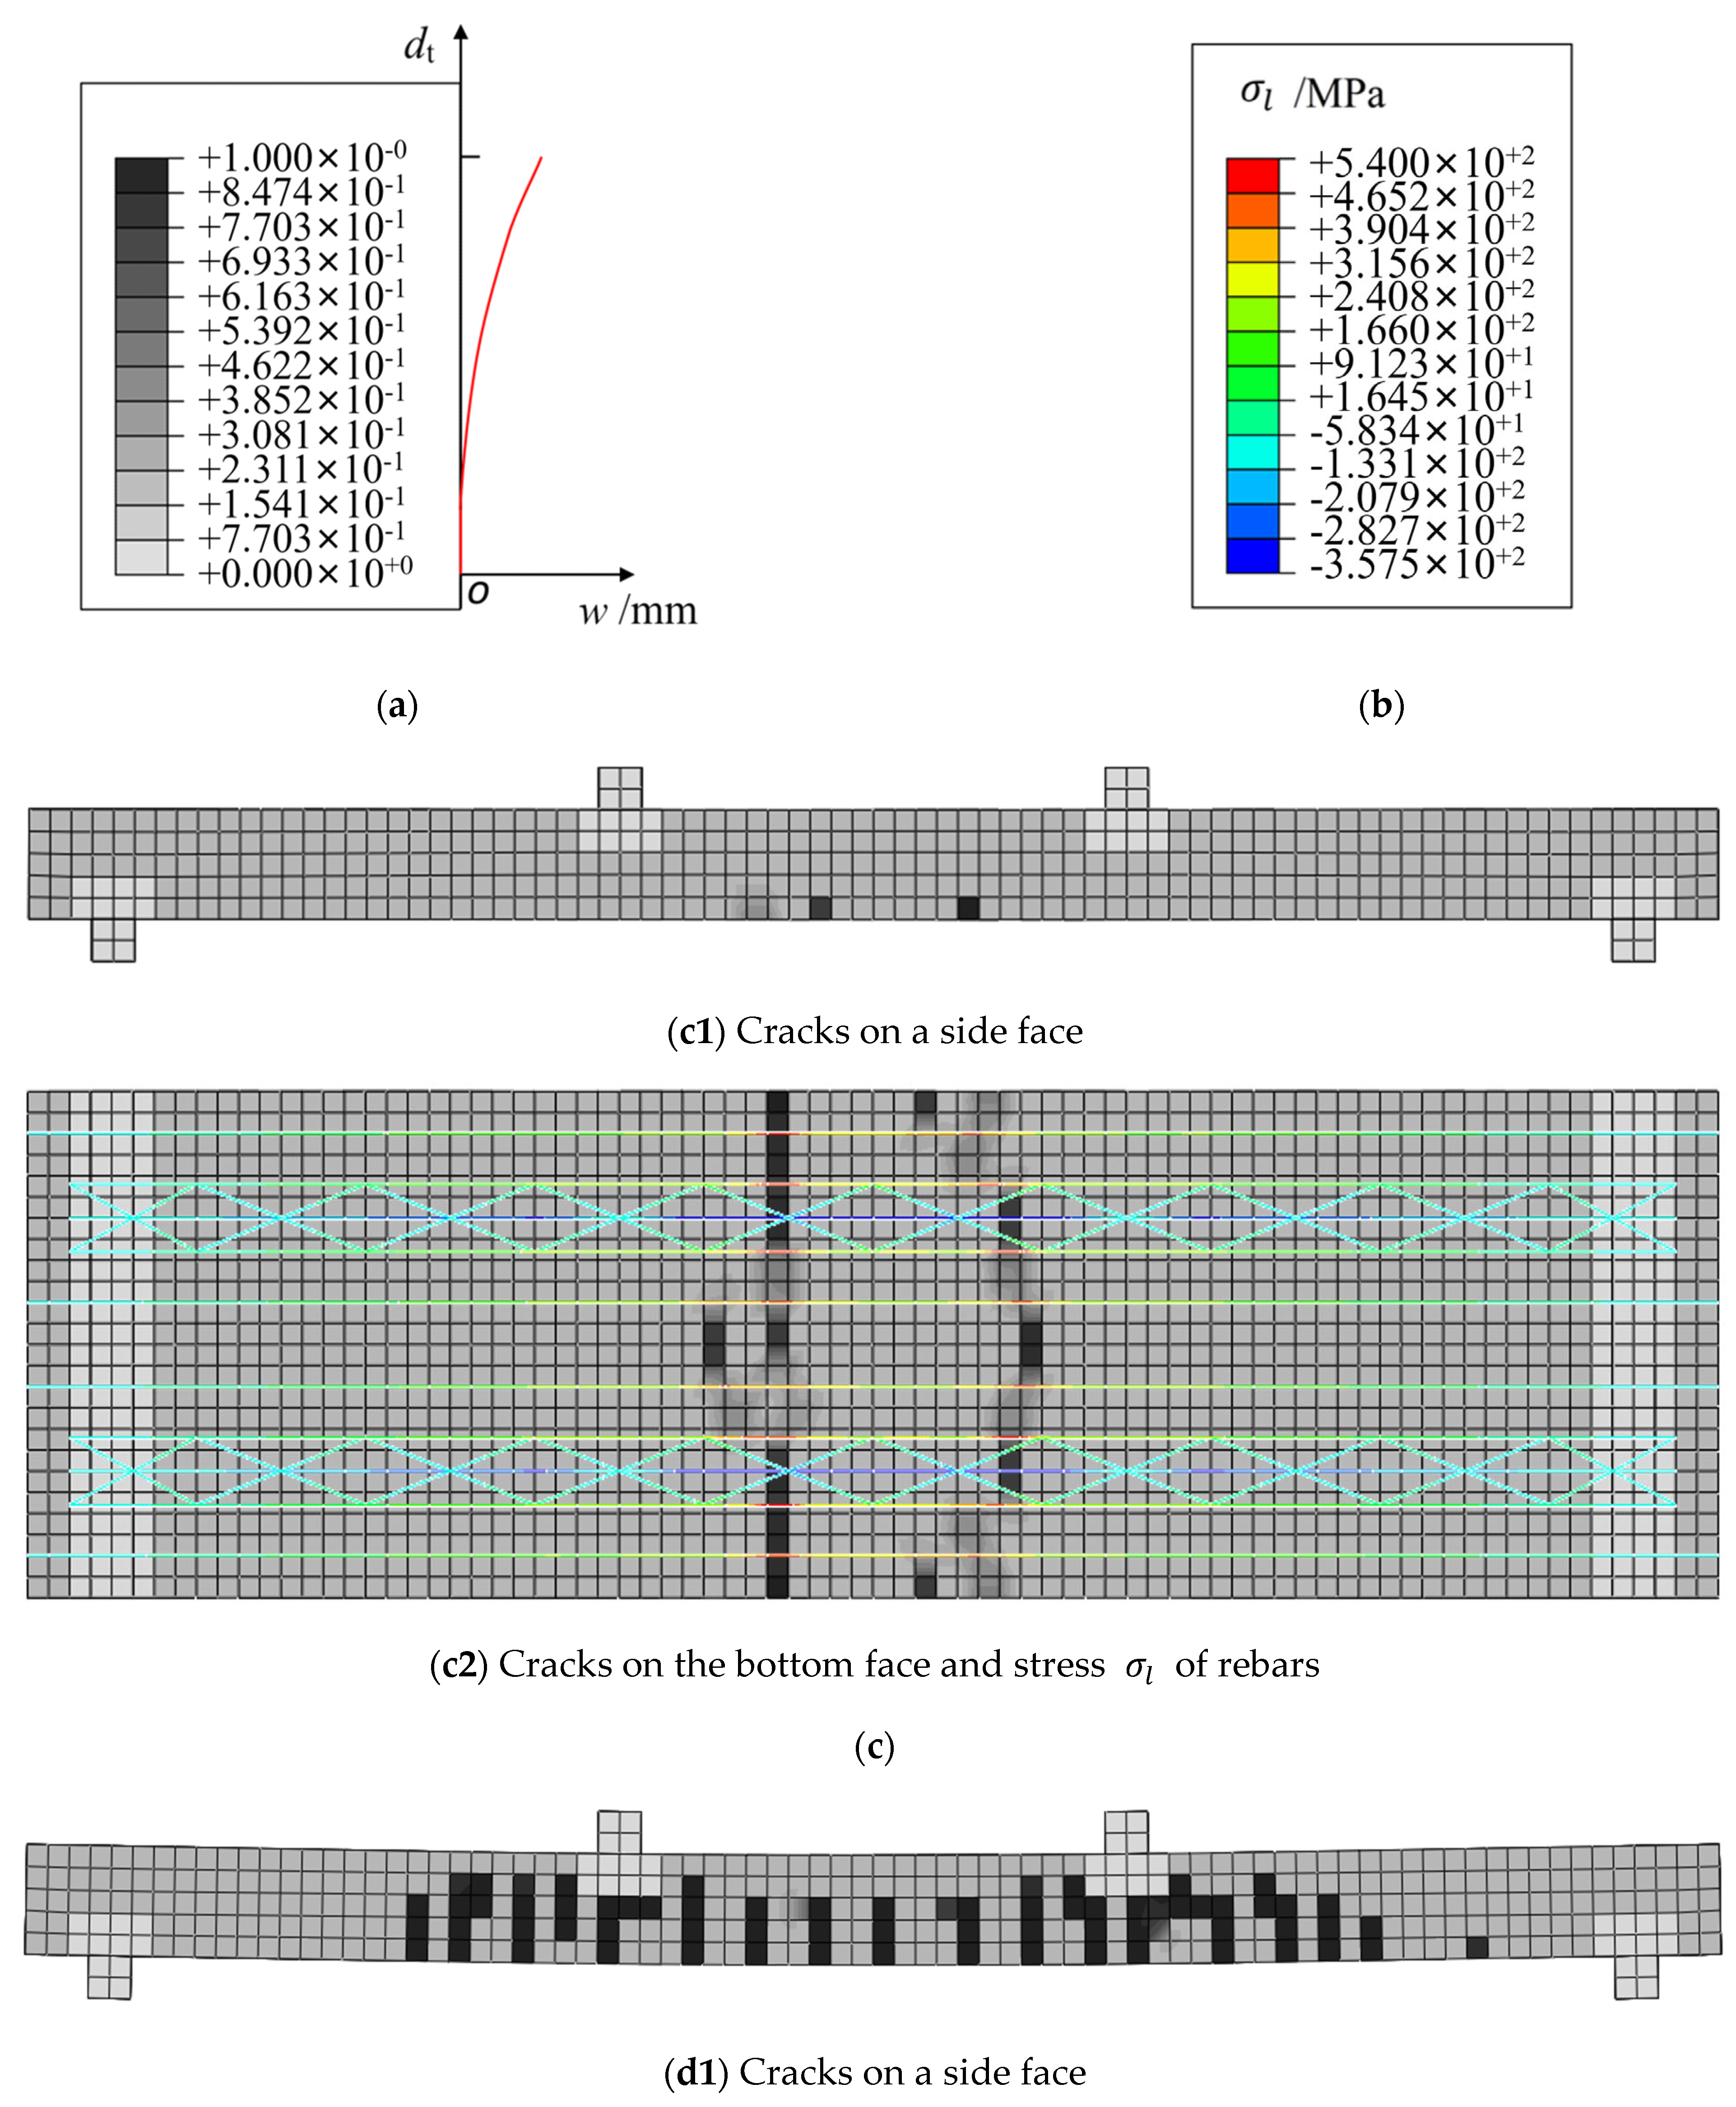
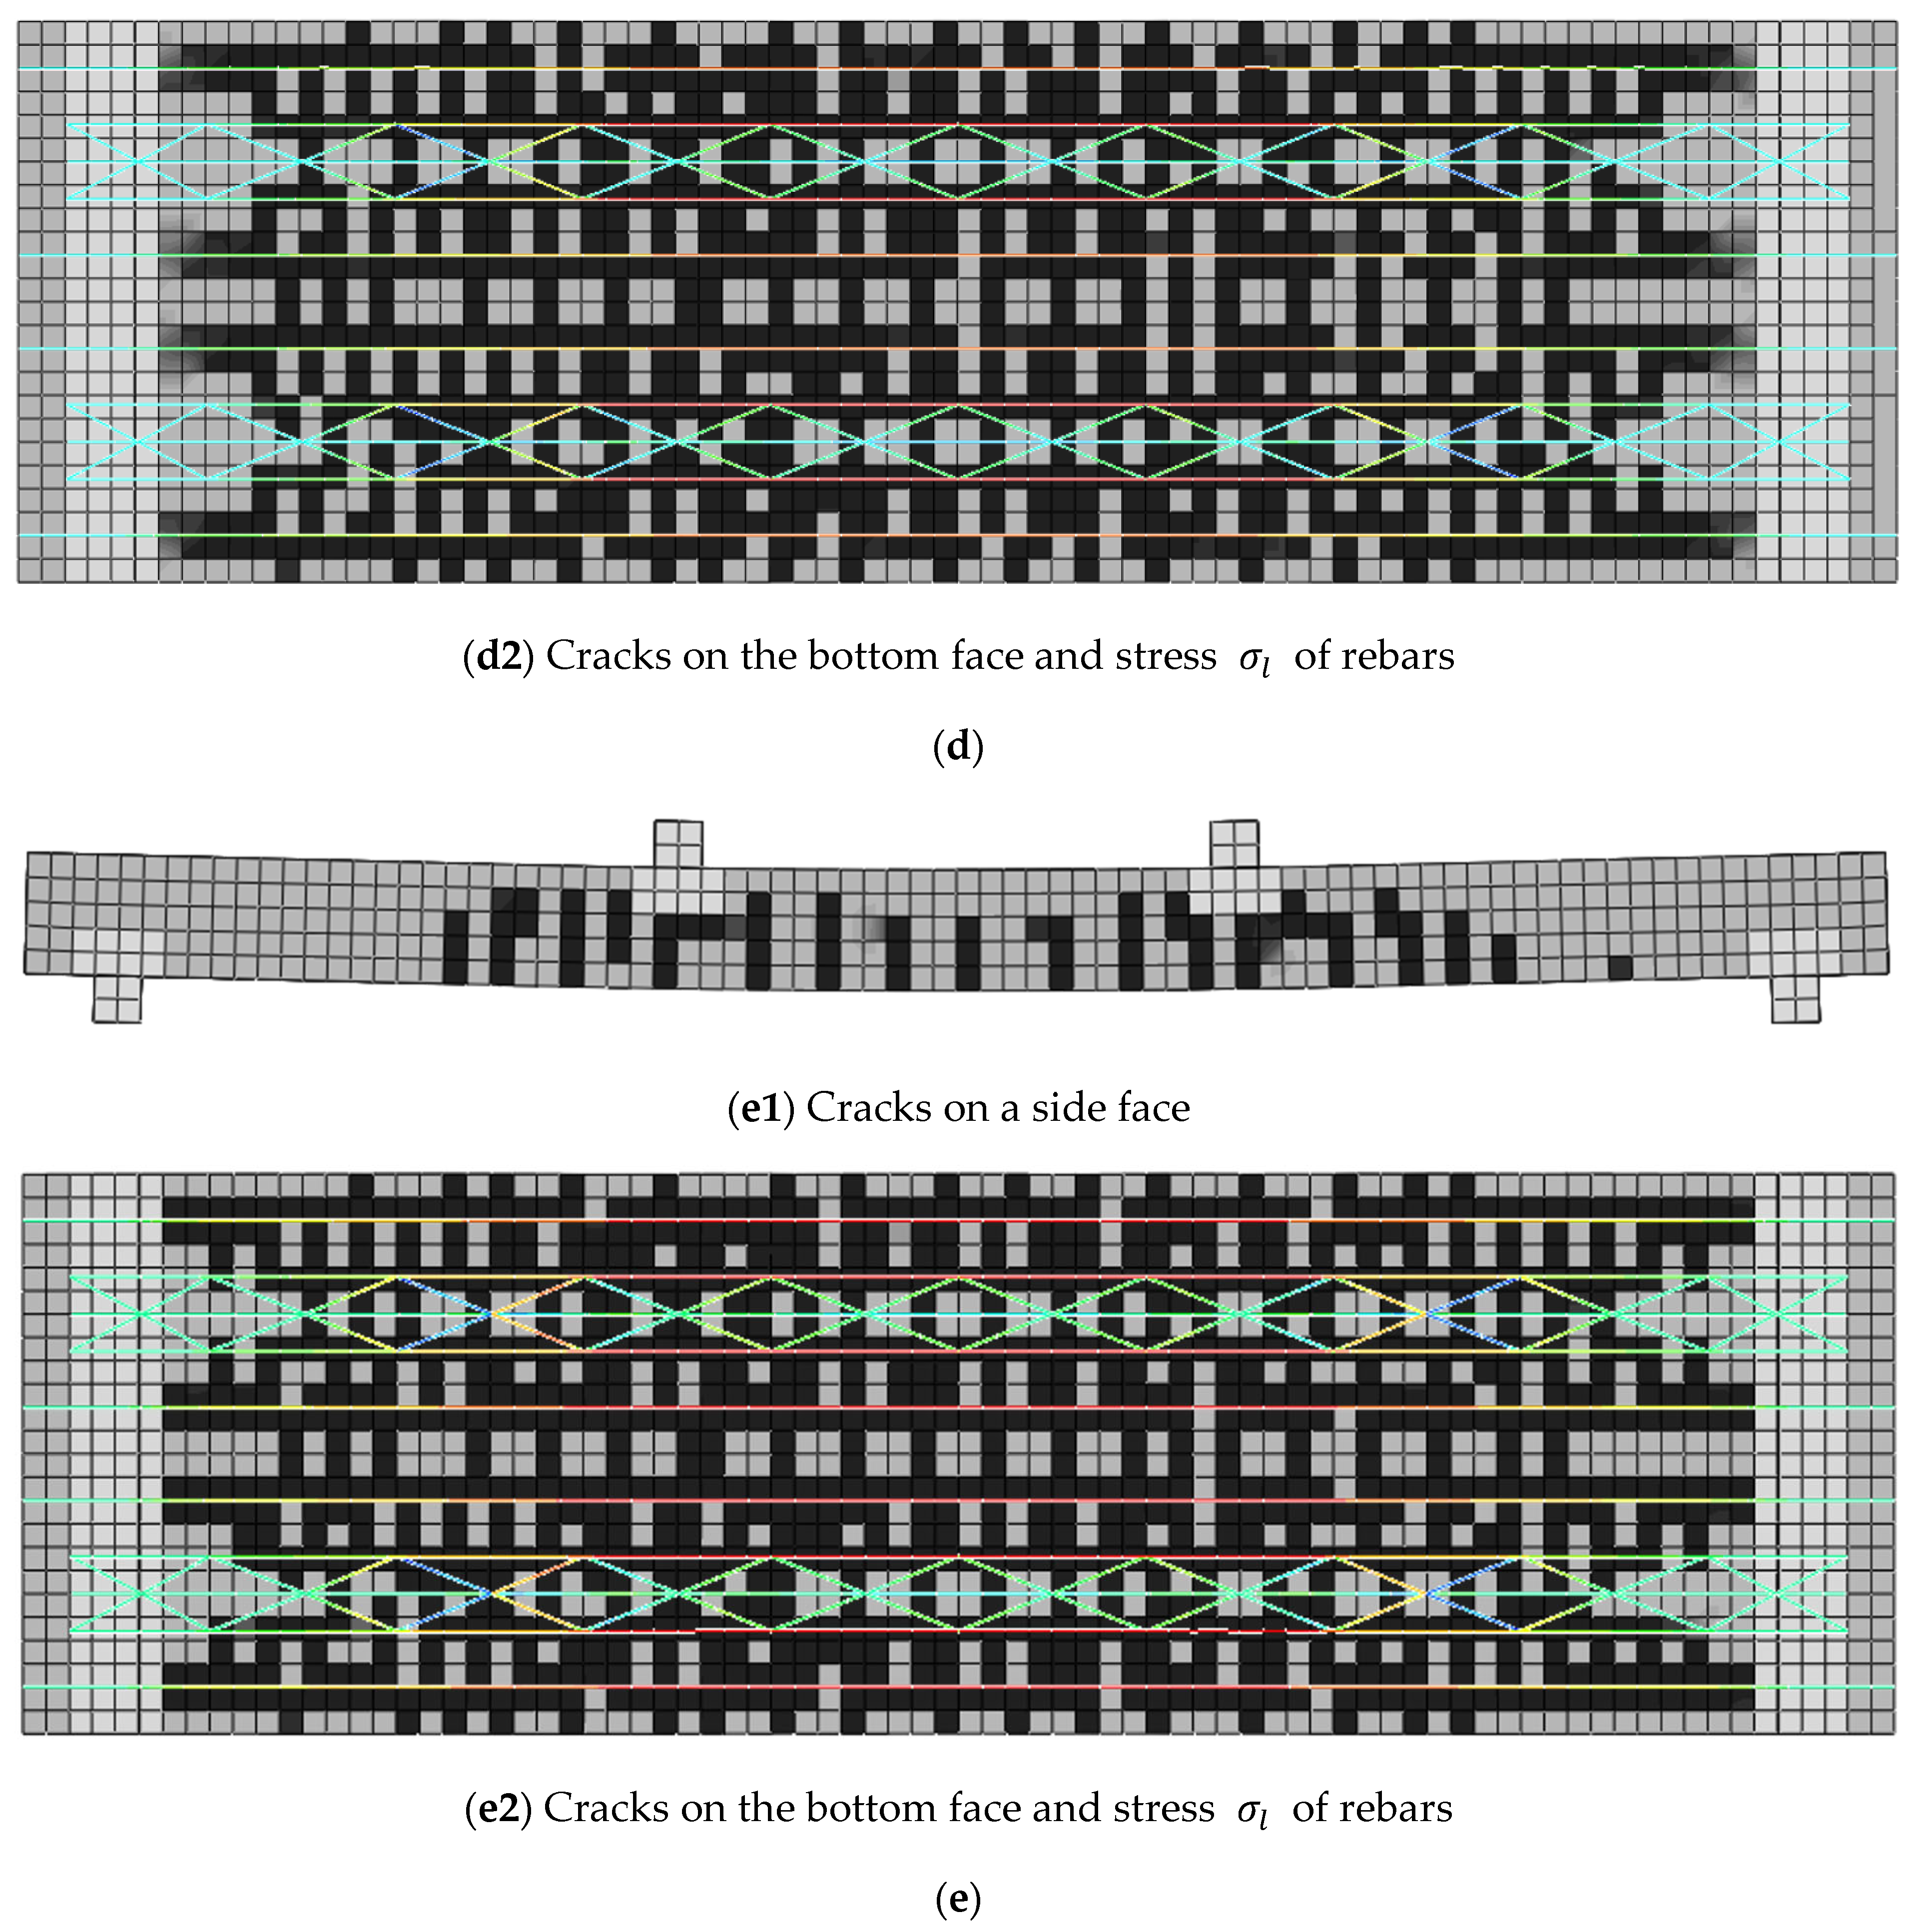
4.2.2. Phenomena I and Process II Given by FE Simulation
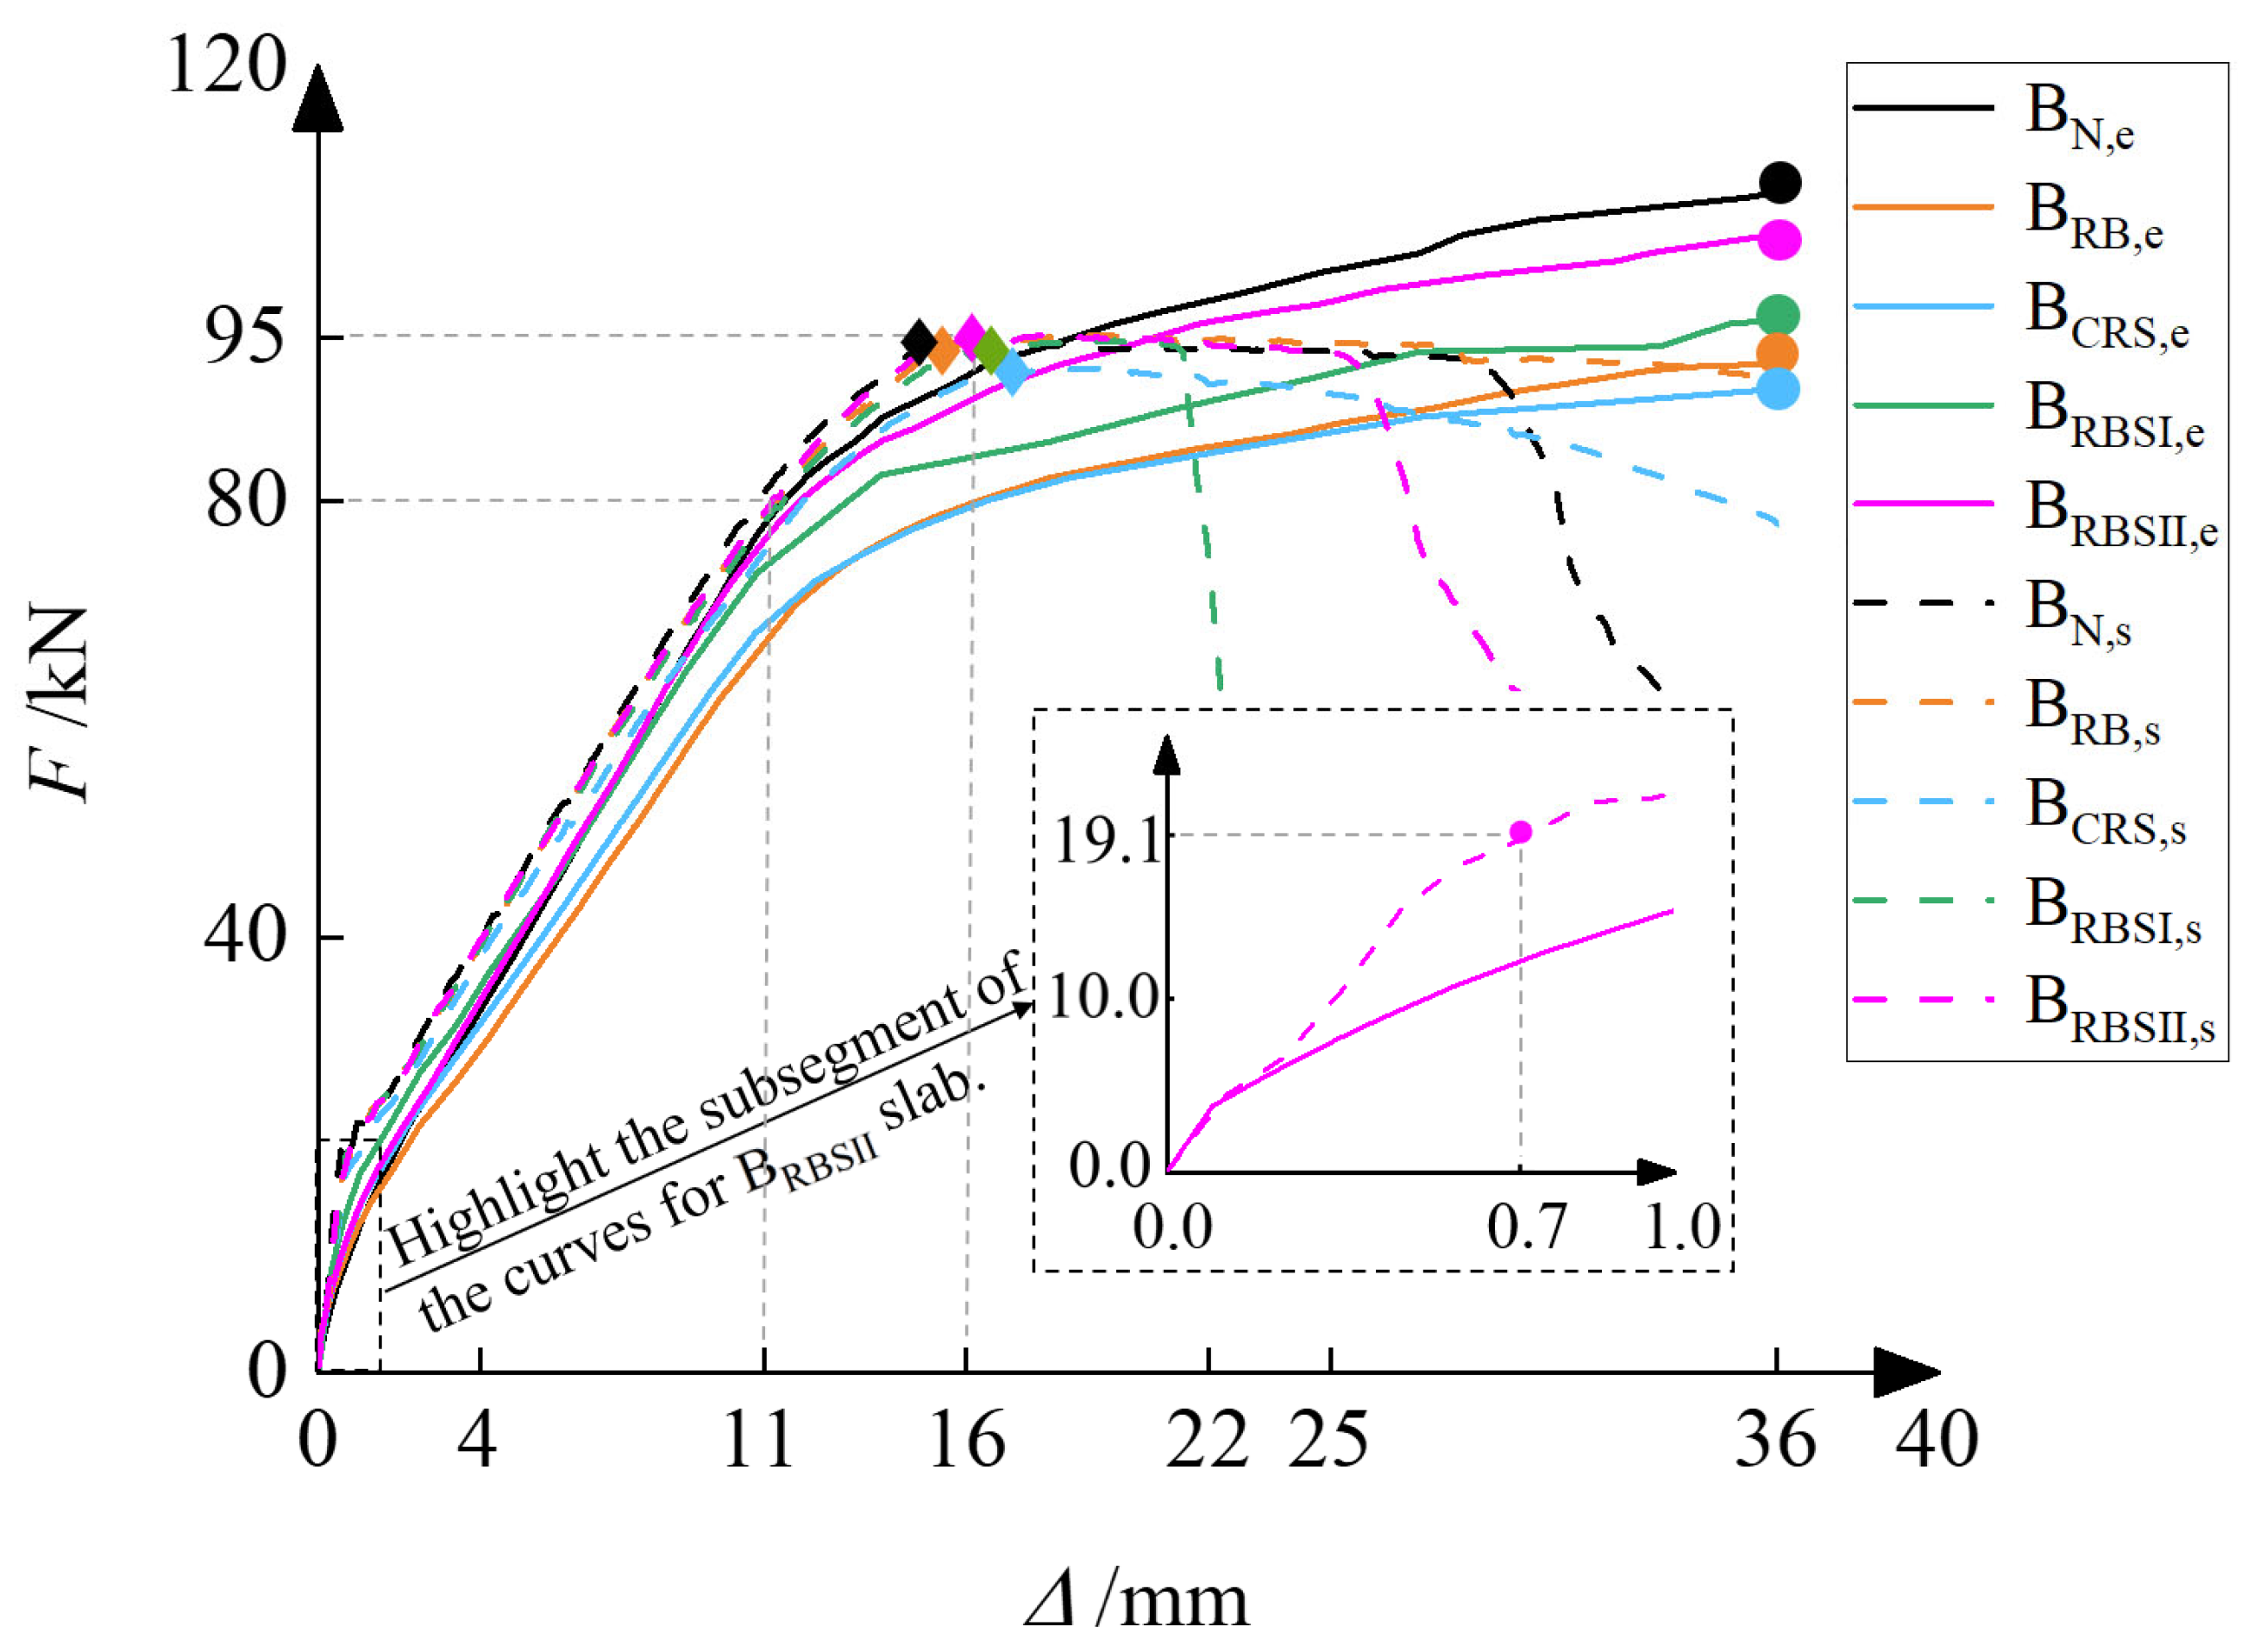
4.3. Load Displacement Curve and Characteristic Load Values
4.4. Yield Load and Ultimate Load
5. Conclusions
- (1)
- All PRB/PCRS physical slabs have flexural properties that meet the engineering requirements, and they are generally stronger than the traditional recycled concrete superposed slab, of which the BRBSⅡ plate has the best performance. The failure mode of each PRB/PCRS slab corresponds to that exhibited by a classic balanced-reinforced flexural member, and the superposed interface remains intact without any tearing. The evolution laws of side cracks, the distribution characteristics of bottom cracks, and the load -displacement curves provided by the experiments and simulations conducted on PRB/PCRS slabs and BN slabs are similar, respectively. Compared to the yield load or the utmost load of the BN slab, the yield load or the utmost load of PRB/PCRS slabs show a slight decrease within or . Notably, the slab with 1:1 mixture of PRB and PCRS demonstrated the highest yield and ultimate bearing capacities, showing minimal decreases 0.7% and 1.6%, compared to the conventional concrete slab.
- (2)
- The superior performance of each PRB/PCRS physical slab can be attributed to the excellent compressive performance of its corresponding PRB/PCRS concrete. The compressive stress -compressive strain test curves of AN concrete and four kinds of PRB/PCRS concrete are similar. Notably, compared to the peak stress of AN concrete, the peak stresses (, CRS) of the three types of PRB/PCRS concrete exhibits modest reductions ranging from 6.9% to 10.8%, with the exception being a 30.7% decrease in of ACRS concrete.
- (3)
- The proposed FE model for PRB/PCRS slabs provides both reasonable simulation solutions and ease of creation. The simulation results, consistent with the experiment ones or common sense, include the crack evolution history, - curve, and stress evolution history of stressed longitudinal rebars. Specifically, compared to or , or given by simulations demonstrate a tiny degree of deviation within or . The geometric features of the kinetic energy history curve obtained from simulation of a numerical slab provide validation for the crack propagation process in the corresponding physical slab.
Author Contributions
Funding
Data Availability Statement
Conflicts of Interest
Nomenclature
| CDP: | Concrete damage plasticity constitutive model |
| B/S/T-face: | Bottom/side/top face of the (physical or numerical) slab discussed or described |
| FE: | Finite element |
| l-rebar(s): | longitudinal stressed rebar(s) located at the bottom of the precast layer |
| PRB: | Recycled brick powder prepared from waste bricks |
| PCRS: | Calcined recycled slurry powder prepared from waste cement blocks |
| N: | Material ID for the ordinary concrete without recycled powder |
| RMP: | recycled micro-powder |
| RB, CRS: | Material IDs for the specific types of concrete with partial replacement of cement by PRB and PCRS, respectively |
| RBSI, RBSII: | Material IDs for the specific types of concrete in which PRB and PCRS are mixed in a 1:1 ratio to partially replace the cement or to completely replace of fly ash, respectively |
| , : | ☐ concrete, and slab cast with ☐ concrete |
| , , : | Quantity ☐ given through analytical analysis, experiment, and simulation, respectively |
| , : | Quantity ☐ under the compression and tension, respectively |
| , : | Quantity ☐ under the peak compressive and tensile stress, respectively |
| : | Quantity ☐ given when load applied on a slab arrives at the cracking load, or quantity given when strain arrives at the cracking strain |
| , : | Quantity ☐ given when the applied load arrives at the yield and ultimate load, respectively |
| : | Quantity ◊ related to or |
| , , : | Force applied to a slab, the moment, and the deflection of the middle point of a slab |
| , : | Uniaxial stress and rebar stress in the longitudinal direction of the rebar |
| , : | Uniaxial strain and initial yield strain of rebar |
| , : | Initial elasticity modulus of concrete, and elasticity modulus of rebar |
| , , : | Kinetic energy, internal potential energy, and the ratio of to |
| : | Yield strength of rebar |
| : | Damage variable or value |
| : | time |
| , : | Deviation in relation to a specific slab response, and compressive strength reduction index for ☐ concrete |
| Note: The ☐ symbol in the nomenclature is a wildcard, which refers to the combination of the same symbols. | |
References
- Fayed, S.; Aksoylu, C.; Ecemiş, A.S.; Madenci, E.; Özkılıç, Y.O. Tensile Behavior of Green Concrete Made of Fine/Coarse Recycled Glass and Recycled Concrete Aggregates. Buildings 2024, 14, 2969. [Google Scholar] [CrossRef]
- Wan, X.; Li, H.; Che, X.; Xu, P.; Li, C.; Yu, Q. A study on the application of recycled concrete powder in an alkali-activated cementitious system. Processes 2023, 11, 203. [Google Scholar] [CrossRef]
- Li, S.; Gao, J.; Li, Q.; Zhao, X. Investigation of using recycled powder from the preparation of recycled aggregate as a supplementary cementitious material. Constr. Build. Mater. 2021, 267, 120976. [Google Scholar] [CrossRef]
- Li, L.; Liu, Q.; Huang, T.; Peng, W. Mineralization and utilization of CO2 in construction and demolition wastes recycling for building materials: A systematic review of recycled concrete aggregate and recycled hardened cement powder. Sep. Purif. Technol. 2022, 298, 121512. [Google Scholar] [CrossRef]
- Kaptan, K.; Cunha, S.; Aguiar, J. A review of the utilization of recycled powder from concrete waste as a cement partial replacement in cement-based materials: Fundamental properties and activation methods. Appl. Sci. 2024, 14, 9775. [Google Scholar] [CrossRef]
- Mao, Y.; Hu, X.; Alengaram, U.J.; Chen, W.; Shi, C. Use of carbonated recycled cement paste powder as a new supplementary cementitious material: A critical review. Cem. Concr. Compos. 2024, 154, 105783. [Google Scholar] [CrossRef]
- Ye, T.; Xiao, J.; Duan, Z.; Li, S. Geopolymers made of recycled brick and concrete powder—A critical review. Constr. Build. Mater. 2022, 330, 127232. [Google Scholar] [CrossRef]
- Yang, Y.; Kang, Z.; Zhan, B.; Gao, P.; Yu, Q.; Wang, J.; Chen, Y. Short review on the application of recycled powder in cement-based materials: Preparation, performance and activity excitation. Buildings 2022, 12, 1568. [Google Scholar] [CrossRef]
- Hu, J.; Ahmed, W.; Jiao, D. A Critical Review of the Technical Characteristics of Recycled Brick Powder and Its Influence on Concrete Properties. Buildings 2024, 14, 3691. [Google Scholar] [CrossRef]
- Sallı Bideci, Ö.; Bideci, A.; Ashour, A. Utilization of recycled brick powder as supplementary cementitious materials—A comprehensive review. Materials 2024, 17, 637. [Google Scholar] [CrossRef]
- Rocha, J.H.A.; Toledo Filho, R.D. The utilization of recycled concrete powder as supplementary cementitious material in cement-based materials: A systematic literature review. J. Build. Eng. 2023, 76, 107319. [Google Scholar] [CrossRef]
- Zheng, L.; Ge, Z.; Yao, Z.; Gao, Z. Mechanical properties of mortar with recycled clay-brick-powder. In ICCTP 2011: Towards Sustainable Transportation Systems; American Society of Civil Engineers: Reston, VA, USA, 2011; pp. 3379–3388. [Google Scholar] [CrossRef]
- Zhang, Y.; Zhang, T.; Liu, Z.; Ma, C. Effect of Recycled Powder on Properties of Cement Morta. E3S Web Conf. 2021, 299, 02009. [Google Scholar] [CrossRef]
- Yang, H.; Guo, Z.; Yin, H.; Guan, D.; Yang, S. Development and testing of precast concrete beam-to-column connections with high-strength hooked bars under cyclic loading. Adv. Struct. Eng. 2019, 22, 3042–3054. [Google Scholar] [CrossRef]
- Mao, C.; Wang, Z. Seismic performance evaluation of a self-centering precast reinforced concrete frame structure. Earthq. Eng. Eng. Vib. 2021, 20, 943–968. [Google Scholar] [CrossRef]
- Liu, Y.; Tong, W.; Li, Q.; Yao, F.; Li, Y.; Li, H.X.; Huang, J. Study on complexity of precast concrete components and its influence on production efficiency. Adv. Civ. Eng. 2022, 2022, 9926547. [Google Scholar] [CrossRef]
- Kim, S.H.; Lee, B.M.; Kang, S.M.; Hwang, H.J.; Choi, H.; Ma, G. Simplified test method for evaluating progressive collapse resistance of precast concrete frame structures. J. Build. Eng. 2024, 88, 109236. [Google Scholar] [CrossRef]
- Huang, K.; Wang, X.; Wang, F.; Zhang, T. Mechanical Properties and Loading Simulation of Unidirectional Laminated Slabs Made from Recycled Concrete with Manufactured Sand. Buildings 2024, 14, 674. [Google Scholar] [CrossRef]
- Abdulrahman, M.B.; Khazaal, A.S.; Al-Attar, A.A.; Dawood, S.H. Reinforced concrete slabs containing recycled concrete as coarse aggregate. In IOP Conference Series: Materials Science and Engineering; IOP Publishing: Bristol, UK, 2020; Volume 978, p. 012032. [Google Scholar] [CrossRef]
- Mohamad, N.; Khalifa, H.; Samad, A.A.A.; Mendis, P.; Goh, W.I. Structural performance of recycled aggregate in CSP slab subjected to flexure load. Constr. Build. Mater. 2016, 115, 669–680. [Google Scholar] [CrossRef]
- Pavlů, T.; Pešta, J.; Vlach, T.; Fořtová, K. Environmental impact of concrete slab made of recycled aggregate concrete based on limit states of load-bearing capacity and serviceability—LCA case study. Materials 2023, 16, 616. [Google Scholar] [CrossRef]
- Rahman, A.F.; Goh, W.I.; Mohamad, N.; Kamarudin, M.S.; Jhatial, A.A. Numerical analysis and experimental validation of reinforced foamed concrete beam containing partial cement replacement. Case Stud. Constr. Mater. 2019, 11, e00297. [Google Scholar] [CrossRef]
- Minh Ha, T.; Ura, S.; Fukada, S.; Torii, K. Development and application of a highly durable precast prestressed concrete slab deck using fly ash concrete. Struct. Infrastruct. Eng. 2020, 16, 1228–1246. [Google Scholar] [CrossRef]
- Hussein, L.F.; Khattab, M.M.; Farman, M.S. Experimental and finite element studies on the behavior of hybrid reinforced concrete beams. Case Stud. Constr. Mater. 2021, 15, e00607. [Google Scholar] [CrossRef]
- Zerfu, K.; Ekaputri, J.J. Nonlinear finite element study on element size effects in alkali-activated fly ash based reinforced geopolymer concrete beam. Case Stud. Constr. Mater. 2021, 15, e00765. [Google Scholar] [CrossRef]
- Sahoo, S.; Veerendar, C.; Prakash, S.S. Experimental and numerical studies on flexural behaviour of lightweight and sustainable precast fibre reinforced hollow core slabs. Constr. Build. Mater. 2023, 377, 131072. [Google Scholar] [CrossRef]
- Huang, J.Q.; Kumar, S.; Dai, J.G. Flexural performance of steel-reinforced geopolymer concrete one-way slabs: Experimental and numerical investigations. Constr. Build. Mater. 2023, 366, 130098. [Google Scholar] [CrossRef]
- Nhan, B.T.; Choi, E.; Jeon, J.S. Investigation of flexural behavior of crimped SMA fiber-reinforced mortar beams through experimental study and mesoscale finite element modeling. Constr. Build. Mater. 2024, 411, 134618. [Google Scholar] [CrossRef]
- Dassault Systemes Simulia Corp. Abaqus 6.14 Analysis User’s Guide: Volume III; Dassault Systemes Simulia Corp: Providence, RI, USA, 2014. [Google Scholar]
- Albrifkani, S.; Wang, Y.C. Explicit modelling of large deflection behaviour of restrained reinforced concrete beams in fire. Eng. Struct. 2016, 121, 97–119. [Google Scholar] [CrossRef]
- Yin, H.; Shirai, K.; Teo, W. Response of UHPC-Concrete Composite Structural Members Using Implicit and Explicit Finite Element Method. Key Eng. Mater. 2019, 793, 93–97. [Google Scholar] [CrossRef]
- Hossain, K.M.A.; Attarde, S.; Anwar, M.S. Finite element modelling of profiled steel deck composite slab system with engineered cementitious composite under monotonic loading. Eng. Struct. 2019, 186, 13–25. [Google Scholar] [CrossRef]
- Wang, W.; Zeng, X.; Niyonzima, E.; Gao, Y.Q.; Yang, Q.W.; Chen, S.Q. Size Effect of Shear Strength of Recycled Concrete Beam without Web Reinforcement: Testing and Explicit Finite Element Simulation. Sustainability 2021, 13, 4294. [Google Scholar] [CrossRef]
- De Borst, R.; Crisfield, M.A.; Remmers, J.J.; Verhoosel, C.V. Nonlinear Finite Element Analysis of Solids and Structures; John Wiley & Sons: Hoboken, NJ, USA, 2012. [Google Scholar]
- Dassault Systemes Simulia Corp. Abaqus 6.14 Analysis User’s Guide: Volume II; Dassault Systemes Simulia Corp: Providence, RI, USA, 2014. [Google Scholar]
- Guo, Z.H. Strength and Deformation of Concrete; Tsinghua University Press: Beijing, China, 1997; Volume 156, p. 156. (In Chinese) [Google Scholar]
- Zhang, C. Study on the Optimization of Analytical Parameters in 3D Explicit Finite Element Quasi-Static Iterative Computation of Concrete Beams. Master’s Thesis, Shaoxing University, Shaoxing, China, 2021. (In Chinese). [Google Scholar]
- Lee, J.; Fenves, G.L. Plastic-damage model for cyclic loading of concrete structures. J. Eng. Mech. 1998, 124, 892–900. [Google Scholar] [CrossRef]
- Lubliner, J.; Oliver, J.; Oller, S.; Onate, E. A plastic-damage model for concrete. Int. J. Solids Struct. 1989, 25, 299–326. [Google Scholar] [CrossRef]
- Dassault Systemes Simulia Corp. Abaqus 6.14 Theory Guide; Dassault Systemes Simulia Corp: Providence, RI, USA, 2014. [Google Scholar]
- Dere, Y.; Ozkilic, Y.O.; Ecemis, A.S.; Korkmaz, H.H. Strengthening of T-beams using external steel clamps and anchored steel plates. Steel Compos. Struct. 2023, 48, 405–417. [Google Scholar] [CrossRef]
- Korkmaz, H.H.; Dere, Y.; Özkılıç, Y.O.; Bozkurt, M.B.; Ecemiş, A.S.; Özdoner, N. Excessive snow induced steel roof failures in turkey. Eng. Fail. Anal. 2022, 141, 106661. [Google Scholar] [CrossRef]
- Bakhti, R.; Benahmed, B.; Laib, A.; Alfach, M.T. New approach for computing damage parameters evolution in plastic damage model for concrete. Case Stud. Constr. Mater. 2022, 16, e00834. [Google Scholar] [CrossRef]
- Chen, H.; Xu, B.; Wang, J.; Zhou, T.; Nie, X.; Mo, Y.L. Parametric analysis on compressive strain rate effect of concrete using mesoscale modeling approach. Constr. Build. Mater. 2020, 246, 118375. [Google Scholar] [CrossRef]
- Natário, P.; Silvestre, N.; Camotim, D. Web crippling failure using quasi-static FE models. Thin-Walled Struct. 2014, 84, 34–49. [Google Scholar] [CrossRef]
- Hillerborg, A.; Modéer, M.; Petersson, P.E. Analysis of crack formation and crack growth in concrete by means of fracture mechanics and finite elements. Cem. Concr. Res. 1976, 6, 773–781. [Google Scholar] [CrossRef]
- Ahmad, A.; Ahmed, A.; Iqbal, M.; Ali, S.M.; Khan, G.; Eldin, S.M.; Yosri, A.M. Non-linear finite element modeling of damages in bridge piers subjected to lateral monotonic loading. Sci. Rep. 2023, 13, 13461. [Google Scholar] [CrossRef]
- Zienkiewicz, O.C.; Taylor, R.L. The Finite Element Method for Solid and Structural Mechanics; Beijing World Publishing Corporation: Beijing, China, 2009. [Google Scholar]
- Bolina, F.L.; Schallenberger, M.; Carvalho, H. Experimental and numerical evaluation of RC ribbed slabs in fire conditions. Structures 2023, 51, 747–759. [Google Scholar] [CrossRef]


| Material ID | Cement | Fly Ash | PRB | PCRS | Natural Sand | Coarse Aggregate | Water | Water Reducer |
|---|---|---|---|---|---|---|---|---|
| AN | 336 | 59 | 0 | 0 | 807 | 948 | 170 | 4.54 |
| ARB | 269 | 59 | 67 | 0 | 807 | 948 | 170 | 4.54 |
| ACRS | 269 | 59 | 0 | 67 | 807 | 948 | 170 | 4.54 |
| ARBSI | 269 | 59 | 33.5 | 33.5 | 807 | 948 | 170 | 4.54 |
| ARBSII | 328 | 0 | 33.5 | 33.5 | 807 | 948 | 170 | 4.54 |
| Material ID | /MPa | /MPa | ||||
|---|---|---|---|---|---|---|
| AN | 23.1 | 2150 | 2.587 | 1.239 | 29,181 | -- |
| ARB | 21.4 | 1970 | 2.303 | 0.259 | 24,877 | 7.4% |
| ACRS | 16.0 | 2160 | 2.809 | 0.320 | 21,879 | 30.7% |
| ARBSI | 20.6 | 2013 | 2.142 | 3.139 | 23,060 | 10.8% |
| ARBSII | 21.5 | 1892 | 2.154 | 0.906 | 25,766 | 6.9% |
| /mm | /MPa | /GPa |
|---|---|---|
| 6 | 480 | 206 |
| 8 | 514 | 200 |
| 10 | 540 | 200 |
| Load Type | Sub-Stage I | Sub-Stage II | Sub-Stage III |
|---|---|---|---|
| Total load | 15 kN (≈) | 60 kN (0.7) | 10 mm |
| Incremental load | 1.5 kN | 6 kN | 3 mm |
| Slab ID | /kN | /kN | /% | /kN | /kN | /% | /kN | /kN | /% |
|---|---|---|---|---|---|---|---|---|---|
| BN | 15.5 | 20.4 | 31.6 | 87.8 | 93.5 | 6.5 | 101.1 | 94.5 | 6.5 |
| BRB | 13.5 | 18.4 | 36.3 | 85.5 | 91.7 | 7.3 | 92.7 | 95.4 | 2.9 |
| BCRS | 10.7 | 18.3 | 71.0 | 85.1 | 91.7 | 7.8 | 90.5 | 92.3 | 2.0 |
| BRBSI | 13.6 | 19.9 | 46.3 | 86.3 | 93.6 | 8.5 | 96.9 | 94.8 | 2.2 |
| BRBSII | 14.5 | 19.1 | 31.7 | 87.2 | 95.0 | 8.9 | 99.5 | 95.3 | 4.2 |
Disclaimer/Publisher’s Note: The statements, opinions and data contained in all publications are solely those of the individual author(s) and contributor(s) and not of MDPI and/or the editor(s). MDPI and/or the editor(s) disclaim responsibility for any injury to people or property resulting from any ideas, methods, instructions or products referred to in the content. |
© 2025 by the authors. Licensee MDPI, Basel, Switzerland. This article is an open access article distributed under the terms and conditions of the Creative Commons Attribution (CC BY) license (https://creativecommons.org/licenses/by/4.0/).
Share and Cite
Ye, Q.; Zhang, P.; Ye, K.; Wang, W.; Li, Z.; Gao, Y.; Xie, T.; Liang, C. Experimental and Explicit FE Studies on Flexural Behavior of Superposed Slabs. Buildings 2025, 15, 1758. https://doi.org/10.3390/buildings15101758
Ye Q, Zhang P, Ye K, Wang W, Li Z, Gao Y, Xie T, Liang C. Experimental and Explicit FE Studies on Flexural Behavior of Superposed Slabs. Buildings. 2025; 15(10):1758. https://doi.org/10.3390/buildings15101758
Chicago/Turabian StyleYe, Qi, Ping Zhang, Ke Ye, Wei Wang, Zeshen Li, Yueqing Gao, Tianyu Xie, and Chaofeng Liang. 2025. "Experimental and Explicit FE Studies on Flexural Behavior of Superposed Slabs" Buildings 15, no. 10: 1758. https://doi.org/10.3390/buildings15101758
APA StyleYe, Q., Zhang, P., Ye, K., Wang, W., Li, Z., Gao, Y., Xie, T., & Liang, C. (2025). Experimental and Explicit FE Studies on Flexural Behavior of Superposed Slabs. Buildings, 15(10), 1758. https://doi.org/10.3390/buildings15101758