Article

Impact of Thermal Mass, Window Performance, and Window–Wall Ratio on Indoor Thermal Dynamics in Public Buildings

1
Innovation Institute for Sustainable Maritime Architecture Research and Technology, Qingdao University of Technology, Qingdao 316600, China
2
Faculty of Environmental Engineering, The University of Kitakyushu, Kitakyushu 8080135, Japan
3
College of Architecture and Urban Planning, Qingdao University of Technology, Qingdao 316600, China
*
Author to whom correspondence should be addressed.
Buildings 2025, 15(10), 1757; https://doi.org/10.3390/buildings15101757
Submission received: 20 April 2025 / Revised: 11 May 2025 / Accepted: 16 May 2025 / Published: 21 May 2025
(This article belongs to the Section Building Energy, Physics, Environment, and Systems)

Abstract

Thermal comfort in public buildings is crucial for occupant well-being and energy efficiency. This study employs TRNSYS software to simulate the effects of thermal mass, window performance, and window–wall ratio (WWR) on summer thermal comfort. The results indicate that without energy-saving measures, increased thermal mass raises daily average maximum and minimum temperatures by 0.33–0.96 °C and 0.14–0.94 °C, respectively. Enhanced WWRs lead to higher daily average maximum and minimum temperatures for double-glazed windows (0.18–0.61 °C and 0.07–0.62 °C, respectively), while single-glazed windows show increased maximum temperatures (0.18–1.86 °C) but decreased minimum temperatures (−0.01 to −0.72 °C). Thermal mass has a modest effect on indoor overheating during high outdoor temperatures. Double-glazed windows and lower WWRs effectively reduce indoor overheating, decreasing the attenuation coefficient by 2.13–28.94%. Conversely, single-glazed windows and higher WWRs enhance heat dissipation, increasing daily average temperature fluctuations by 2.33–44.18%. Notably, single-glazed windows with WWRs ≥ 50% improve thermal comfort by reducing extreme superheat temperature occurrence in heavy-thermal-mass buildings by 0.81 to 14.63%. Despite lower cooling loads with heavy thermal mass, double-glazed windows, and low WWRs, the study suggests that single-glazed windows and high WWRs can enhance summer thermal comfort. Therefore, reasonable shading measures and lighter thermal mass are recommended for such buildings.

1. Introduction

As per the 2018 Intergovernmental Panel on Climate Change (IPCC) report, the global warming phenomenon contributed to a 0.87 °C increase in the annual average surface temperature during the period 2006–2015 compared to 1850–1900. Projections indicate a prospective rise of 1.5–2.0 °C by 2040 [1]. This temperature surge, particularly in the summer, surpasses the overall annual average, leading to overheating in structures. Consequently, sustaining the thermal comfort of occupants necessitates heightened energy consumption [2]. In the context of China’s construction sector, public buildings play a significant role, constituting 44% of the nation’s building energy consumption [3]. Despite this, the focus of researchers has predominantly centered on enhancing the energy efficiency of buildings, with relatively less emphasis on addressing indoor thermal comfort concerns [4].
Enhancing the energy efficiency and occupant comfort of public buildings relies significantly on improving their thermal performance [5]. Envelope optimization and passive adjustments, such as the structure of walls [6] and windows [7], play a significant role in this process. Among the key factors influencing thermal performance are thermal mass, window performance, and window–wall ratio (WWR) [8]. Sun et al. [9] found that modifying thermal mass can significantly affect overheating hours in different climates, with heavy-thermal-mass materials reducing overheating in Harbin, Beijing, and Shanghai by 5.25%, 10%, and 5%, respectively, while increasing it in Kunming by 17.5%.
Research on thermal mass has primarily focused on its location [10,11], distribution [10,12], type [13,14], and thickness [10]. However, many of these studies primarily emphasize active temperature control strategies, like air conditioning and night ventilation, while paying comparatively less attention to passive regulation methods [15,16]. The influence of thermal mass on cooling loads varies across locations, with a decrease of 29–32.1% in Los Angeles and San Francisco [17], an increase in Las Vegas [18], and no significant change in Hong Kong and New Zealand [19,20]. Li et al. reported that in desert climate zones, the use of lightweight wall structures can reduce cooling loads by 6.67 KWh·m−2 [21].
Window systems have also been extensively studied. Mingotti et al. [22] reported that double-glazed windows reduce cooling loads in warm areas compared to single-glazed windows. Andarini et al. [23] showed that utilizing glass with high light transmittance and low solar absorption coefficients can reduce annual energy consumption by up to 43%. Eduardo et al. [24] found that energy consumption remains low with WWRs between 30 and 45% but increases significantly with WWRs over 60%. Gupta et al. [25] highlighted that reducing WWRs from 90% to 40% in tropical regions like China and Malaysia can improve temperature and enhance thermal comfort.
While many studies have considered the influence of window performance on indoor thermal environments, including factors like the heat transfer coefficient (u value) [26] and solar heat absorption coefficient (SHGC) [6], optimal WWR has also been proposed [27,28]. Although glass curtain walls are widely used in public buildings [29], their drawbacks, such as negative impacts on thermal comfort [4] and increased energy consumption [30], have received significant attention, while their distinct benefits are often underappreciated. Xie et al. found that buildings with high WWRs in the Guangzhou region exhibit better energy-saving performance in the summer, while winter overheating can be effectively mitigated by incorporating phase change materials [31,32]. Similarly, Orman et al. emphasized the importance of appropriate thermal mass selection, WWR control, and active adjustment strategies for improving summer thermal comfort [33]. Cherier et al. demonstrated that a WWR of 60% generally achieves optimal energy efficiency, with annual energy savings reaching up to 9.75% in cold semi-arid climates and 6.92% in hot semi-arid climates. Low-emissivity glass typically provides the best performance, although other glass types may be more suitable in regions requiring significant solar protection [34]. Moreover, several studies have highlighted that the impact of envelope design factors on building performance is inherently interactive rather than independent [1,35]. For instance, some research has explored the effects of different WWRs and window glazing types on indoor thermal environments [36], while other studies have examined the impact of thermal mass on the overall energy performance of buildings [37]. Additionally, some studies have examined the combined effects of different WWRs and thermal masses, revealing that a larger thermal mass is not always beneficial, as the optimal WWR varies with climate conditions [38]. For example, Ahmad et al. compared different WWRs (10%, 20%, 30%, and 40%) and wall types (thermal conductivities of 2.08 W·m−2K−1 and 0.85 W·m−2K−1), demonstrating that the impact of reducing thermal loads becomes more pronounced with lower thermal conductivity walls and smaller WWRs [39]. However, few studies have simultaneously addressed the combined effects of thermal mass, glass performance, and the WWR. Most research has focused on daytime thermal comfort or energy-saving effects, with limited attention to the long-term impact of diurnal temperature fluctuations on overall thermal comfort and energy balance. Furthermore, the influence of diurnal temperature variations on the overall energy efficiency of high-WWR buildings remains underexplored.
Employing TRNSYS software for three-dimensional building modeling, this study conducts a detailed analysis of summer thermal properties in public buildings located in Qingdao, China, under conditions devoid of energy-saving measures and active interventions. The research objectives include examining daily maximum/minimum temperatures, temperature fluctuations, attenuation coefficient, occurrences of extreme superheat temperatures, and cooling load implications. Unlike most studies that focus on single envelope components, this study simultaneously examines the combined effects of thermal mass, window performance, and the WWR on the indoor thermal environment of public buildings. It supplements the understanding of the mechanisms by which different envelope elements contribute to passive thermal regulation in public buildings. Through parametric modeling, this study provides a detailed simulation of various thermal performance indicators, including temperature fluctuations, attenuation coefficients, and cooling loads, for different combinations of thermal mass, window types, and WWRs. This approach enables a more precise quantification of the influence of envelope parameters on building thermal performance, offering more refined analytical results. Additionally, it highlights the potential for energy savings in buildings with high WWRs and explores passive cooling strategies for mitigating the impacts of future climate change, aiming to assist designers and building operators in enhancing summer thermal comfort.

2. Methodology

This section describes the TRNSYS model and basic thermal parameters.

2.1. Simulation Process

2.1.1. The Physical Model

Utilizing key parameters intrinsic to the public building envelope, including thermal mass, WWRs, and window performance, this study involved the simulation of office room temperatures in Qingdao during August. The simulation was performed using TRNSYS, a widely recognized 3D modeling tool known for its precise hourly indoor temperature calculations. The main goals of the simulation were to assess thermal comfort and estimate energy usage.
The model used TRNSYS (see Figure 1). The geometric specifications of the room included dimensions of 7.5 m in length, 5.5 m in width, and 3.5 m in height. Notably, the east, west, and north walls, along with the ceiling, were internal walls adjacent to other rooms. Conversely, the south wall constituted the external facade, being in direct contact with the ambient air and featuring windows. It is worth noting that the model assumed that the building envelope maintained a steady-state heat transfer condition throughout the simulation, without considering the thermal lag effects of materials and ignoring transient heat conduction processes. The influence of humidity and material aging on thermal conductivity was also disregarded. During the simulation, it was assumed that there was no air infiltration in the room, neglecting air leakage and unintentional ventilation. Additionally, the heat dissipation from personnel, lighting, and equipment was assumed to be uniformly distributed throughout the room, reflecting a uniform heat distribution. The model primarily considered heat conduction and convection without accounting for infrared radiation. It also assumed that all occupants were engaged in light activities, excluding the effects of intense physical exertion on heat dissipation.
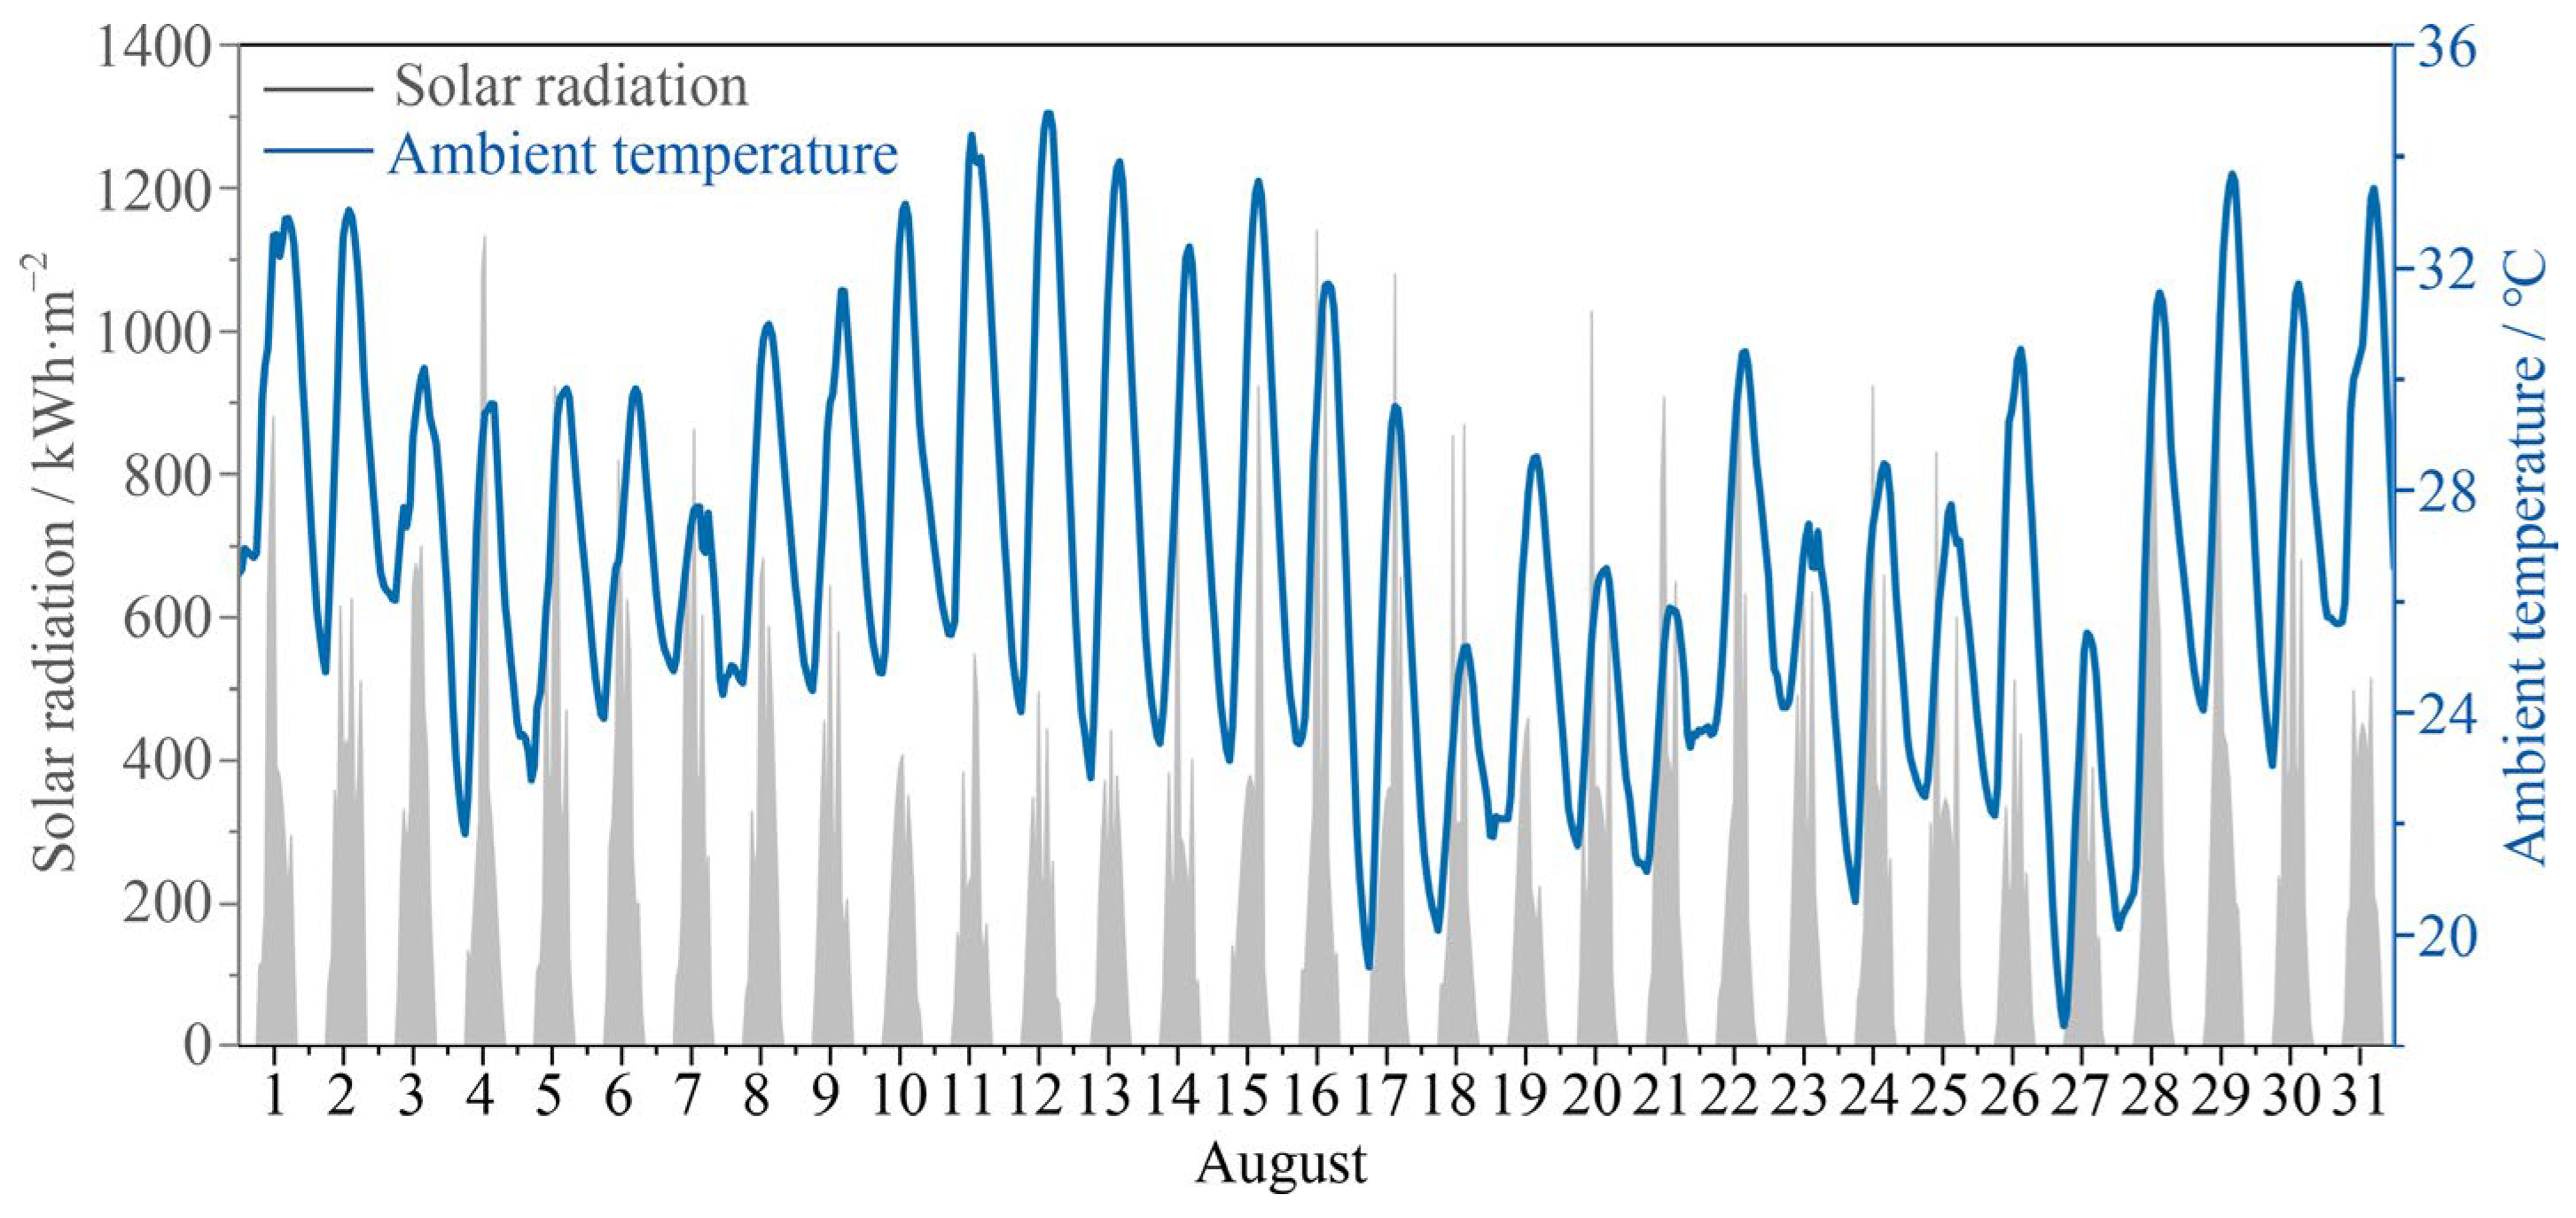
Qingdao, located at 36.1° N latitude and 120.4° E longitude, is a typical example of a city in a cold climate zone, experiencing hot summers and cold winters. Qingdao experiences a typical maritime climate, characterized by a summer period lasting from June to August, during which the average maximum temperature ranges from 24 to 30 °C. Throughout the summer season, the prevailing wind direction in Qingdao is predominantly south-easterly, with an average wind speed ranging between 3.4 m/s and 5.4 m/s. This wind pattern facilitates the influx of cool and humid air from the sea into the city [40]. The simulation relies on weather data obtained from Meteonorm software (version 8.2.0). Figure 2 shows the temporal variation curve of solar radiation and ambient temperature in Qingdao during August. Notably, August experiences a substantial influx of solar radiation, approximately reaching 127 kWh·m−2, accompanied by an average temperature of 26.73 °C.

2.1.2. Building Envelope Parameters

Adhering to the specifications outlined in the China National Standard for Thermal Design of Civil Buildings (GB 50176-2016) [41], appropriate envelope parameters were chosen within the TRNSYS. Table 1 provides details of the physical parameters for the non-transparent envelope, where the insulation thickness of the outer wall was the only variable considered for the inner wall, maintaining consistent physical parameters. The external walls, classified by thermal mass, included three categories: light, medium, and heavy. For insulation purposes, expanded polystyrene—a commonly used and cost-effective material—was employed [13,14]. Regarding window performance, two types from the TRNSYS model library were selected: the double-glazed window (Double 14011) and the single-glazed window (Single 102). Table 2 details the fundamental parameters of these windows. The study encompassed six distinct combinations, denoted as light thermal mass and the double-glazed window (LD), medium thermal mass and the double-glazed window (MD), heavy thermal mass and the double-glazed window (HD), light thermal mass and the single-glazed window (LS), medium thermal mass and the single-glazed window (MS), and heavy thermal mass and the single-glazed window (HS). The WWRs were systematically varied within a range of 0–90%, with intervals set at 10%.

2.1.3. Heating Power of Personnel, Lights, and Equipment

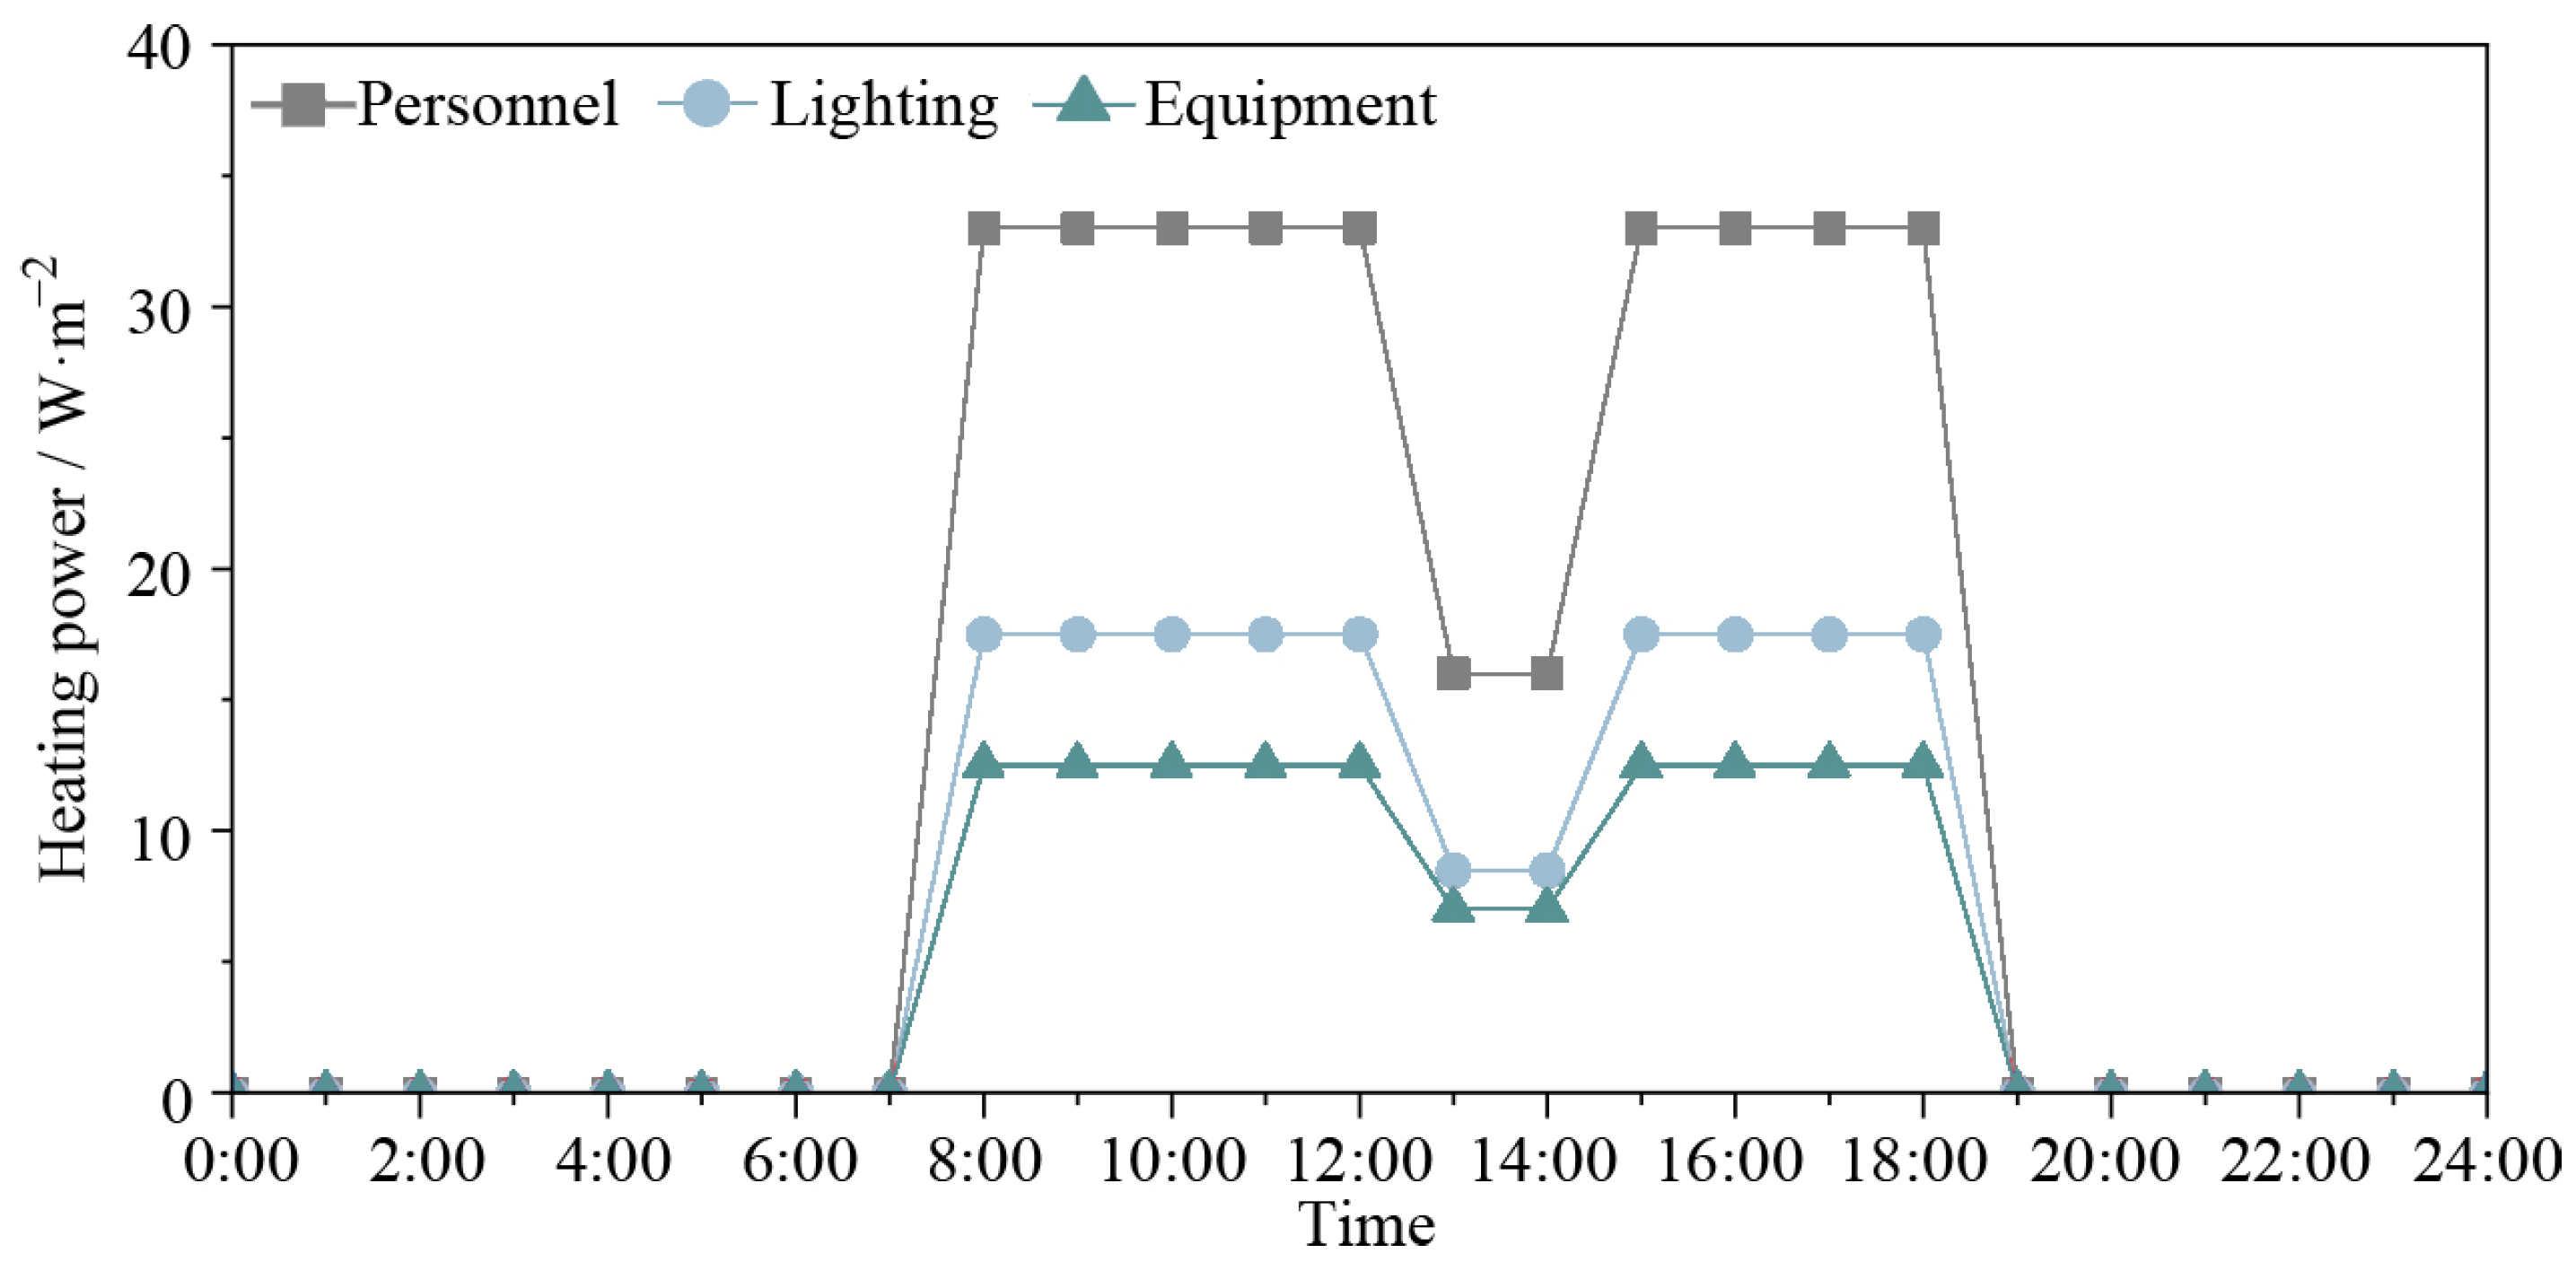
In accordance with GB 50189-2015, titled “Energy-saving Design Standards for Public Buildings”, the heating power for personnel, lighting, and equipment within the building model was established [42]. The personnel density was set at 0.25 people per square meter. Notably, lighting accounted for a substantial share of the total energy consumption in public buildings, with lighting equipment power maintained at a constant level. The mentioned standard also provides specific limits on lighting power. Although lighting with varying WWRs does influence lighting, individual differences play a role. This regulation is considered stochastic and exerts a minimal impact on lighting energy consumption. As a precautionary measure, a safety factor was introduced, aligning with the guidelines outlined in GB 50189-2015. Figure 3 shows the heating power contributions from personnel, lighting, and equipment. The operational timeframe for public buildings typically follows a fixed schedule, as exemplified in this case, spanning from 8:00 to 18:00.

2.2. Evaluation Indicator

To begin, the analysis focused on the daily maximum and minimum temperatures. The maximum temperature occurred during the operational period, while the minimum temperature was observed in the used period. This distinction allowed for a convenient analysis of extreme temperatures in different periods [31]. To provide a clearer representation of temperature changes, we will visually present the temperature fluctuations (see Equation (1)).
T f l u = T m a x T m i n
where Tflu represents temperature fluctuations and Tmax and Tmin represent maximum and minimum temperatures, respectively.
Secondly, we also analyzed the attenuation coefficient, defined as the ratio of the daily amplitude of indoor to outdoor temperature. This coefficient served as an effective index for measuring the thermal performance of buildings (see Equation (2)) [43].
A t t e n u a t i o n   c o e f f i c i e n t = 1 n i = 1 i = n T i n T o u t
where Tin represents indoor temperature, Tout represents outdoor temperature, and n represents days.
Next, we conducted a comparison of the duration of extreme superheat during the operational period in August. Despite a 100% overheating degree throughout August, we focused on determining the proportion of time when the temperature was within the thermal comfort range of 18–26 °C. A higher tolerance for thermal comfort corresponds to a greater proportion of time within this range. To quantify this, we calculated the number of hours spent in the extreme temperature range (≥37 °C).
Finally, we examined the impact of variables on refrigeration energy consumption by calculating the cooling load for the month of August.

2.3. Validation

When conducting building simulations, a crucial aspect is validating the results by assessing the deviation from actual conditions, thus establishing the accuracy and validity of the simulations [44]. The most accurate method for verification is the real method, involving a direct comparison of simulation results with actual values. To demonstrate the validity of our simulations, we compared the simulated cooling load with the actual electricity consumption for a room featuring light thermal mass, single-glazed windows, and WWR = 50%. The specific calculation process is as follows:
The comprehensive cooling load (Qc) is primarily determined by the combination of personnel heat load (Qp), lighting and equipment heat load (Ql and Qe), and external climate heat load (Qs). The calculation is based on the following equations, Equations (3)–(7):
Q p = n × q m
Q l = A × q l
Q e = A × q e
Q s = A w × U w × T o T i
Q c = Q p + Q l + Q e + Q s
where n is the number of personnel, qm is the heat dissipation per person, A is the building area, ql is the unit area lighting heat load, qe is the unit area equipment heat load, Aw is the external wall area, Uw is the overall heat transfer coefficient of the external wall, and To and Ti are the outdoor and indoor temperatures, respectively.
For this study, the test room had an area of 30 m2 and accommodated 8 staff members primarily engaged in office work. The lighting system consisted of LED lights with a power density of 15 W/m2. The main office equipment included 8 computers (100 W each) and 1 printer (200 W). The external wall area was 30 m2, with an overall heat transfer coefficient of 0.5 W·m−2K−1, and the temperature difference between indoor and outdoor environments was 9 °C. Specifically, for the month of August, the calculated cooling load using TRNSYS software was 17.5 kWh·m−2, while the actual cooling load stood at 18.9 kWh·m2, resulting in a deviation of 7.4%. This difference falls within an acceptable range, and we duly accounted for it in subsequent analyses.

3. Results and Discussion

3.1. Study Overview and Analysis Scope

Selecting August as a representative summer month, this study initially explores the thermal comfort of buildings with varying thermal masses and window configurations under the assumption that the active refrigeration system remains inactive. The comparison encompasses parameters such as the daily average Tmax, Tmin, and Tflu; attenuation coefficient; and the occurrence time of extreme superheat temperatures during the operational period. Subsequently, an analysis is conducted on the influence of thermal mass, window performance, and WWRs on the cooling load. The findings inform the formulation of recommendations aimed at enhancing the thermal performance of public buildings.

3.2. The Daily Average Maximum Temperature

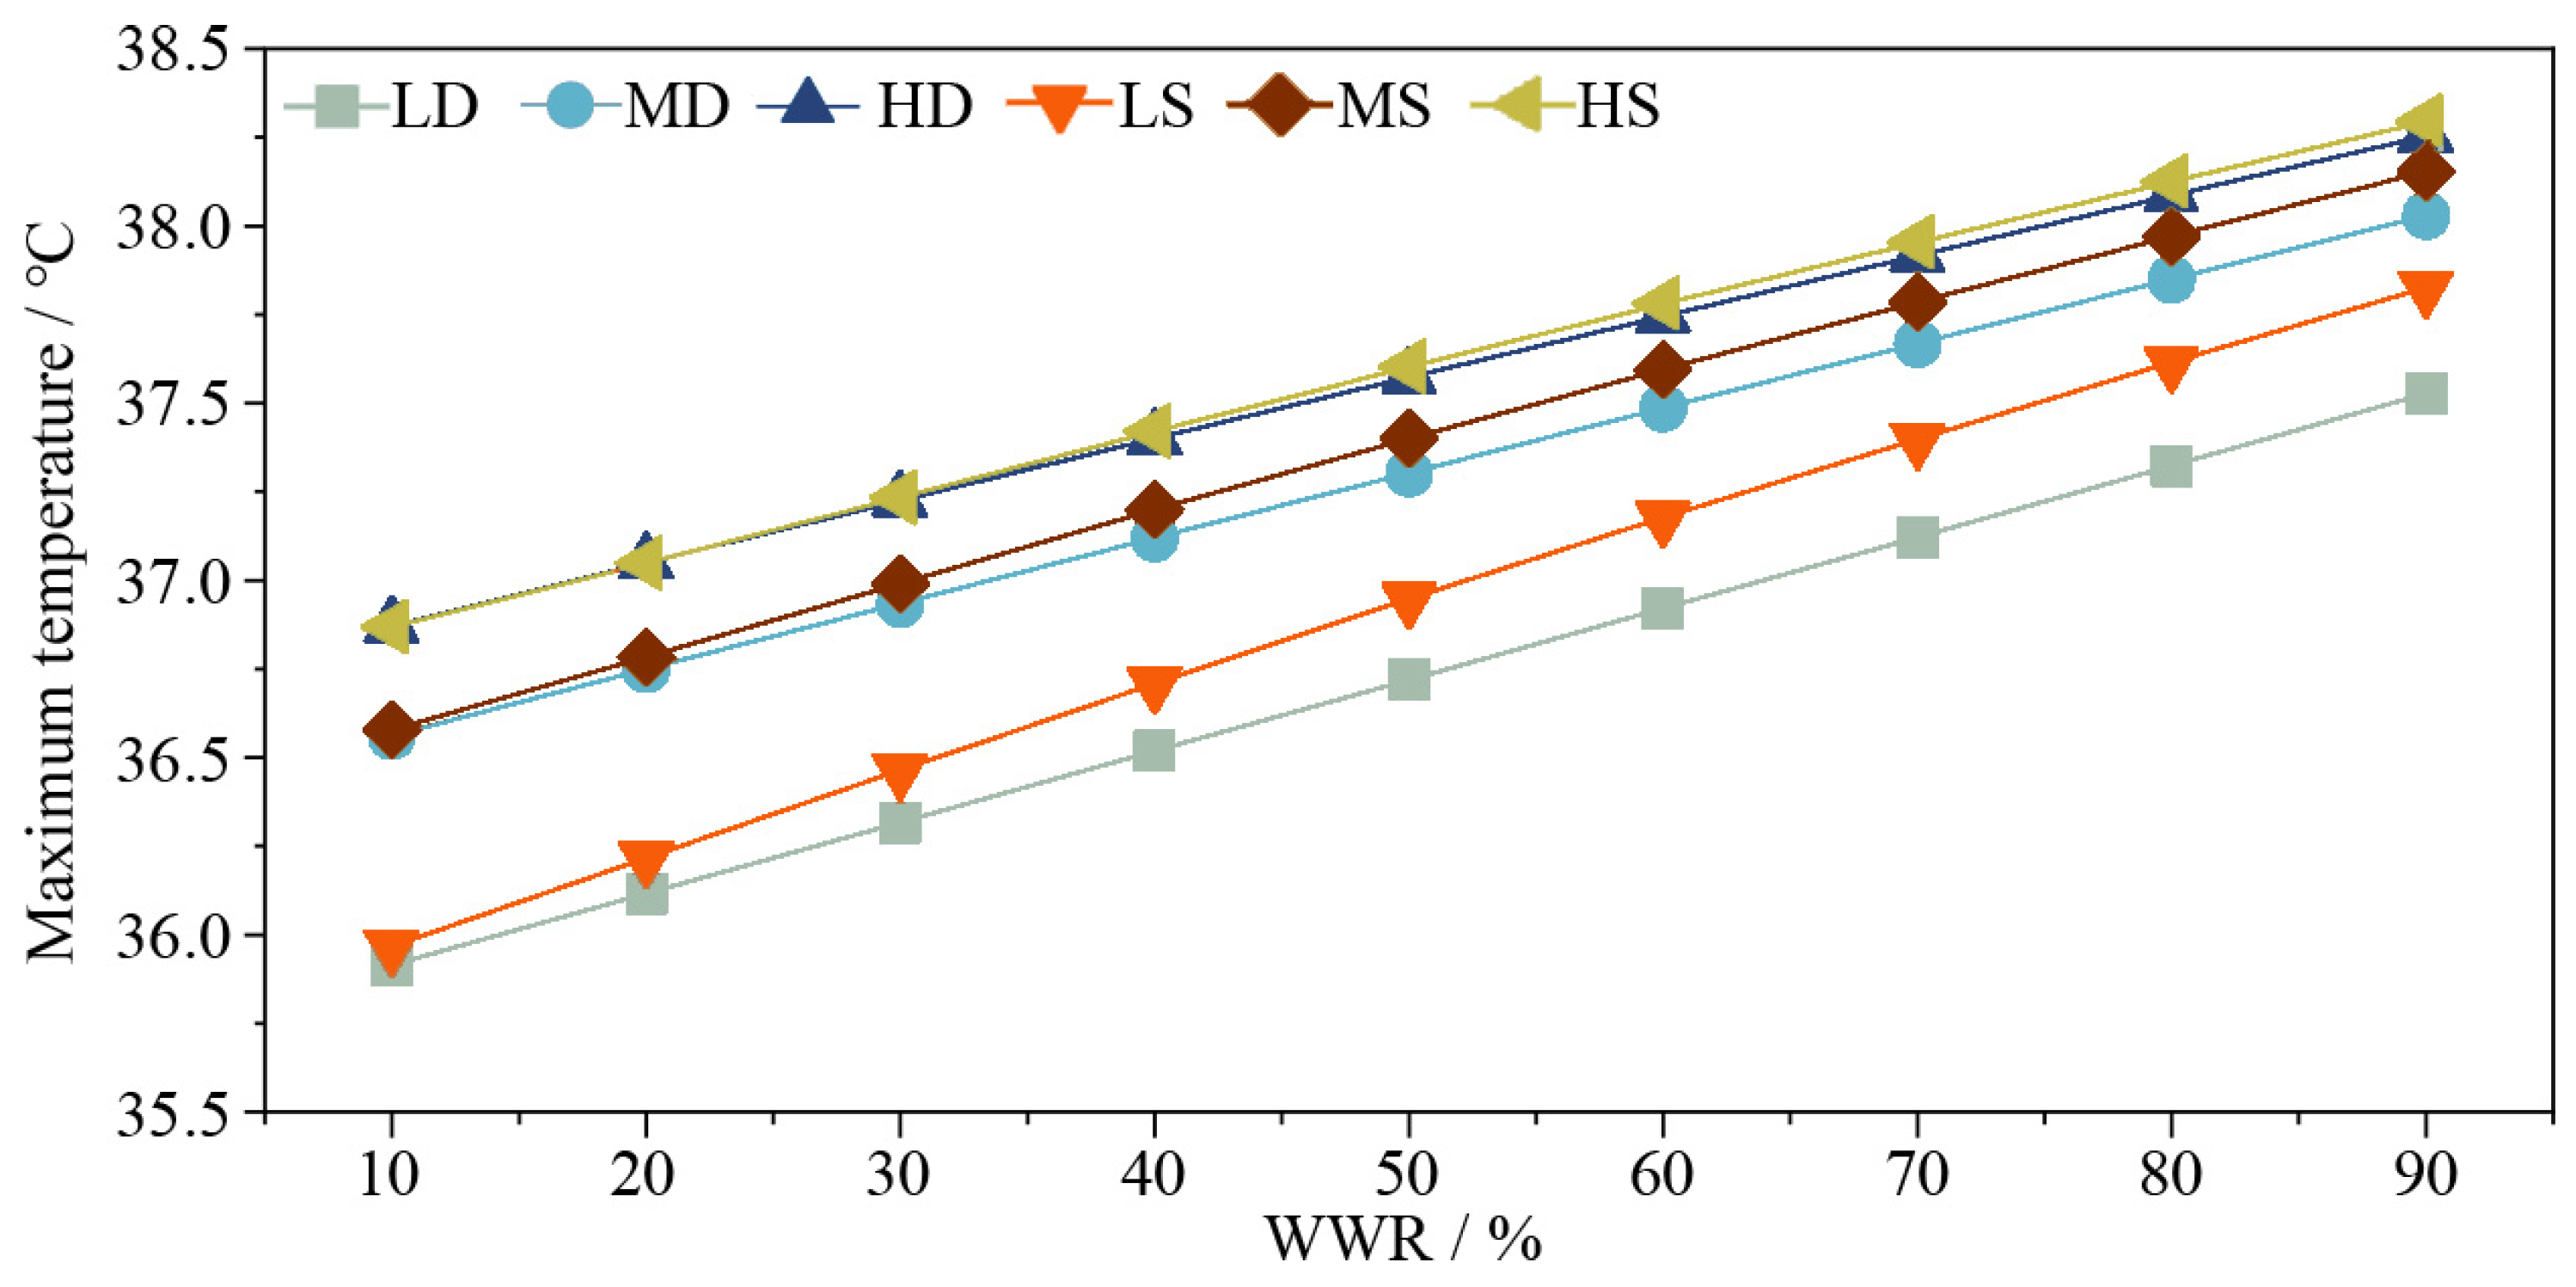
Figure 4 shows the daily average Tmax, revealing noteworthy distinctions between buildings with varying thermal masses and window configurations. Heavy thermal mass exhibits a higher daily average Tmax compared to their light thermal mass, with a discernible difference ranging from 0.47 to 0.96 °C. This elevation in temperature can be attributed to the retention of a substantial amount of heat absorbed during the preceding day. If this heat is not effectively released during the night, it contributes to a sustained exothermic effect, resulting in an increased indoor temperature [45]. The impact of window performance is also evident, as the daily average Tmax for the single-glazed window exceeds that of the double-glazed window by 0–0.30 °C. This discrepancy arises from the greater solar radiation penetration of the single-glazed window, leading to the accumulation of more heat. Furthermore, an increase in the WWRs correlates with a gradual rise in the daily average Tmax (0.49–5.17%). This phenomenon is attributed to the low solar altitude angle in Qingdao during this period, causing buildings with high WWRs to receive more solar radiation throughout the day, significantly elevating the total heat absorbed [4]. During this time, the impact of window performance on daily average Tmax intensifies, while the influence of thermal mass diminishes. This observation underscores the interactive nature of the effects of thermal mass, window performance, and WWRs on Tmax. In summary, buildings characterized by heavy thermal mass, the single-glazed window, and high WWRs are more susceptible to indoor overheating. Effective adjustment of heat transfer and dissipation mechanisms emerges as a pivotal consideration for managing indoor temperatures in such public buildings.
Notably, several studies suggest that buildings with high thermal mass demonstrate a greater capacity to reduce maximum temperatures during night ventilation. Kolokotroni et al. [46] observed a 2.5 K reduction in Tmax for a room with heavy thermal mass when night ventilation increased from 0 to 10 air changes per hour (ACH). In comparison, a room with light thermal mass experienced a greater reduction of 4.0 K. Shaviv et al. [47] reported a 2.2 K decrease in Tmax for heavy buildings compared to light buildings at a ventilation rate of 2 ACH, with a temperature fluctuation of 9.5 K. This difference became more pronounced with higher ventilation volumes. Similarly, Hacker et al. [48] found that increasing night ventilation to 6 ACH resulted in a reduction of 1.8 K and 5.0 K in Tmax for buildings with medium and very heavy thermal mass, respectively. Notably, no active/passive measures were employed in these studies, and the impact of night ventilation warrants further consideration in subsequent research.

3.3. The Daily Average Minimum Temperature

Figure 5 shows the daily average Tmin, revealing distinct trends influenced by thermal mass, window performance, and WWRs. The daily average Tmin exhibits a gradual increase with heavy thermal mass, ranging from 0.32 to 0.89 °C. The heavy thermal mass, due to its capacity to absorb and store more heat during the day, experiences challenges in dissipating internal heat without night ventilation, resulting in elevated temperatures. Comparatively, the single-glazed window consistently displays a lower daily average Tmin than the double-glazed window, with a reduction of 0.07–1.23 °C. This discrepancy is attributed to the higher heat transfer coefficient of the single-glazed window. As WWRs increase, the daily average Tmin of the double-glazed window rises by 0.07–0.62 °C, while that of the single-glazed window decreases by 0.02–0.72 °C. The enhanced heat dissipation capacity of the single-glazed window and higher WWRs facilitate the release of a significant amount of heat to the outside [49]. However, as WWRs continue to increase, this increase/decrease effect gradually diminishes, primarily influenced by outdoor ambient temperature fluctuations [31]. In summation, during the summer, buildings characterized by light thermal mass, the single-glazed window, and high WWRs demonstrate improved indoor and outdoor heat exchange capabilities. This characteristic aids in reducing nighttime indoor temperatures and mitigating the accumulation of heat during the day.

3.4. The Daily Average Temperature Fluctuation

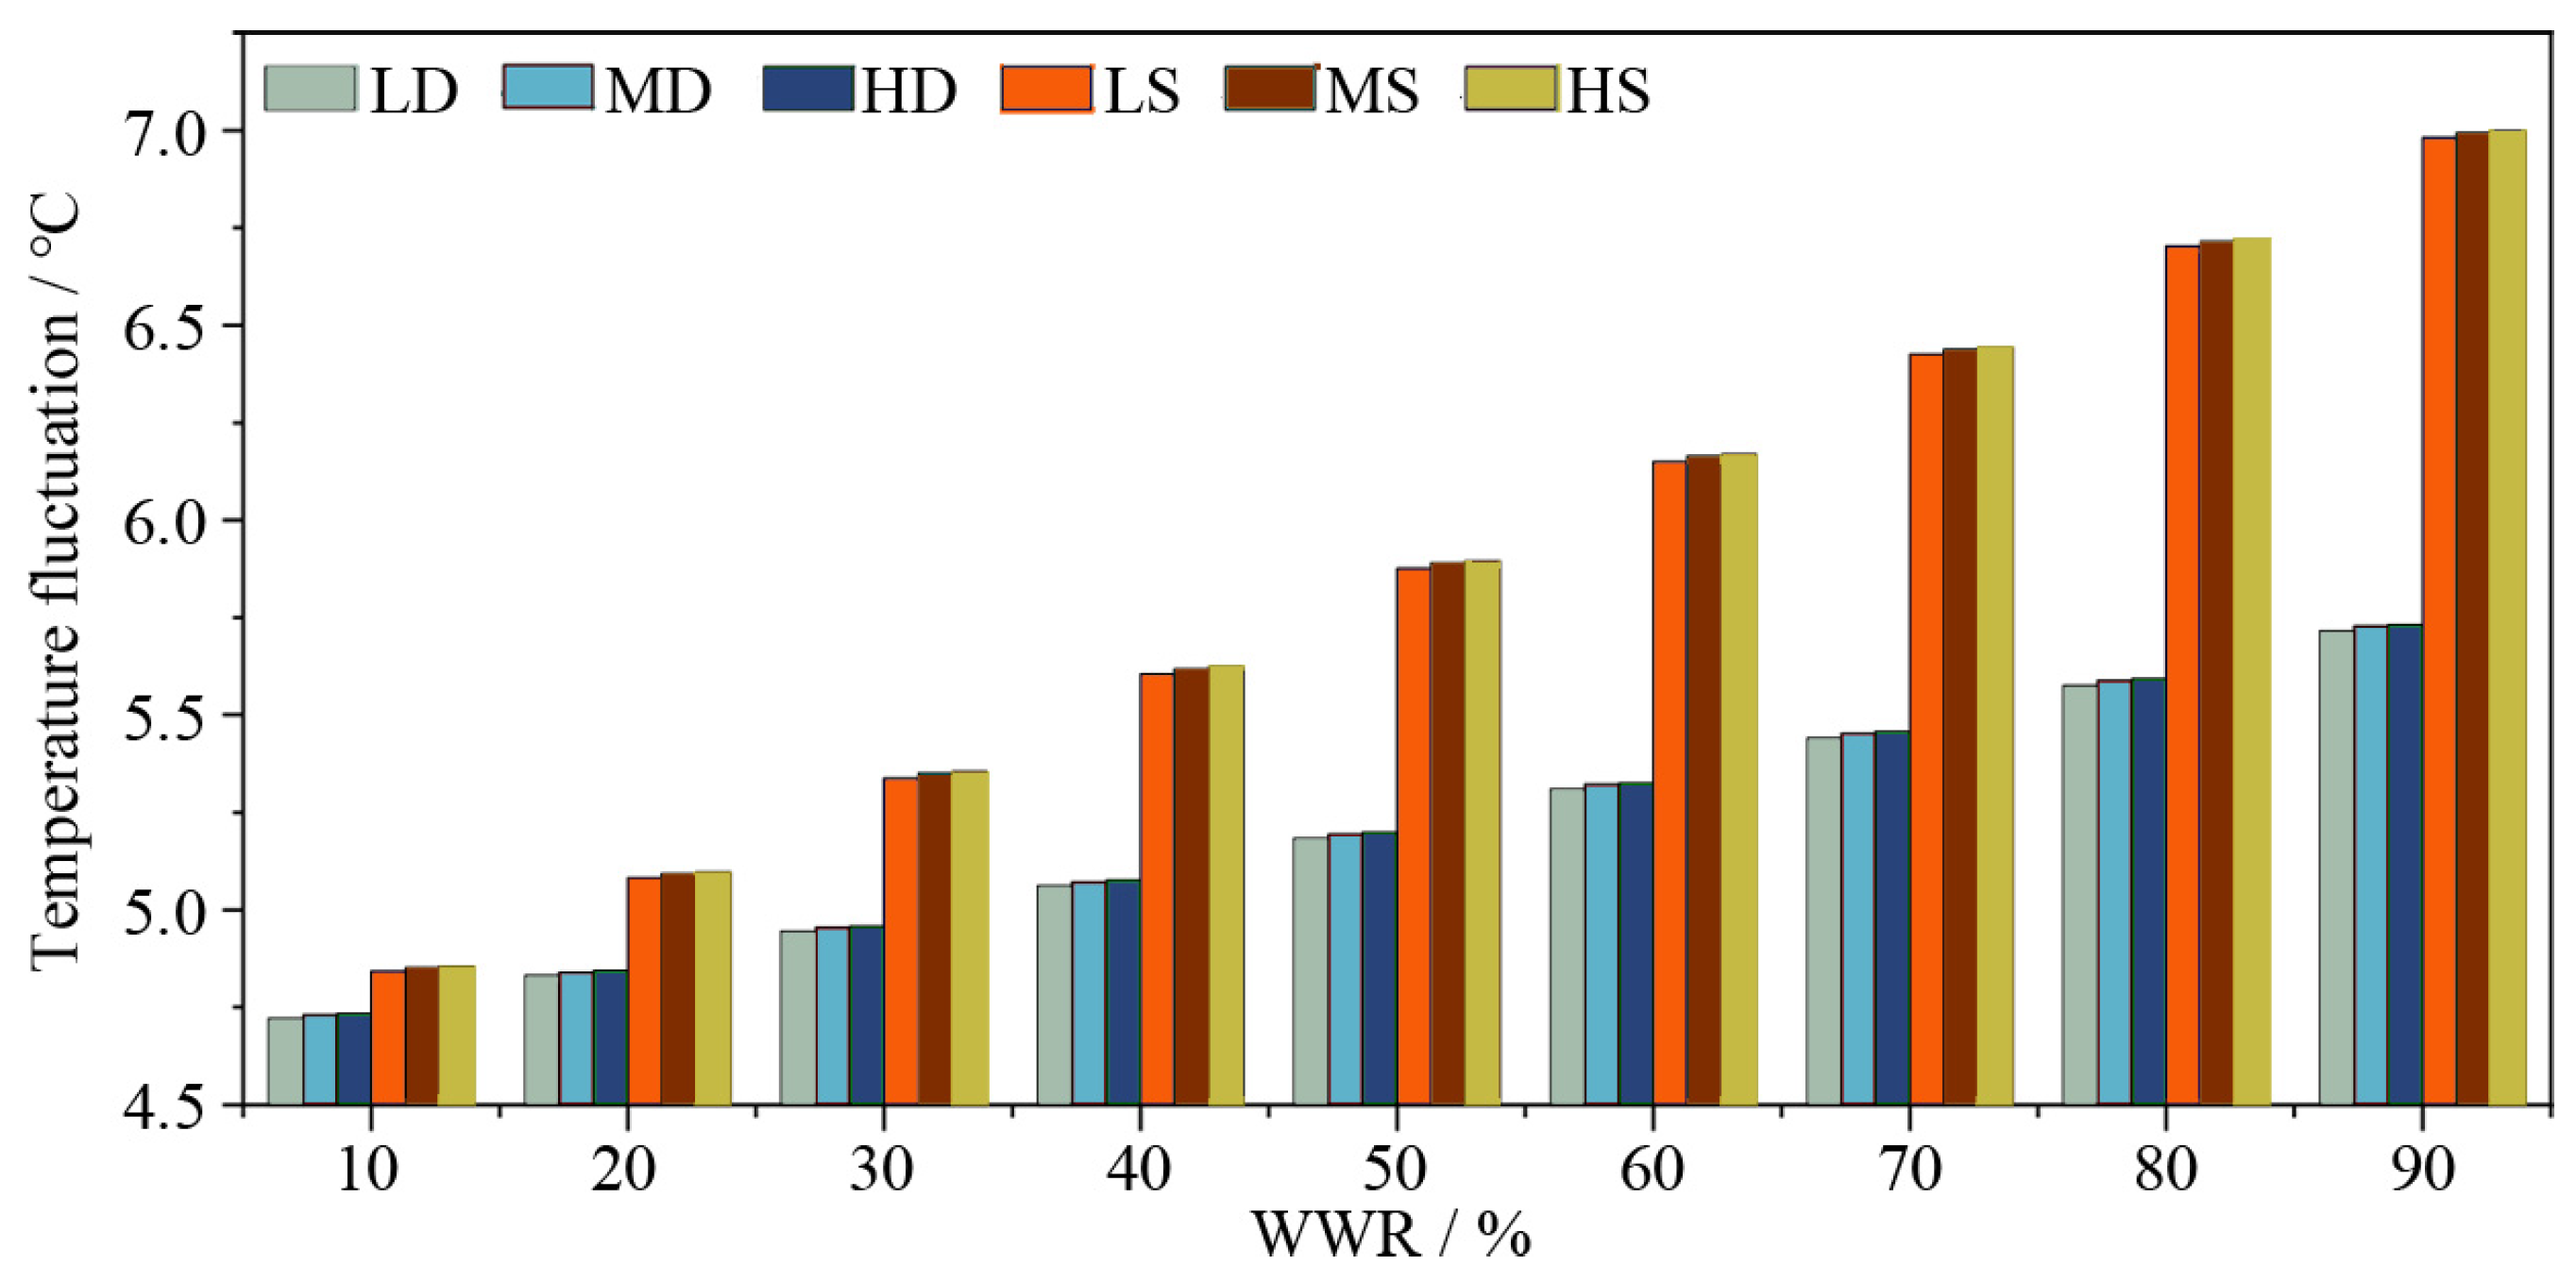
Figure 6 shows the daily average Tflu, representing the range between the average Tmax and Tmin. Increasing the thermal mass leads to a slight elevation in the daily average Tflu, with increases ranging from 0.18% to 0.29%. Comparatively, buildings with the single-glazed window exhibit a higher average Tflu, ranging from 0.12% to 0.27%, in comparison to the double-glazed window. As WWRs increase, the daily average Tflu gradually rises (0.99% to 2.14%), with a more pronounced impact on the single-glazed window (4.95% to 44.18%). This outcome underscores the significant influence of solar radiation on the indoor temperature of buildings with the single-glazed window and high WWRs. Strong solar radiation intensifies daytime temperatures [27], while the enhanced heat dissipation effect contributes to lower nighttime temperatures and, consequently, a larger Tflu [31]. Kuczyński et al. demonstrated in two field studies that enhancing the thermal mass of building envelopes can significantly reduce peak indoor temperatures while also minimizing diurnal temperature variations, which is critical for enhancing thermal comfort in temperate climates [2,43]. Given that their research was conducted in a temperate climate, the findings are particularly relevant for improving indoor thermal comfort in regions with similar weather patterns. In contrast, in Qingdao, where summer daytime indoor temperatures tend to be relatively high, small diurnal temperature fluctuations can hinder thermal comfort. Maximizing nighttime heat dissipation could effectively reduce indoor air temperatures [32]. High-WWR designs and single glazing, known for their strong heat exchange capabilities, may therefore offer potential benefits for passive energy efficiency in office buildings in such climates.

3.5. The Attenuation Coefficient

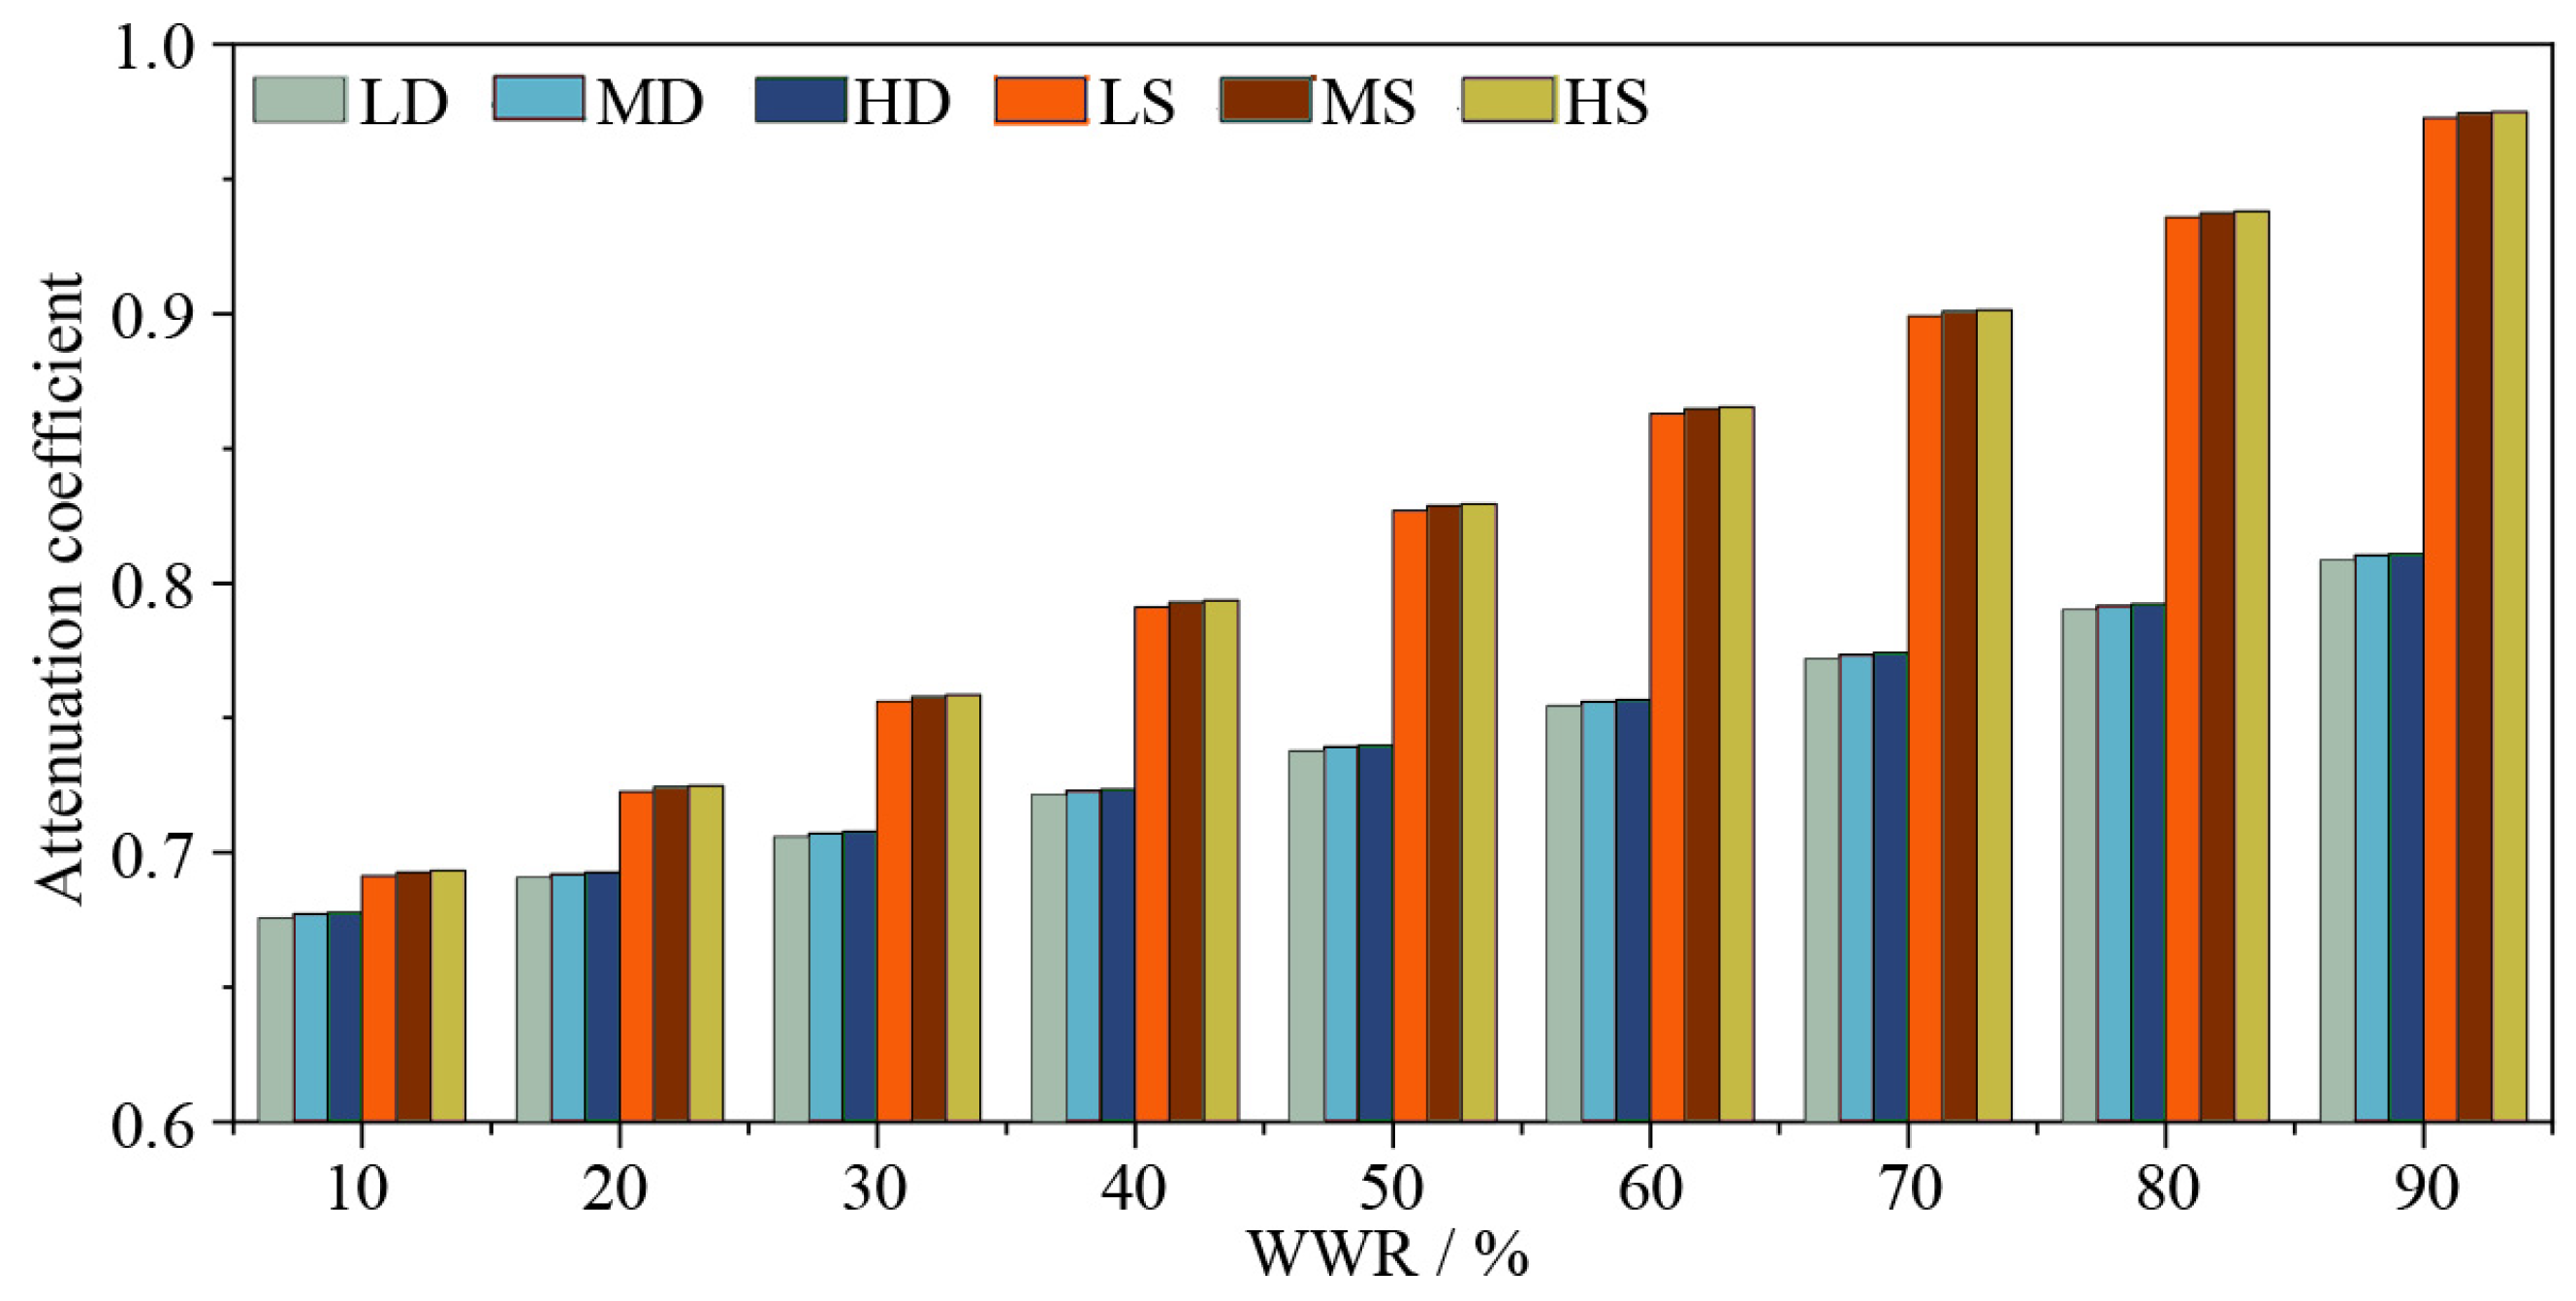
The attenuation coefficient, representing the ratio of daily amplitude between indoor and outdoor temperatures, serves as a valuable indicator for evaluating building overheating. As depicted in Figure 7, thermal mass exerts a minimal influence on the attenuation coefficient. In comparison to light thermal mass, heavy thermal mass exhibits only a slight increase in the attenuation coefficient, ranging from 0.18% to 0.24%. The impact of window performance on the attenuation coefficient is more pronounced, with the single-glazed window showing an increase of 2.29–20.25% compared to the double-glazed window. With an escalation in WWRs, the attenuation coefficient gradually increases by 0.13–0.28, signifying an intensification of indoor overheating, particularly evident in the case of the single-glazed window, where the increase ranges from 4.54% to 40.72%. This observation aligns with earlier research carried out by Sun et al. [9] and Xie et al. [31]. The heavy thermal mass, with its superior insulation capabilities, impedes the transfer of internal heat to the outdoors at night, potentially hindering efforts to alleviate overheating [9]. Conversely, the combination of the single-glazed window and high WWRs enhances the building’s heat accumulation during the day, contributing to prolonged overheating periods [31,50].

3.6. The Occurrence of Extreme Superheat Temperatures During the Operational Period

While the summer temperatures in Qingdao often exceed the thermal comfort zone (18–26 °C), users have the potential to implement adaptive measures to mitigate thermal discomfort. As the temperature approaches the thermal comfort zone, the tolerance for thermal discomfort increases, enhancing the probability of maintaining thermal comfort. During the August utilization period (8:00–18:00), instances where room temperature exceeds 37 °C are considered unbearable and detrimental to human health.
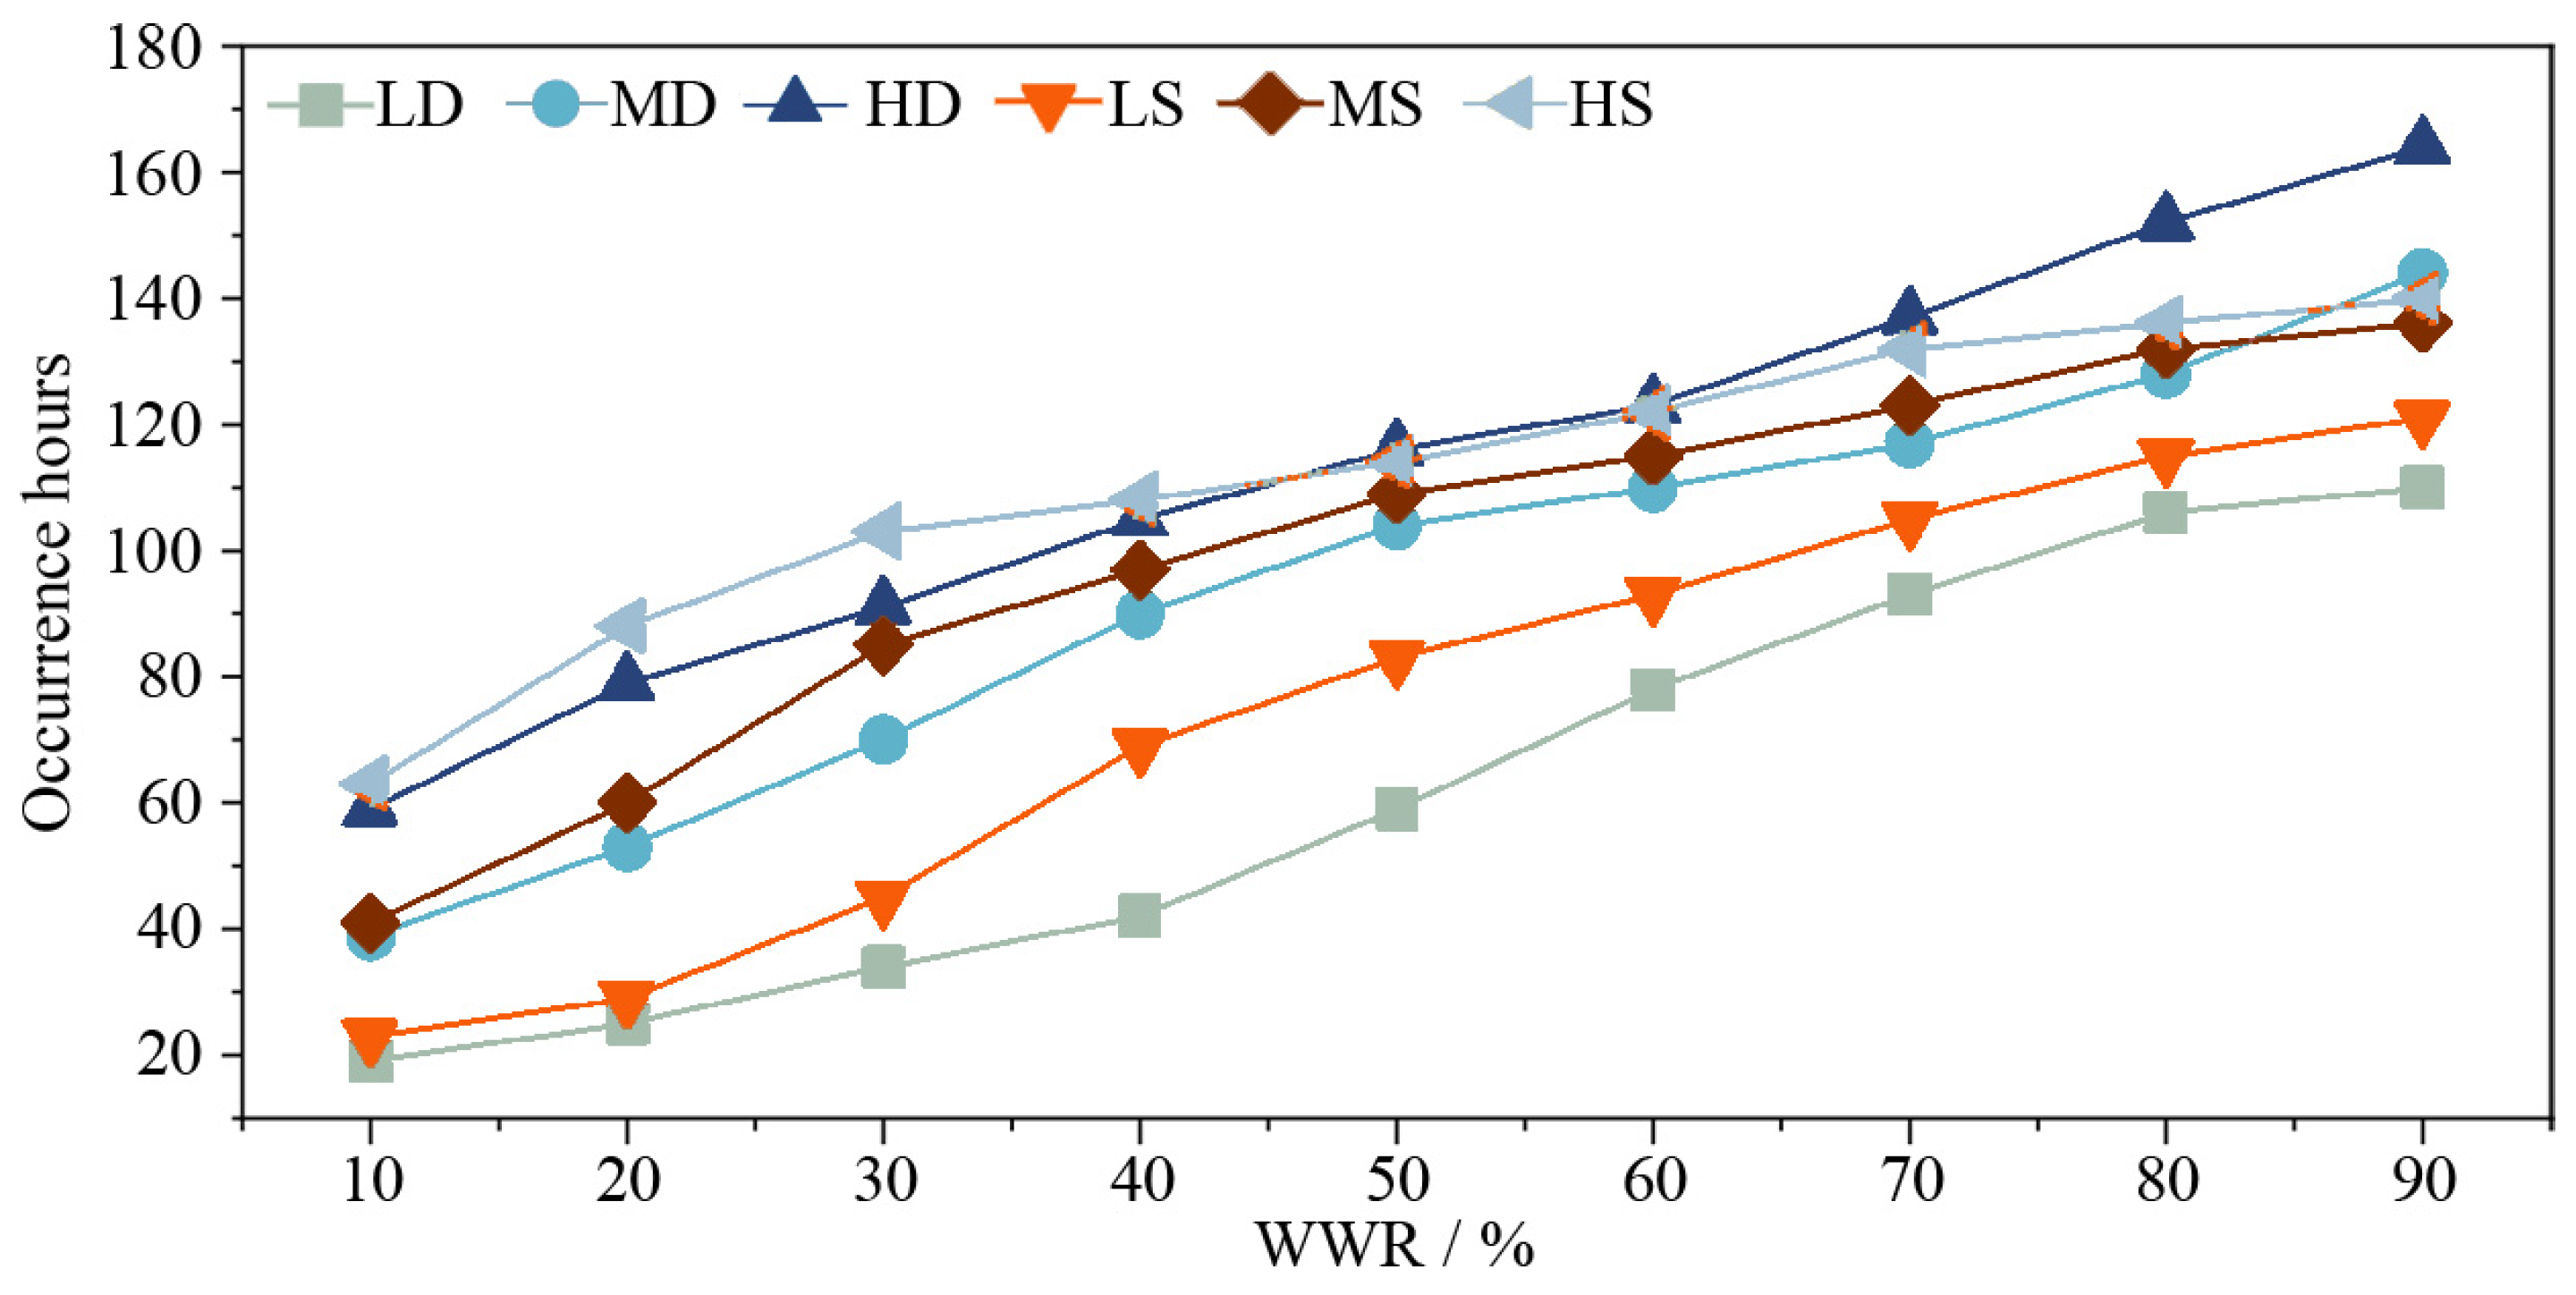
Figure 8 illustrates the occurrence of extreme superheat temperatures (≥37 °C) during the operational period. Light-thermal-mass buildings experience a reduction in extreme superheat temperature duration, ranging from 15 to 63 h, compared to medium- and heavy-thermal-mass buildings. Notably, buildings with double-glazed windows consistently exhibit the shortest duration of extreme superheat temperature (19–110 h). When WWRs are less than 50%, the duration of extreme superheat temperature in single-glazed windows is consistently longer than that in double-glazed windows. However, as thermal mass and WWRs increase, this difference initially grows and then diminishes. For WWRs ≥ 50%, buildings with heavy thermal mass and double-glazed windows experience the longest duration of extreme superheat temperature, ranging from 116 to 164 h. Notably, at a WWR of 90%, buildings with medium thermal mass and double-glazed windows also experience a significant increase in extreme superheat temperature duration, reaching 144 h. These findings suggest that in buildings with high WWRs, increased thermal mass and the use of double-glazed windows lead to more pronounced thermal discomfort. This observation is consistent with the studies by Sierra-Perez et al. [51] and Zune et al. [52]. However, Artmann et al. [53] found that increasing the thermal mass of a building from light to heavy with a night ventilation rate of 8 ACH can effectively reduce the number of overheating hours. In a field study, Kuczyński et al. found that in an exceptionally hot month with an average outdoor temperature of 22.5 °C, the use of high-thermal-mass walls reduced the duration of Tin exceeding 28 °C from 18.6 days to just 8 h, significantly decreasing high-temperature exposure [43]. This indicates that the impact of thermal mass on indoor thermal environments in high-WWR buildings is particularly pronounced and context-dependent. This highlights the potential of exploring the impact of night ventilation on buildings with varying thermal masses as a promising avenue for future research.

3.7. The Cooling Load

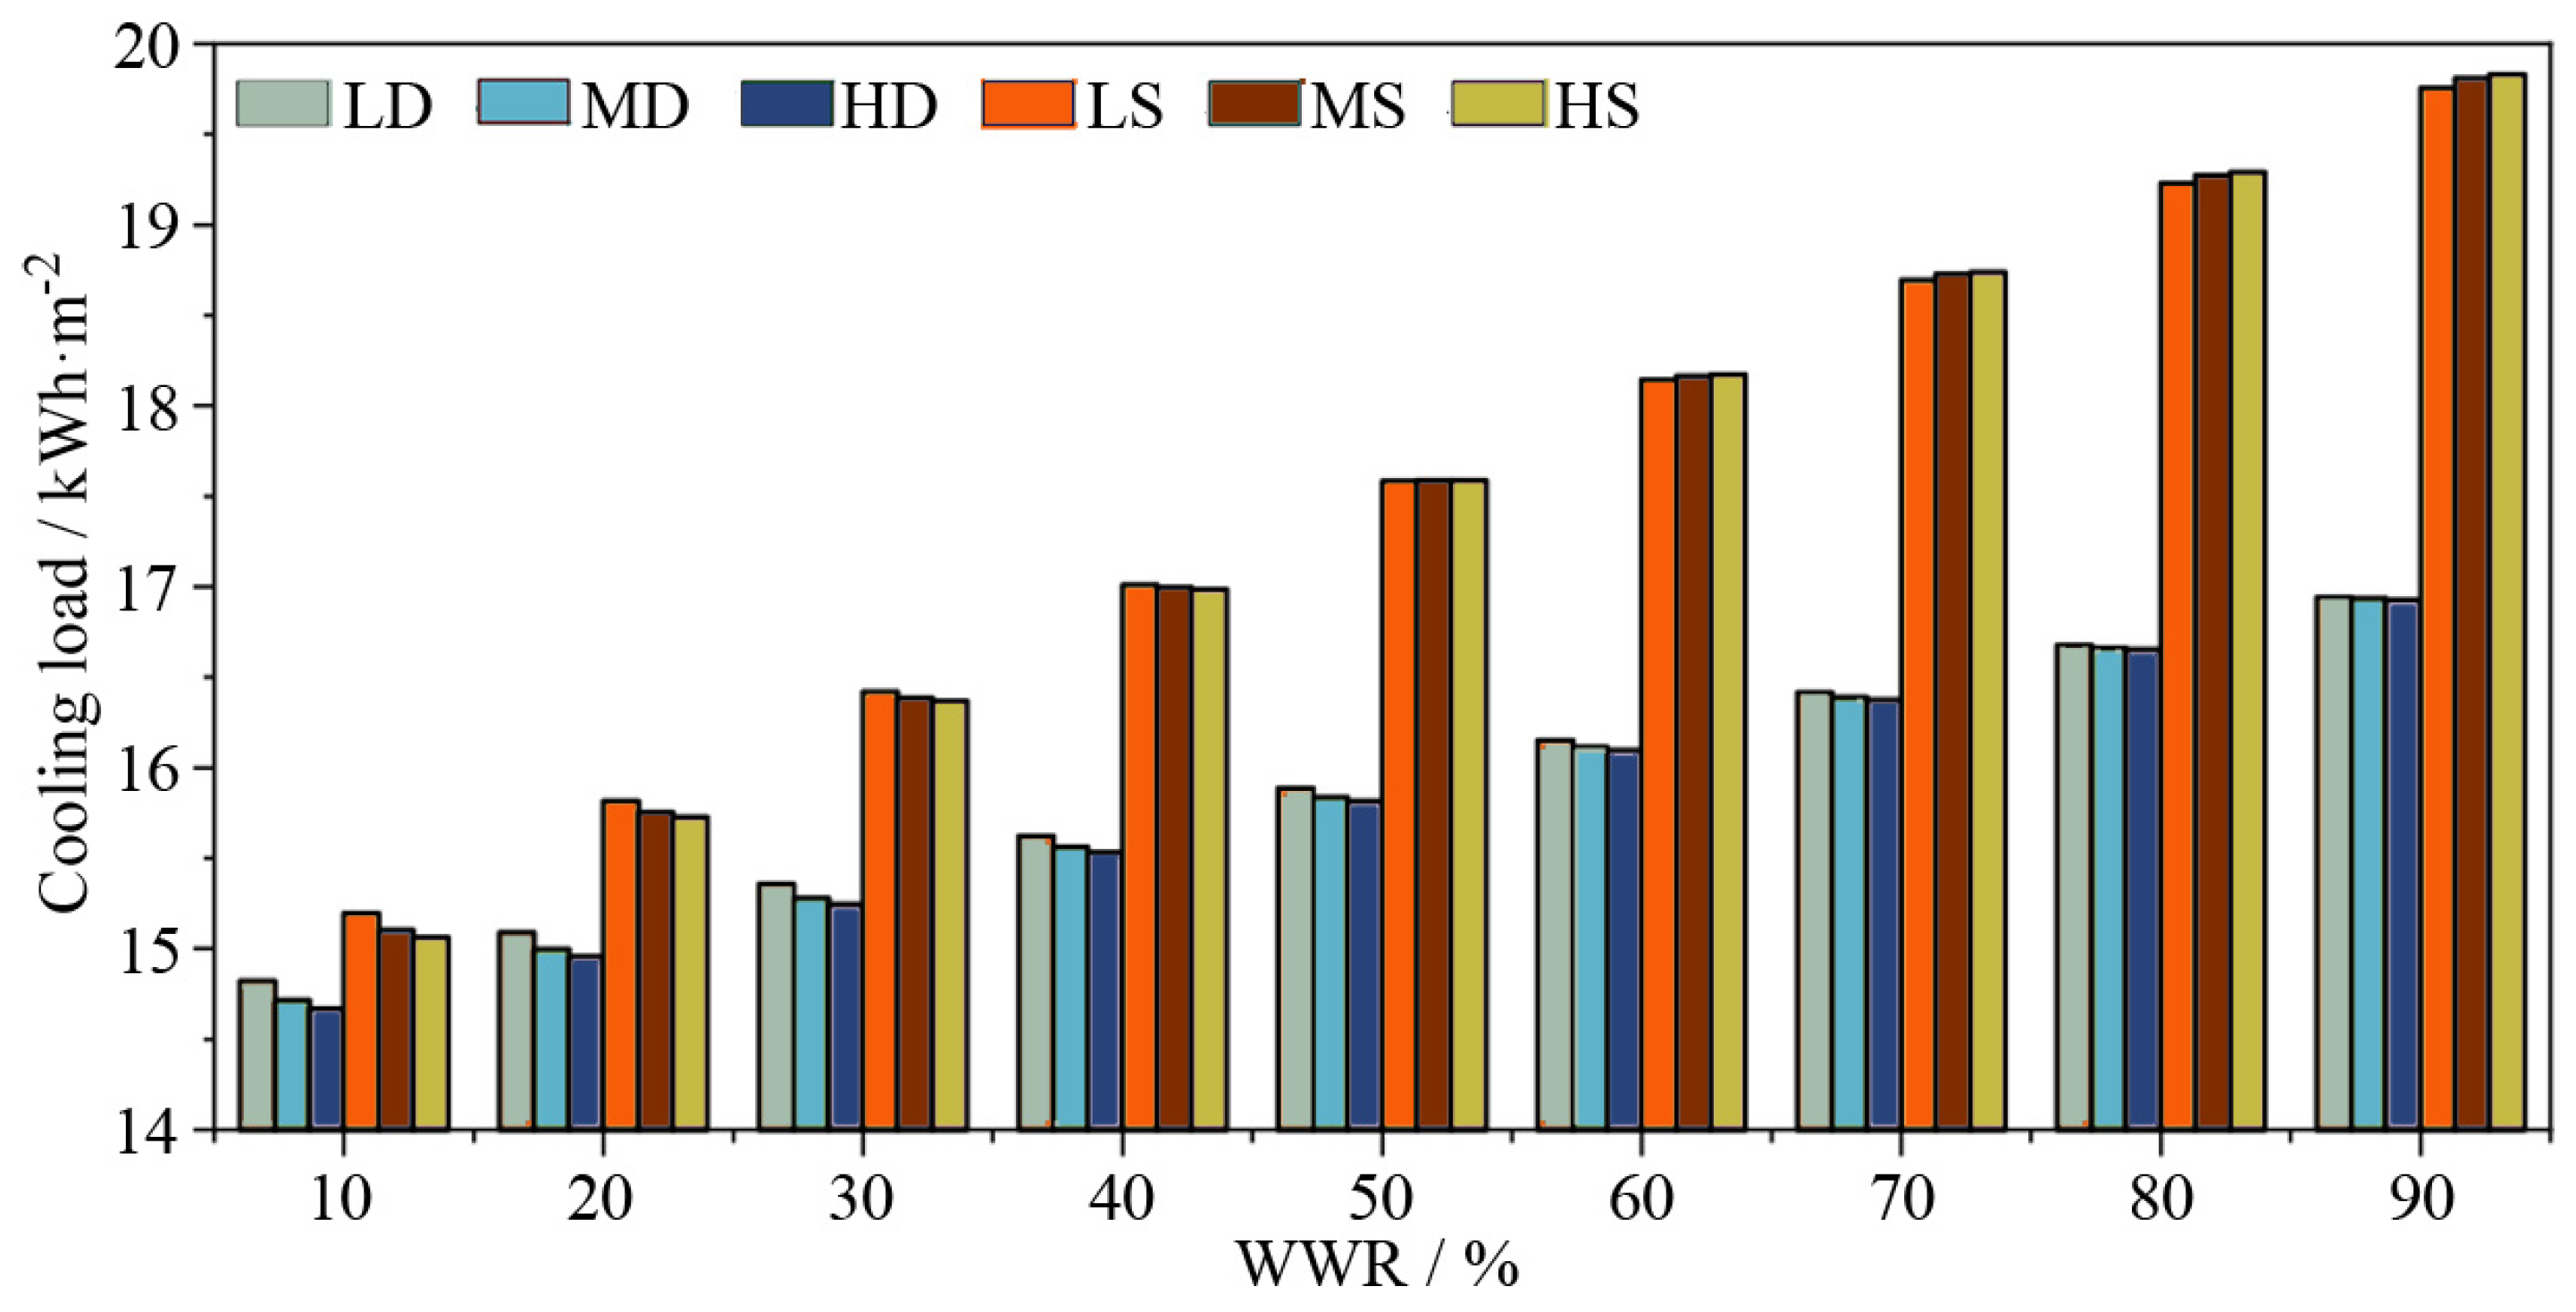
The study also conducted simulations of the building’s refrigeration energy consumption after activating the mechanical ventilation system. In this scenario, the indoor temperature during the operational period is maintained at 26 °C. Figure 9 shows the cooling load in August. The influence of thermal mass on the cooling load depends on window performance and WWRs. In buildings employing the double-glazed window and higher thermal mass, it correlates with a lower cooling load. Heavy thermal mass exhibits a reduction in the cooling load ranging from 0.07% to 1.04% when compared to light thermal mass. This outcome suggests that heavy thermal mass is more effective in transferring heat to the outside during the night, thereby decreasing indoor temperatures and enhancing heat storage during the day, ultimately resulting in a reduced cooling load [25,54]. With an increase in WWRs, the cooling load experiences an increment of 1.80% to 15.42%. However, the influence of thermal mass on this variation gradually diminishes. In buildings featuring single-glazed windows, when WWRs < 50%, the cooling load gradually decreases with the increase in thermal mass (0.13–0.86%). Conversely, when WWRs ≥ 50%, the cooling load gradually increases with the rise in thermal mass (0.02–0.38%). Overall, as WWRs increase from 10% to 90%, the cooling load demonstrates an increase ranging from 4.09% to 31.65%. In a field study, Ahmad et al. observed that walls with a low thermal conductivity (0.85 W·m−2K−1) reduced summer cooling loads by 26.0% compared to walls with a high thermal conductivity (2.08 W·m−2K−1) [39]. It is evident that controlling the WWR is crucial for energy conservation. However, with the increasing prevalence of glass curtain walls in modern public buildings, many structures are now characterized by high WWRs. For buildings with high WWRs, it is generally recommended to prioritize the use of glazing with high-thermal-insulation performance. In cases where the use of large-area single-glazed windows is unavoidable, lightweight walls are preferred to alleviate the issue of summer overheating. This recommendation is primarily based on the fact that lightweight walls have a lower thermal mass compared to heavy walls, allowing them to release absorbed heat more rapidly during the daytime, thereby reducing indoor heat retention and minimizing overheating effects. Since single-glazed windows have a relatively high heat transfer coefficient, they tend to facilitate greater heat accumulation indoors [31]. In contrast, lightweight walls can more effectively conduct this accumulated heat to the exterior, mitigating the risk of indoor heat buildup and enhancing overall cooling efficiency. Additionally, during nighttime, when external temperatures drop, lightweight walls can quickly dissipate the heat accumulated during the day, thereby reducing the cooling load on mechanical systems and improving overall energy efficiency. Nevertheless, it is essential to recognize that lightweight walls may have inferior thermal insulation properties. However, this limitation can be addressed through the incorporation of external insulation layers, low-emissivity coatings, and effective nighttime ventilation strategies, ultimately achieving a balanced method to energy efficiency and thermal comfort.
This study highlights the energy-saving potential associated with high WWRs, which facilitate effective heat exchange between indoor and outdoor environments, thereby enabling nighttime cold storage benefits. Guo et al. [49] emphasized that buildings with high WWRs can enhance nighttime cold storage, maximizing cooling capacity utilization. Xie et al. [31] also noted that in warmer climates, buildings with high WWRs (>70%) tend to outperform those with low WWRs (<30%), potentially lowering indoor temperatures by 5–10 °C as the WWR increases. However, the unique benefits of high WWRs require further exploration, especially considering their influence on solar radiation. Intense solar exposure increases daytime temperatures, while substantial cooling effects cause nighttime temperatures to drop, leading to significant temperature fluctuations. This fluctuation effectively transfers accumulated daytime heat to the outside, enhancing the building’s nighttime cold storage capacity and ultimately contributing to improved thermal comfort the following day. To address the potential limitations associated with high WWRs, such as excessive solar gain and temperature fluctuations, several measures can be considered. Incorporating shading devices, ventilation strategies, and refrigeration can mitigate the effects of solar radiation and enhance thermal comfort [55]. Additionally, integrating cold storage materials like phase change materials can further enhance nighttime cold storage capacity and release it at opportune times, preventing excessively low temperatures during early usage stages and reducing maximum temperatures. Furthermore, considering the day–night temperature difference in high-WWR thermal performance, the use of smart glass windows provides the opportunity for dynamic adjustments in shading areas, further contributing to energy savings. Future research should focus on critically analyzing the implications of high WWRs and developing strategies to overcome potential limitations, thereby maximizing their energy-saving potential and applicability in various climatic conditions.
Compared to double glazing, single glazing has a smaller thermal capacity and a higher thermal transmittance, allowing for faster heat conduction. This characteristic is particularly advantageous for high-WWR buildings, where nighttime heat dissipation is critical. Single glazing significantly reduces the thermal lag effect, allowing for more efficient nighttime cooling despite the increased daytime heat gain [21]. During nighttime, as the outdoor temperature drops, single glazing can more rapidly transfer accumulated indoor heat to the exterior, reducing indoor temperature fluctuations and improving overall cooling efficiency. This is particularly beneficial in cities like Qingdao, where summer nighttime temperatures are generally lower, enhancing the potential for natural cooling and reducing residual indoor heat. However, single glazing does lead to higher daytime heat gains, which can be mitigated through supplementary measures such as external shading, low-emissivity coatings, natural ventilation, or the use of high-reflectivity glass and smart curtains. These strategies can help offset the increased daytime solar heat gain, further improving overall energy efficiency. In contrast, double glazing, while providing better daytime insulation, has a higher thermal capacity, resulting in slower heat release and potentially higher nighttime temperatures [31]. This heat retention effect is particularly noticeable in regions with large diurnal temperature variations, like Qingdao, where it can compromise nighttime thermal comfort by increasing cooling loads. Our experimental measurements in August showed that for a 30 m2 room with a 50% WWR, the maximum daytime temperature was 34.1 °C for single glazing and 31.7 °C for double glazing, while the minimum nighttime temperatures were 24.3 °C and 25.1 °C, respectively. The cooling load for the single-glazed room was 1.6 kWh·m−2 lower than that for the double-glazed room. Overall, while single glazing may not be as effective for low-WWR buildings where nighttime heat dissipation is less critical, its rapid heat release capability in high-WWR buildings can effectively counteract daytime heat accumulation, significantly improving overall thermal comfort.
Compared to conventional single-factor studies, this study simultaneously considers the combined effects of thermal mass, window performance, and WWR on the indoor thermal environment of buildings, addressing a critical gap in multi-factor interaction studies. It demonstrates the advantages of TRNSYS parametric modeling for precise simulation and multi-scenario evaluation, emphasizing the energy-saving potential of buildings with high WWRs. These findings provide practical design guidance for architects and engineers in selecting appropriate WWRs, optimizing thermal mass, and configuring window types. However, this study has certain limitations. The model was developed under the assumption of no active cooling, which may not fully reflect real-world conditions. Future studies should incorporate real-world data to validate and refine the simulation results. Additionally, while this study focuses on the climate of Qingdao, the applicability of the findings to other climate zones remains uncertain and requires further exploration. This study utilized weather data obtained from the Meteonorm database, which, while comprehensive, may differ from actual site conditions. Future research should include on-site measurements to enhance model accuracy. Furthermore, long-term thermal stress and building lifecycle impacts on overall energy performance should be considered in subsequent studies to provide a more comprehensive evaluation of building energy efficiency.

4. Conclusions

This study thoroughly explores the relationship between thermal mass, window performance, and the WWR and the summer thermal comfort of public buildings. Using parametric modeling, the research analyzes the impact of the aforementioned factors and underscores the importance of optimizing these variables for the green and sustainable development of public buildings. The specific research conclusions are as follows:
  • With the increase in thermal mass, the daily average maximum temperature increases by 0.33–0.96 °C. The daily average maximum temperature of the double-glazed window increased by 0–0.30 °C compared to the single-glazed window. With the increase in WWRs, the daily average maximum temperature increased by 1.43–1.67 °C. At this time, the influence of thermal mass on the daily average maximum temperature decreases, while the influence of window performance on the daily average maximum temperature increases. High WWRs can cause excessive indoor temperatures, especially for buildings using single-glazed windows.
  • The daily average minimum temperature of heavy thermal mass is 0.14–0.31 °C and 0.45–0.94 °C higher than that of medium and light thermal mass, respectively. With the increase in WWRs, the daily average minimum temperature of the double-glazed window increased by 0.21–1.98%, while the daily average minimum temperature of the single-glazed window decreased by 0.06–2.24%. The increase in WWRs weakens the effect of thermal mass on the daily average minimum temperature. Light thermal mass, the single-glazed window, and high WWRs contribute to the building’s nighttime heat dissipation.
  • With the increase in thermal mass, the daily average Tflu increased by 0.18–0.29%, and the influence was weak. Compared with the double-glazed window, the daily average Tflu of the single-glazed window increased significantly by 2.56–22.14%. With the increase in WWRs, the daily average Tflu also increased significantly (2.33–44.18%). In Qingdao’s summer, buildings with single-glazed windows and high WWRs are more conducive to improving thermal comfort.
  • With the increase in thermal mass and WWRs, the attenuation coefficient increases by 0.18–0.24% and 2.18–40.72%, respectively, while the attenuation coefficient of the single-glazed window is 0.02–0.15 higher than that of the double-glazed window, which is more likely to cause indoor overheating. However, from the point of view of the occurrence time of different temperatures during the operational period, when the WWRs ≥ 50%, the single-glazed window shows better performance than the double-glazed window, and the extreme temperature occurrence time is reduced by 0.81–14.63%.
  • When the refrigeration system is turned on, the increase in WWR leads to an increase in the cooling load (14.30–30.56%). In double-glazed buildings, the cooling load decreases by 0.07–1.04% with the increase in thermal mass; in single-glazed buildings, when WWRs < 50%, the cooling load decreases by 0.13–0.86% with the increase of thermal mass. When WWRs ≥ 50%, the cooling load increases by 0.02–0.38% with the increase in thermal mass. Controlling WWRs is the key to energy conservation, and light thermal mass is recommended for buildings with high WWRs and single-glazed windows.
Our study underscores the significant role of WWRs in determining the thermal performance of buildings. While buildings with heavy thermal mass, double-glazed windows, and low WWRs demonstrate reduced cooling loads, it is important to note that higher thermal mass does not necessarily translate to enhanced passive energy conservation. With the increasing prevalence of public buildings featuring high WWRs, devising strategies to enhance their thermal comfort and energy efficiency is of paramount importance. Our findings indicate that high-WWR configurations with single-glazed windows can absorb considerable solar radiation during the daytime, leading to increased indoor temperatures. However, these designs also demonstrate a strong capacity for nighttime heat dissipation, presenting substantial energy-saving potential. To enhance both thermal comfort and energy efficiency in buildings with high WWRs, it is crucial to adopt shading strategies that reduce daytime solar heat gain and leverage night ventilation for effective heat release. Future studies should explore innovative approaches to mitigate the thermal challenges of high WWRs, such as incorporating advanced materials like phase change materials for improved nighttime cooling and implementing smart glass technologies for dynamic solar control. By addressing these aspects, we can further advance our understanding of the thermal performance of buildings with high WWRs and develop more effective strategies for enhancing their energy efficiency and occupant comfort.

Author Contributions

Conceptualization, R.C. and N.Z.; methodology, R.C.; software, B.Y.; validation, R.C., N.Z. and Y.S.; formal analysis, W.Z.; investigation, Y.S.; resources, N.Z.; data curation, N.Z.; writing—original draft preparation, N.Z.; writing—review and editing, W.Z.; visualization, W.G.; supervision, B.Y.; project administration, W.Z. All authors have read and agreed to the published version of the manuscript.

Funding

The authors received no financial support for the article.

Data Availability Statement

The data presented in this study are available on request from the corresponding author.

Conflicts of Interest

The authors declare no conflicts of interest.

References

  1. Alayed, E.; Bensaid, D.; O’Hegarty, R.; Kinnane, O. Thermal Mass Impact on Energy Consumption for Buildings in Hot Climates: A Novel Finite Element Modelling Study Comparing Building Constructions for Arid Climates in Saudi Arabia. Energy Build. 2022, 271, 112324. [Google Scholar] [CrossRef]
  2. Kuczyński, T.; Staszczuk, A.; Gortych, M.; Stryjski, R. Effect of Thermal Mass, Night Ventilation and Window Shading on Summer Thermal Comfort of Buildings in a Temperate Climate. Build. Environ. 2021, 204, 108126. [Google Scholar] [CrossRef]
  3. Hu, S.; Jiang, Y.; Yan, D. China Building Energy Use and Carbon Emission Yearbook 2021; China Architecture Building Press: Beijing, China, 2021. [Google Scholar]
  4. Zomorodian, Z.S.; Tahsildoost, M. Assessment of Window Performance in Classrooms by Long Term Spatial Comfort Metrics. Energy Build. 2017, 134, 80–93. [Google Scholar] [CrossRef]
  5. Lin, Y.H.; Tsai, K.T.; Lin, M.D.; Yang, M.D. Design Optimization of Office Building Envelope Configurations for Energy Conservation. Appl. Energy 2016, 171, 336–346. [Google Scholar] [CrossRef]
  6. Cho, H.M.; Yang, S.; Wi, S.; Chang, S.J.; Kim, S.E. Hygrothermal and Energy Retrofit Planning of Masonry Façade Historic Building Used as Museum and Office: A Cultural Properties Case Study. Energy Build. 2020, 201, 117607. [Google Scholar] [CrossRef]
  7. Li, D.; Wu, Y.; Liu, C.; Zhang, G.; Arıcı, M. Energy Investigation of Glazed Windows Containing Nano-PCM in Different Seasons. Energy Convers. Manag. 2018, 172, 119–128. [Google Scholar] [CrossRef]
  8. Verichev, K.; Serrano-Jiménez, A.; Carpio, M.; Barrios-Padura, Á.; Díaz-López, C. Influence of Degree Days Calculation Methods on the Optimum Thermal Insulation Thickness in Life-Cycle Cost Analysis for Building Envelopes in Mediterranean and Semi-Arid Climates. J. Build. Eng. 2023, 79, 107783. [Google Scholar] [CrossRef]
  9. Sun, H.; Calautit, J.K.; Jimenez-Bescos, C. Examining the Regulating Impact of Thermal Mass on Overheating, and the Role of Night Ventilation, within Different Climates and Future Scenarios across China. Clean. Eng. Technol. 2022, 9, 100534. [Google Scholar] [CrossRef]
  10. Al-Sanea, S.A.; Zedan, M.F. Improving Thermal Performance of Building Walls by Optimizing Insulation Layer Distribution and Thickness for Same Thermal Mass. Appl. Energy 2011, 88, 3113–3124. [Google Scholar] [CrossRef]
  11. Ozel, M. Effect of Insulation Location on Dynamic Heat-Transfer Characteristics of Building External Walls and Optimization of Insulation Thickness. Energy Build. 2014, 72, 288–295. [Google Scholar] [CrossRef]
  12. Ozel, M.; Pihtili, K. Optimum Location and Distribution of Insulation Layers on Building Walls with Various Orientations. Build. Environ. 2007, 42, 3051–3059. [Google Scholar] [CrossRef]
  13. Al-Tamimi, N. An Optimum Thermal Insulation Type and Thickness for Residential Buildings in Three Different Climatic Regions of Saudi Arabia. Civ. Eng. Archit. 2021, 9, 317–327. [Google Scholar] [CrossRef]
  14. Al-Sanea, S.A.; Zedan, M.F. Optimum Insulation Thickness for Building Walls in a Hot-Dry Climate. Int. J. Ambient Energy 2002, 23, 115–126. [Google Scholar] [CrossRef]
  15. Pajek, L.; Hudobivnik, B.; Kunič, R.; Košir, M. Improving Thermal Response of Lightweight Timber Building Envelopes During Cooling Season in Three European Locations. J. Clean. Prod. 2017, 156, 939–952. [Google Scholar] [CrossRef]
  16. Kendrick, C.; Ogden, R.; Wang, X.; Baiche, B. Thermal Mass in New Build UK Housing: A Comparison of Structural Systems in a Future Weather Scenario. Energy Build. 2012, 48, 40–49. [Google Scholar] [CrossRef]
  17. Thiele, A.M.; Jamet, A.; Sant, G.; Pilon, L. Annual Energy Analysis of Concrete Containing Phase Change Materials for Building Envelopes. Energy Convers. Manag. 2015, 103, 374–386. [Google Scholar] [CrossRef]
  18. Zhu, L.; Hurt, R.; Correia, D.; Boehm, R. Detailed Energy Saving Performance Analyses on Thermal Mass Walls Demonstrated in a Zero Energy House. Energy Build. 2009, 41, 303–310. [Google Scholar] [CrossRef]
  19. Bloomfield, D.P.; Fisk, D.J. The Optimisation of Intermittent Heating. Build. Environ. 1977, 12, 43–55. [Google Scholar] [CrossRef]
  20. Blumberga, A.; Kass, K.; Kamendere, E. A Review on Latvian Historical Building Stock with Heavy Walls. Energy Procedia 2016, 95, 17–21. [Google Scholar] [CrossRef]
  21. Li, M.; Shen, X.; Wu, W.; Cetin, K.; Mcintyre, F.; Wang, L.; Liu, M. Cooling Demand Reduction with Nighttime Natural Ventilation to Cool Internal Thermal Mass under Harmonic Design-Day Weather Conditions. Appl. Energy 2025, 379, 124947. [Google Scholar] [CrossRef]
  22. Mingotti, N.; Chenvidyakarn, T.; Woods, A.W. Combined Impacts of Climate and Wall Insulation on the Energy Benefit of an Extra Layer of Glazing in the Facade. Energy Build. 2013, 58, 237–249. [Google Scholar] [CrossRef]
  23. Andarini, R. The Role of Building Thermal Simulation for Energy Efficient Building Design. Energy Procedia 2014, 47, 217–226. [Google Scholar] [CrossRef]
  24. da Cunha, E.G.; Gioielli, B.E. Analysis of Thermal Bridge Impact in a Hotel Building for the Eight Brazilian Bioclimatic Zones. J. Civ. Eng. Archit. 2015, 9, 393–400. [Google Scholar]
  25. Gupta, V.; Deb, C. Envelope Design for Low-Energy Buildings in the Tropics: A Review. Renew. Sustain. Energy Rev. 2023, 186, 113650. [Google Scholar] [CrossRef]
  26. Wu, H.; Zhang, T. Multi-Objective Optimization of Energy, Visual, and Thermal Performance for Building Envelopes in China’s Hot Summer and Cold Winter Climate Zone. J. Build. Eng. 2022, 59, 105034. [Google Scholar] [CrossRef]
  27. Hou, J.; Liu, Z.A.; Zhang, L. Influence and Sensitivity Evaluation of Window Thermal Parameters Variations on Economic Benefits of Insulation Materials for Building Exterior Walls—A Case Study for Traditional Dwelling in China. Therm. Sci. Eng. Prog. 2023, 46, 102207. [Google Scholar] [CrossRef]
  28. Alghoul, S.K.; Rijabo, H.G.; Mashena, M.E. Energy Consumption in Buildings: A Correlation for the Influence of Window to Wall Ratio and Window Orientation in Tripoli, Libya. J. Build. Eng. 2017, 11, 82–86. [Google Scholar] [CrossRef]
  29. Cappelletti, F.; Prada, A.; Romagnoni, P.; Gasparella, A. Passive Performance of Glazed Components in Heating and Cooling of an Open-Space Office under Controlled Indoor Thermal Comfort. Build. Environ. 2014, 72, 131–144. [Google Scholar] [CrossRef]
  30. Goia, F. Search for the Optimal Window-to-Wall Ratio in Office Buildings in Different European Climates and the Implications on Total Energy Saving Potential. Sol. Energy 2016, 132, 467–492. [Google Scholar] [CrossRef]
  31. Xie, X.; Chen, X.N.; Xu, B.; Pei, G. Investigation of Occupied/Unoccupied Period on Thermal Comfort in Guangzhou: Challenges and Opportunities of Public Buildings with High Window-Wall Ratio. Energy 2022, 244, 123186. [Google Scholar] [CrossRef]
  32. Xie, X.; Xu, B.; Fei, Y.; Chen, X.N.; Pei, G.; Ji, J. Passive Energy-Saving Design Strategy and Realization on High Window-Wall Ratio Buildings in Subtropical Regions. Renew. Energy 2024, 229, 120709. [Google Scholar] [CrossRef]
  33. Orman, Ł.J.; Majewski, G.; Radek, N.; Pietraszek, J. Analysis of Thermal Comfort in Intelligent and Traditional Buildings. Energies 2022, 15, 6522. [Google Scholar] [CrossRef]
  34. Cherier, M.K.; Hamdani, M.; Kamel, E.; Guermoui, M.; Bekkouche, S.M.E.A.; Al-Saadi, S.; Flah, A. Impact of Glazing Type, Window-to-Wall Ratio, and Orientation on Building Energy Savings Quality: A Parametric Analysis in Algerian Climatic Conditions. Case Stud. Therm. Eng. 2024, 61, 104902. [Google Scholar] [CrossRef]
  35. La Roche, P.; Milne, M. Effects of Window Size and Thermal Mass on Building Comfort Using an Intelligent Ventilation Controller. Sol. Energy 2004, 77, 421–434. [Google Scholar] [CrossRef]
  36. Ahmed, A.E.; Suwaed, M.S.; Shakir, A.M.; Ghareeb, A. The Impact of Window Orientation, Glazing, and Window-to-Wall Ratio on the Heating and Cooling Energy of an Office Building: The Case of Hot and Semi-Arid Climate. J. Eng. Res. 2023, 13, 409–422. [Google Scholar] [CrossRef]
  37. Yoon, N.; Wu, W. Short-Term Thermal Resilience and Building Energy Flexibility Using Thermal Mass and Controlled Natural Ventilation. Energy Build. 2024, 320, 114547. [Google Scholar] [CrossRef]
  38. Al-Yasiri, Q.; Alshara, A.; Al-Maliki, I.; Al-Saadi, H.; Al-Khafaji, S. Effect of Window-to-Wall Ratio and Thermal Insulation on Building Thermal Energy in Various Iraqi Cities. Misan J. Eng. Sci. 2024, 3, 182–196. [Google Scholar]
  39. Ahmad, A.; Prakash, O.; Brar, L.S.; Irshad, K.; Hasnain, S.M.; Paramasivam, P.; Ayanie, A.G. Effect of Wall, Roof, and Window-to-Wall Ratio on the Cooling and Heating Load of a Building in India. Energy Sci. Eng. 2025, 13, 1255–1279. [Google Scholar] [CrossRef]
  40. Guo, F.; Ma, Y.; Zhang, K.; Han, L.; Guo, L. The Climate Change in Qingdao During 1899–2015 and Its Response to Global Warming. J. Geosci. Environ. Prot. 2018, 6, 58–70. [Google Scholar] [CrossRef]
  41. GB 50176-2016; Thermal Design Code for Civil Buildings. Ministry of Housing and Urban-Rural Development of the People’s Republic of China: Beijing, China, 2016.
  42. GB 50189-2015; Energy-saving Design Standards for Public Buildings. Ministry of Housing and Urban-Rural Development of the People’s Republic of China: Beijing, China, 2015.
  43. Kuczyński, T.; Staszczuk, A. Experimental Study of the Influence of Thermal Mass on Thermal Comfort and Cooling Energy Demand in Residential Buildings. Energy 2020, 195, 116984. [Google Scholar] [CrossRef]
  44. Heydari, A.; Sadati, S.E.; Gharib, M.R. Effects of Different Window Configurations on Energy Consumption in Building: Optimization and Economic Analysis. J. Build. Eng. 2021, 35, 102099. [Google Scholar] [CrossRef]
  45. Evola, G.; Margani, G.; Marletta, L. Cost-Effective Design Solutions for Low-Rise Residential Net ZEBs in Mediterranean Climate. Energy Build. 2014, 68, 7–18. [Google Scholar] [CrossRef]
  46. Kolokotroni, M.; Webb, B.C.; Hayes, S.D. Summer Cooling with Night Ventilation for Office Buildings in Moderate Climates. Energy Build. 1998, 27, 231–237. [Google Scholar] [CrossRef]
  47. Shaviv, E.; Yezioro, A.; Capeluto, I.G. Thermal Mass and Night Ventilation as Passive Cooling Design Strategy. Renew. Energy 2001, 24, 445–452. [Google Scholar] [CrossRef]
  48. Hacker, J.N.; De Saulles, T.P.; Minson, A.J.; Holmes, M. Embodied and Operational Carbon Dioxide Emissions from Housing: A Case Study on the Effects of Thermal Mass and Climate Change. Energy Build. 2008, 40, 375–384. [Google Scholar] [CrossRef]
  49. Guo, R.; Hu, Y.; Liu, M.; Heiselberg, P. Influence of Design Parameters on the Night Ventilation Performance in Office Buildings Based on Sensitivity Analysis. Sustain. Cities Soc. 2019, 50, 101661. [Google Scholar] [CrossRef]
  50. Gamero-Salinas, J.C.; Monge-Barrio, A.; Sánchez-Ostiz, A. Overheating Risk Assessment of Different Dwellings During the Hottest Season of a Warm Tropical Climate. Build. Environ. 2020, 171, 106664. [Google Scholar] [CrossRef]
  51. Sierra-Pérez, J.; Rodríguez-Soria, B.; Boschmonart-Rives, J.; Gabarrell, X. Integrated Life Cycle Assessment and Thermodynamic Simulation of a Public Building’s Envelope Renovation: Conventional vs. Passivhaus Proposal. Appl. Energy 2018, 212, 1510–1521. [Google Scholar] [CrossRef]
  52. Zune, M.; Tubelo, R.; Rodrigues, L.; Gillott, M. Improving Building Thermal Performance through an Integration of Passivhaus Envelope and Shading in a Tropical Climate. Energy Build. 2021, 253, 111521. [Google Scholar] [CrossRef]
  53. Artmann, N.; Gyalistras, D.; Manz, H.; Heiselberg, P. Impact of Climate Warming on Passive Night Cooling Potential. Build. Res. Inf. 2008, 36, 111–128. [Google Scholar] [CrossRef]
  54. Radhi, H. Evaluating the Potential Impact of Global Warming on the UAE Residential Buildings—A Contribution to Reduce the CO2 Emissions. Build. Environ. 2009, 44, 2451–2462. [Google Scholar] [CrossRef]
  55. Zeinelabdein, R.; Omer, S.; Gan, G. Critical Review of Latent Heat Storage Systems for Free Cooling in Buildings. Renew. Sustain. Energy Rev. 2018, 82, 2843–2868. [Google Scholar] [CrossRef]
Figure 1. TRNSYS model.
Buildings 15 01757 g001
Figure 2. The solar radiation and ambient temperature in Qingdao during August (data generated using Meteonorm software, 2024) [31].
Buildings 15 01757 g002
Figure 3. The heating power contributions from personnel, lighting, and equipment.
Buildings 15 01757 g003
Figure 4. The daily average maximum temperature.
Buildings 15 01757 g004
Figure 5. The daily average minimum temperature.
Buildings 15 01757 g005
Figure 6. The daily average minimum fluctuation.
Buildings 15 01757 g006
Figure 7. The attenuation coefficient in August.
Buildings 15 01757 g007
Figure 8. The occurrence of extreme superheat temperatures during the operational period.
Buildings 15 01757 g008
Figure 9. The cooling load in August.
Buildings 15 01757 g009
Table 1. Physical parameters of the opaque envelopes.
TypeLayerThickness (δ), mTotal Thickness (δ), mOverall Heat Transfer Coefficient (U),
W·m−2K−1
CellingExpanded polystyrene board0.020.1550.224
Reinforced concrete0.12
Cement mortar0.015
Interior wallGypsum0.0120.0740.652
Insulation0.050
Gypsum0.012
Light
thermal mass
Plaster0.0150.2850.833
Insulation0.030
Brick0.240
Medium thermal massPlaster0.0150.3200.485
Insulation0.065
Brick0.240
Heavy thermal massPlaster0.0150.3550.339
Insulation0.100
Brick0.240
Table 2. Physical parameters of the windows.
TypeDouble 14011Single 102
Thickness of glass (δ), mm26 (6/16/4)6
Overall heat transfer coefficient (U), W·m−2K−11.2405.69
Solar radiation transmissivity0.3540.823
Solar radiation reflectivity0.3210.072
Visible light transmissivity0.5290.855
Disclaimer/Publisher’s Note: The statements, opinions and data contained in all publications are solely those of the individual author(s) and contributor(s) and not of MDPI and/or the editor(s). MDPI and/or the editor(s) disclaim responsibility for any injury to people or property resulting from any ideas, methods, instructions or products referred to in the content.