
Molecular Dynamics Study of a Superabsorbent Polymer (SAP)-Modified Calcium Silicate Hydrate (C-S-H) Gel’s Mechanical Properties

 ,
,
Abstract
1. Introduction
2. Materials and Methods
2.1. Model Construction of C-S-H Gel
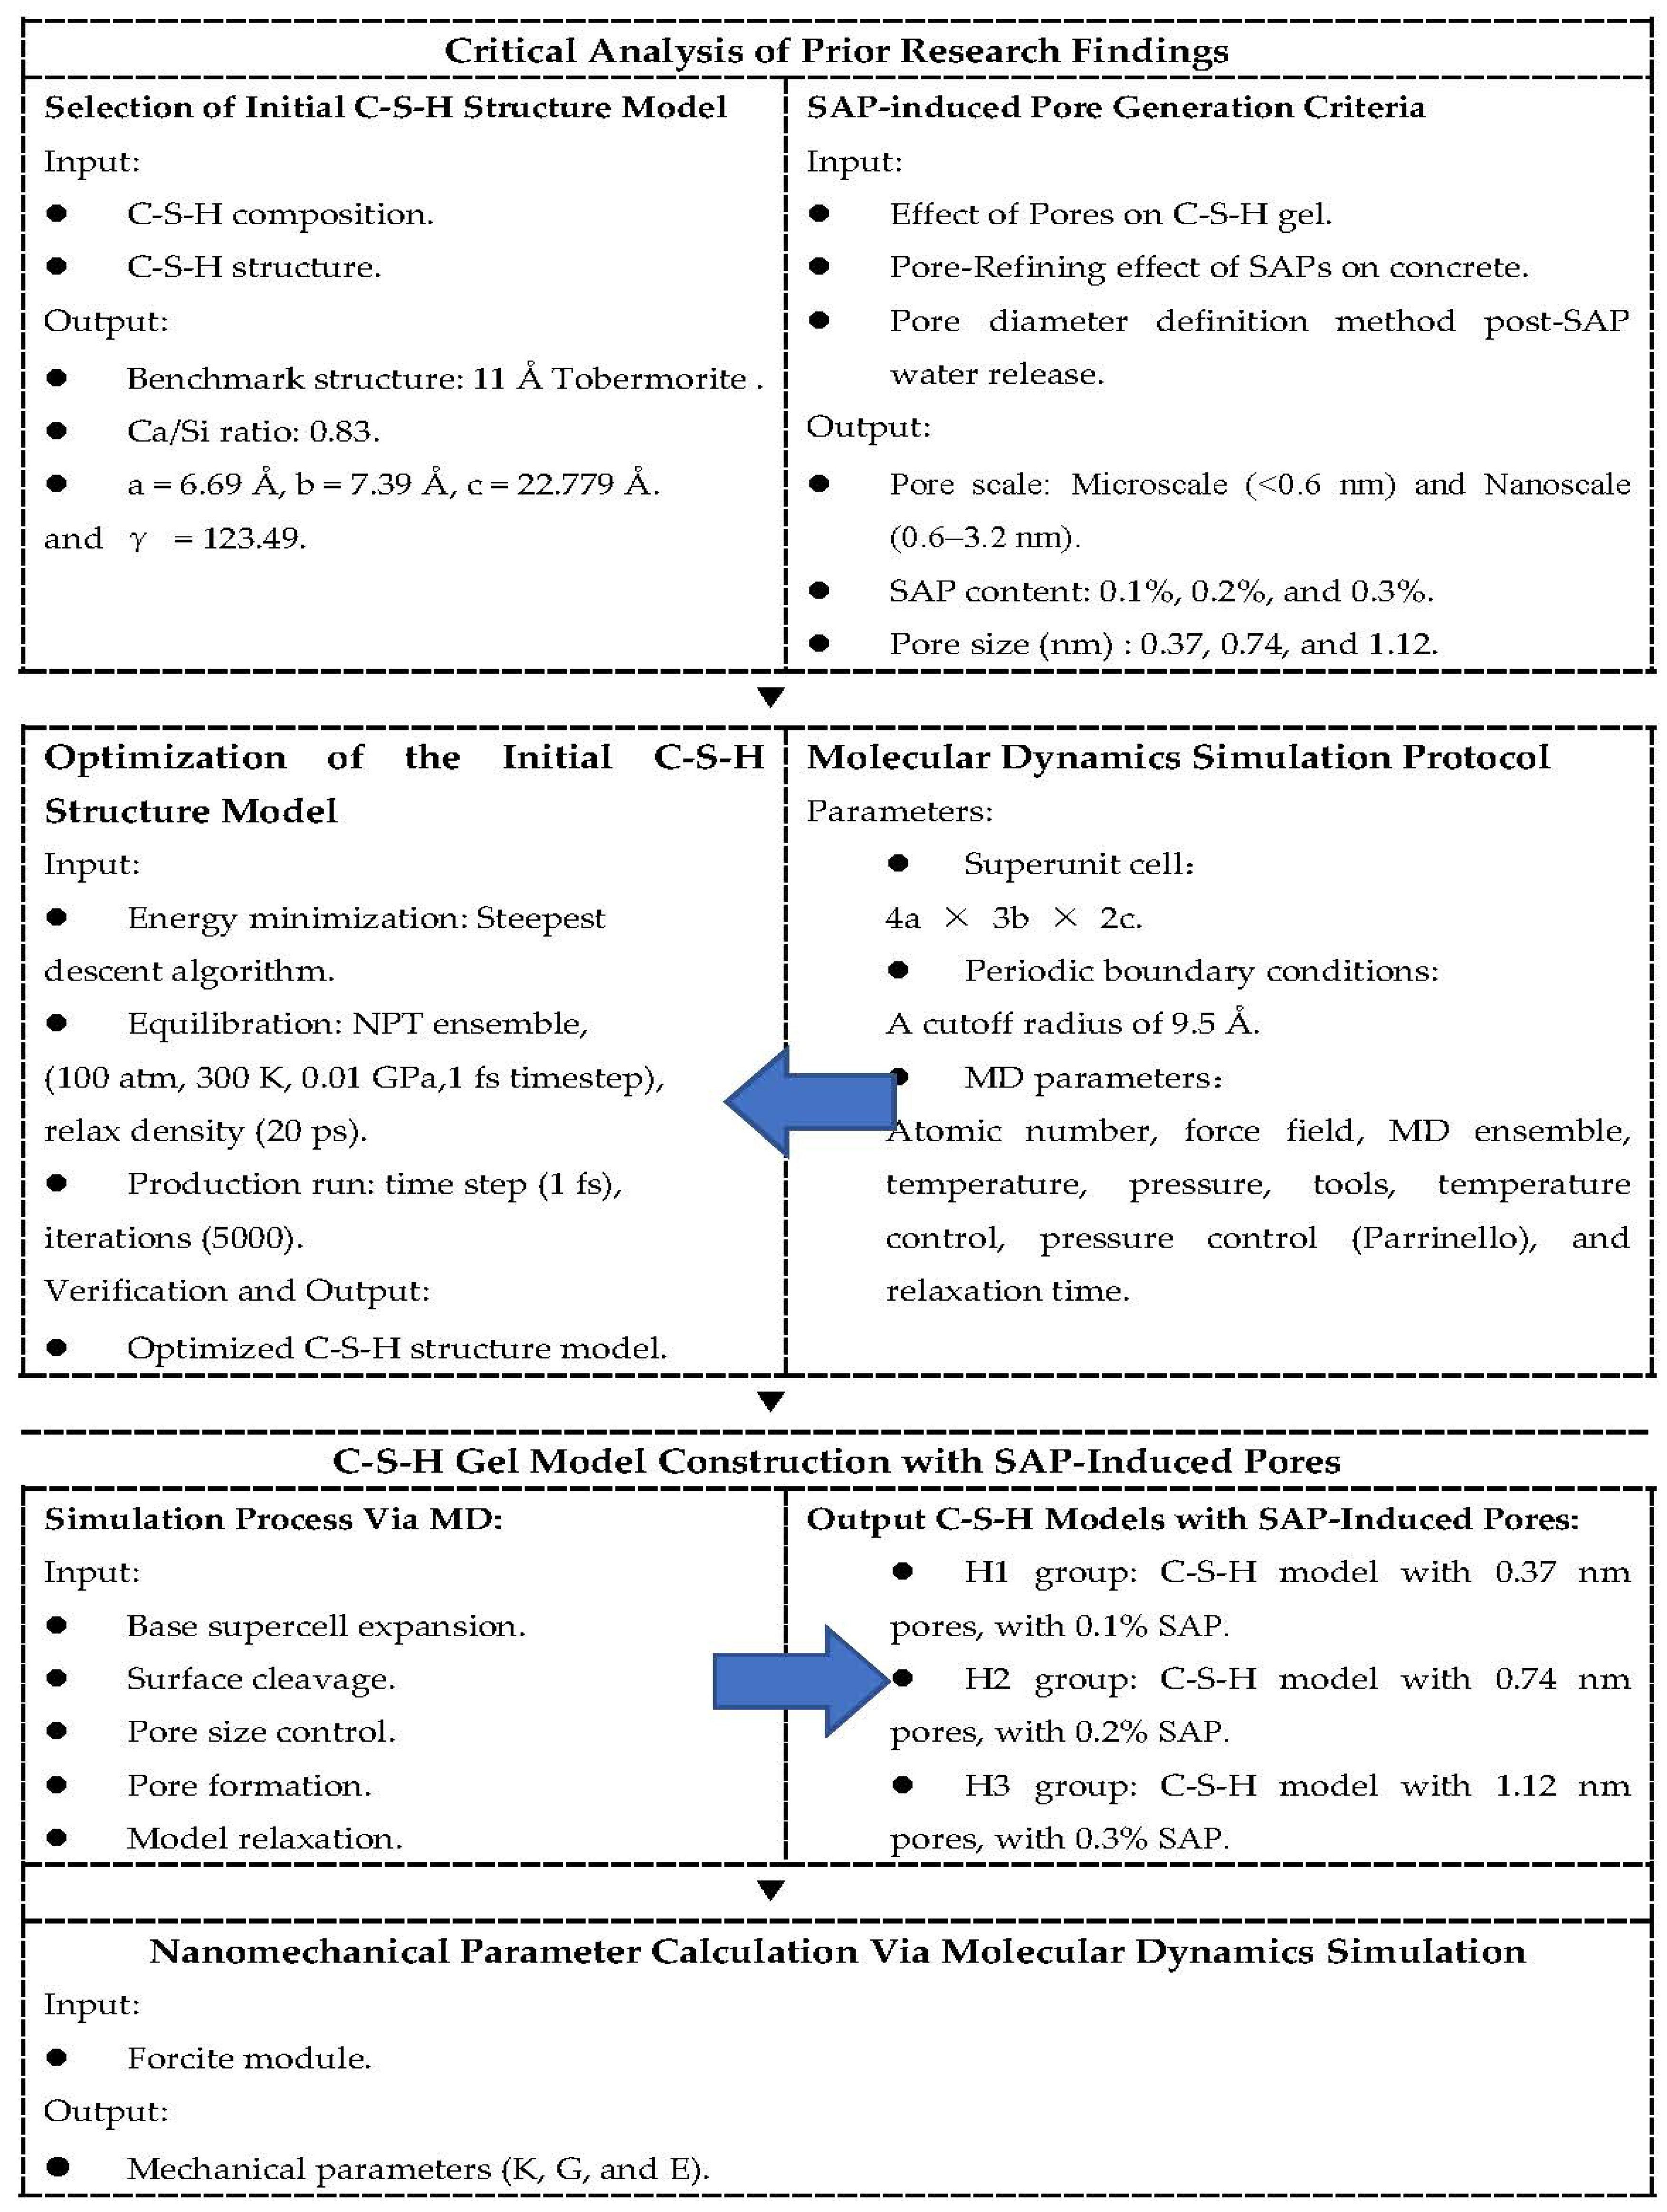
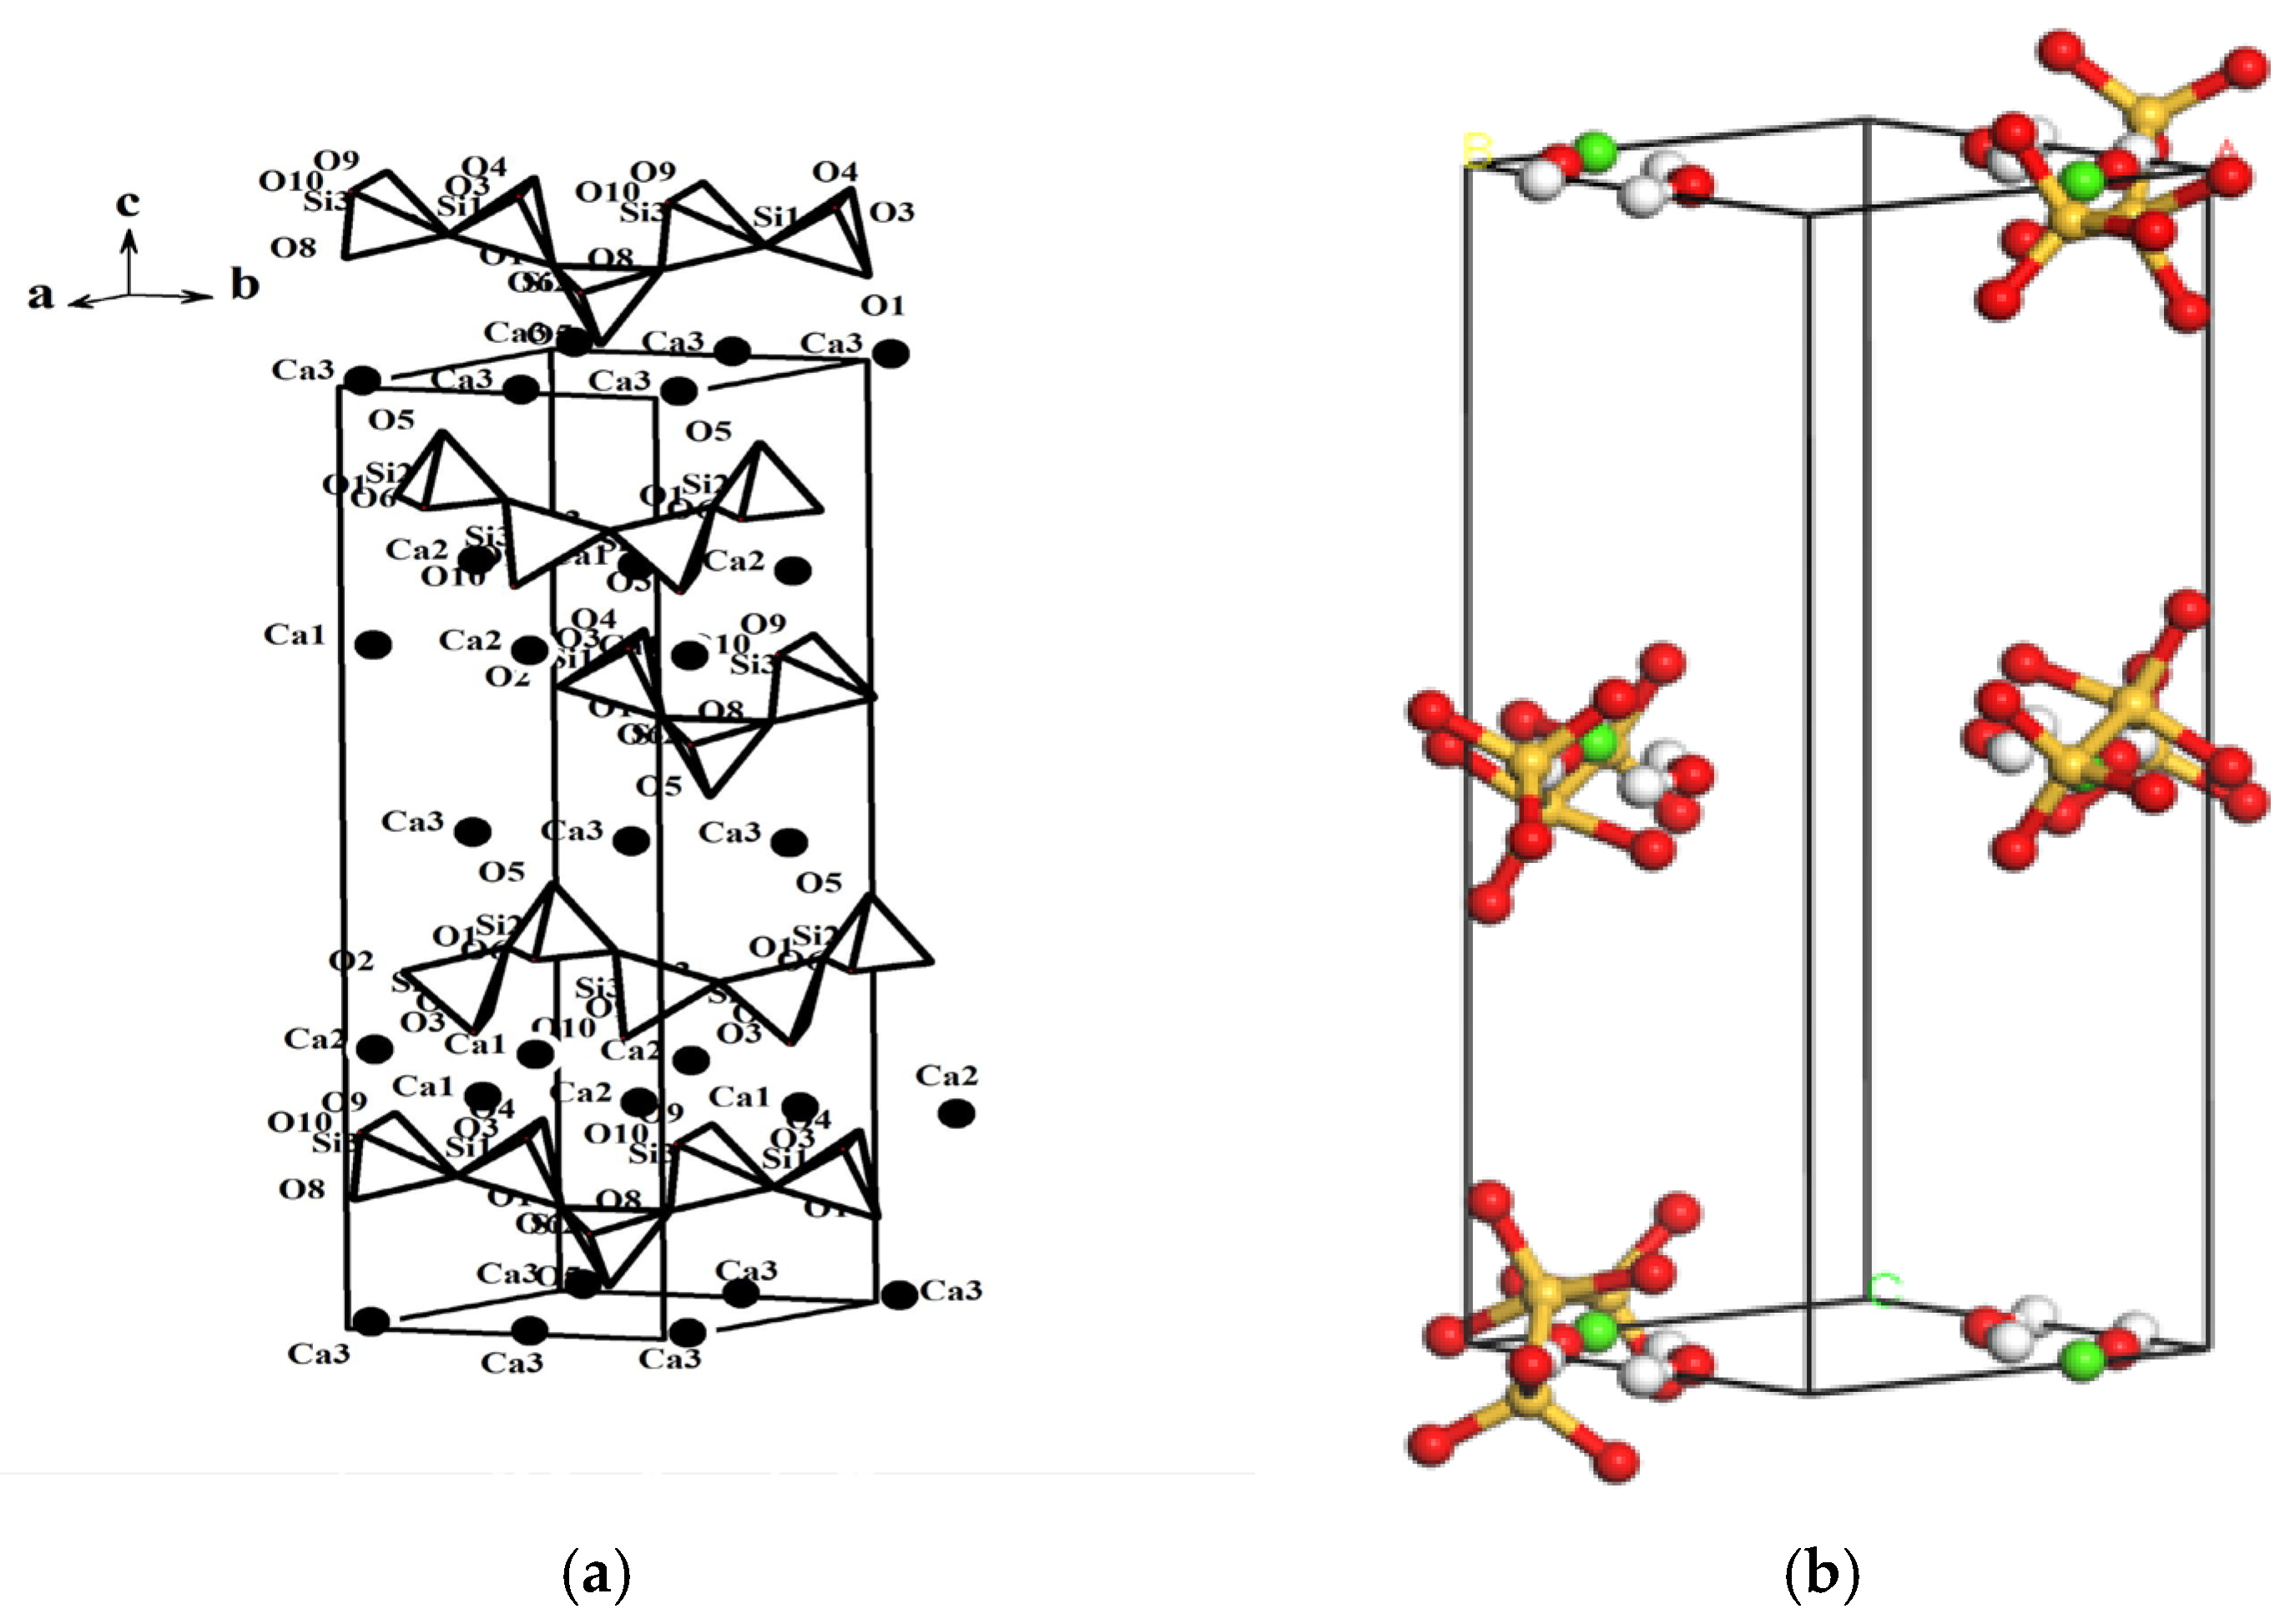
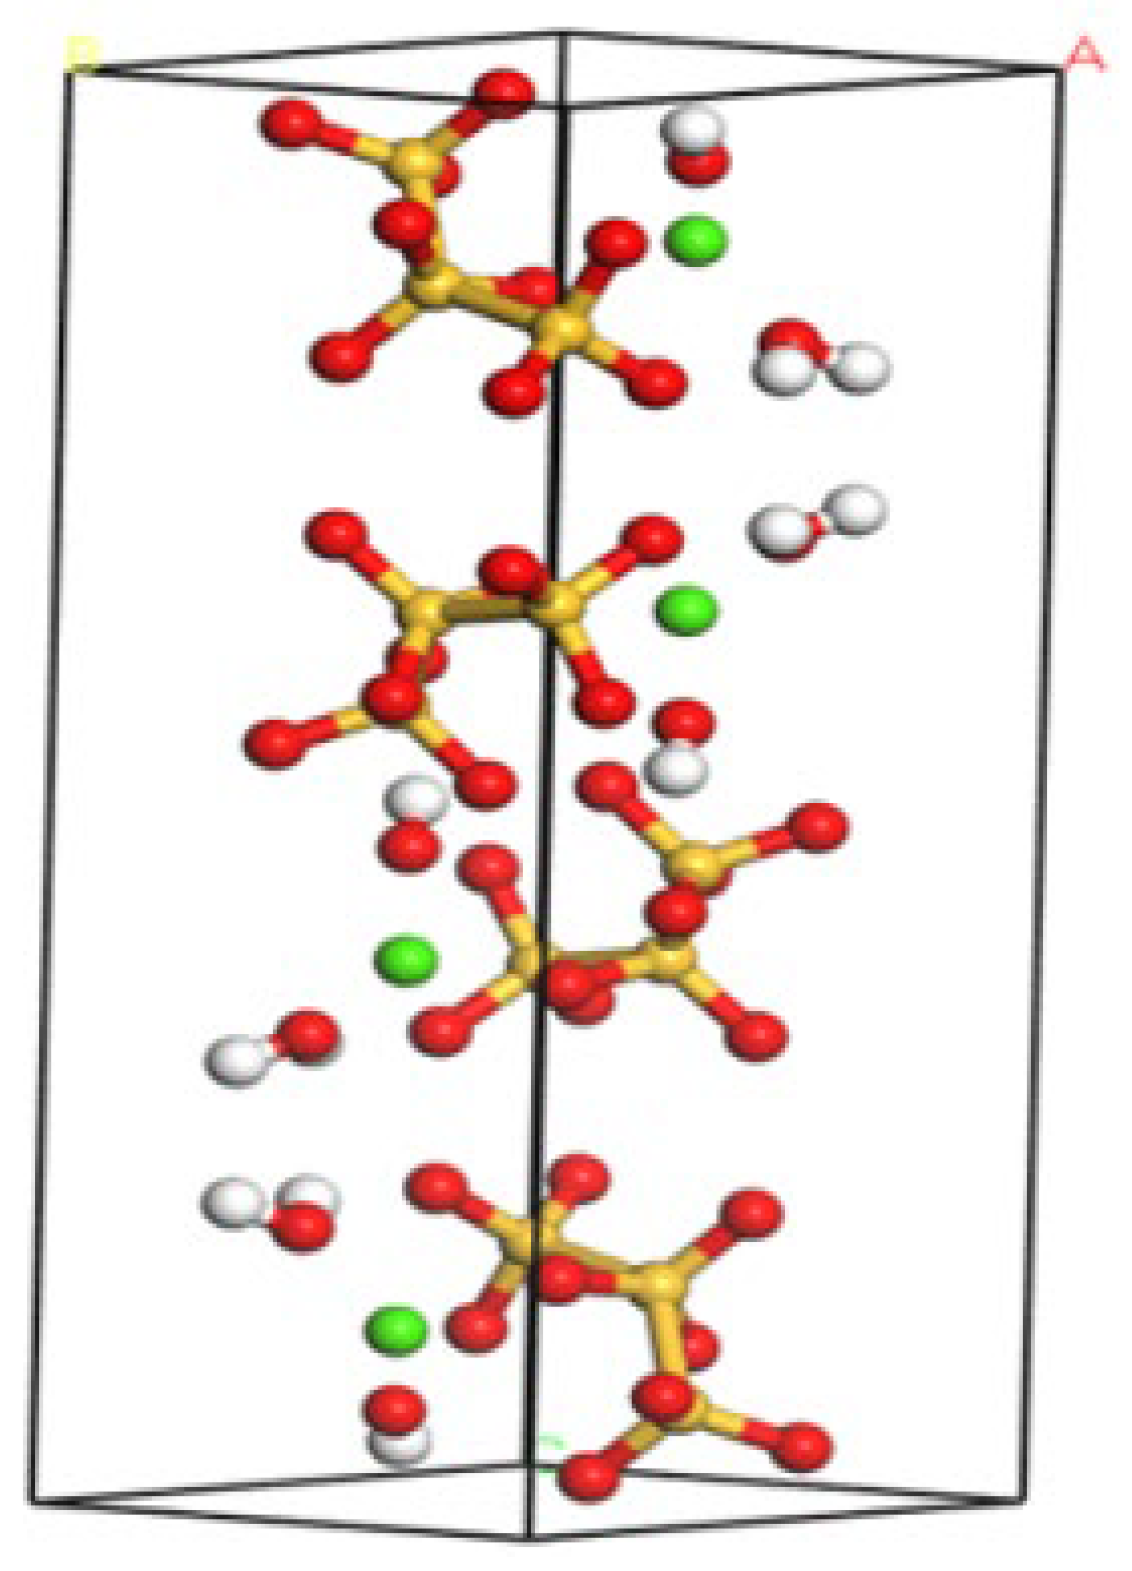
2.1.1. Selection of Initial C-S-H Structure Model
2.1.2. Molecular Dynamics Simulation Protocol
2.2. SAP-Induced Pore Generation Criteria
2.2.1. Effect of Pores on Concrete Strength
2.2.2. Pore-Refining Effect of SAPs on Concrete
2.2.3. Pore Diameter Definition Method Post-SAP Water Release
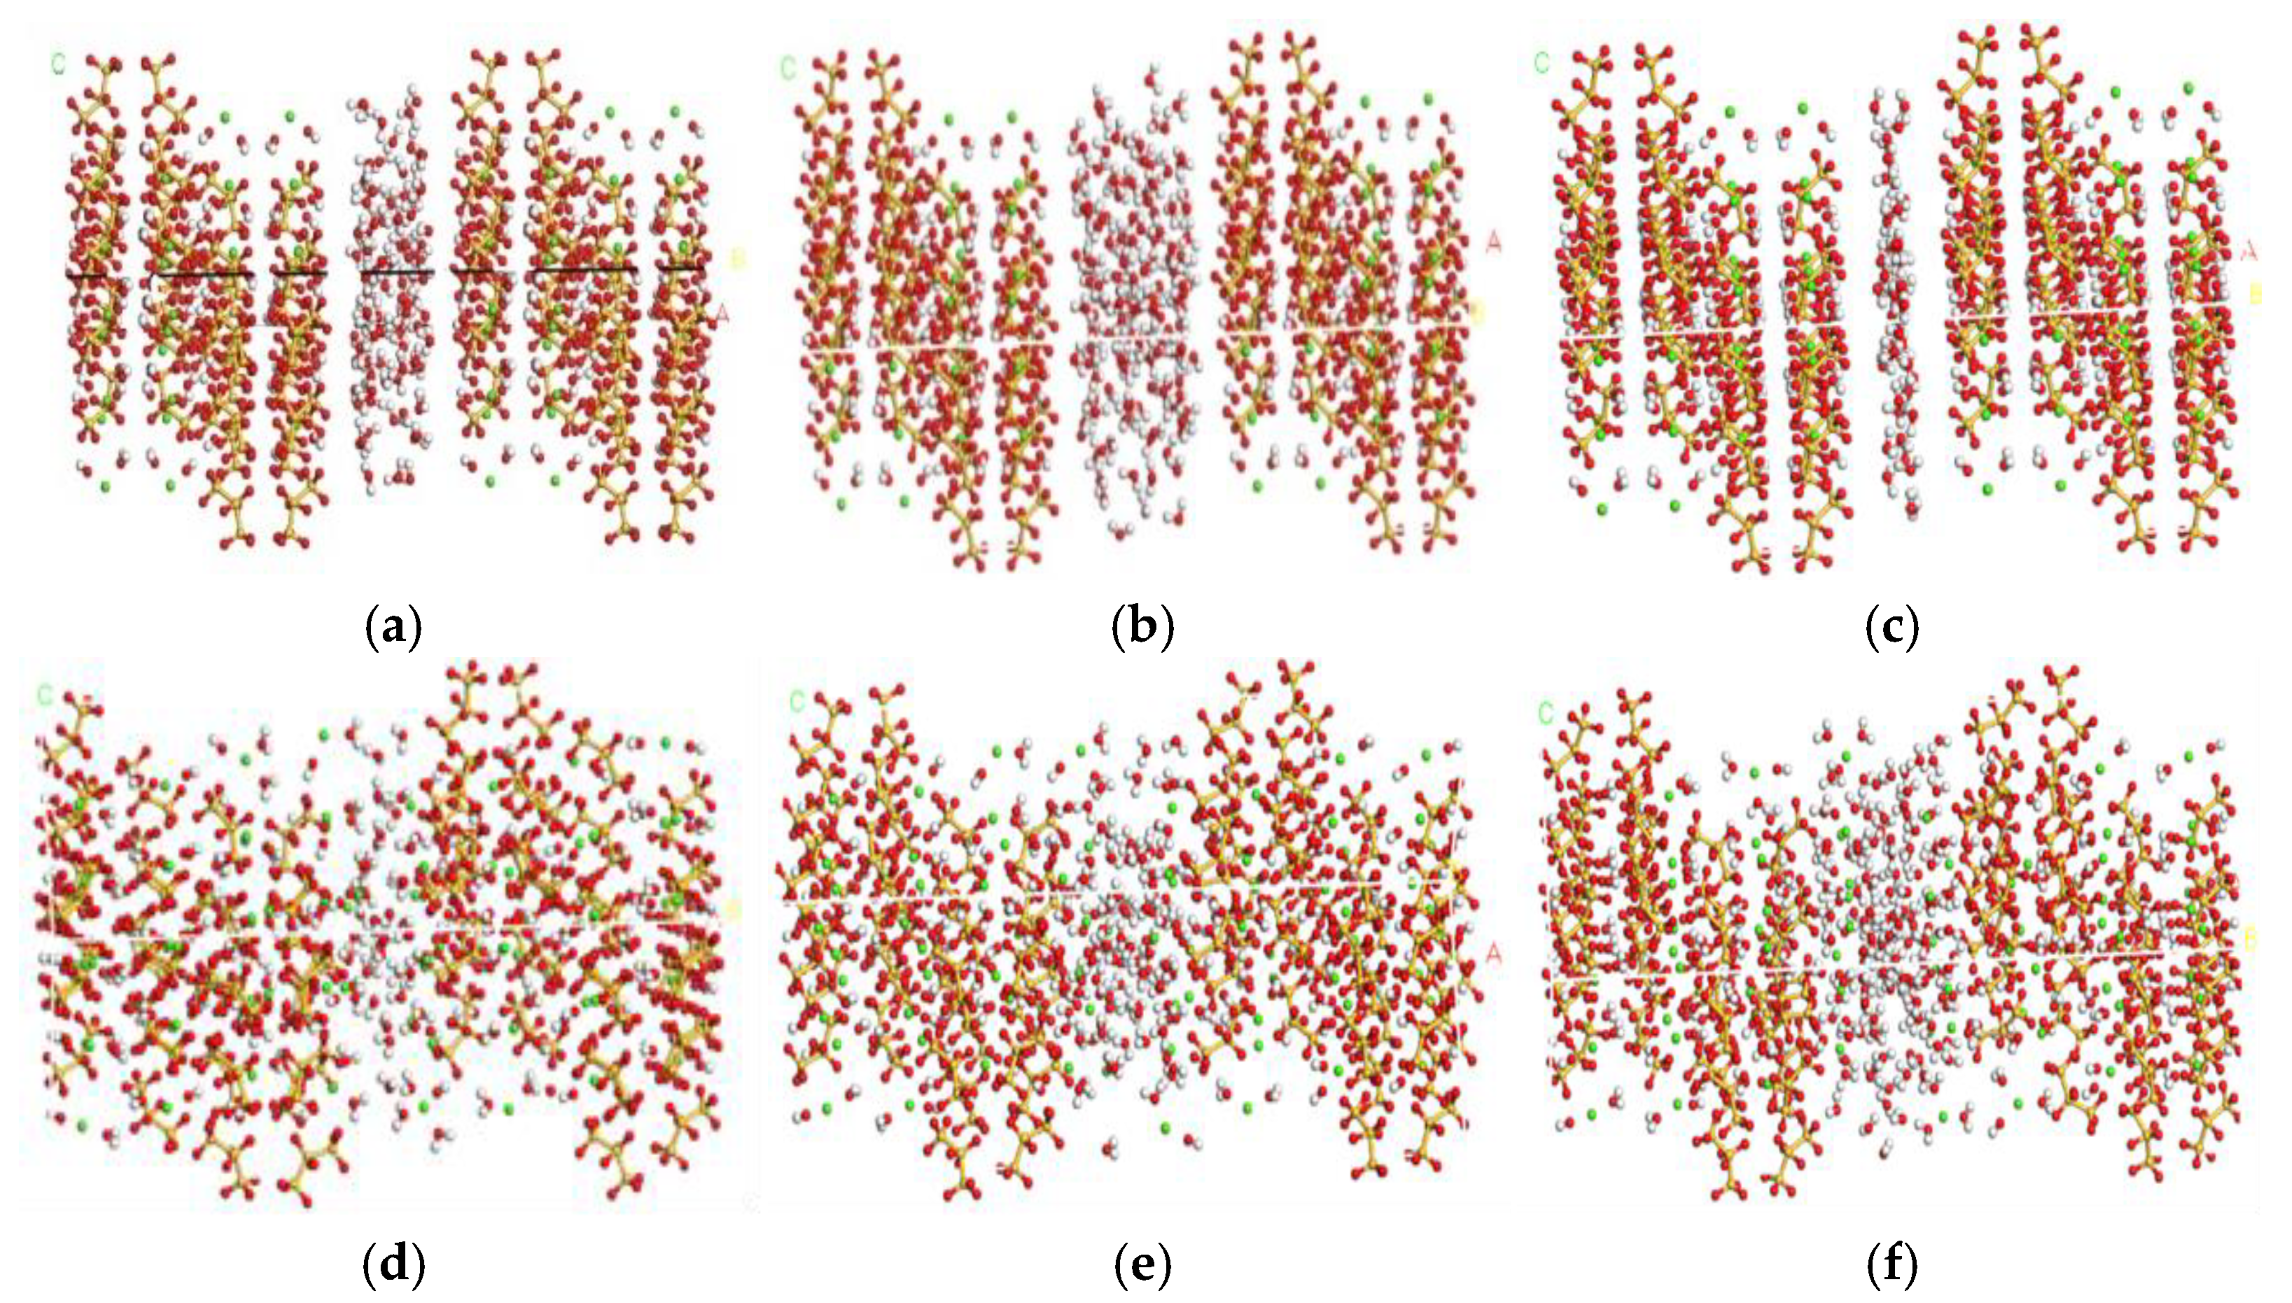
2.3. C-S-H Gel Model Construction with SAP-Induced Pores
3. Results
3.1. C-S-H Weak Region Bulk Modulus Evolution
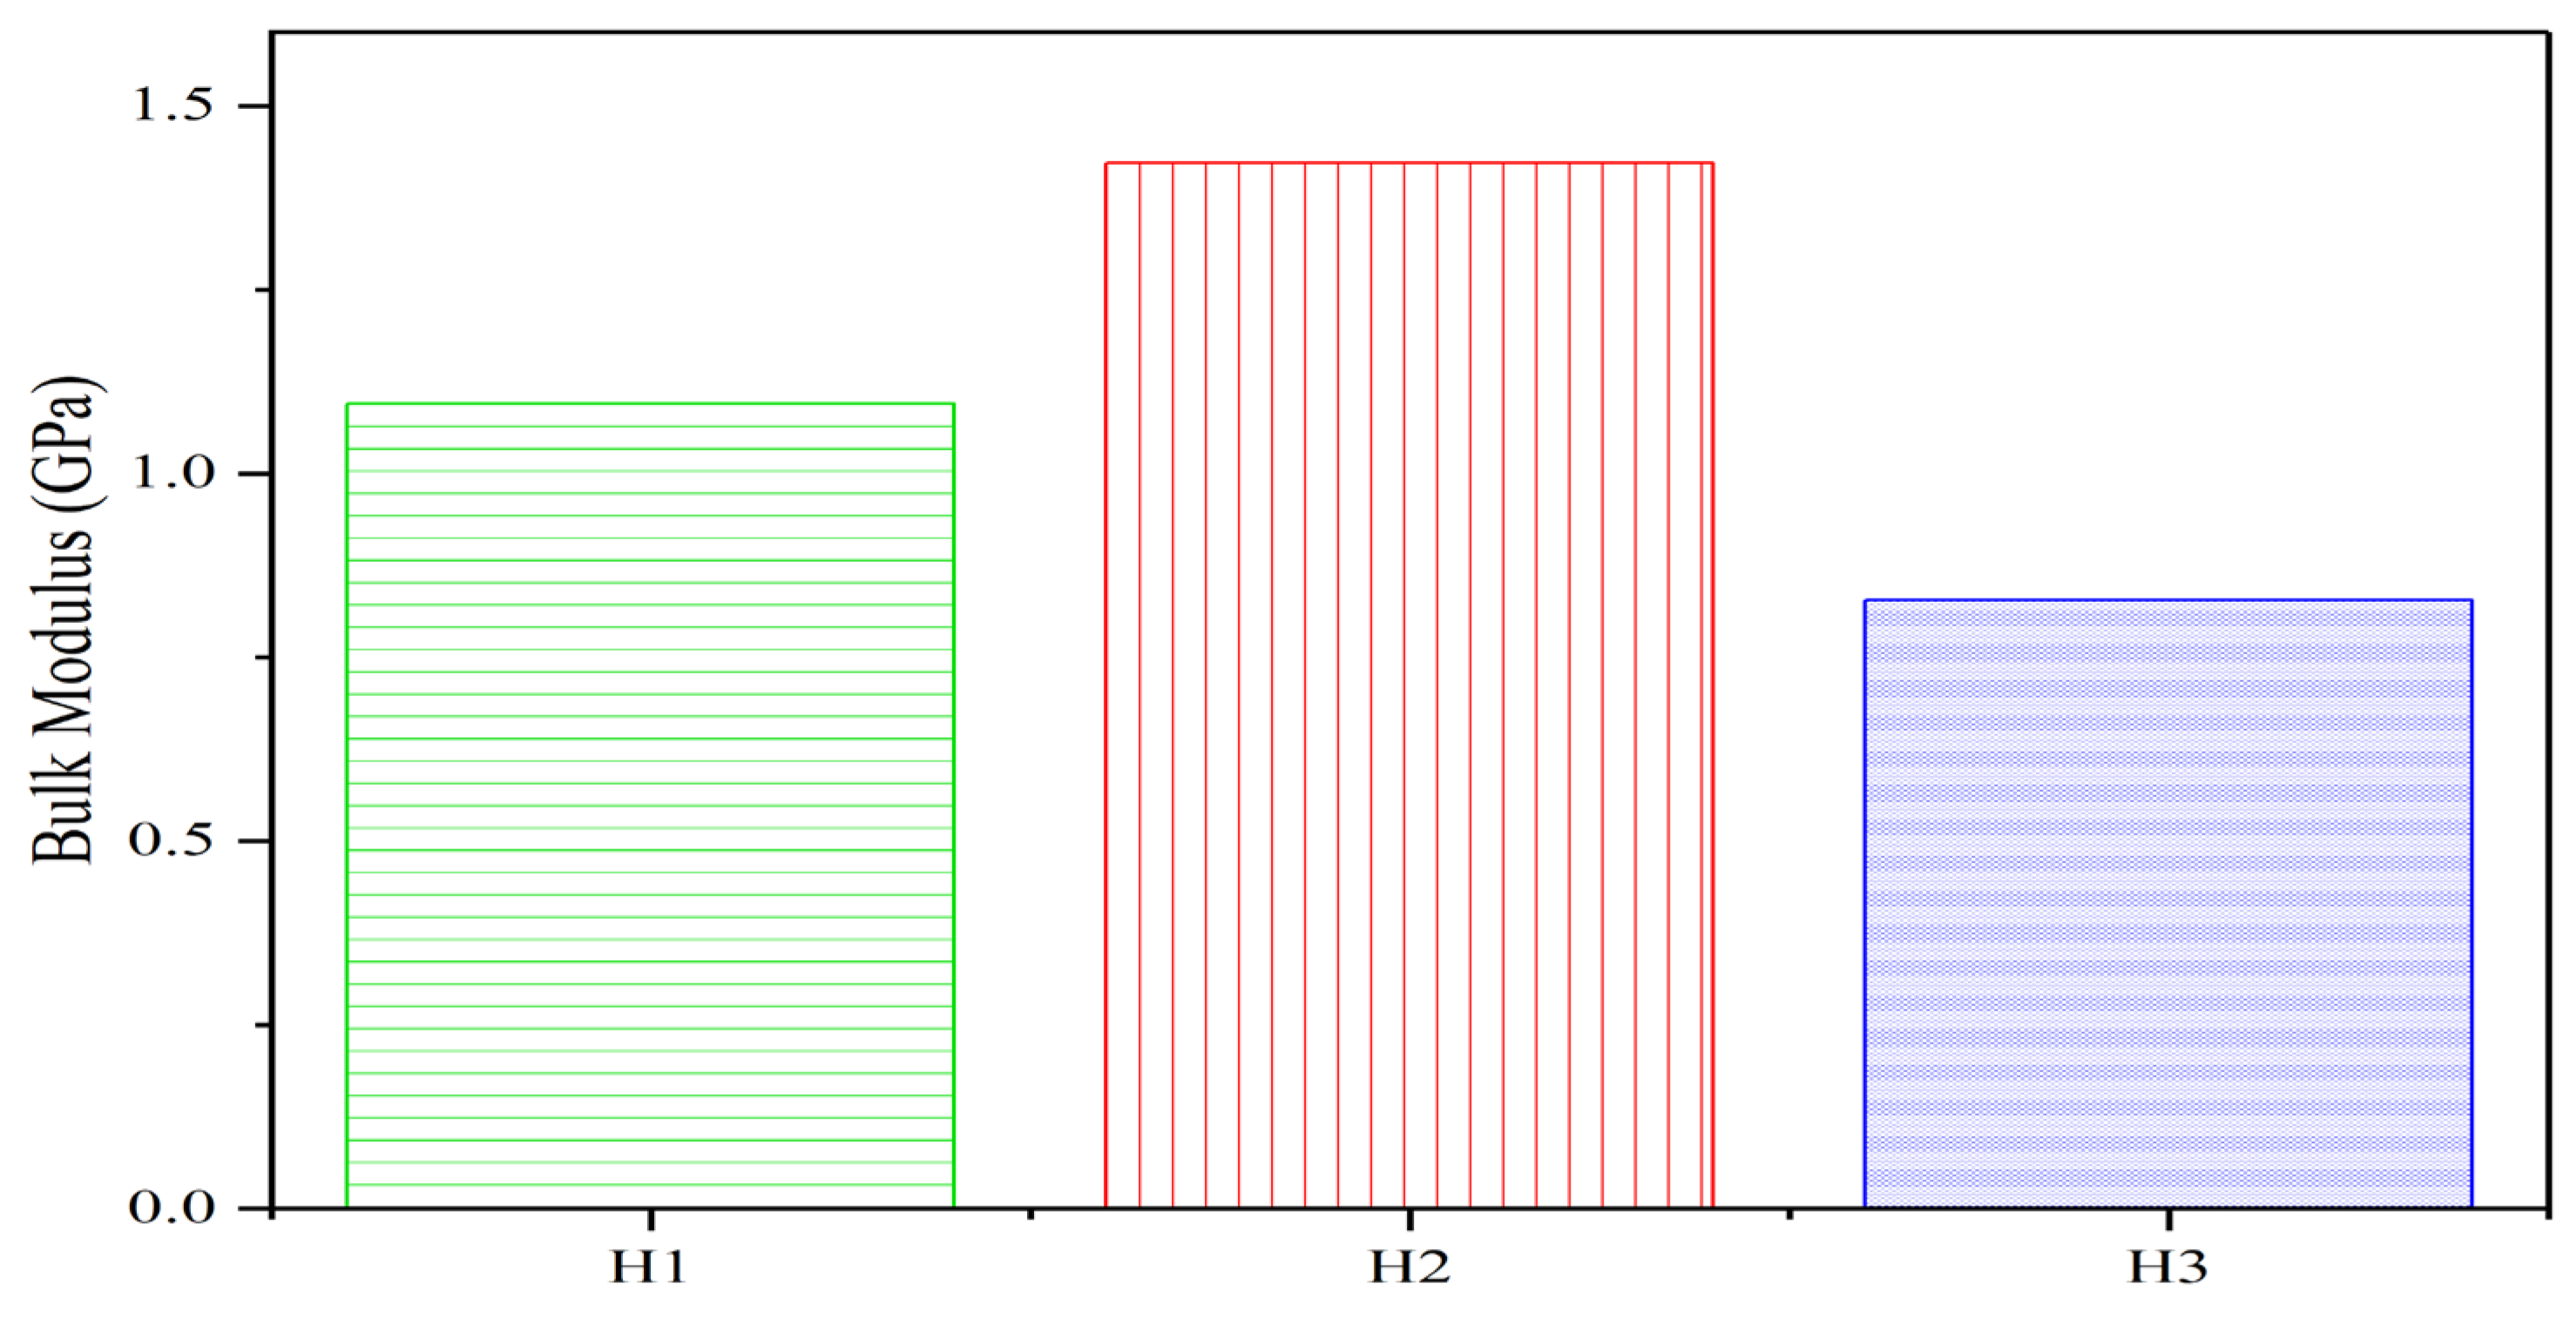
- The bulk modulus of the three C-S-H gel groups exhibits an initial increase followed by a decrease as the pore size reduces within the 0.3–1.5 nm range. The maximum bulk modulus occurs at 0.2% SAP content, indicating optimal mechanical performance. Controlling the SAP content to 0.2% ensures that pore sizes within 0.3–1.5 nm exert the most favorable influence on concrete mechanics;
- For group H1, the bulk modulus of the C-S-H system with 0.37 nm pores is 9.214 GPa. Increasing the pore size to 0.74 nm elevates the modulus to 10.606 GPa. This trend may arise from the minimal impact of pore size variation on K within the H1-H2 range (ultra-small pores), coupled with heightened system energy and water molecule mobility due to increased hydration, which collectively enhance K;
- In contrast, at 0.3% SAP content (H3 group, 1.12 nm pores), K drops sharply to 7.343 GPa. This decline suggests that pore expansion-induced weakening of compressibility resistance outweighs any modulus enhancement from additional water molecules, resulting in a net reduction in the mechanical stability.
3.2. C-S-H Weak Region Shear Modulus Evolution
- The shear modulus of the three C-S-H gel groups exhibits a non-monotonic relationship with pore size within the 0.3–1.5 nm range: it initially increases and then decreases as pore size reduces.
- Specifically, for the H2 group (pore size reduced from 1.12 nm to 0.74 nm), G rises to 5.315 GPa. For the H1 group (pore size further reduced to 0.37 nm), G declines to 4.877 GPa.
- This trend may arise from two competing mechanisms:
- (1)
- Enhanced interlayer contact: Smaller pores increase the contact area between C-S-H gel layers, restricting relative sliding and thereby improving shear resistance.
- (2)
- Reduced viscous resistance: At a fixed water density (1 g/cm3), fewer water molecules occupy smaller pores, lowering viscous damping between layers. These opposing effects lead to an initial increase in G followed by a decrease.
- The highest shear modulus (5.315 GPa) occurs at 0.2% SAP content, corresponding to an optimal pore size of 0.74 nm within the 0.3–1.5 nm range.

3.3. C-S-H Weak Region Young Modulus Evolution
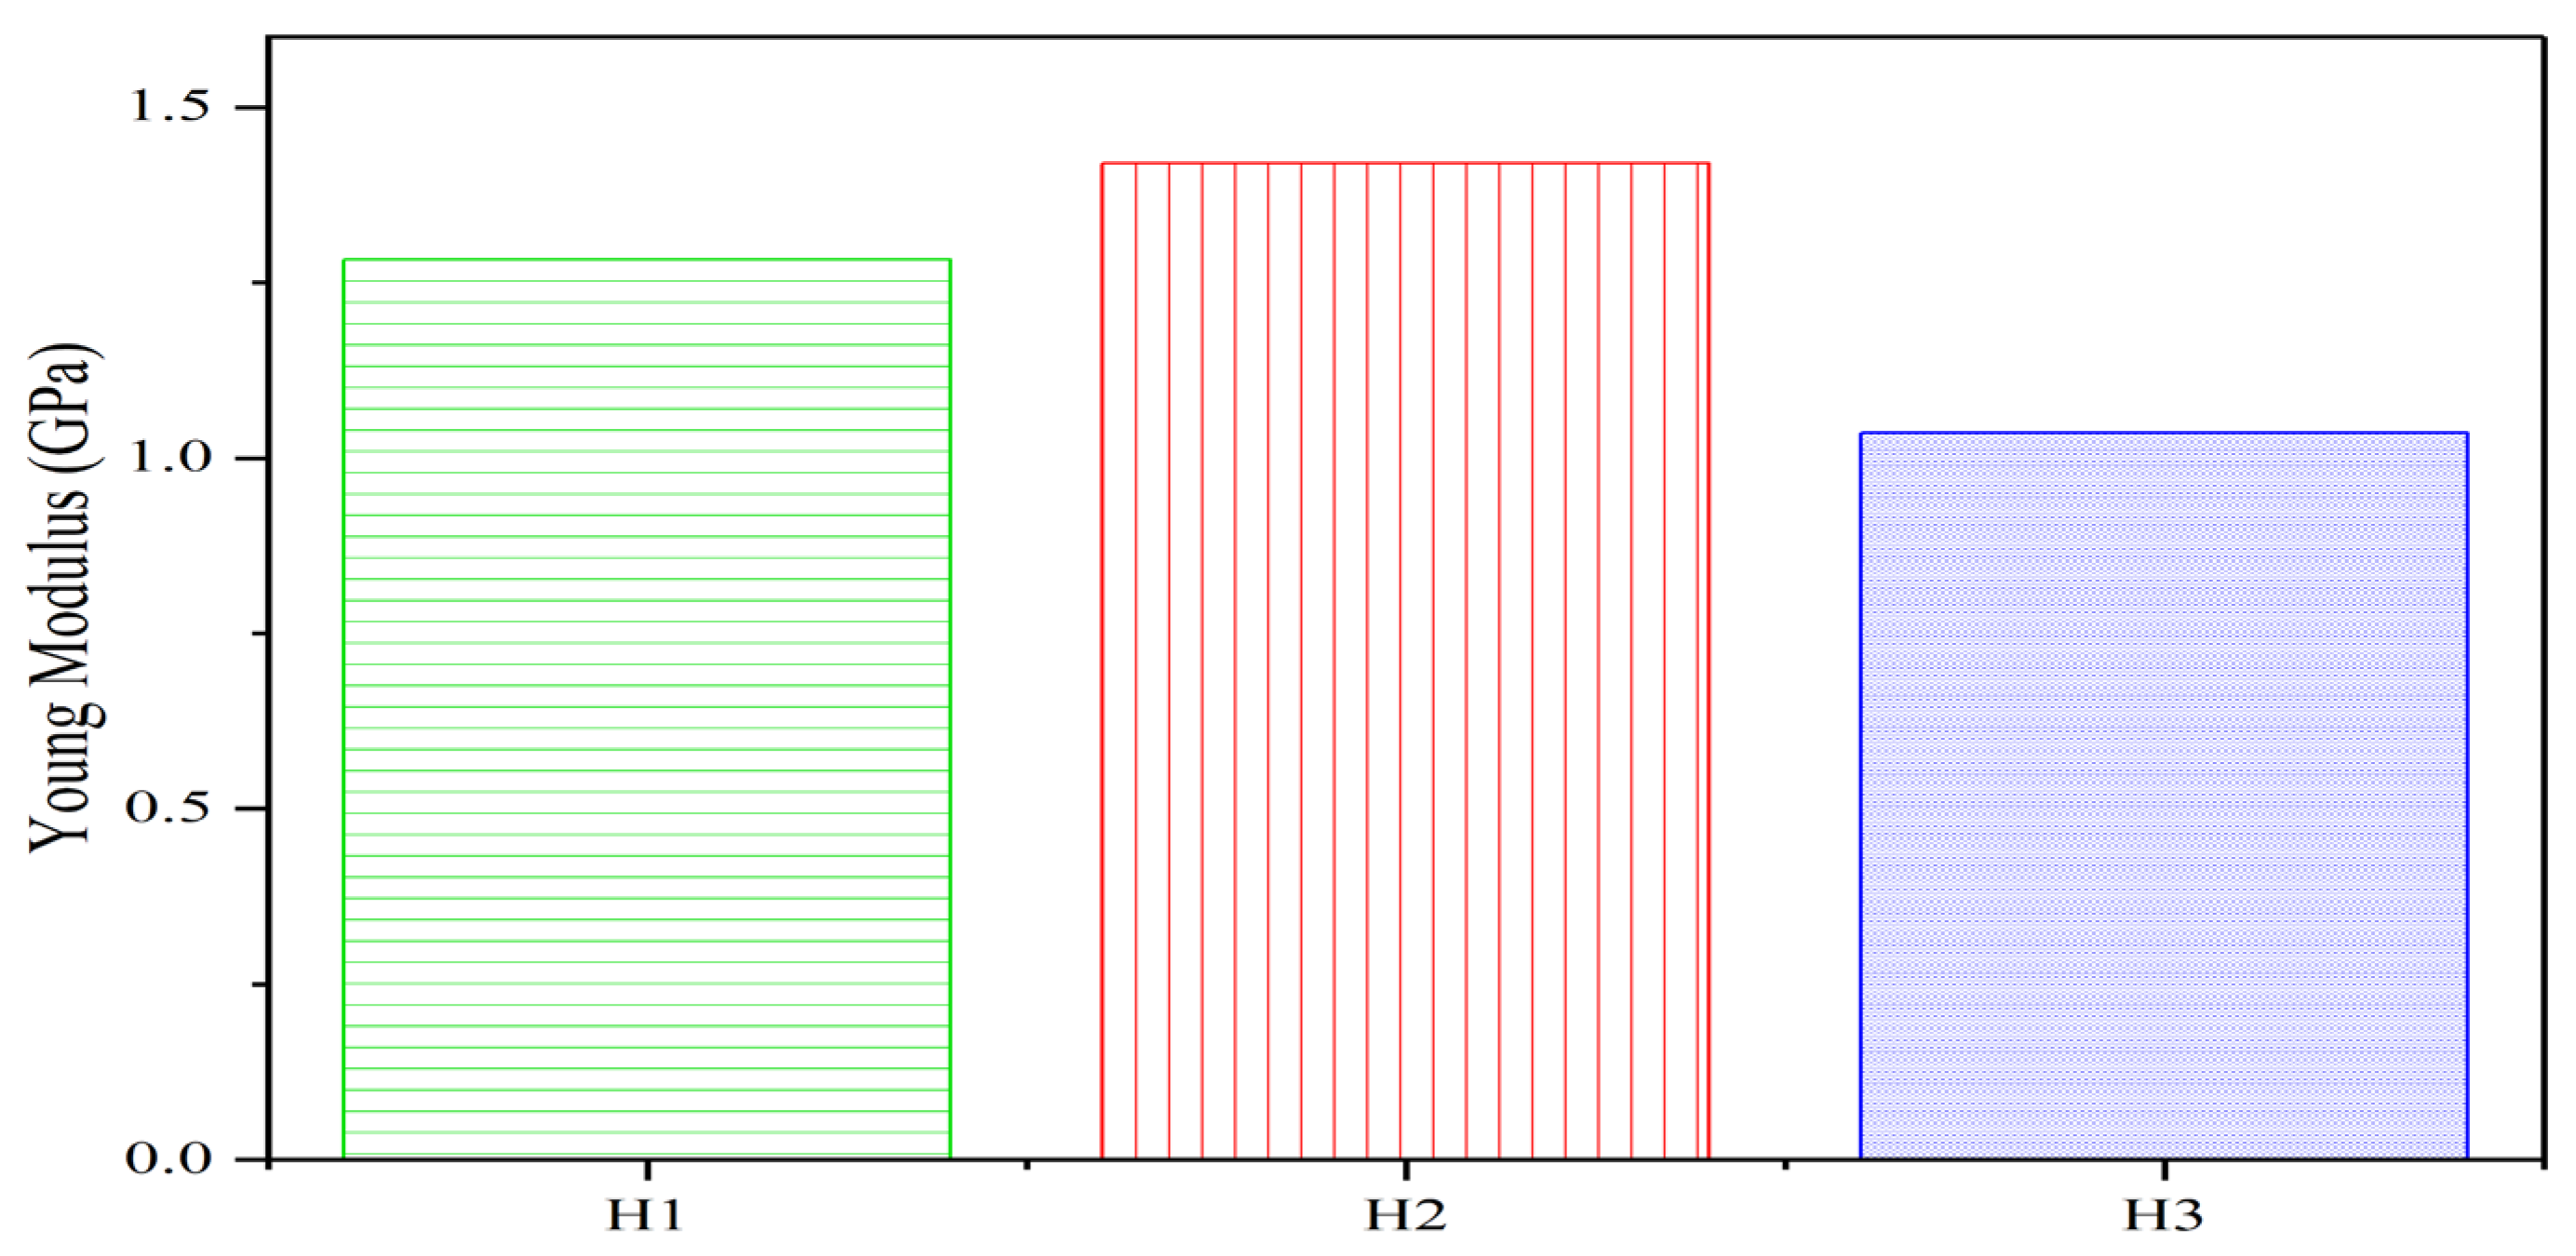
- E initially increases from 12.437 GPa to 13.663 GPa but subsequently decreases to 9.657 GPa as pore size expands within the 0.3–1.5 nm range.
- This non-monotonic trend stems from two competing mechanisms:
- (1)
- Enhanced energy from hydration: Increased water molecule density at smaller pores elevates system energy, improving deformation resistance.
- (2)
- Structural weakening: Larger pores reduce structural integrity, facilitating compressive strain.
- When the pore size grows from 0.37 nm to 0.74 nm (H1 to H2 groups), the hydration effect dominates, increasing E. The further expansion to 1.12 nm (H3 group) shifts the balance toward pore-induced structural weakening, causing E to decline.
4. Nanomechanical Behavior of SAP-Modified C-S-H: Verification and Discussion
4.1. Verification
4.2. Discussion
4.2.1. Fundamental Insights into SAP-Modified C-S-H Mechanics
4.2.2. Engineering Implications for Concrete Design
- (1)
- SAP particle size control: Smaller SAP particles (<50 μm) generate sub ~0.74 nm pores during swelling, minimizing mechanical degradation while sustaining internal curing efficiency [116]. The smaller SAP-induced pores (0.37–1.12 nm) promote distributed microcracking at the nanoscale [117]. This aligns with experimental observations of increased fracture energy (25–40%) in SAP-modified concrete proposed by Mechtcherine et al. [114], where 40 μm SAPs improved pavement durability by 35% without compromising the 28-day strength.
- (2)
- Dosage optimization: Nonlinear mechanical degradation (e.g., 41% G, 44% K, 41% E reduction at 0.3% SAP vs. 0.2% SAP) suggests an optimal SAP dosage of 0.1–0.2 wt% cement, balancing pore refinement (desirable for curing) and strength retention (critical for load-bearing structures).
- (3)
- Material–structure synergy: The observed nanoscale mechanical degradation and pore refinement induced by SAPs have profound implications for macroscale concrete performance. In cast-in-place concrete structures (e.g., high-performance concrete bridge deck presented in Appendix C (Figure A1a,b)), the targeted SAPs used in low-stress zones could enhance crack resistance, whereas SAP exclusion from high-stress regions (e.g., beam tension faces) preserves structural integrity.
4.2.3. Limitations and Future Directions
- (1)
- Simplified pore morphology: Spherical pores in simulations neglect real SAP-induced pore anisotropy observed via TEM. Future work should incorporate irregular pore geometries.
- (2)
- Multi-ion effects: Simulations assumed pure pore water, whereas real cement pore solutions contain Ca2+, K+, Na+, and SO42−, which may alter the interfacial water structure.
- (3)
- Scale integration: The current MD-to-macro correlation relies on phenomenological models. Multiscale frameworks (e.g., FE-MD coupling) are needed to predict component-level performance.
5. Conclusions and Prospects
5.1. Key Findings
- (1)
- Pore classification and SAP refinement mechanism: SAP addition refines transition/capillary pores into gel pores (0.6–3.2 nm), with a distinct 0.74 nm peak in pore size distribution. Pores < 0.74 nm dominate interfacial energy dissipation, whereas larger pores (>0.74 nm) trigger localized stress concentrations.
- (2)
- Molecular dynamics framework: We established a validated MD workflow for C-S-H gel with SAP-induced pores (0.37–1.12 nm), enabling the atomic-scale analysis of pore–property relationships.
- (3)
- Optimal SAP content: A 0.2% SAP dosage generates ~0.74 nm pores, maximizing interfacial bulk (10.61 GPa), shear (5.31 GPa), and Young’s modulus (13.66 GPa) values.
5.2. Scientific Prospects
- (1)
- Pore morphology realism: Replace idealized spherical pores with TEM-informed irregular geometries to capture anisotropic stress distributions.
- (2)
- Multiscale bridging: Integrate MD-predicted nanomechanics into phase-field or FEM frameworks to predict macroscale crack propagation in SAP-modified concrete.
5.3. Applied Engineering Prospects
- (1)
- SAP material design: Prioritize SAPs with crosslinked networks (e.g., acrylic acid-co-acrylamide) to limit swelling and stabilize pore sizes <0.74 nm.
- (2)
- Optimize particle size distribution (e.g., 20–50 μm) to enhance pore refinement efficiency.
- (3)
- Concrete mix optimization: Apply 0.1–0.2% SAPs in high-stress zones (e.g., bridge decks) for crack suppression, while minimizing SAPs in compression-critical regions (e.g., columns). Combine SAPs with nano-silica to offset strength loss via pozzolanic reactivity.
Author Contributions
Funding
Data Availability Statement
Conflicts of Interest
Appendix A

| Items | H1 Group | H2 Group | H3 Group | |||
|---|---|---|---|---|---|---|
| Initial | Final | Initial | Final | Initial | Final | |
| Tot. energy (kcal/mol) | −21,346.382 | −20,712.823 | −21,346.382 | −20,712.823 | −21,814.6649 | −21,216.576 |
| Pot. energy (kcal/mol) | −22,763.189 | −22,091.413 | −22,763.189 | −22,091.413 | −23,364.698 | −22,830.948 |
| Kin. energy (kcal/mol) | 1416.807 | 1378.590 | 1416.807 | 1378.590 | 1550.049 | 1614.372 |
| Tot. enthalpy (kcal/mol) | −24,500.171 | −23,483.741 | −24,500.171 | −23,483.741 | −24,595.401 | −23,306.257 |
| Temperature (K) | 298.000 | 289.962 | 298.000 | 289.962 | 298.000 | 310.366 |
| Pressure (GPa) | −0.980 | −0.861 | −0.980 | −0.861 | −0.810 | −0.609 |
| Volume (Å3) | 22,361.199 | 22,361.199 | 22,361.199 | 22,361.199 | 23,838.302 | 23,838.302 |
| Density (g/cm3) | 1.756 | 1.756 | 1.756 | 1.756 | 1.710 | 1.710 |
Appendix B
| (a) Stiffness Matrix of H1 | (b) Flexibility Matrix of H1 |
| (c) Stiffness Matrix of H2 | (d) Flexibility Matrix of H2 |
| (e) Stiffness Matrix of H3 | (f) Flexibility Matrix of H3 |
Appendix C

References
- Mostafaei, H.; Keshavarz, Z.; Rostampour, M.A.; Mostofinejad, D.; Wu, C. Sustainability Evaluation of a Concrete Gravity Dam: Life Cycle Assessment, Carbon Footprint Analysis, and Life Cycle Costing. Structures 2023, 53, 279–295. [Google Scholar] [CrossRef]
- Hadizadeh-Bazaz, M.; Navarro, I.J.; Yepes, V. Life Cycle Assessment of a Coastal Concrete Bridge Aided by Non-Destructive Damage Detection Methods. J. Mar. Sci. Eng. 2023, 11, 1656. [Google Scholar] [CrossRef]
- Kaya, O.; Citir, N.; Ceylan, H.; Kim, S.; Waid, D.R. Development of Pavement Performance and Remaining Service Life Prediction Tools for Iowa Jointed Plain Concrete Pavement Systems. J. Transp. Eng. Part B-Pavements 2022, 149, 04022070. [Google Scholar] [CrossRef]
- Wu, R.; Shen, Y.; Li, J.; Cheng, L.; Zhang, G.; Zhang, Y. Effect of Iron Tailings and Slag Powders on Workability and Mechanical Properties of Concrete. Front. Mater. 2021, 8, 723119. [Google Scholar]
- Alaj, A.; Krelani, V.; Numao, T. Effect of Class F Fly Ash on Strength Properties of Concrete. Civ. Eng. J.-Tehran 2023, 9, 2249–2258. [Google Scholar] [CrossRef]
- Masanaga, M.; Hirata, T.; Kawakami, H.; Morinaga, Y.; Nawa, T.; Elakneswaran, Y. Effects of a New Type of Shrinkage-Reducing Agent on Concrete Properties. Materials 2020, 13, 3018. [Google Scholar] [CrossRef]
- Dąbrowski, M.; Glinicki, M.A. Air void system parameters and frost resistance of air-entrained concrete containing calcareous fly ash. Roads Bridges-Drog. I Mosty 2013, 12, 41–55. [Google Scholar] [CrossRef]
- Wu, J.; Zhang, W.; Han, J.; Liu, Z.; Liu, J.; Huang, Y. Experimental Research on Crack Resistance of Steel–Polyvinyl Alcohol Hybrid Fiber-Reinforced Concrete. Materials 2024, 17, 3097. [Google Scholar] [CrossRef]
- Velichko, E.G.; Vatin, N.I. Reactive Powder Concrete Microstructure and Particle Packing. Materials 2022, 15, 2220. [Google Scholar] [CrossRef]
- Oneschkow, N.; Scheiden, T.; Hüpgen, M.; Rozanski, C.; Haist, M. Fatigue-Induced Damage in High-Strength Concrete Microstructure. Materials 2021, 14, 5650. [Google Scholar] [CrossRef]
- Sagar, B.; Sivakumar, M.V.N. Mechanical and Microstructure Characterization of Alccofine Based High Strength Concrete. Silicon 2022, 14, 795–813. [Google Scholar] [CrossRef]
- Wu, Z. Research and application of high strength and super high strength cement-based materials. Concr. Cem. Prod. 1992, 5, 4–9. [Google Scholar]
- Prado, L.P.; Carrazedo, R.; El Debs, M.K. Interface strength of High-Strength concrete to Ultra-High-Performance concrete. Eng. Struct. 2022, 252, 113591. [Google Scholar] [CrossRef]
- Du, J.; Meng, W.; Khayat, K.H.; Bao, Y.; Guo, P.; Lyu, Z.; Abu-obeidah, A.; Nassif, H.; Wang, H. New development of ultra-high-performance concrete (UHPC). Compos. Part B-Eng. 2021, 224, 109220. [Google Scholar] [CrossRef]
- Škvára, F.; Kolář, K.; Novotný, J.; Zadák, Z. Cement pastes and mortars with low water-to-cement ratio I. Cem. Concr. Res. 2003, 10, 253–262. [Google Scholar] [CrossRef]
- Huang, F.; Hu, Z.; Li, S.; Liu, J.; Han, F.; Liu, J. Long-term deformation and mechanical properties evolution of cement paste with ultra-low water-to-cement ratio driven by water migration. J. Build. Eng. 2023, 76, 107250. [Google Scholar] [CrossRef]
- An, M.; Liu, Y.; Zhang, G.; Wang, Y. Properties of Cement-Based Materials with Low Water–Binder Ratios and Evaluation Mechanism under Further Hydration Effect. Appl. Sci. 2023, 13, 9946. [Google Scholar] [CrossRef]
- Suzuki, M.; Meddah, M.S.; Sato, R. Use of porous ceramic waste aggregates for internal curing of high-performance concrete. Cem. Concr. Res. 2009, 39, 373–381. [Google Scholar] [CrossRef]
- Zhang, S.; Lu, Z.; Li, Y.; Ang, Y.; Zhang, K. A Method for Internal Curing Water Calculation of Concrete with Super Absorbent Polymer. Adv. Civ. Eng. 2021, 2021, 6645976. [Google Scholar] [CrossRef]
- Justs, J.; Wyrzykowski, M.; Winnefeld, F.; Bajare, D.; Lura, P. Influence of superabsorbent polymers on hydration of cement pastes with low water-to-binder ratio. J. Therm. Anal. Calorim. 2013, 115, 425–432. [Google Scholar] [CrossRef]
- AzariJafari, H.; Kazemian, A.; Rahimi, M.; Yahia, A. Effects of pre-soaked super absorbent polymers on fresh and hardened properties of self-consolidating lightweight concrete. Constr. Build. Mater. 2016, 113, 215–220. [Google Scholar] [CrossRef]
- Liu, J.; Wang, M.; Liu, N.; Teng, L.; Wang, Y.; Chen, Z.; Shi, C. Development of ultra-fine SAP powder for lower-shrinkage and higher-strength cement pastes made with ultra-low water-to-binder ratio. Compos. Part B-Eng. 2023, 262, 110810. [Google Scholar] [CrossRef]
- Shah, T.-U.-H.; Tahir, M.H.; Rahman, A.U.; Liu, H.-W. Superabsorbent capability and high retention ability of China clay (Kaolinite)/polyacrylic acid composites for aqueous solution. Chin. J. Chem. Phys. 2019, 32, 508–512. [Google Scholar] [CrossRef]
- Bai, H.; Li, Z.; Zhang, S.; Wang, W.; Dong, W. Interpenetrating polymer networks in polyvinyl alcohol/cellulose nanocrystals hydrogels to develop absorbent materials. Carbohydr. Polym. 2018, 200, 468–476. [Google Scholar] [CrossRef]
- Yu, K.; Liu, J.; Li, H.; Li, B.; Guo, J. Preparation and properties of super water-retaining agent with sulfonic acid and carboxylic acid groups assisted by ultrasounds. Polym. Bull. 2024, 81, 13607–13627. [Google Scholar] [CrossRef]
- Lee, P.I. Absorbent polymer technology. J. Control. Release 2002, 17, 297–298. [Google Scholar] [CrossRef]
- Qi, Z.; Hu, X. Water absorbency of super absorbent polymer based on flexible polymeric network. Eur. Polym. J. 2022, 166, 111045. [Google Scholar] [CrossRef]
- Watanabe, N.; Hosoya, Y.; Tamura, A.; Kosuge, H. Characteristics of water-absorbent polymer emulsions. Polym. Int. 2007, 30, 525–531. [Google Scholar] [CrossRef]
- Rahman, M.M.; Jyoti, L.T.Z.; Paul, S.; Ishmam, A.; Hossain, M.A. Mechanical and Thermal Performance of Cement Mortar Incorporating Super Absorbent Polymer (SAP). Civ. Eng. J.-Tehran 2020, 6, 2231–2244. [Google Scholar] [CrossRef]
- Liu, J.; Farzadnia, N.; Shi, C. Microstructural and micromechanical characteristics of ultra-high performance concrete with superabsorbent polymer (SAP). Cem. Concr. Res. 2021, 149, 106560. [Google Scholar] [CrossRef]
- Xie, F.; Zhang, C.; Cai, D.; Ruan, J. Comparative Study on the Mechanical Strength of SAP Internally Cured Concrete. Front. Mater. 2020, 7, 588130. [Google Scholar] [CrossRef]
- Kim, M.; Moon, J.; Hong, S.-G. Theoretical study on the freeze resistance of concrete mixed with superabsorbent polymer (SAP) considering the reabsorption behavior of SAP. J. Sustain. Cem.-Based Mater. 2022, 12, 292–304. [Google Scholar] [CrossRef]
- Mechtcherine, V.; Wyrzykowski, M.; Schröfl, C.; Snoeck, D.; Lura, P.; De Belie, N.; Mignon, A.; Van Vlierberghe, S.; Klemm, A.J.; Almeida, F.C.R.; et al. Application of super absorbent polymers (SAP) in concrete construction—Update of RILEM state-of-the-art report. Mater. Struct. 2021, 54, 80. [Google Scholar] [CrossRef]
- De Souza, F.B.; Sagoe-Crentsil, K.; Duan, W. A century of research on calcium silicate hydrate (C-S-H): Leaping from structural characterization to nanoengineering. J. Am. Ceram. Soc. 2022, 105, 3081–3099. [Google Scholar] [CrossRef]
- Bedi, R.; Sharma, S.; Sonwani, Y.K. Prediction of Mechanical Properties of Epoxy Concrete Using Molecular Dynamics Simulation. Compos.-Mech. Comput. Appl. 2021, 12, 25–39. [Google Scholar] [CrossRef]
- Ma, X.; Liu, J.; Wu, Z.; Shi, C. Effects of SAP on the properties and pore structure of high performance cement-based materials. Constr. Build. Mater. 2017, 131, 476–484. [Google Scholar] [CrossRef]
- Sutter, L.L.; Peterson, K.R.; Van Dam, T.J.; Smith, K. Using Epifluorescence Optical Microscopy to Identify Causes of Concrete Distress: Case Study. Transp. Res. Rec. 2007, 1798, 22–30. [Google Scholar] [CrossRef]
- Barbhuiya, S.; Das, B.B. Molecular dynamics simulation in concrete research: A systematic review of techniques, models and future directions. J. Build. Eng. 2023, 76, 107267. [Google Scholar] [CrossRef]
- Older, I.; Rossler, M. Investigations on the relationship between porosity structure and strength of hydrated Portland cement pastes II. Effects of pore structure and degree of hydration. Cem. Concr. Res. 1985, 4, 401–410. [Google Scholar]
- Atize, C.; Massidda, L. Effect of pore size distribution on strength of hardened cement paste. Cem. Concr. Res. 1986, 1, 56–62. [Google Scholar]
- Jambor, J. Pore structure and strength of hardened cement pastes. In Proceedings of the 8th ICCC, Vienna, Austria, 7–11 September 1964. [Google Scholar]
- Schiller, K.K. Strength of porous materials. Cem. Concr. Res. 1971, 1, 419–422. [Google Scholar] [CrossRef]
- Hasselman, D.P.H. Relation between effects of porosity on strength and on Young’s modulus of elasticity of polycrystalline materials. J. Am. Ceram. Soc. 1963, 46, 564–565. [Google Scholar] [CrossRef]
- Pellenq, R.J.M.; Kushima, A.; Shahsavari, R.; Van Vliet, K.J.; Buehler, M.J.; Yip, S.; Ulm, F.J. A realistic molecular model of cement hydrates. Proc. Natl. Acad. Sci. USA 2009, 106, 16102–16107. [Google Scholar] [CrossRef]
- Bauchy, M.; Qomi, M.J.A.; Bichara, C.; Ulm, F.-J.; Pellenq, R.J.-M. Transition in Materials: Hardness is Driven by Weak Atomic Constraints. Phys. Rev. Lett. 2015, 114, 125502. [Google Scholar] [CrossRef]
- Le Chatelier, H. Experimental researches on the constitution of cements and the theory of their setting. Comptes Rendus Acad. Sci. 1882, 94, 867–869. [Google Scholar]
- Taylor, H.F.W.; Howison, J.W. Relationships between calcium silicates and clay minerals, Clay Mineral. Bulletin 1956, 3, 98–111. [Google Scholar]
- Taylor, H.F.W. Proposed structure for calcium silicate hydrate gel. J. Am. Ceram. Soc. 1986, 69, 464–467. [Google Scholar] [CrossRef]
- Taylor, H.F.W. A discussion of the papers “Models for the composition and structure of calcium silicate hydrate (C-S-H) gel in hardened tricalcium silicate pastes” and “The incorporation of minor and trace elements into calcium silicate hydrate (C-S-H) gel in hardened cement pastes”. Cem. Concr. Res. 1993, 23, 995–998. [Google Scholar]
- Newberry, S.B.; Smith, M.M. Constitution of hydraulic cements. J. Soc. Chem. Ind. 1903, 22, 94–95. [Google Scholar]
- Bogue, R.H. The Chemistry of Portland Cement, 2nd ed.; Reinhold Publishing Corporation: New York, NY, USA, 1955. [Google Scholar]
- Bernal, J.D.; Jeffery, J.W.; Taylor, H.F.W. Crystallographic research on the hydration of Portland cement. A first report on investigations in progress. Mag. Concr. Res. 1952, 4, 49–54. [Google Scholar] [CrossRef]
- Richardson, I.G.; Groves, G.W. The structure of the calcium silicate hydrate phases present in hardened pastes of white Portland cement/blast-furnace slag blends. J. Mater. Sci. 1997, 32, 4793–4802. [Google Scholar] [CrossRef]
- Richardson, I.G.; Brough, A.R.; Groves, G.W.; Dobson, C.M. The characterization of hardened alkali- activated blast-furnace slag pastes and the nature of the calcium silicate hydrate (C-S-H) phase. Cem. Concr. Res. 1994, 24, 813–829. [Google Scholar] [CrossRef]
- Richardson, I.G.; Brough, A.R.; Brydson, R.; Groves, G.W.; Dobson, C.M. The location of aluminum in substituted calcium silicate hydrate (C-S-H) gels as determined by 29Si and 27Al nmR and EELS. J. Am. Chem. Soc. 1993, 76, 2285–2288. [Google Scholar] [CrossRef]
- Richardson, I.G. Tobermorite/jennite and tobermorite/calcium hydroxide-based models for the structure of C-S-H: Applicability to hardened pastes of tricalcium silicate, h-dicalcium silicate, Portland cement, and blends of Portland cement with blast-furnace slag, metakaolin, or silica fume. Cem. Concr. Res. 2004, 34, 1733–1777. [Google Scholar]
- Richardson, I.G.; Groves, G.W. Microstructure and microanalysis of hardened ordinary Portland cement pastes. J. Mater. Sci. 1993, 28, 265–277. [Google Scholar] [CrossRef]
- Hamid, S.A. The crystal structure of the 11 Å natural tobermorite Ca2.25 [Si3O7.5(OH)1.5].3.5H2O. Z. Krist. 1981, 154, 189–198. [Google Scholar]
- Bauchy, M.; Qomi, M.J.A.; Ulm, F.-J.; Pellenq, R.J.-M. Order and disorder in calcium–silicate–hydrate. Phys. Rev. Lett. 2015, 114, 195502. [Google Scholar] [CrossRef]
- Richardson, I.G. The calcium silicate hydrates. Cem. Concr. Res. 2008, 38, 137–158. [Google Scholar] [CrossRef]
- Qomi, M.J.A.; Krakowiak, K.J.; Bauchy, M.; Stewart, K.L.; Shahsavari, R.; Jagannathan, D.; Brommer, D.B.; Baronnet, A.; Buehler, M.J.; Yip, S.; et al. Combinatorial molecular optimization of cement hydrates. Nat. Commun. 2014, 5, 4960. [Google Scholar]
- Hou, D.; Yu, J.; Wang, P. Molecular dynamics modeling of the structure, dynamics, energetics and mechanical properties of cement-polymer nanocomposite. Composites 2019, 162, 433–444. [Google Scholar] [CrossRef]
- Li, Z.; Liu, S.; Tong, T.; Xiao, S.; Li, Y. Effect of Gel Pore on the Mechanical Properties of Calcium Silicate Hydrate by Molecular Dynamics Simulation. J. Mater. Sci. Eng. 2023, 41, 703–709+774. [Google Scholar]
- Roopa, A.K.; Hunashyal, A.M.; Patil, A.Y.; Kamadollishettar, A.; Patil, B.; Soudagar, M.E.M.; Shahapurkar, K.; Khan, T.M.Y. Study on Interfacial Interaction of Cement-Based Nanocomposite by Molecular Dynamic Analysis and an RVE Approach. Adv. Civ. Eng. 2023, 6, 1–18. [Google Scholar] [CrossRef]
- Mishra, R.K.; Mohamed, A.K.; Geissbühler, D.; Manzano, H.; Jamil, T.; Shahsavari, R.; Kalinichev, A.G.; Galmarini, S.; Tao, L. Cemff: A force field database for cementitious materials including validations, applications and opportunities. Cem. Concr. Res. 2017, 102, 68–89. [Google Scholar] [CrossRef]
- Hue, K.Y.; Lew, J.H.; Thant, M.M.M.; Matar, O.K.; Luckham, P.F.; Müller, E.A. Molecular Dynamics Simulation of Polyacrylamide Adsorption on Calcite. Molecules 2023, 28, 6367. [Google Scholar] [CrossRef]
- Zhang, W.; Zhang, M.; Hou, D. EVA enhances the interfacial strength of EPS concrete: A molecular dynamics study. J. Exp. Nanosci. 2021, 16, 382–396. [Google Scholar]
- Fan, D.; Yang, S. Mechanical properties of C-S-H globules and interfaces by molecular dynamics simulation. Constr. Build. Mater. 2018, 176, 573–582. [Google Scholar] [CrossRef]
- Mohan, M.K.; Rahul, A.V.; Van Stappen, J.F.; Cnudde, V.; De Schutter, G.; Van Tittelboom, K. Assessment of pore structure characteristics and tortuosity of 3D printed concrete using mercury intrusion porosimetry and X-ray tomography. Cem. Concr. Compos. 2023, 140, 105104. [Google Scholar] [CrossRef]
- Ghods, P.; Isgor, O.B.; Carpenter, G.J.C.; Li, J.; McRae, G.A.; Gu, G.P. Nano-scale study of passive films and chloride-induced depassivation of carbon steel rebar in simulated concrete pore solutions using FIB/TEM. Cem. Concr. Res. 2013, 47, 55–68. [Google Scholar] [CrossRef]
- Brisard, S.; Davy, C.A.; Michot, L.; Troadec, D.; Levitz, P. Mesoscale pore structure of a high-performance concrete by coupling focused ion beam/scanning electron microscopy and small angle X-ray scattering. J. Am. Ceram. Soc. 2018, 102, 2905–2923. [Google Scholar] [CrossRef]
- Bikbaou, M. 7th international congress on the chemistry of cement (Paris). Cem. Concr. Res. 1980, 9, i–ii. [Google Scholar]
- Powers, T.C. Physical Properties of Cement Paste. In Proceedings of the Fourth International Symposium on the Chemistry of Cement, Washington, DC, USA, 2–7 October 1960; Volume 2, p. 577. [Google Scholar]
- Feldman, R.F.; Ramachandran, V.S. New Accelerated Methods for Redictin Durability of Cementitious Materials. ASTM 1978, 691, 313–325. [Google Scholar]
- Feldman, R.F. Pore Structure Formation During Hydration of Fly-Ash and Slag Cement Blends. In Proceedings of the Materials Research Society Annual Meeting, Boston, MA, USA, 16 November 1981; Volume 11, pp. 16–19. [Google Scholar]
- Brunauer, S. Pore Structure of Solids. Pure Appl. Chem. 1976, 48, 401–405. [Google Scholar] [CrossRef]
- Lianyi, K.; Zhengji, D. Phase compositon of hardened cement slurry. In Proceedings of the 6th International Cement Chemistry Conference, II; China Building Industry Press: Beijing, China, 1982. [Google Scholar]
- Brunauer, S.; Mikhail, R.S.H.; Bodor, E.E. Pore Structure Analysis without a Pore Shape Model. J. Colloid Interface Sci. 1967, 24, 451–463. [Google Scholar] [CrossRef]
- Wu, Z.; Lian, H. High-Performance Concrete; China Railway Publishing House: Beijing, China, 1992; pp. 218–244. [Google Scholar]
- Hansen, T.C. Physical structure of hardened cement paste: A classical approach. Mater. Struct. 1986, 14, 210–219. [Google Scholar] [CrossRef]
- Shen, A. Cement and Concrete; Beijing Communications Press: Beijing, China, 2000; pp. 93–103. [Google Scholar]
- Rao, G.A. Generalization of Abram’s law for cement mortars. Cem. Concr. Res. 2001, 31, 495–502. [Google Scholar] [CrossRef]
- Powers, T.C. Structure and physical properties of hardened Portland cement paste. J. Am. Ceram. Soc. 1958, 41, 1–6. [Google Scholar] [CrossRef]
- Balshin, M.Y. The Mechanics of Powder Material Compaction. Dokl. Akad. Nauk. SSSR 1949, 67, 831–834. [Google Scholar]
- Ryshkewitch, E. Compression Strength of Porous Sintered Alumina and Zirconia. J. Am. Ceram. Soc. 1953, 36, 65–68. [Google Scholar] [CrossRef]
- Jin, N.; Jin, X.; Guo, J. Relationship modeling of pore structure and strength of concrete. J. Zhejiang Univ. (Eng. Sci.) 2005, 39, 1680–1684. [Google Scholar]
- Ma, C.; Feng, N.; Wu, Z. The relationship between the pore structure and the flexural and compressive strength of zeolite rock. Concrete 1994, 6, 6–12. [Google Scholar]
- Tan, Y.; Li, B.; Chen, Y.-T.; Ling, Y.; Shi, W. Effects of Superabsorbent Polymer and Natural Zeolite on Shrinkage, Mechanical Properties, and Porosity in Ultra-High Performance Concretes. Dev. Built Environ. 2024, 20, 100568. [Google Scholar] [CrossRef]
- Olawuyi, B.J.; Babafemi, A.J.; Boshoff, W.P. Early-age and long-term strength development of high-performance concrete with SAP. Constr. Build. Mater. 2020, 267, 121798. [Google Scholar] [CrossRef]
- Borito, S.M.; Zhu, H.; Yu, Y.; Al-shawafi, A. Effect of superabsorbent polymers on mechanical strength and cracking of mortar and concrete with water to cement ratios of 0.4 and 0.5. Struct. Concr. 2022, 23, 3974–3994. [Google Scholar] [CrossRef]
- Beushausen, H.; Gillmer, M.; Alexander, M. The influence of superabsorbent polymers on strength and durability properties of blended cement mortars. Cem. Concr. Compos. 2014, 52, 73–80. [Google Scholar] [CrossRef]
- Ding, H.; Zhang, L.; Zhang, P. Factors Influencing Strength of Super Absorbent Polymer (SAP) Concrete. Trans. Tianjin Univ. 2017, 23, 245–257. [Google Scholar] [CrossRef]
- Zhang, Z. Influence and Mechanism of SAP on the Properties of Cement Concrete. Master’s Thesis, Jilin University, Changchun, China, 2019. [Google Scholar]
- Kong, X.; Zhang, Z. Investigation on the shrinkage-reducing effect of super-absorbent polymer in high-strength concrete and its mechanism. J. Build. Mater. 2014, 17, 559–565+571. [Google Scholar]
- Shen, A.; Li, D.; Guo, Y.; Qian, Y.; Wang, W.; Qin, X.; Lv, Z.; Zhao, M.; Wang, Z. Correlation Investigation between Impermeability and Mesostructure of Internal Curing Concrete with SAP. Bull. Chin. Ceram. Soc. 2019, 38, 3993–4001. [Google Scholar]
- Qin, H.; Gao, M.; Pang, C.; Wei, S. Research on performance improvement of expansive concrete with internal curing agent SAP and its action mechanism. J. Build. Mater. 2011, 14, 394–399. [Google Scholar]
- Jensen, O.M.; Hansen, P.F. Water-entrained cement-based materials: I. Principles and theoretical background. Cem. Concr. Res. 2001, 31, 647–654. [Google Scholar] [CrossRef]
- Kang, S.-H.; Hong, S.-G.; Moon, J. Absorption kinetics of superabsorbent polymers (SAP) in various cement-based solutions. Cem. Concr. Res. 2017, 97, 73–83. [Google Scholar] [CrossRef]
- Liu, M.; Hu, Y.; Li, J.; Liu, X.; Sun, H.; Di, Y.; Wu, X.; Zhang, J. Insights into Hydration Kinetics of Cement Pastes Evaluated by Low-Field Nuclear Magnetic Resonance: Effects of Super-Absorbent Polymer as Internal Curing Agent and Calcium Oxide as Expansive Agent. Materials 2025, 18, 836. [Google Scholar] [CrossRef] [PubMed]
- Zhu, X.; Brochard, L.; Vandamme, M.; Ren, Q.; Li, C.; Jiang, Z. A hierarchical C-S-H/organic superstructure with high stiffness, super-low porosity, and low mass density. Cem. Concr. Res. 2024, 176, 107407. [Google Scholar] [CrossRef]
- Ulm, F.J.; Vandamme, M.; Jennings, H.M. Nanogranular origin of concrete creep. J. Am. Ceram. Soc. 2010, 93, 1239–1252. [Google Scholar]
- Xun, W.; Wu, C.; Leng, X.; Li, J.; Xin, D.; Li, Y. Effect of Functional Superplasticizers on Concrete Strength and Pore Structure. Appl. Sci. 2020, 10, 3496. [Google Scholar] [CrossRef]
- Kim, I.-S.; Choi, S.-Y.; Choi, Y.-S.; Yang, E.-I. Effect of Internal Pores Formed by a Superabsorbent Polymer on Durability and Drying Shrinkage of Concrete Specimens. Materials 2021, 14, 5199. [Google Scholar] [CrossRef]
- Kang, S.-H.; Hong, S.-G.; Moon, J. The effect of superabsorbent polymer on various scale of pore structure in ultra-high performance concrete. Constr. Build. Mater. 2018, 172, 29–40. [Google Scholar] [CrossRef]
- Wang, F.; Fei, Y.; Peng, B. Autogenous Shrinkage of Concrete with Super-Absorbent Polymer. ACI Mater. J. 2009, 106, 123–127. [Google Scholar]
- Klemm, A.J.; Sikora, K.S. The effect of Superabsorbent Polymers (SAP) on microstructure and mechanical properties of fly ash cementitious mortars. Constr. Build. Mater. 2013, 49, 134–143. [Google Scholar] [CrossRef]
- Tong, Y.; Lai, J.; Bi, Y.; Sun, J.; Zhan, S.; Zhan, Y. Effect of adding methods of super absorbent polyer on performance of cement mortar. Concrete 2019, 3, 111–114. [Google Scholar]
- Snoeck, D.; Pel, L.; De Belie, N. Comparison of different techniques to study the nanostructure and the microstructure of cementitious materials with and without superabsorbent polymers. Constr. Build. Mater. 2019, 223, 244–253. [Google Scholar] [CrossRef]
- Lu, Y.; Wang, K.; Zhu, D.; Meng, Q.; Cui, L. Hydration and pore structure characteristics of concrete incorporating internal curing materials in a dry and large-temperature-difference environment. Mater. Res. Express 2022, 9, 035502. [Google Scholar] [CrossRef]
- Hill, T.R. A self-consistent mechanics of composite materials. J. Mech. Phys. Solids 1965, 13, 213–222. [Google Scholar] [CrossRef]
- Voigt, W. Lehrbuch der kristallphysic; Teubner: Leibzig, Germany, 1928. [Google Scholar]
- Reuss, A. Berechnung der Fließgrenze von Mischkristallen auf Grund der Plastizitätsbedingung für Einkristalle. ZAMM-Z. Angew. Math. Mech. 1929, 9, 49–58. [Google Scholar] [CrossRef]
- Shahsavari, R.; Buehler, M.J.; Pellenq, R.J.-M.; Ulm, F.-J. First-Principles Study of Elastic Constants and Interlayer Interactions of Complex Hydrated Oxides: Case Study of Tobermorite and Jennite. J. Am. Ceram. Soc. 2009, 92, 2323–2330. [Google Scholar] [CrossRef]
- Mechtcherine, V.; Dehn, F.; Plank, J. Superabsorbent polymers in concrete: Pore-filling mechanism and its effect on mechanical properties. Cem. Concr. Res. 2016, 89, 228–237. [Google Scholar]
- Lee, S.; Kim, J.; Park, H. Optimizing Strength and Ductility in SAP-Modified Concrete Mixtures. ACI Mater. J. 2021, 118, 123–134. [Google Scholar]
- Schröfl, C.; Snoeck, D.; Mechtcherine, V. Effect of particle size and solution concentration on the swelling capacity of superabsorbent polymers in cementitious materials. Cem. Concr. Compos. 2015, 65, 15–24. [Google Scholar]
- Yang, J.; Sun, Z.; De Belie, N.; Snoeck, D. Self-healing ability of cracks in alkali-activated slag systems incorporating superabsorbent polymers. Cem. Concr. Res. 2023, 89, 228–237. [Google Scholar] [CrossRef]

| Items | Algorithm | Energy (kcal·mol−1) | Force (kcal·mol−1·A−1) | Maximum Number of Iterations | External Pressure (GPa) | Motion Groups Rigid | Optimize Cell |
|---|---|---|---|---|---|---|---|
| Parameters | Smart | 0.001 | 0.5 | 500 | 0.001 | No | No |
| Items | Atomic Number | Tools | Force Field | MD Ensemble | Temperature (K) |
|---|---|---|---|---|---|
| Parameters | 100 | Discover | COMPASS | NPT | 300 |
| Items | Pressure (Gpa) | Temperature Control | Pressure Control | Time Step (fs) | Relaxation Time (ps) |
| Parameters | 0.01 | Nose-Hoover | Parrinello | 1 | 20 |
| Tot. Energy | Pot. Energy | Kin. Energy | Tot. Enthalpy | Temperature | Pressure | Bulk | Density | |
|---|---|---|---|---|---|---|---|---|
| (kcal·mol−1) | (K) | (GPa) | (A3) | (g·cm−3) | ||||
| Initial | −1135.969 | −1199.461 | 63.491 | −1216.436 | 300.000 | −0.595 | 938.837 | 2.146 |
| Final | −1073.531 | −1151.184 | 77.653 | −1279.237 | 366.916 | −1.522 | 938.837 | 2.146 |
| Std.Dev. | 22.225 | 12.678 | 12.758 | 101.724 | 60.284 | 0.705 | 0.000 | 0.000 |
| Pore Parameters | Authors | Models | Authors | Models |
|---|---|---|---|---|
| Void | Feret [82] | F = K [C/(C + W + A) | Abrams [82] | F = K1/K2W/C |
| Powers [83] | F = fXn | / | / | |
| Porosity | Balshin [84] | F = F0(1 − P)k | Ryshewitch [85] | E = E0e−BP |
| Schiller [42] | F = kln(P0/P) | Hasselman [43] | F = F0(1 − kP) | |
| Jambor [41] | Diamond [86] | |||
| Pore Size Distribution | Older [39] | F = 12 − 0.1P<10nm − 3.7P10–100nm − 3P>100nm | Atzeni [40] | F = F0 − a·P<10.6nm − b·P10.6–53nm − c·P53–106nm − d·P>106nm |
| Ma [87] | F = F0 − a·P<50nm − b·P50–100nm − c·P>100nm | / | / |
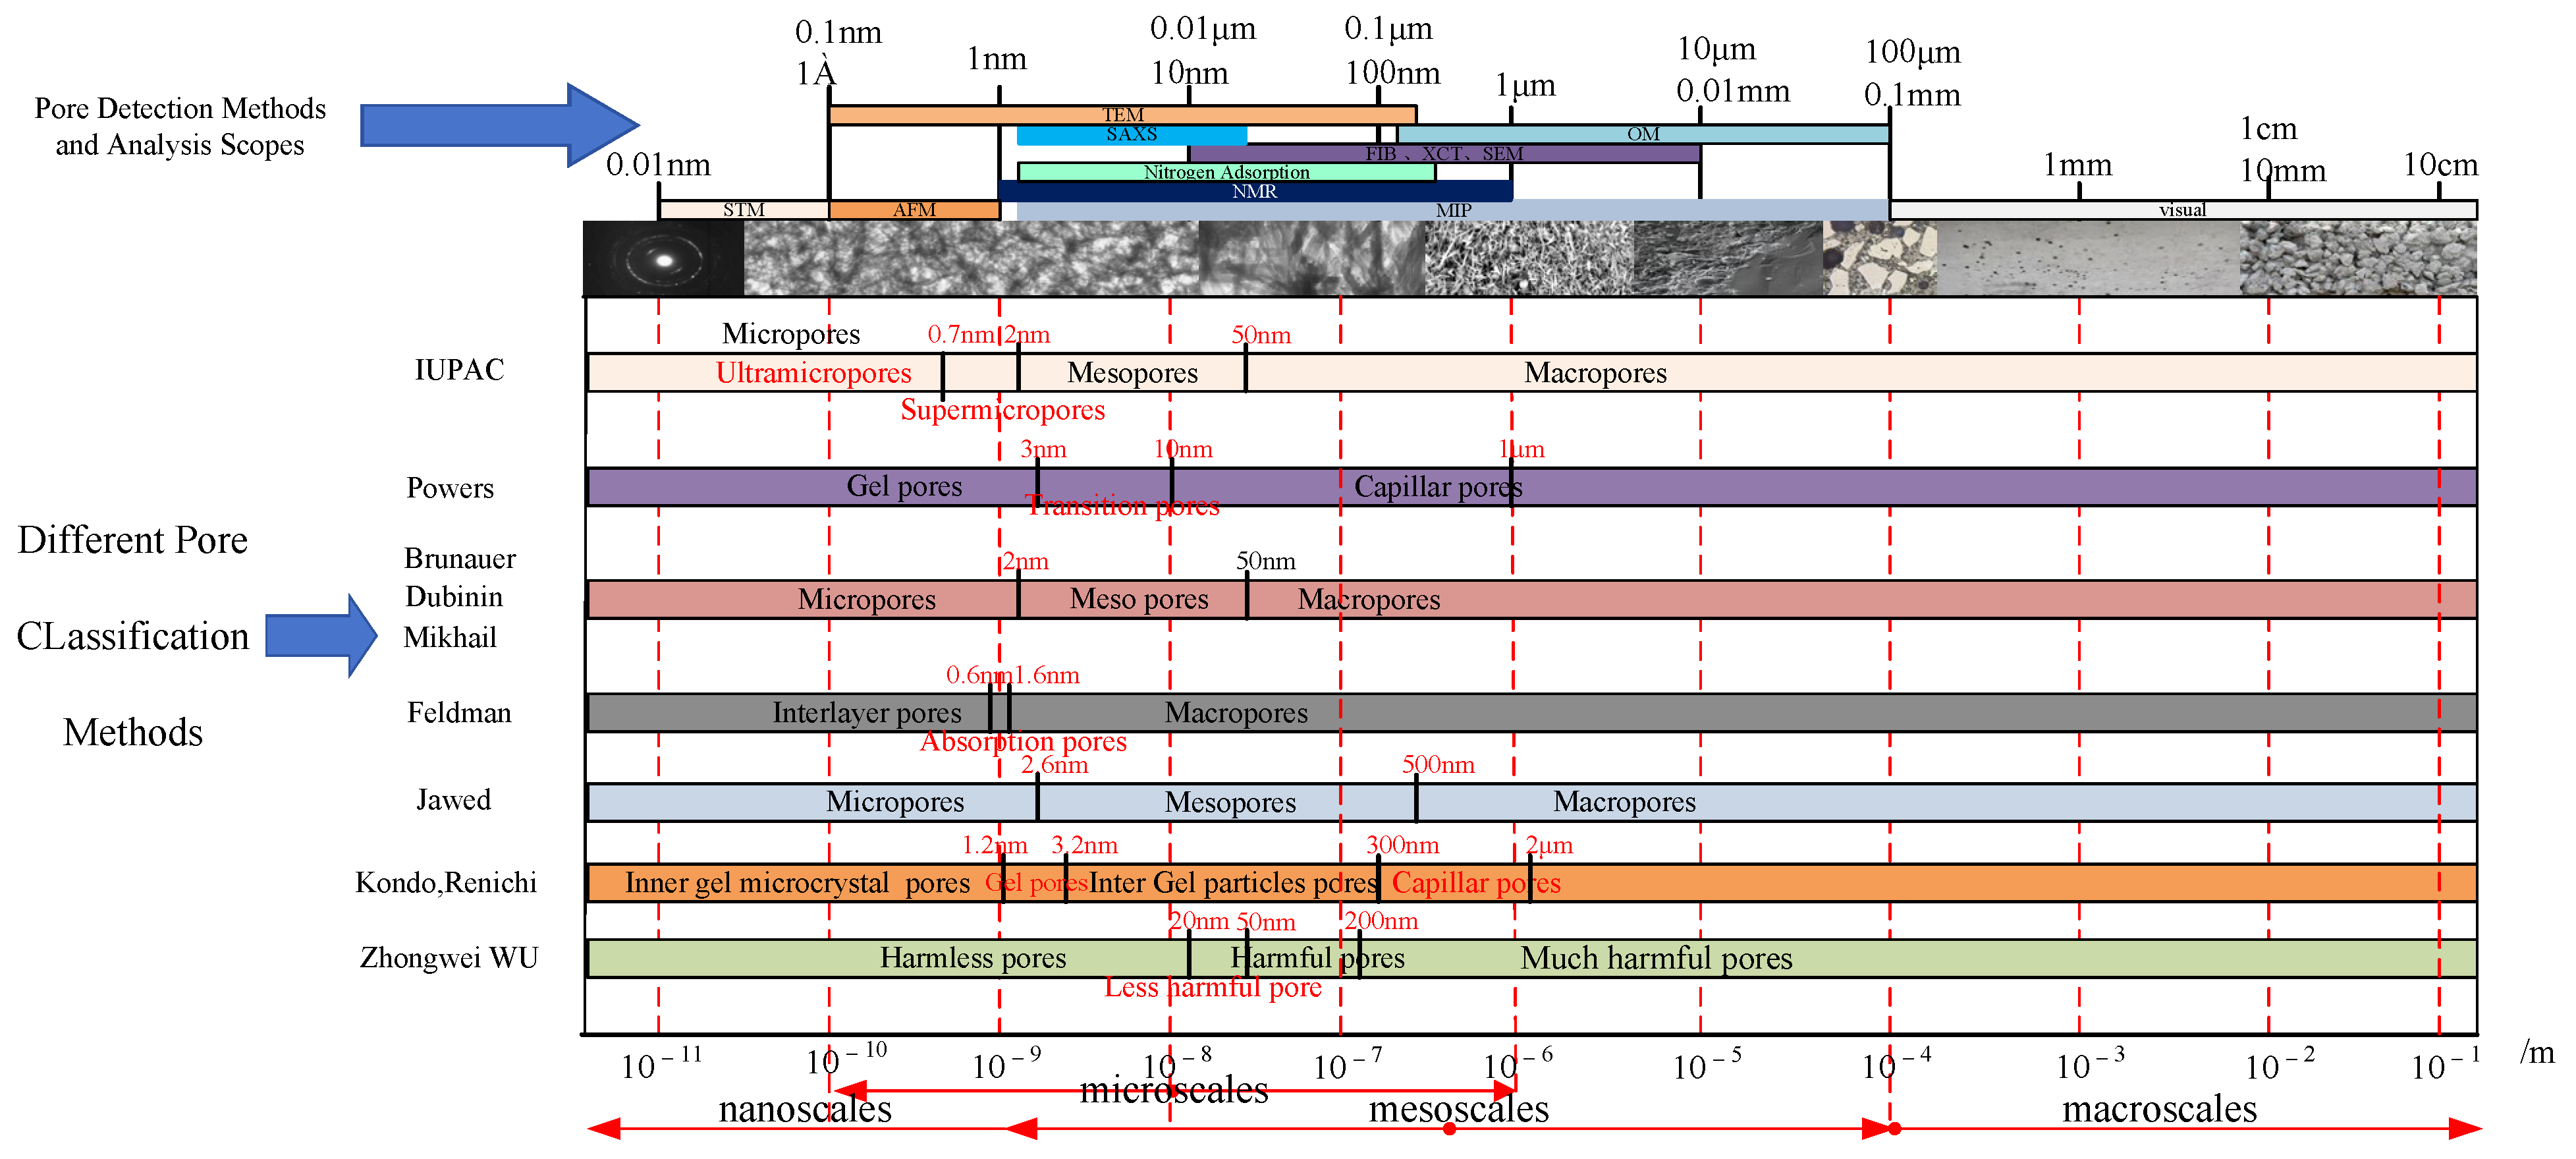
| Pore Types in Concrete Structures | Pore Classification (IUPAC) | Location in Structure | Pore Size Range (nm) | Pore Scales |
|---|---|---|---|---|
| Micro-crystalline Pores | Supermicropores | Inner Gel Microcrystal | <0.6 | Nanoscales |
| Gel Pores | Ultramicropore–Nanopores | Within C-S-H Matrix | 0.6–3.2 | Nanoscales |
| Capillary Pores | Mesopores | Outer Gel–Inner Cement Particle | 3.2–50 | Mesoscales |
| Corse Pores | Macropores | Outer Cement Particle | >50 | Macroscales |
| Literatures | Samples | Porosity (%) | Critical Aperture (nm) | Pore Volume Distribution (mL·g−1) | |||
|---|---|---|---|---|---|---|---|
| <10 nm | 10–100 nm | 100–1000 nm | >1000 nm | ||||
| Kong [94] | Control group | 22.7 | 90 | 0.023 | 0.080 | 0.018 | 0.004 |
| 85.25 kg of SAP per cubic meter of concrete | 28.7 | 86 | 0.031 | 0.115 | 0.005 | 0.018 | |
| 85.25 kg of SAP and 170.5 kg of Water per cubic meter of concrete | 30.8 | 79 | 0.028 | 0.136 | 0.007 | 0.024 | |
| Shen [95] | Control group | 5.0337 | 40.32 | 15.49 | 81.27 | 2.97 | 0.27 |
| Concrete containing 0.18% SAP (by weight) and 0.056 times the standard water content | 9.8190 | 28.64 | 39.81 | 57.50 | 2.54 | 0.15 | |
| Pore Size | Author | SAP Mass Content (%) | SAP Fineness | Year of Publication |
|---|---|---|---|---|
| <2 nm | Fazhou Wang [105] | 0.3, 0.5, 0.7 | SAP: 500 μm | 2009 |
| <10 nm | Klemm [106] | 0.1–1 | / | 2013 |
| <10 nm | Xianwei Ma [36] | 0.3, 0.6, 0.9 | SAPH100: 20–250 μm SAPH30: 250–1400 μm | 2017 |
| <10 nm | Sung-Hoon Kang [104] | 0.3, 0.4 | SAP-AA: 100–700 μm SAP-AM: 100–700 μm | 2018 |
| <10 nm | Yanwei Tong [107] | 0.3 | SAP-A: 30–50 mesh SAP-B: 50–70 mesh; SAP-C:100 mesh | 2019 |
| 1.5–2 nm | Snoeck [108] | 0.22, 0.45 | SAPA: 79–121 μm SAPB: 424–530 μm | 2019 |
| <10 nm | Yan Lu [109] | 0.1, 0.2, 0.3 | SAP: 200 mesh | 2022 |
| Sample Code | Pore Size (nm) | SAP Mass Content (%) |
|---|---|---|
| H1 | 0.37 | 0.1 |
| H2 | 0.74 | 0.2 |
| H3 | 1.12 | 0.3 |
| This Study Tobermorite 4a × 6b × 2c | LI Zongli [63] Jennite Unit Cell | Shahsavari [113] | Hajilar [111] Jennite | |||||||
|---|---|---|---|---|---|---|---|---|---|---|
| Jennite Tobermorite Unit Cell | ||||||||||
| 1a × 1b × 1c | 2a × 2b × 2c | |||||||||
| Pores (nm) | 0.37 | 0.74 | 1.12 | 1.0 | 1.5 | 2.0 | No | No | ||
| K (GPa) | 9.21 | 10.61 | 7.34 | 50.5 | 52.5 | 48.0 | 31.83 | 58.00 | 64.8 | 65.0 |
| G (GPa) | 4.87 | 5.31 | 3.77 | 25.0 | 23.5 | 22.0 | 21.96 | 32.56 | 34.6 | 34.1 |
| E (GPa) | 12.44 | 13.66 | 9.66 | 62.5 | 61.0 | 60.0 | 53.55 | 82.29 | 88.2 | 87.1 |
Disclaimer/Publisher’s Note: The statements, opinions and data contained in all publications are solely those of the individual author(s) and contributor(s) and not of MDPI and/or the editor(s). MDPI and/or the editor(s) disclaim responsibility for any injury to people or property resulting from any ideas, methods, instructions or products referred to in the content. |
© 2025 by the authors. Licensee MDPI, Basel, Switzerland. This article is an open access article distributed under the terms and conditions of the Creative Commons Attribution (CC BY) license (https://creativecommons.org/licenses/by/4.0/).
Share and Cite
Zhou, S.; Cai, J.; Lai, K.; Li, G.; Liu, S.; Wang, J.; Sun, X. Molecular Dynamics Study of a Superabsorbent Polymer (SAP)-Modified Calcium Silicate Hydrate (C-S-H) Gel’s Mechanical Properties. Buildings 2025, 15, 1752. https://doi.org/10.3390/buildings15101752
Zhou S, Cai J, Lai K, Li G, Liu S, Wang J, Sun X. Molecular Dynamics Study of a Superabsorbent Polymer (SAP)-Modified Calcium Silicate Hydrate (C-S-H) Gel’s Mechanical Properties. Buildings. 2025; 15(10):1752. https://doi.org/10.3390/buildings15101752
Chicago/Turabian StyleZhou, Shengbo, Jinlin Cai, Ke Lai, Gengfei Li, Shengjie Liu, Jian Wang, and Xiaohu Sun. 2025. "Molecular Dynamics Study of a Superabsorbent Polymer (SAP)-Modified Calcium Silicate Hydrate (C-S-H) Gel’s Mechanical Properties" Buildings 15, no. 10: 1752. https://doi.org/10.3390/buildings15101752
APA StyleZhou, S., Cai, J., Lai, K., Li, G., Liu, S., Wang, J., & Sun, X. (2025). Molecular Dynamics Study of a Superabsorbent Polymer (SAP)-Modified Calcium Silicate Hydrate (C-S-H) Gel’s Mechanical Properties. Buildings, 15(10), 1752. https://doi.org/10.3390/buildings15101752