Article

Application and Validation of AIRNET in Simulating Building Drainage Systems for Tall Buildings

School of Energy, Geoscience, Infrastructure, and Society (EGIS), Heriot-Watt University, Edinburgh EH14 4AS, UK
*
Author to whom correspondence should be addressed.
Buildings 2025, 15(10), 1725; https://doi.org/10.3390/buildings15101725
Submission received: 4 April 2025 / Revised: 2 May 2025 / Accepted: 7 May 2025 / Published: 20 May 2025
(This article belongs to the Section Building Structures)

Abstract

The building drainage system (BDS) is a critical building component and must be designed to protect public health by maintaining safe and hygienic conditions within the indoor environment. The recent COVID-19 pandemic and the emergence of other wastewater-related issues, such as the spread of anti-microbial resistance (AMR), place the BDS at the centre of the public health agenda. To understand the complex characteristics of the BDS and its performance, the numerical simulation model AIRNET was used to model whole system responses to discharging events. In this study, the model’s effectiveness and accuracy were evaluated through its application in a case study system representative of a real-world tall building. Data reflecting actual conditions were collected using the drainage test rig at the National Lift Tower (NLT) in Northampton. The data show a strong correlation between the measured and modelled air pressures in the system over time and along the drainage stack height. More importantly, a sample dataset representing various ventilation configurations, flow rates, and water usage combinations shows a strong linear relationship between the simulated and measured pressure values. These results confirm the accuracy and reliability of the AIRNET model in modelling the BDS, even when applied to high-rise buildings. This is crucial for addressing drainage challenges in high-rise building design.

1. Introduction

The primary purpose of any BDS is to ensure the safe and efficient disposal of human waste from buildings. The system must be designed to prevent foul gases and wastewater backup from entering the indoor environment. Achieving this requires careful consideration of all possible pressure transients within the system and their effects on the water depth in trap seals. Maintaining sufficient water in trap seals is essential, as it acts as the primary barrier against the cross-contamination of viruses and pathogens that exist within the BDS. Consequently, inadequate BDS design does not only result in system failure, but also poses a significant threat to public health [1,2,3,4,5,6,7,8].
The standardisation of plumbing regulations can be traced back to the 1940s, when Dr Roy B. Hunter in the USA conducted studies on water and drainage system design. Hunter applied probability principles and introduced the concept of “fixture units” to estimate loads and design plumbing systems [9]. Since the introduction of this approach, many factors have changed, including water consumption and building sizes; however, the design approach has seen no significant updates [10]. Evidence indicates that these codes have limitations and are often unsuitable for high-rise buildings due to the increased complexity of systems. In addition, most design codes provide recommendations for low- to medium-height buildings and prioritise flow rate as the primary factor for designing BDSs, often overlooking other critical factors. These limitations highlight the need for advanced simulation tools like AIRNET, which can predict critical parameters such as air pressure and trap seal depletion, especially in the complex conditions of high-rise buildings.
Understanding the critical factors that impact BDSs in high-rise buildings is challenging and requires advanced approaches such as numerical modelling tools. AIRNET is an innovative numerical model developed at Heriot-Watt University for simulating BDS operation. This numerical model is capable of simulating BDS operation with a high degree of detail and accuracy, offering comprehensive and precise information about the system’s characteristics. Despite its long-term successful application, there have been no data from real-world buildings or laboratory experiments to prove its accuracy and applicability to high-rise buildings. This paper applies data from a case study system representative of a real-world tall building to scientifically examine AIRNET’s strengths and limitations, with the specific aim of validating its ability to simulate drainage system behaviour under varied conditions, while also highlighting its potential application for assessing risks and modelling high-rise BDS operation.

2. Numerical Modelling of Air Flow and Air Pressures in BDSs—AIRNET Model

The mechanisms describing air pressure transient propagation in BDSs have been described comprehensively elsewhere. Numerical methods designed for full bore fluid flow are employed to simulate air pressure wave propagation within a confined conduit [11]. Whole system modelling remains a challenge as systems can be very complex and subject to random discharging surge flows from appliances across the whole height of the system. One of the main advantages of the AIRNET model is that it has the capability to model the whole system in a short calculation time. Other modelling techniques, CFD, for example, can give very detailed results for small parts of the system (junctions and termination boundaries, for example); however, whole-system modelling is computationally challenging. The power of AIRNET lies not only on its fundamental application of equations of momentum and continuity, but in its constantly evolving library of boundary equations. This continuous development has allowed for the modelling of innovations in practice, advances in materials, and the effects of other factors such as climate change and water conservation strategies.
The programme models low-amplitude (typically less than 100 mm water gauge) air pressure transients using the fundamental St. Venant equations of momentum and continuity, which are solved numerically via the method of characteristics. This method provides air pressure and velocity within a solid bounded duct system subjected to air pressure transients. Figure 1 illustrates the fundamental principles of airflow and air pressure within a building drainage system. When water enters the stack from a branch in an annular flow, it draws airflow into the network, generating suction pressure in the vertical stack. Pressure drops occur at the stack’s upper termination due to separation losses as airflow exits the top. Frictional losses in the dry stack lead to additional pressure drops, which can be calculated using D’Arcy’s equation. Further pressure drops happen as the entrained airflow moves through the unsteady water curtain at the discharging branch. Figure 1 also depicts positive pressure at the stack’s base as airflow is pushed through the water curtain formed at the bend at the base of the stack.
These pressure losses in the stack can be combined as follows:
P t o t a l = P e n t r y + P d r y   p i p e   f r i c t i o n + P b r a n c h   j u n c t i o n + P b a c k   p r e s s u r e
The ‘motive force’ that entrains this airflow and compensates for these pressure losses comes from the shear force between the annular terminal velocity water layer and the air in the wet portion of the stack. This can be seen as a ‘negative’ friction factor, generating an equal pressure rise, similar to a fan drawing air through the stack. Ongoing research has identified the form and relationships governing this shear force, allowing for the prediction of the transient response of the stack network to variations in applied water downflows.

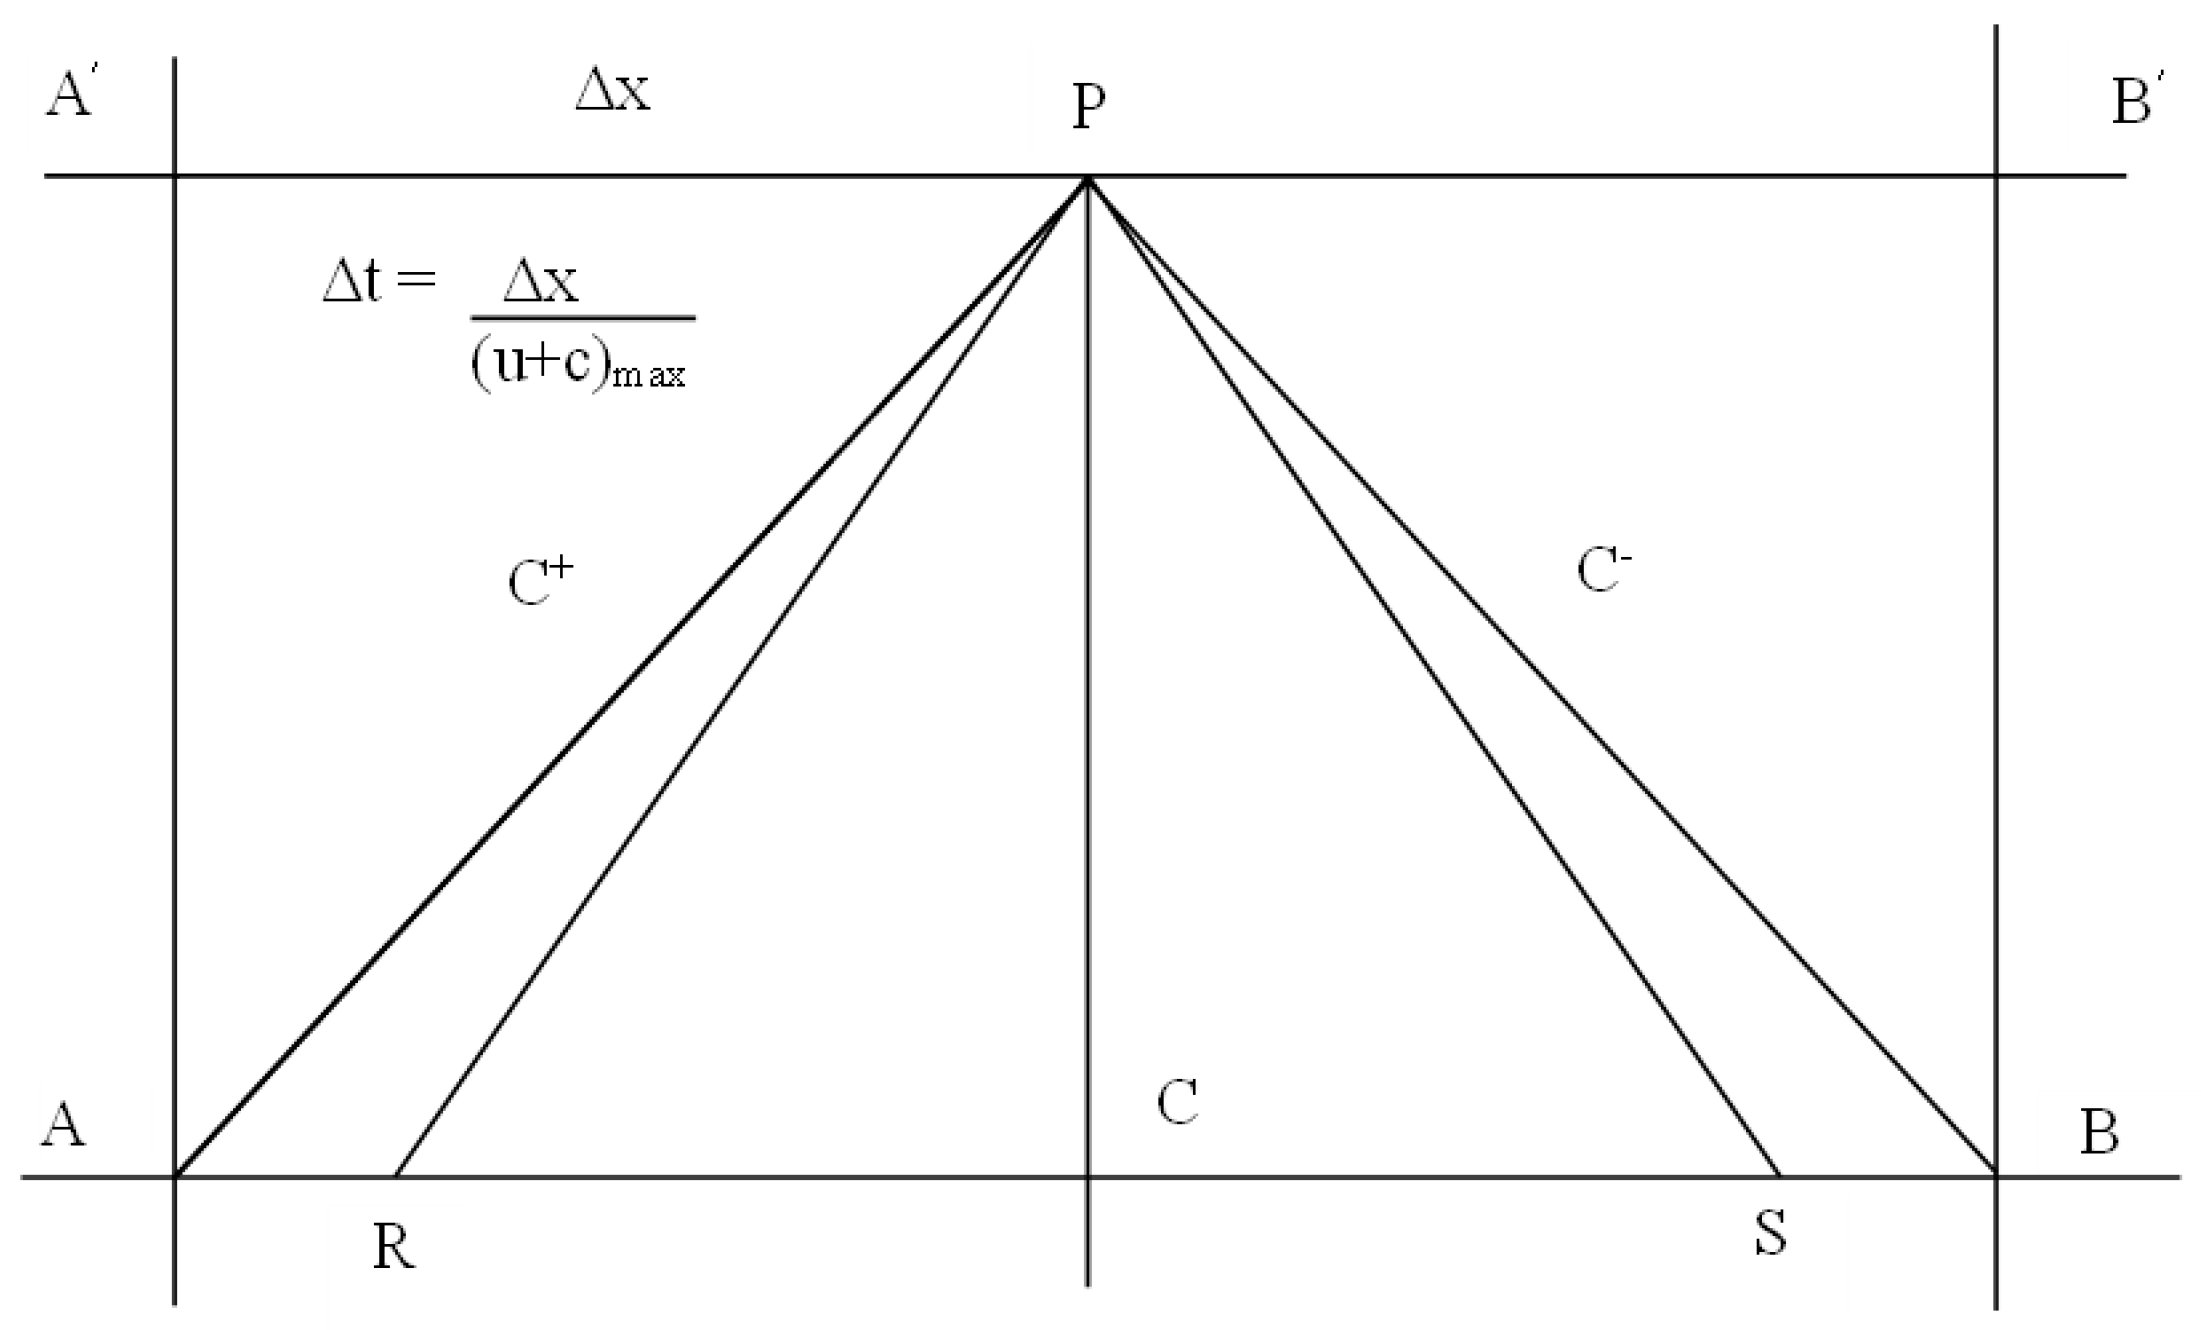
2.1. Mathematical Modelling of Air Pressure Transients

The method of characteristics offers a flexible mathematical model that effectively represents pressure transients in complex pipe and duct networks. It has become the standard solution technique for their analysis in the field.
Calculations progress through the system on a two-dimensional grid representing time (t) and distance (x). The conditions at one point in the grid are based on the conditions at adjacent nodes upstream and downstream, one time step in the past, requiring a definition of the characteristic slope for calculation. In Figure 2, R and S represent points where conditions are known by interpolation between A and C, and B. The characteristic lines between R and P, and S and P, represent equations used to calculate the condition at point P. The characteristic slopes allow information regarding air velocity and wave speed, and hence pressure, to propagate throughout the network.
The characteristic slopes, PR and PS, are given by 1/(u + c). If the fluid velocity is much less than the wave speed (u << c), the variation in the slope of the characteristic line may be assumed negligible, making AR and BS two points, removing the need to interpolate conditions at R and S.
The basic equations of transient propagation, the St. Venant equations of momentum and continuity, are quasi-linear hyperbolic partial differential equations. These can be transformed into a pair of total derivative equations via the method of characteristics, which can be solved using a finite difference scheme.
The transformation of the St. Venant equations of continuity and momentum into the total derivatives required by the method of characteristics has been shown to be as follows:
For C+—Line PR
u P u R + 2 γ 1 c P c R + 4 f R   u R   |   u R   | Δ t 2 D = 0
when
d x d t = u + c
and
For C−—Line PS
u P u S 2 γ 1 c P c S + 4 f S   u S     u S   Δ t 2 D = 0
when
d x d t = u c
In the case of a building drainage system, fS and fR are functions of time, location, and annular water downflow and hence act as drivers in the simulation by generating the entrained air flow within the wet stack, or as determinants of the frictional losses in the dry stack. The expression
d x d t = u ± c
is known as the Courant Criterion, and must be adhered to ensure stability.
These equations may be reduced such that the resultant expressions are based around two simultaneous first-order equations linking wave speed and flow velocity by letting
u p = K 1 + K 2   c p
for the C+ characteristic, and
u p = K 3 + K 4   c p
for the C− characteristic, where
K 1 = u R + 2 γ 1 c R 4 f R u R | u R | Δ t 2 D
K 2 = K 4 = 2 γ 1
K 3 = u S 2 γ 1 c S 4 f u s u Δ t 2 D
The pressure can then be calculated from the Gas Laws using the following expression:
P p = P o ρ o γ   γ c 2 γ 1 1 γ
The time steps between calculations are critical and depend upon the Courant Criterion. When used in this way
t   x u + c m a x = u ± c
For the analysis of low-amplitude air pressure transients in building drainage networks, a typical time step would be less than
t   x u + c m a x     1.0 320 + 20 = 0.003   s
when Dx, the distance between calculation nodes, is 1 m.
Although the time step will vary with wave speed, in this example the variations will be minimal, dependent only on variations in air pressure—itself minimal.

2.2. Boundary Conditions

The technique outlined above necessitates knowing the initial conditions to commence calculations. Figure 2 illustrates that while the pressure at point P can be derived from the characteristic equations C+ and C− using information from points A and B, issues arise at the pipe boundaries, labelled AA’ and BB’. At these boundaries, only one characteristic is present: a C+ at B’ and a C− at A’. To solve these nodes and advance the calculation, boundary conditions that can be resolved with a single C+ and C− characteristic are essential. Since there are always two unknowns (fluid velocity and wave speed) and only one characteristic equation at a boundary during a time step, an additional equation is needed to simultaneously solve for the variables. The boundary condition expressions must accurately reflect the physical constraints on the flow at that specific location. Boundary conditions are required at the initial time step to start the calculation and for the network to continue progressing.
Appropriate boundary conditions will be introduced. Examples include a concentrated loss at a branch/stack junction, a constant pressure at an open upper stack termination, or the pressure loss due to air inflow through an AAV. Similarly, the mass of water within an appliance trap provides a boundary condition, via the relevant equation of motion, that represents trap depletion.
The following sections will validate the AIRNET programme across various configurations suitable for a BDS.

3. Physical Model

Given the difficulties in obtaining observed data on BDSs from real-world buildings, considerable efforts have been made to establish a physical test rig that replicates BDS conditions in high-rise buildings. For this purpose, a testing facility is located at the National Lift Tower (NLT) in Northampton, UK. Originally constructed as a lift testing site, the tower has since been repurposed for building drainage system experiments. Its distinctive vertical height of 127 m, approximately equivalent to a 40-story building, provides an ideal environment for studying the complexities of BDS operation in high-rise buildings. The tower, now recognised as the world’s tallest building drainage test facility, is owned and operated by Aliaxis. It is equipped with a fully functional BDS test rig, providing advanced capabilities for research and development. It is designed to be adaptable and capable of testing a variety of drainage system configurations, including the single-stack system, the modified one-pipe system with different diameter ventilation pipes, and fully active systems that incorporate Air Admittance Valves (AAVs) and Positive Pressure Relief Devices (PPRDs) [12,13,14,15].
As shown in Figure 3, the test facility contains two primary drainage systems: (i) a passive system, including a 100 mm main stack pipe, with connections to three different diameter ventilation pipes (50 mm, 75 mm, and 100 mm) on each level controlled by gate valves, as shown in Figure 3a; and (ii) an active system, consisting of a 100 mm diameter stack connected to PPRDs and AAVs, as shown in Figure 3b. Both systems can be used as a single-stack system when all gate valves are closed.
Both systems are connected to ten discharge branches at various levels along the tower. These branches are equipped with water trap seals representing different appliances, including toilets, as shown in Figure 4. The toilets are controlled by a smart automatic system, allowing them to flush as required. Depending on the test, the toilets can be flushed individually, simultaneously, or in various combinations. The WC cisterns can be filled quickly through a storage tank located at the top of the tower. Water used from the appliances is collected in a lower storage tank and then pumped back up to the top tank for reuse. Water can be pumped to any level to simulate a steady flow within the system. The flow rate is adjustable using a valve and can be precisely monitored with a flowmeter. Furthermore, the system is equipped with highly sensitive pressure sensors to measure pressure along the main stack. Six pressure sensors were installed at critical locations, such as near the stack base and at key discharge points. Given that the system is relatively tall, it was impractical to install sensors at every junction. Therefore, the sensors were strategically positioned at locations where major pressure changes were expected, ensuring that all significant pressure behaviours throughout the system were accurately captured. Clear pipes and bends are also installed at key locations, such as at the base of the stack, to allow for real-time flow observation.
All tests were carried out indoors under stable environmental conditions, with no significant fluctuations in ambient temperature or pressure during the testing period. Each test was repeated at least three times to confirm repeatability and ensure the reliability of the recorded data.

4. Analysis and Comparison of Measured and Modelled BDS Operation

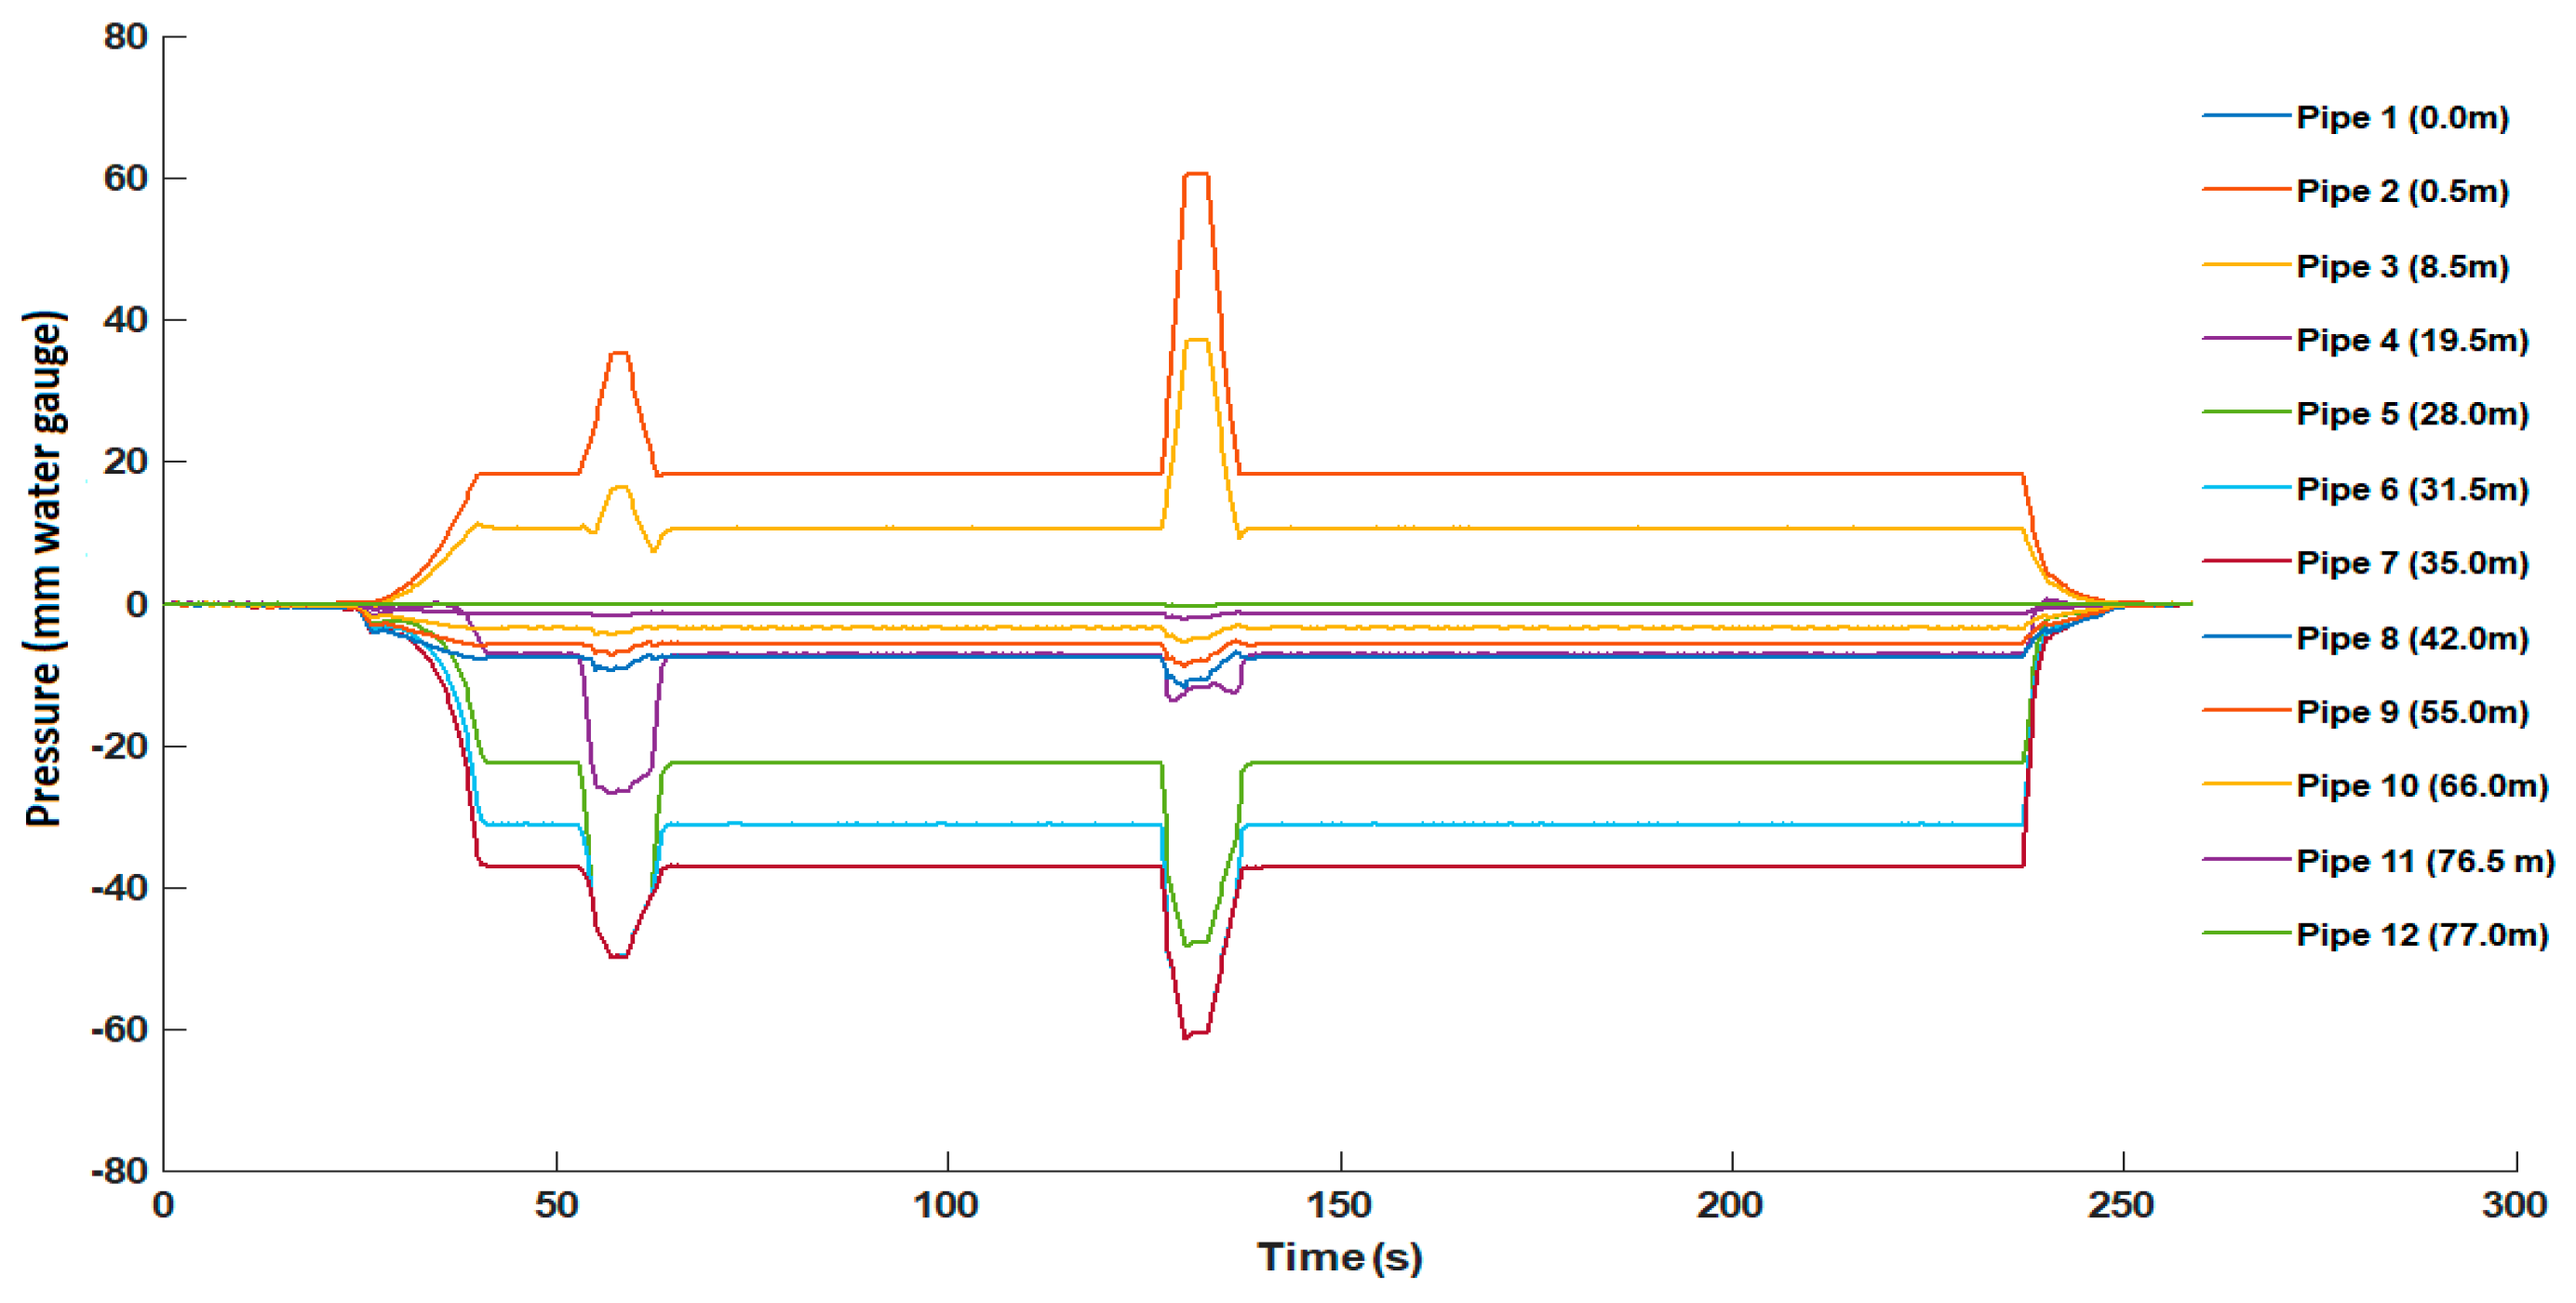
4.1. Pressure Response to Flow Rate over Time

The different configurations of the BDS test rig at the NLT were modelled using AIRNET. Although this study primarily focuses on the pressure profile along the height of the tower, this section provides details on pressure fluctuation over time in the systems. To investigate the drainage system response to different flow rates and monitor pressure profile over time, the system was tested and simulated under steady and unsteady flow conditions. A continuous water flow rate of 1.8 litres per second (L/s) was maintained at Floor 9 as a steady flow, while a couple of toilet flushes were introduced to create unsteady flow in the system, as shown in Figure 5. A single toilet flush occurred around 50 s, followed by double flushes at 130 s. These flushing events cause temporary spikes in the water flow rate, after which the system returns to the steady flow of 1.8 L/s. This combination of steady flow and unsteady flow caused by toilet flushing simulates realistic usage scenarios to determine how the pressure responds to these fluctuations and how effectively AIRNET captures these changes.
The test rig was divided into different sections based on junction locations, enabling AIRNET to simulate the air pressure profile across all the pipes within the test rig. Figure 6 presents the air pressure data from the single-stack system simulation as an example. The air pressure data demonstrate a clear response to the applied water flow profile, starting from zero pressure when there is no water flow, increasing to constant air pressure during steady water flow, and experiencing air pressure spikes during the toilet flushing. AIRNET not only accurately simulated air pressure spikes caused by the toilet flush events at the specified flush times, but it also captured the pressure differences between single and double toilet flush events. The double flush produced an air pressure wave nearly twice as high as that of the single flush, accurately reflecting the expected system response under these conditions. As the water flow reduced and eventually ceased within the system, the pressure gradually returned to its baseline level, ultimately stabilising at zero.
For the same scenario, actual pressure readings were recorded using pressure sensors strategically placed along the stack. Six sensors were installed at the key points where significant pressure changes typically occur, providing essential data without the need for sensors at every junction. This arrangement ensured that the collected pressure data accurately reflected critical variations within the system. Figure 7 illustrates the measured pressure profile obtained from six sensors along the test rig stack. The air pressure data reveal distinct fluctuations, corresponding to the water flow rate variations introduced by steady flow and toilet flush events. The air pressure levels start near zero, when there is no flow, a rise in response to the steady flow rate, and when significant peaks and dips show during flushing events, reflecting the system’s response to these dynamic conditions.
When comparing the measured air pressure profile in Figure 7 to the simulated air pressure profile in Figure 6, it is evident that both datasets show similar patterns and fluctuations of pressure in the system. In both figures, the air pressure starts at zero when there is no water flow, increasing to a stable level under steady flow, and presents air pressure spikes during toilet flushes. The pressure responses to toilet flush events are well-aligned, displaying consistent spikes and dips across both the simulation and experimental data. Notably, the pressure peaks closely correspond with the drops, with both reaching similar maximum positive and negative values. The alignment of patterns, fluctuations, and peak pressure values between the measured and modelled data demonstrates the accuracy of the AIRNET numerical simulation model in capturing the BDS behaviour across the full observation period.

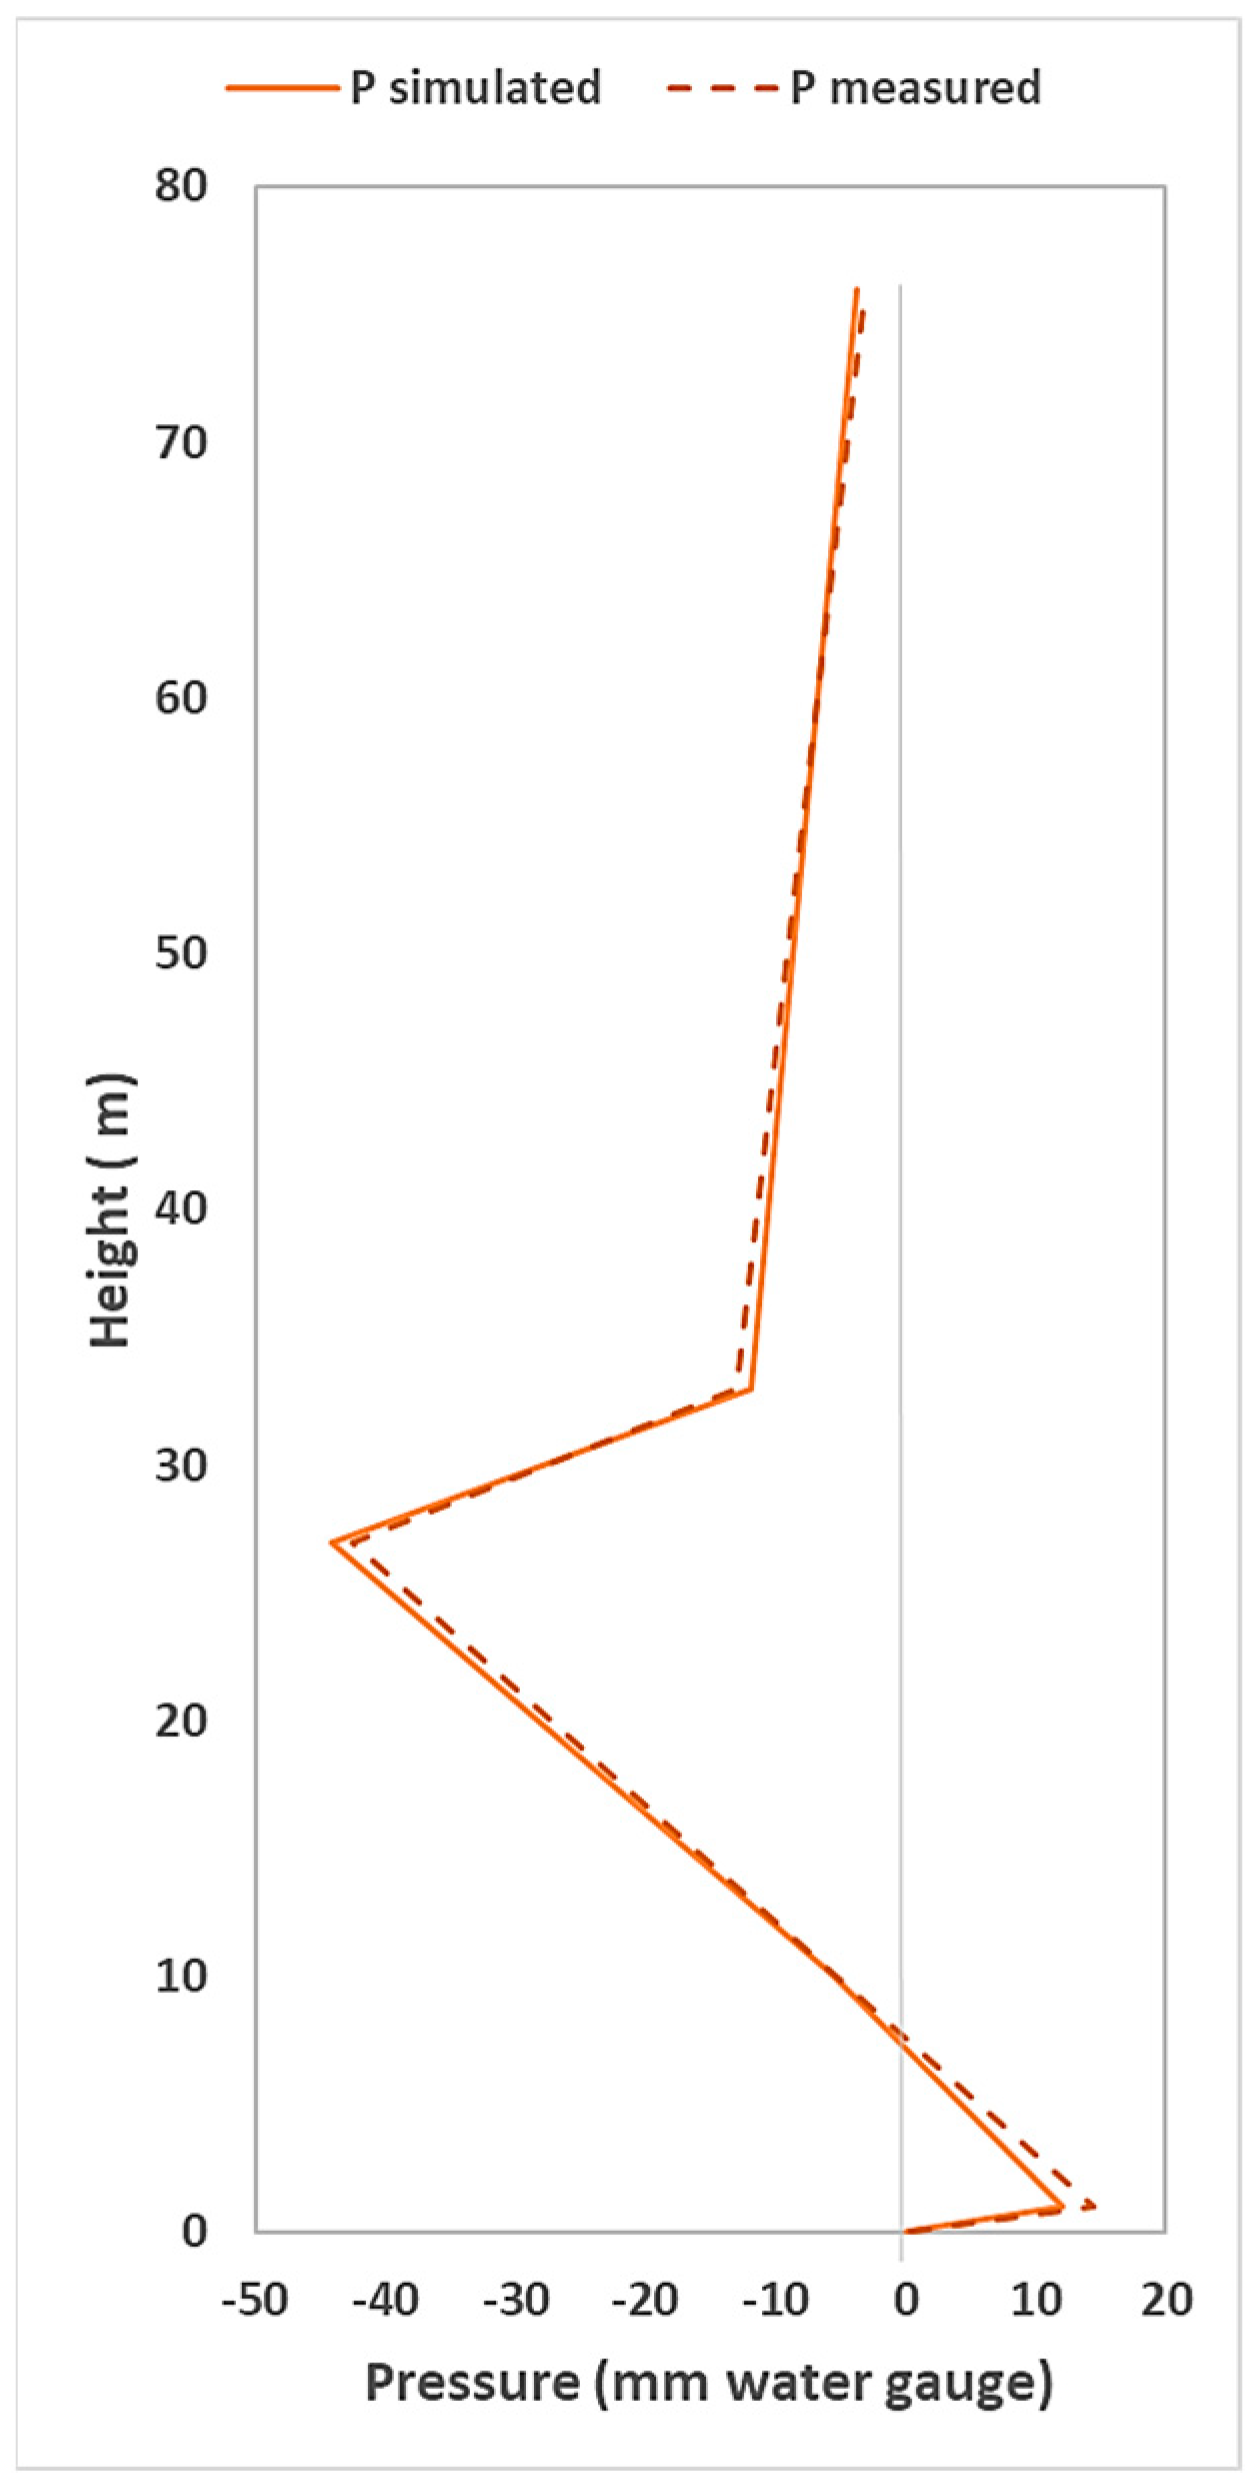
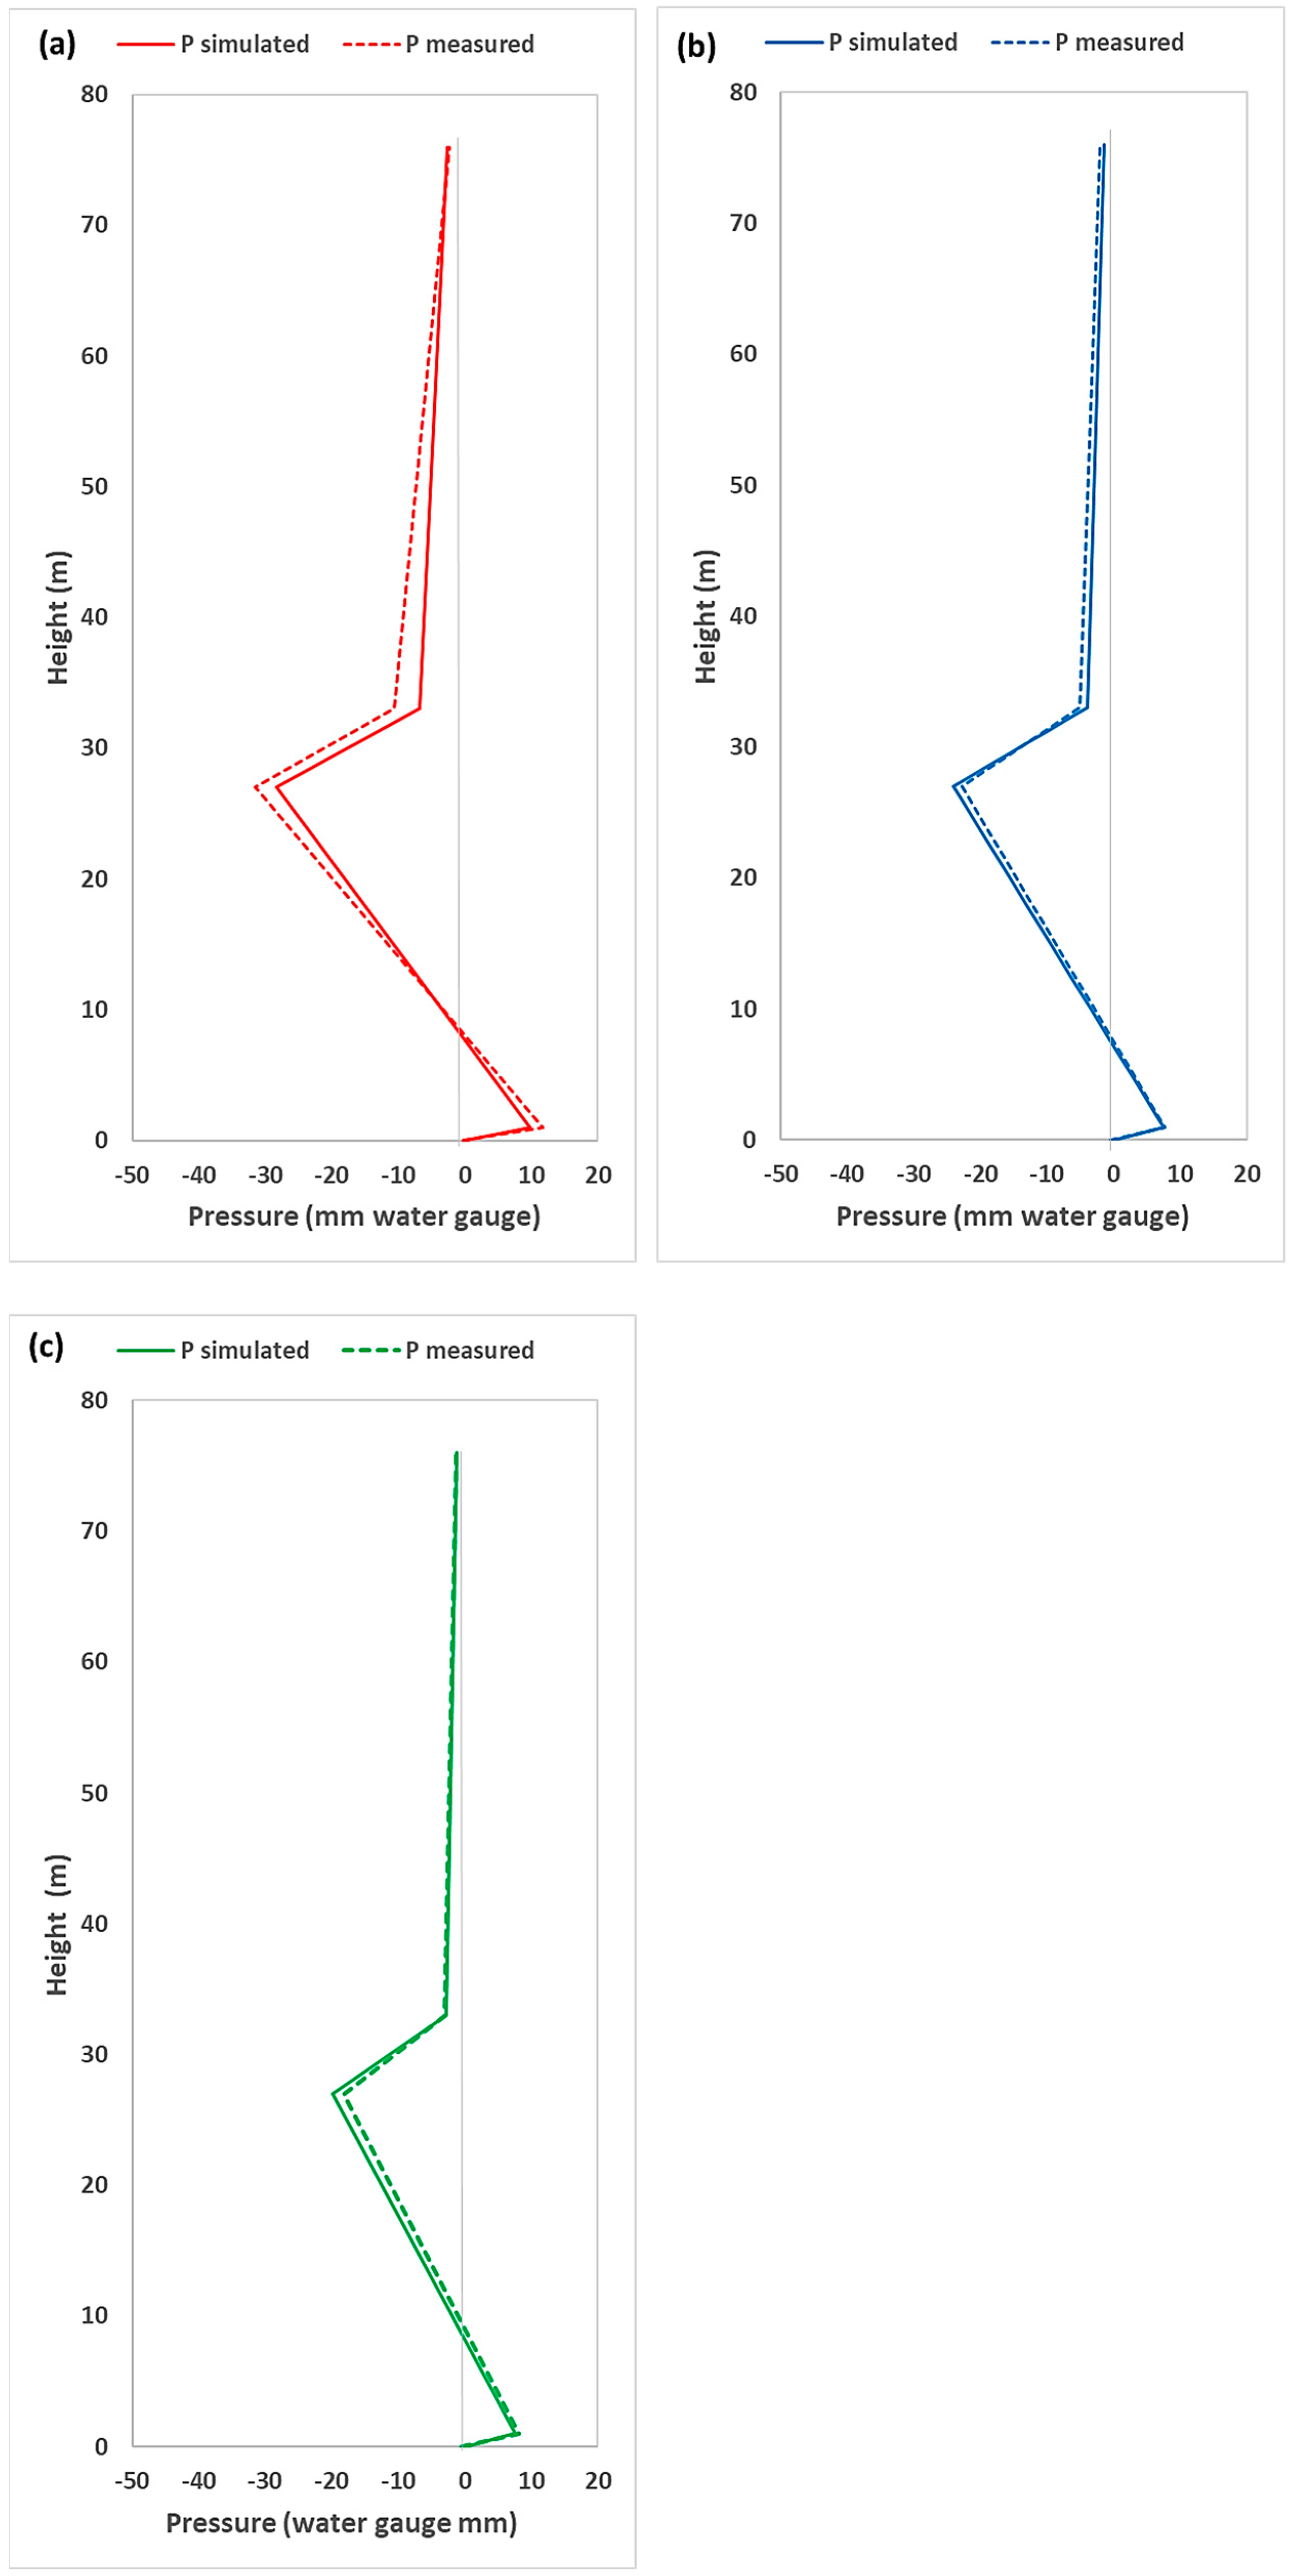
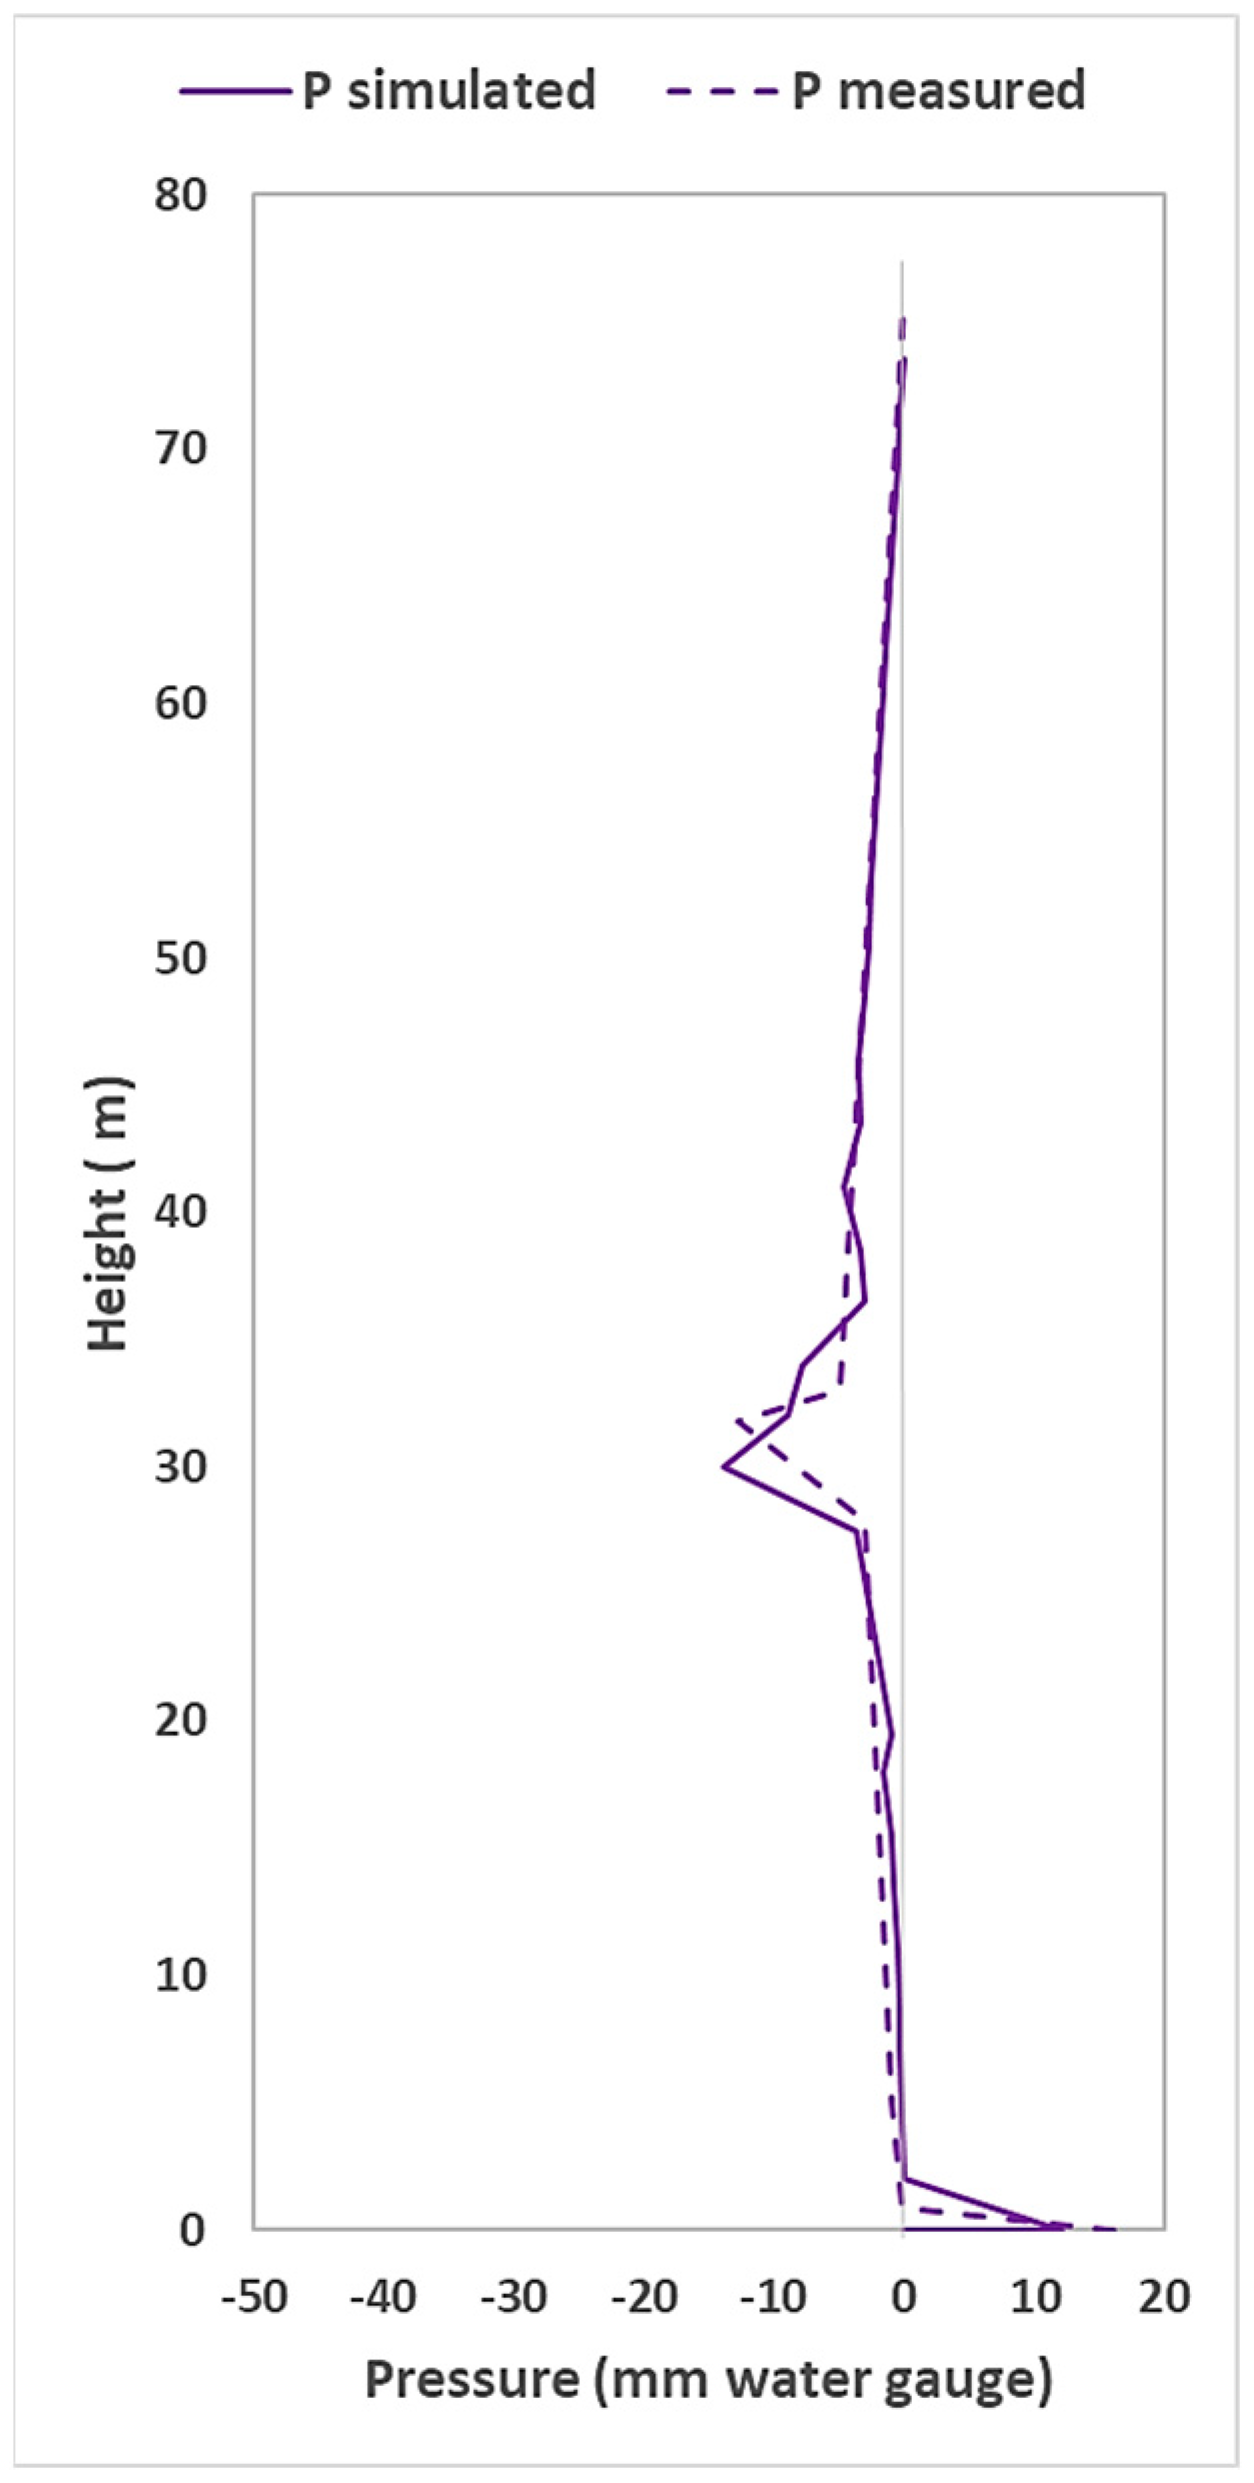
4.2. Pressure Profiles Across the Stack Height

In the previous section, a detailed comparison between the measured and modelled air pressure data was conducted, demonstrating strong agreement and alignment throughout the entire operational duration. Following this confirmation of AIRNET’s capability in simulating air pressure over time, the data were analysed to determine the maximum positive and negative pressures across the BDS test rig height. The pressure at 90 s, within the range of 60 to 120 s, was considered representative of steady flow conditions at 1.8 L/s discharged from Floor 9. The drainage systems were tested and simulated for different configurations as follows.

4.2.1. Single-Stack System (Primary Ventilated System)

The test rig was examined as a single-stack system by closing all connected valves to isolate it from the ventilation pipes. Air pressure data were then recorded across the test rig height. AIRNET was used to model the same single-stack system and water flow conditions. Figure 8 shows the measured (dashed line) and modelled (solid line) air pressure profiles for the single-stack system. The results show a strong overall alignment between the measured and modelled data across the test rig height. Both profiles show a gradual reduction in air pressure from the top of the stack downward, attributed to frictional losses within the system. A sudden air pressure drop is observed when water enters the system at Floor 9, resulting in a significant negative pressure, reaching −45 mm water gauge, due to a lack of sufficient air in the system to equalise the pressure. Following this minimum air pressure point, the pressure profile gradually shifts towards positive values, reaching the maximum positive air pressure near the base of the stack.

4.2.2. Modified One-Pipe System (Secondary Ventilated System)

The test rig was converted from a single-stack system to a modified one-pipe system by opening the valves to connect the main stack with one of the ventilation pipes on each floor. The system operation was measured and modelled under the same water flow rate scenario using the three different ventilation pipe diameters in turn: 50 mm, 75 mm, and 100 mm. Testing the system under different ventilation options provided a detailed understanding of the role that system ventilation plays in reducing the risk of high pressures within the system.
Figure 9 shows the air pressure profile for the modified one-pipe system with different ventilation pipe sizes. Overall, there is strong alignment between the measured and modelled air pressure profiles in all three cases. Similar to the single-stack system, AIRNET accurately simulated the pressure regime within the system, with both the measured and modelled air pressure profiles starting with a slight decrease in pressure from the top of the stack due to friction. This trend continues until Floor 9, where flow enters the system and generates negative air pressure. The air pressure then increased, reaching its maximum positive value at the bottom of the stack. In all three cases, the measured and modelled systems exhibit consistent pressure profiles in terms of shape and pattern. Additionally, a decrease in negative air pressure values is observed, dropping from −32 mm to −22 mm and then to −19 mm as the vent pipe size increases from 50 mm to 75 mm, and then to 100 mm, respectively. These results show that larger vent pipe diameters reduce pressure and improve system stability and pressure equalisation. However, real-world applications must also consider practical constraints such as cost, space, and installation challenges.

4.2.3. Fully Active System

One of the key aspects of the NLT is the setup of a separate test rig specifically for a fully active system, as shown in Figure 3b. The main stack is connected to several PPRDs and AAVs along the height of the test rig. Similarly to the other configurations, the operation of the fully active BDS was measured and then modelled in AIRNET. Figure 10 presents the measured (dashed line) and modelled (solid line) air pressure profiles of the fully active system.
The data show that both the measured and modelled air pressure profiles demonstrate a similar pattern, showing good agreement. AIRNET successfully simulated both positive and negative air pressures in terms of magnitude and location. The peak negative and positive pressures closely follow each other, indicating the model’s accuracy. However, slight pressure fluctuations and variation at some levels may be attributed to the complexity of air movement within the active components. The misalignment of air pressure sensors on the test rig with the precise location of air pressure simulation in the AIRNET model is also likely a contributing factor.
More importantly, the air pressure profile demonstrates how the application of the fully active system effectively terminates the air pressure wave immediately after the water entry point at Floor 9. This contrasts with other configurations, where negative air pressures are generated at the water entry point but gradually decrease before shifting to positive pressure near the bottom of the stack. Additionally, the results indicate that the application of the fully active system achieved the lowest negative pressure value of −13 mm, compared to all other configurations. These results demonstrate the effectiveness of the fully active system in equalising air pressure fluctuations by ensuring the termination of pressure waves at the exact location and moment of their generation, preventing further propagation through the system.

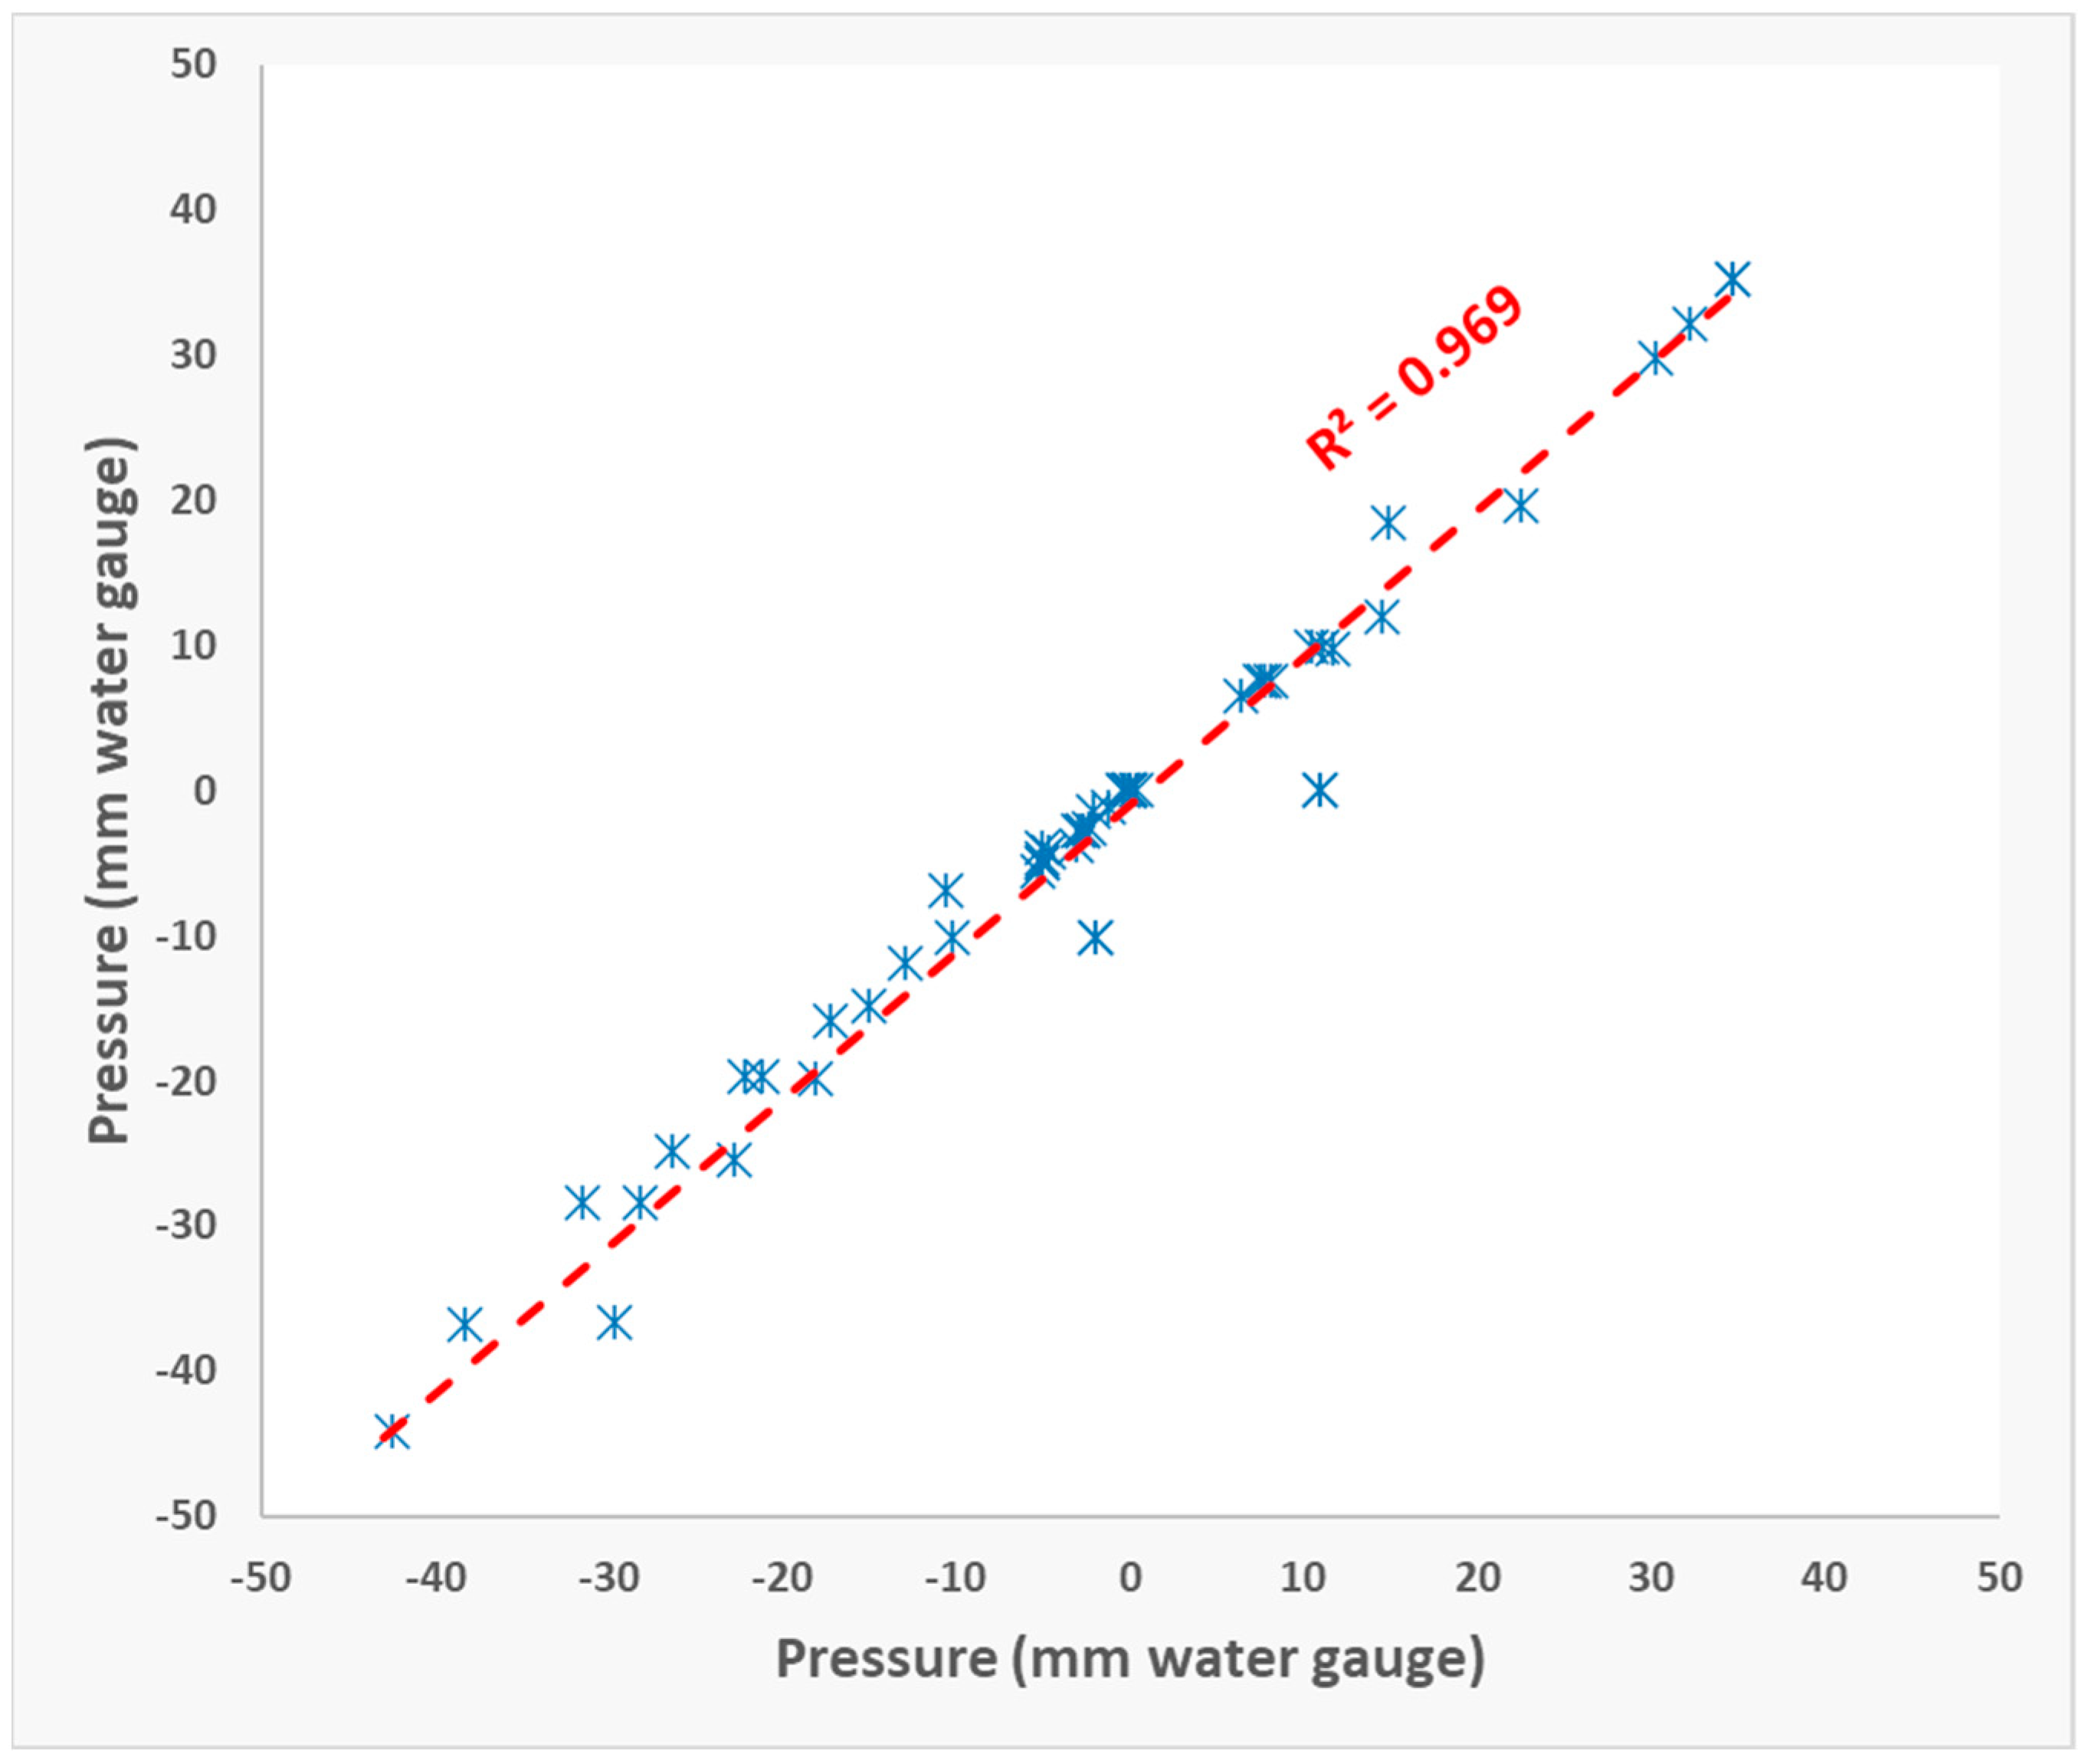
4.3. Validation of AIRNET Across Multiple Scenarios

A representative sample of data acquired over many years of research was selected to validate the accuracy and reliability of AIRNET. For this purpose, a sample dataset was selected, consisting of several pressure data points obtained from both experimental measurements and simulations. The sample data covered a wide range of BDS configurations including the following: (i) a 100 mm single stack; (ii) a 100 mm modified single pipe with ventilation pipes of 50 mm, 75 mm, and 100 mm; and (iii) a fully active system using AAV and PPRD. Air pressure data were recorded under different water flow rate conditions, ranging from 60 to 300 litres per minute. The flow rate included a combination of steady and unsteady flows, distributing across different levels along the drainage stack height. Figure 11 illustrates the comparison between measured and modelled air pressure values in (mm water gauge) from measurements and simulations. The red dashed line represents the line of best fit, demonstrating the correlation between the measured and modelled data. The data show a strong linear relationship, with a coefficient of determination (R2) of 0.96, Mean Absolute Error (MAE) of 1.94 mm water gauge, and Root Mean Square Error (RMSE) of 3.51 mm water gauge, indicating a high degree of consistency between the measured and modelled values. The results validate the overall accuracy of the AIRNET model in simulating air pressures across various BDS configurations and confirm its reliability as a tool in analysing key characteristics of BDS operation, even when applied to high-rise buildings.
The slight difference between some of the measured and modelled values may be attributed to several factors. One potential reason is that the BDS test rig used to gather the measured data is not connected to the public sewer, which can slightly influence the pressure regimes within the stack. Additionally, the limited number of pressure sensors along the BDS test rig may not capture pressure variations at every exact level, as AIRNET does at precisely defined intervals (e.g., every 0.5 m).

5. Conclusions

This study evaluated the application and validation of the AIRNET numerical simulation tool in modelling BDS operation, particularly in high-rise buildings. By comparing measured and modelled air pressure data collected from a case-study system representative of a real-world tall building, this study confirmed the accuracy and reliability of AIRNET in predicting air pressure variations to applied water flow rates within building drainage systems. The results initially showed how AIRNET successfully captured all pressure changes over time caused by water entry into the system. The simulated air pressure closely matched that measured in terms of air pressure values, patterns, and timing. Moreover, a sample of air pressure data representing a wider range of scenarios and conditions demonstrated a strong correlation between the measured and modelled air pressure. The results show a strong linear relationship, confirming the accuracy and reliability of the AIRNET model.
Beyond pressure prediction, AIRNET offers detailed insight into airflow and water trap seal depletion, both of which are critical for system risk assessment. The integration of all these parameters allows for a more comprehensive evaluation of drainage system performance, helping to identify potential risks and improve design strategies. Overall, this study confirms the scientific validation of AIRNET as a valuable tool for assessing and optimising the performance of BDSs, especially in tall buildings, where traditional design codes currently provide little guidance for the designer.
Such tools are crucial for preventing system failures, including trap seal loss, which can lead to cross-contamination and public health risks, as observed during the spread of diseases such as SARS and COVID-19. Future research should focus on expanding AIRNET’s capabilities to serve as a practical design tool for assessing risks in BDS. Further development could also aim to integrate AIRNET into user-friendly design software, enhancing its accessibility for engineers and designers.

Author Contributions

Conceptualization, M.G. and S.M.; methodology, M.G. and S.M.; software, M.G., S.M. and D.A.K.; writing—original draft preparation, M.G. and S.M.; writing—review and editing, M.G., D.A.K. and D.P.C.; review and editing, M.G., D.A.K. and D.P.C.; project administration, M.G., D.A.K. and D.P.C.; funding acquisition, M.G., D.A.K. and D.P.C. All authors have read and agreed to the published version of the manuscript.

Funding

This research was funded by Aliaxis SA.

Data Availability Statement

The data may be obtained on request from the correspondence author.

Acknowledgments

The authors gratefully acknowledge the support provided by Aliaxis Group.

Conflicts of Interest

The authors declare no conflicts of interest. The authors declare that this study received funding from Aliaxis SA. The funder was not involved in the study design, collection, analysis, interpretation of data, the writing of this article or the decision to submit it for publication.

References

  1. Xue, Y.; Stewart, C.; Kelly, D.; Campbell, D.; Gormley, M. Two-Phase Annular Flow in Vertical Pipes: A Critical Review of Current Research Techniques and Progress. Water 2022, 14, 3496. [Google Scholar] [CrossRef]
  2. Gormley, M.; Aspray, T.J.; Kelly, D.A. COVID-19: Mitigating transmission via wastewater plumbing systems. Lancet Glob. Health 2020, 8, e643. [Google Scholar] [CrossRef] [PubMed]
  3. Gormley, M.; Swaffield, J.A.; Sleigh, P.A.; Noakes, C.J. An assessment of, and response to, potential cross-contamination routes due to defective appliance water trap seals in building drainage systems. Build. Serv. Eng. Res. Technol. 2012, 33, 203–222. [Google Scholar] [CrossRef]
  4. Stewart, C.; Gormley, M.; Xue, Y.; Kelly, D.; Campbell, D. Steady-state hydraulic analysis of high-rise building wastewater drainage networks: Modelling basis. Buildings 2021, 11, 344. [Google Scholar] [CrossRef]
  5. Wong, L.T.; Mui, K.W.; Cheng, C.L.; Leung, P.H.M. Time-variant positive air pressure in drainage stacks as a pathogen transmission pathway of COVID-19. Int. J. Environ. Res. Public Health 2021, 18, 6068. [Google Scholar] [CrossRef] [PubMed]
  6. Gormley, M.; Aspray, T.J.; Kelly, D.A. Aerosol and bioaerosol particle size and dynamics from defective sanitary plumbing systems. Indoor Air 2021, 31, 1427–1440. [Google Scholar] [CrossRef] [PubMed]
  7. Kang, M.; Wei, J.; Yuan, J.; Guo, J.; Zhang, Y.; Hang, J.; Qu, Y.; Qian, H.; Zhuang, Y.; Chen, X.; et al. Probable evidence of fecal aerosol transmission of SARS-CoV-2 in a high-rise building. Ann. Intern. Med. 2020, 173, 974–980. [Google Scholar] [CrossRef] [PubMed]
  8. Gormley, M. SARS-CoV-2: The growing case for potential transmission in a building via wastewater plumbing systems. Ann. Intern. Med. 2020, 173, 1020–1021. [Google Scholar] [CrossRef]
  9. Hunter, R.B. Plumbing Manual; National Bureau of Standards: Washington, DC, USA, 1940. [Google Scholar]
  10. Mohammed, S.A. Developing a New Design Approach to Estimate Design Flow Rate in Non-Residential Buildings. Ph.D. Thesis, Heriot-Watt University, School of Energy, Geoscience, Infrastructure and Society, Edinburgh, UK, 2022. [Google Scholar]
  11. Swaffield, J.A. Transient Airflow in Building Drainage Systems; Spon: London, UK, 2010. [Google Scholar]
  12. Swaffield, J.A.; Campbell, D.P.; Gormley, M. Pressure transient control: Part I—Criteria for transient analysis and control. Build. Serv. Eng. Res. Technol. 2005, 26, 99–114. [Google Scholar] [CrossRef]
  13. Swaffield, J.A.; Campbell, D.P.; Gormley, M. Pressure transient control: Part II—Simulation and design of a positive surge protection device for building drainage networks. Build. Serv. Eng. Res. Technol. 2005, 26, 195–212. [Google Scholar] [CrossRef]
  14. Gormley, M. Air pressure transient generation as a result of falling solids in building drainage stacks: Definition, mechanisms and modelling. Build. Serv. Eng. Res. Technol. 2007, 28, 55–70. [Google Scholar] [CrossRef]
  15. Gormley, M.; Kelly, D.A. Pressure transient suppression in drainage systems of tall buildings. Build. Res. Inf. 2018, 47, 421–436. [Google Scholar] [CrossRef]
Figure 1. Entrained airflow analysis for AIRNET model.
Buildings 15 01725 g001
Figure 2. Grid showing characteristic lines as utilised in Method of Characteristics approach to air pressure transient modelling.
Buildings 15 01725 g002
Figure 3. Schematic illustration of the BDS test rig at the NLT: (a) Passive ventilation configuration, and (b) Active ventilation configuration.
Buildings 15 01725 g003
Figure 4. Arrangement of appliances and fittings on Floor 9 (32.9 m from base of stack).
Buildings 15 01725 g004
Figure 5. Flow rate profile illustrating steady and unsteady flow at the base of the test rig.
Buildings 15 01725 g005
Figure 6. Simulated pressure profile over time for all 12 pipes along the test rig.
Buildings 15 01725 g006
Figure 7. Measured pressure profiles over time from six sensors located along the test rig.
Buildings 15 01725 g007
Figure 8. Measured (dashed line) and modelled (solid line) air pressure profile for a single-stack system.
Buildings 15 01725 g008
Figure 9. Measured (dashed lines) and modelled (solid lines) air pressure profiles for a modified one-pipe system: (a) 50 mm vent pipe, (b) 75 mm vent pipe, and (c) 100 mm vent pipe.
Buildings 15 01725 g009
Figure 10. Measured (dashed line) and modelled (solid line) pressure profiles for the fully active system.
Buildings 15 01725 g010
Figure 11. Correlation between simulated and measured pressure data, blue markers represent pressure data points, red dashed line indicates the line of best fit.
Buildings 15 01725 g011
Disclaimer/Publisher’s Note: The statements, opinions and data contained in all publications are solely those of the individual author(s) and contributor(s) and not of MDPI and/or the editor(s). MDPI and/or the editor(s) disclaim responsibility for any injury to people or property resulting from any ideas, methods, instructions or products referred to in the content.

