Article

Energy Dissipation Between Concrete and Composite Waterproof Sheet Interface

1
Department of Smart City Engineering, Seoul National University of Science & Technology, 232 Gongneung-ro, Nowon-gu, Seoul 01811, Republic of Korea
2
School of Architecture, Seoul National University of Science & Technology, 232 Gongneung-ro, Nowon-gu, Seoul 01811, Republic of Korea
*
Author to whom correspondence should be addressed.
Buildings 2025, 15(10), 1724; https://doi.org/10.3390/buildings15101724
Submission received: 10 February 2025 / Revised: 14 March 2025 / Accepted: 31 March 2025 / Published: 19 May 2025

Abstract

Underground structures are subject to deterioration conditions in which water leakage occurs through cracks due to the long-term influence of soil and groundwater. Therefore, composite waterproofing sheets can play an important role in securing the leakage stability of structures by combining them with concrete structures. In this study, a total of eight composite waterproofing sheets were used according to the thickness of the compound and the properties of the material attached to the concrete, and the deformation characteristics at the bonding surface were identified through repeated tensile tests. Types A, B, and C, with a compound thickness of 1.35 to 1.85 mm and a single layer, had strong bonding performance, with a deformation rate of 0.5 to 2 × 10⁻⁴ and a DE/RE ratio of 0.3 to 1.3; tensile deformation progressed while maintaining integrity with the concrete at the bonding surface. Types D and E were viscoelastic and non-hardening compounds with a compound thickness of 1.35 to 3.5 mm, where the strain rate due to tensile deformation was the lowest, at 0.1 × 10⁻⁴ or less, and the DE/RE ratio was −5 to 3; therefore, when internal stress occurs, the high-viscosity compound absorbs it, and the material is judged to have low deformation characteristics. Types F, G, and H, which were 2 to 2.9 mm thick and had two layers using a core material, were found to have characteristics corresponding to tensile deformation, as the strain rate increased continuously from 0.2 to 0.5 × 10⁻⁴, and the DE/RE ratio increased up to 8 mm of tensile deformation.

1. Introduction

Starting with various tunnels, a wide range of underground structures, such as underground drainage, pipelines, underground parking lots, subways, underground tanks, communal areas, public underground commercial facilities, and underground power generation, are being created [1,2,3,4,5,6,7]. Most of these structures are made of reinforced concrete, and it is inevitable that some parts, such as connecting parts, cracks, and expansion joints, which are characteristics of concrete construction, are vulnerable [8,9]. Since these structures are located underground, they are greatly displaced during the contraction and expansion that occurs due to vibration, inequal subsidence, and temperature changes. These changes can be caused by internal and external influences, and special attention must be paid to leakage [10,11,12,13]. In particular, in the case of important national facilities or large underground structures, a technology that can block leakage by applying a waterproof method to the outer wall of the structure is required. The safety of such a waterproof layer must be ensured by reviewing the local conditions of the soil and groundwater in the construction area in advance because soil and ground water conditions, such as chemical components (acid, alkali, sulfate, oil, etc.), water pressure (ground water level), and soil pressure, have a great impact on concrete structures and waterproof layers [14,15].
When subjected to water or earth pressure, underground structures such as subterranean parking lots frequently experience cracks, bulging (bellying), structural flotation, and displacement in their bottom floors and walls, primarily due to buoyancy forces and external loads [4,5,7,14,16]. These structural deformations can damage the waterproofing layer installed on external walls. Therefore, it is crucial to carefully select waterproofing materials and methods, explicitly considering the effects of hydrostatic and soil pressures during the waterproof design stage [7,11]. When water and earth pressure are received at the same time, ground subsidence under the foundation may occur, resulting in structural defects, such as the destruction of the underground retaining wall’s waterproof layer, diagonal cracks in the underground floor, and destroyed columns due to soil pressure [3,5,7]. In addition to water pressure, the outer side of the underground structure is affected by traffic loads, such as contraction and expansion due to temperature changes, uneven settlement, freezing and thawing, and vehicles, and this effect causes movement in the structure’s connections and crack joints [12,13,17]. Changes in the behavior of the structure affect the long-term durability of the finishing material and the waterproof layer.
The underground parking lot of an apartment house consists of an upper slab at the top, a floor slab at the middle floor, and a base slab and an outer wall at the bottom floor. A waterproof design should be made to prevent leakage in each part [18,19,20,21,22]. The top floor upper slab is loaded with weight as a greening and planting space, and a significant load is applied to the upper slab [18,19]. In the case of exterior walls, water pressure and earth pressure act on the exterior wall [20]. In the case of an intermediate floor slab, load is transmitted due to the repeated stopping and movement of vehicles entering the interior [18]. In the case of the bottom floor slab, the load caused by the hydraulic action under the slab affects the floor structure [18]. A waterproof design is required to ensure the leakage safety of reinforced concrete structures in the upper and middle layers, outer walls, and floors of the structure. The representative recycling of waterproof materials and methods include asphalt waterproofing, improved asphalt waterproofing sheets, synthetic polymer waterproofing sheets, self-adhesive waterproofing sheets, spraying membrane waterproofing, and sheet-coated composite waterproofing [18,23,24,25,26,27,28,29,30,31].
The main objective of this study is to conduct experiments and analyze differences in the performances of four types of waterproofing sheets applied to various layers of underground structures, specifically examining their behavior on concrete surfaces. The goal is to enhance waterproofing performance, allowing flexible adaptation according to structural type and behavior. A self-adhesive waterproof sheet method (HDPE film + self-adhesive compound), an improved waterproof sheet method using a high-viscosity compound (PE film + self-adhesive compound with high viscosity), an improved asphalt sheet with a non-hardening seal (PE film + self-adhesive compound with non-hardening characteristic), and a nonwoven waterproof sheet method (PE film + high-adhesion asphalt containing butyl and latex) were used to evaluate the safety of the underground structure. Through repeated tensile tests, the characteristics of each waterproof sheet were presented according to behavior by analyzing the stress–strain curve on the surface of the test body due to stress generation according to the component materials, thickness, and physical performance of the waterproof sheet. The results of the characteristic analysis of each waterproofing sheet can offer valuable data for optimal waterproof design, particularly suited to the external environmental conditions encountered during the construction of underground structures.

2. Experimental Program

2.1. Waterproofing Materials and Properties

The types of recycling composite waterproof sheets used in this study are summarized in Table 1 and Figure 1. Types A, B, and C are self-adhesive-type waterproof sheets in which a self-adhesive compound is combined with an HDPE film [7,18]. A high-density polyethylene (THK 0.15 mm) film is used. It is a chain-shaped polymer material generated by the polymerization of ethylene monomers and is attached to the top of the asphalt via its adhesive properties in the form of a film, enacting strength reinforcement of the sheet waterproofing material and protecting the main waterproof layer (asphalt). Due to its material properties, high-density polyethylene (HDPE) has a very dense tissue, is hard, has no odor and toxicity, features a very large molecular weight compared to polyethylene (PE), and has excellent physical properties such as impact strength, tear strength, and elongation [32,33]. Self-adhesive high-adhesive asphalt (including butyl and latex) is an improved asphalt that adds styrene butadiene rubber (SBR) and styrene butadiene styrene (SBS) to straight asphalt, and has excellent material stability, acid resistance, and crack resistance [34,35]. In particular, the oxidation resistance of carbon black when added to rubber enhances the resistance to oxidation of the binder, increases the resistance to material deformation due to its high viscosity and high elasticity, and has excellent resistance to reflective cracks and heat cracks.
Type D is an adhesion and self-adhesion waterproof sheet method that combines a self-adhesive asphalt compound with an improved asphalt waterproof sheet (KS F 4917) or a self-adhesive waterproof sheet (KS F 4934) into one material. The material composition consists of polyethylene (PE) film and an adhesive compound mounted on the top surface, and it is a waterproof sheet integrated by replacing the high-viscosity seal material (KS F 4935) with a compound in the improved asphalt waterproof sheet [7,18]. In Type E, a seal with unhardened characteristics is combined with the improved asphalt. High-viscosity unhardened seal materials are made by crosslinking asphalt, synthetic polymer resin, functional powder, and underwater adhesives, and are functional rubberized asphalt waterproof materials with self-healing and underwater adhesion properties that maintain the shape of viscoelastic jelly semi-permanently [36]. Since it contains a compound containing a hydrophilic group and a hydrophobic group, such a material can be adhered even in a wet and underwater state. Viscoelastic adhesion is a type of adhesion, and as a mode of “resistance to deformation”, the polymer of adhesion that melts even at room temperature shows the behavior of elastic deformation and viscous flow at the same time, and when external pressure is removed, the surface is sufficiently adhered [36]. Since viscoelastic adhesion does not involve solidification when applied to an object, it can stretch and respond to the structure during concrete movement, so the viscoelastic adhesive material itself is not destroyed by various factors, and it can serve as a supplement. Type E, G, and H are nonwoven reinforced waterproof sheet methods that attach improved asphalt waterproof sheets (KS F 4917) to the background. The material composition consists of a polyethylene (PE) film, an asphalt paving (AP) compound, a central reinforcement (PP, polypropylene), and a compound.

2.2. Test Specimens and Setup

The concrete test piece attached to the waterproof sheet consists of upper and lower parts of 180 mm in diameter and 130 mm in height, and the T-shaped circular rod is fixed to a height of 50 mm from the bottom inside the waterproof test piece, after which concrete is placed. The T-shaped circular rod protruding outward is connected to a combined deterioration behavior response tester. A circular pipe with a diameter of 40 mm and a height of 130 mm is fixed to the lower test specimen, after which concrete is placed. The circular pipe has a screw shaft inside to connect it to the test plate on the floor. Details of the test specimen are shown in Figure 2. After deforming the concrete test specimen, one must completely dry it for 48 h in a dryer set at 80 °C without removing the latency. Afterwards, the latency is removed in the area where the waterproof layer is constructed, and the upper and lower background specimens are stacked, spaced about 50 mm apart from the top and bottom ends of the test specimen, and the waterproof material is constructed from the rest (Figure 3). The prepared test specimen is attached to the test apparatus as shown in Figure 4. After attaching the test specimen to the lower surface of the tester, one must combine the upper test plate in consideration of the margin according to the repeated behavior. The prepared specimen was here subjected to repeated tensile tests, and the displacement increased to 2 mm, 4 mm, 6 mm, 8 mm, and 10 mm. Each displacement was conducted 15 times to measure the tensile strain installed on the surface.

3. Test Results

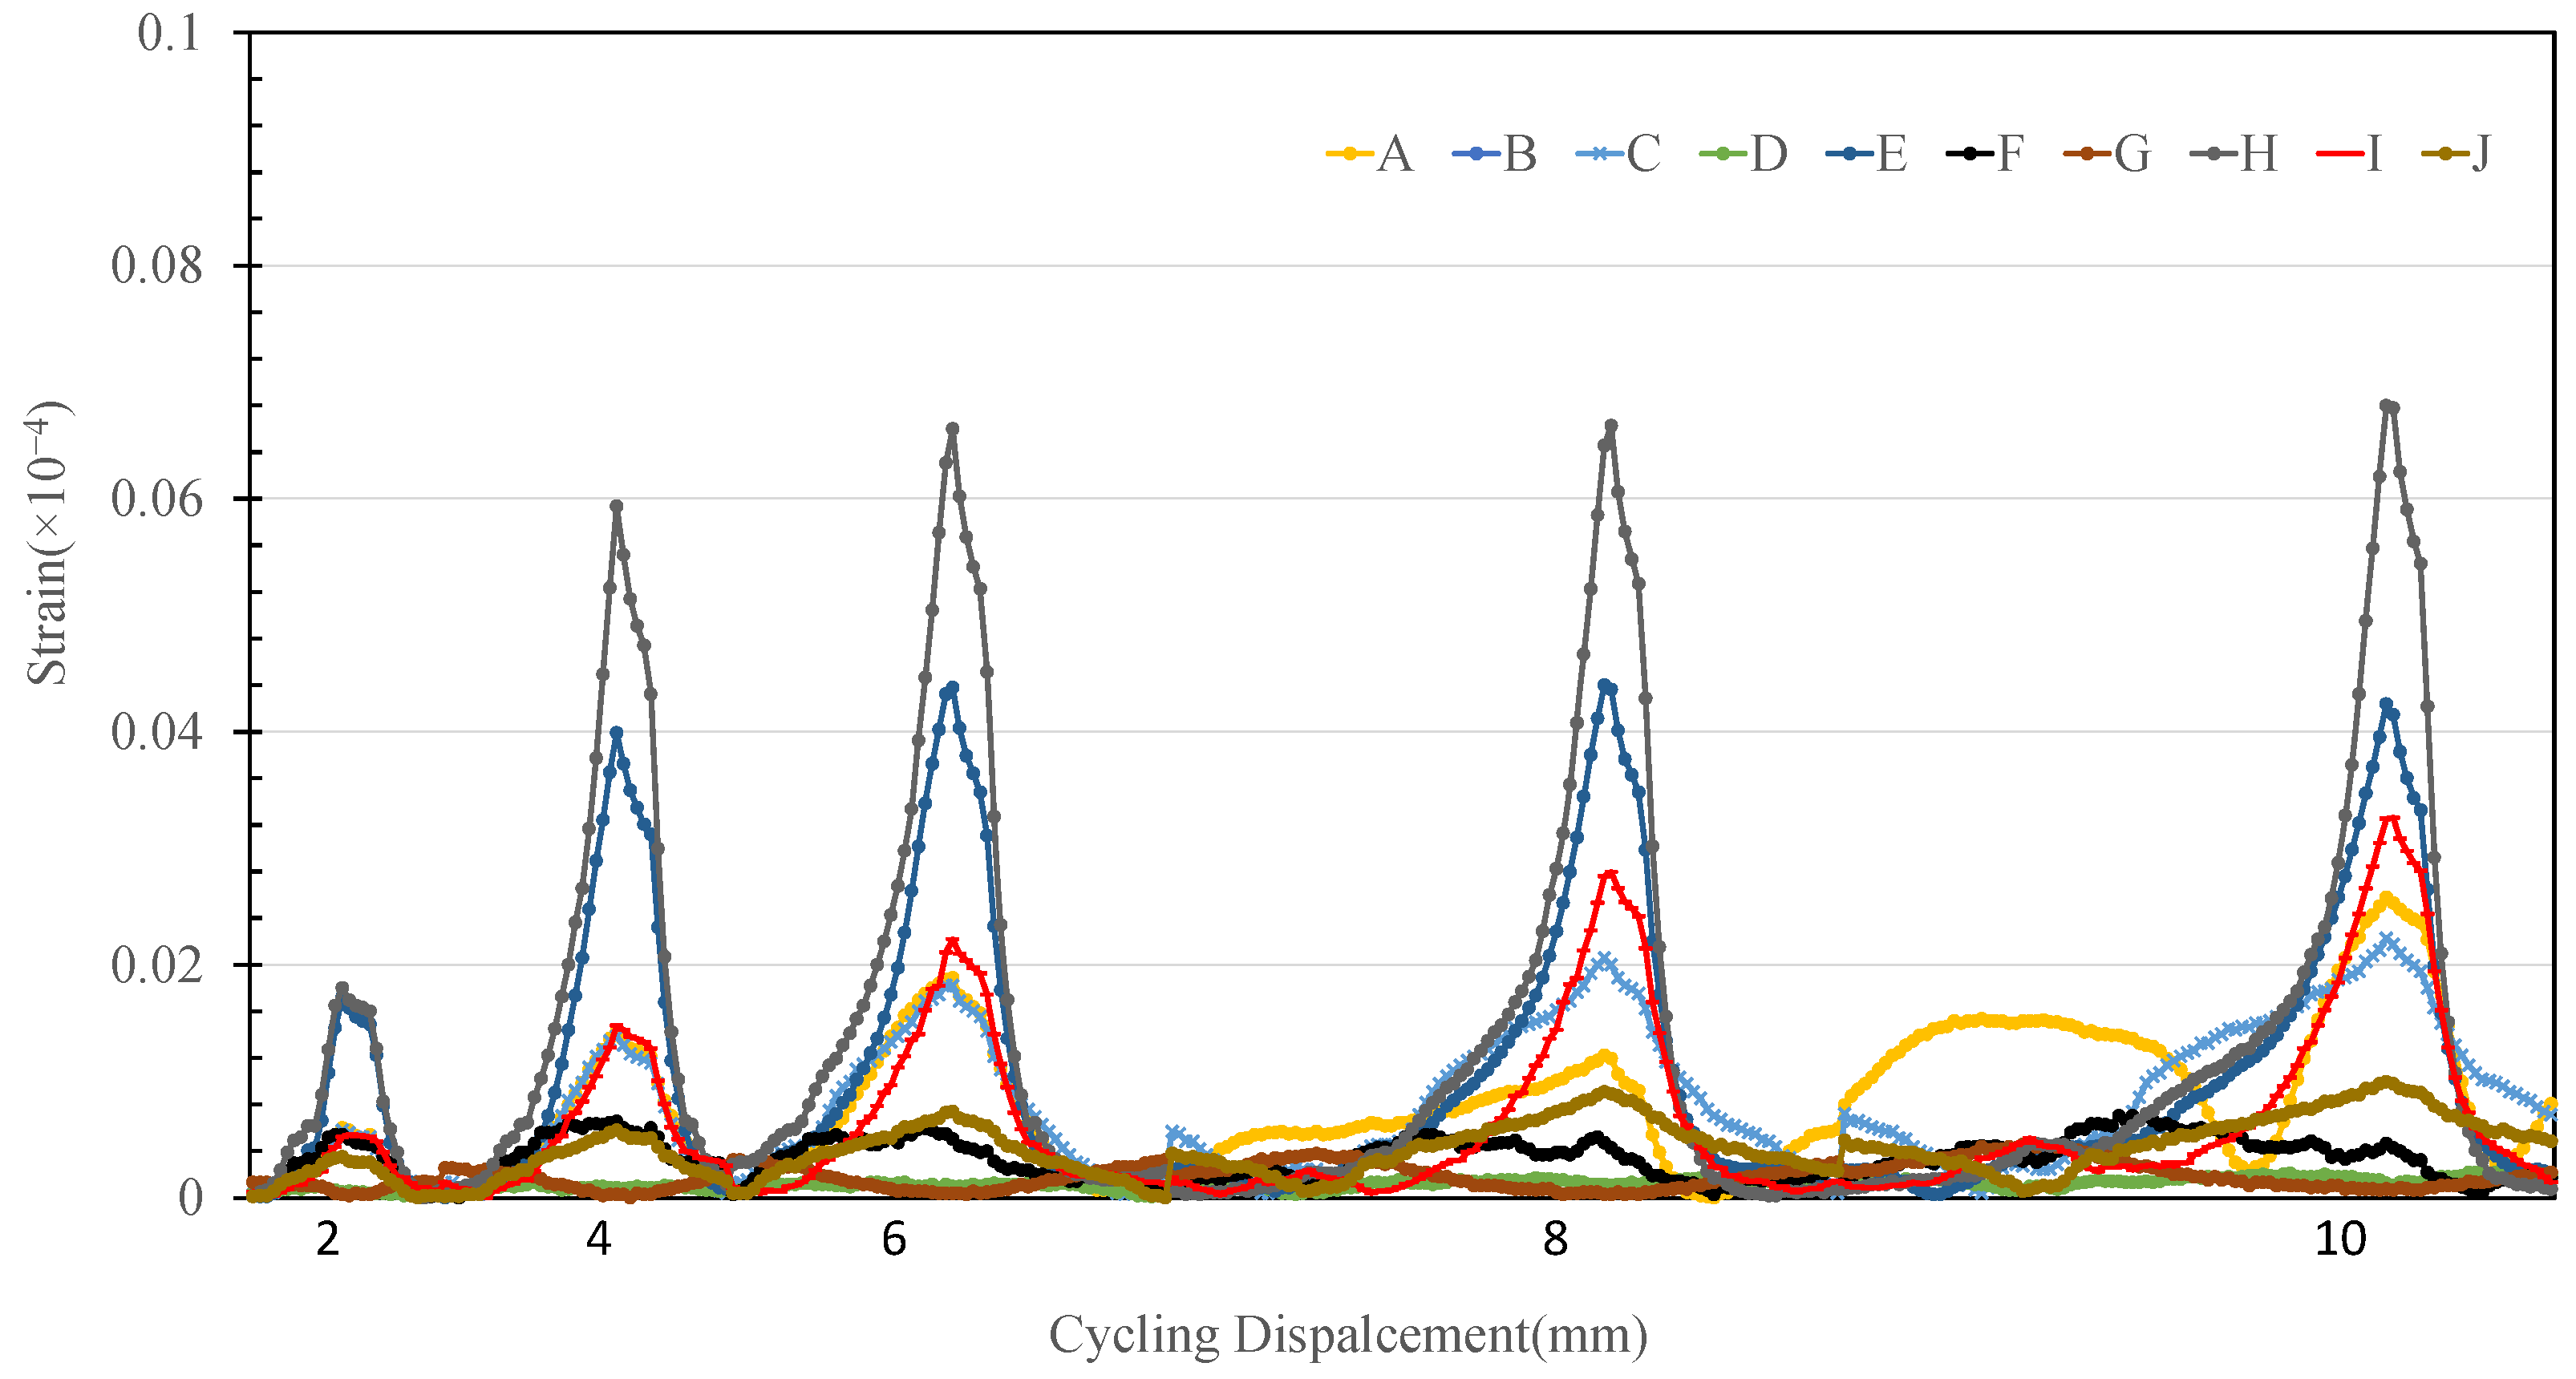
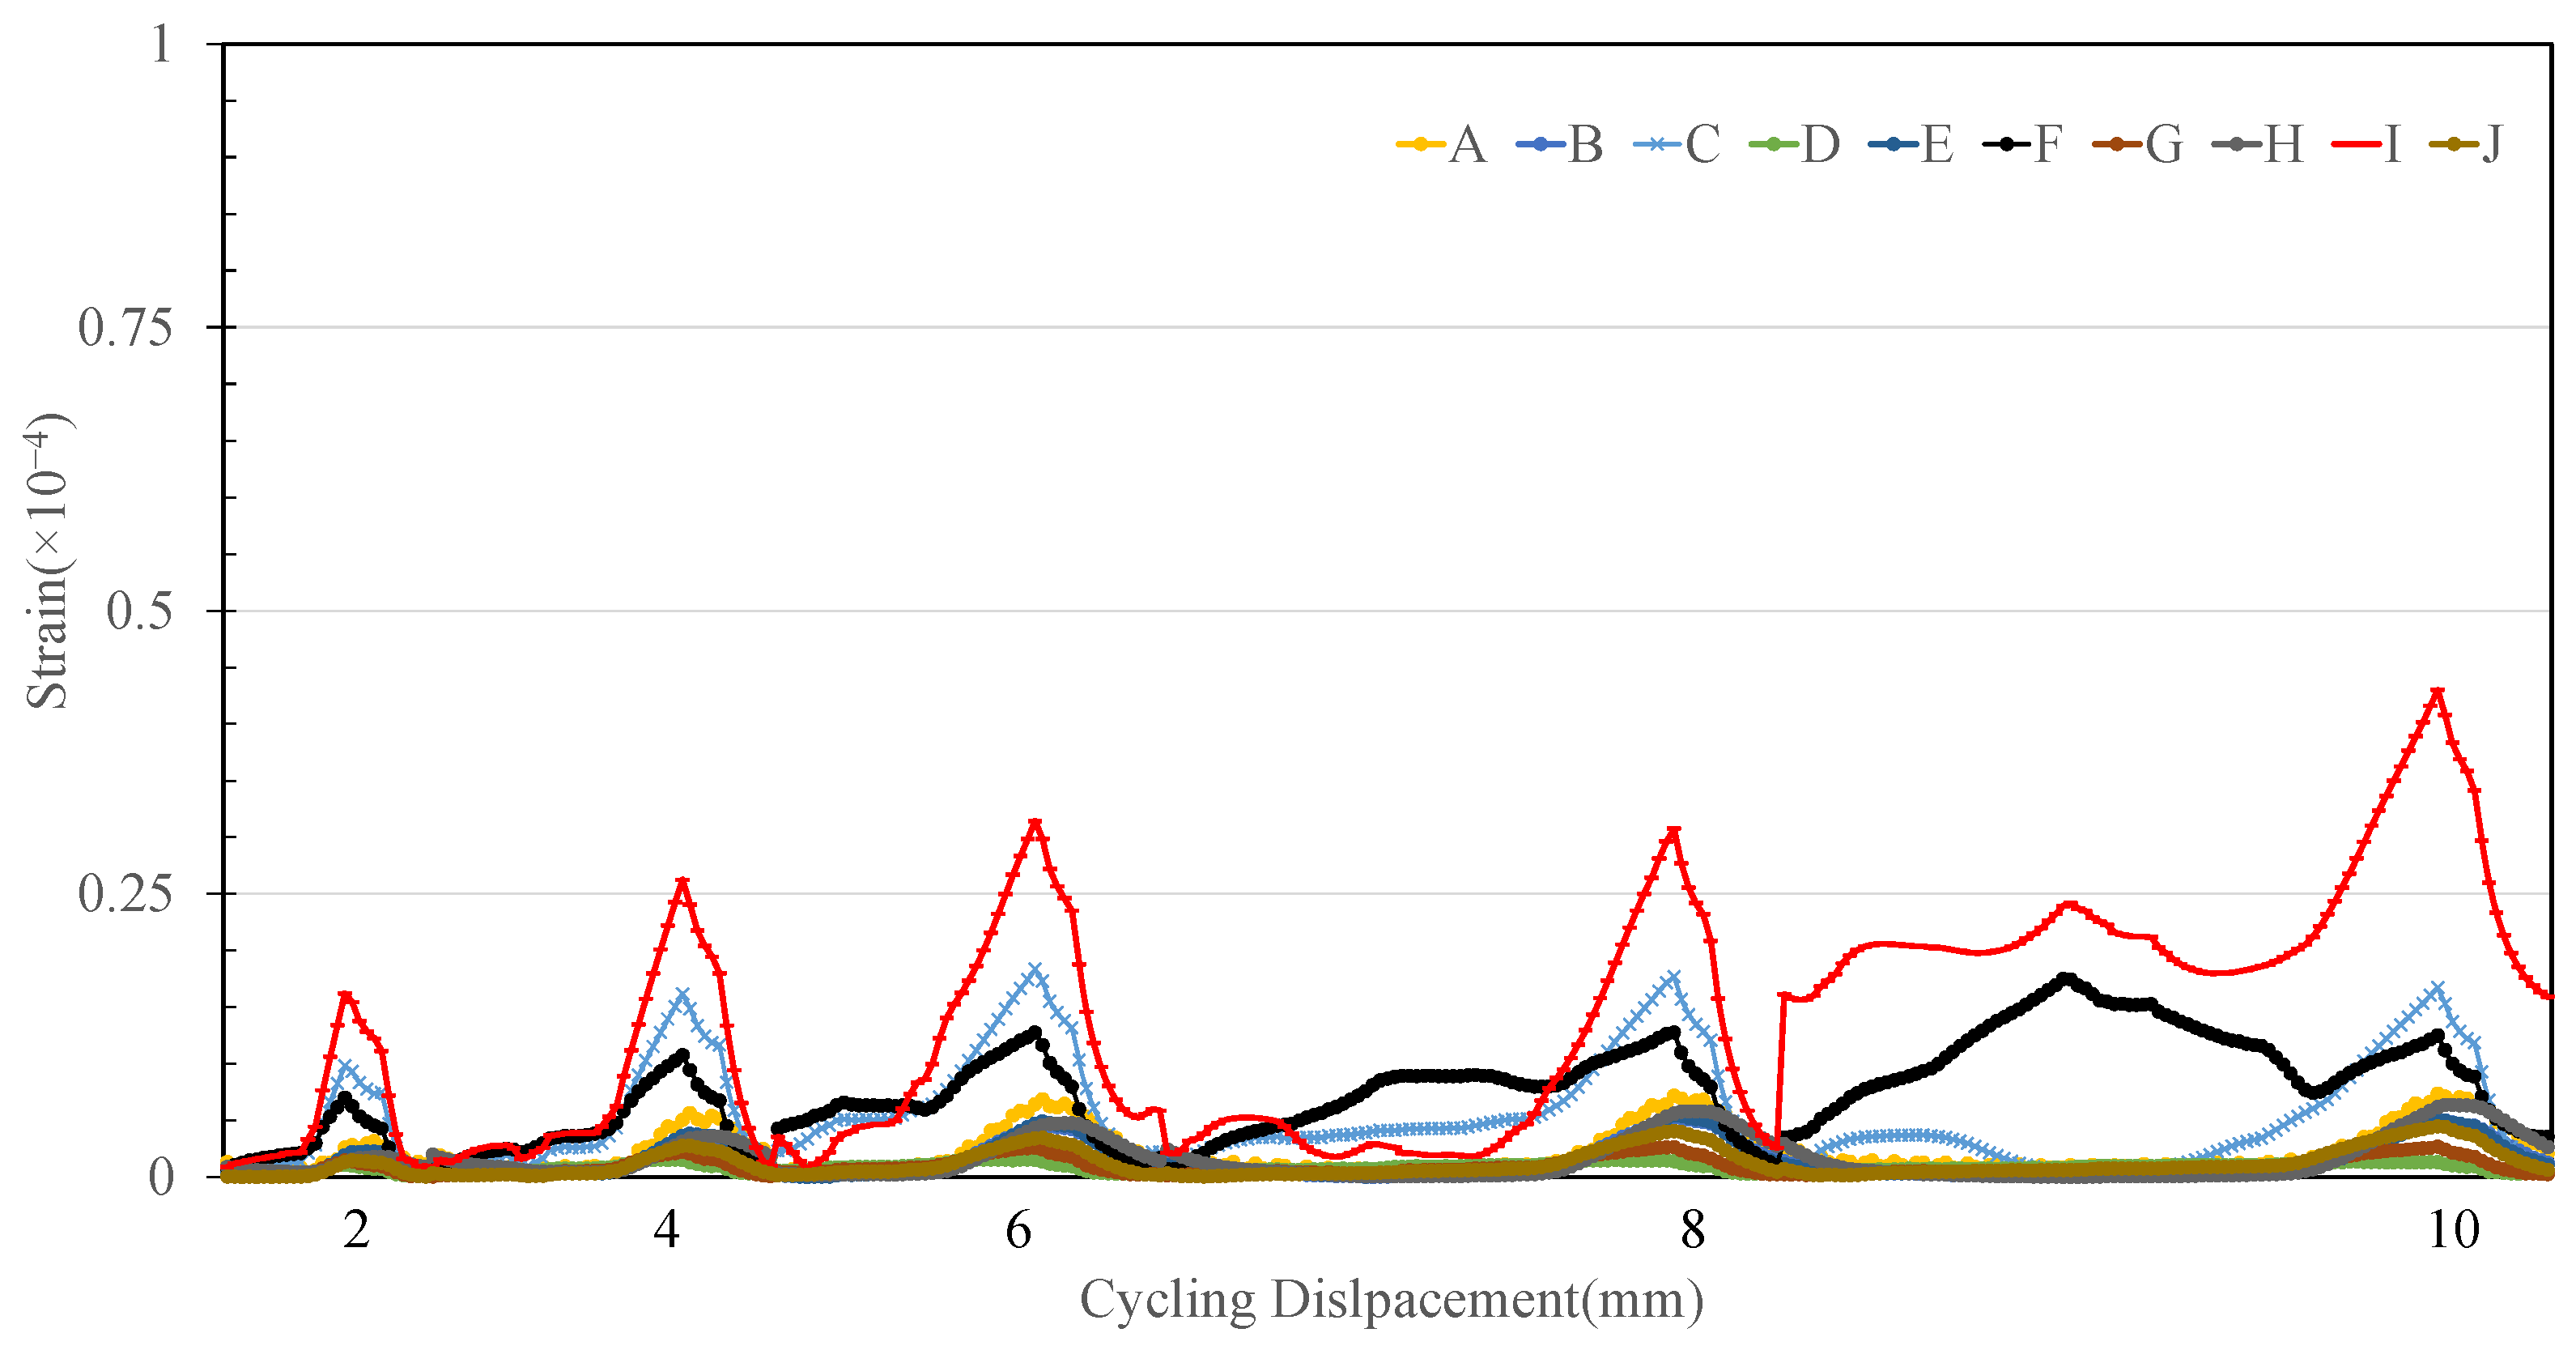
3.1. Relationship Between Cycling Displacement vs. Strains

Figure 5, Figure 6, Figure 7 and Figure 8 show representative test results showing the characteristics of the surface strain change according to repeated tensile cycling movements in the entire test specimen. Figure 4 shows the test results for Type A. As the width of the repetitive movement increased, the strains gradually decreased after causing maximum deformation (strain_I, 1.15 × 10⁻⁴) at 6 mm. The 10 mm width of movement scenario is characterized by showing less than half the strain (strain_I, 0.4 × 10⁻⁴) compared to the 6 mm width of movement. In Figure 6 and Figure 7, we see that the maximum movement width was 0.1 × 10⁻⁴ or less, and the strains were 1/10 or less compared to Type A. In particular, in Figure 2 (Type D), the deformation type of strains (A, C, E, H, I) according to the cycling movement was tensile deformation, but strains (D, F, H, J) showed the opposite movement phenomenon due to contraction. Except for strains (D and G), the strains in Figure 7 (Type E) show tensile deformation. Figure 8 (Type G) shows a strain of up to 0.43 × 10⁻⁴ (strain_I). It has a strain of up to 2.7 times that of Type A and about 5.4 times larger than Type D and Type E. By comparing and observing the change in the strain gauge attached to the waterproof sheet resulting from the increase in movement width, the stress generated on the concrete surface showed different results regarding the transmission process compared to the composite waterproof sheet.

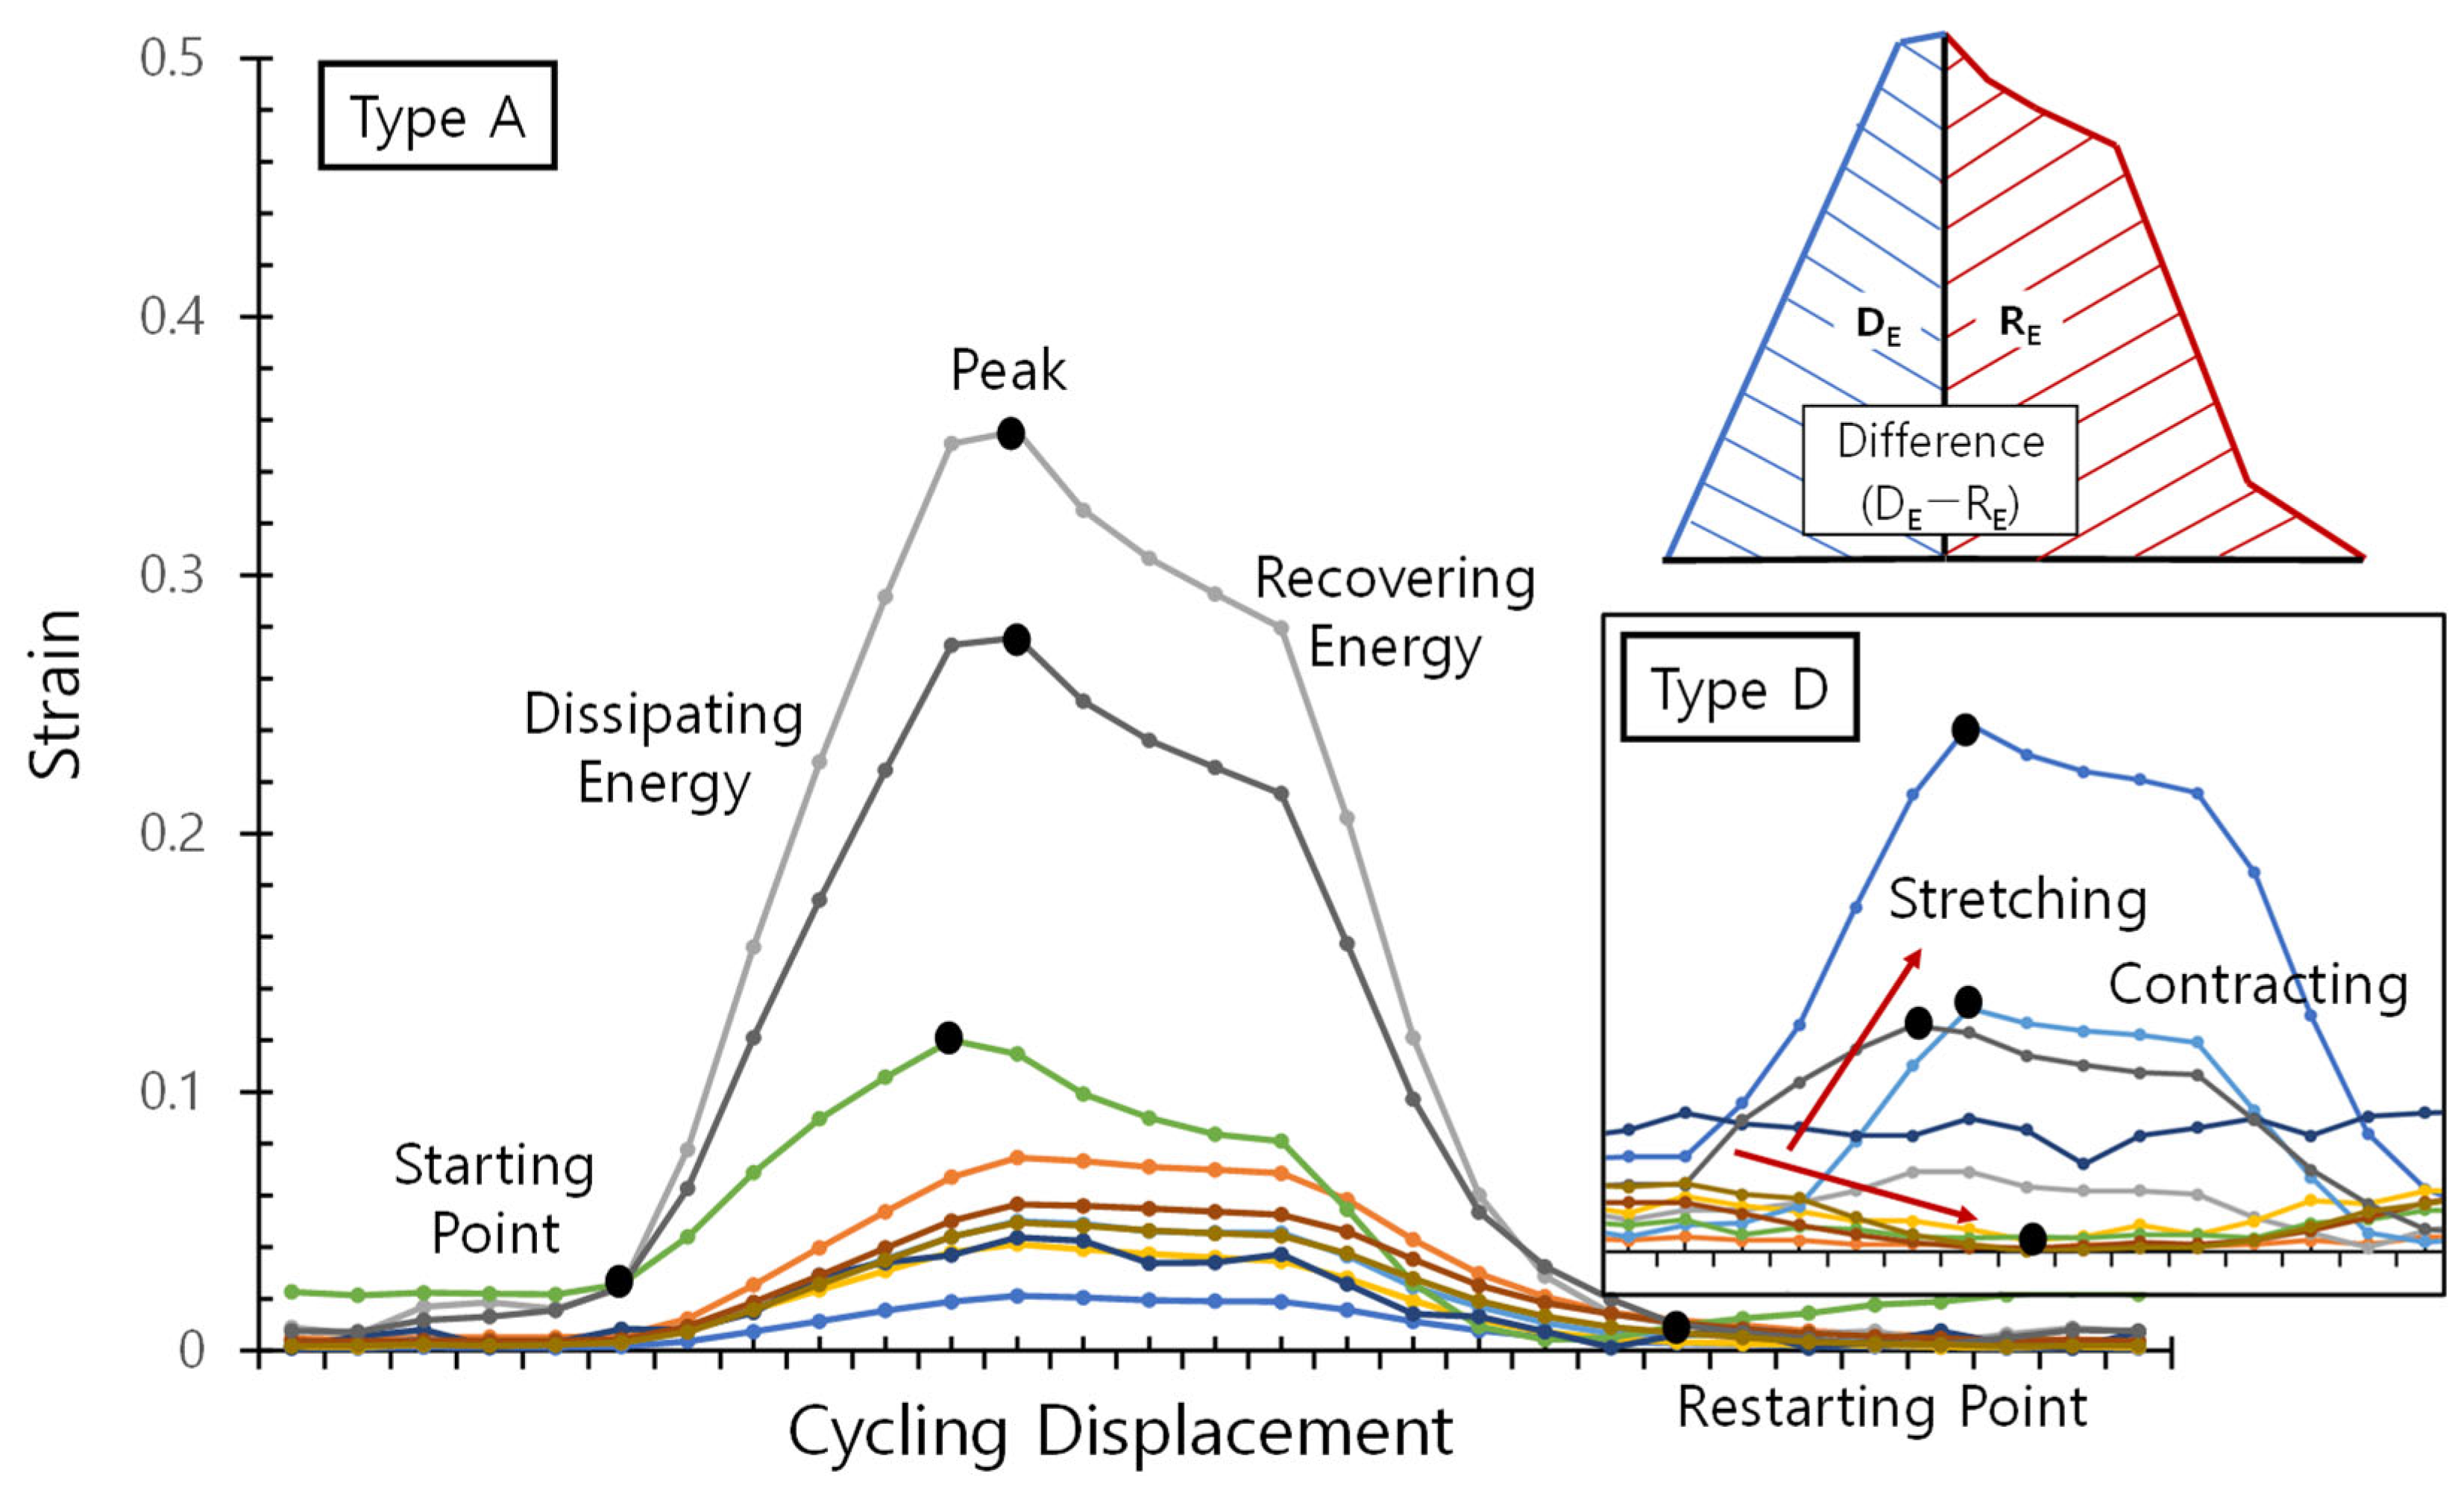
3.2. Dissipating and Recovering Energy

Figure 9 is a schematic diagram of a typical example of deformation caused by repetitive movement on a test specimen (Type A and D). When applying a tensile load to the specimen, each strain gauge on the surface of the specimen showed different strains, and the strain size and shape were different depending on the attached position and type of composite waterproof sheet. In the process of reaching the maximum strain, linear deformation occurred, but in the process of returning from the maximum point to the origin, the resilience was different depending on the increased resilience of the waterproof sheet. In particular, depending on the physical properties of the material constituting the waterproof layer, a number of composite waterproof materials (Type D, E, F) were found to cause contraction under tensile operation. Dissipated energy (DE) was generated in the process of rising during 15 repetitive movements for each width of movement from 2 mm to 10 mm, and recovering energy (RE) were values restored in the process of returning to the original point from the maximum deformation, as summarized in Table 2. It can be seen that the deformation resilience of the waterproof sheet varied depending on the type of composite waterproof sheet as the movement width increases by 2 mm. Overall, it can be clearly observed that the proportion of negative values increased as the movement width increased.

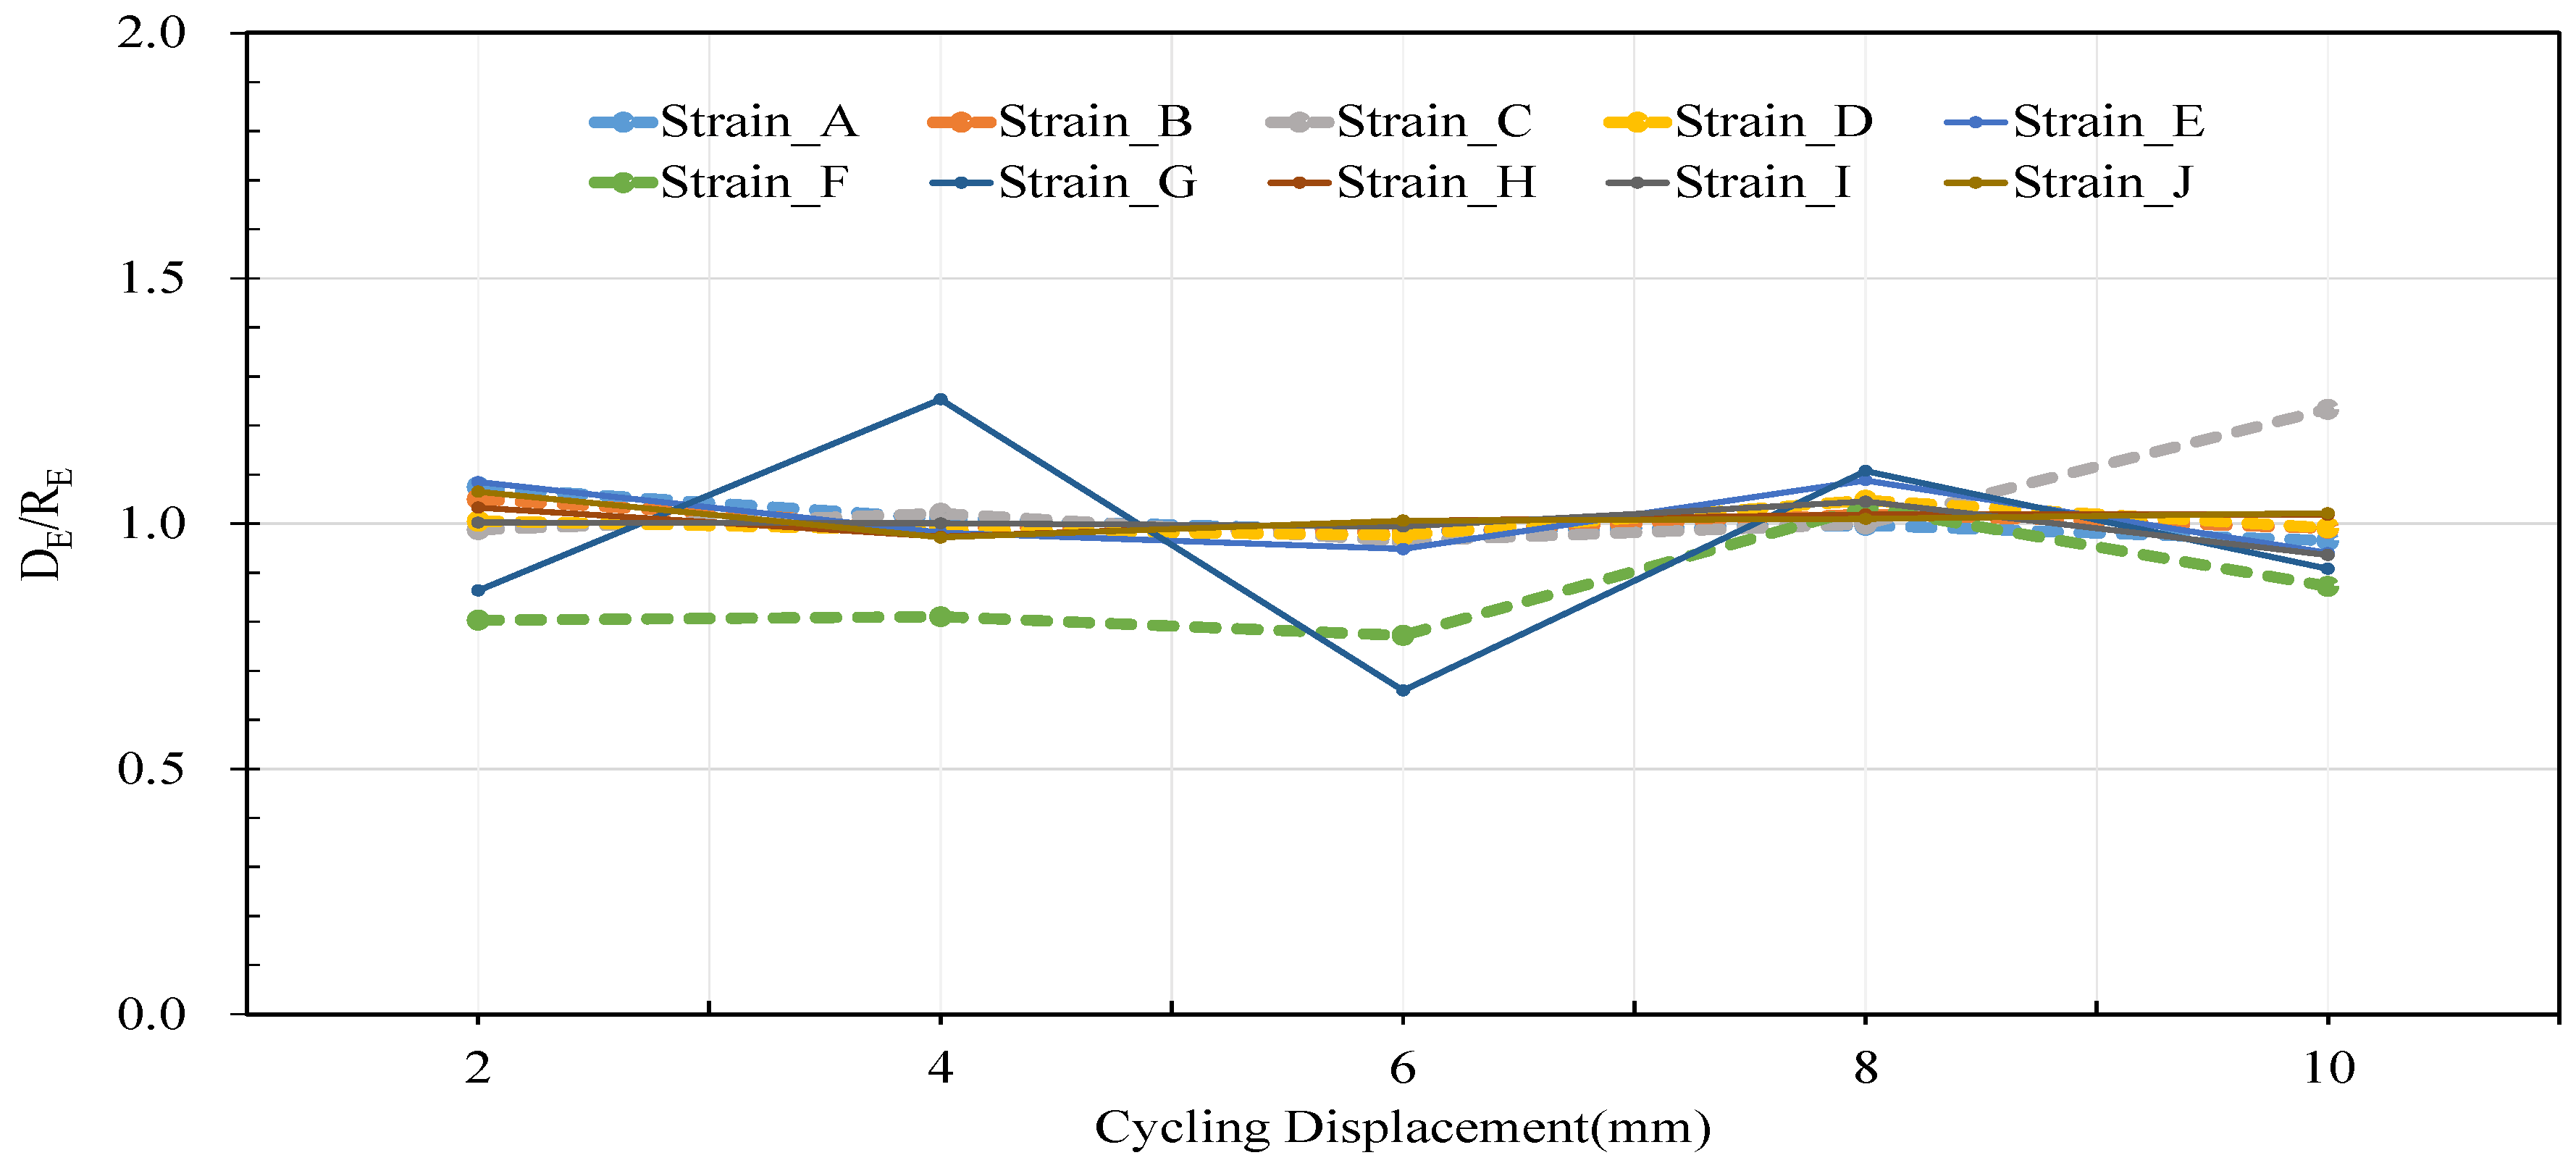
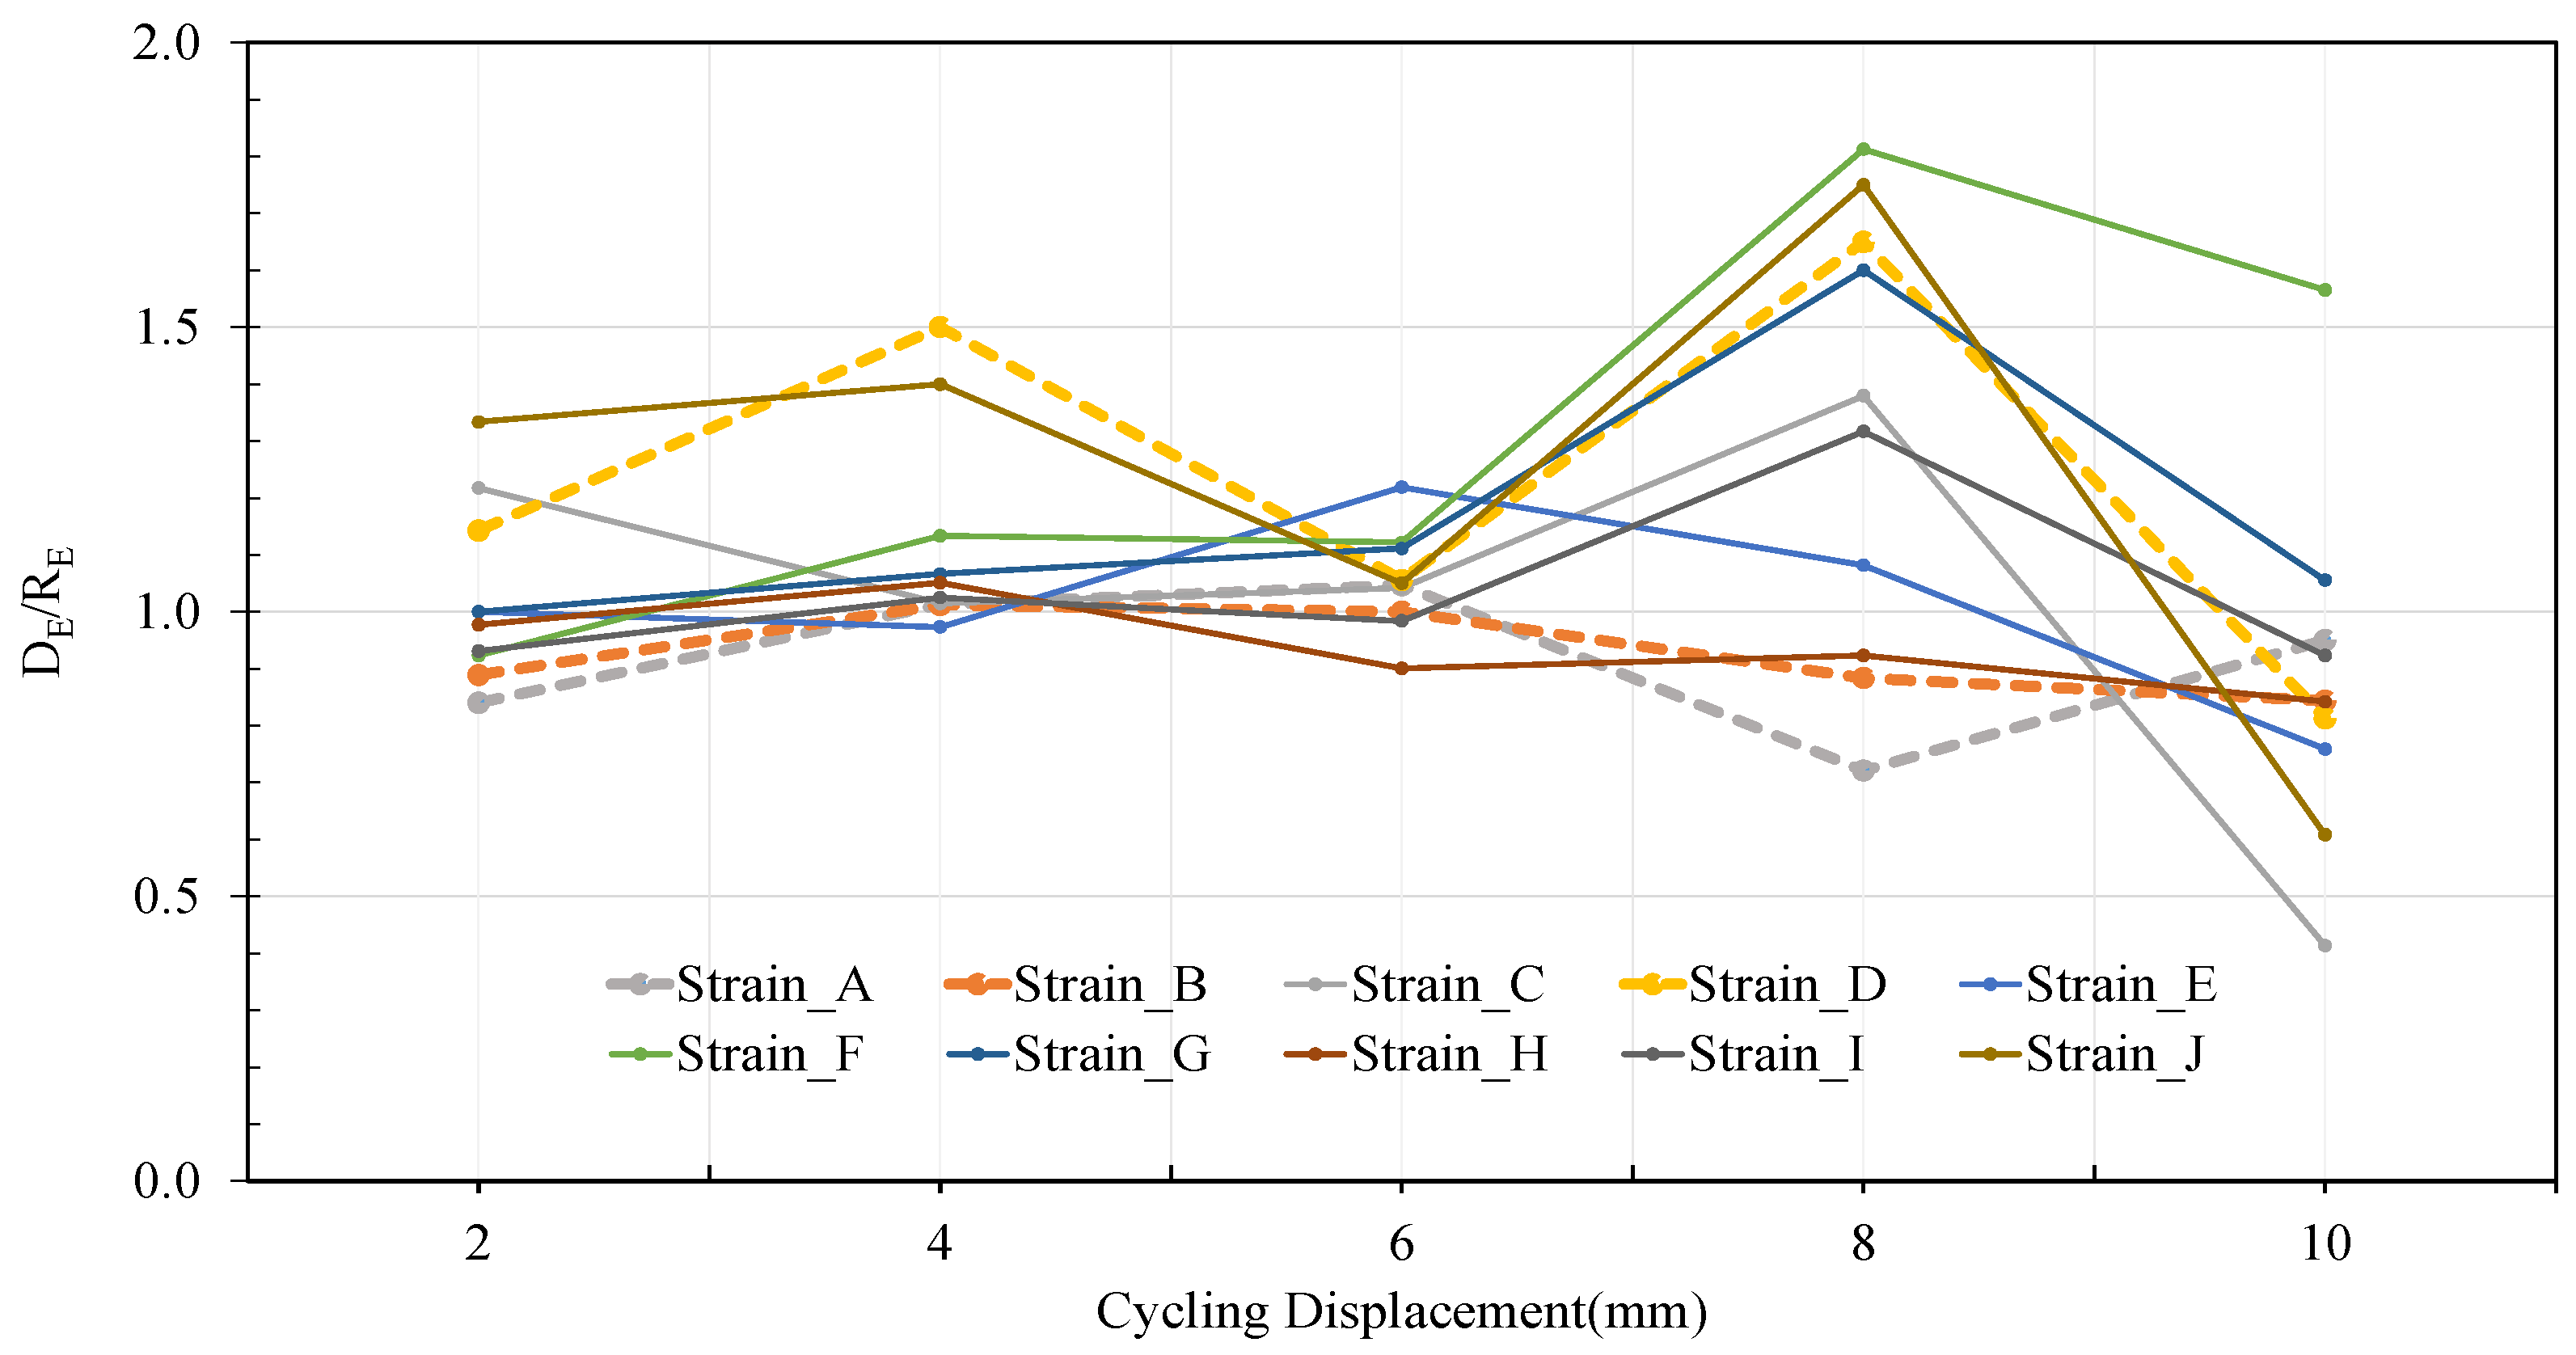
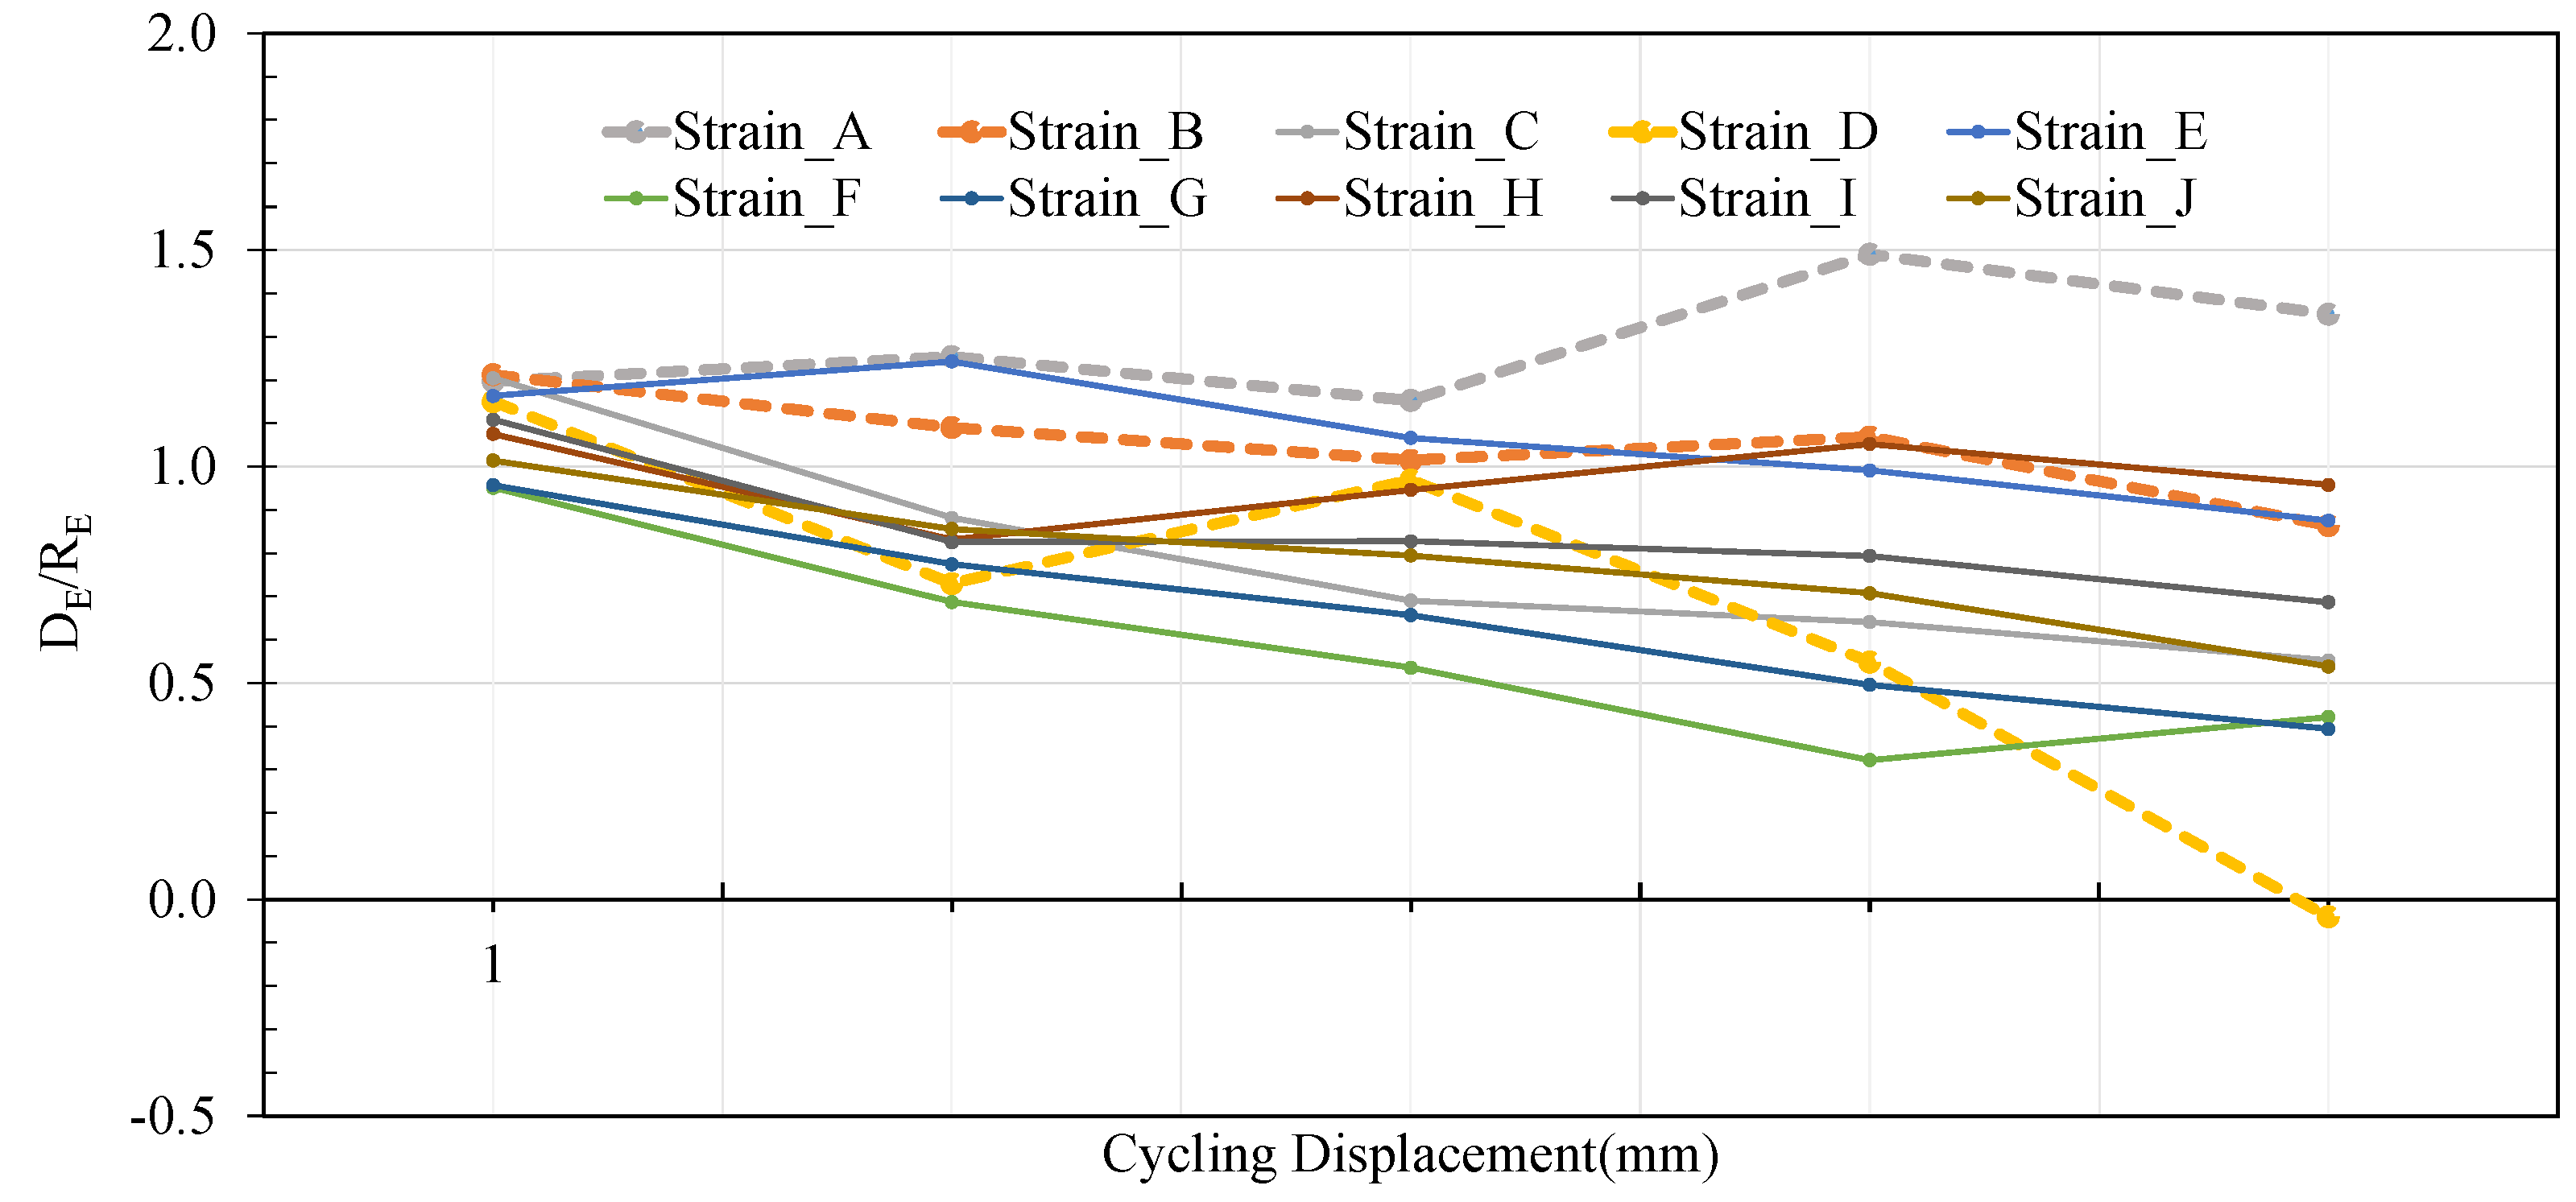
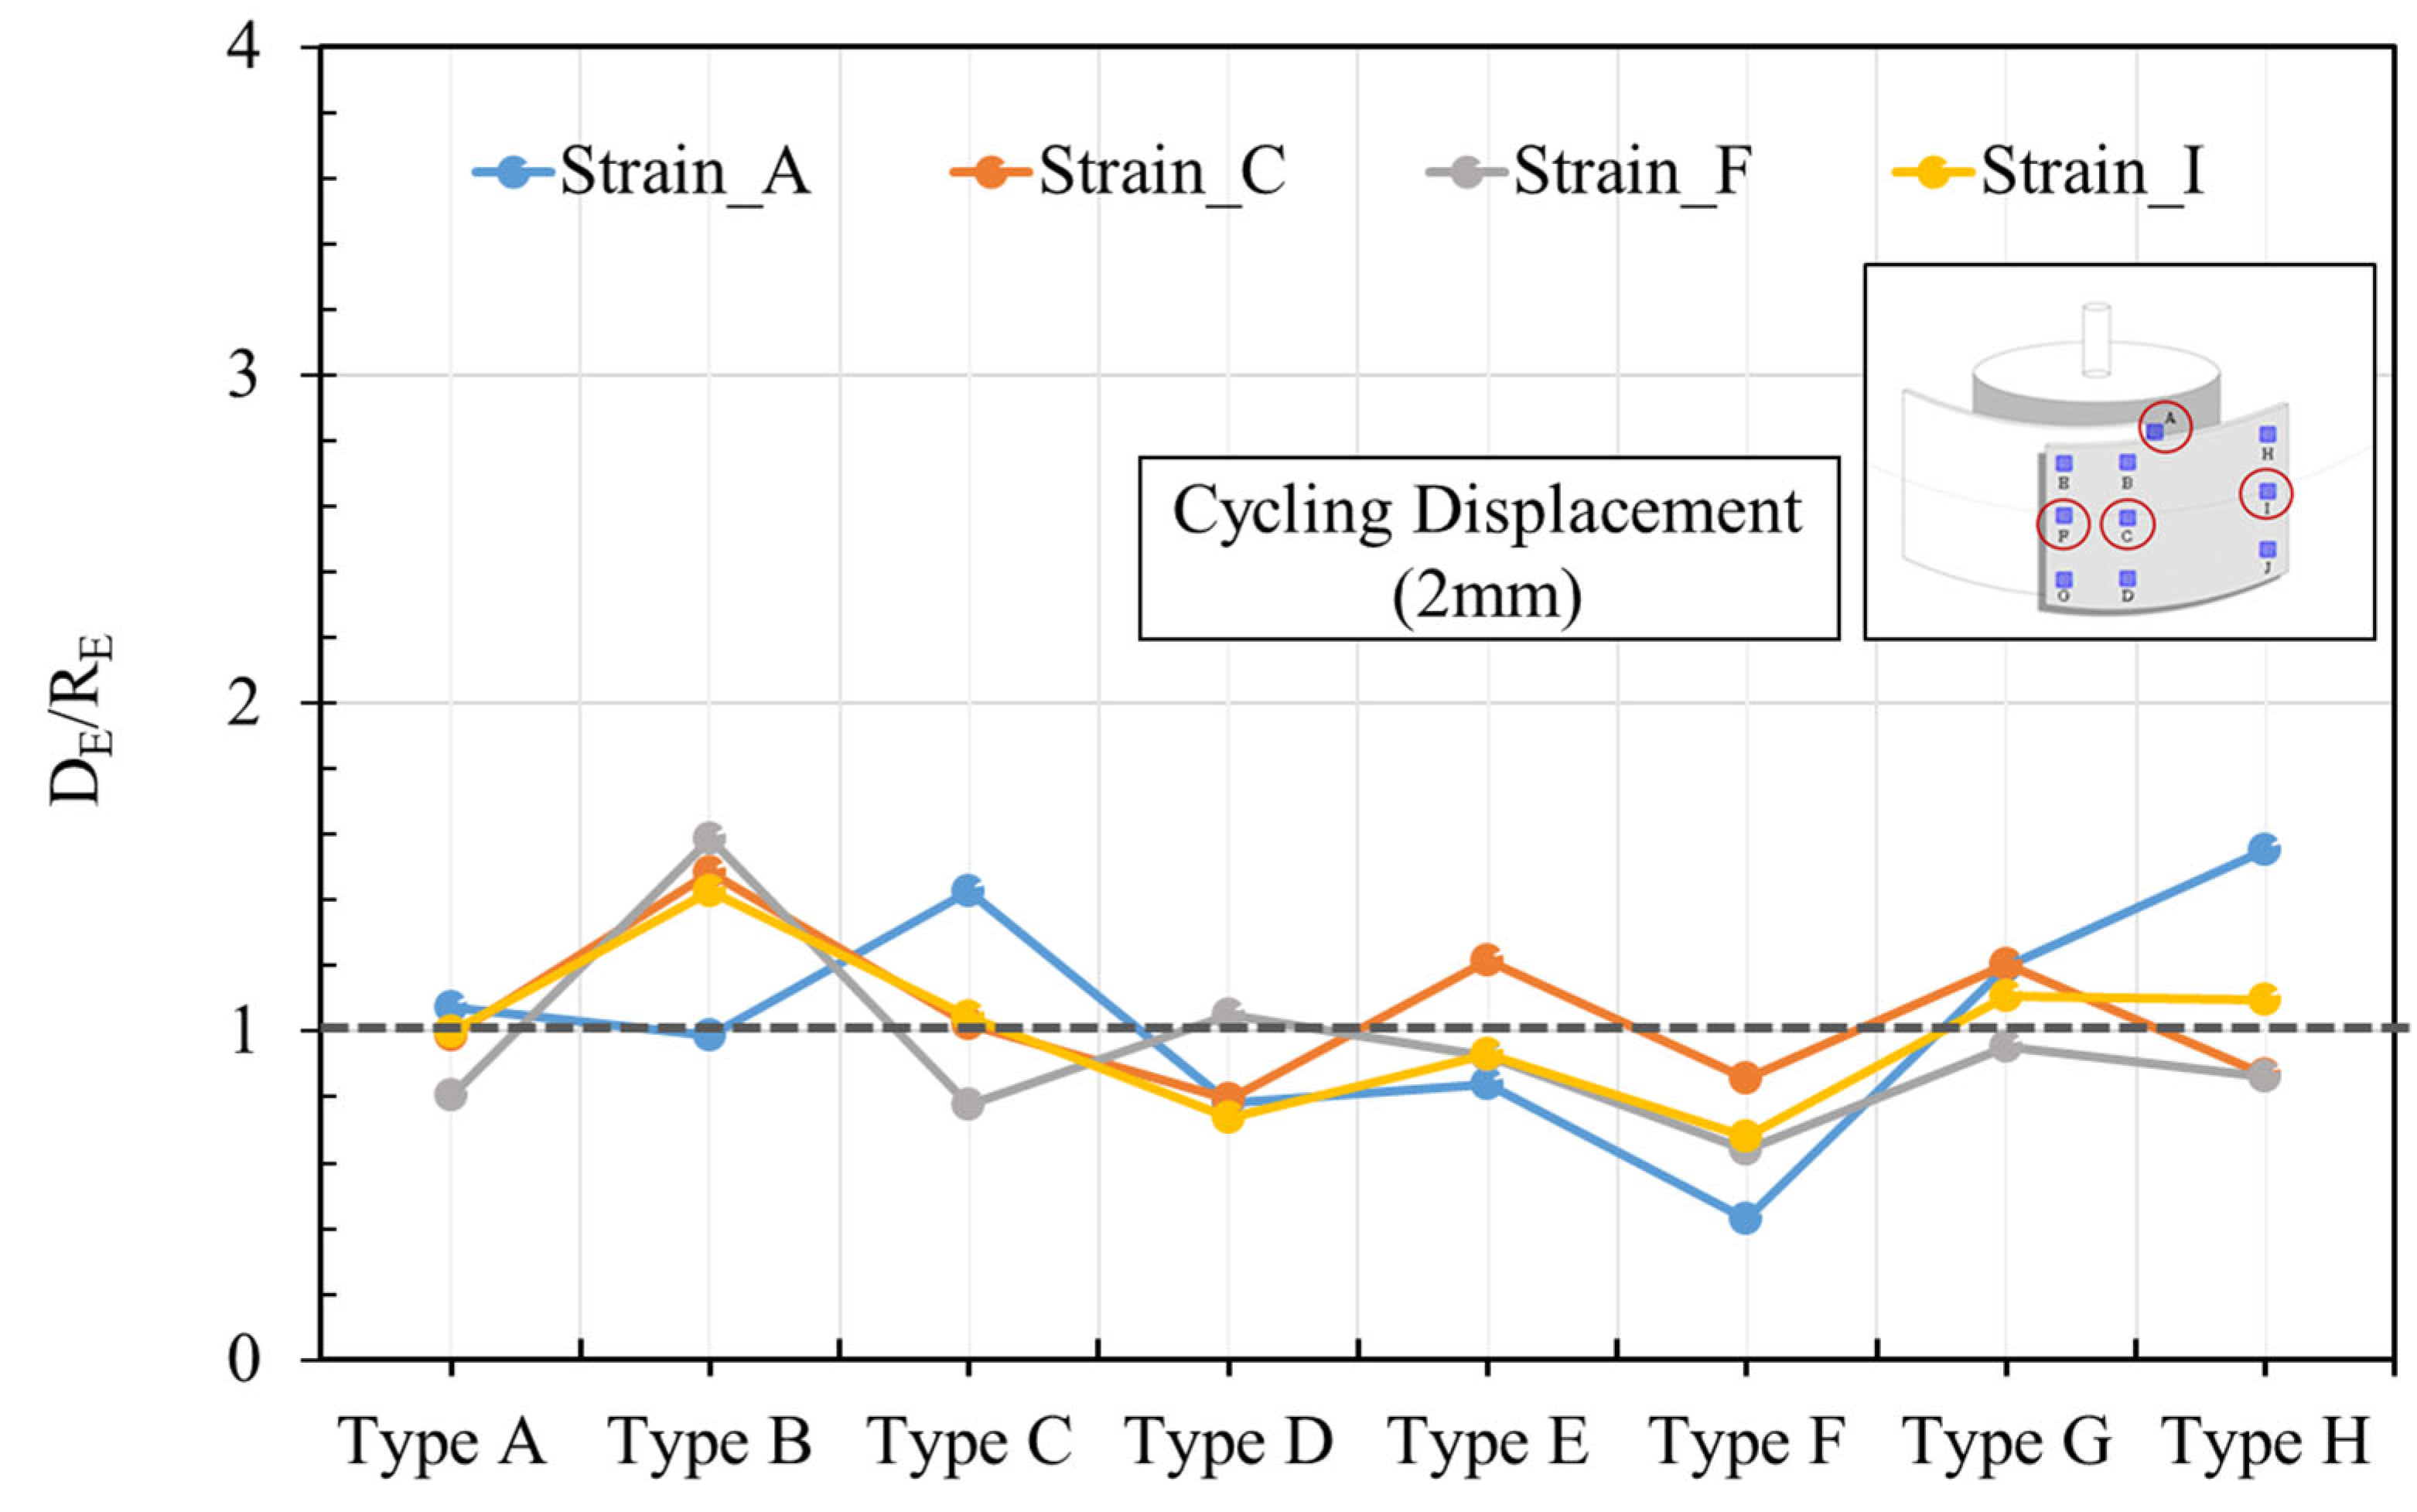
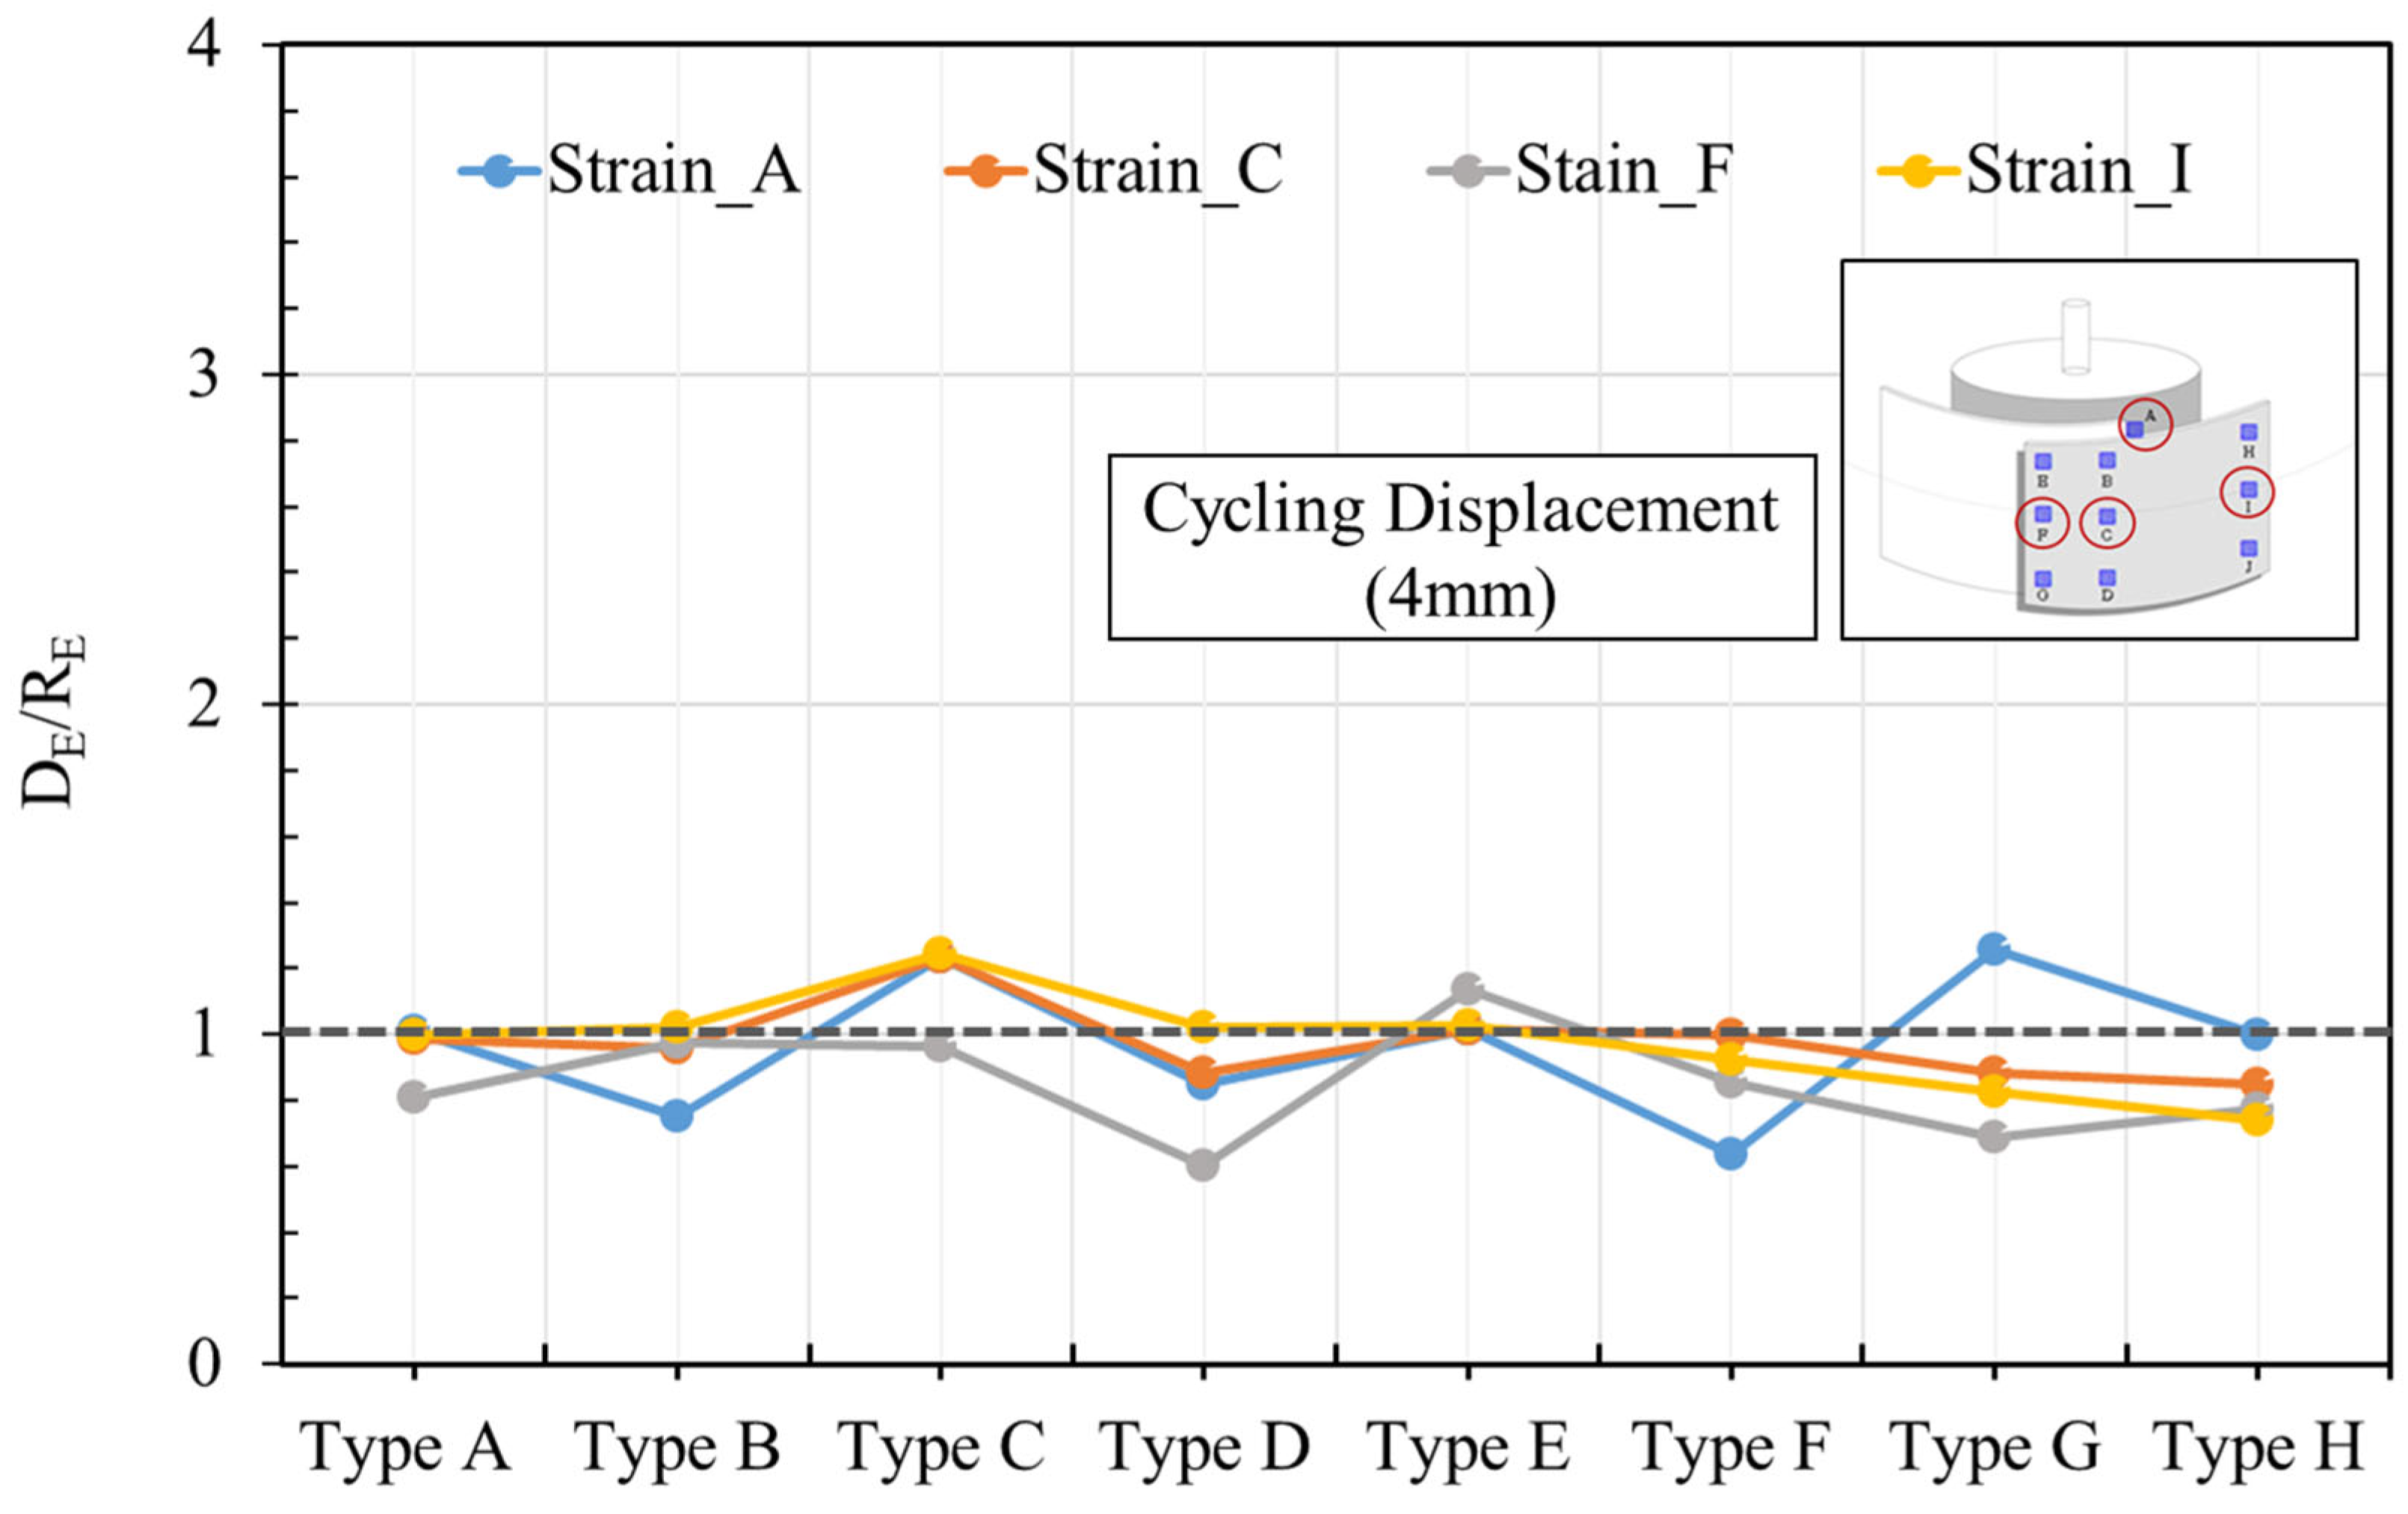
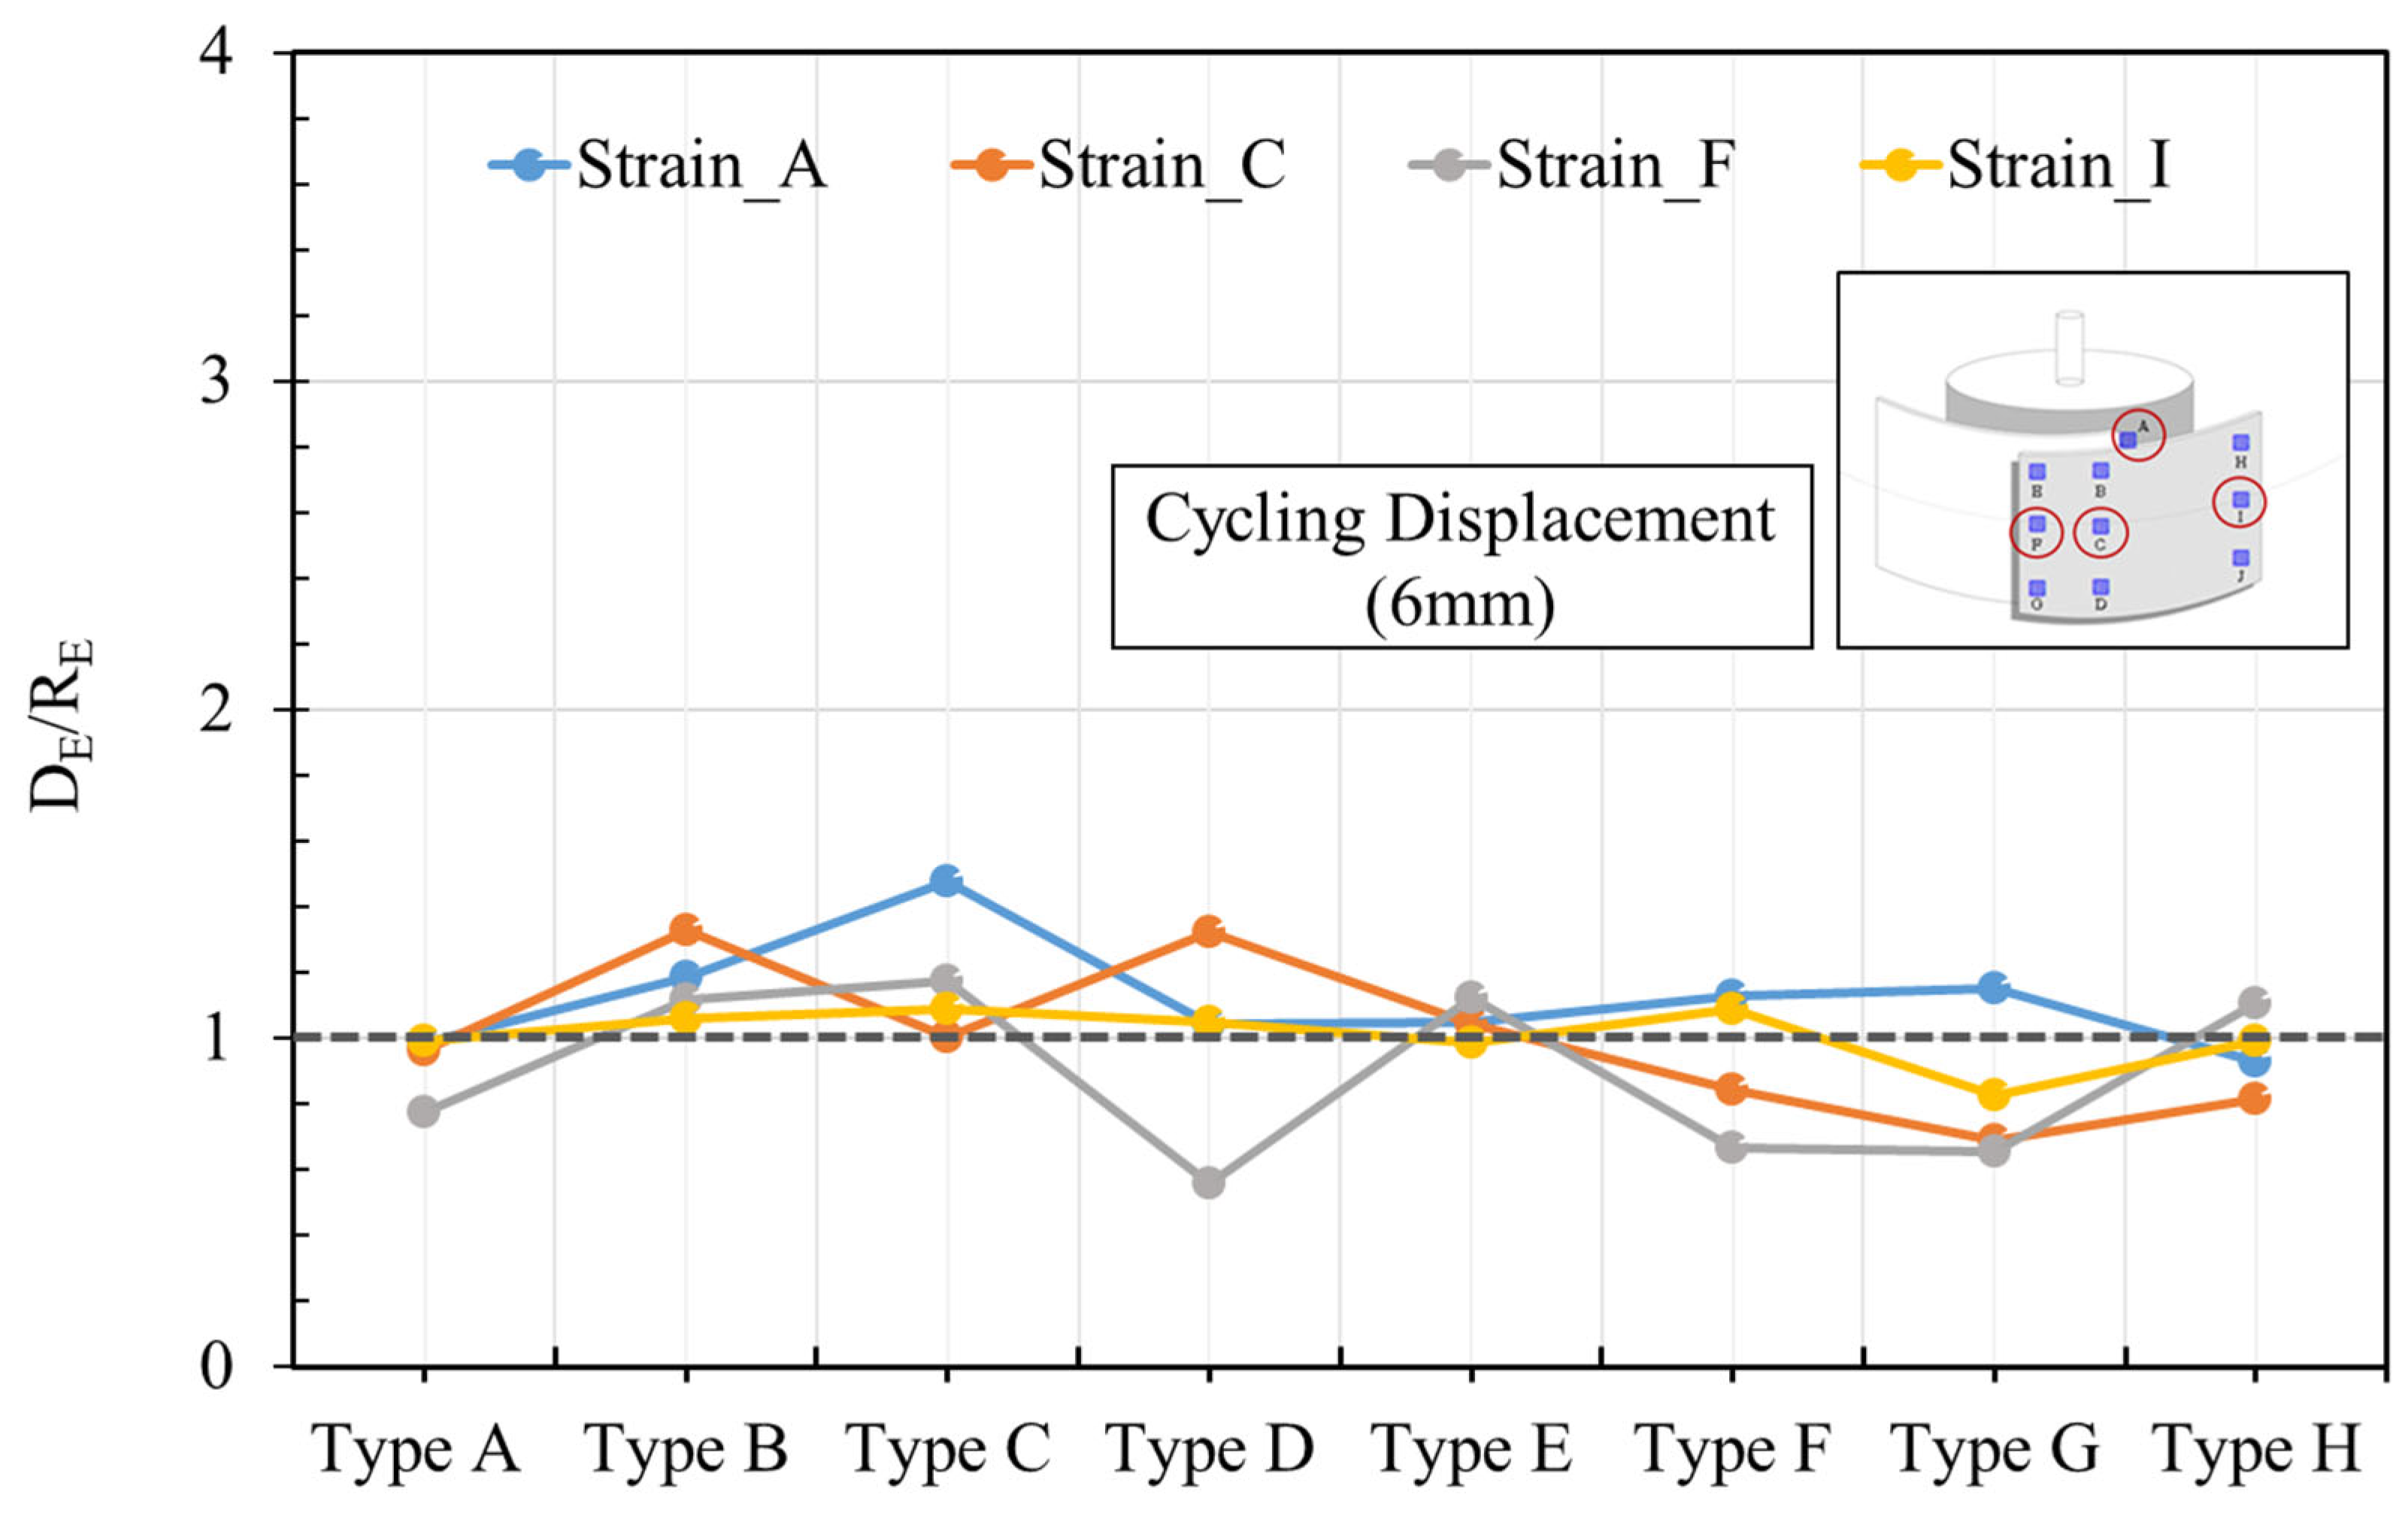
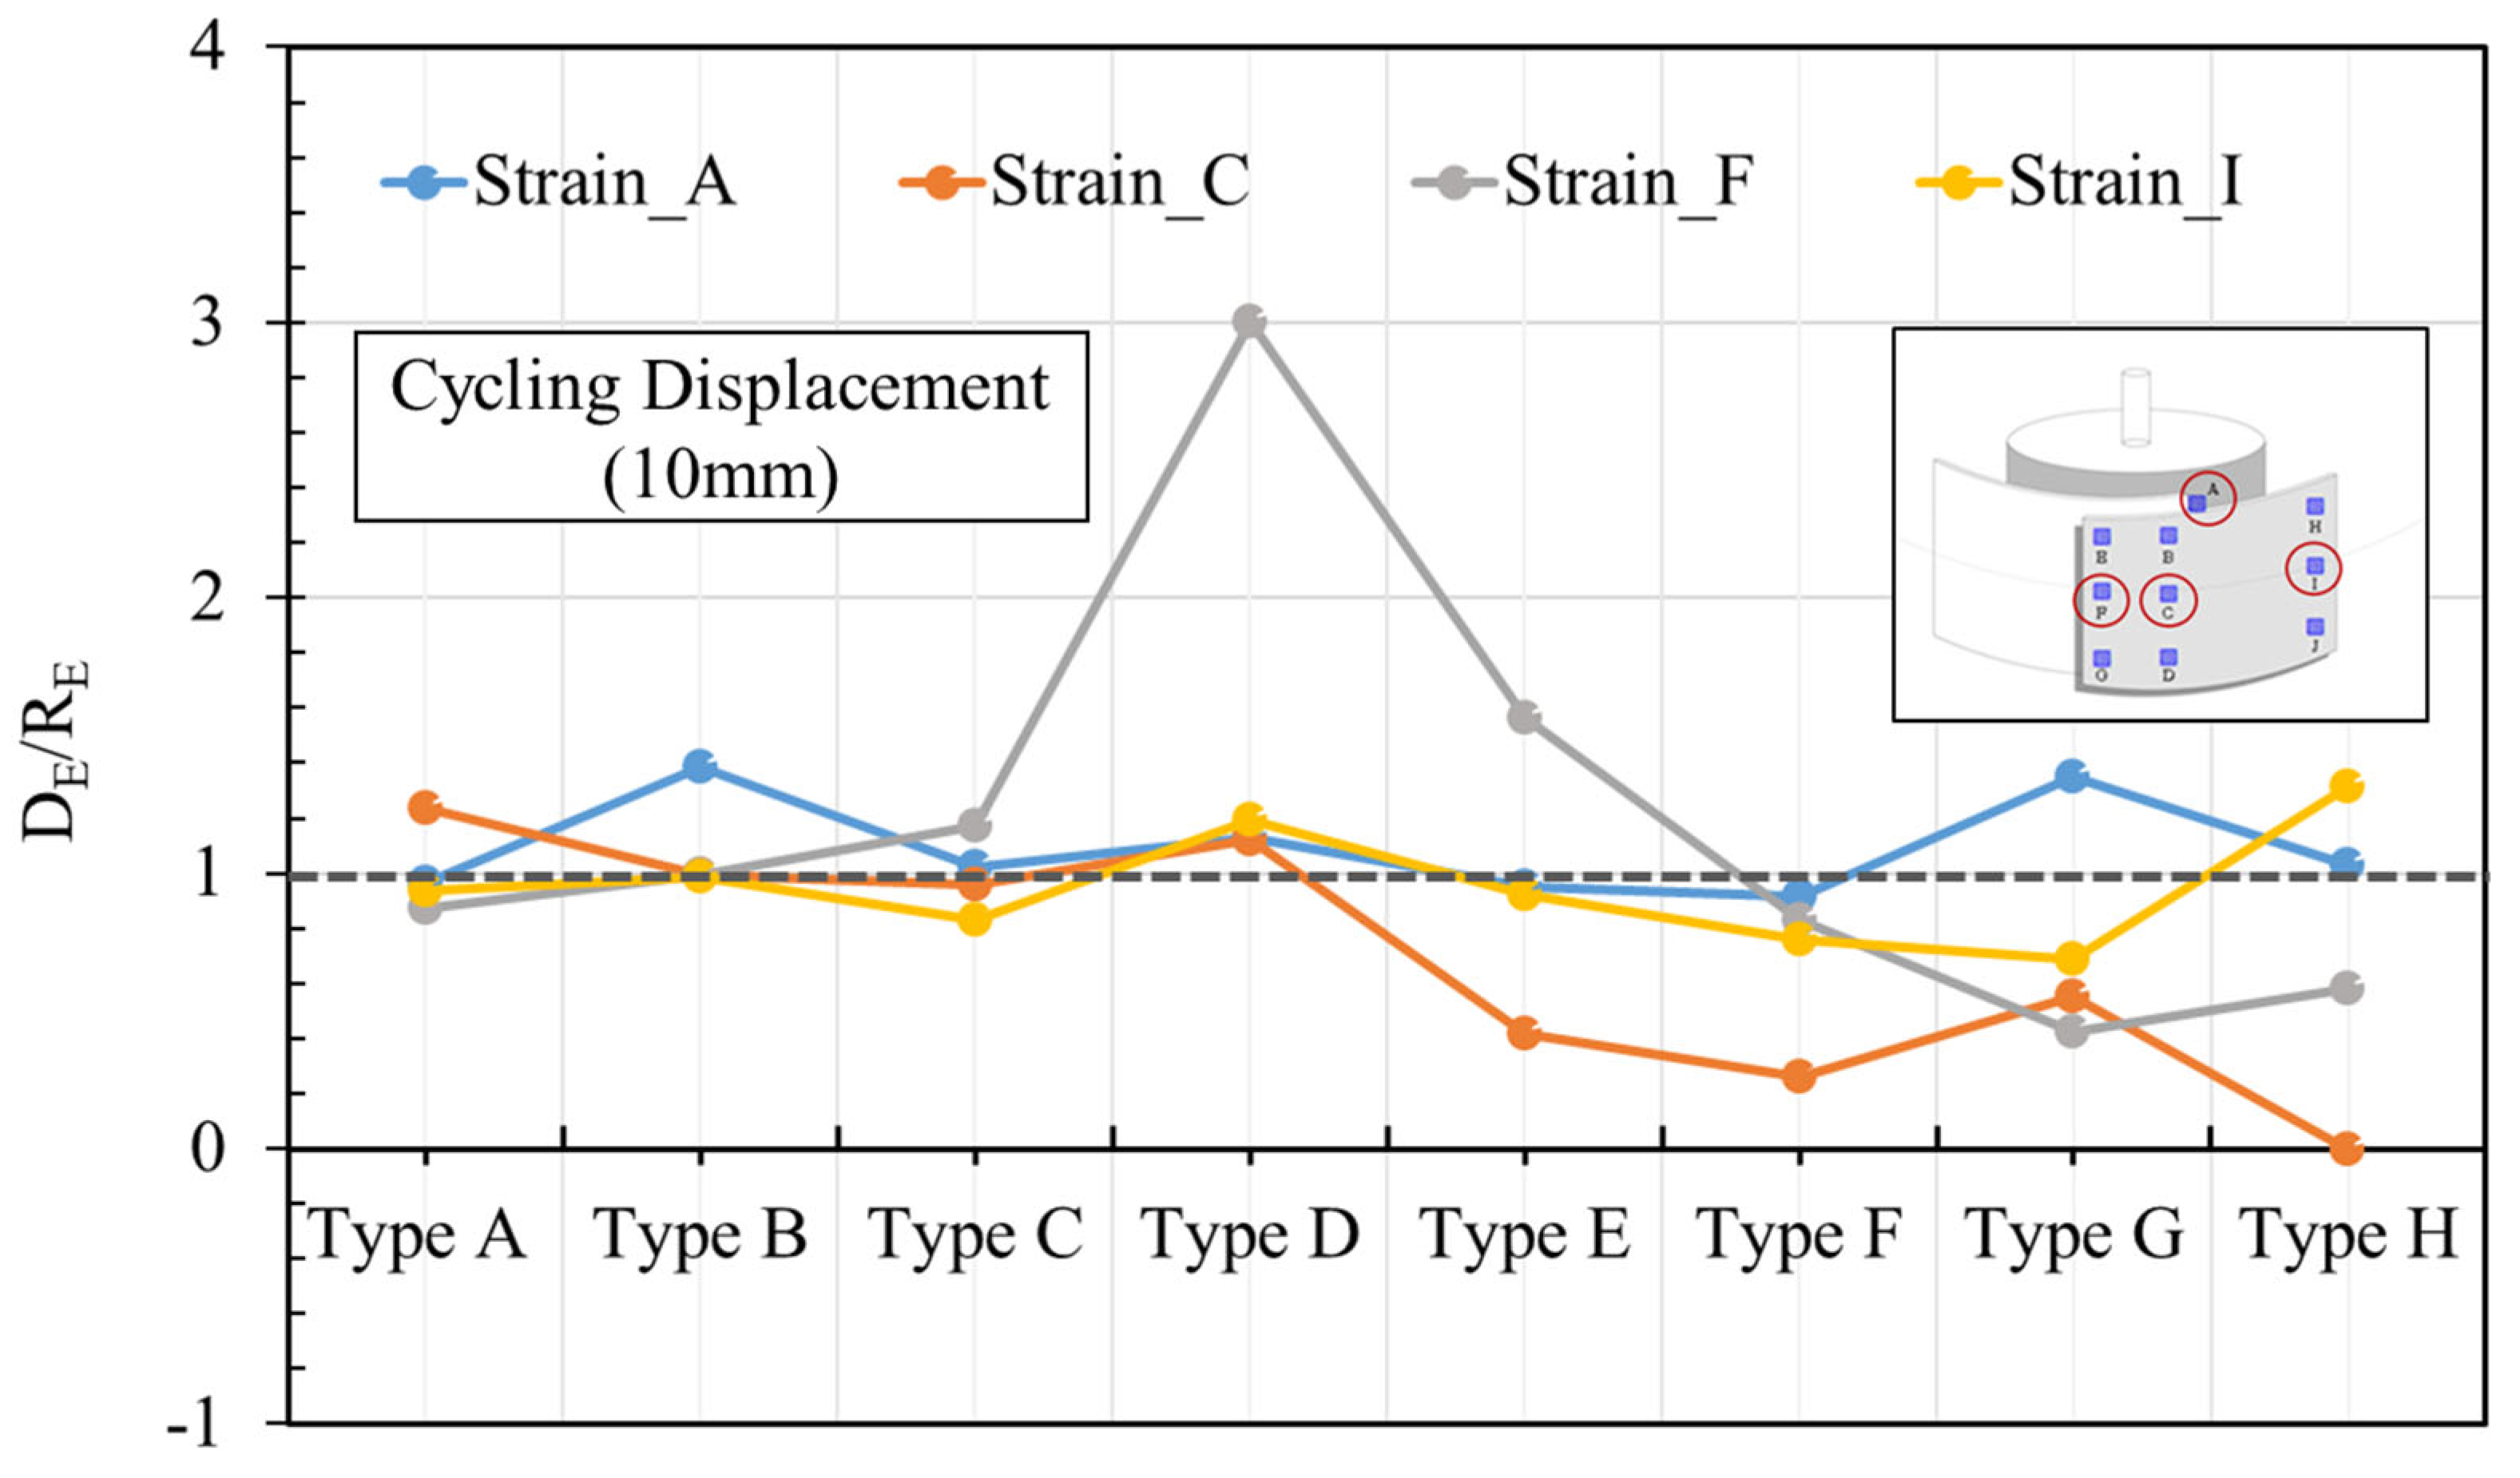
3.3. Dissipating and Recovering Energy Ratio (DE/RE)

The ratio between the dissipated and the recovering energy for all types of composite waterproof sheet is shown in Table 3. Figure 10, Figure 11, Figure 12 and Figure 13, representative of specimens (Types A, D, E, G), show distinct behaviors that were compared and analyzed. The energy dispersion (DE) of the composite waterproof sheet due to the generation of tensile stress in the interface as well as the restoring energy (RE) were calculated as a ratio and compared. In Figure 10, the difference in ratio at a specific part can be confirmed by comparing the DE/RE of Type A. Type A is characterized by being more viscous and more strongly attached than other types of specimens. As can be seen in the figure, the ratio of most attachment gauges is distributed close to 1. In the case of strain_G, as the tensile behavior increased, a value larger than 1 was shown at 4 mm, and then a value smaller than 1 was found at 6 mm. In the case of strain_F, the DE/RE value started to be less than 1, and as the displacement increased, the DE/RE value continued to be lower than 1. Figure 11 shows the DE/RE ratio of the Type D specimen, with a lot of variability in many parts. The compound consisting of the high-viscosity seal on the concrete surface showed a relatively lower viscosity than Type A [7,18]. Compared with Figure 6, it can be seen that the range of change in the DE/RE ratio is large in more parts. In strains (G, J), DE/RE was clearly less than 1 at 4 mm, and strain_H showed values of DE/RE at 2 mm, 6 mm, 8 mm and 10 mm that were greater than 1. Figure 12 shows the DE/RE ratio of Type E with an unhardening compound (viscoelastic), and the results are significantly different from those of Type A and Type D. In the initial behavior at 2 mm and 4 mm, for all strains except strains_D and J, the resilience was excellent, but the difference in deformation after 6 mm was clearly distinguished. Except for strains_A and B, the resilience to tensile deformation progressed rapidly at 8 mm, and then slowly at 10 mm due to a loss of resilience. In Figure 13, the restoration process after the tensile behavior began proceeded slowly, and the DE/RE ratio was less than 1, except for in strain_A. In particular, strain_D showed a value close to 0 at 10 mm, which is interpreted as a relatively large RE value compared to DE due to its longer and slower post-tension restoration process.
In Figure 14, Figure 15, Figure 16, Figure 17 and Figure 18, the total waterproof sheet along with the important parts (A, C, F, I) where the maximum stress occurs with a high probability of important leakage are selected and compared for DE/RE ratio. Figure 14 compares the DE/RE values for each type of waterproof sheet at 2 mm displacement. At 2 mm, which is the smallest displacement, it can be seen that the DE/RE value had a distribution close to 1. There was no significant change in DE/RE value even at 4 mm (Figure 15) and 6 mm (Figure 16). Overall, in the process of increasing the change from 2 mm to 6 mm, the capacity for deformation resistance in the composite waterproof sheet in the interface was generally excellent. At 8 mm (Figure 17), a marked change in the behavioral abilities of the composite waterproof sheet began to be seen. For Type E, Type F, Type G, and Type H, it can be confirmed that the DE/RE ratios showed different tensile deformation and restoration processes from before, as they deviated significantly from the value of 1. In the displacement gauges C, F, and I in the middle area, where the maximum load occurs, the resilience due to the loss of a tensile behavior ability was slowed, resulting in a relatively large RE value. Figure 18 shows more pronounced results, and in the case of Type D, strain_F lost its tensile-restoration capability due to the large DE/RE ratio being further increased to 3.0, which is the largest value, at 10 mm. The remaining Types E, F, G, and H were found to have lost their tensile-restoration ability after 8 mm, and thus developed in their behavior.

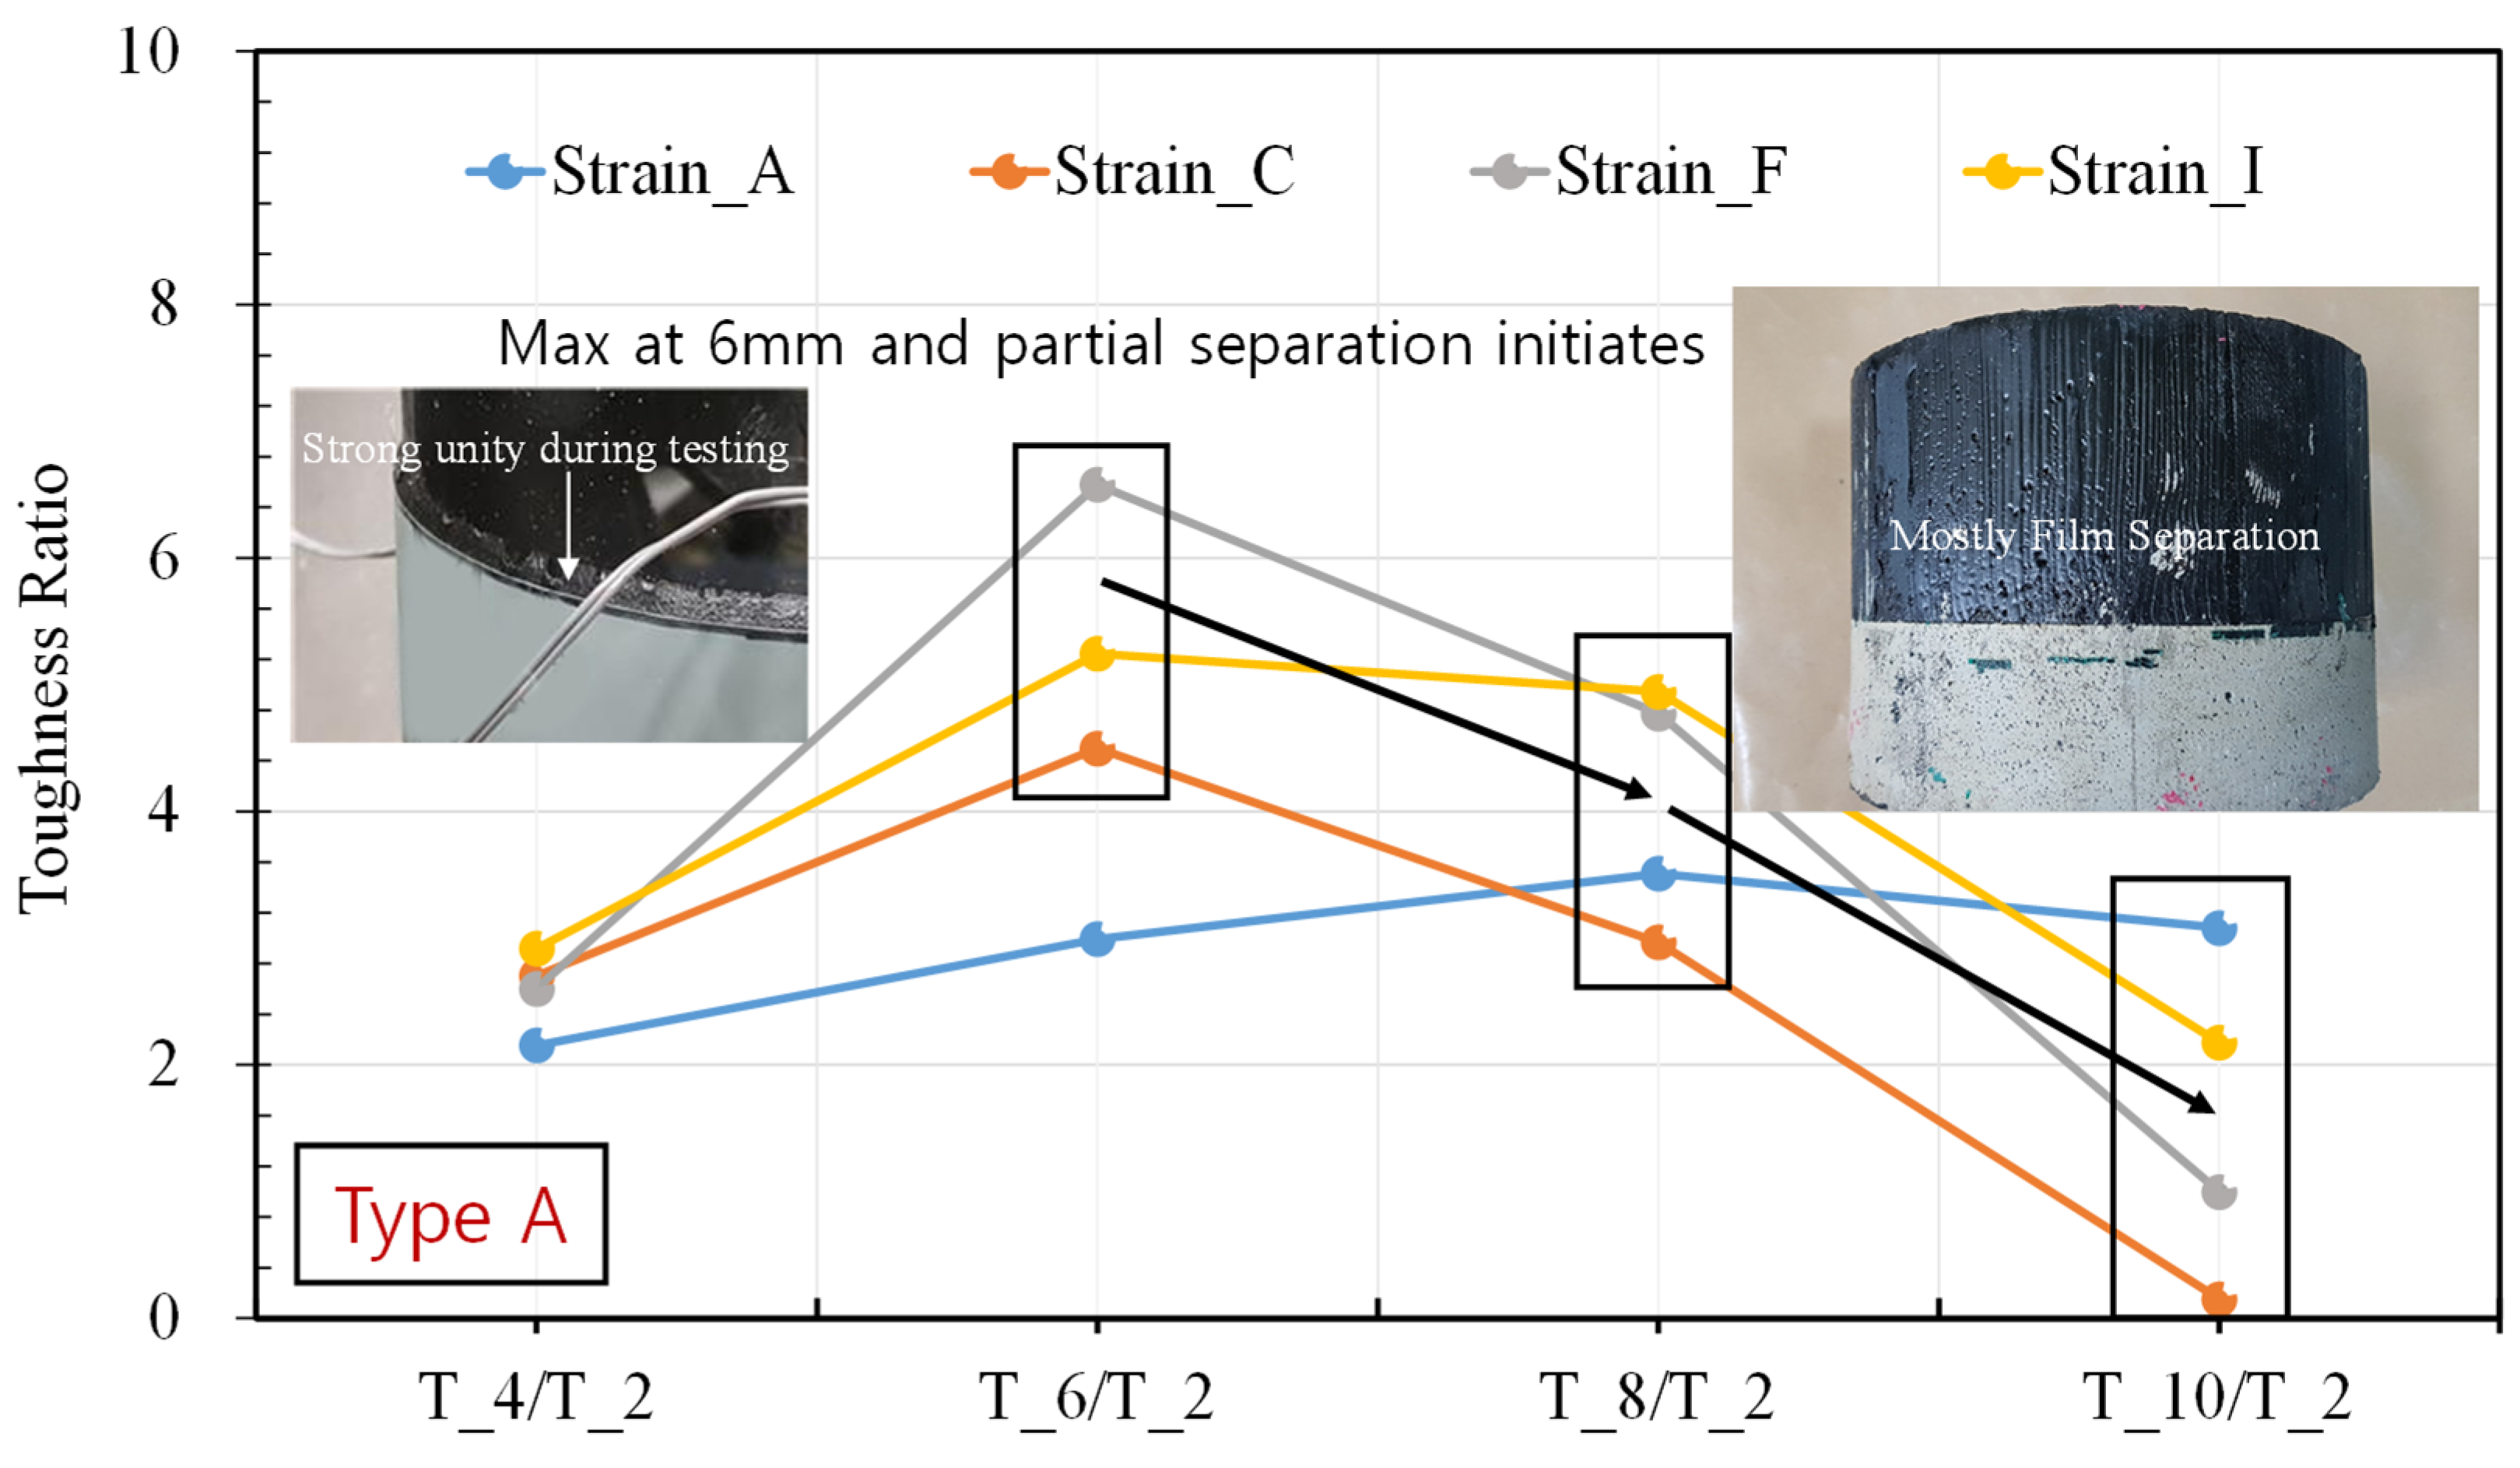
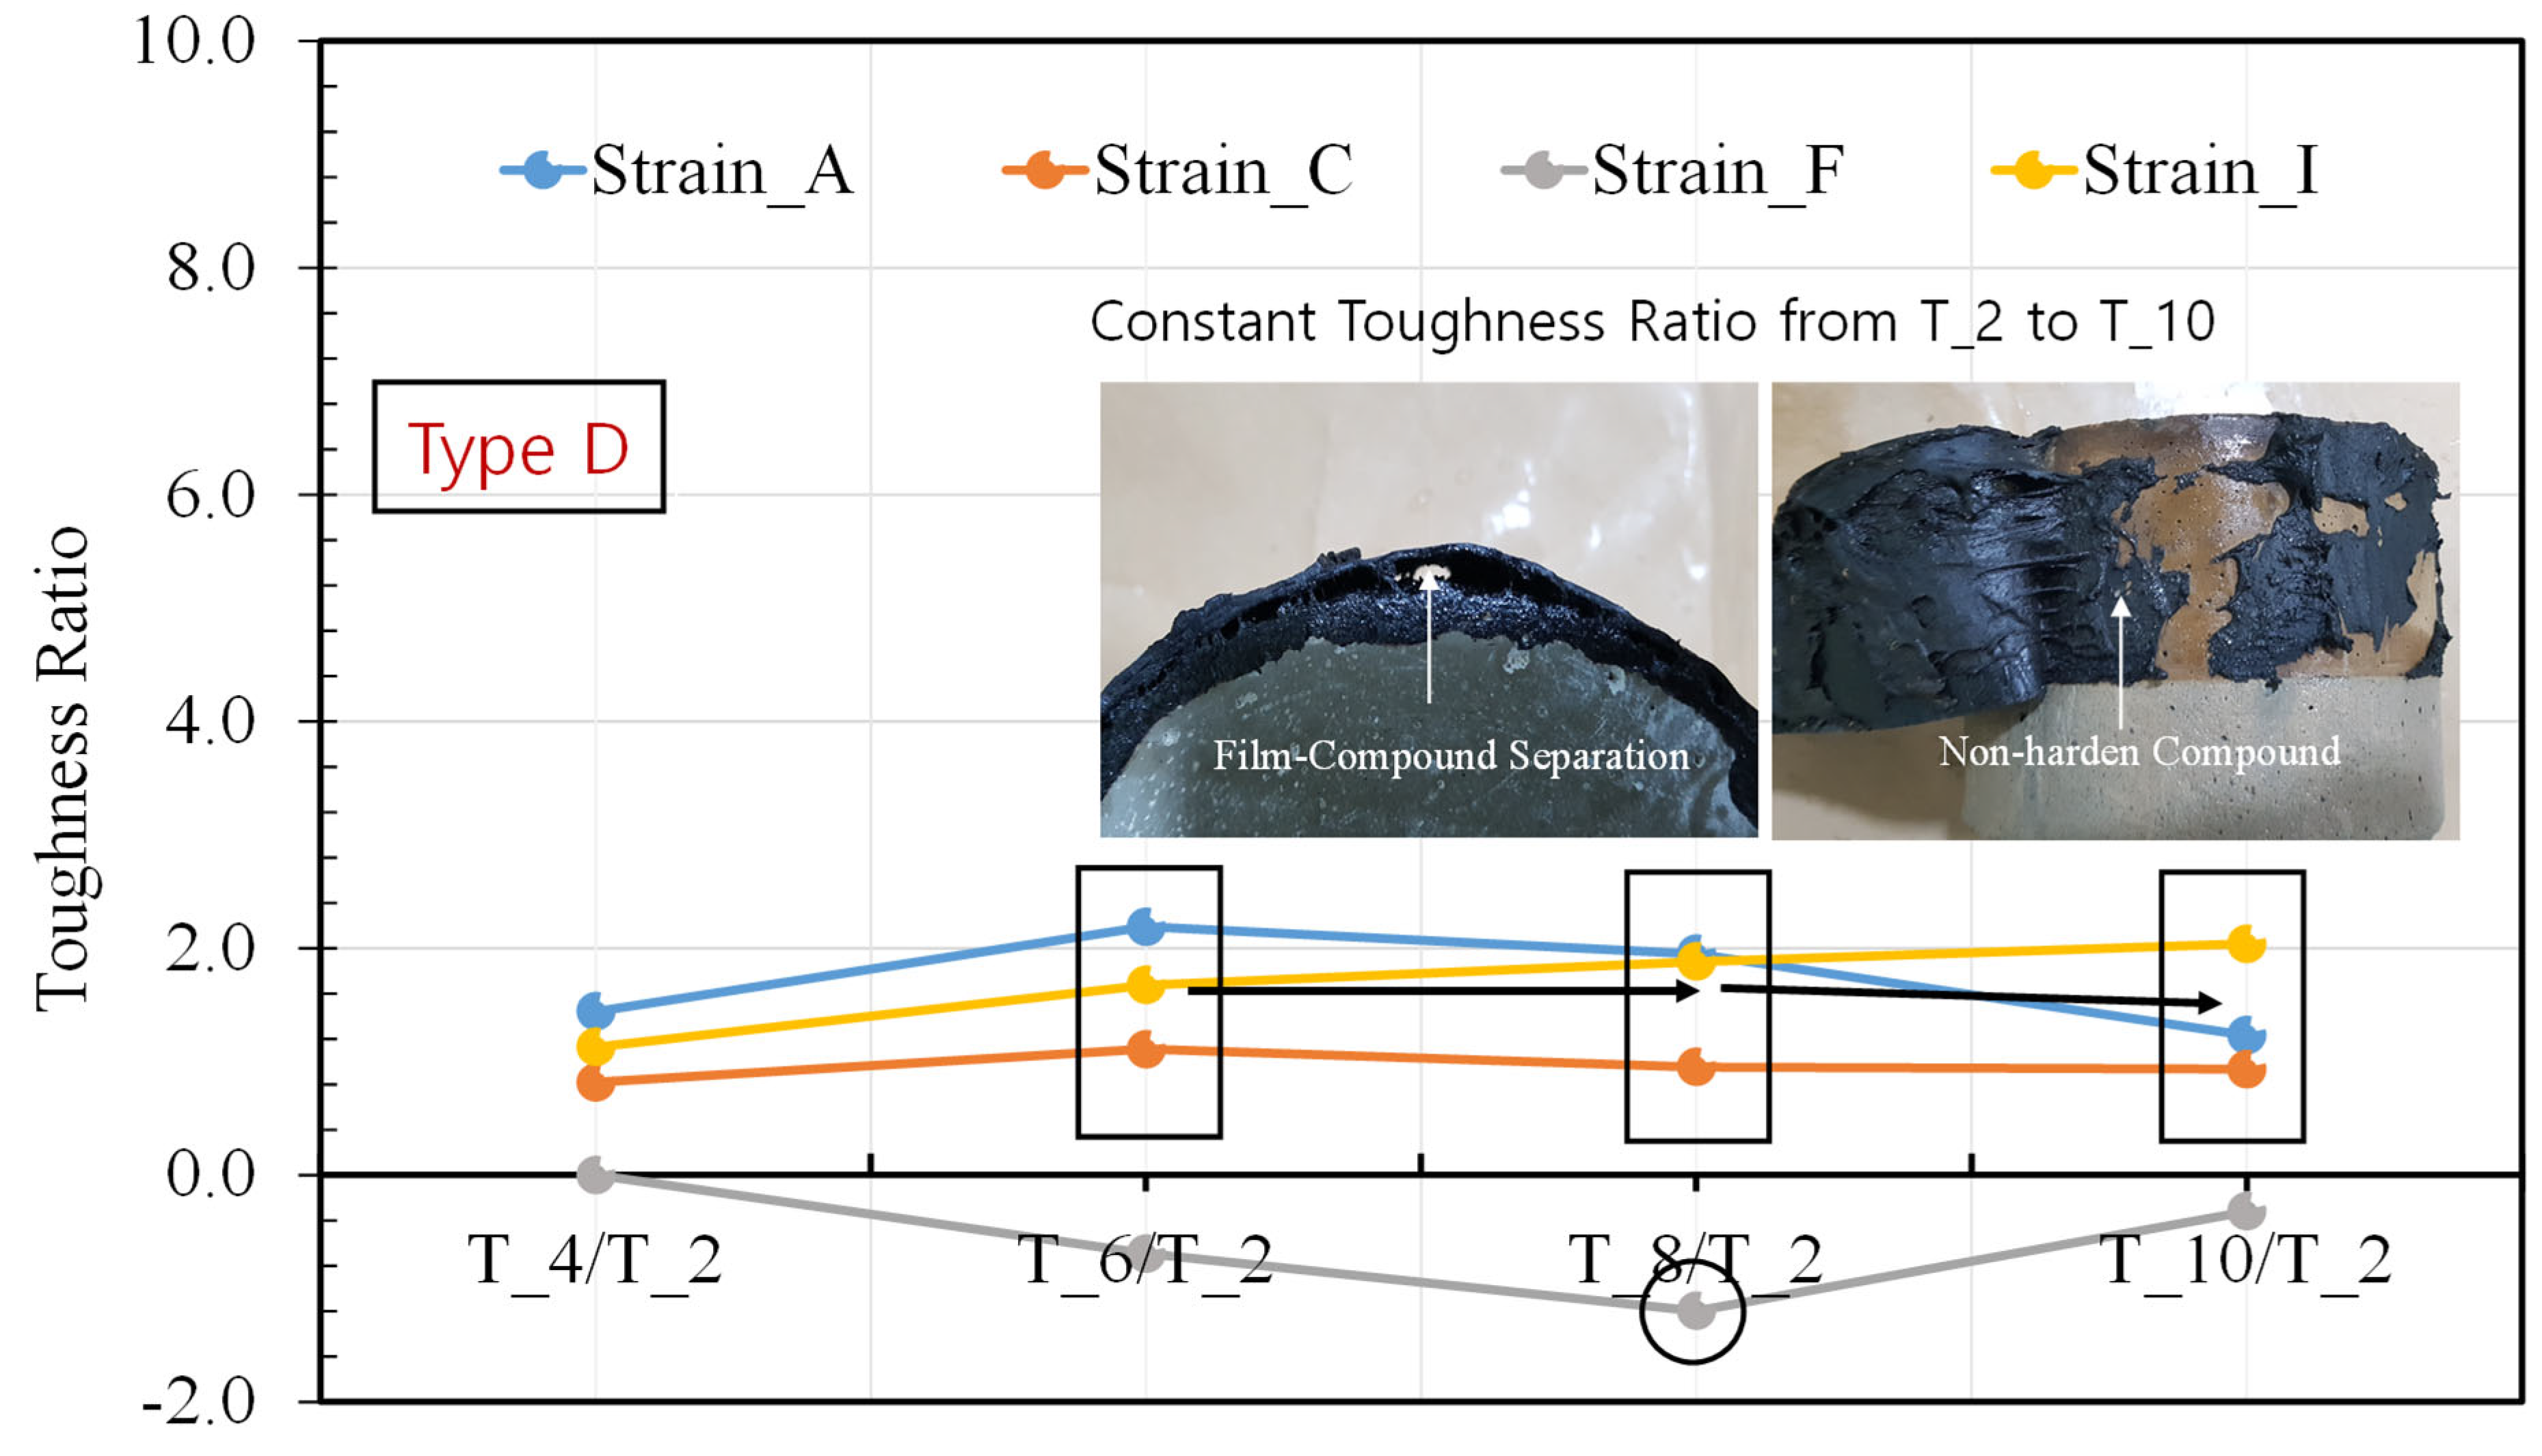
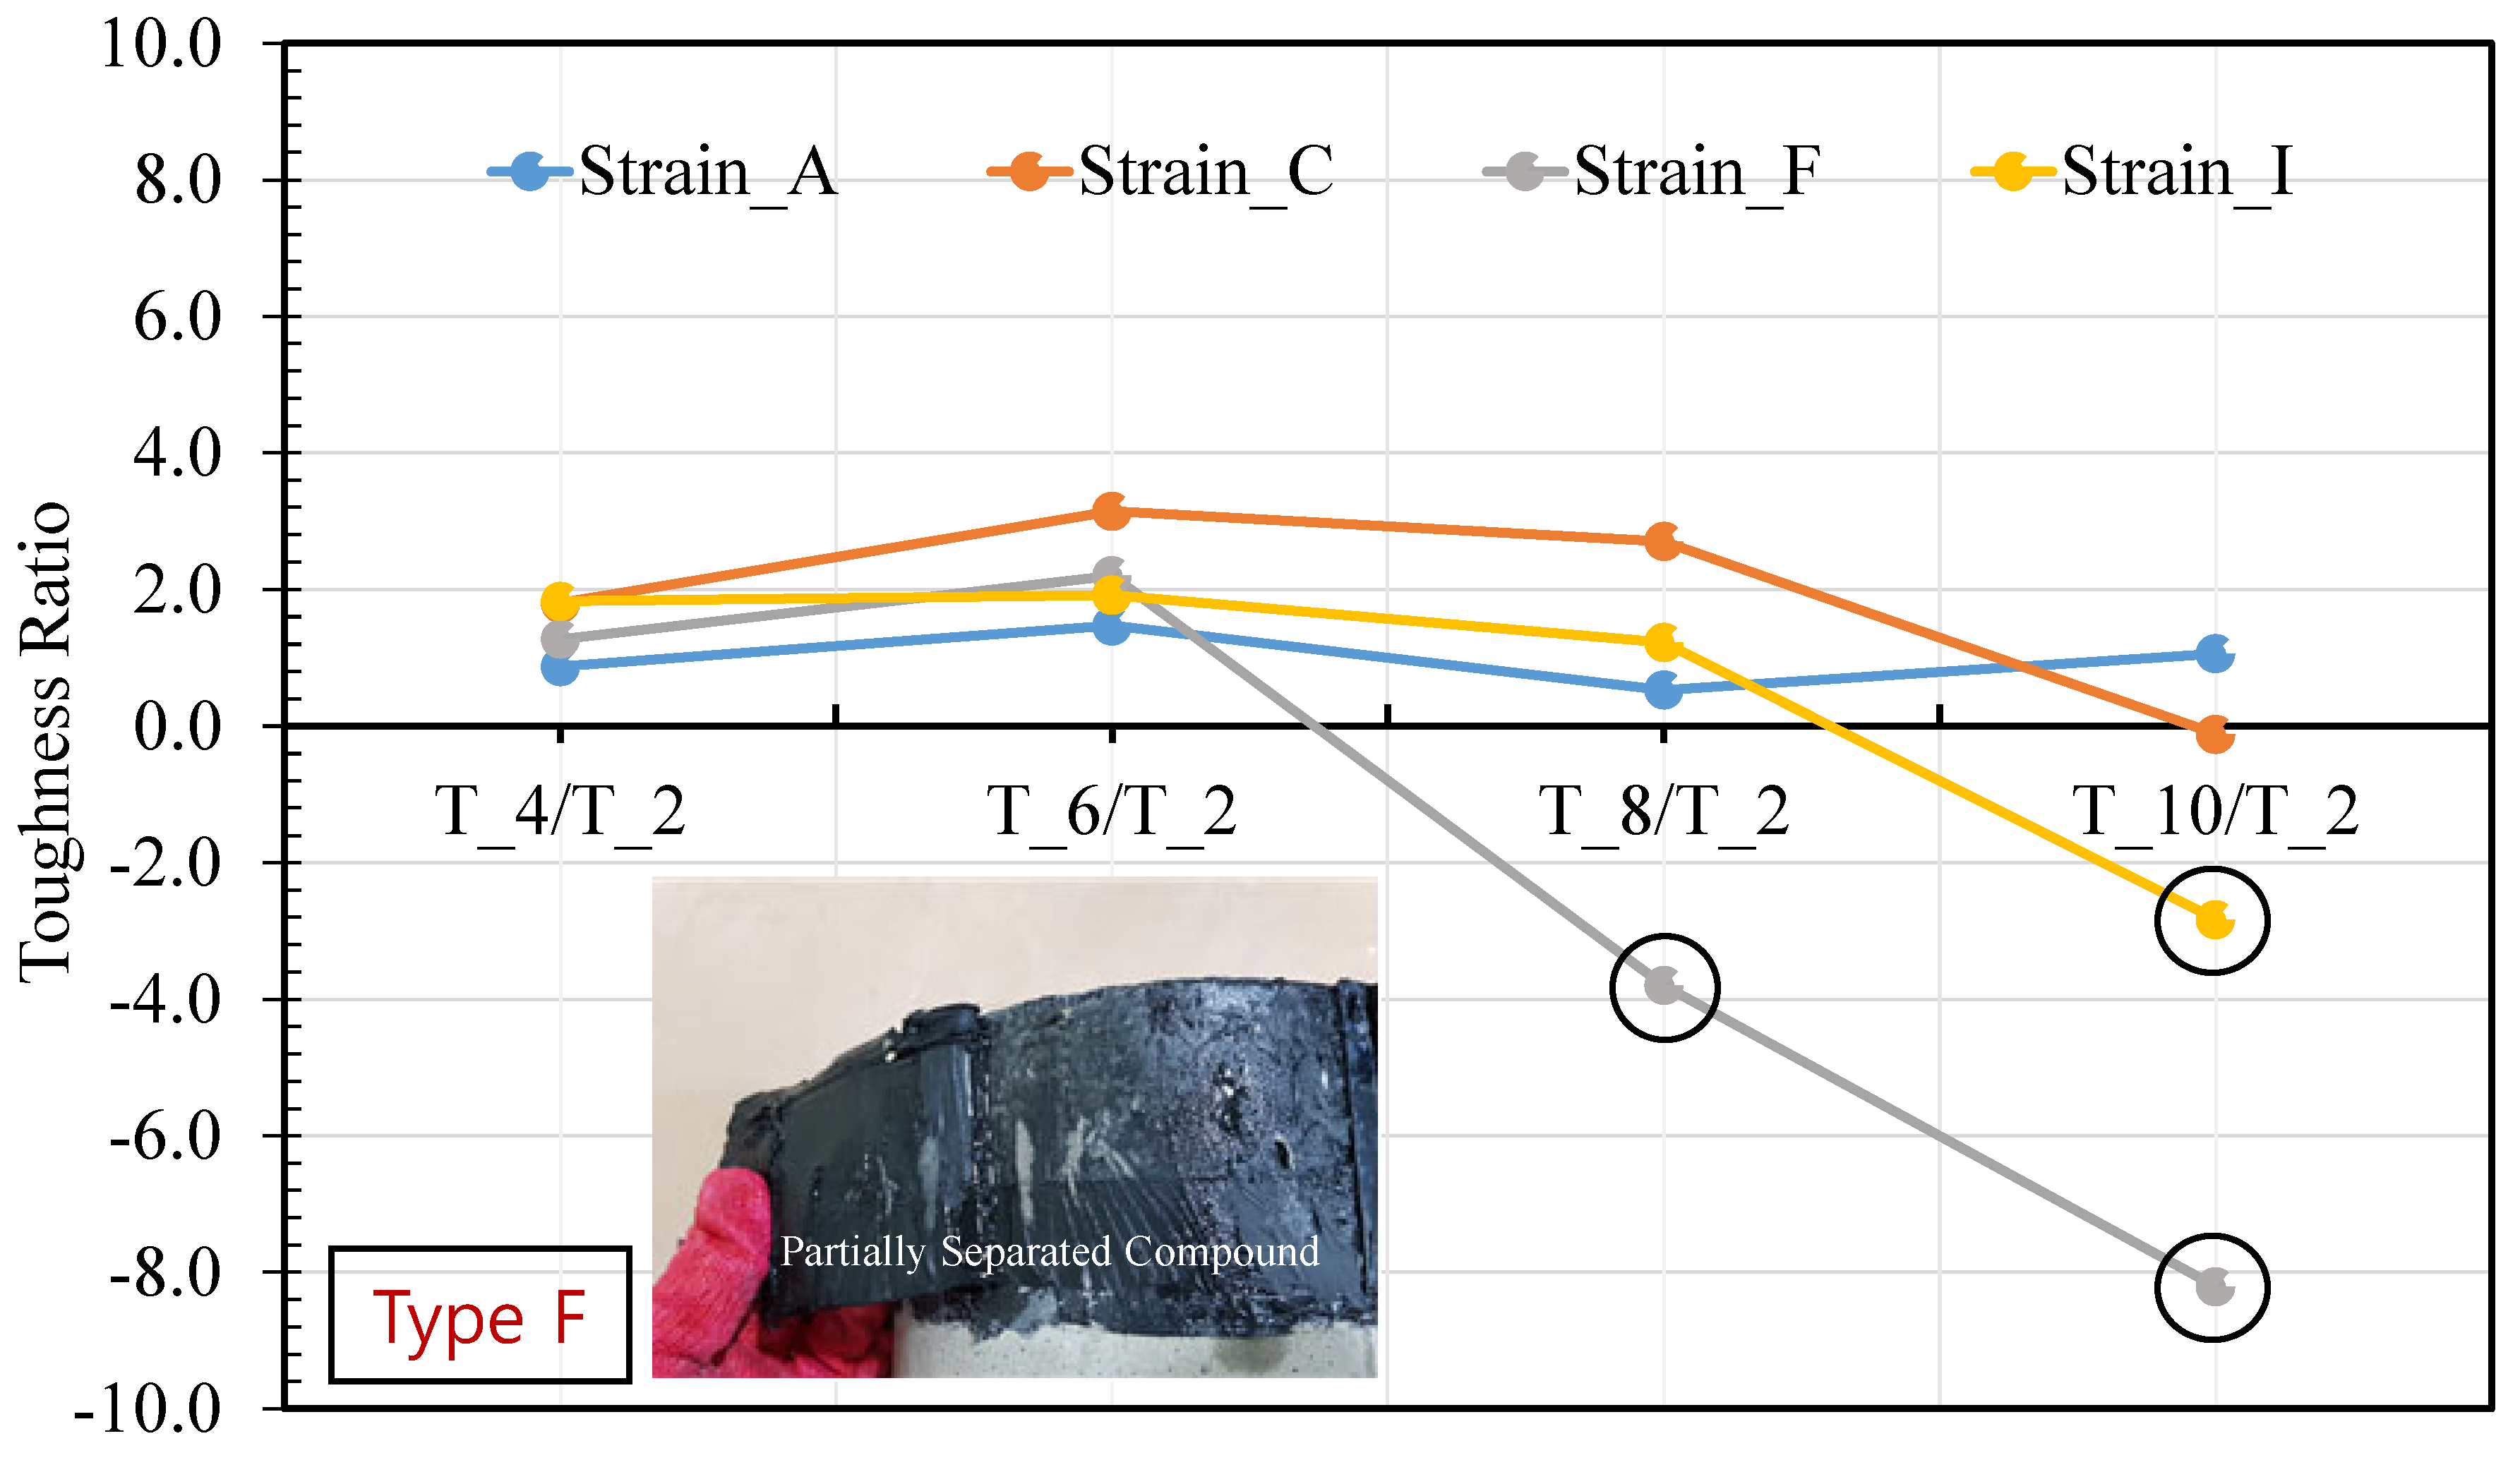
3.4. Toughness Properties

Depending on the type and characteristics of the internal materials that make up the waterproof sheet, the behavioral characteristics of the composite waterproof sheet in the interface can be generally classified into four types. Figure 19, Figure 20, Figure 21 and Figure 22 classify and organize representative behavioral changes in the experimental results of all eight composite waterproof sheets. Figure 19 shows a graph comparing the toughness results generated at 4 mm, 6 mm, 8 mm, and 10 mm based on the toughness at 2 mm as a result of a comparative analysis of the energy dispersion and absorption of Type A. Even if the cycling displacement increased after the energy dispersion reached its maximum at 6 mm, the toughness ratio (Part C, F, I) gradually decreased. After the maximum stress occurred at 6 mm, it is judged that the inside of the compound of interface 1 and 2 was separated (Figure 1), leading to a natural decrease in stress. It was confirmed that the film and the compound moved with strong unity during the test, and after the test, a considerable amount of the compound remained on the concrete surface. Figure 20 shows the results of a comparative analysis of the energy dispersion and absorption for Type D. The surface strain parts A, C, and I showed relatively low toughness ratios of less than 2, and there was no significant change even in the process of increasing the deformation width. In particular, strain_F showed a negative value, which is a characteristic of a compound with the characteristics of a high-viscosity seal, as confirmed in Figure 9, and is a result of a phenomenon of contraction in a specific part during tensile testing. During the test process, it is judged that the change in toughness on the surface of the waterproof sheet was small as stress absorption in the high-viscosity seal increased relatively due to separation from the waterproof sheet’s film part in interface 3 (Figure 1). In Figure 21, the toughness change of Type F is analyzed. It is shown that the toughness ratio of the strain parts A, C, F, and I generally increased up to 6 mm and then decreased after 6 mm. The strain A had a toughness ratio of 1 or less up to 10 mm, and the strains C, F, and I in the central part of the test body decreased to a toughness ratio close to or less than 0. In particular, in strain F, the decrease in the toughness ratio increased rapidly, and the final value dropped from −4 to −8. It is judged that this was caused by contraction in certain parts during tensile deformation due to internal material characteristics, as shown in Figure 9, or by the slowing elastic resilience due to the separation of the compound from the concrete surface. In Figure 22, after analyzing the Type G test specimen, a toughness change different from that of the previous specimen types is shown. The toughness ratio of the waterproof sheet tended to retain almost the same value up to 10 mm without significant variability. As a result of removing the waterproof sheet after the test, it was confirmed that the remaining compound fell neatly from the concrete surface, with little remaining.

4. Discussion

Concrete structures constructed underground must be constructed to be protected from contact with soil, groundwater, etc., so as to ensure long-term durability. In order to protect the long-term performance of concrete from external environments such as water, moisture, temperature changes, and cracks, the behavioral response of concrete at the bonding interface must vary depending on the characteristics of the composite waterproofing sheet attached to the concrete base. The eight types of composite waterproofing sheets used in this study differ in the type of cross-sectional composition and material thickness, but the results of repeated tensile tests show that they respond to three major tensile deformations at the concrete interface. The thickness of the compound varies from 1.35 mm (Type C) to a maximum of 3.5 mm (Type D) depending on the manufacturer, and it consists of two compound layers (Type F, G, H) using reinforcing materials. When the tensile behavior of the separated concrete layer with an artificial crack increased from 2 mm to a maximum of 10 mm, the response capabilities of the compounds at the bonding interface varied. Types A, B, and C of composite waterproofing sheet, each with one compound layer, showed relatively strong adhesion to concrete, and when the tensile width reached 6 mm, the maximum deformation was reached, after which then the deformation capacity gradually decreased. It was found that the degree of deformation was large in C and I, where the sensors were attached. Type D and E composite waterproofing sheets, composed of compounds with excellent viscosity and a property of not hardening after attachment, showed relatively low sensor strain rates on the surface during tensile deformation. Due to the compound’s property of not hardening after attachment to the concrete surface, it was confirmed that the tensile strain in the PE film corresponded to the tensile behavior with a very low strain rate of approximately 0.1 × 10⁻⁴. Types F, G, and H, with two compound layers separated by a reinforcing material, had strain rates of approximately 0.2 to 0.5 × 10⁻⁴ on the surface of the waterproofing sheets, and it was found that they had tensile deformation capacities within the range of compounds with non-hardening properties and compounds with hardening properties. It is judged that the deformation capacity was here strengthened as the reinforcement at interface 2 partially offset the stress energy generated at interface 1, which was the attachment surface, and then transferred it to the surface layer.

5. Conclusions

The eight composite waterproof sheets used in this study could be divided into three types of behavioral phenomena. The types and properties of the materials inside the waterproof sheet were different depending on the interfaces, and the stress transfer processes in the compound were different under cycling tensile testing as a result of the hardening or non-hardening compound’s properties. The results of analyzing the test data can be summarized as follows.
Types A, B, and C are composite waterproofing sheets in which high-adhesive asphalt is attached to a film made of high-density polyethylene (HDPE), and they have one compound layer (1.35–1.85 mm). During the tensile deformation process, they showed relatively strong bonding strength with the concrete surface and stress transfer to the sheet surface. The maximum tensile strain, maximum strain, and energy dissipation were the greatest at 6 mm, and they were shown to maintain strong adhesion (0.3 < DE/RE < 1.3) during the load restoration process. After the test, the waterproofing sheet was removed and observed, and it was confirmed that the film was cleanly separated from the compound.
For types D and E, the compound layer (1.35–3.5 mm) was configured in one layer, and the high-viscosity or non-hardening viscoelastic compound strongly adhered to the concrete surface, while the compound with ductility showed an ability to absorb a significant portion of the stress generated during tensile deformation internally. In the process of moving from 2 mm to 10 mm, it showed a low strain rate (0.1 × 10⁻⁴ or less) that was clearly different from those of other waterproofing sheets, and the range of energy dissipation and recovery ratio (−5 < DE/RE < 3) was the largest. Even after the waterproofing sheet was removed, traces of the compound remained on the concrete.
For Types F, G, and H, the material was a waterproofing sheet with two compound layers (2 mm to 2.9 mm) and with reinforcing material in the middle, produced via a waterproofing method that heats and melts the compound using a torch and attaches it to concrete. During the repeated tensile deformation process, the strain was 0.2 to 0.5 × 10⁻⁴, and the strain increased as the tensile deformation increased. In particular, the DE/RE ratio was the highest when moving to 8 mm, and the elastic recovery tended to be considerably slow because the compound shrank or separated in a specific part during the tensile deformation process.
The ability of a waterproof sheet composed of a composite material to prevent leakage when subjected to tensile deformation at the bonding surface of different heterogeneous materials was experimentally verified. The cross-section of the waterproof sheet is composed of multiple layers, so the role of each layer could not be evaluated in detail here. This is considered a limitation of the study. In future studies, the results derived in this experiment will be used to analyze the behavior of each layer via computer simulation.

Author Contributions

J.P. conceived and designed the experiments; B.K. and J.P. performed the experiments; J.P. and B.K. analyzed the data; B.K. and J.P. wrote the paper. All authors have read and agreed to the published version of the manuscript.

Funding

This research received no external funding.

Data Availability Statement

Data is contained within the article.

Acknowledgments

This work was supported by the Seoul National University of Science and Technology.

Conflicts of Interest

The authors declare no conflicts of interest. The sponsors had no role in the design, execution, interpretation, or writing of the study.

References

  1. Wang, Y.; Zhao, Z.; Qiang, H.; Wang, X.; Guo, J. Blast resisting responses and upgrading technology for an underground structure subjected to external explosions. Structures 2023, 56, 105055. [Google Scholar] [CrossRef]
  2. Cheng, Y.; Pan, D.; Chen, Q.; Huang, Y.; Zhang, D. Shaking table test on underground structure-soil-aboveground structure interaction. Tunn. Undergr. Space Technol. 2023, 140, 105300. [Google Scholar] [CrossRef]
  3. Li, G.; Zhang, H.; Wang, R.; Dong, Z.Q.; Yu, D.H. Seismic damage characteristics and evaluation of aboveground-underground coupled structures. Eng. Stuctures 2023, 283, 115871. [Google Scholar] [CrossRef]
  4. Lee, K.J. An analytical study on the patents substance of urban underground space development technology. J. Archit. Inst. Korea Struct. Constr. 2019, 35, 129–138. [Google Scholar]
  5. Lee, S.M.; Yoon, H.M. Actual Conditions and Utilization of Spill Groundwater in Seoul; The Seoul Institute: Seoul, Republic of Korea, 2019; Volume 275. [Google Scholar]
  6. Adagunodo, T.A.; Aremu, A.A.; Bayowa, O.G.; Ojoawo, A.I.; Adewoye, A.O.; Olonade, T.E. Assessment and health effects of radon and its relation with some parameters in groundwater sources from shallow aquifers in granitic terrains, southeastern axis of Ibadan, Nigeria. Groundw. Sustain. Dev. 2023, 21, 100930. [Google Scholar] [CrossRef]
  7. Song, J.Y.; Kwak, K.S.; Oh, S.K. Mechanism of water leakage and need for waterproofing in concrete structure. Archi. Inst. Korea 2012, 24, 18–23. [Google Scholar]
  8. Laxman, K.C.; Tabassum, N.; Ai, L.; Cole, C.; Ziehl, P. Automated crack detection and crack depth prediction for reinforced concrete structures using deep learning. Constr. Build. Mater. 2023, 370, 130709. [Google Scholar] [CrossRef]
  9. Deng, H.S.; Fu, H.L.; Chen, W.; Zhao, Y.B.; Yi, H.D. Study on deterioration, cracking mechanism and treatment measures of plain concrete lining with cold joints in high-speed railroad tunnel. Case Stud. Constr. Mater. 2023, 18, e01895. [Google Scholar] [CrossRef]
  10. Zhan, X.; Zhang, H.; Wang, P.; Ren, Q.; Zhang, D.; Yan, L.; Zhu, X. Flow-field fitting method applied to the detection of leakages in the concrete gravity. J. Appl. Geophys. 2023, 208, 104896. [Google Scholar]
  11. Song, X.F.; Wei, J.F.; He, T.S.H. A method to repair concrete leakage through cracks by synthesizing super-absorbent resin in situ. Constr. Build. Mater. 2009, 23, 386–391. [Google Scholar] [CrossRef]
  12. Lee, J.H.; Song, J.Y.; Oh, S.K. Leakage situation and main leakage areas of domestic residential building underground parking lots. J. Korean Recycl. Constr. Resour. Inst. 2016, 4, 496–503. [Google Scholar]
  13. Han, Y.J.; Oh, K.W.; Kim, S.R.; Kim, B.I.; Oh, S.K. Consumer awareness analysis of residential building underground structure leakage prevention measurements. J. Korean Recycl. Constr. Resour. Inst. 2016, 4, 379–387. [Google Scholar] [CrossRef]
  14. Sang, Y.C. Groundwater obstruction and countermeasures for groundwater discharge from subway in Seoul, Korea. J. Geol. Soc. Korea 2010, 46, 61–72. [Google Scholar]
  15. Mossberg, A.; Nilsson, D.; Frantzich, H. Evaluating new evacuation systems related to human behavior using a situational awareness approach- A study of the implementation of evacuation elevators in an underground facility. Fire Saf. J. 2022, 134, 103693. [Google Scholar] [CrossRef]
  16. Sun, W.; Iiu, H.; Zhang, W.; Iiu, S.; Han, L. Determination of groundwater buoyancy reduction coefficient in clay: Model tests, numerical simulations and machine learning methods. Undergr. Space 2023, 13, 228–240. [Google Scholar] [CrossRef]
  17. Matias, S.R.; Ferreira, P.A. The role of railway traffic and extreme weather on slab track long-term performance. Constr. Build. Mater. 2022, 322, 126445. [Google Scholar] [CrossRef]
  18. Song, J.Y.; Oh, K.W.; Kim, B.; Oh, S.K. Performance evaluation of waterproofing membrane systems subject to the concrete joint load behavior of below-grade concrete structures. Appl. Sci. 2017, 7, 1147. [Google Scholar] [CrossRef]
  19. Kim, D.B.; Choi, S.Y.; Park, J.S.; He, X.Y.; Oh, S.K. Oil Leakage evaluation for selection of emulsion-based non-curable synthetic polymer eubberized gel (ENC-SPRG) as waterproofing material in underground structures. Materials 2019, 12, 3816. [Google Scholar] [CrossRef]
  20. Kim, S.Y.; Oh, S.K.; Kim, B. Artificial-crack-behavior test evaluation of the water-leakage repair materials used for the repair of water-leakage cracks in concrete Structures. Appl. Sci. 2016, 6, 253. [Google Scholar] [CrossRef]
  21. Chung, C.P.; Choi, S.Y.; Kim, D.B.; Park, W.G.; Kim, B.; Oh, S.K. Evaluation of sheet-coated composite waterproofing joint types by analysis of tensile strength change and concrete displacement resistance testing under environmental degradation. Materials 2020, 13, 2120. [Google Scholar] [CrossRef]
  22. Cho, B.H.; Nam, B.H.; Seo, S.; Kim, J.; An, J.; Youn, H. Waterproofing performance of waterstop with adhesive bonding used at joints of underground concrete structures. Constr. Build. Mater. 2019, 221, 491–500. [Google Scholar] [CrossRef]
  23. Zhang, H.; Gao, P.; Zhang, Z.; Pan, Y. Experimental study of the performance of a stress-absorbing waterproof layer for use in asphalt pavements on bridge decks. Constr. Build. Mater. 2020, 254, 119290. [Google Scholar] [CrossRef]
  24. Pelz, U.; Karlovsek, J. Spray-applied waterproofing membranes in tunneling: Application and research directions in Australia. Tunn. Undergr. Space Technol. 2022, 122, 104364. [Google Scholar] [CrossRef]
  25. Xia, H.; Lu, C.; Yang, H.; Song, L.; Geng, J.; Cui, Z.; Niu, Y.; Sun, Y. Preparation and performance of durable waterproof adhesive layer for steel bridge deck based on self-stratification effect. Constr. Build. Mater. 2023, 366, 130133. [Google Scholar] [CrossRef]
  26. Muhammad, N.Z.; Keyvanfar, A.; Majid, M.Z.A.; Shafaghat, A.; Mirza, J. Waterproof performance of concrete: A critical review on implemented approaches. Constr. Build. Mater. 2015, 101 Pt 1, 80–90. [Google Scholar] [CrossRef]
  27. Kim, S.Y.; Kim, M.G.; Oh, S.K. A study on the seismic performance design of waterproofing materials applied single-side walls on underground structures. Korea Inst. Struct. Maint. Insp. 2020, 24, 43–50. [Google Scholar]
  28. Oh, S.K.; Lee, J.Y.; Choi, S.M. An experimental study on the highly adhesive composite waterproofing sheet using reclaimed rubber. J. Archit. Inst. Korea 2014, 16, 279–284. [Google Scholar]
  29. Kim, M.G.; Lee, S.W.; Kim, S.Y.; Oh, S.K. Construction verification evaluation for securing the field quality of composite membrane waterproofing material. Korea Inst. Build. Constr. 2021, 21, 87–95. [Google Scholar]
  30. Kim, S.Y.; Park, J.S.; Oh, S.K. Verification and improvement of structural behavior response performance evaluation method for the standard establishment of adhesive composite waterproofing sheets. Korea Inst. Struct. Maint. Insp. 2021, 21, 377–386. [Google Scholar]
  31. Julie Anne, B. dos Santos; Renata Monte. Evaluation of the creak bridging ability of waterproofing membranes using indirect tensile test and digital image correlation. J. Build. Eng. 2022, 45, 103667. [Google Scholar]
  32. Wee, J.W.; Chudnvsky, A.; Choi, B.H. Crack layer modeling of overload-induced slow crack growth retardation of high-density polyethylene. Inter. J. Mech. Sci. 2023, 257, 108546. [Google Scholar] [CrossRef]
  33. Lourmpas, N.; Bailas, K.; Papanikos, P.; Lekkas, D.F.; Kyriakakis, E.C.; Efthimiadou, E.K.; Alexopoulos, N.D. Assessing the weathering-induced degradation on the structural integrity of high-density polyethylene. Mater. Today Proc. 2023, 93, 844–849. [Google Scholar] [CrossRef]
  34. Shi, R.; Ma, J.; Song, X.; Zhan, B.; Xu, X.; Zhao, S.; He, J. Composition effects on thermodynamic properties and interfacial structure in styrene-butadiene rubber: A combined experimental and simulation study. Chem. Eng. Sci. 2023, 275, 118750. [Google Scholar] [CrossRef]
  35. Yao, H.; Wang, Q.; Zhang, Z.; Zhou, X.; Cao, Y. Effect of styrene-butadiene-styrene triblock copolymer structure on the rheological properties of high content SBS polymer modified asphalts. Constr. Build. Mater. 2023, 400, 132738. [Google Scholar] [CrossRef]
  36. Wei, K.; Cao, X.; Wu, Y.; Cheng, Z.; Tang, B.; Shan, B. Dynamic chemistry approach for self-healing of polymer-modified asphalt: A state-of-the-art review. Constr. Build. Mater. 2023, 403, 133128. [Google Scholar] [CrossRef]
Figure 1. Composition of composite waterproof sheet series.
Buildings 15 01724 g001
Figure 2. Composition of test specimen.
Buildings 15 01724 g002
Figure 3. Preparation for test specimen.
Buildings 15 01724 g003
Figure 4. Strain gauge attachment location.
Buildings 15 01724 g004
Figure 5. Strain comparisons of Type A.
Buildings 15 01724 g005
Figure 6. Strain comparisons of Type D.
Buildings 15 01724 g006
Figure 7. Strain comparisons of Type E.
Buildings 15 01724 g007
Figure 8. Strain comparisons of Type G.
Buildings 15 01724 g008
Figure 9. Typical type of strain-cycling displacement curve.
Buildings 15 01724 g009
Figure 10. DE/RE comparisons of Type A.
Buildings 15 01724 g010
Figure 11. DE/RE comparisons of Type D.
Buildings 15 01724 g011
Figure 12. DE/RE comparisons of Type E.
Buildings 15 01724 g012
Figure 13. DE/RE comparisons of Type G.
Buildings 15 01724 g013
Figure 14. DE/RE comparisons of all types for 2 mm repeated displacement (15 times).
Buildings 15 01724 g014
Figure 15. DE/RE comparisons of all types for 4 mm repeated displacement (15 times).
Buildings 15 01724 g015
Figure 16. DE/RE comparisons of all types for 6 mm repeated displacement (15 times).
Buildings 15 01724 g016
Figure 17. DE/RE comparisons of all types for 8 mm repeated displacement (15 times).
Buildings 15 01724 g017
Figure 18. DE/RE comparisons of all types for 10 mm repeated displacement (15 times).
Buildings 15 01724 g018
Figure 19. Toughness ratio change for Type A at maximum stress-generating parts.
Buildings 15 01724 g019
Figure 20. Toughness ratio change for Type D at maximum stress-generating parts.
Buildings 15 01724 g020
Figure 21. Toughness ratio change for Type F at maximum stress-generating parts.
Buildings 15 01724 g021
Figure 22. Toughness ratio change for Type G at maximum stress-generating parts.
Buildings 15 01724 g022
Table 1. Composite waterproofing sheet.
TypeCompositionMaterials PropertyAdhesive Strength
(N/mm2)
Tensile Performance
(N/mm2, %)
AFilm (0.15 mm) + Compound (1.85 mm)-Film: high-density polyethylene (HDPE)
-Compound: high-adhesion asphalt containing butyl and latex, etc.
0.75Tensile strength6.2
Elongation643
BFilm (0.15 mm) + Compound (1.65 mm)1.80Tensile strength6.2
Elongation597
CFilm (0.15 mm) + Compound (1.35 mm)1.65Tensile strength5.3
Elongation576
DFilm (0.05 mm) + Compound (1.0 mm) +Compound (2.5 mm)-Film: polyethylene (PE)
-Improved asphalt waterproofing sheet + high-viscosity sealing materials (compound)
1.00Tensile strength13.4
Elongation220
EFilm (2.0 mm) + Compound (1.35 mm)-Film: polyethylene (PE)
-Improved asphalt waterproofing sheet + non-hardening seal (compound)
Buildings 15 01724 i0010.10Tensile strength14.1
Elongation429
FFilm (0.05 mm) + Compound (1.45 mm) +
Reinforced Material (0.1 mm) +Compound (1.45 mm)
-Film: polyethylene (PE)
-Compound: high-adhesion asphalt containing butyl and latex, etc.
-Reinforced materials: polypropylene connecting and reinforcing two compound layers
-Attachment: with a torch
2.20Tensile strength17.3
Elongation576
GFilm (0.05 mm) + Compound (1.0 mm) +Reinforced Material (0.1 mm) +Compound (1.0 mm)1.60Tensile strength14.1
Elongation429
HFilm (0.05 mm) + Compound (1.2 mm) +Reinforced Material (0.1 mm) +Compound (1.2 mm)1.80Tensile strength16.8
Elongation839
Table 2. Difference between dissipated and recovering energy.
Cycling
Displacement
DE-RE (×10−4)Specimen Types
A BCDEFGHIJ
20.0520.118−0.1370.0070.144−0.700−0.3790.0590.020.105Type A
40.015−0.0390.619−0.046−0.070−1.7490.797−0.1320.023−0.124
6−0.034−0.170−1.774−0.119−0.255−5.425−2.6740.034−0.2380.034
8−0.0090.178−0.0270.2320.4370.50.5710.1341.8290.062
10−0.078−0.0650.352−0.034−0.194−0.437−0.4060.102−1.2130.115
2−0.0010.1211.1230.1460.0960.6860.1070.030.9790.077Type B
4−0.047−0.142−0.2280.043−0.031−0.064−0.0170.010.138−0.024
60.0530.1981.4270.1540.0890.280.0780.0240.43−0.003
80.0520.0870.12−0.033−0.001−0.334−0.0100.015−0.1340.001
100.1470.08−0.0220.021−0.013−0.024−0.0330.006−0.067−0.021
20.0410.0270.0410.022−0.006−0.1740.0080.0260.1150.028Type C
40.030.0890.4780.0690.041−0.0320.0270.0620.790.045
60.1130.0210.0130.0490.0130.467−0.0040.040.6550.063
8−0.0100.002−0.3140.015−0.0310.071−0.0470.0120.5180.021
100.0060.09−0.1170.0780.0560.4910.0960.089−4.3940.08
2−0.0560.004−0.0130.013−0.0270.0020.0020.02−0.0310.007Type D
4−0.055−0.028−0.006−0.094−0.0020.0180.016−0.0420.002−0.055
60.022−0.0140.0170.022−0.0240.014−0.083−0.0300.0080.005
8−0.002−0.0060.0030.0010.013−0.0040.051−0.0030.0050.008
100.035−0.0020.006−0.008−0.017−0.01200.0060.036−0.019
2−0.005−0.0080.0070.0010−0.0030−0.003−0.0030.005Type E
40.0010.0030.0010.003−0.0060.0040.0010.0170.0020.01
60.00500.0040.0010.0420.0050.002−0.037−0.0020.002
8−0.034−0.0510.0480.0150.0220.030.014−0.0340.0520.031
10−0.007−0.053−0.050−0.003−0.0540.0130.001−0.060−0.013−0.009
2−0.1410.05−0.0780.045−0.001−0.0590.0120.068−0.109−0.001Type F
4−0.069−0.008−0.0030.012−0.004−0.02700.062−0.042−0.005
60.031−0.001−0.266−0.016−0.008−0.118−0.0030.0880.0460.004
8−0.010−0.0150.033−0.00300.2610.002−0.018−0.1760.015
10−0.016−0.0240.07−0.053−0.0260.203−0.037−0.0100.2190.005
20.0370.0190.1050.0080.02−0.020−0.0040.0050.10.001Type G
40.0530.013−0.098−0.0190.039−0.173−0.028−0.016−0.255−0.020
60.0390.003−0.251−0.0020.013−0.270−0.039−0.008−0.219−0.032
80.1030.013−0.305−0.028−0.002−0.412−0.0590.009−0.276−0.053
100.093−0.028−0.400−0.053−0.027−0.291−0.080−0.008−0.450−0.096
20.0260.059−0.0580.0280.031−0.0510.001−0.0310.0540.001Type H
40−0.026−0.086−0.0140.02−0.104−0.0340.017−0.1840.016
6−0.018−0.009−0.115−0.011−0.007−0.0750.01−0.020−0.004−0.016
80.0320.045−0.227−0.0600.002−0.230−0.0530.051−0.1720.003
100.0050.010−0.084−0.008−0.095−0.042−0.0870.109−0.045
Table 3. Ratio between dissipated and restoring energy.
Cycling DisplacementDE/RE (×10−4)Specimen Types
ABCDEFGHIJ
21.071.050.991.001.080.800.861.031.001.07Type A
41.010.991.020.990.980.811.250.971.000.97
60.980.980.970.980.950.770.661.010.991.01
81.001.021.001.051.091.031.111.021.041.01
100.970.991.230.990.940.870.911.020.941.02
20.991.351.491.351.321.591.471.101.431.19Type B
40.750.790.961.050.950.980.971.021.020.97
61.191.281.331.181.151.121.141.041.061.00
81.121.081.010.971.000.910.991.020.991.00
101.381.071.001.020.981.000.941.010.990.97
21.431.061.021.080.980.781.031.061.051.09Type C
41.241.191.231.211.110.961.091.131.251.13
61.481.021.001.071.021.170.991.051.091.10
80.961.000.911.020.951.030.921.011.071.03
101.021.120.961.121.101.171.211.120.831.13
20.781.400.791.270.811.051.031.790.741.25Type D
40.850.070.880.090.990.60−3.670.141.02−5.00
61.05−0.101.33−0.310.940.560.592.771.050.95
81.001.431.060.981.051.10−2.621.051.030.95
101.131.131.120.000.933.001.000.921.191.10
20.840.891.221.141.000.921.000.980.931.33Type E
41.011.011.011.500.971.131.071.051.031.40
61.051.001.041.061.221.121.110.900.981.05
80.720.881.381.651.081.811.600.921.321.75
100.950.840.410.810.761.571.060.840.920.61
20.431.740.861.350.980.641.091.400.680.98Type F
40.630.971.001.040.970.861.001.300.920.96
61.131.000.850.950.950.670.991.141.091.03
80.900.951.020.991.000.591.010.940.601.10
100.920.870.260.830.740.830.850.970.761.04
21.201.211.201.151.160.950.961.081.111.01Type G
41.251.090.880.731.240.690.770.830.830.86
61.151.010.690.971.070.540.660.950.830.79
81.491.070.640.550.990.320.501.050.790.71
101.350.860.55−0.040.880.420.390.960.690.54
21.561.490.871.271.380.871.010.811.091.01Type H
41.000.920.850.931.080.780.741.100.741.11
60.930.980.810.950.980.861.110.920.990.92
81.141.100.520.741.010.440.631.200.741.02
101.031.030.000.580.960.580.660.681.310.77
Disclaimer/Publisher’s Note: The statements, opinions and data contained in all publications are solely those of the individual author(s) and contributor(s) and not of MDPI and/or the editor(s). MDPI and/or the editor(s) disclaim responsibility for any injury to people or property resulting from any ideas, methods, instructions or products referred to in the content.

