Abstract
Currently, there are many infrastructures for which these design service lives are expired. These lifespans have been extended through retrofitting and strengthening. Usually, the existing reinforced concrete (RC) structures are strengthened by applying steel plate bonding and concrete enlargement methods. However, since fiber-reinforced polymer (FRP) composite materials have properties that are better than those of steel and concrete materials, i.e., being light weight, with anticorrosive material, a high ratio of strength to weight, and better workability, FRP sheet bonding methods for RC members have been developed, and practical applications have been gradually increased worldwide, statically. The methods may also have some potential to strengthen the members under impact and blast loading. In this paper, to rationally improve the impact resistance of RC beams under flexure, beams were strengthened by bonding an FRP sheet to the bottom tension side. Then, low-velocity impact loading tests (hereafter referred to as impact loading tests) using a 300 kg steel weight were carried out on the beams strengthened with carbon FRP (CFRP) sheets of different areal masses to investigate the failure mode at the ultimate state of the beams, in which the areal mass is physically similar to the amount of the sheet reinforcing RC beams and hereafter referred to as the sheet volume. Two sheet volumes (one is an areal mass of 300 g/m2 having a 0.17 mm thickness and the other is of 600 g/m2 having a 0.33 mm thickness) were compared, and two static failure modes, concrete crushing-intermediate crack (IC) debonding and premature IC debonding, were observed. The following results were obtained from this study: taking a static calculated moment ratio My/Mu of the rebar yield-moment My to the ultimate moment Mu for each beam, in the case of the beams having an My/Mu (=0.67) larger than 0.65 that went through static failure in the concrete crushing-IC debonding mode, the beams failed in sheet rupturing mode subjected to an impact load. When the sheet volume was comparatively large and a static calculated moment ratio My/Mu (=0.6) was less than 0.65, the beams collapsed in the premature IC debonding mode under not only static but also impact loading, and the impact resistance of the beams was enhanced with an increasing sheet volume; this increase was greater in the impact loading case than in the static loading case.
1. Introduction
Today, due to financial issues of owners, not much progress has been made in rebuilding infrastructure for which the design service life has expired, and the problem is increasing year by year. Globally, the lifespans of these structures may be assumed to have been extended through retrofitting and strengthening. In Japan, after the Hyogoken-Nanbu earthquake that occurred on 17 January 1995, bridges were strengthened to upgrade the earthquake resistance nationwide. Usually, the existing RC structures are strengthened by applying steel plate bonding and concrete enlargement methods. However, the former method has some drawbacks: awkward handling of heavy steel plates, which are not easily fit into specific places in situ, and corrosion. The latter method also affects the earthquake resistance of the structure by increasing the self-weight.
FRP composite materials, as alternatives, have properties better than those of steel and/or concrete materials, including light weight, anticorrosive material, a high ratio of strength to weight, a high tensile modulus, and comparatively easy applications. Research on and the development of FRP applications in the retrofitting and strengthening of RC members have been encouraged since the 1990s. Practical applications have gradually increased worldwide.
Focusing on the strengthened RC beams in flexure with bonding FRP sheets to the tension-side surface (hereafter referred to as FRP- strengthened beams) subjected to static load, Ritchie et al. [1] conducted static loading tests on RC beams with glass FRP (GFRP), aramid FRP (AFRP), and CFRP plates bonded to the tension side. Saadatmanesh and Ehsami [2] experimentally confirmed that the load-bearing capacity (hereafter referred to as bearing capacity) of rectangular and T-shaped RC beams can be substantially increased and the crack width can be decreased by bonding GFRP plates to their tension flanges. Triantafillou and Plevris [3] identified all the failure mechanisms of the FRP-strengthened beams under flexural loading. These mechanisms include compressive failure, FRP debonding, and, for RC beams that contain steel reinforcing bars (rebars), rebar yielding-FRP rupturing and rebar yielding-concrete crushing. Sharif et al. [4] experimentally demonstrated that the strength in flexure and ductility of pre-cracked RC beams can be upgraded by bonding GFRP plates to the lower surface and anchoring the plate ends using the I-jacket method rather than the steel anchor bolt method. Experiments by Arduini and Nanni [5] showed that the performance in flexure of pre-cracked RC beams reinforced by bonding CFRP sheets is not significantly different from that of strengthened undamaged RC beams. The experimental and numerical results of Rahimi and Hutchinson [6] indicated that the failure mechanism of cover debonding of FRP plates from the tensile surface of RC beams (similar to that of IC debonding described below) is controlled by a specified principal stress at the bonding surface between the concrete and FRP plate.
Chen and Teng [7] developed a simple and rational model for predicting the anchorage strength for FRP and/or steel plates bonded to a concrete surface considering an existing fracture mechanics analysis and experimental results. Smith and Teng [8,9] also proposed a different simple model to predict plate end debonding failure under flexural loading for FRP-plate-strengthened beams. Teng et al. [10] proposed that the IC debonding failure mechanism is similar to that during simple shear tests of bonded joints between an FRP sheet and concrete to determine the bond strength, and they developed design procedures for strengthening in the flexure of RC beams that combined the modified Chen–Teng bond strength model and a cracked section analysis. Kishi et al. [11,12] analyzed experimental results for the FRP-strengthened beams with FRP sheets suitable for practical use and were the first to propose two types of IC debonding failure modes under flexural loading. These failure modes will be described below in detail. Design guidelines were established for using externally bonded FRP sheets/laminates to improve the static and seismic strength of RC members, for instance ACI (American Concrete Institute) 440.2R-17 [13], and these methods have been globally applied in practice.
In Japan, usually, two materials of an FRP sheet, CFRP sheet and AFRP sheet, are used for strengthening infrastructures. Although one material for the AFRP sheet is normally used, there are three materials for the CFRP sheet. The material properties for an AFRP sheet are as follows: tensile strength ff = 2.1 GPa, Young’s modulus Ef = 118 GPa, and fracture strain εuf = 1.75% (Fibex, [14]). Those for a CFRP sheet are as follows: ff = 3.4 GPa, Ef = 245 GPa, and εuf = 1.39% for the high-strength type; ff = 2.4 GPa, Ef = 440 GPa, and εuf = 0.545% for the medium-elasticity type; and ff = 1.9 GPa, Ef = 640 GPa, and εuf = 0.3% for the high-elasticity type (Toray, [15]), respectively. The high-strength type CFRP and AFRP sheets are used for strengthening RC members because they have greater fracture strain and the medium- and high-strength type CFRP sheets, for strengthening steel members in which, although these fracture strains are less than 0.6%, the values of Young’s modulus are more than twice that of steel members.
Currently, terrorism is an international issue, and infrastructures are exposed to risk. Even though structures are normally subjected to static and quasi-static loads, they sometimes undergo severe damage due to impact loads generated by falling rocks and/or vehicle or ship collisions. FRP materials may have some potential to retrofit and/or strengthen structures subjected to such impacts and blast loading.
The applicability of FRPs for retrofitting and upgrading RC members under flexure and subjected to impact loads was initially and experimentally discussed by Eriki and Meier [16]. Their experiments showed that the impact-bearing performance of RC beams can be enhanced by bonding CFRP laminates to the tension-side surface. Tang and Saadatmanesh [17,18] conducted repeated drop-weight impact loading tests (hereafter referred to as drop tests) for RC beams that were not reinforced against shear; they strengthened the beams by bonding CFRP and/or AFRP laminates to both the tension- and compression-side surfaces. The experimental results exhibited that the FRP laminates significantly upgraded the impact-bearing capacity of the beams and decreased the deflection and crack width. Kantar and Anil [19] conducted repeated constant energy drop tests of flexural strengthened small plain concrete beams by bonding a CFRP strip to the tension-side surface. The experimental results showed that the impact-bearing behavior of the beams can be enhanced due to bonding the strip. Kishi et al. [20] conducted drop tests and confirmed that the impact-bearing capacity of RC beams was enhanced through flexural upgrading by bonding the high-strength type CFRP or AFRP sheet to the tension side. The upgrading effects were similar for the sheets of different materials with a similar axial stiffness and fractural strain.
Kadhim et al. [21] proposed a non-linear three dimensional FE method to analyze the impact-response behavior of the RC beams upgraded in shear and/or flexure with bonding CFRP sheets. However, the sheet debonding/rupturing behavior of the RC beams without U-shaped bonding of the sheet cannot be analyzed. Even though Ye et al. [22] proposed an elasto-plastic three dimensional FE analysis model for evaluating the impact-response behavior of the flexural and/or shear strengthened RC beams with bonding large-rupture-strain FRP (LRS-FRP) sheets under impact loading (in which the fracture strain of the LRS-FRP sheet is larger than 5%), the CFRP-strengthened beams were not precisely analyzed.
Thus, the upgrading effects of FRP laminates/sheets on the bearing capacity of RC members subjected to an impact load have been investigated in various ways. However, the failure mechanism for the FRP-strengthened beams subjected to an impact load, including FRP sheet debonding and rupturing, has not yet been identified experimentally and numerically. Research in this field is still not excessive (Pham and Hao [23]).
In this study, the CFRP sheets of high strength (hereafter referred to as CFRP sheets) with different sheet volumes were used for upgrading the RC beams in flexure, which statically collapsed in the flexural failure mode, and drop tests were conducted to look into the effects of the amount of the sheet volume and the impact-bearing behavior of the beams. Each beam was impacted only once. The tests were conducted by replacing a used beam with an unused beam and increasing the drop height of the weight to reach the ultimate state. Two sheet volumes were considered based on the static failure modes proposed by Kishi et al. [12]. To confirm the static bearing behavior, including the failure mode, of the FRP-strengthened beams, static loading tests were also conducted. As a reference, RC beams without bonding a sheet were also subjected to static and impact loads.
In addition, when RC beams were flexural strengthened by bonding an FRP sheet, the sheet-end debonding and IC debonding of the sheet should be practically and effectively controlled. To restrain the former debonding of the sheet, there are three methods: (1) a method applying an anchorage system (Sharif et al. [4], Ye et al. [22], Li and Xian [24]); (2) a method of winding and/or U-shaped bonding FRP strip near the sheet end of the beam (Sharif et al. [4], Ye et al. [22], Pham and Hao [25], Chen et al. [26], Jin et al. [27], Kadhim et al. [28]); and (3) a method of bonding a longer FRP sheet than the anchoring length (Tang and Saadatmanesh [17,18], Kantar and Anil [19], Kishi et al. [20]). The latter IC debonding of the sheet should be restrained by winding at even intervals and/or U-shaped bonding of the FRP strip (Pham and Hao [25], Chen et al. [26], Jin et al. [27]). In this paper, any anchorage system or U-shaped bonding method were not applied to precisely investigate IC debonding of the sheet and/or the sheet rupturing behavior of the RC beams.
2. Experimental Overview
2.1. Dimensions and Static Design Values of the RC Beams
Twelve specimens provided by a local construction firm in Japan (Hokken Co. Ltd., Sapporo, Japan) were used in this study. The axial stiffness of the CFRP sheet for strengthening the RC beam and the calculated static flexural and shear-bearing capacities of the beams are indicated in Table 1, where the name of the test specimen is identified using the amount of the areal mass of the strengthening CFRP material (N: none; Cm: CFRP, where m = 1 and 2 are the cases of bonding a CFRP sheet with areal masses ρf of 300 g/m2 and 600 g/m2, respectively) and the types of loading (S: static loading; Hn: impact loading, where n: set drop height in metric units). These two variables were linked by a hyphen. Beams C2 listed in Table 1 are the same specimens as the Beams C previously experimented on by the authors (Kishi et al. [20]). However, Beams N are again tested in this study. The measured drop height H′ was evaluated using the actual drop velocity of the weight immediately before colliding the beam. The velocity was estimated by using an image processor of the high-speed camera described below. The sheets with two-unit areal masses were prepared for each failure mode proposed by Kishi et al. [12] expected under static loading. The calculated static rebar-yield load Py and flexural bearing capacity Pusc of each beam were calculated by applying a multilayered method (Kaklauskas et al. [28]) and following the Japan Concrete Standard (JSCE [29]) with material properties of the concrete and CFRP sheets (see Table 2) as described below in more detail. From Table 1, since the ratios of shear to flexural bearing capacity α = Vusc/Pusc for all beams used in this study were greater than 1, all beams were expected to undergo static flexural failure, and the shear strengthening for the beams with winding of the CFRP strip was not needed statically. Beams C1 and C2 under static loading were expected to fail in the concrete crushing-IC debonding mode and the premature IC debonding mode, respectively, based on the thresholds described below, because the static calculated moment ratios My/Mu are 0.67 and 0.6, respectively.

Table 1.
List of specimens.
Table 2.
Material properties of sheets.
All beams tested in this study had a rectangular-shaped cross section with a width of 200 mm, depth of 250 mm, and clear span length of 3 m. The rebar arrangement is shown in Figure 1. The main rebar and stirrup arrangement, the treatment of the ends of the rebar, and the CFRP sheet bonding method for the beams were the same as those tested by Kishi et al. [20], and the paper can be referenced for details. The beams were strengthened by bonding a one-ply CFRP sheet up to near the supports to restrain the sheet-end debonding. Also, any countermeasure treatment for restraining the sheet debonding was not applied because of investigating the failure mechanisms of the beams including IC debonding of the sheet and/or the sheet rupturing under the impact loading.
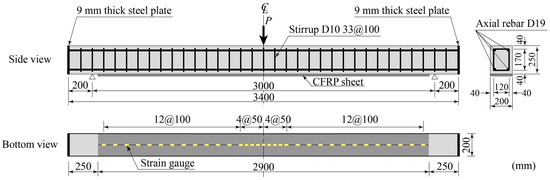
Figure 1.
Dimensions of specimens.
In addition, the procedure for bonding the sheet to the tensile surface of the beam was as follows: (1) the bonded surface with the sheet was grit-blasted to a depth of approximately 1 mm; (2) an epoxy resin type primer was treated on the surface; (3) after checking the primer with drying to the touch, the sheet was bonded to the surface applying an epoxy-resin type adhesive and conducting a defoaming treatment. The sheet was cured in the air for approximately one week.
The material properties of the sheet supplied by the manufacturer (Toray [15]) are listed in Table 2. The properties were evaluated by conducting the test following JIS (Japanese Industrial Standards) K 7165 [30].
2.2. Experimental Method for the Impact Loading
Drop tests were carried out on the beams by freely falling a weight from a predetermined height onto the midspan of the beam using an impact loading apparatus (Kishi et al.) [20,31,32], as described in Figure 2. A 300 kg weight was applied as an impactor. The supports of the beam can freely rotate to be pinned, and the horizontal displacements at the supports are restrained through tightening with the cross beams.
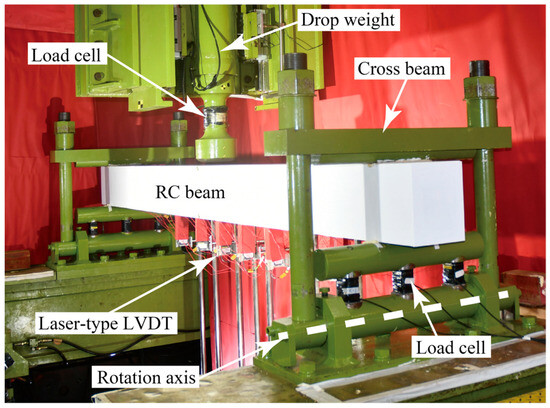
Figure 2.
Experimental setup for impact loading test.
In this study, the impact force P, total reaction force (hereafter referred to as the reaction force) R, the midspan deflection (hereafter referred to as the deflection) δ, and the axial strains of the sheet at a total of 33 points, shown in Figure 1, to evaluate the strain distribution of the sheet, were measured similarly to the experimental study of Kishi et al. [20]. Furthermore, the digital images of the side surface of the midspan area were taken by using a high-speed camera with 2000 fps. The residual deflection δrs was measured, and the crack patterns for each beam were depicted after the experiment. The deflection δ at mid-depth was measured with a laser-type linear variable differential transformer (LVDT) having a 200 mm maximum stroke because of certainly in measuring the deflection to avoid the influence of the sheet debonding and/or rupturing. All experimental data at every 0.1 ms were recorded using a digital data recorder.
3. Failure Mode Proposed by Kishi et al. and Experimental Results of Static Loading
3.1. Static IC Debonding Failure Modes Proposed by Kishi et al.
Kishi et al. [11,12] were the first to conduct static four- and/or three-point loading tests on FRP-strengthened beams to identify their static IC debonding failure modes under flexure while controlling the sheet-end debonding.
The experimental results showed the following: (1) that IC debonding failure did not always occur in the pure bending region; (2) however, it could occur in the intermediate rebar yielded area in the shear span, as shown in Figure 3; and (3) the sheet was debonded owing to the peeling action of the tips for the diagonal cracks (hereafter referred to as peeling action of the diagonal cracks) that developed where the intermediate rebar yielded.
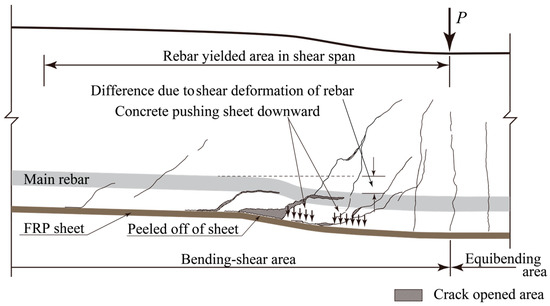
Figure 3.
Schematic diagram of debonding mechanisms of FRP sheets on RC beams.
Additionally, considering the load–deflection relationships obtained from the experimental results, Kishi et al. [11,12] classified two types of bearing behavior of FRP-strengthened beams, referring to the calculated curve and the ultimate strength: in the first type, the ultimate state was reached owing to IC debonding of the sheet, and the calculated ultimate strength due to concrete crushing was confirmed by following the calculated curve. In the second type, the ultimate state was reached due to premature IC debonding of the sheet after rebar yielding, and the calculated ultimate strength was not confirmed. The calculated curve and the ultimate strength can be obtained by applying the multilayered method (Kaklauskas et al. [28]) and Mohr’s integral technique (Kishi et al. [20]) by assuming a plane section of the beams during bending and ideal bonding between concrete and reinforcements (rebar and FRP sheet), and following the full stress–strain relationship for each material (JSCE [29]), as Kishi et al. [20] used. The calculation procedure was clearly explained in detail by Kishi et al. [18].
Considering the experimental results of Kishi et al. [12], the failure modes can be specified by the ratio of the calculated rebar-yield area to the shear span length. Converting this relationship into a bending moment diagram, the failure mode of RC beams is classified as the concrete crushing-IC debonding mode when the ratio of the calculated rebar-yield moment My to the calculated ultimate moment Mu (hereafter referred to as static calculated moment ratio My/Mu) is greater than 0.65 and as the premature IC debonding mode when My/Mu ≤ 0.65. These results show that RC beams subjected to a static load should be strengthened to reach the ultimate flexural state in the concrete crushing-IC debonding failure mode due to the deflection curvature near the loading area increasing, and countermeasures should be implemented to restrain premature IC debonding of the sheet when the sheet volume is grown to upgrade the flexural bearing capacity of the beam.
3.2. Experimental Results of Static Loading
The beams were subjected to a static load following the three-point loading method with a hydraulic jack having a capacity of 500 kN and a loading jig of a width in the axial direction of 100 mm in the same way as with the study of Kishi et al. [20,31,32]. For Beam N, the load steadily went up after the rebar yielding owing to an effect of plastic hardening. Therefore, the load was surcharged up to the deflection of around 80 mm, at which point the deflection-to-span length ratio was more than 2.5%.
3.2.1. Load Deflection Relation
Figure 4 shows comparisons of the load–deflection relationships of RC beams strengthened with CFRP sheets or not. In this figure, the experimental results for Beams C1 and C2 were compared with the calculated relationships assuming a concentrated surcharge load, which were obtained by applying the multilayered method (Kaklauskas et al. [28]) and Mohr’s integral technique (Kishi et al. [20]) as mentioned above. Those surcharged loads tended to increase with a larger deflection stiffness than Beam N after rebar yielding. The stiffness for Beam C2 was larger than that for Beam C1, which corresponded to the amount of the sheet volume. However, Beam C2 reached the ultimate state earlier than Beam C1; the maximum deflections for these beams were 46 mm and 57 mm, respectively.
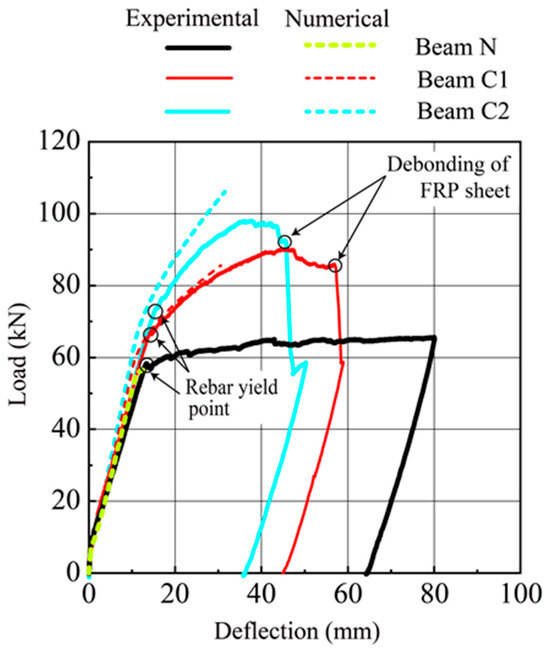
Figure 4.
Comparisons of static load–deflection relationships between experimental and numerical results.
The experimental results of the rebar-yield load and the maximum load for the three beams are indicated in Table 3. In this table, the maximum load of Beam N was taken at the point when the beam deflected by approximately δ = 30 mm because the strengthened beams approximately reached the calculated limit state at the deflection level. The table indicates that due to strengthening with the CFRP sheet, the rebar-yield load and the maximum load of Beam C1 were 15% and 46% greater than those of Beam N, respectively. In the case of Beam C2, even greater results were obtained than those of Beam C1 because of a larger amount of the sheet volume.
Table 3.
Experimental results in static loading.
Comparing the experimental and numerical curves for Beams C1 and C2, the experimental results for Beam C1 approximately enveloped the calculated curve and failed owing to the IC debonding of the sheet after deflecting by approximately twice the magnitude of the numerical result. However, in the case of Beam C2, the experimental results did not ensure the calculated bearing capacity during the gradual debonding of the sheet and lastly failed owing to the sheet completely debonding. Therefore, these results confirmed that the failure modes for Beams C1 and C2 under static loading belonged to the concrete crushing-IC debonding type and the premature IC debonding type, respectively.
3.2.2. Axial Strain Distribution of CFRP Sheet and Crack Patterns
Figure 5 indicates the axial strain distributions of the CFRP sheets at the deflection δcu when reaching the calculated ultimate state and at the experimental deflection δeu immediately before sheet debonding compared with those of the calculated ultimate state. The numerical results were bilinearly distributed around the midspan, in which the main rebar yielded area was in the shape of a triangle with an apex at the midspan point, and the elastic region of the rebar was distributed in the outer areas. The widths of the rebar yield region and elastic region for each beam are also indicated in the figure. This figure demonstrates that the elastic region of the rebar for Beam C1 was larger than that for Beam C2, which corresponded to the abovementioned values of My/Mu for both beams.
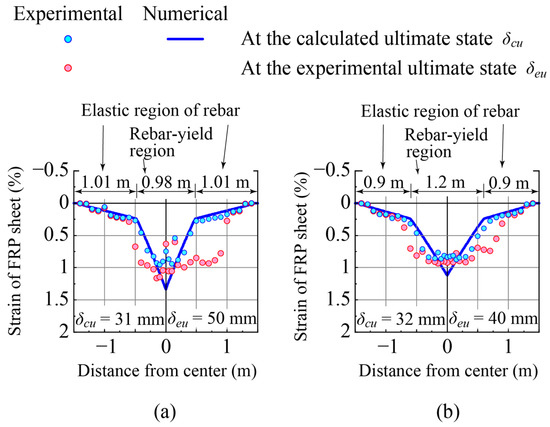
Figure 5.
Axial strain distributions of CFRP sheets when the beam deflection reached the calculated ultimate state and immediately before sheet debonding: (a) Beam C1 and (b) Beam C2.
The experimental strains near the loading area for both beams at the calculated ultimate state were distributed with similar values but differed from the numerical results. This occurred because the actual load was partially and uniformly distributed in the midspan area with a length of 100 mm in the axial direction due to the loading jig setup described above, while the numerical results were obtained by simply assuming a concentrated load.
In the case of Beam C1, a comparison of the strain distributions between the experimental and numerical results at the deflection δcu showed that the experimental results followed the numerical results not only in the rebar yield area around the midspan but also in the rebar elastic areas. This agreement implied that Beam C1 reached the calculated bearing capacity of the beam. However, regarding the case of Beam C2, even though the experimentally obtained strains in the rebar elastic region corresponded to the numerical results, those in the rebar yield region did not correspond very well to the numerical values since the strain plateau around the midspan was developed more widely and the strains in the regions near the ends of the plateau were larger than the numerical values. This meant that the beam may have been more severely damaged than Beam C1 owing to the peeling action of the diagonal cracks and the progressive debonding of the sheet, and the beam could not achieve the numerical bearing capacity.
From the experimental strain distributions of the sheet at the deflection δeu described in Figure 5, the strain plateau in the midspan area spread toward the supports for both beams. In terms of Beam C1, the strain values in the plateau were mainly distributed around 1%, which was less than the failure strain of the sheet εuf (=1.39%). Since the width of the plateau on the right-hand side was larger than that on the left-hand side, the sheet debonding might have started closer to the support in the intermediate area of the right-hand side of the beam owing to the peeling action of the diagonal cracks. In terms of Beam C2, the strains distributed in the plateau were smaller than those of Beam C1 and less than 1%. This may have been due to the sheet gradually debonding. Additionally, stepwise plateaus were formed on both sides of the beam. However, the plateau on the right-hand side was slightly wider than that on the left-hand side.
Figure 6 indicates the crack patterns for both beams at the deflection δeu. This figure shows the crack patterns distributed in a region of approximately 2.2 m in the central area of the beams. According to this figure, the sheet debonding progressed almost exclusively toward the support on the right-hand side, especially in Figure 6a, and Beam C2 could not ensure the capacity due to the sheet gradually debonding from an early stage after the rebar yielded owing to the peeling action of the diagonal cracks.
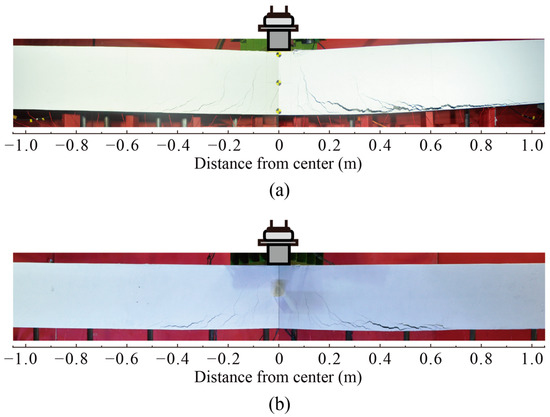
Figure 6.
Crack patterns immediately before sheet debonding: (a) Beam C1 and (b) Beam C2.
4. Experimental Results of Impact Loading
4.1. Time Records of Impact Force, Reaction Force, and Deflection
Figure 7 describes the time records of the impact force P, reaction force R, and deflection δ for all beams under impact loading. In these figures, the actual time was taken as the origin of the time axis when the weight collided with the upper surface of the beam. The positive reaction force was assumed to be in the upward direction, similarly to that of static loading. The calculated static bearing capacities (referred to hereafter as the calculated static capacities) for the three beams and the time when the CFRP sheet debonded and/or ruptured are described in Figure 7b. The calculated static maximum deflections (referred to hereafter as the calculated deflections) for the three beams are indicated in Figure 7c.
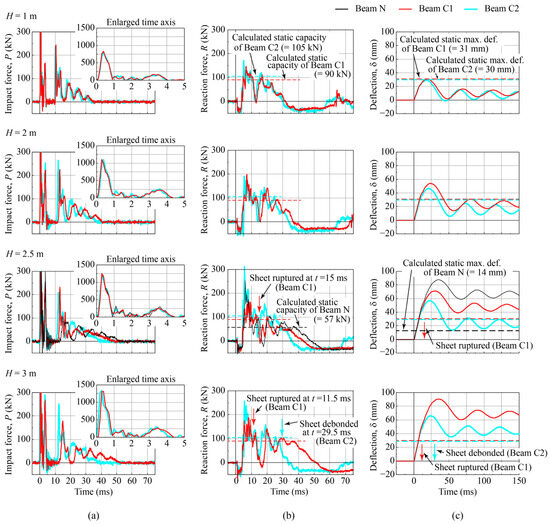
Figure 7.
Time records of dynamic responses: (a) impact force P, (b) reaction force R, and (c) deflection δ.
Figure 7a indicates the time records of the impact force P for 75 ms and (inset) 5 ms intervals at the beginning of the impact. This figure exhibits that the time records of the responses to the impact forces were similar irrespective of the amount of the sheet volume, including without strengthening, and drop height of the weight H (referred to hereafter as drop height H) (Kishi et al. [20]). These records may belong to Type III impact profiles (Li et al. [33]), with each wave consisting of a primary peak impact force and an impact force plateau. The plateau indicates an approximately triangular-shaped time record having a duration of ca. 25–40 ms, including components of the time record with relatively low amplitudes and periods of 5–10 ms.
The maximum impact forces for the three beams at drop height H = 2.5 m are indicated in Table 4. As shown in this table, these values are approximately the same, even though the amount of the sheet volume differed. The primary peak impact force depended on the contact stiffness of the concrete (Kishi et al. [20]).
Table 4.
Experimental results for maximum responses to impact loading at H = 2.5 m.
The time records of the force plateaus of Beams C1 and C2 were virtually the same for drop height H = 1 m. This may have been because the upgrading effects of the CFRP sheets were not very different, as the input impact energy was relatively small. Regarding the case of the drop height greater than H = 1 m, the amplitude and duration of the time record for Beam C1 were smaller and longer than those for Beam C2, which corresponded to the amount of the sheet volume.
Even though Beam C1 collapsed in the sheet rupturing mode at drop heights H = 2.5 and 3 m and the sheet debonded for Beam C2 at H = 3 m, these behaviors could not be confirmed from the time records.
Figure 7b indicates the time records of the reaction force R over the first 75 ms after impact. According to this figure, (1) at every drop height H, a negative reaction force was excited at the start of impact, which was also reported by Cotsovos [34], Pham et al. [35], Wang et al. [36], and Kishi et al. [20,31,32]; (2) the main reaction force consisted of an approximately triangular wave with high frequency components; and (3) the duration and maximum amplitude of the main reaction force for all beams approximately corresponded to those of the impact force plateau. The negative reaction force was measured by initializing the amplifier units for the load cells after the ends of the beam with the load cells were tightened by using the steel cross beam shown in Figure 2 as mentioned by Kishi et al. [20].
After the main response, the origins of the reaction force time records for all beams shifted to approximately 30–40 kN in the negative direction. This may have been owing to the instantaneous release of the bolts that tightened the supporting areas with the cross beams under the impact loading. After the supporting areas were unfastened, the beams vibrated periodically, as shown in the deflection time records described below.
Regarding the case of drop height H = 1 m, the reaction time records for Beams C1 and C2 were approximately the same as the impact force time records. When the drop height was increased to more than H = 1 m, even though the amplitudes of the waves (except for the high frequency components) were not very different for the two beams, the duration of the main response inclined to be prolonged for Beam C1, and the difference between Beams C1 and C2 increased, which corresponded to the increase in the drop height H. Beam C1 underwent more damage than Beam C2 due to the smaller sheet volume.
A comparison of the reaction time record with the calculated static capacity for each beam showed that the maximum reaction forces for Beams C1 and C2 were greater than the calculated capacities at drop height H = 1 m and approximately two times greater at H = 2 m. The maximum reaction forces occurred at the beginning of the positive reaction force wave excitation, accompanied by high-frequency components. The values for the three beams at drop height H = 2.5 m are indicated in Table 4. Even though the flexural stiffness of Beam C1 was greater than that of Beam N, the maximum reaction force was smaller for Beam C1 than for Beam N. This may have been due to the wider time intervals in recording the wave and/or experimental error, but the reasons cannot be clearly specified at this stage.
Figure 7c indicates the time records of deflection δ for 150 ms after impact. These results exhibit the following: (1) the deflections of the beams under the impact loading followed half-sine waves; (2) after unloading, the deflections were restrained; (3) the beams were under a damped free vibration state of low frequency irrespective of whether the sheet debonded and/or ruptured; and (4) the maximum deflections of Beam C2 for all cases of drop height H were smaller than those of Beam C1 because of the larger sheet volume. The residual deflections δrs for Beams C1 and C2 were inclined to increase with an increase in drop height H.
The time records of the three beams for drop height H = 2.5 m indicated the following: (1) unstrengthened Beam N exhibited the largest maximum and residual deflections; (2) even though the maximum deflection δmax for Beam C1 was less than that of Beam N, the damped free vibration periods of both beams were similar because the sheet for Beam C1 ruptured before reaching the maximum response value, and the flexural stiffnesses of the two beams might have become identical after the sheet ruptured; and (3) the vibration period of Beam C2 after unloading was shorter than those of Beams N and C1 because the sheet did not debond. The maximum deflections δmax and the residual deflection δrs for the three beams are described in Table 4. The table indicates the following: (1) the maximum deflection δmax and the residual deflection δrs of Beam C1 decreased by approximately 20% and 30%, respectively, compared to those of Beam N due to strengthening with the CFRP sheet, even though the CFRP sheet ruptured before reaching the maximum deflection and (2) both deflections of δmax and δrs for Beam C2 were smaller than those of Beam C1 due to the larger sheet volume, which did not debond.
Comparing the deflection time records with the calculated deflection for each beam, at drop height H = 1 m, since the calculated deflections of Beams C1 and C2 were 31 mm and 30 mm, respectively, the experimental results were approximately the same as the calculated results without sheet debonding and/or rupturing. At H = 2 m, the maximum experimental deflections δmax for Beams C1 and C2, 54 mm and 46 mm, respectively, were more than 1.5 times greater than the calculated deflections, even though the sheets did not debond and/or rupture. The residual deflections δrs of Beams C1 and C2 were smaller than the calculated deflections. At H = 2.5 m, the sheet for Beam C1 ruptured before reaching the maximum response value, and the residual deflection δrs was greater than the calculated deflection. The residual deflection δrs for Beam C2 was still smaller than the calculated deflection. At H = 3 m, the sheet for Beam C1 ruptured as at H = 2.5 m, and that of Beam C2 debonded after reaching the maximum deflection δmax. The residual deflections δrs of Beams C1 and C2 were larger than the calculated deflections. These results implied that even though the residual deflections δrs were smaller than the calculated deflections when the CFRP sheet did not debond or rupture, the residual deflections δrs were larger than the calculated deflections when the sheet debonded or ruptured.
4.2. Time Shifts of Strain Distribution for CFRP Sheet and Crack Patterns of Beams
Figure 8 indicates the time shifts of the axial strain distribution for the CFRP sheet and the side surface of the central area (±0.6 m from the midspan) of each strengthened beam at drop height H = 3 m.
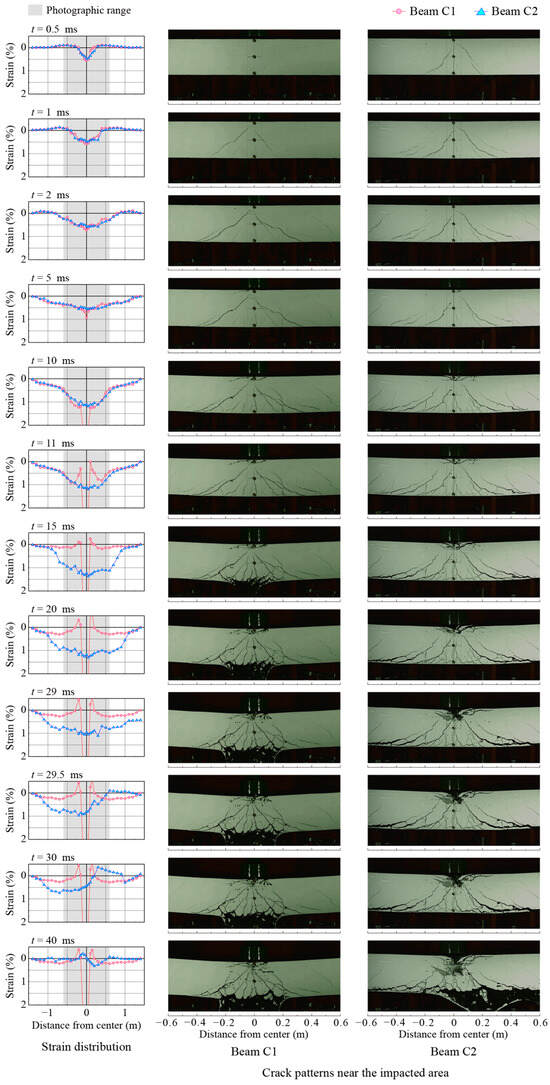
Figure 8.
Time shifts of strain distribution of CFRP sheet and crack patterns of beams at H = 3 m.
As shown in Figure 8, at time t = 0.5–2 ms after the start of impact (referred to hereafter as time t), the strain distributions for both beams showed that the tensile and compressive strains were distributed around the midspan area and the area near the support of the beams, respectively, the positive strain area extended toward the supports, and the negative strain area tended to decrease (Kishi et al. [20]). Regarding the case of Beam C1, the tensile strain near the loading area reached 0.5% at time t = 0.5 ms. However, at time t = 2 ms, the magnitude of the strain did not increase except near the midspan, and the area with a similar strain level expanded because it was after the time when the beam was subjected to the primary peak impact force with a 1 ms duration. The strain at the midspan gradually increased to approximately 0.75% at time t = 2 ms, while in the case of Beam C2, the strain distributions were similar to those of Beam C1 except near the midspan. Diagonal cracks formed in Beam C1 at time t = 1 ms. The flexural cracks slightly developed near the midspan in both beams. At time t = 2 ms, in the case of Bean C1, several diagonal cracks newly developed, whereas for Beam C2, only existing cracks were visible in the central area.
At time t = 5 ms, both beams shifted to the simply supported state. The main rebar at the midspan for Beam C1 might have yielded because the maximum strain reached approximately 0.95% and the sheet volume was small. The crack patterns for both beams were nearly identical to those at time t = 2 ms.
At time t = 10 ms, the strains in the midspan areas of both beams were in a dome-shaped distribution due to the progressive yielding of the main rebar, and those in the outer areas did not deform after time t = 5 ms because the rebar was in the elastic state. Since the strains at the midspan for Beam C1 exceeded 2% and were locally distributed, the sheet might have been close to rupturing. However, the upgrading effect of the sheet was still preserved for the areas where the strain distributions of the sheet were similar to those of Beam C2. The widths of the areas where the main rebar yielded were approximately the same for the two beams and differed from the static experimental results in that the width for Beam C1 (due to concrete crushing-IC debonding) was less than that for Beam C2 (premature IC debonding) (see Figure 5). From the crack patterns for Beam C1, the flexural cracks developed under the diagonal cracks were noticeable. This may be due to the deflection curvature near the loading area increasing. Regarding the case of Beam C2, since the horizontal cracks developed from the tips of the diagonal cracks due to the peeling, partial debonding of the sheet may have been initiated. The bottom ends of the flexural cracks tended to be joined due to the horizontal cracks that developed along the lower fibers.
At time t = 11 ms, regarding the case of Beam C1, the CFRP sheet ruptured at the midspan, and the strains near the sheet were in a transient state before being released, whereas for the case of Beam C2, even though the strain distributions did not change from time t = 10 ms, at time t = 15 ms, the strains tended to flatten in the intermediate area because the partial debonding of the sheet progressed due to peeling at the tips for the diagonal cracks. The strain level of the flattened area was greater than 1%. The elastic region of the main rebar decreased by approximately 0.5 m on both sides of the beam. According to the crack patterns of Beam C1 at time t = 15 ms, it is certainly confirmed that the sheet ruptured at the midspan, and due to this, the lower concrete cover above the sheet separated and divided into small blocks. In the case of Beam C2, in contrast, each horizontal crack that initiated from the tips of the diagonal crack did not fully open, but the partial sheet debonding zone still increased.
At time t = 20–40 ms, the strain distribution of Beam C2 showed that at time t = 20 ms, the flattening of the strain distribution in the intermediate area progressed toward the right-hand side support, and the strains near the support were still less than approximately 0.25%. At time t = 29 ms, partial debonding of the sheet progressed toward the right-hand side support because the strains near the support reached around 0.5%. At time t = 29.5 ms, since the strains were released to approximately zero in the region from the support to the distance of 1 m on the right-hand side of the beam, this area of the sheet might have completely debonded, and the sheet debonding may have progressed toward the left-hand side of the beam. At time t = 40 ms, the CFRP sheet completely lost its strengthening effect because the strains over the whole area of the sheet decreased to zero. According to the crack patterns of Beam C2, even though during time t = 20–30 ms, only the width of the horizontal cracks starting from the tips of the diagonal cracks tended to increase with time, at time t = 40 ms, the sheet debonding progressed from the right-hand side to the left of the beam, and the small blocks of the lower concrete cover spalled.
Thus, for the FRP-strengthened beams, the failure modes under impact loading differed from those under static loading as follows: (1) when the sheet volume was comparatively small and the static calculated moment ratio My/Mu (=0.67) was larger than 0.65, the FRP sheet ruptured under impact loading, whereas the beam failed in the concrete crushing-IC debonding mode under static loading; and (2) when the sheet volume was relatively large and the static calculated moment ratio My/Mu (=0.6) was less than 0.65, the sheet underwent premature IC debonding under impact loading, and the beam failed in the same mode under static loading. In the former case, the sheet rupture occurred at an early stage after impact due to the deflection curvature near the loading area increasing. However, in the latter case, the sheet debonded after reaching the maximum response state owing to the peeling action of the diagonal cracks. By increasing the sheet volume, the sheet rupturing can be restrained, and the impact bearing capacity can be upgraded.
4.3. Crack Patterns of the Test Specimens After Impact Loading
Figure 9 indicates the crack patterns for all specimens after impact load testing. In this figure, the bonded length of the sheet to the lower concrete cover was indicated. The following details were observed: flexural cracks developed over the whole span and from not only the lower fibers but also the upper fibers (Kishi et al. [20], Kishi and Mikami [31], and Hao et al. [37]). Furthermore, diagonal cracks occurred near the loading area, irrespective of whether the beams were upgraded by bonding the sheet or not and the amount of the sheet volume. The crack patterns that developed from the upper fibers might have been because of a flexural wave of a fixed beam traveling toward the supports at the start of impact, as mentioned above (Kishi et al. [20]). Beam N failed in the flexural-shear failure mode. However, Beam C1, which was strengthened by bonding the sheet, failed in the sheet rupturing mode, in which the sheet debonding occurred due to rebound of the rupturing sheet and was limited to the area near where the sheet ruptured. Beam C2 was strengthened by bonding the sheet with twice the volume of that of Beam C1 and failed by the sheet fully debonding because of the peeling action of the diagonal cracks previously mentioned.
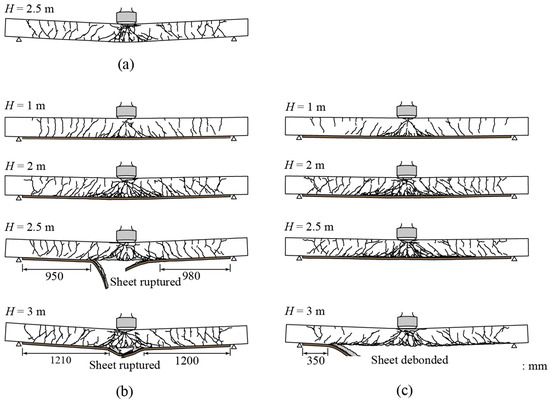
Figure 9.
Crack patterns after impact loading: (a) Beam N, (b) Beam C1, and (c) Beam C2.
Figure 10 indicates the damage states of the RC beam and the CFRP sheet for Beams C1 and C2 after impact loading tests. From this figure, it is observed that for Beam C1, the CFRP sheet was ruptured to be torn off and was locally debonded near the ruptured area owing to rebound at the sheet rupturing, whereas, for Beam C2, the sheet was debonded together with bonding the lower concrete cover over the entire beam.
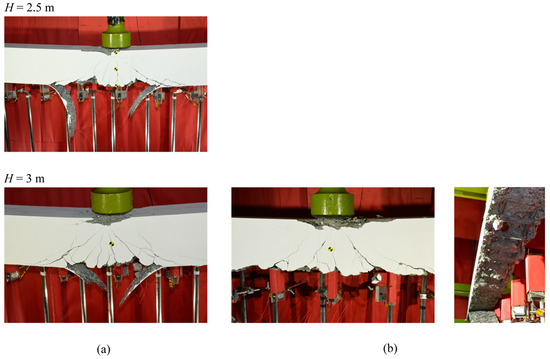
Figure 10.
Damage state of RC beam and CFRP sheet after impact loading test: (a) Beam C1 and (b) Beam C2.
5. Conclusions
In this study, RC beams were upgraded in flexure with bonding CFRP sheets of various areal masses to the tension side, and their impact resistance under low-velocity impact loading was investigated by conducting drop-weight impact loading tests. Two sheet volumes were compared based on the static failure modes: concrete crushing-IC debonding and premature IC debonding. The results obtained in this study were as follows:
- In the static loading case, where RC beams upgraded with FRP sheets had a static calculated moment ratio My/Mu (=0.67) larger than 0.65 and collapsed in the concrete crushing-IC debonding failure mode due to the deflection curvature near the loading area increasing, these beams failed in the sheet rupturing mode under impact loading because of the small sheet volume.
- When the sheet volume was comparatively large and the static calculated moment ratio My/Mu (=0.6) was less than 0.65, the RC beams failed in the premature IC debonding failure mode under both static and impact loading owing to the peeling action of the diagonal cracks developed near the loading area.
- Even though the concrete crushing-IC debonding type of RC beams reached the calculated bearing capacity under static loading, the impact resistance was less than that of the premature IC debonding type of beams.
- Under impact loading, when the residual deflection of the upgraded RC beams was larger than the static calculated maximum deflection, the beams collapsed in sheet debonding and/or rupturing mode.
Then, based on these experimental results, the failure mode of the FRP-strengthened beams subjected to a low-velocity impact load may be predicted by using the static calculated moment ratio My/Mu as an index. However, since the input impact energy when the beams collapsed in sheet debonding and/or rupturing mode has not been predicted yet, further experimental study should be required and a numerical analysis method, to appropriately estimate the impact-resistance behavior of the members including the sheet debonding and/or rupturing, should be developed early and should be used for numerical simulations to establish an appropriate design procedure for the FRP-strengthened beams under the impact loading.
Author Contributions
Conceptualization, T.K. and N.K.; methodology, T.K. and N.K.; software, T.K. and N.K.; validation, T.K., M.K. and N.K.; formal analysis, T.K. and N.K.; investigation, T.K. and N.K.; resources, T.K., M.K. and N.K.; data curation, T.K.; writing—original draft preparation, T.K. and N.K.; writing—review and editing, T.K. and N.K.; visualization, T.K.; supervision, N.K.; project administration, T.K. and N.K.; funding acquisition, T.K., M.K. and N.K. All authors have read and agreed to the published version of the manuscript.
Funding
This research received no external funding.
Data Availability Statement
All data generated or used during this study appear in the submitted article.
Acknowledgments
The CFRP sheet and adhesive were provided by Toray Industries, Inc. Japan and Sumitomo Rubber Industries, Ltd. Japan, respectively.
Conflicts of Interest
The authors declare that they have no known competing financial interests or personal relationships that could have appeared to influence the work reported in this paper.
Abbreviations
The following abbreviations are used in this paper:
| Af | cross-sectional area of the FRP sheet per unit width |
| E | measured input impact energy |
| Ef | elastic modulus of the FRP sheet |
| f′c | compressive strength of concrete |
| ff | tensile strength of the FRP sheet |
| fy | yield stress of longitudinal rebar |
| H | set drop height of weight |
| H′ | measured drop height of weight |
| Mu | static calculated ultimate moment of the RC beam |
| My | static calculated rebar-yield moment of the RC beam |
| My/Mu | static calculated moment ratio |
| P | impact force |
| Pmax | maximum impact force |
| Pusc | calculated static flexural load-bearing capacity of the RC beam |
| Py | calculated static rebar-yield load of the RC beam |
| R | total reaction force |
| Rmax | maximum reaction force |
| t | time after the beginning of impact |
| Vusc | calculated static shear load-bearing capacity of the RC beam |
| ρf | areal mass of the FRP sheet per unit area |
| α | shear-flexural capacity ratio of the RC beam |
| δ | midspan deflection of the RC beam |
| δcu | midspan deflection of the RC beam when reaching the calculated ultimate state |
| δeu | midspan deflection of the RC beam immediately before sheet debonding |
| δmax | maximum deflection of the beam |
| δrs | residual deflection of the beam |
| εuf | failure strain of the FRP sheet |
References
- Ritchie, P.A.; Thomas, D.A.; Lu, L.W.; Conelly, G.M. External reinforcement of concrete beams using reinforced plastics. ACI Struct. J. 1991, 88, 490–500. [Google Scholar]
- Saadatmanesh, H.; Ehsami, M.R. RC beams strengthened with GFRP plates. I: Experimental study. J. Struct. Engrg. 1991, 117, 3417–3433. [Google Scholar] [CrossRef]
- Triantafillou, T.C.; Plevris, N. Strengthening of RC beams with epoxy-bonded fibre-composite materials. Mater. Struct. 1992, 25, 201–211. [Google Scholar] [CrossRef]
- Sharif, A.; Al-Sulaimani, G.J.; Basunbul, I.A.; Baluch, M.H.; Ghaleb, B.N. Strengthening of initially loaded reinforced concrete beams using FRP plates. ACI Struct. J. 1994, 91, 160–168. [Google Scholar]
- Arduini, M.; Nanni, A. Behavior of precracked RC beams strengthened with carbon FRP sheets. J. Comp. Constr. 1997, 1, 63–70. [Google Scholar] [CrossRef]
- Rahimi, H.; Hutchinson, A. Concrete beams strengthened with externally bonded FRP plates. J. Comp. Constr. 2001, 5, 44–56. [Google Scholar] [CrossRef]
- Chen, J.F.; Teng, J.G. Anchorage strength models for FRP and steel plates bonded to concrete. J. Struct. Engrg. 2001, 127, 784–791. [Google Scholar] [CrossRef]
- Smith, S.T.; Teng, J.G. FRP-strengthened RC beams. I: Review of debonding strength models. Eng. Struct. 2002, 24, 385–395. [Google Scholar] [CrossRef]
- Smith, S.T.; Teng, J.G. FRP-strengthened RC beams. II: Assessment of debonding strength models. Eng. Struct. 2002, 24, 397–417. [Google Scholar] [CrossRef]
- Teng, J.G.; Smith, S.T.; Yao, J.; Chen, J.F. Intermediate crack-induced debonding in RC beams and Slabs. Constr. Build. Mater. 2003, 17, 447–462. [Google Scholar] [CrossRef]
- Kishi, N.; Mikami, H.; Kurihashi, Y. An experimental study on load-carrying behavior of flexural strengthened RC beams with AFRP sheet. J. V JSCE 2001, 683, 47–64. (In Japanese) [Google Scholar] [CrossRef][Green Version]
- Kishi, N.; Mikami, H.; Kurihashi, Y. An experimental study on flexural load-carrying behavior and prediction of failure mode for RC beams strengthened with FRP sheet. J. V JSCE 2002, 711, 91–109. (In Japanese) [Google Scholar]
- ACI (American Concrete Institute). Guide for the Design and Construction of Externally Bonded FRP Systems for Strengthening Concrete Structure; ACI 440.2R-17 2017; ACI: Farmington Hills, MI, USA, 2017. [Google Scholar]
- Fibex. FiBRA Sheet Product Data. Tokyo, Fibex. Available online: http://www.fibex.co.jp/seihin_01.html (accessed on 25 April 2025). (In Japanese).
- Toray. TORAYCA Cloth Product Data. Tokyo, Toray. Available online: https://www.cf-composites.toray/resources/data_sheets/ (accessed on 15 May 2025).
- Erki, M.A.; Meier, U. Impact loading of concrete beams externally strengthened with CFRP laminates. J. Comp. Constr. 1999, 3, 117–124. [Google Scholar] [CrossRef]
- Tang, T.; Saadatmanesh, H. Behavior of concrete beams strengthened with fiber-reinforced polymer laminates under impact loading. J. Comp. Constr. 2003, 7, 209–218. [Google Scholar] [CrossRef]
- Tang, T.; Saadatmanesh, H. Analytical and experimental studies of fiber-reinforced polymer-strengthened concrete beams under impact loading. ACI Struct. J. 2005, 102, 139–149. [Google Scholar]
- Kantar, E.; Anil, Ö. Low velocity impact behavior of concrete beam strengthened with CFRP strip. Steel Compos. Struct. 2012, 12, 207–230. [Google Scholar] [CrossRef]
- Kishi, N.; Komuro, M.; Kawarai, T.; Mikami, H. Low-velocity impact load testing of RC beams strengthened in flexure with bonded FRP sheets. J. Comp. Constr. 2020, 24, 4020036. [Google Scholar] [CrossRef]
- Kadhim, M.M.A.; Jawdhari, A.R.; Altaee, M.J.; Adheem, A.H. Finite element modelling and parametric analysis of FRP strengthened RC beams under impact load. J. Build. Eng. 2020, 32, 101526. [Google Scholar] [CrossRef]
- Ye, Z.; Zhou, Y.; Zhao, D. Numerical Simulations and Simplified Design Approaches for Large-Rupture-Strain FRP-Strengthened Reinforced Concrete Beams under Impact. J. Compos. Constr. 2023, 27, 4023037. [Google Scholar] [CrossRef]
- Pham, T.M.; Hao, H. Review of concrete structures strengthened with FRP against impact loading. Structures 2016, 7, 59–70. [Google Scholar] [CrossRef]
- Li, C.; Xian, G. Novel wedge-shaped bond anchorage system for pultruded CFRP plates. Mater. Struct. 2018, 51, 162. [Google Scholar] [CrossRef]
- Pham, T.M.; Hao, H. Impact Behavior of FRP-Strengthened RC Beams without Stirrups. J. Comp. Constr. 2016, 20, 4016011. [Google Scholar] [CrossRef]
- Chen, W.; Pham, T.M.; Sichembe, H.; Chen, L.; Hao, H. Experimental study of flexural behavior of RC beams strengthened by longitudinal and U-shaped basalt FRP sheet. Compos. Part B 2018, 134, 114–126. [Google Scholar] [CrossRef]
- Jin, L.; Lan, Y.; Zhang, R.; Du, X. Numerical analysis of the mechanical behavior of the impact-damaged RC beams strengthened with CFRP. Compos. Struct. 2021, 274, 114353. [Google Scholar] [CrossRef]
- Kaklauskas, G.; Bačinskas, D.; Šitnkus, R. Deflection estimates of reinforced concrete beams by different methods. J. Stayba 1999, 5, 258–264. [Google Scholar] [CrossRef][Green Version]
- JSCE (Japan Society of Civil Engineers). Standard Specification for Concrete Structures-2017 Design; Japan Society of Civil Engineers: Tokyo, Japan, 2018. [Google Scholar]
- JIS (Japanese Industrial Standard). Plastics—Determination of Tensile Properties—Part 5. Test Conditions for Unidirectional Fibre-Reinforced Plastic Composites; JIS K 7165; Japanese Industrial Standard: Tokyo, Japan, 2008. [Google Scholar]
- Kishi, N.; Mikami, H. Empirical formulas for designing reinforced concrete beams under impact loading. ACI Struct. J. 2012, 109, 509–519. [Google Scholar]
- Kishi, N.; Komuro, M.; Kono, K.; Kawarai, T. Impact resistance of porosity-free fiber-reinforced concrete (PFFRC) beams under low-velocity impact loading. Int. J. Prot. Struct. 2022, 13, 344–362. [Google Scholar] [CrossRef]
- Li, H.; Chen, W.; Hao, H. Factors influencing impact force profile and measurement accuracy in drop weight impact tests. Inter. J. Impact Eng. 2020, 145, 103688. [Google Scholar] [CrossRef]
- Cotsovos, D.M. A simplified approach for assessing the load-carrying capacity of reinforced concrete beams under concentrated load applied at high rates. Inter. J. Impact Eng. 2010, 37, 907–917. [Google Scholar] [CrossRef]
- Pham, T.M.; Hao, H. Behavior of fiber-reinforced polymer-strengthened reinforced concrete beams under static and impact loads. Int. J. Prot. Struct. 2017, 8, 3–24. [Google Scholar] [CrossRef]
- Wang, W.; Wu, C.; Yu, Y.; Zeng, J. Dynamic responses of hybrid FRP-concrete-steel double-skin tubular column (DSTC) under lateral impact. Structures 2021, 32, 1115–1144. [Google Scholar] [CrossRef]
- Hao, H.; Tran, T.T.; Li, H.; Pham, T.M.; Chen, W. On the accuracy, reliability and controllability of impact tests of RC beams. Inter. J. Impact Eng. 2021, 157, 103979. [Google Scholar] [CrossRef]
Disclaimer/Publisher’s Note: The statements, opinions and data contained in all publications are solely those of the individual author(s) and contributor(s) and not of MDPI and/or the editor(s). MDPI and/or the editor(s) disclaim responsibility for any injury to people or property resulting from any ideas, methods, instructions or products referred to in the content. |
© 2025 by the authors. Licensee MDPI, Basel, Switzerland. This article is an open access article distributed under the terms and conditions of the Creative Commons Attribution (CC BY) license (https://creativecommons.org/licenses/by/4.0/).