
Comprehensive Material Characterization and Seismic Performance Evaluation of a Traditional Masonry Residential Building with Reinforced Concrete Slabs


Abstract
1. Introduction
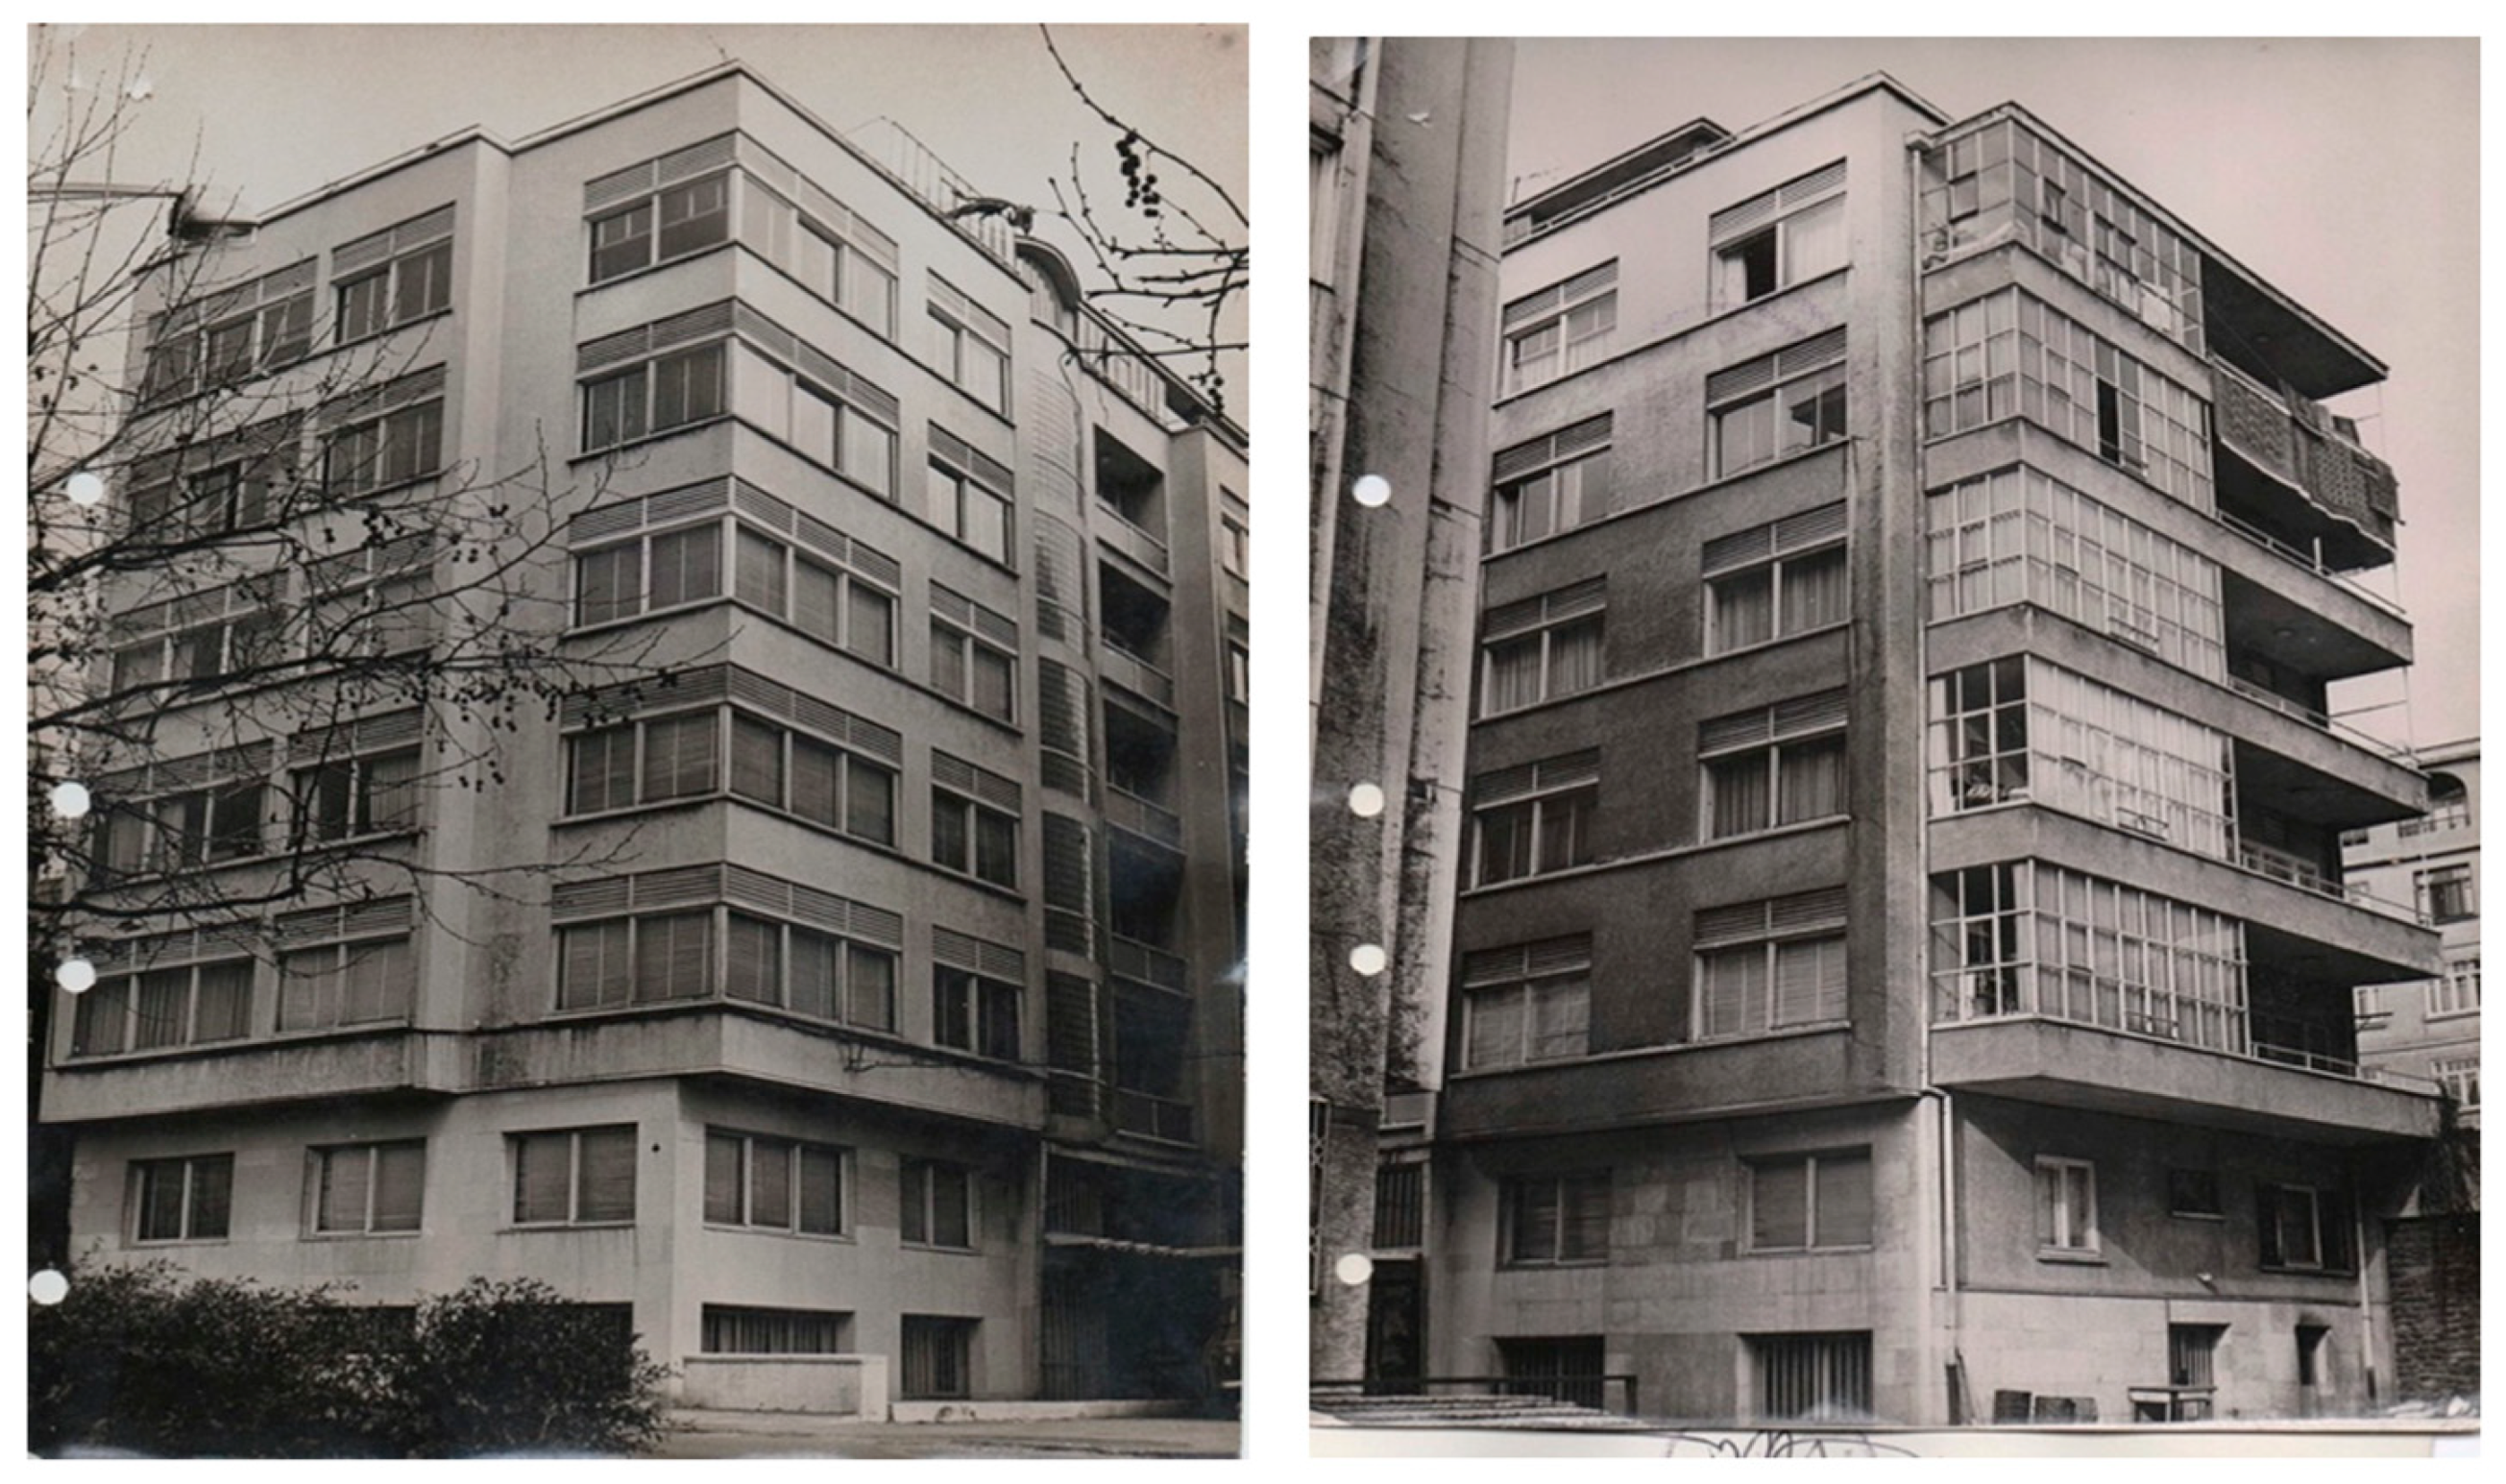
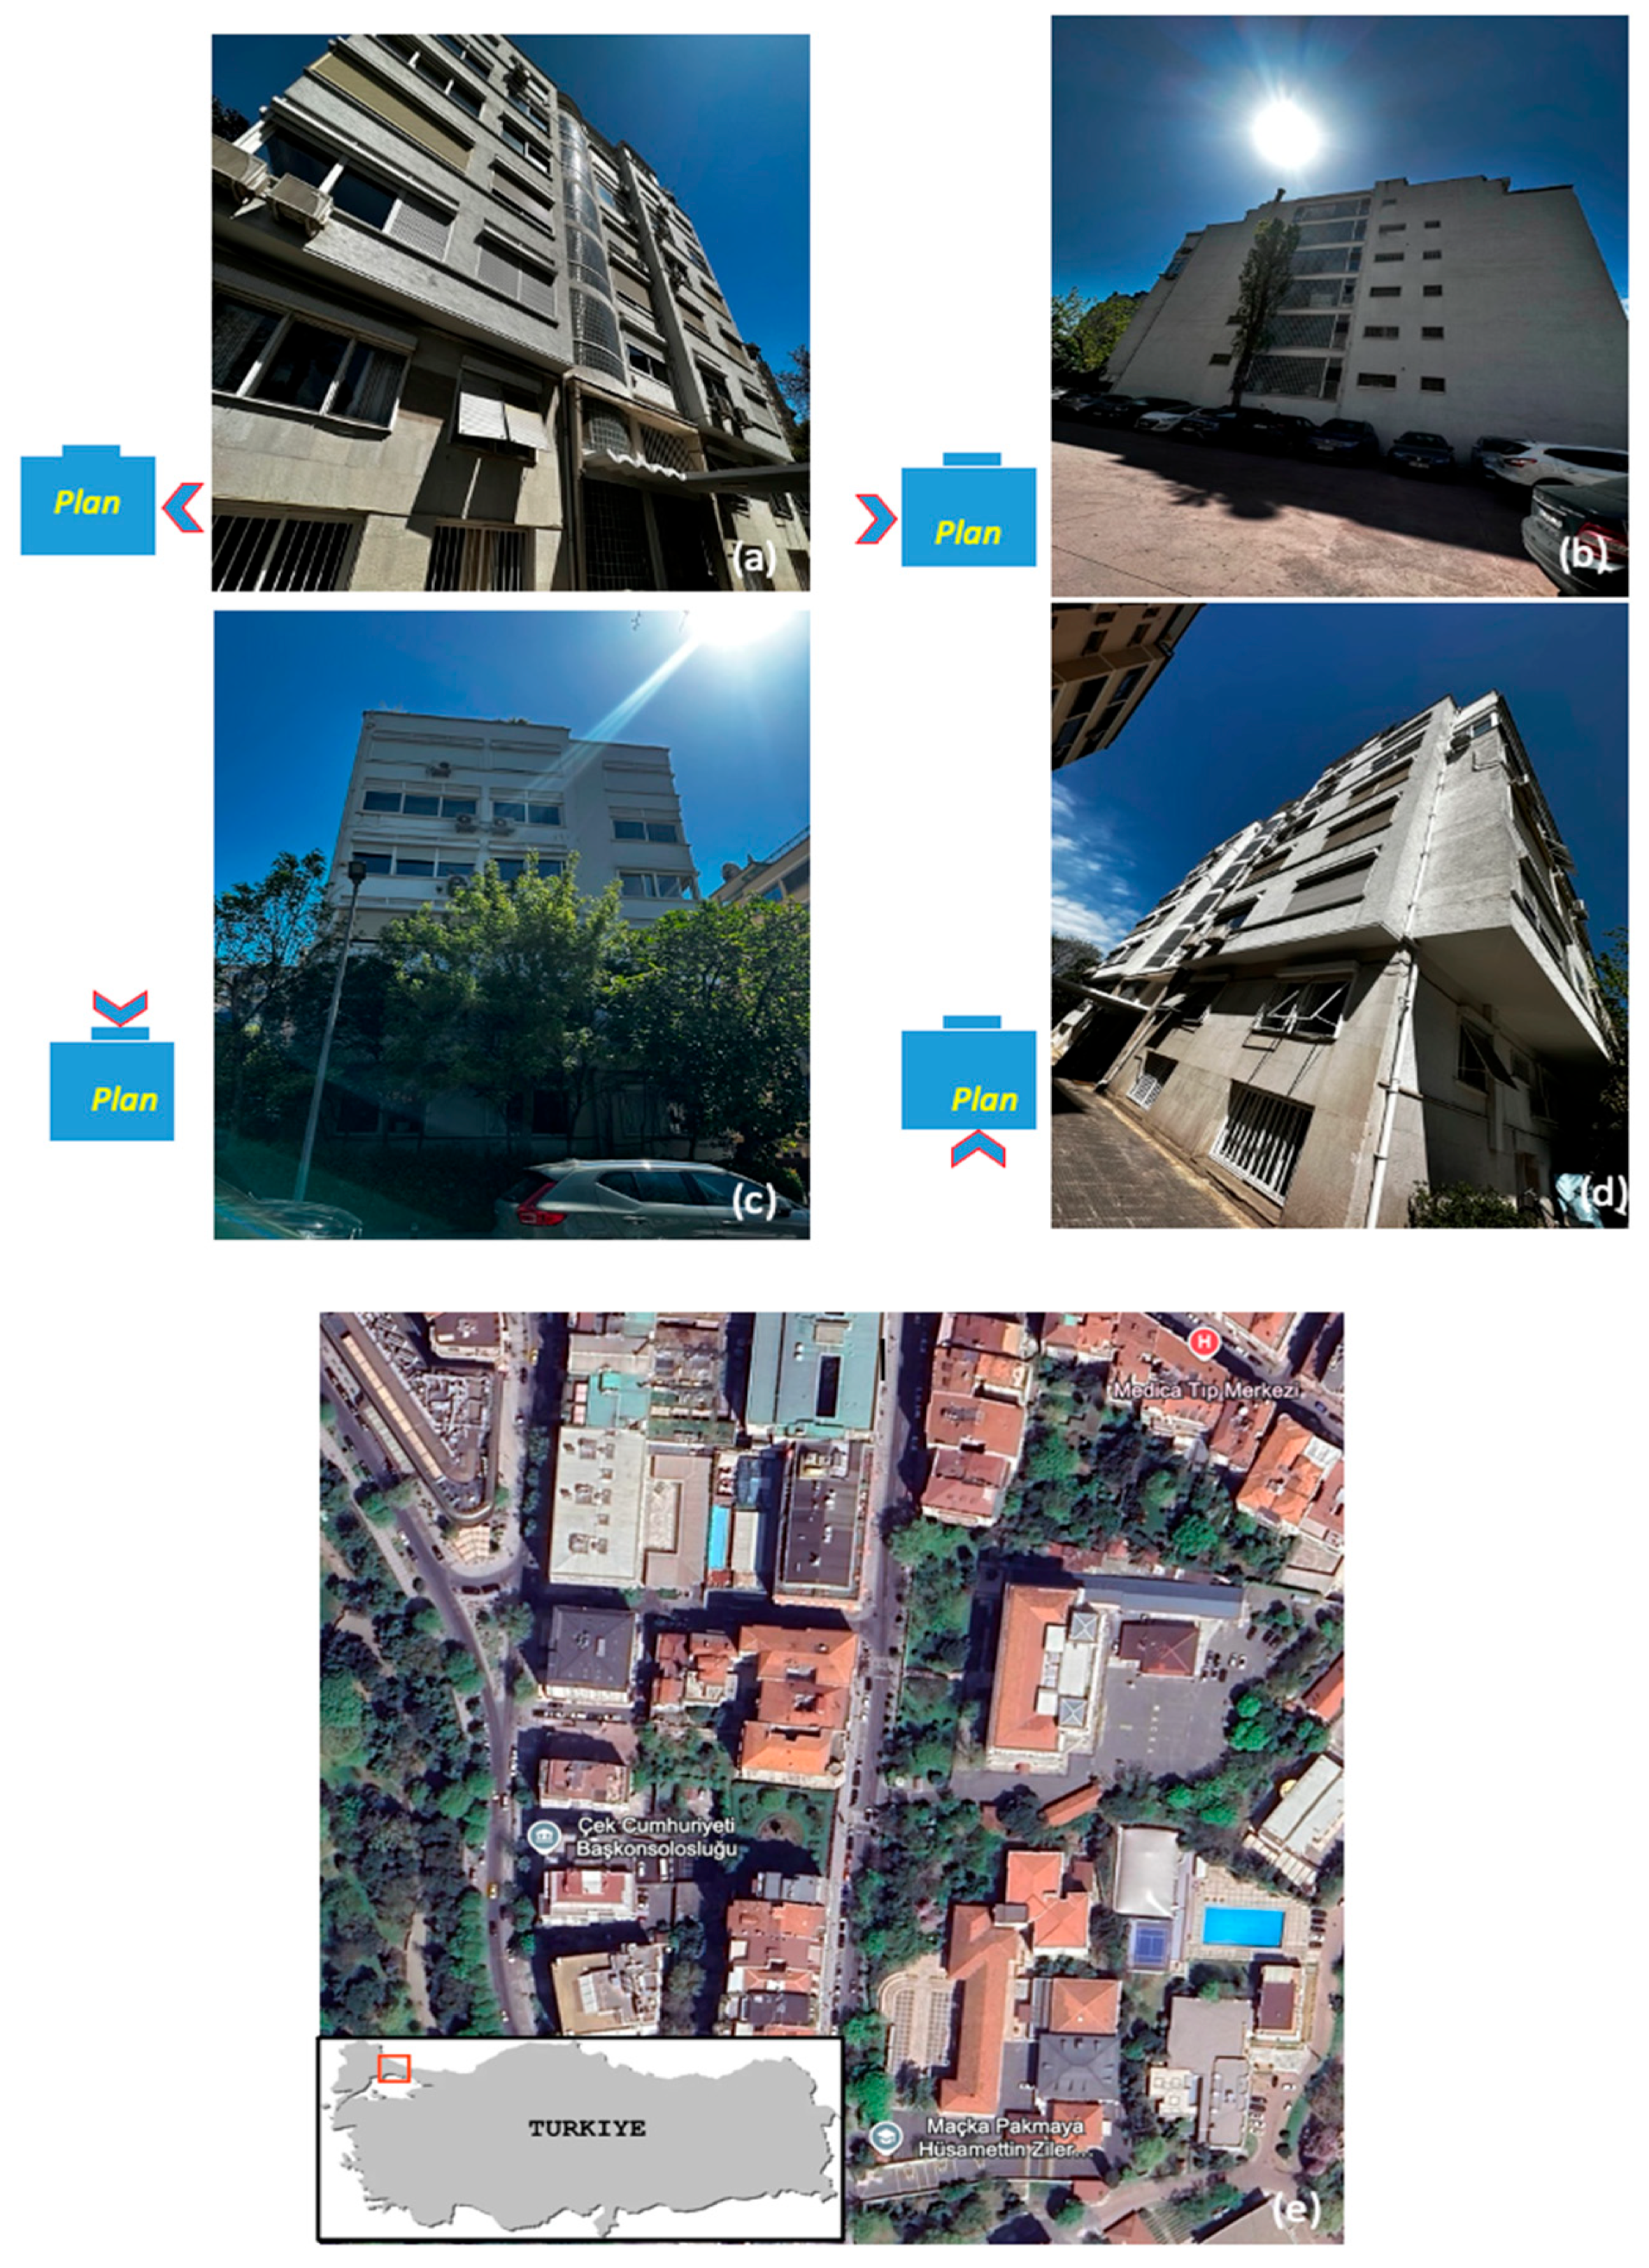
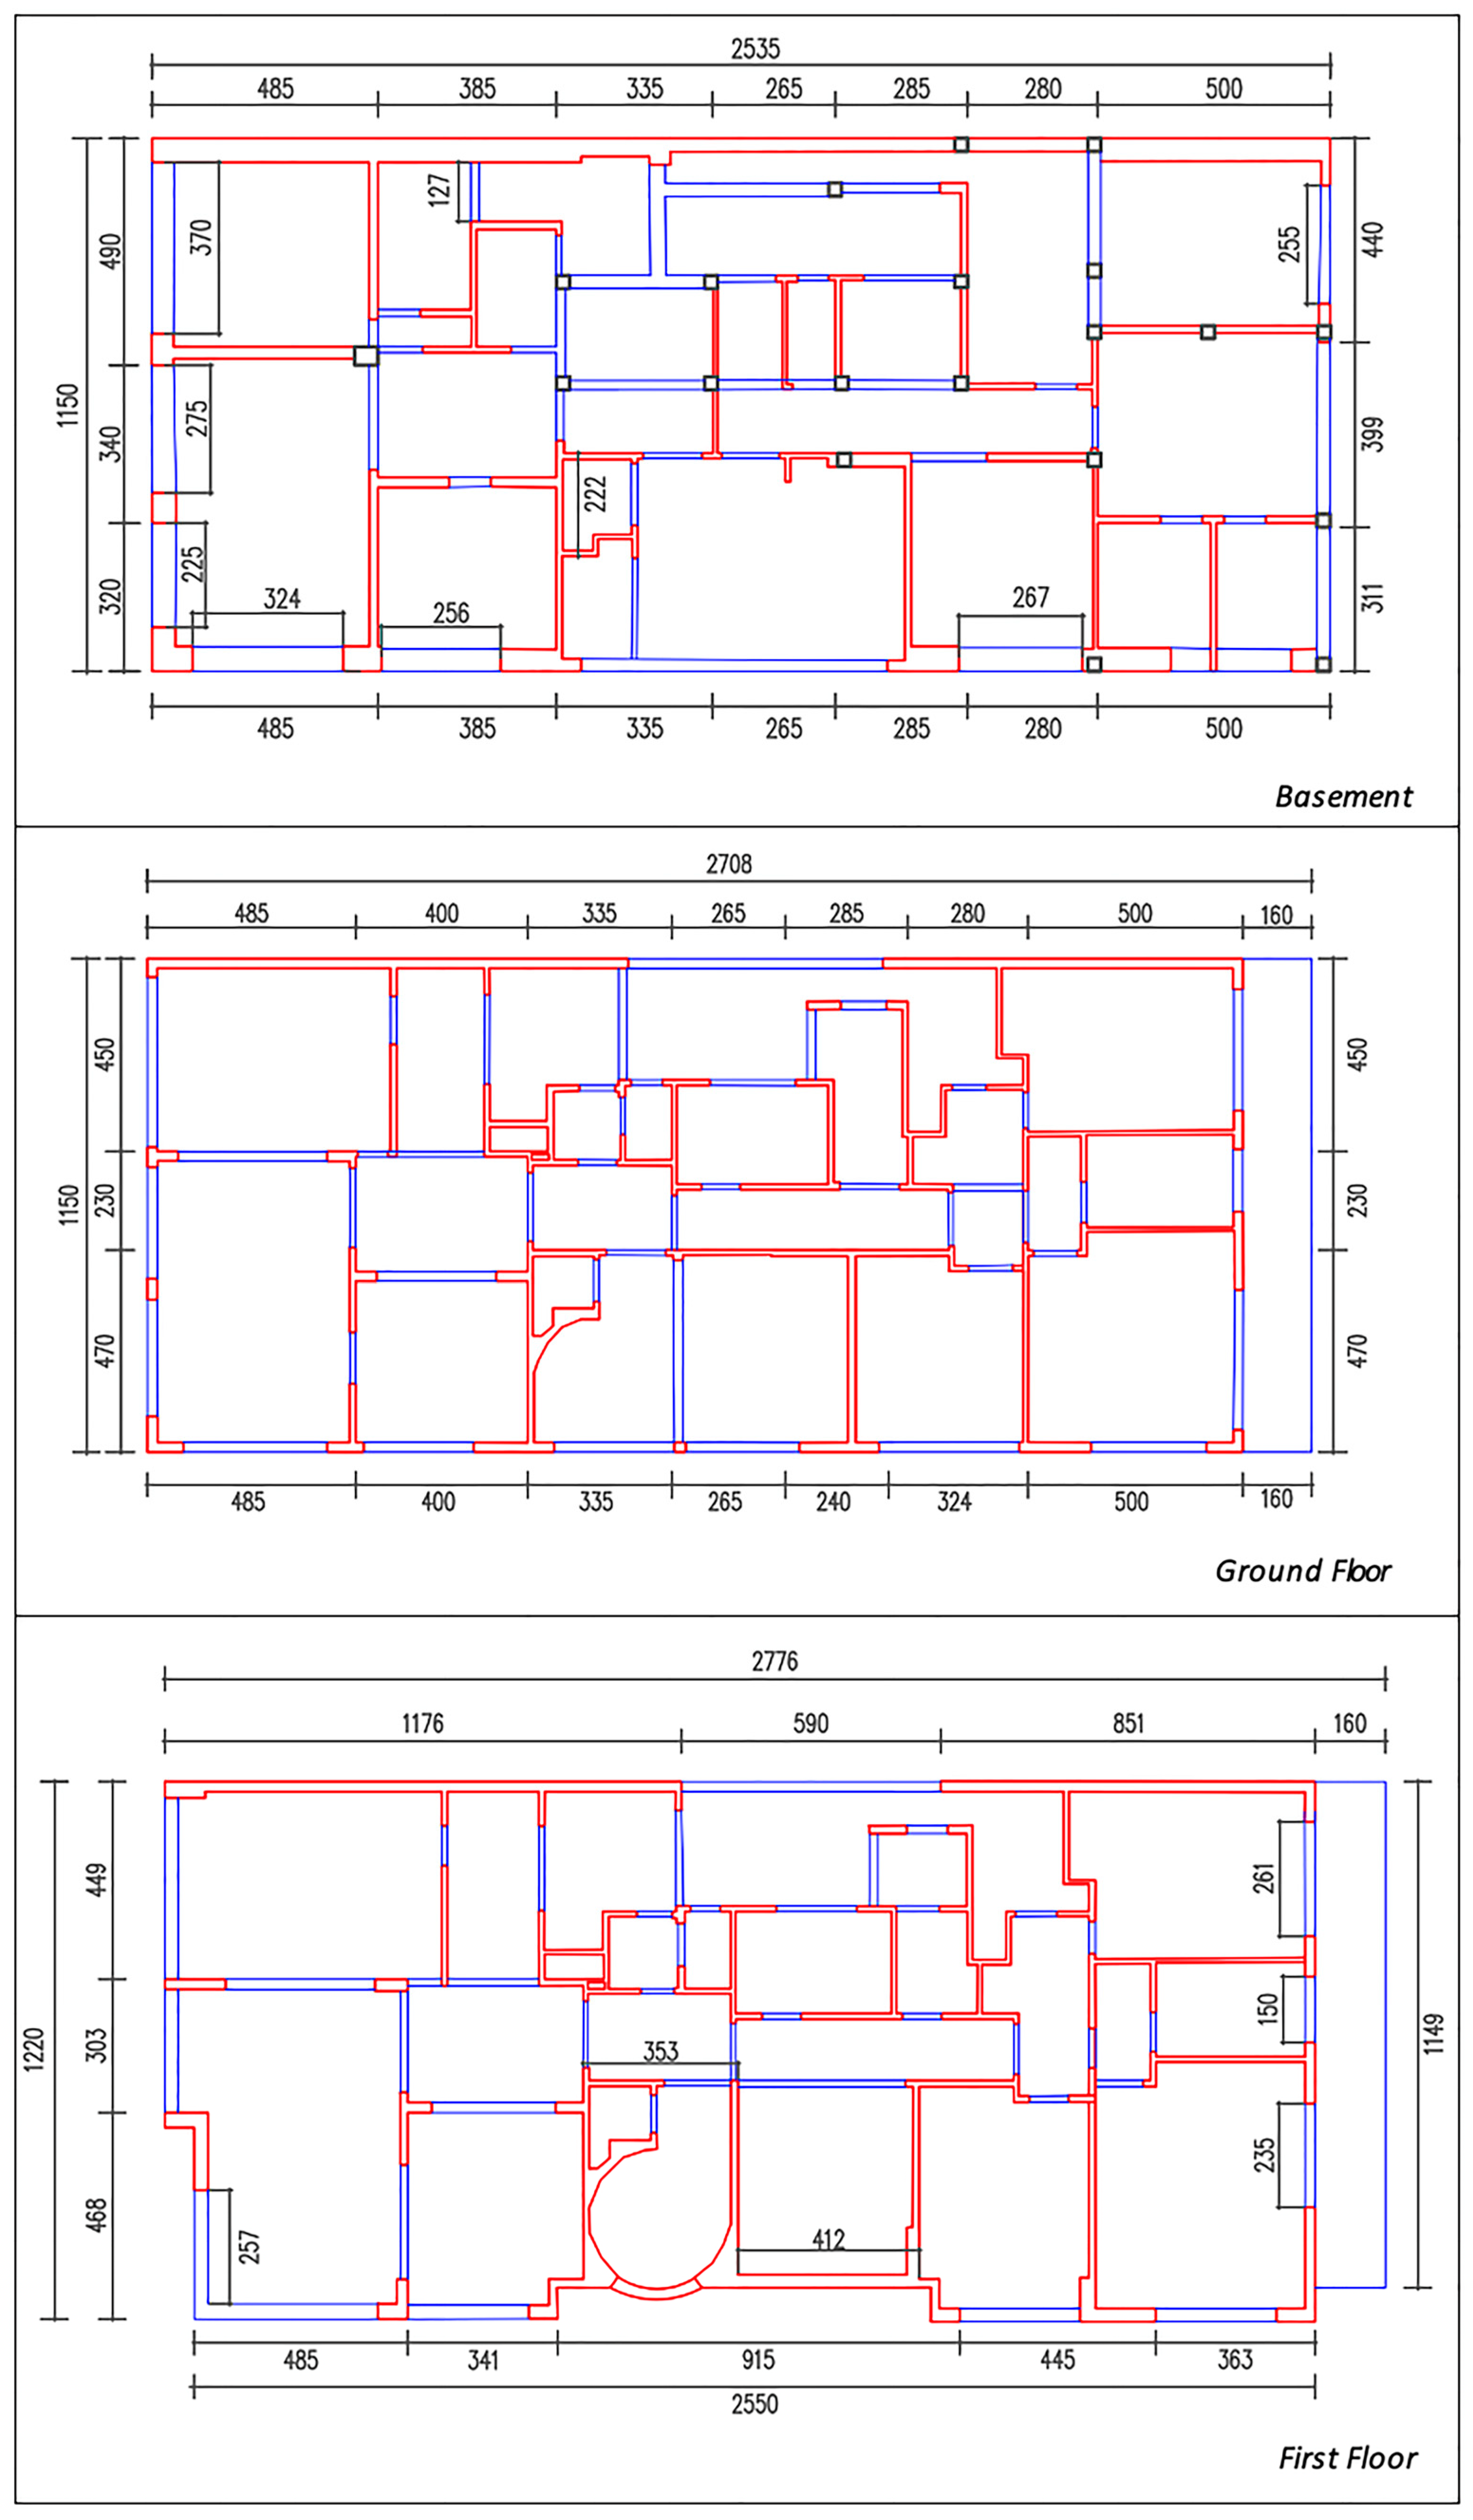
2. The Examined Building
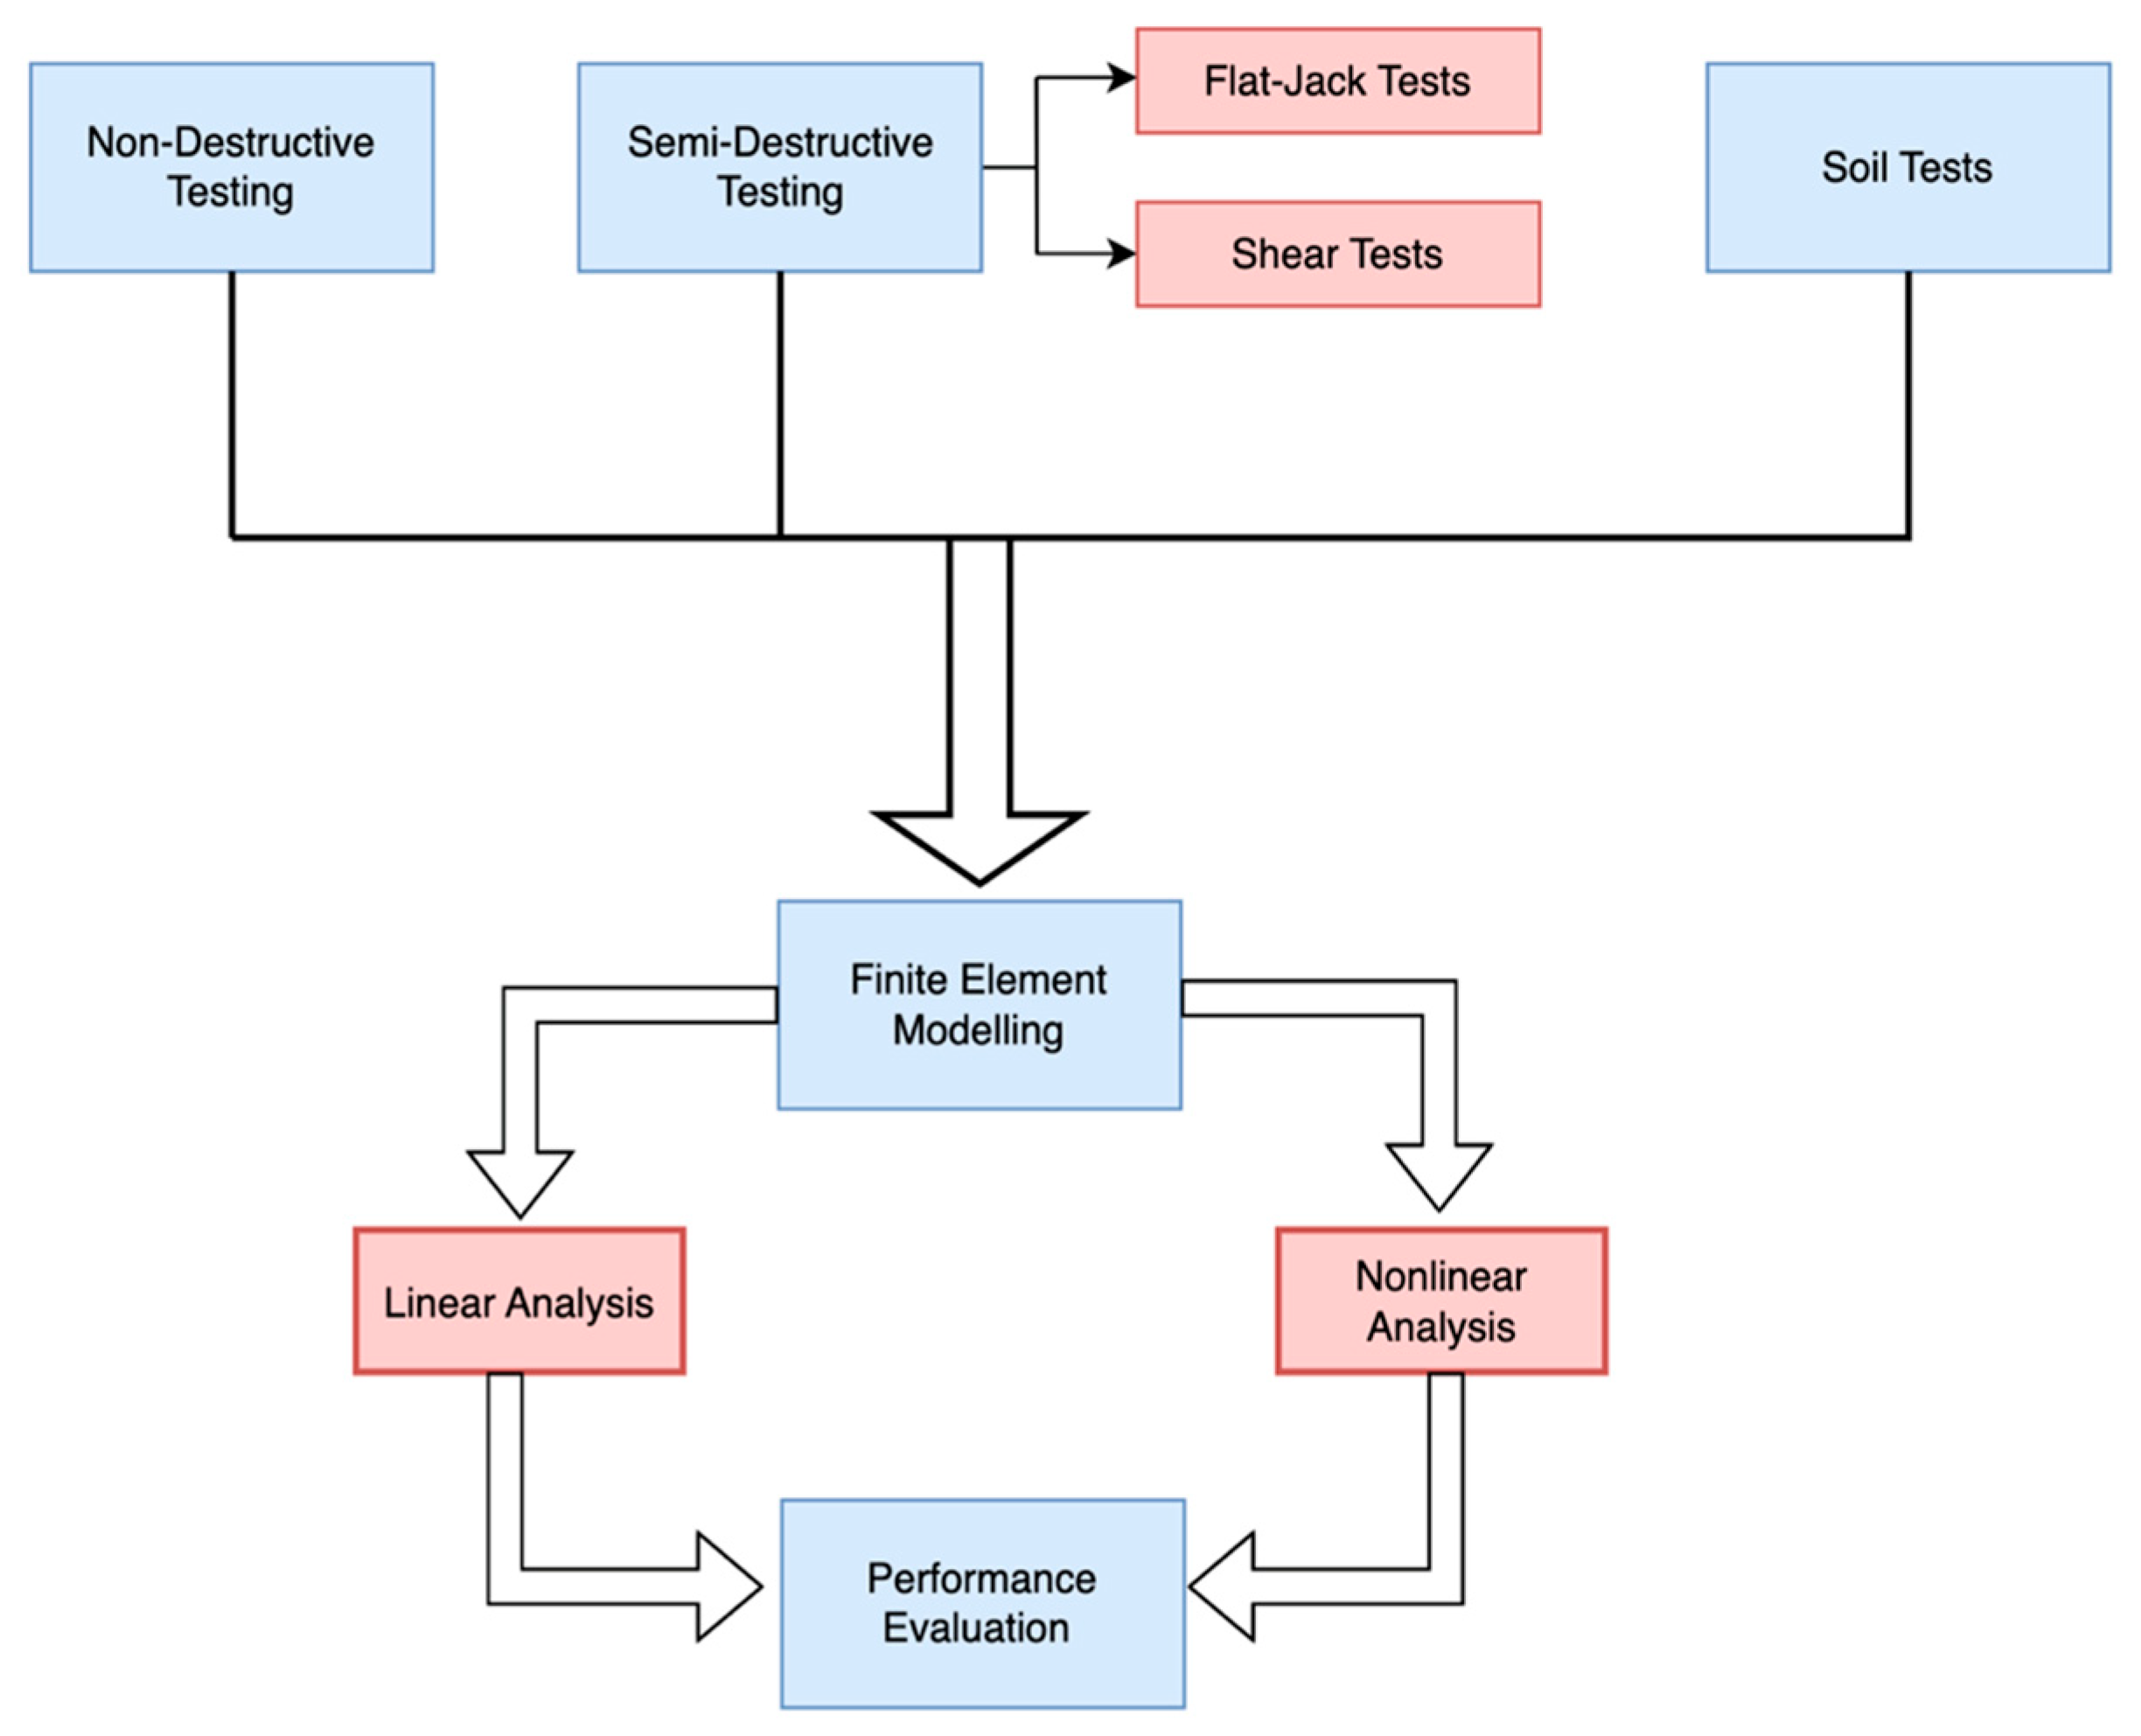
3. Material Tests
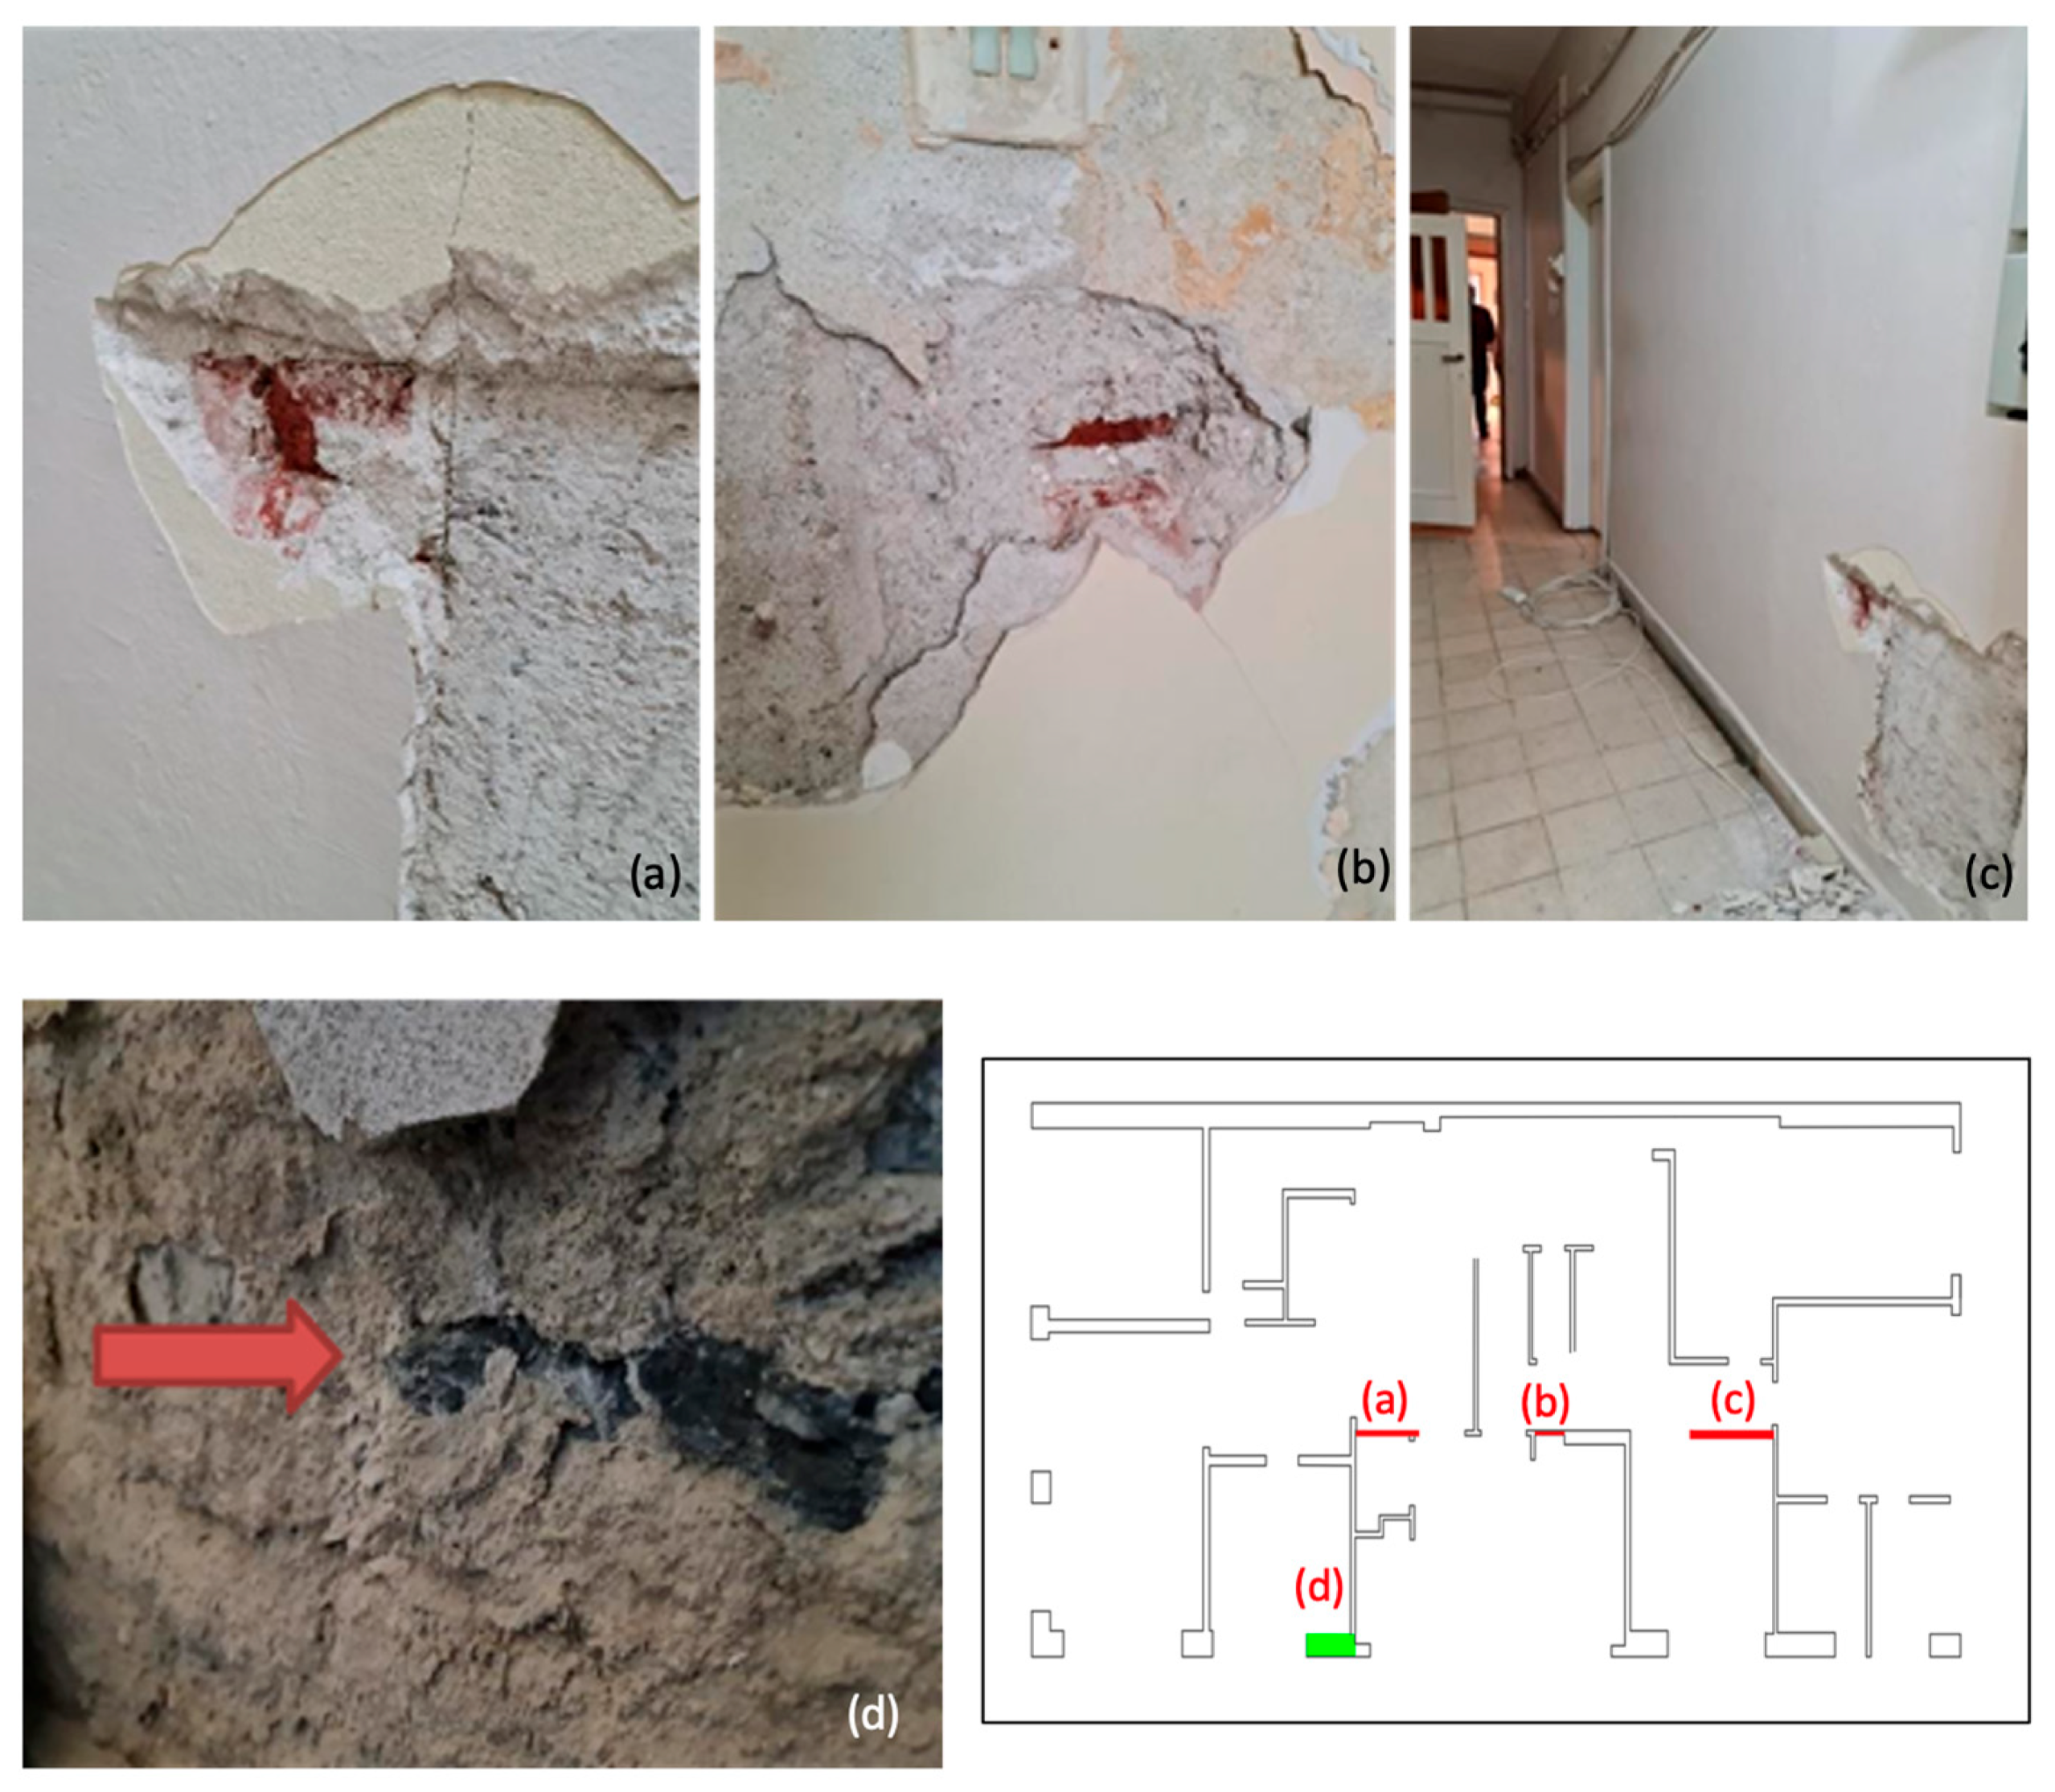
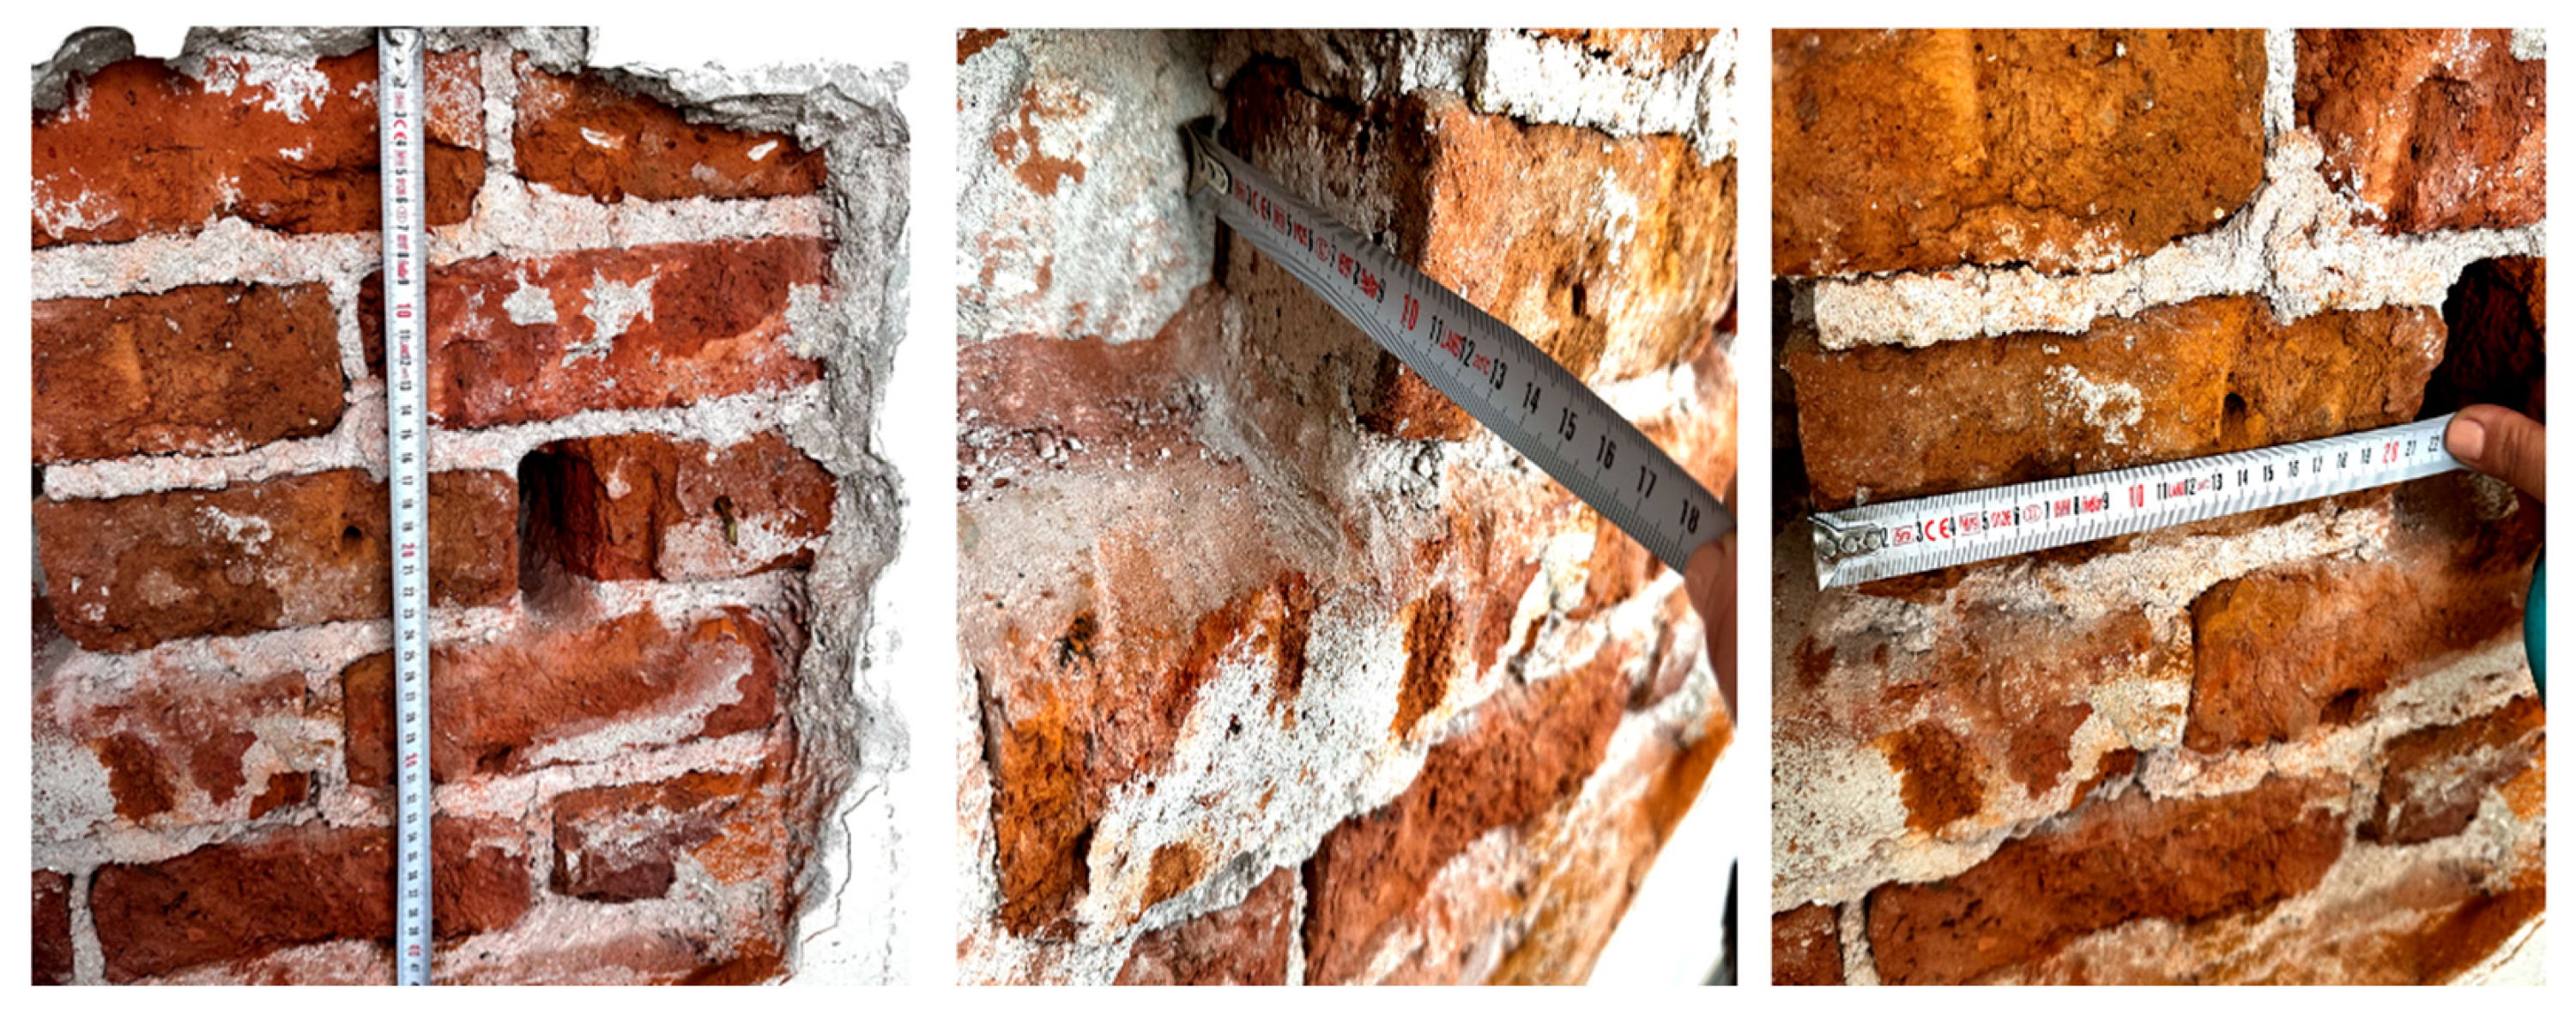
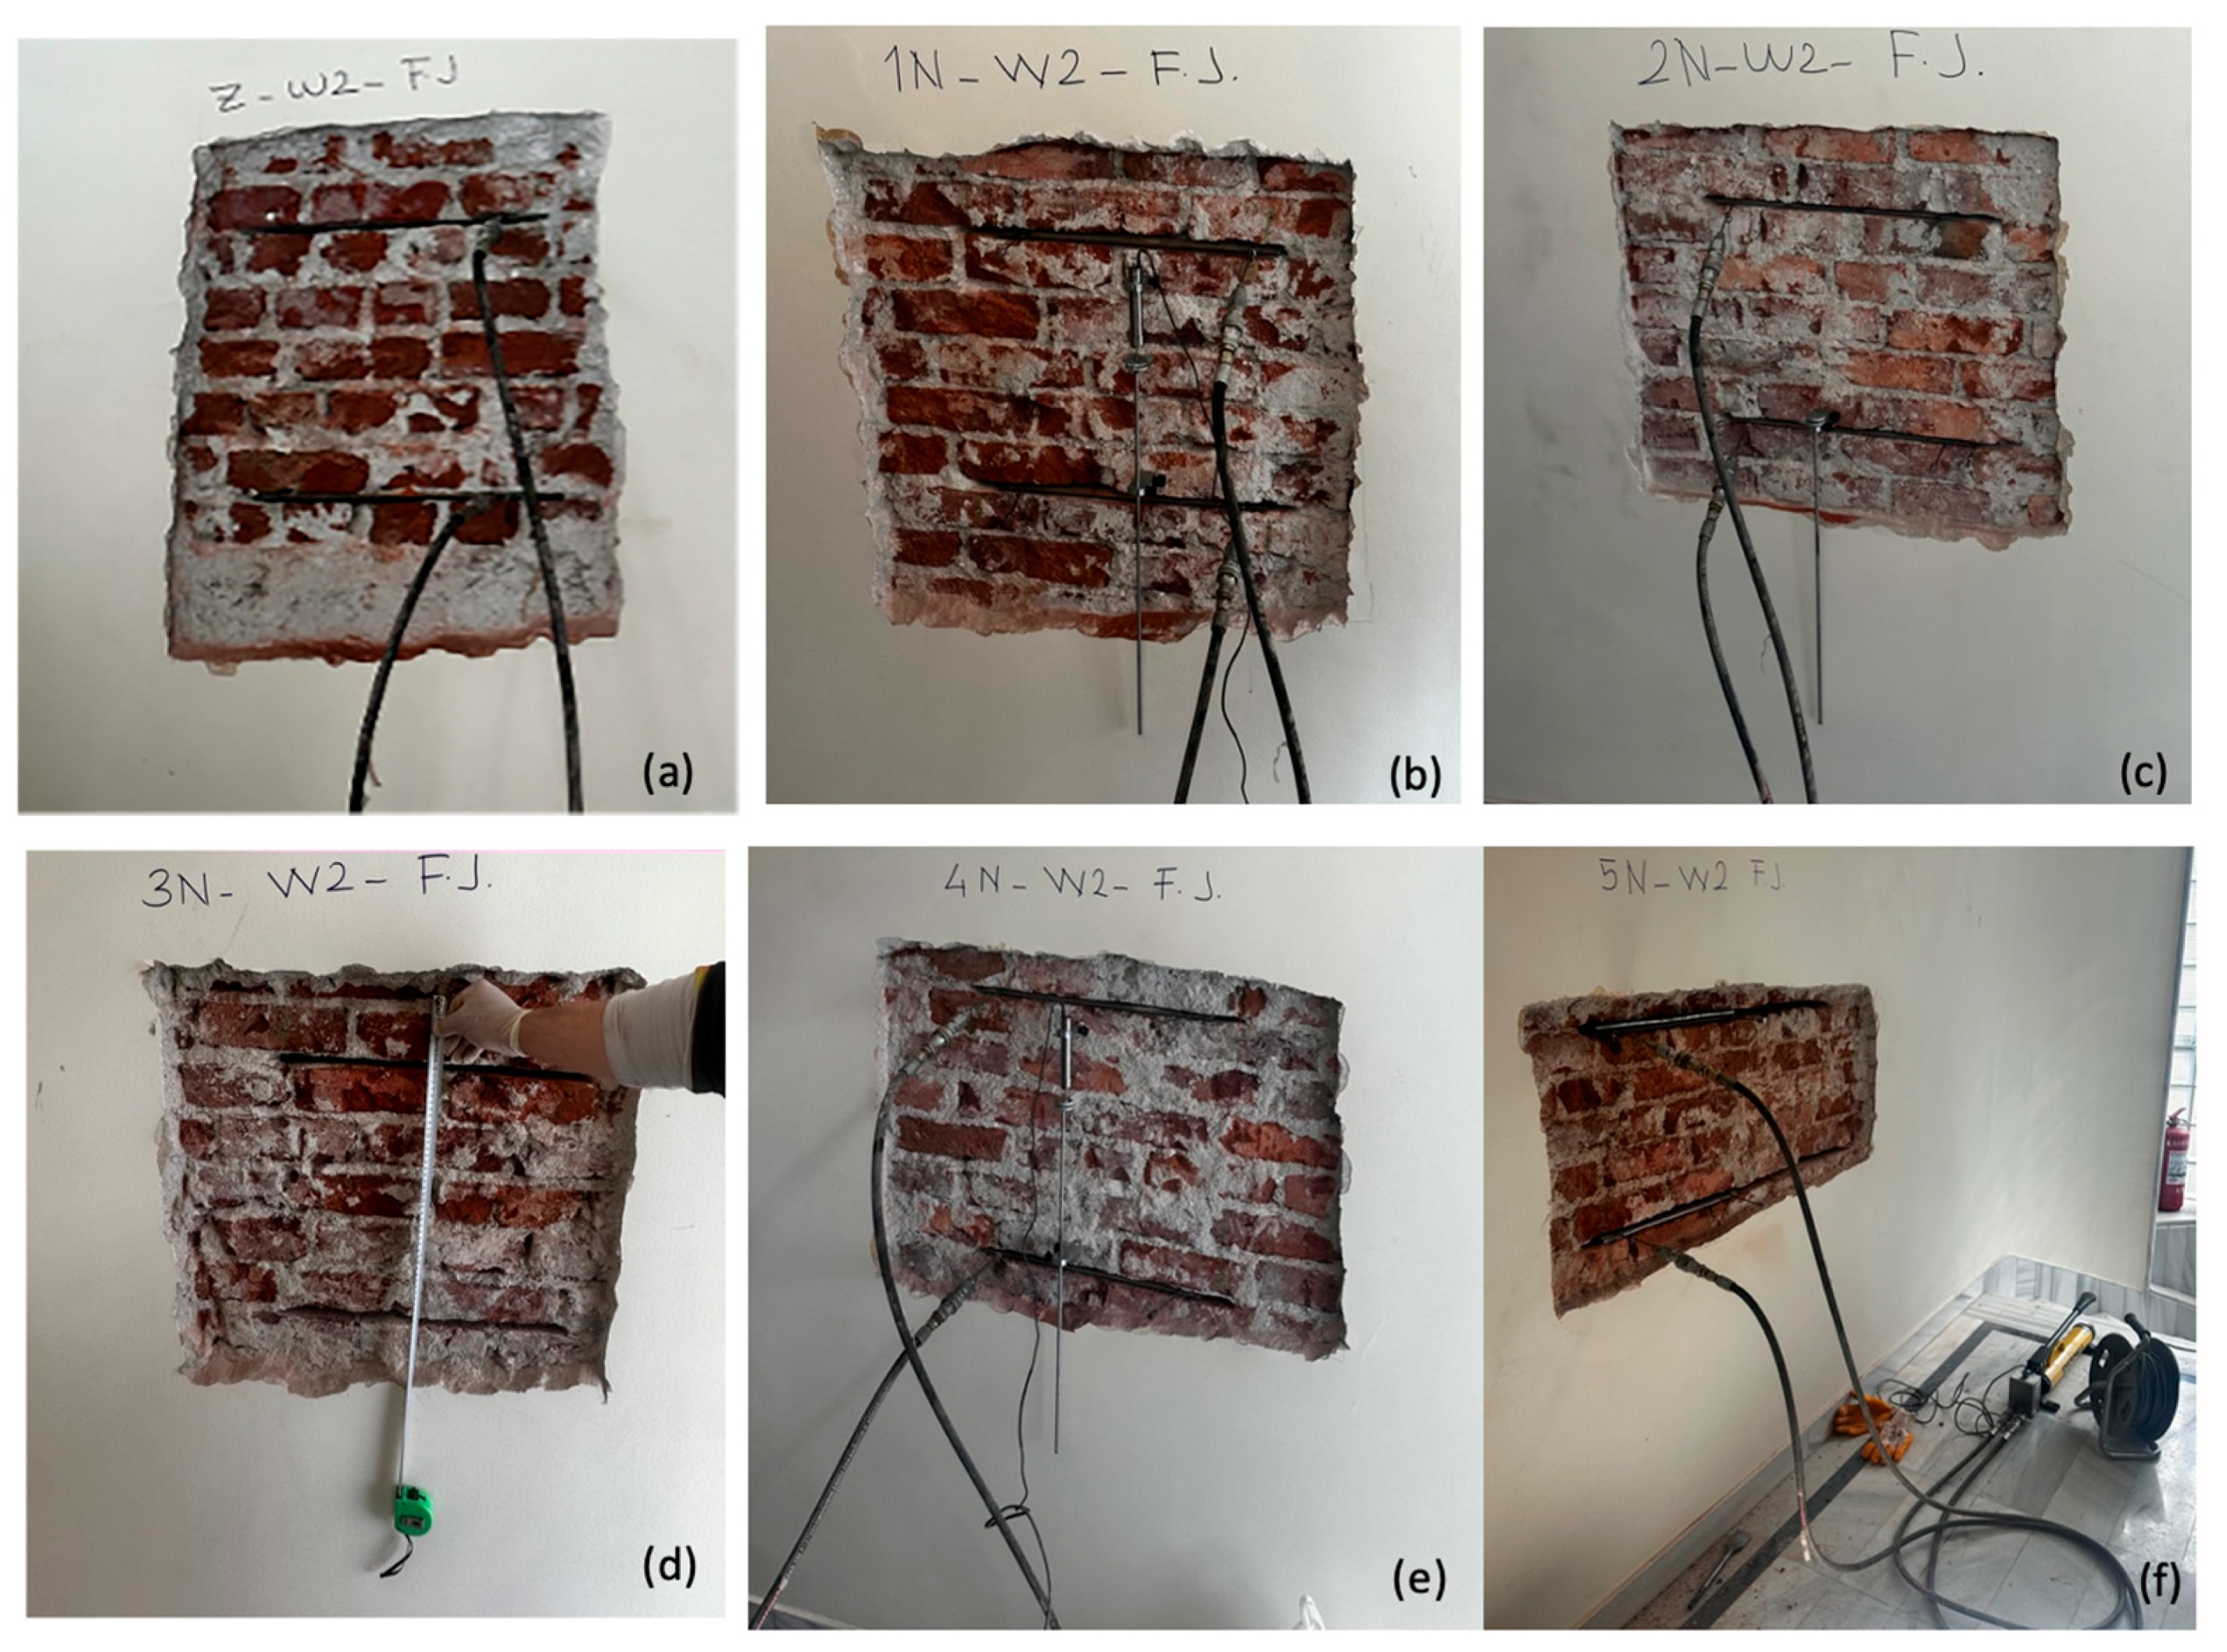
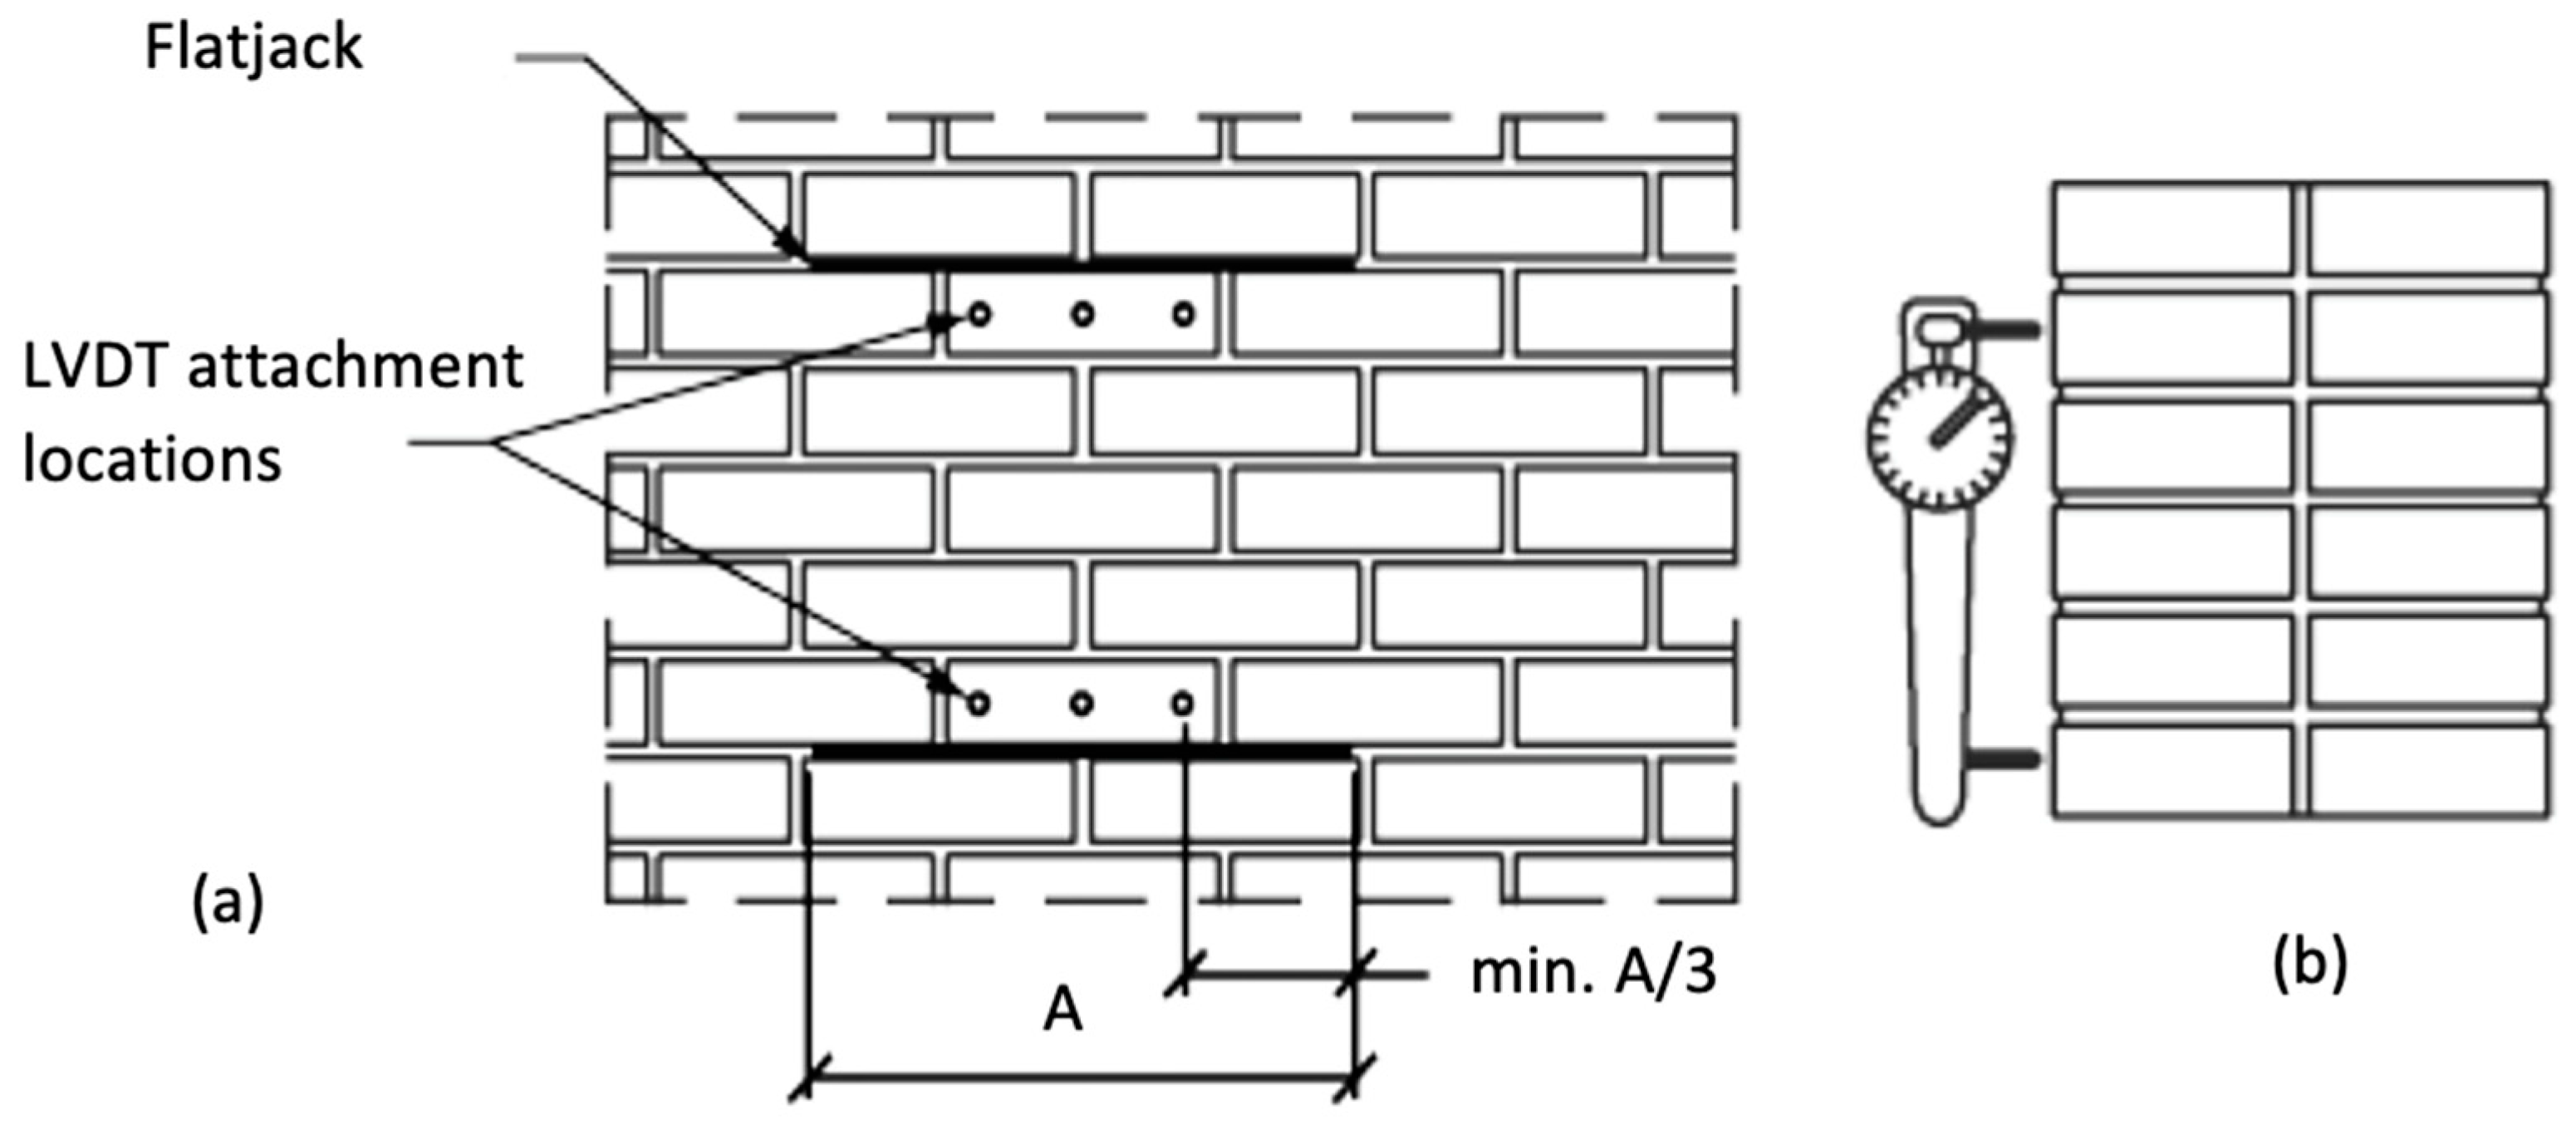
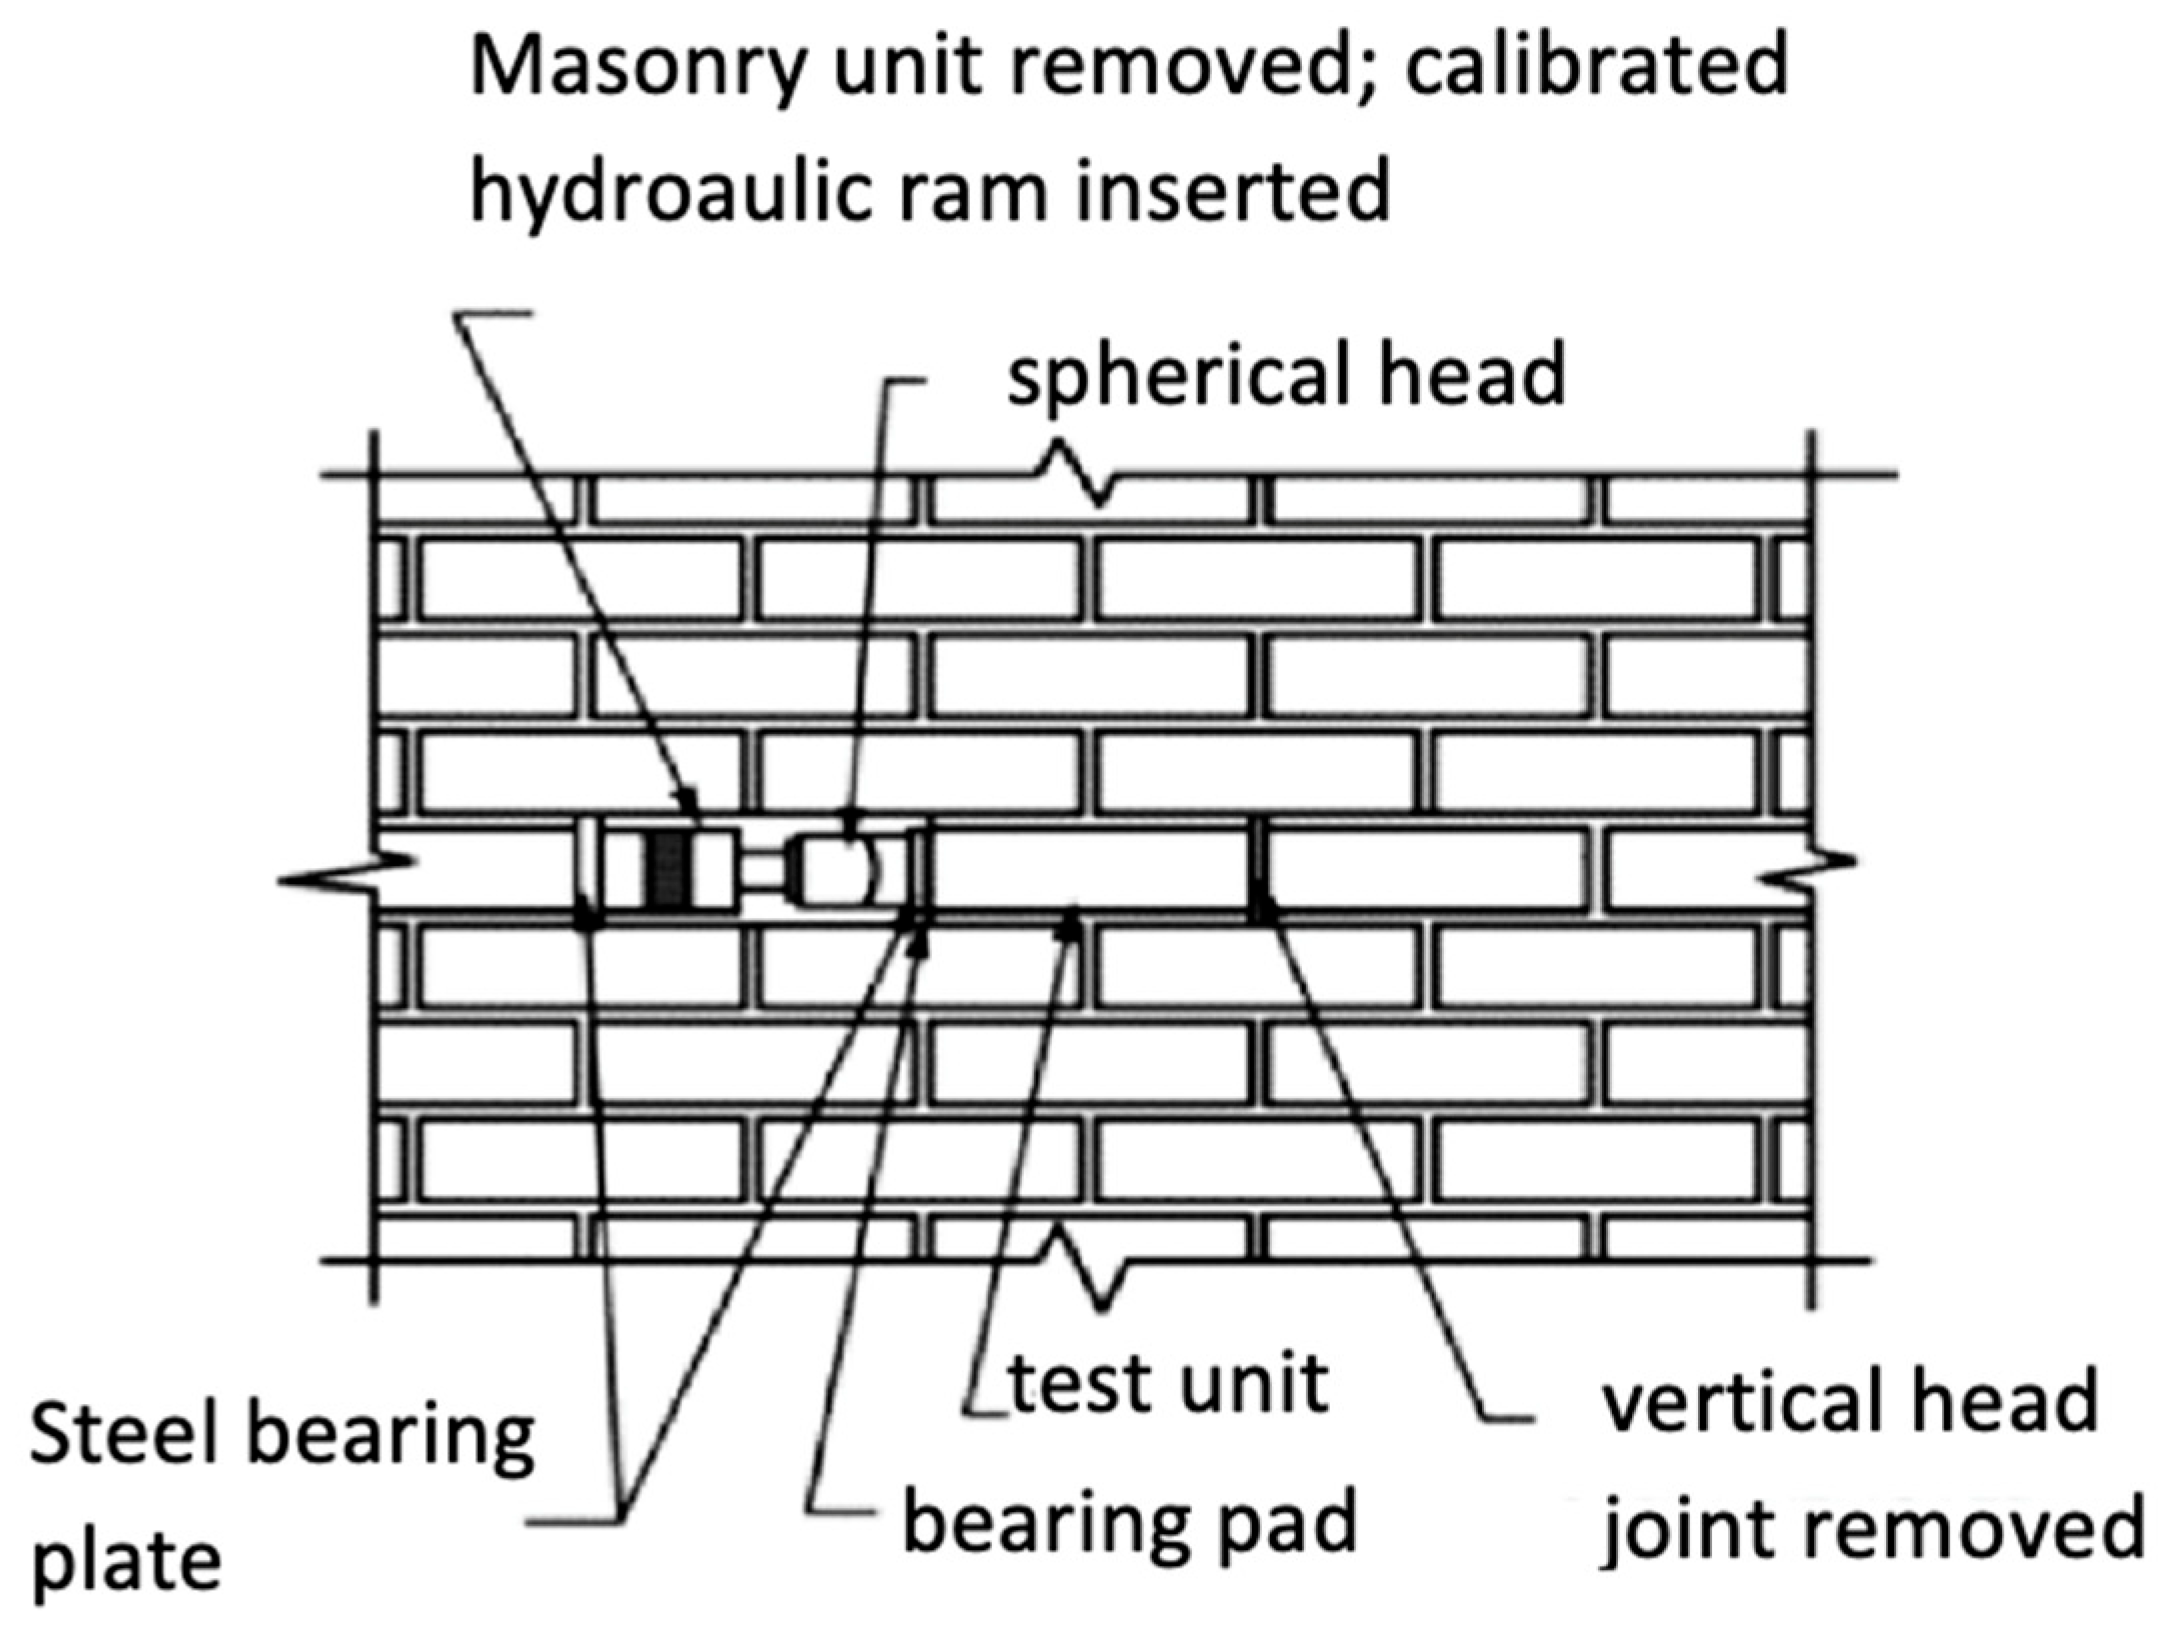
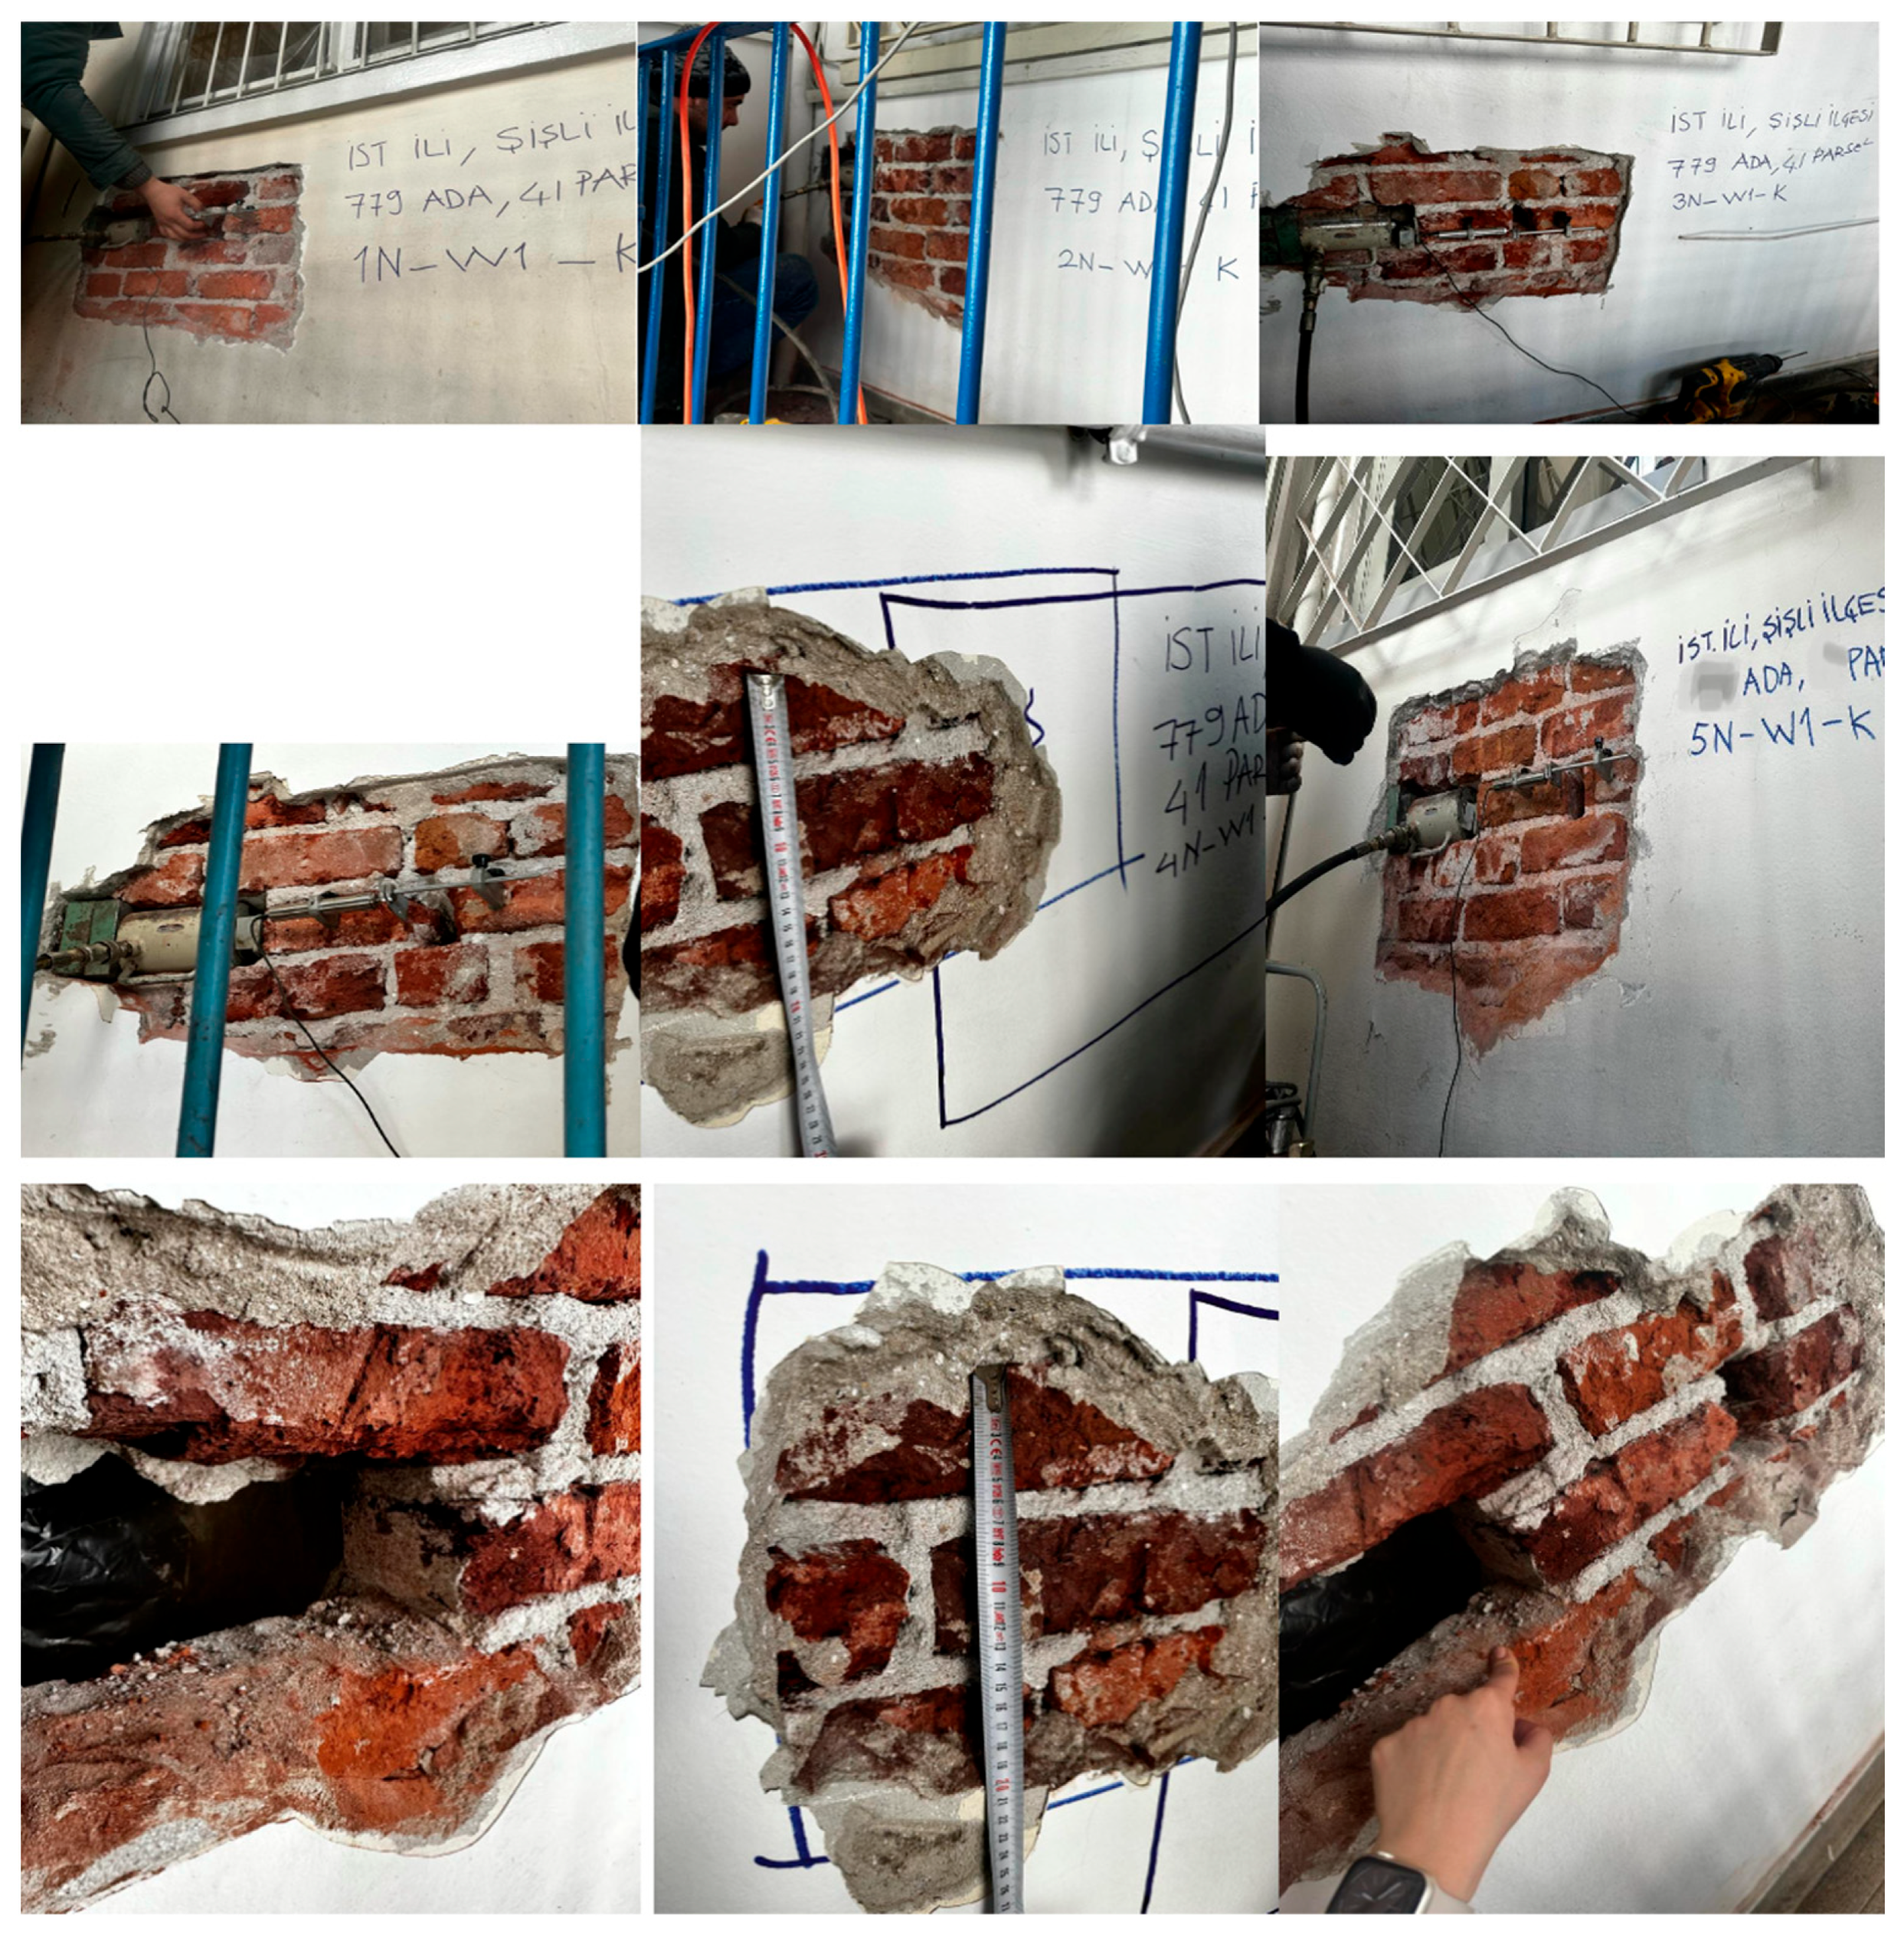
3.1. Flat-Jack Tests
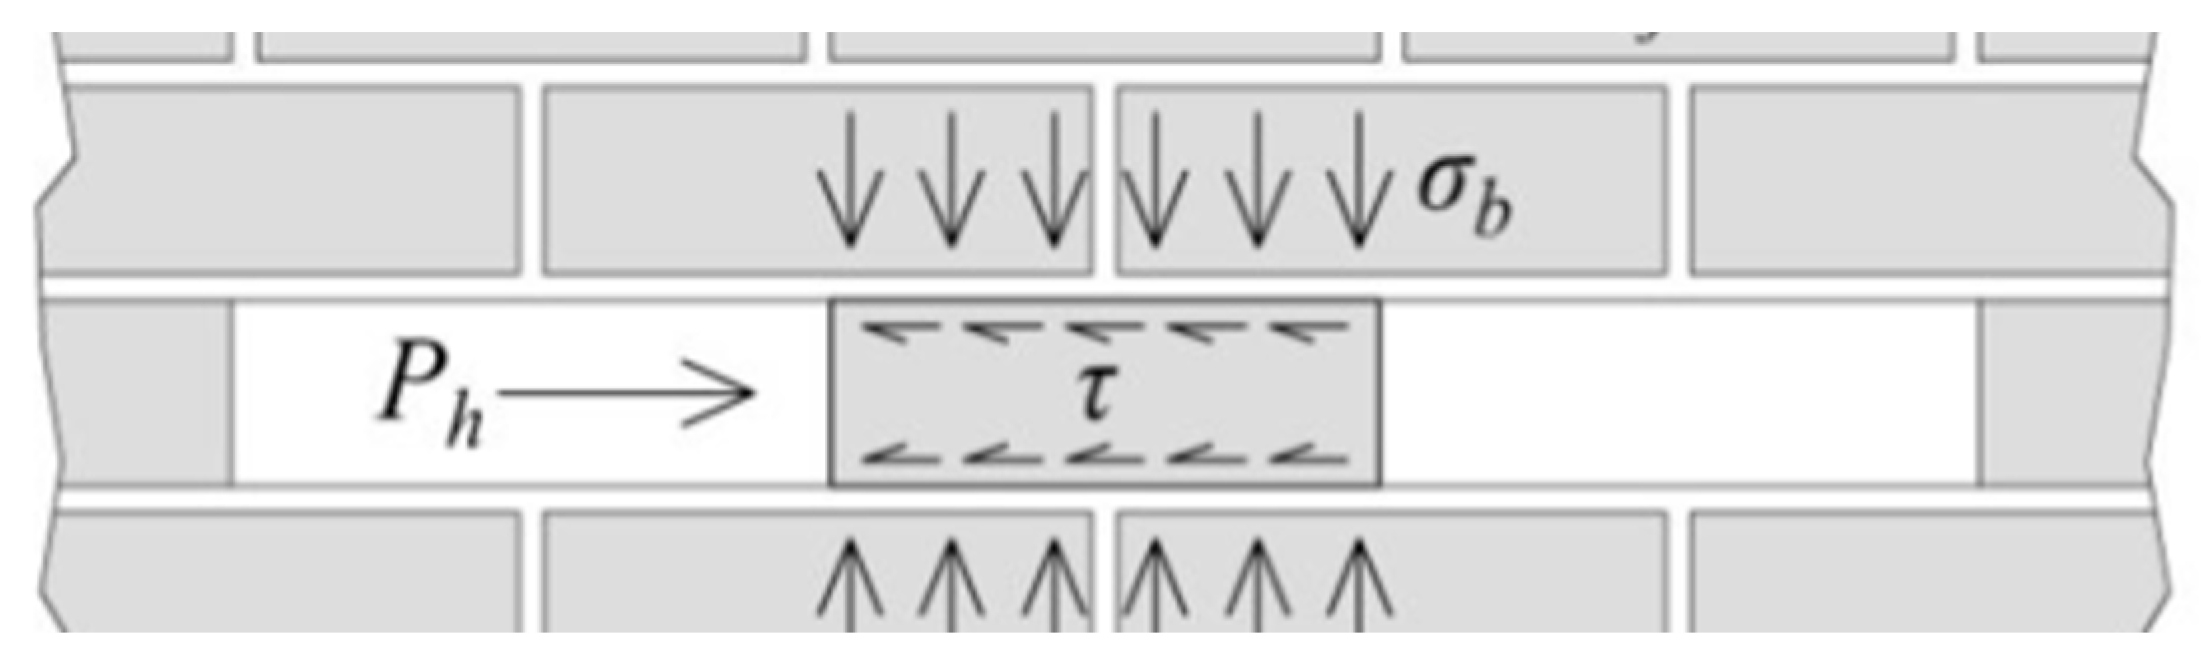
3.2. Shear Tests
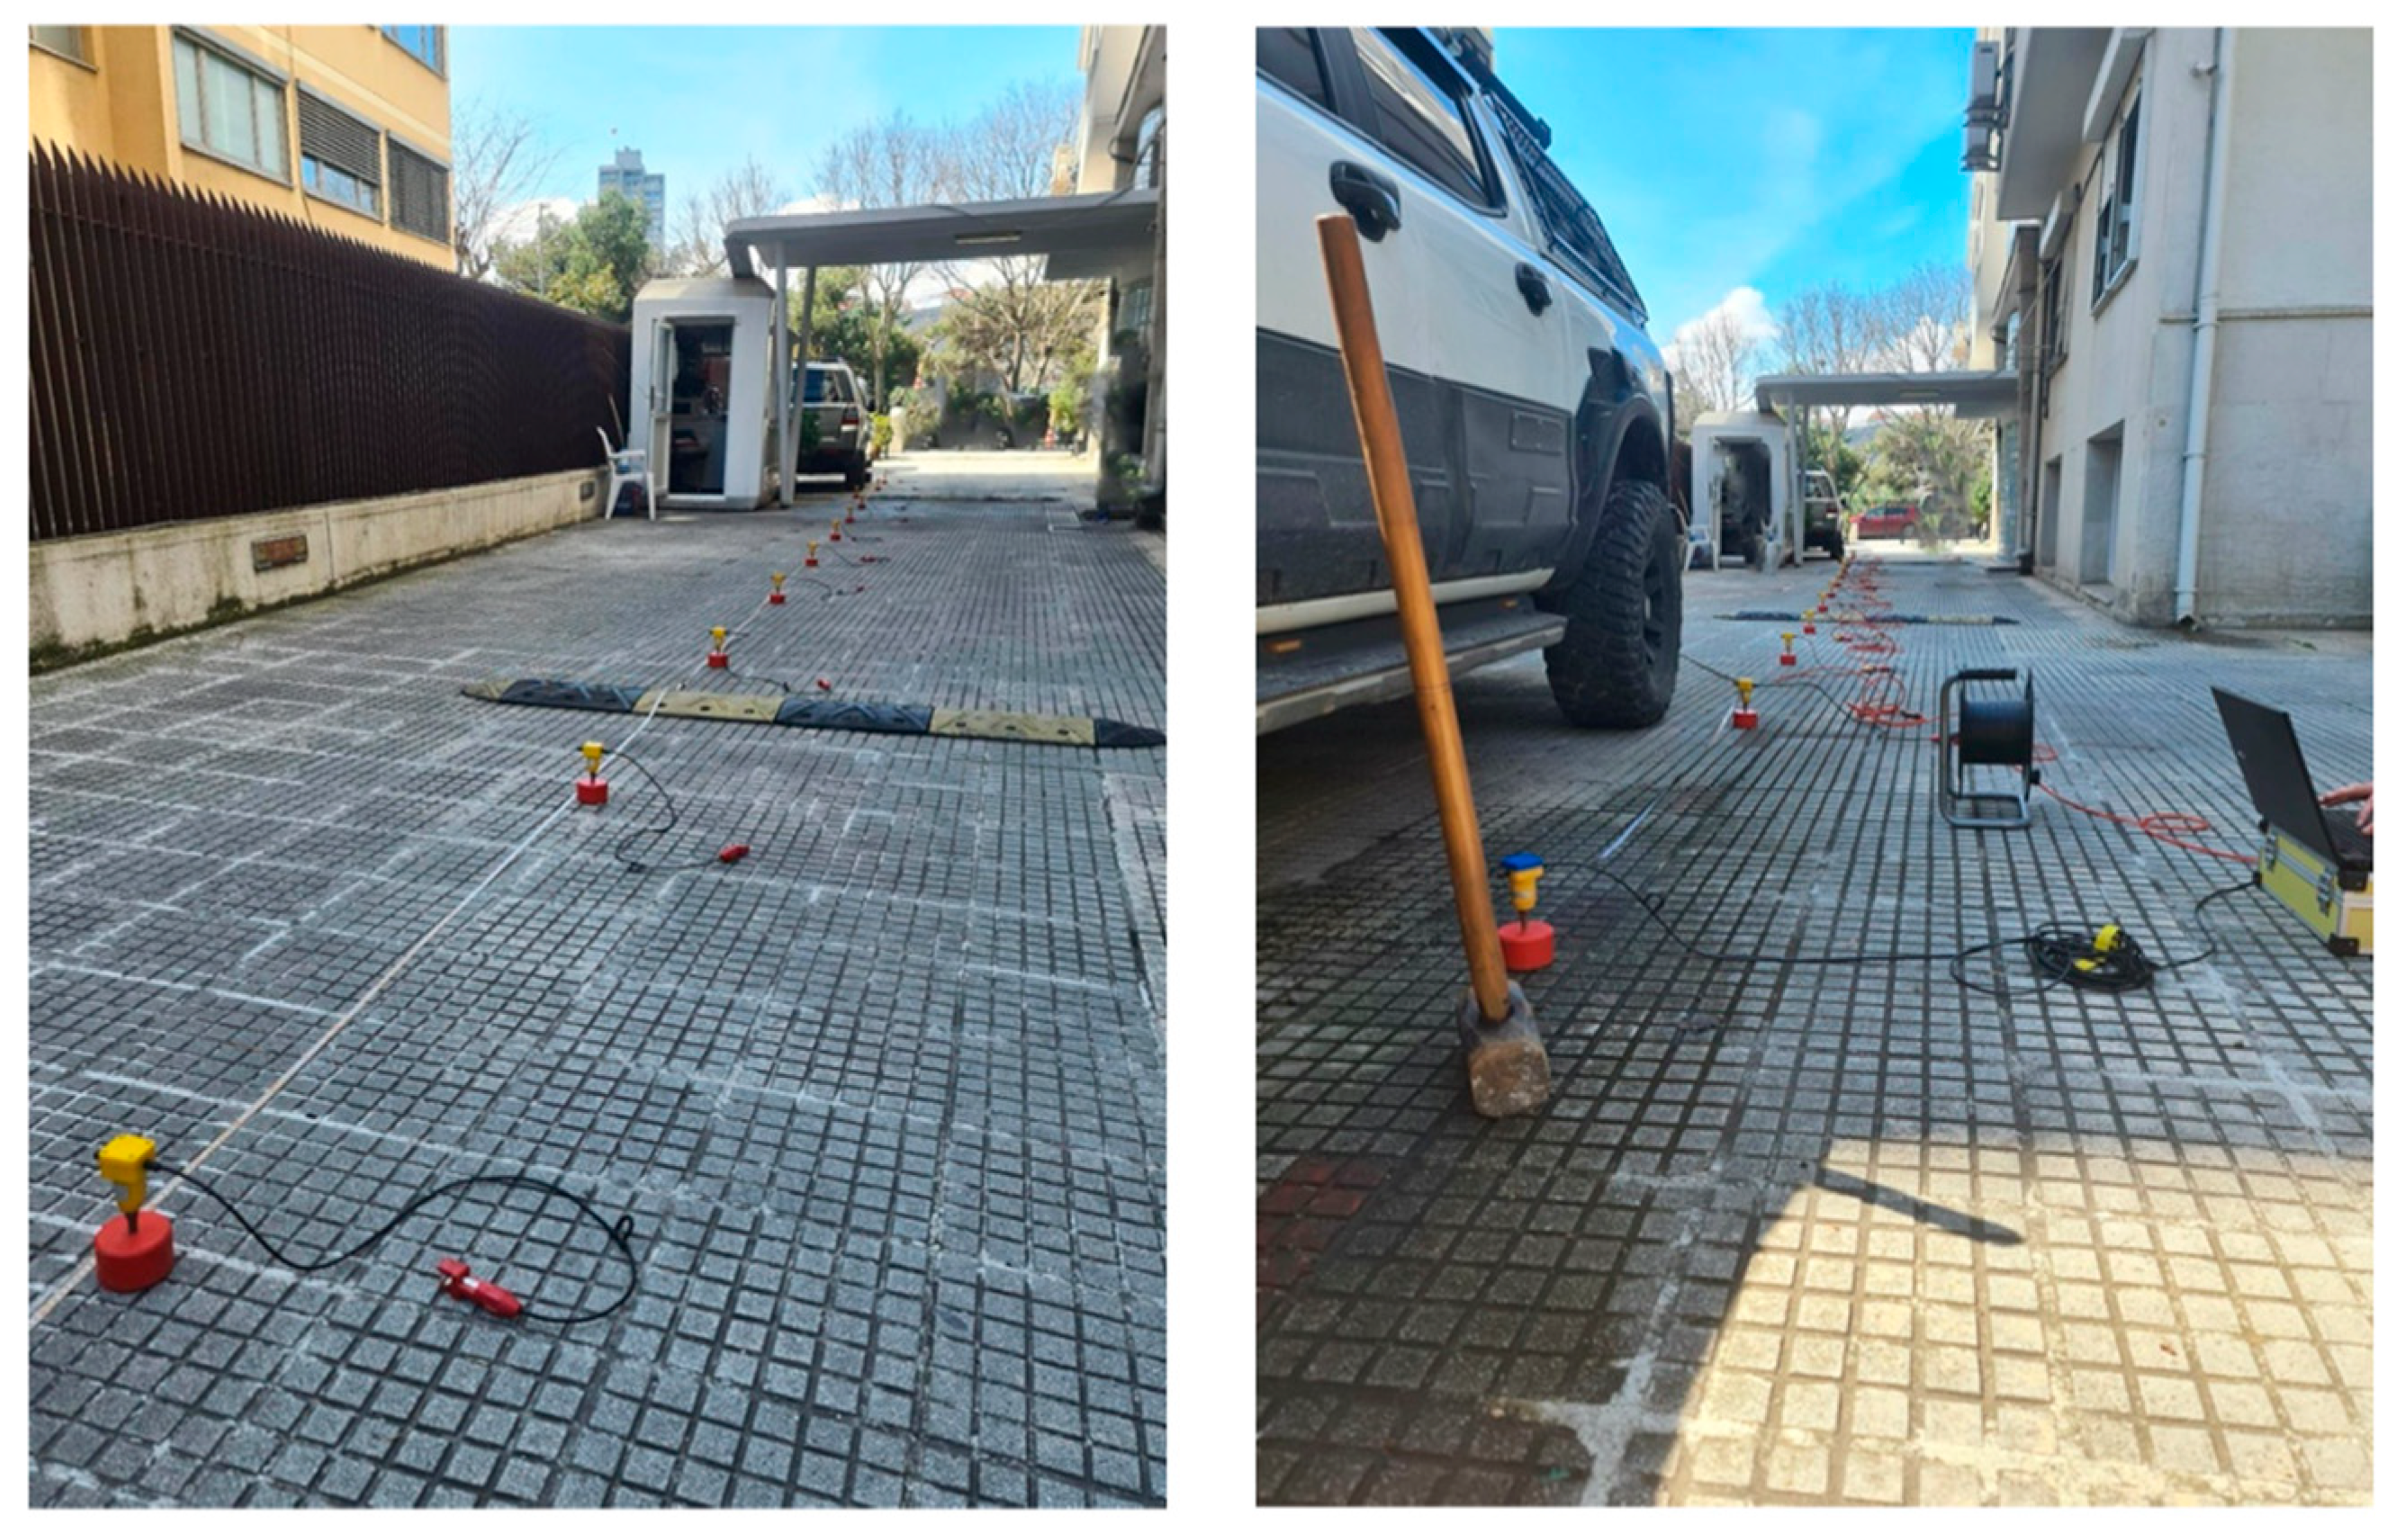
4. Soil Tests
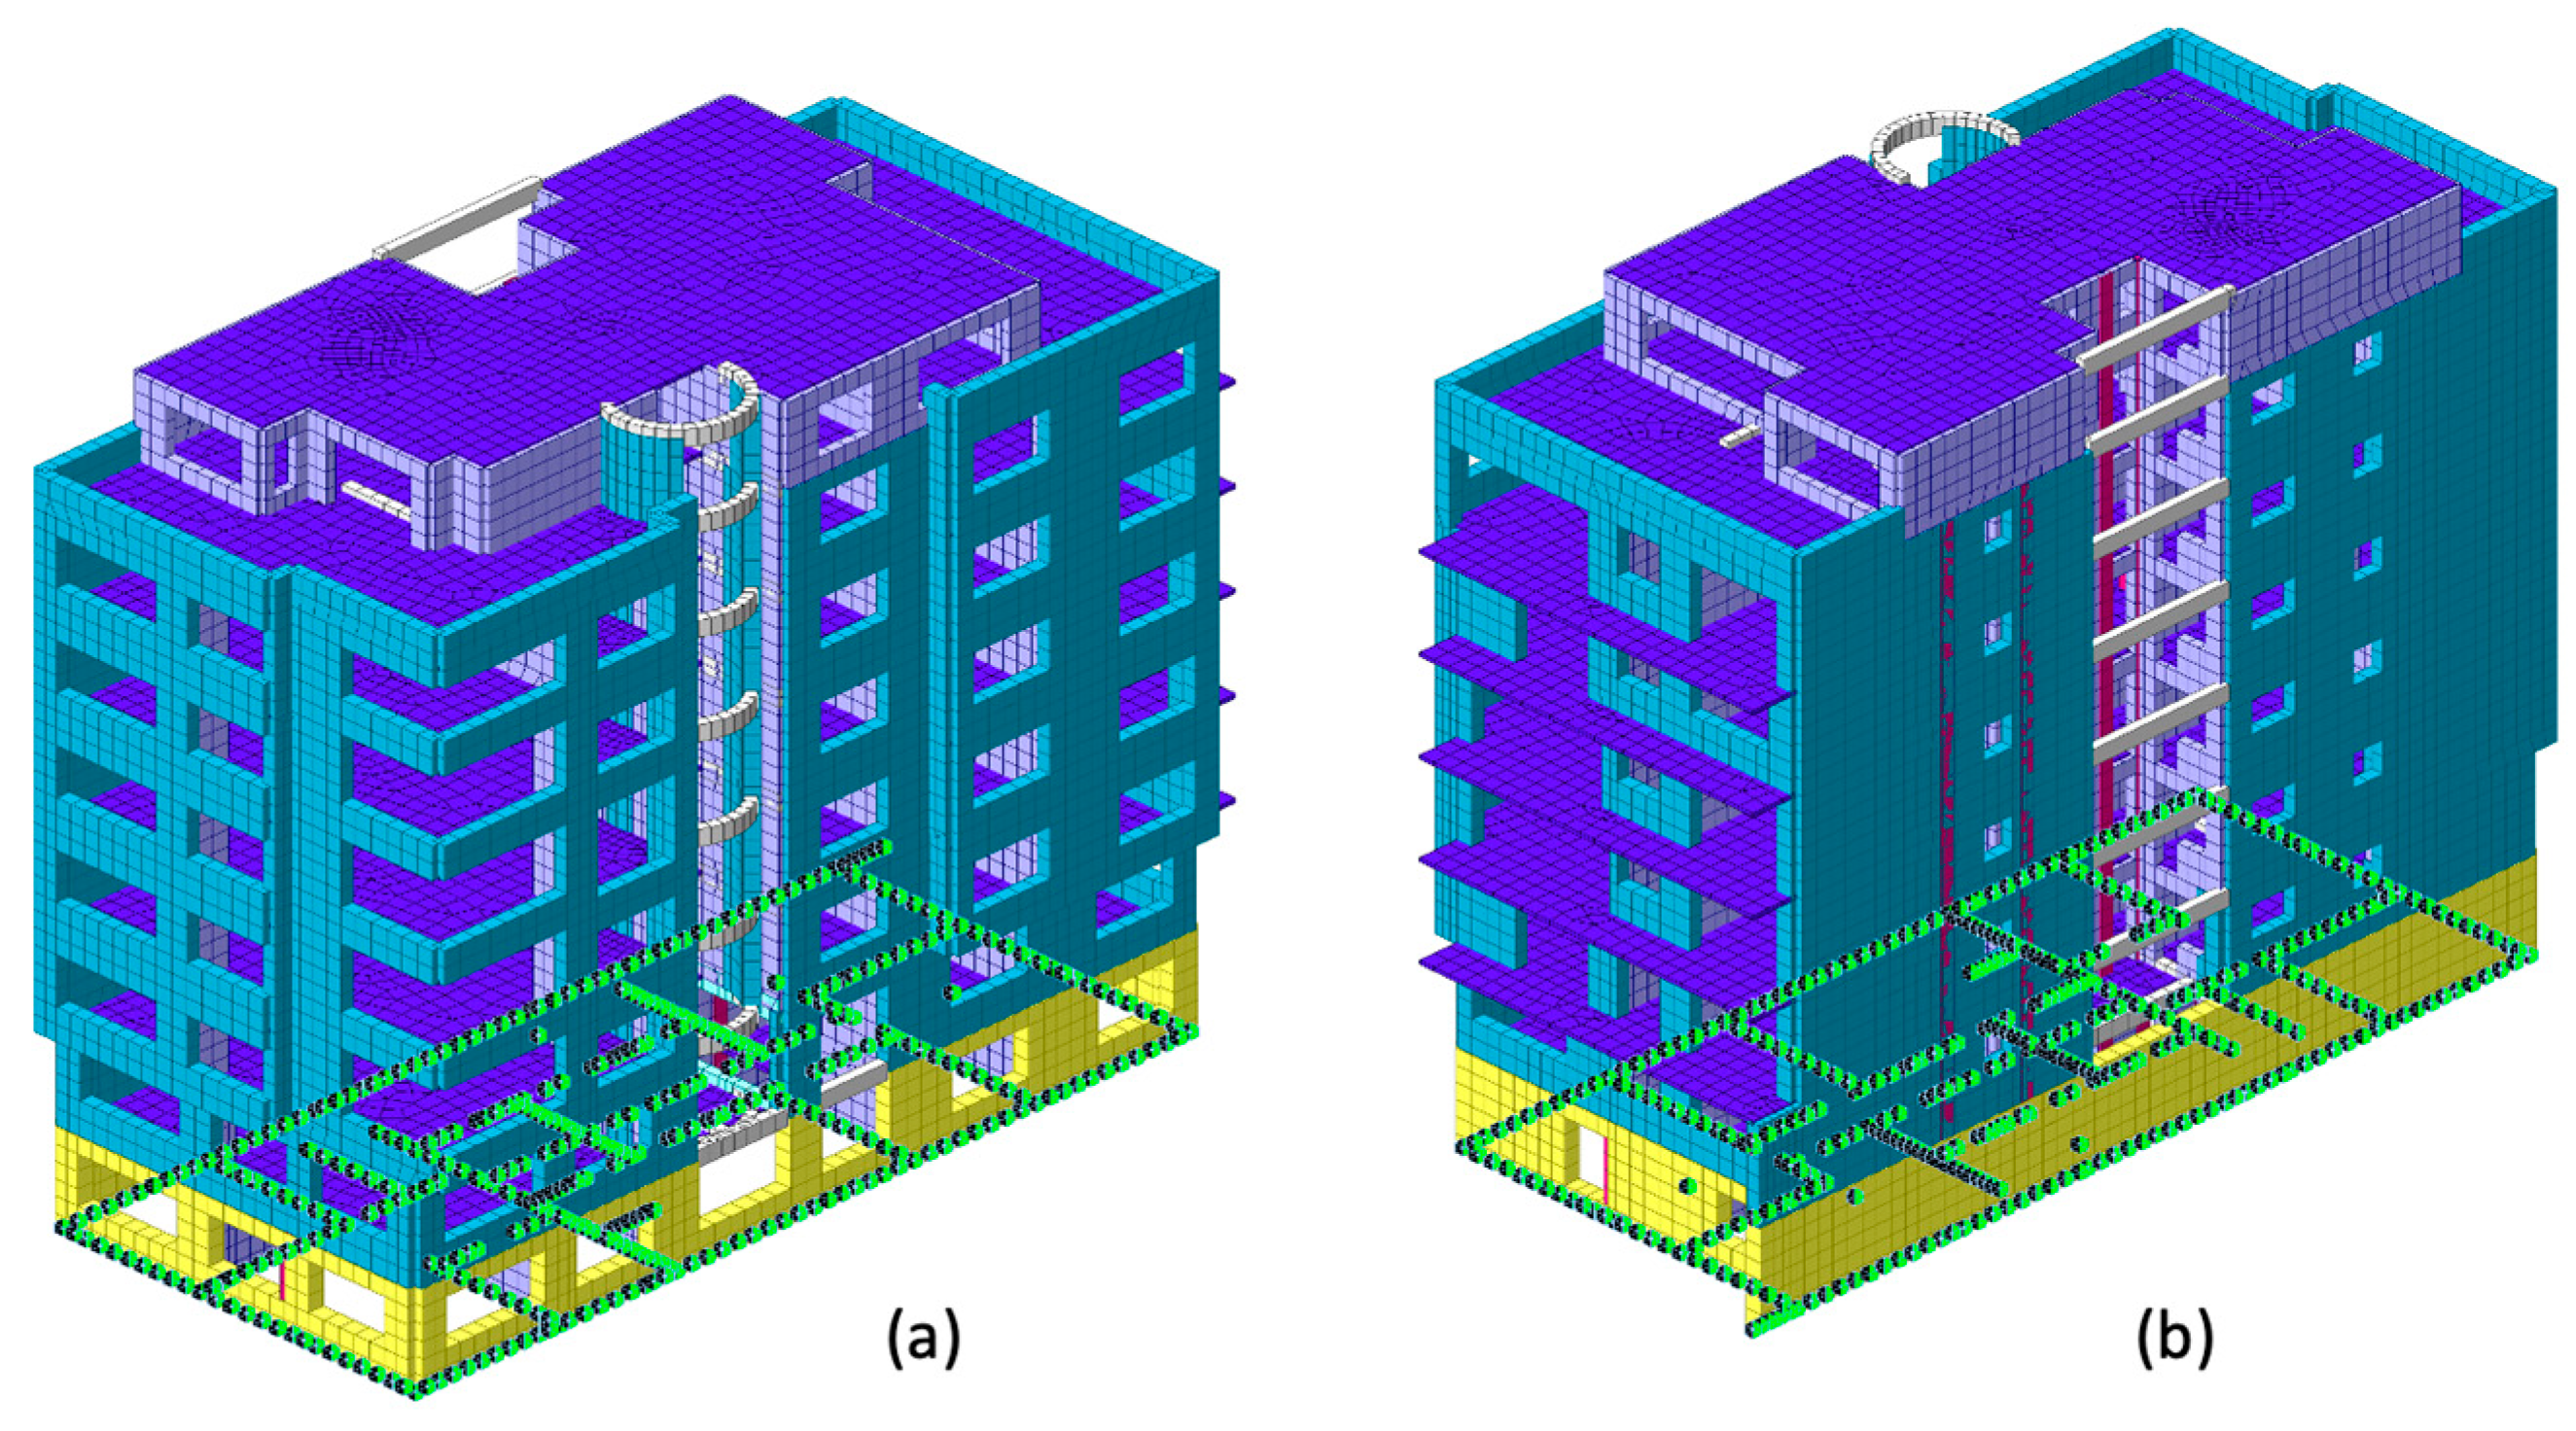
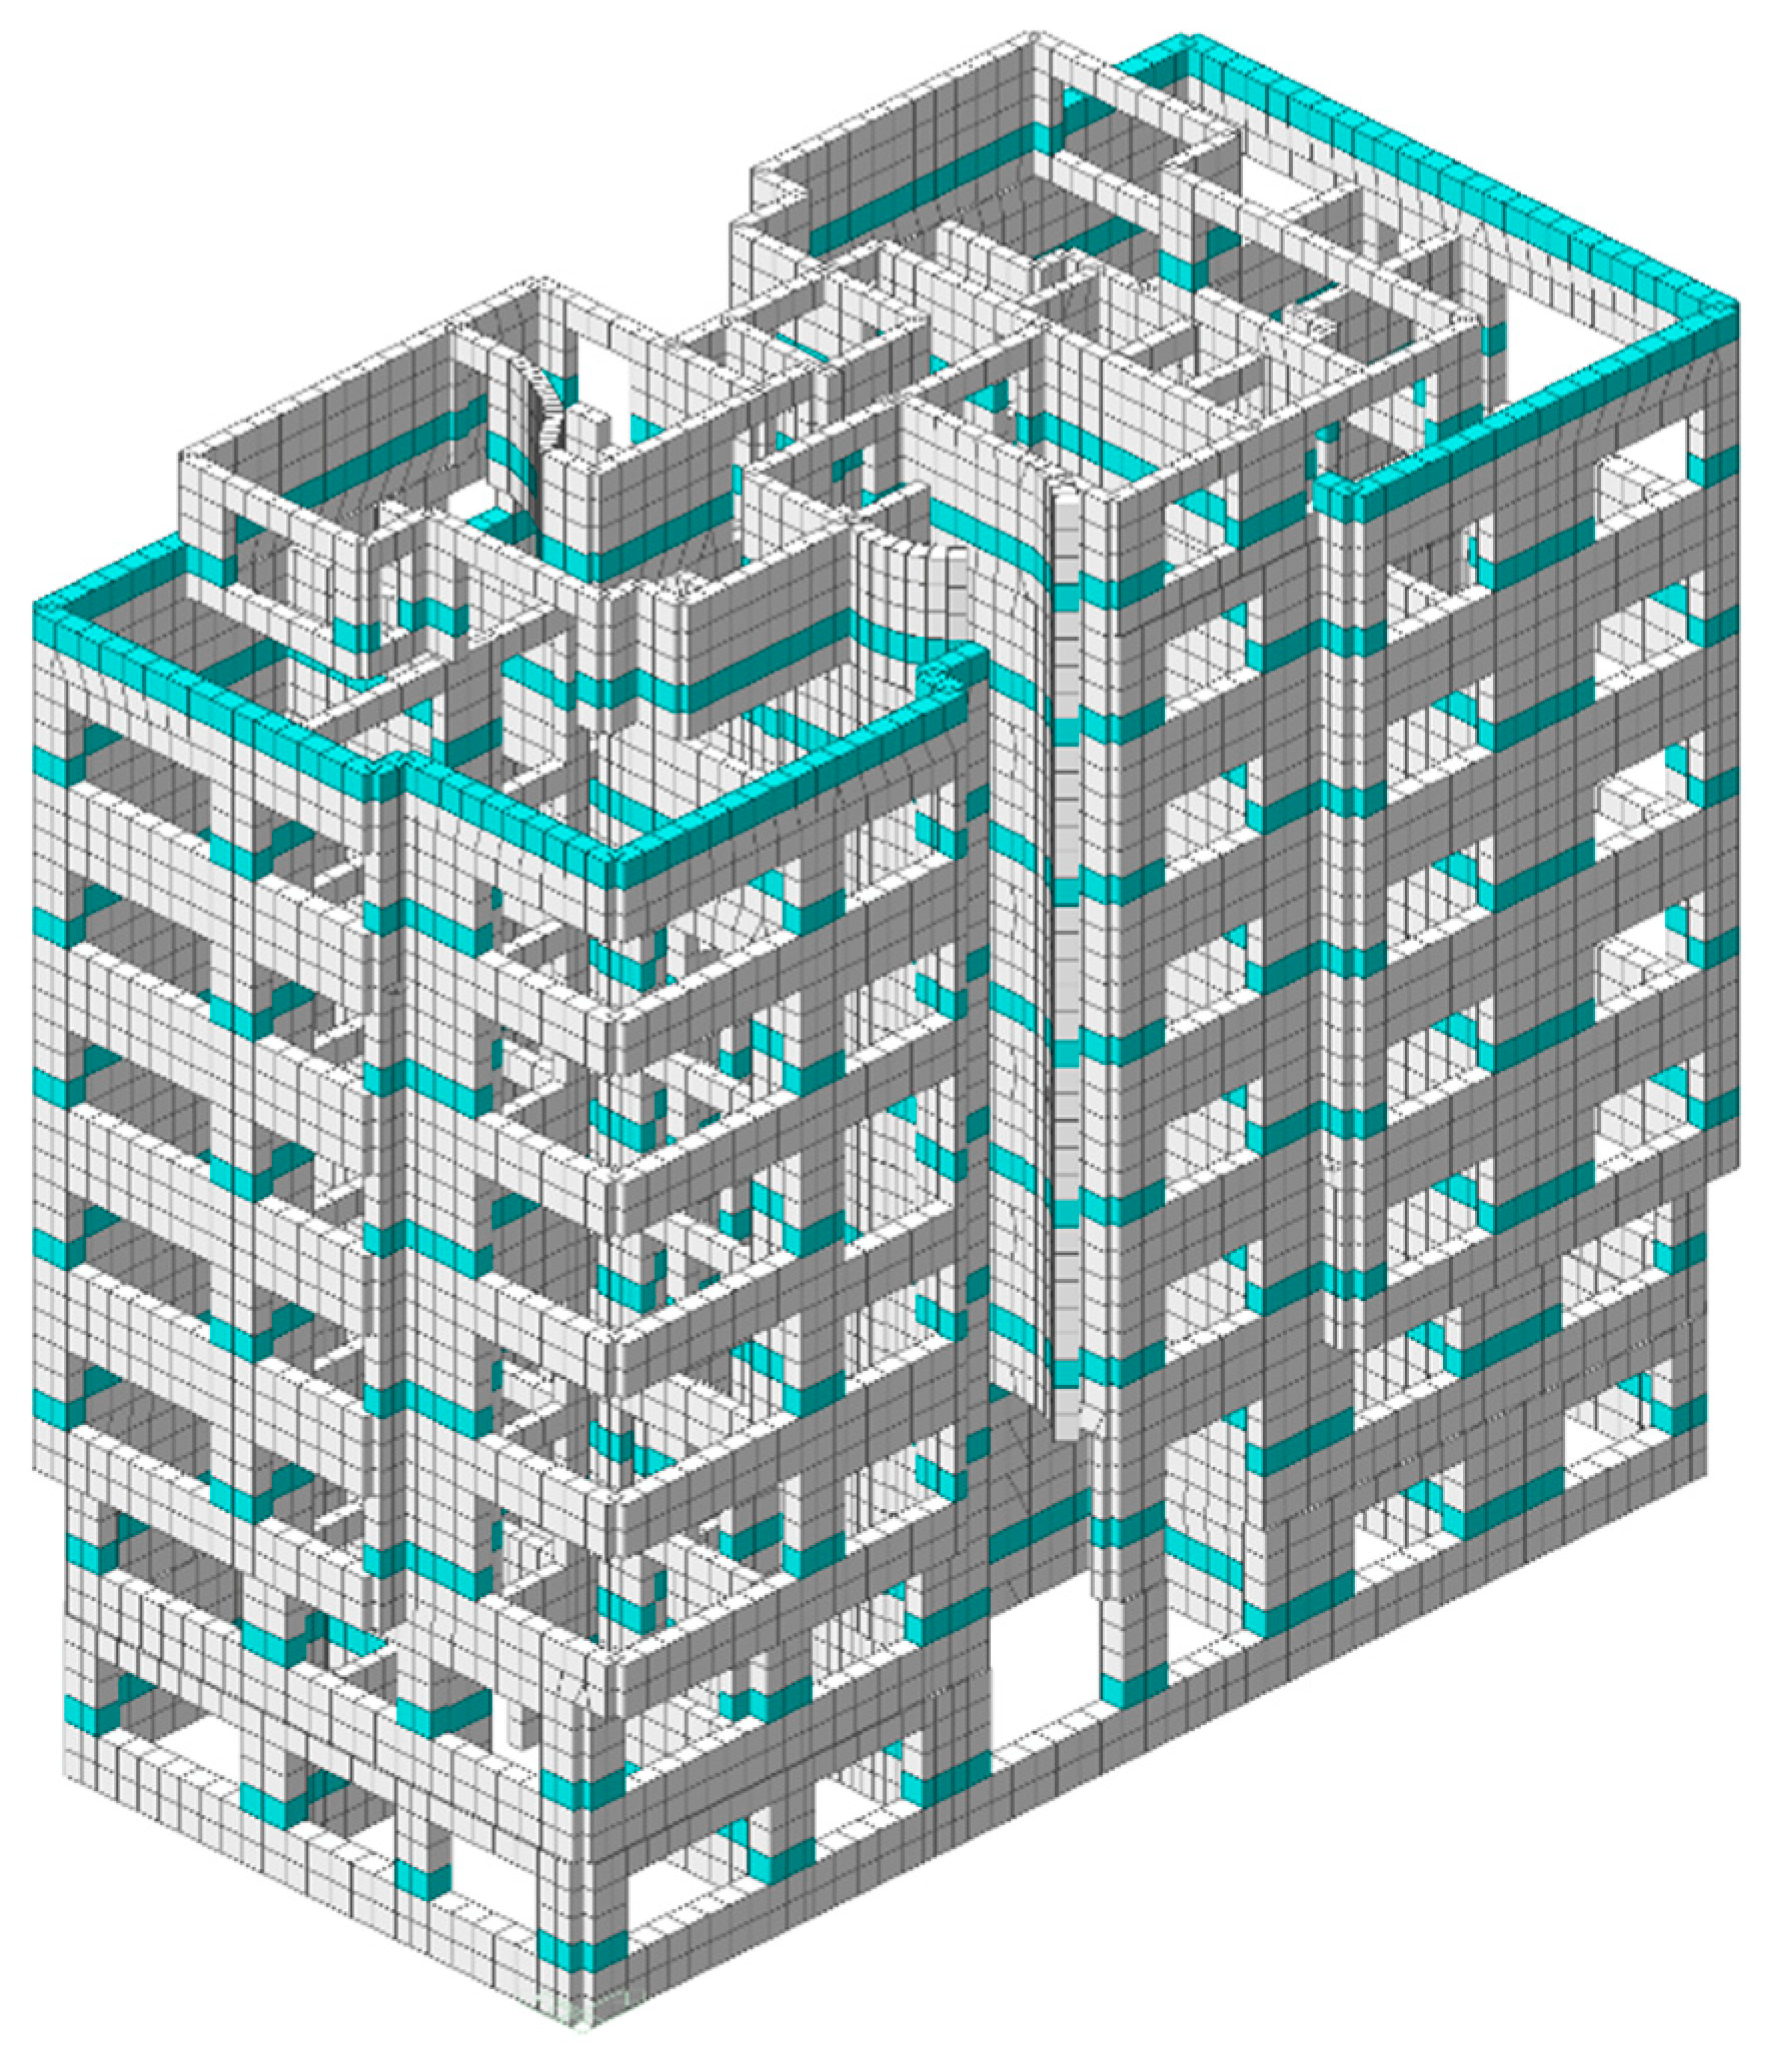
5. Finite Element Method
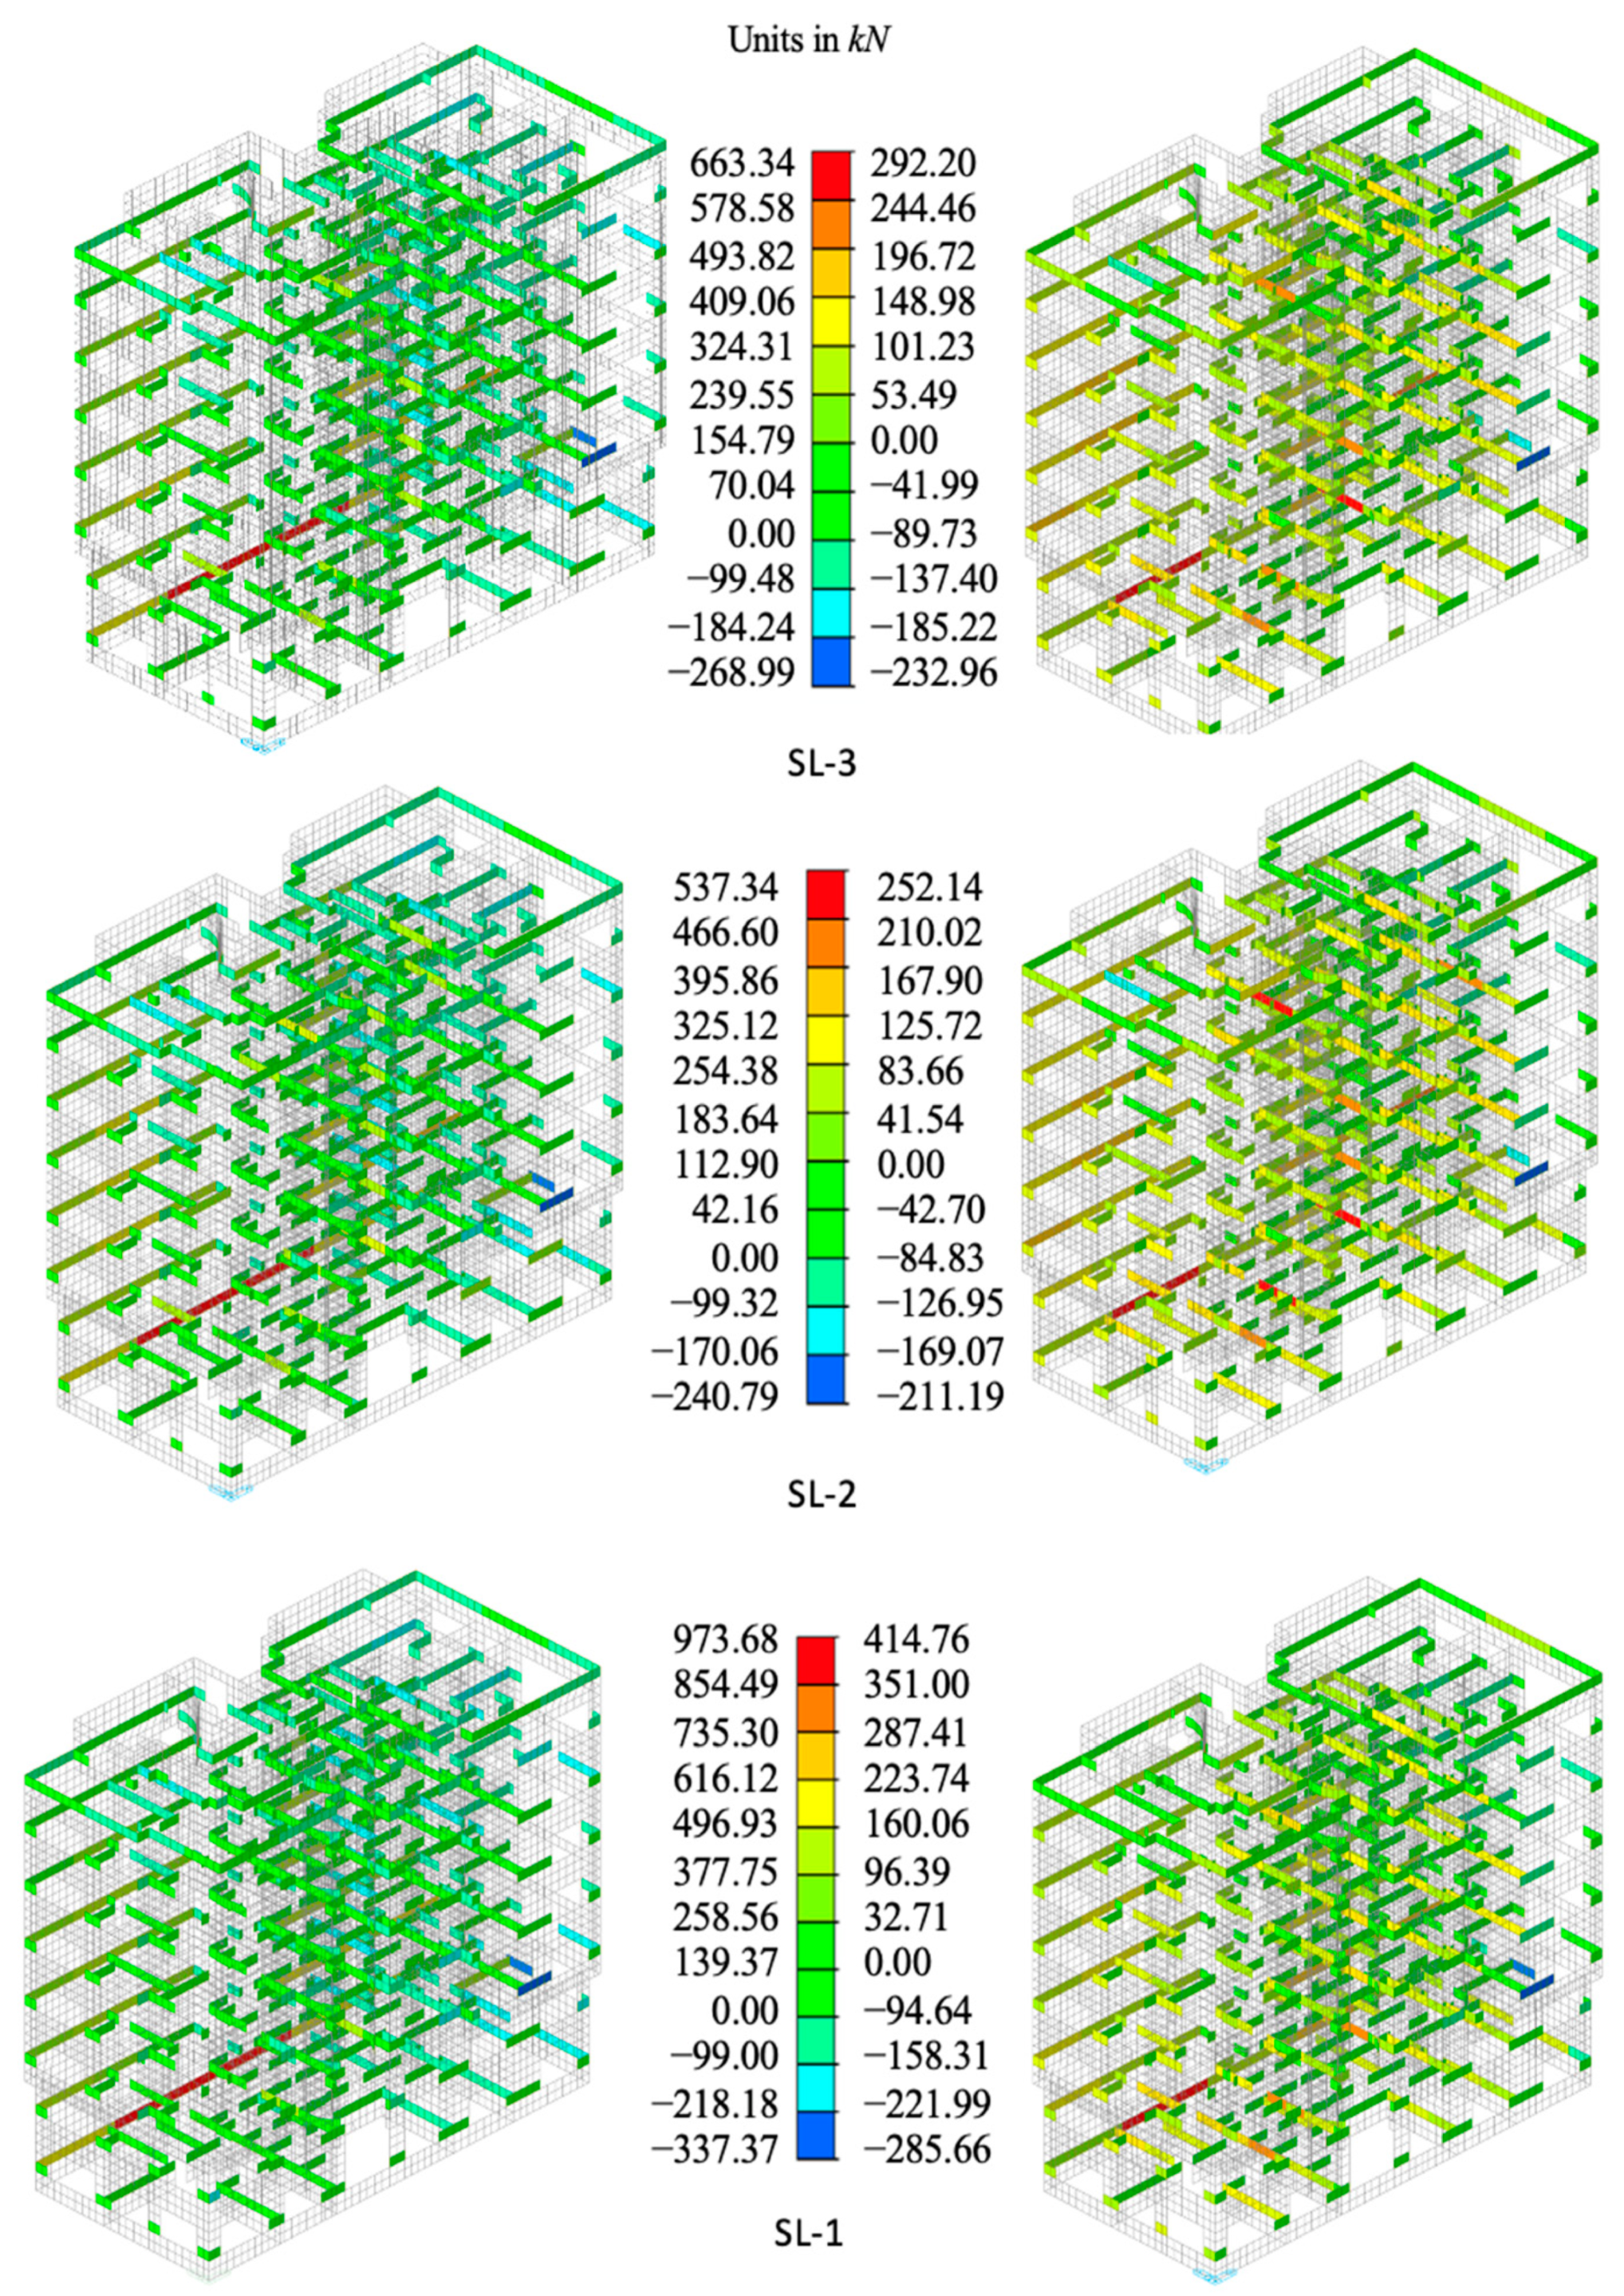
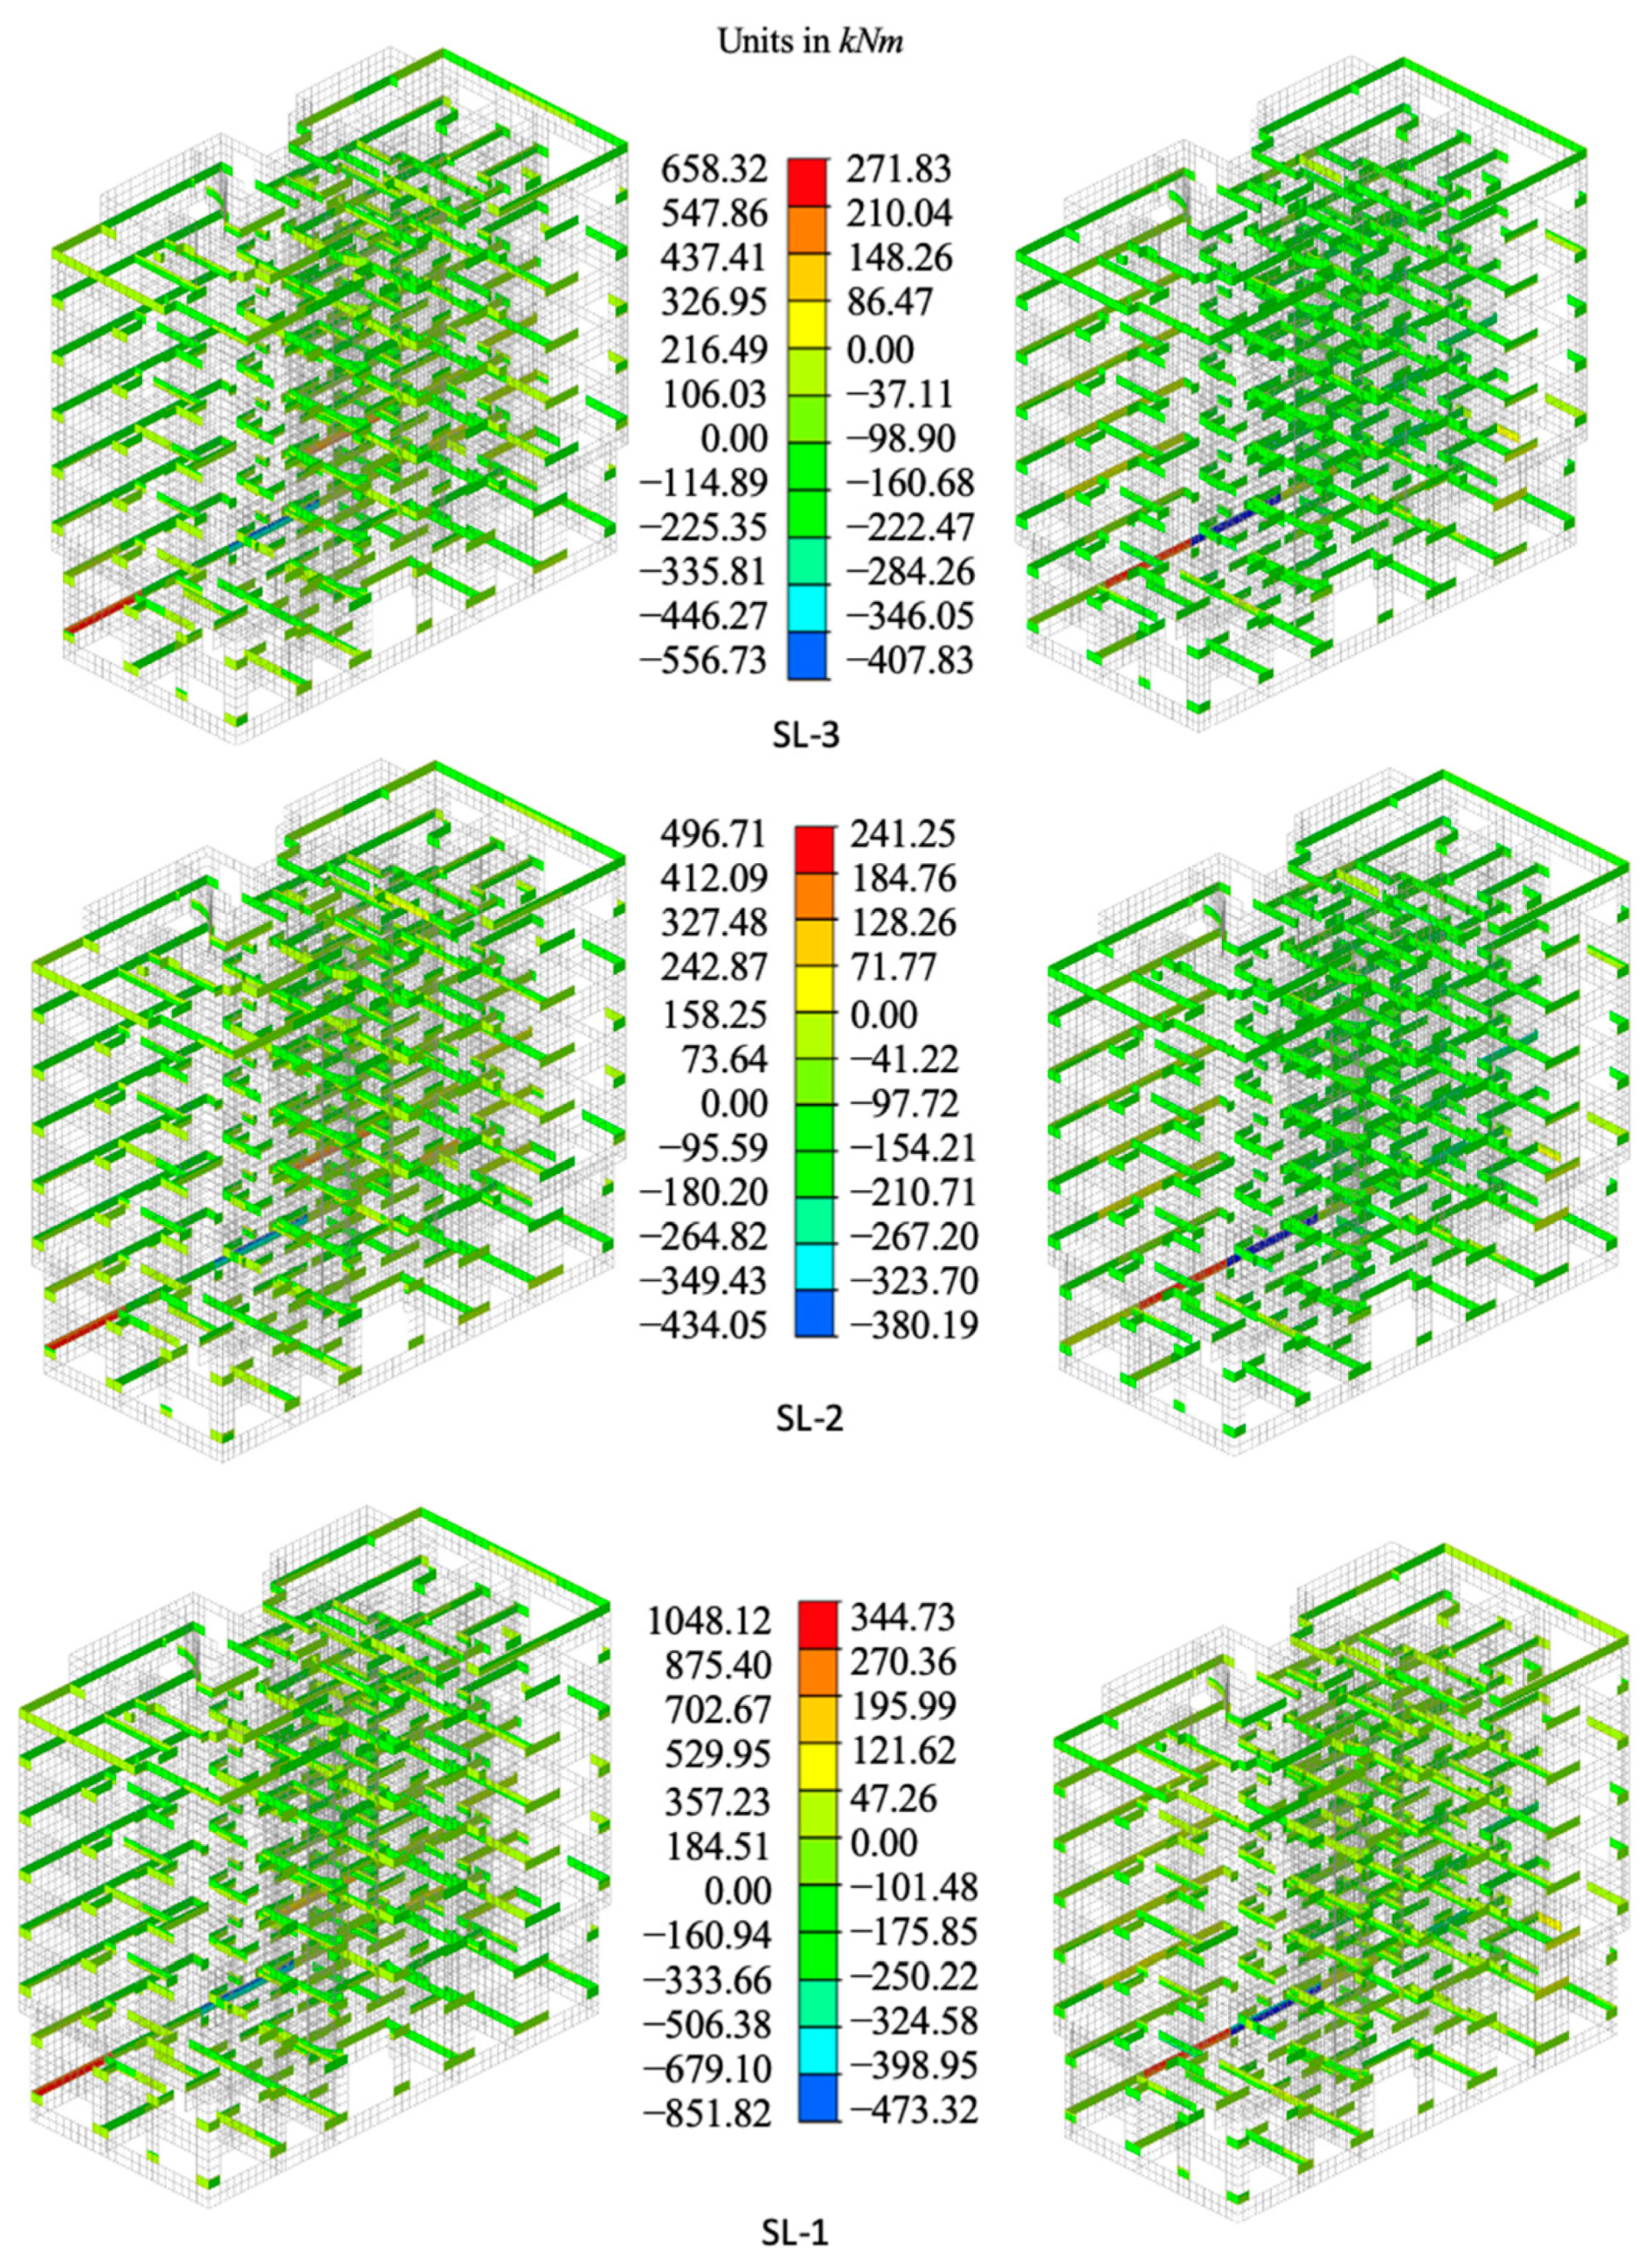
5.1. Linear Analysis
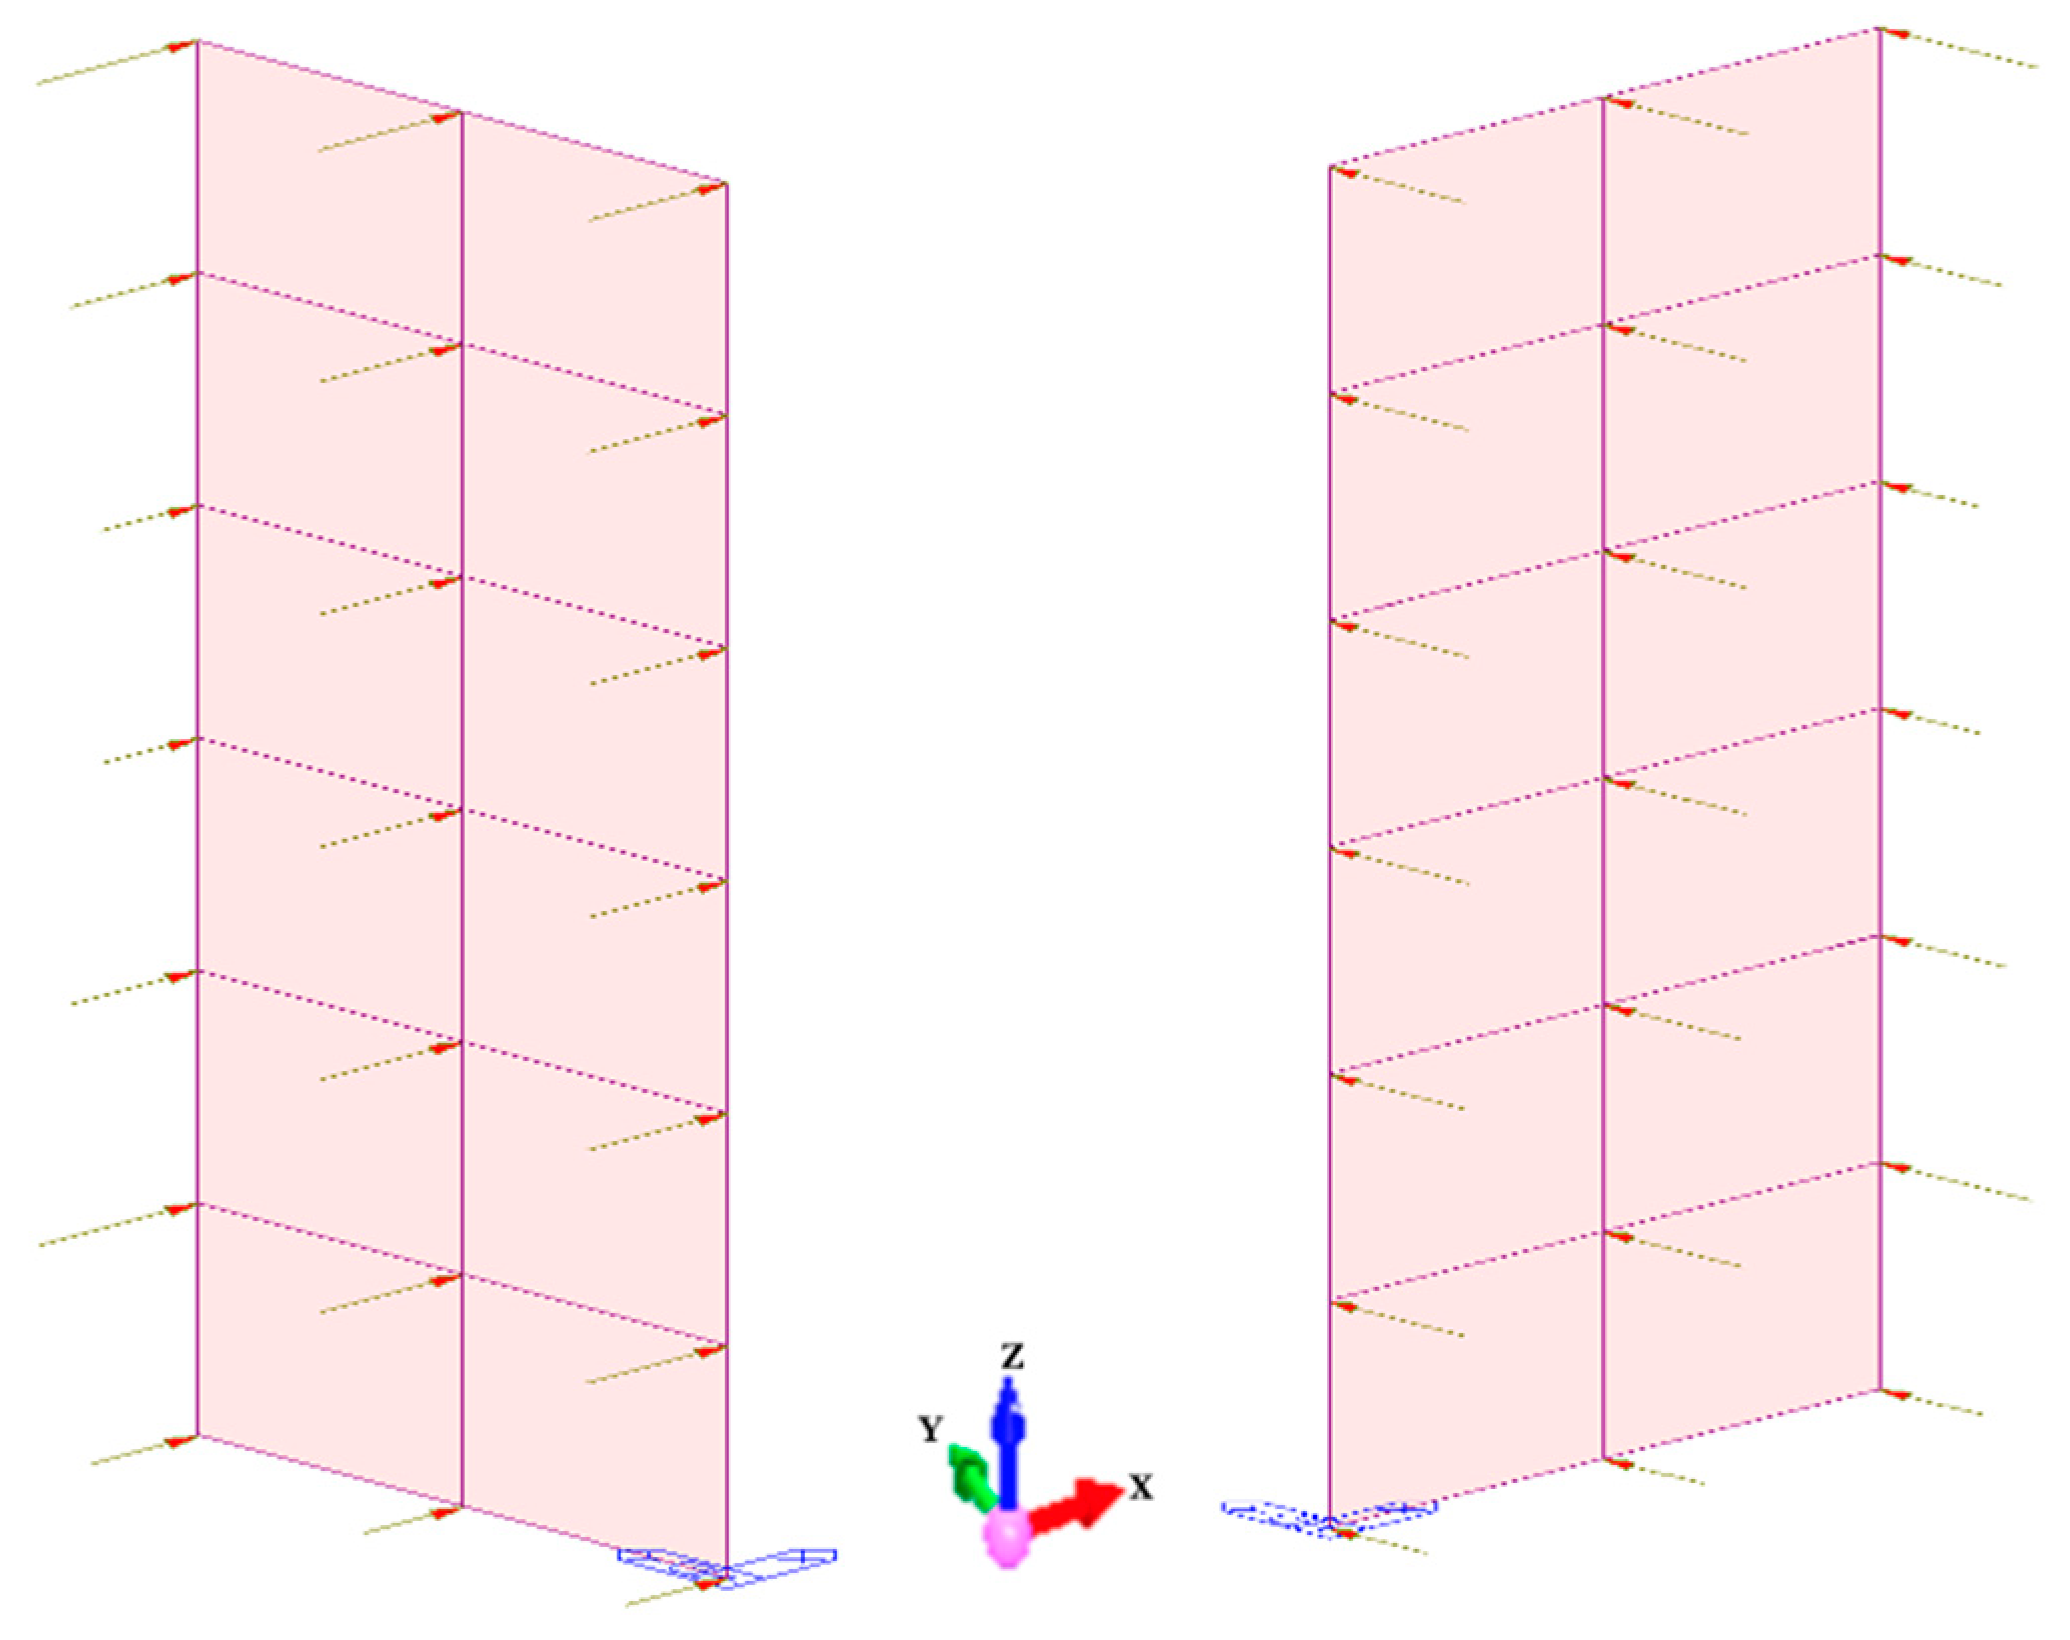
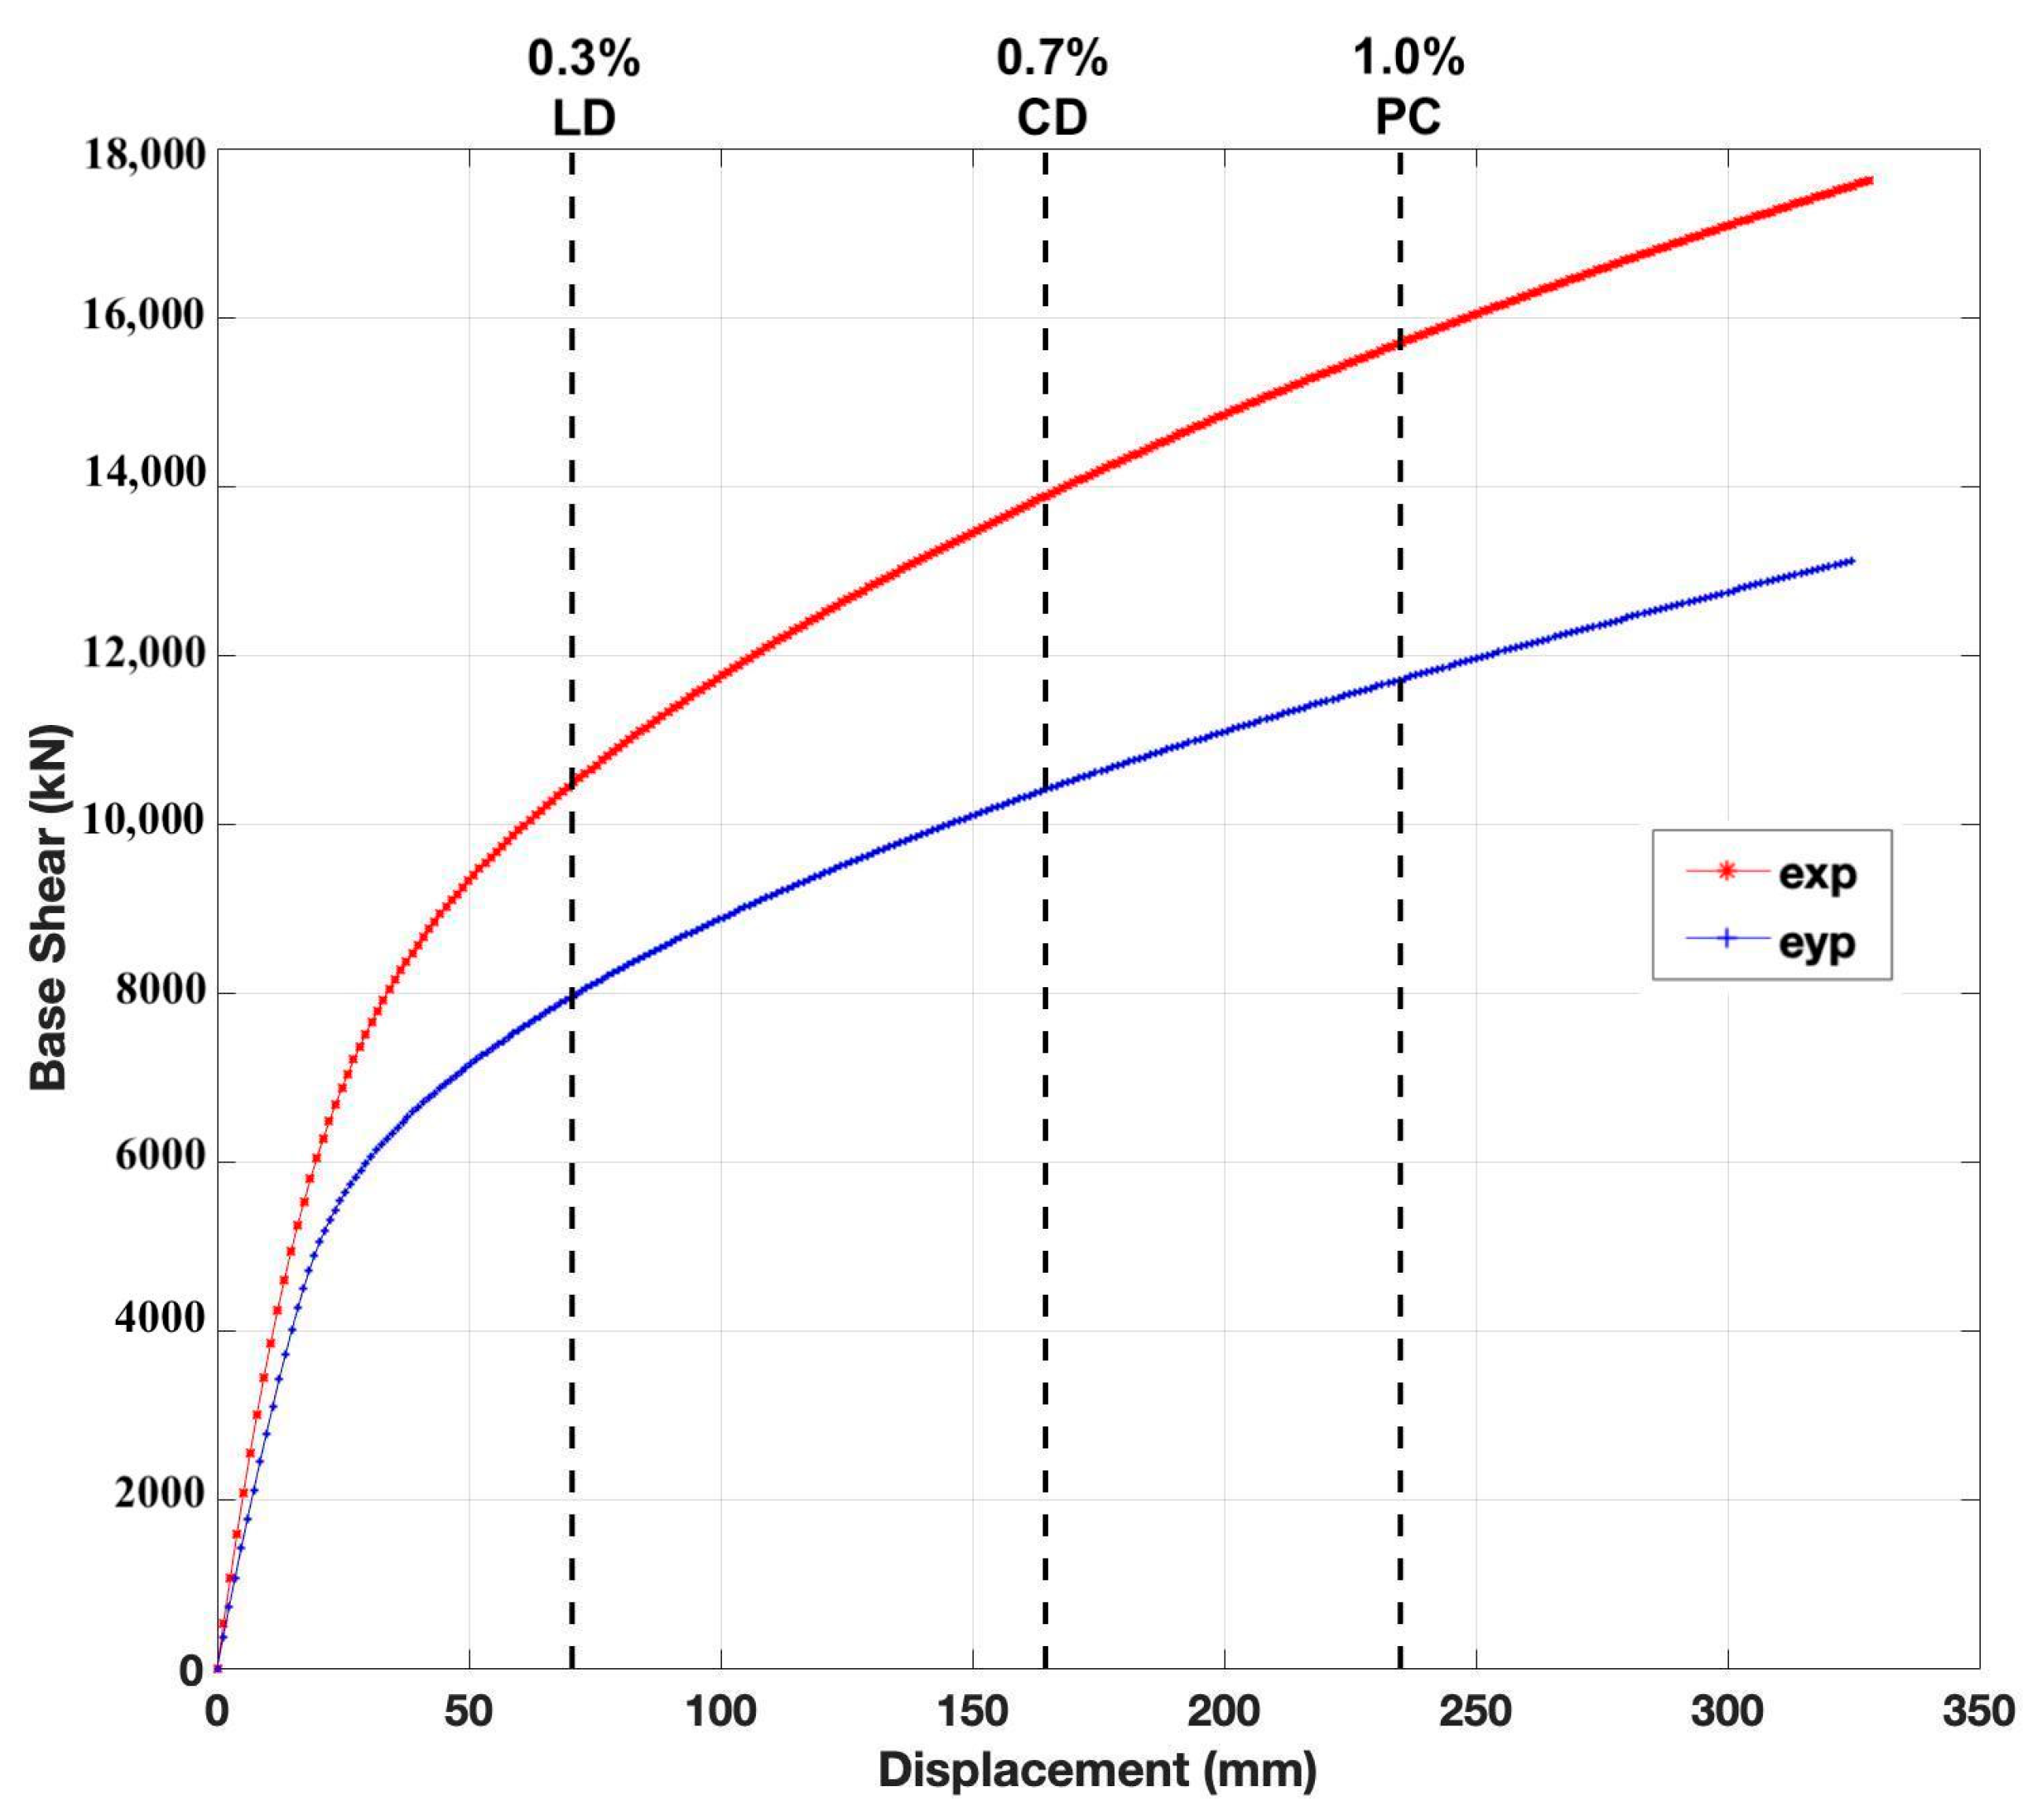
5.2. Nonlinear Analysis
6. Discussion
7. Conclusions
Author Contributions
Funding
Data Availability Statement
Conflicts of Interest
Abbreviations
| URM | Unreinforced Masonry |
| RC | Reinforced Concrete |
| FEM | Finite Element Method |
| FEA | Finite Element Analysis |
| TBSC | Turkish Building Seismic Code |
| SRMGHS | Seismic Risk Management Guide for Historical Structures |
| NDT | Non-Destructive Testing |
| LVDT | Linear Variable Differential Transformer |
| MASW | Multichannel Analysis of Surface Waves |
| DEM | Distinct Element Method |
| RVE | Representative Volume Element |
| SL-1 | Seismic Level 1 (Very Rare Earthquake) |
| SL-2 | Seismic Level 2 (Rare Earthquake) |
| SL3 | Seismic Level 3 (Frequent Earthquake) |
| PGA | Peak Ground Acceleration |
| E | Elastic Modulus |
| τ | Shear Strength Index |
| CD | Controlled Damage |
| LD | Limited Damage |
| PC | Pre-Collapse |
| Ra | Earthquake Load Reduction Coefficient |
| μ | Coefficient of friction |
References
- Chieffo, N.; Clementi, F.; Formisano, A.; Lenci, S. Comparative Fragility Methods for Seismic Assessment of Masonry Buildings Located in Muccia (Italy). J. Build. Eng. 2019, 25, 100813. [Google Scholar] [CrossRef]
- Casapulla, C.; Giresini, L.; Argiento, L.U.; Maione, A. Nonlinear Static and Dynamic Analysis of Rocking Masonry Corners Using Rigid Macro-Block Modeling. Int. J. Struct. Stab. Dyn. 2019, 19, 1950137. [Google Scholar] [CrossRef]
- D’Altri, A.M.; Sarhosis, V.; Milani, G.; Rots, J.; Cattari, S.; Lagomarsino, S.; Sacco, E.; Tralli, A.; Castellazzi, G.; De Miranda, S. Modeling Strategies for the Computational Analysis of Unreinforced Masonry Structures: Review and Classification. Arch. Computat. Methods Eng. 2020, 27, 1153–1185. [Google Scholar] [CrossRef]
- Ravichandran, N.; Losanno, D.; Parisi, F. Comparative Assessment of Finite Element Macro-Modelling Approaches for Seismic Analysis of Non-Engineered Masonry Constructions. Bull. Earthq. Eng. 2021, 19, 5565–5607. [Google Scholar] [CrossRef]
- Bidaj, A.; Bilgin, H.; Hysenlliu, M.; Premti, I.; Ormeni, R. Performance of URM Structures under Earthquake Shakings: Validation Using a Template Building Structure by the 2019 Albanian Earthquakes. Res. Eng. Struct. Mater. 2022, 8, 811–834. [Google Scholar] [CrossRef]
- Valluzzi, M.R.; Sbrogiò, L.; Saretta, Y.; Wenliuhan, H. Seismic Response of Masonry Buildings in Historical Centres Struck by the 2016 Central Italy Earthquake. Impact of Building Features on Damage Evaluation. Int. J. Archit. Herit. 2022, 16, 1859–1884. [Google Scholar] [CrossRef]
- Sarhosis, V.; Giarlelis, C.; Karakostas, C.; Smyrou, E.; Bal, I.E.; Valkaniotis, S.; Ganas, A. Observations from the March 2021 Thessaly Earthquakes: An Earthquake Engineering Perspective for Masonry Structures. Bull. Earthq. Eng. 2022, 20, 5483–5515. [Google Scholar] [CrossRef]
- Morandi, P.; Albanesi, L.; Damiani, N.; Manzini, C.F.; Magenes, G. In-Plane Seismic Performance of an Innovative Steel Modular Reinforcement System for URM Walls. Procedia Struct. Integr. 2023, 44, 1060–1067. [Google Scholar] [CrossRef]
- Blash, A.A.A.; Bakar, B.H.A.; Udi, U.J.; Dabbour, B.S.A.; Jaafar, A.A.; Yanhao, L.; Abu Bakar, I.A.; Rashed, M. Performance of Unreinforced Masonry Walls in Compression: A Review of Design Provisions, Experimental Research, and Future Needs. Appl. Sci. 2023, 13, 12306. [Google Scholar] [CrossRef]
- Buonocunto, V.; Acconcia, E.; Parisi, F. Seismic Fragility Modelling of Unreinforced Masonry Buildings in Campania Region. Procedia Struct. Integr. 2023, 44, 67–74. [Google Scholar] [CrossRef]
- Doran, B.; Karslioglu, M.; Unsal Aslan, Z.; Vatansever, C. Experimental and Numerical Investigation of Unreinforced Masonry Walls with and without Opening. Int. J. Archit. Herit. 2023, 17, 1833–1854. [Google Scholar] [CrossRef]
- Dedeoğlu, İ.Ö.; Yetkin, M.; Calayır, Y. Seismic Performance of Masonry Structures in the Rural Area during the November 23, 2022, Düzce-Gölyaka Earthquake. J. Build. Eng. 2024, 96, 110373. [Google Scholar] [CrossRef]
- Tripathy, D.; Singhal, V. Experimental and Analytical Investigation of Opening Effects on the In-Plane Capacity of Unreinforced Masonry Wall. Eng. Struct. 2024, 311, 118161. [Google Scholar] [CrossRef]
- Caicedo, D.; Tomić, I.; Karimzadeh, S.; Bernardo, V.; Beyer, K.; Lourenço, P.B. Collapse Fragility Analysis of Historical Masonry Buildings Considering In-Plane and out-of-Plane Response of Masonry Walls. Eng. Struct. 2024, 319, 118804. [Google Scholar] [CrossRef]
- Keshmiry, A.; Hassani, S.; Dackermann, U.; Li, J. Assessment, Repair, and Retrofitting of Masonry Structures: A Comprehensive Review. Constr. Build. Mater. 2024, 442, 137380. [Google Scholar] [CrossRef]
- Dauda, J.A.; Iuorio, O.; Muhit, I.B.; Da Silva, L.C.M. Systematic Review of Experimental Testing of Masonry Walls’ Failure: Comparative Analysis and Future Directions. Eng. Fail. Anal. 2024, 163, 108571. [Google Scholar] [CrossRef]
- Ahn, S.-J.; Park, J.-H.; Kim, H.-W. Seismic Fragility Curves for Unreinforced Masonry Buildings in Korea Based on Component Damage. J. Earthq. Eng. 2025, 29, 755–790. [Google Scholar] [CrossRef]
- Haj Najafi, L.; Kheyroddin, A.; Kioumarsi, M. Reliability Assessment of Unreinforced Masonry Buildings Using Fragility Curves for Collapse and Non-Collapse Scenarios. J. Build. Eng. 2025, 101, 111884. [Google Scholar] [CrossRef]
- Gautam, D.; Adhikari, R.; Olafsson, S.; Rupakhety, R. System Identification for Structural Condition Assessment: Application to Critical Neoclassical Monuments in Nepal. Eng. Fail. Anal. 2025, 167, 108931. [Google Scholar] [CrossRef]
- Bilgin, H.; Shkodrani, N.; Hysenlliu, M.; Baytan Ozmen, H.; Isik, E.; Harirchian, E. Damage and Performance Evaluation of Masonry Buildings Constructed in 1970s during the 2019 Albania Earthquakes. Eng. Fail. Anal. 2022, 131, 105824. [Google Scholar] [CrossRef]
- Pouraminian, M. Multi-Hazard Reliability Assessment of Historical Brick Minarets. J. Build. Rehabil. 2022, 7, 10. [Google Scholar] [CrossRef]
- Kocaman, İ.; Gürbüz, M. Enhancing Seismic Performance of Historic Mosques through Retrofitting Measures. Eng. Struct. 2024, 301, 117245. [Google Scholar] [CrossRef]
- Onat, Ö.; Evci, P.U. A Parametric Study in Reinforced Concrete Frames with Different Infill Wall Materials. Bull. Earthq. Eng. 2024, 22, 4447–4476. [Google Scholar] [CrossRef]
- Alecci, V.; Ayala, A.G.; De Stefano, M.; Marra, A.M.; Nudo, R.; Stipo, G. Influence of the Masonry Wall Thickness on the Outcomes of Double Flat-Jack Test: Experimental and Numerical Investigation. Constr. Build. Mater. 2021, 285, 122912. [Google Scholar] [CrossRef]
- Segura, J.; Bernat, E.; Mendizábal, V.; Pelà, L.; Roca, P.; Gil, L. Experimental Comparison of Two Testing Setups for Characterizing the Shear Mechanical Properties of Masonry. J. Build. Eng. 2021, 44, 103277. [Google Scholar] [CrossRef]
- Pirchio, D.; Walsh, K.Q.; Kerr, E.; Giongo, I.; Giaretton, M.; Weldon, B.D.; Ciocci, L.; Sorrentino, L. An Aggregated Non-Destructive Testing (NDT) Framework for the Assessment of Mechanical Properties of Unreinforced Masonry Italian Medieval Churches. Constr. Build. Mater. 2022, 342, 128041. [Google Scholar] [CrossRef]
- Avila-Haro, J.A.; Gonzalez-Drigo, R.; Vargas-Alzate, Y.F.; Pujades, L.; Barbat, A. Probabilistic Seismic Assessment of a High-Rise URM Building. J. Build. Eng. 2022, 45, 103344. [Google Scholar] [CrossRef]
- Lulić, L.; Stepinac, M.; Bartolac, M.; Lourenço, P.B. Review of the Flat-Jack Method and Lessons from Extensive Post-Earthquake Research Campaign in Croatia. Constr. Build. Mater. 2023, 384, 131407. [Google Scholar] [CrossRef]
- Stepinac, M.; Lulić, L.; Damjanović, D.; Duvnjak, I.; Bartolac, M.; Lourenço, P.B. Experimental Evaluation of Unreinforced Brick Masonry Mechanical Properties by the Flat-Jack Method—An Extensive Campaign in Croatia. Int. J. Archit. Herit. 2024, 18, 691–708. [Google Scholar] [CrossRef]
- Łątka, D. Commentary on the Flat-Jack Test—Factors Influencing the Measurements. In Structural Analysis of Historical Constructions; Endo, Y., Hanazato, T., Eds.; RILEM Bookseries; Springer Nature: Cham, Switzerland, 2024; Volume 47, pp. 568–580. ISBN 978-3-031-39602-1. [Google Scholar]
- Aris Parsekian, G.; Borges Ferreira Júnior, J.; Maria Dalfré, G.; Marcio Da Silva, R. Flatjack Application on Existing Hollow Concrete Block Masonry. MATEC Web Conf. 2024, 403, 04001. [Google Scholar] [CrossRef]
- Thamboo, J.; Corradi, M.; Poologanathan, K. Investigating the Mechanical Characteristics of Unreinforced and Reinforced Stone Masonry Using an Experimental Database. Bull. Earthq. Eng. 2024, 22, 2173–2199. [Google Scholar] [CrossRef]
- García, H.; Jiménez-Pacheco, J.; Ulloa, J. Effective Properties of Masonry Structures and Macro-Model Analysis with Experimental Verification. Results Eng. 2024, 23, 102546. [Google Scholar] [CrossRef]
- TBSC. Turkish Building Seismic Code; The Disaster and Emergency Management Presidency-Ministry of the Interior: Ankara, Türkiye, 2018.
- SRMGHS. Seismic Risks Management Guide for Historical Structures; General Directorate of Foundations: Ankara, Türkiye, 2017. [Google Scholar]
- ASTM C1197–91; Standard Test Method for In Situ Measurements of Masonry Deformability Properties Using the Flatjack Method. ASTM International: West Conshohocken, PA, USA, 1991.
- ASTM C1531-16; Standard Test Methods for In Situ Measurement of Masonry Mortar Joint Shear Strength Index. ASTM International: West Conshohocken, PA, USA, 2016.
- Park, C.B.; Miller, R.D.; Xia, J. Multichannel Analysis of Surface Waves. Geophysics 1999, 64, 800–808. [Google Scholar] [CrossRef]
- Bowles, J.E. Foundation Analysis and Design, 5th ed.; McGraw-Hill: New York, NY, USA, 1996; ISBN 978-0-07-912247-6. [Google Scholar]
- Uyanık, O.; Çatlıoğlu, B. Determination of Density from Seismic Velocities. Jeofizik 2015, 17, 3–15. [Google Scholar]
- Kramer, S.L. Geotechnical Earthquake Engineering; Prentice-Hall International Series in Civil Engineering and Engineering Mechanics; Prentice Hall: Upper Saddle River, NJ, USA, 1996; ISBN 978-0-13-374943-4. [Google Scholar]
- Keçeli, A. Soil Parameters Which Can Be Determined by Seismic Velocities. Jeofizik 2012, 16, 17–29. [Google Scholar]
- Lourenço, P.B. Computations on Historical Masonry Structures. Ph.D. Thesis, Delft University of Technology, Delft, The Netherlands, 1996. [Google Scholar]
- Roca, P.; Cervera, M.; Gariup, G.; Pela’, L. Structural Analysis of Masonry Historical Constructions. Classical and Advanced Approaches. Arch. Computat. Methods Eng. 2010, 17, 299–325. [Google Scholar] [CrossRef]
- Midas Gen, v2020; Integrated Solution System for Building and General Structure. MIDAS Software: Seongnam, Republic of Korea, 2020.
- EN 1998-1; Eurocode 8: Design of Structures for Earthquake Resistance—Part 1: General Rules, Seismic Actions and Rules for Buildings. European Committee for Standardization: Bruxelles, Belgium, 2004.
- FEMA 356: Prestandard and Commentary for the Seismic Rehabilitation of Buildings; Federal Emergency Management Agency: Washington, DC, USA, 2000.
- AlShawa, O.; Liberatore, D.; Sorrentino, L. Pre- and Post-Simulations of Shake-Table Tests on a Stone Masonry Building Aggregate Using Finite-Discrete Elements. Bull. Earthq. Eng. 2024, 22, 6093–6121. [Google Scholar] [CrossRef]
- AFAD. Available online: https://tdth.afad.gov.tr/TDTH/main.xhtml (accessed on 7 May 2025).
- Foraboschi, P.; Vanin, A. Non-Linear Static Analysis of Masonry Buildings Based on a Strut-and-Tie Modeling. Soil Dyn. Earthq. Eng. 2013, 55, 44–58. [Google Scholar] [CrossRef]
- Lee, J.S.; Pande, G.N.; Middleton, J.; Kralj, B. Numerical Modelling of Brick Masonry Panels Subject to Lateral Loadings. Comput. Struct. 1996, 61, 735–745. [Google Scholar] [CrossRef]
- Pande, G.N.; Liang, J.X.; Middleton, J. Equivalent Elastic Moduli for Brick Masonry. Comput. Geotech. 1989, 8, 243–265. [Google Scholar] [CrossRef]
- Pande, G.N.; Kralj, B.; Middleton, J. Analysis of the Compressive Strength of Masonry Given by the Equation FK = K (FB) A (FM) B; Structural Engineer; Institution of Structural Engineers: London, UK, 1994; Volume 72. [Google Scholar]
- Midas Analysis Manual Masonry; MIDAS Information Technology Co., Ltd.: Seongnam, Republic of Korea, 2019.


| Floor | Modulus of Elasticity (E, MPa) | Shear Strength Index (τ, MPa) |
|---|---|---|
| ground | 1058 | 0.79 |
| first | 464.6 | 0.50 |
| second | 646.9 | 0.74 |
| third | 435.6 | 0.66 |
| fourth | 1062.2 | 0.78 |
| fifth | 200.2 | 0.53 |
| Parameters | Unit | Layer 1 | Layer 2 |
|---|---|---|---|
| Vp | m/s | 2200 | 3300 |
| Vs | m/s | 760 | 987 |
| Average thickness | m | 2 | - |
| Vp/Vs | - | 2.89 | 3.34 |
| Poisson’s ratio [39] | - | 0.43 | 0.45 |
| Density [40] | gr/cm3 | 2.19 | 2.31 |
| Shear modulus [41] | kg/cm2 | 12,675 | 22,459 |
| Elasticity modulus [39] | kg/cm2 | 36,308 | 65,172 |
| Bulk modulus [39] | kg/cm2 | 89,313 | 221,122 |
| Bed coefficient | t/m3 | 7148 | 9752 |
| Bearing capacity [42] | kg/cm2 | 8.34 | 11.38 |
| Design strength | kg/cm2 | 5.96 | 8.13 |
| Fundamental period of soil | s | 0.21 | 0.21 |
| Vs30 | m/s | 1236 | 1236 |
| Soil amplification factor | - | 1 | 1 |
| Layer No. | Depth Range (m) | Soil Description |
|---|---|---|
| 1 | 0–2.0 | medium-dense silty clay |
| 2 | >2.0 | dense sand/weathered rock |
| Explanation | Formulation |
|---|---|
| Short-period design spectral acceleration coefficient | |
| Design spectral acceleration coefficient for a 1.0-s period |
| Parameters | Unit |
|---|---|
| soil class | ZB * |
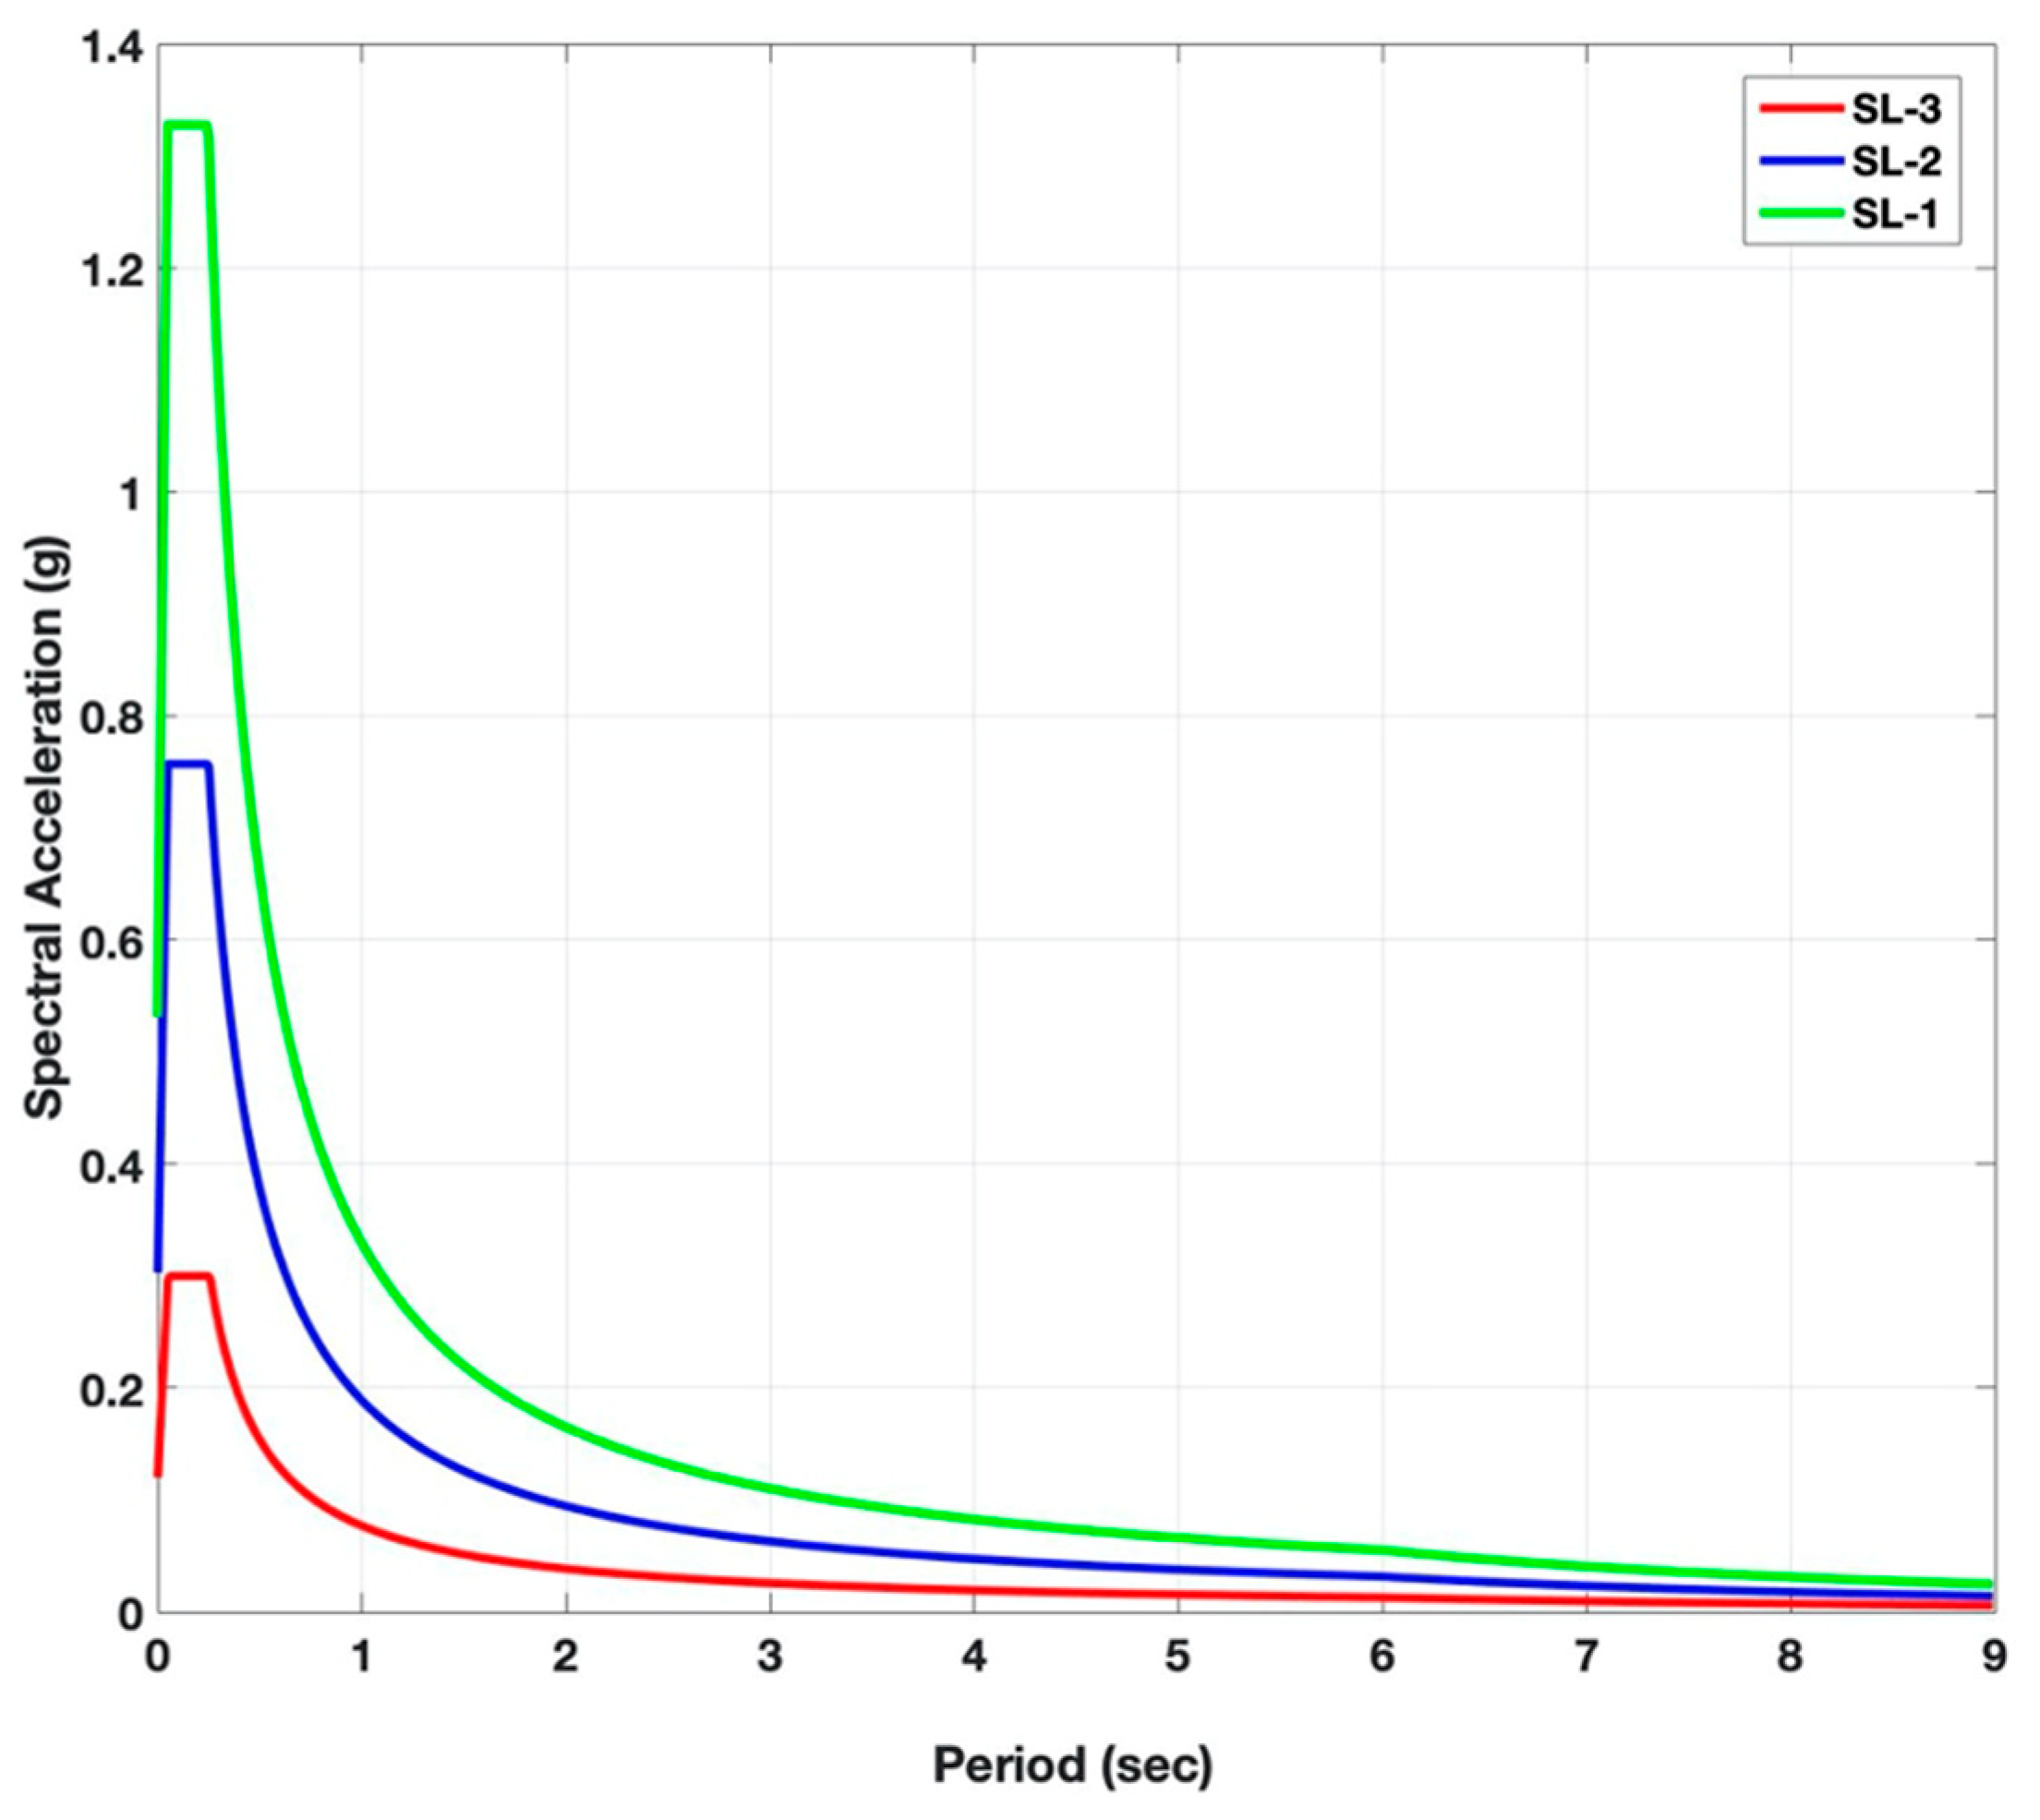
| seismic ground motion level | SL-3, SL-2, SL-1 |
| earthquake map spectral acceleration coefficients | SL-3, Ss = 0.333, S1 = 0.096 SL-2, Ss = 0.841, S1 = 0.236 SL-1, Ss = 1.475, S1 = 0.412 |
| peak ground acceleration | SL-3, PGA = 0.145 g SL-2, PGA = 0.346 g SL-1, PGA = 0.595 g |
| local soil coefficients | SL-3, Fs = 0.900, F1 = 0.800 SL-2, Fs = 0.757, F1 = 0.800 SL-1, Fs = 0.900, F1 = 0.800 |
| spectral acceleration coefficients | SL-3, SDS = 0.300, SD1 = 0.077 SL-2, SDS = 0.757, SD1 = 0.189 SL-1, SDS = 1.327, SD1 = 0.330 |
| live load participation coefficient (n) | 0.30 |
| Material | Elasticity Modulus (MPa) | Material Type | Weight Density (N/mm3) | Poisson’s Ratio |
|---|---|---|---|---|
| brick walls | 750 | Isotropic | 2.2 × 10⁻⁵ | 0.25 |
| stone walls | 3000 | Isotropic | 1.8 × 10⁻⁵ | 0.25 |
| reinforced concrete | 24,000 | Isotropic | 1.2 × 10⁻⁵ | 0.25 |
| Parameters | Unit |
|---|---|
| evaluated performance goals and ground motion levels during earthquakes | LD for SL-3 CD for SL-2 PC for SL-1 |
| limit values for story drift | 0.3% for LD 0.7% for CD 1.0% for PC |
| local soil coefficients | SL-3, Fs = 0.900, F1 = 0.800 SL-2, Fs = 0.757, F1 = 0.800 SL-1, Fs = 0.900, F1 = 0.800 |
| coefficient of earthquake load reduction, Ra | Ra = 1 for SL-3 Ra = 3 for SL-2 Ra = 3 for SL-1 |
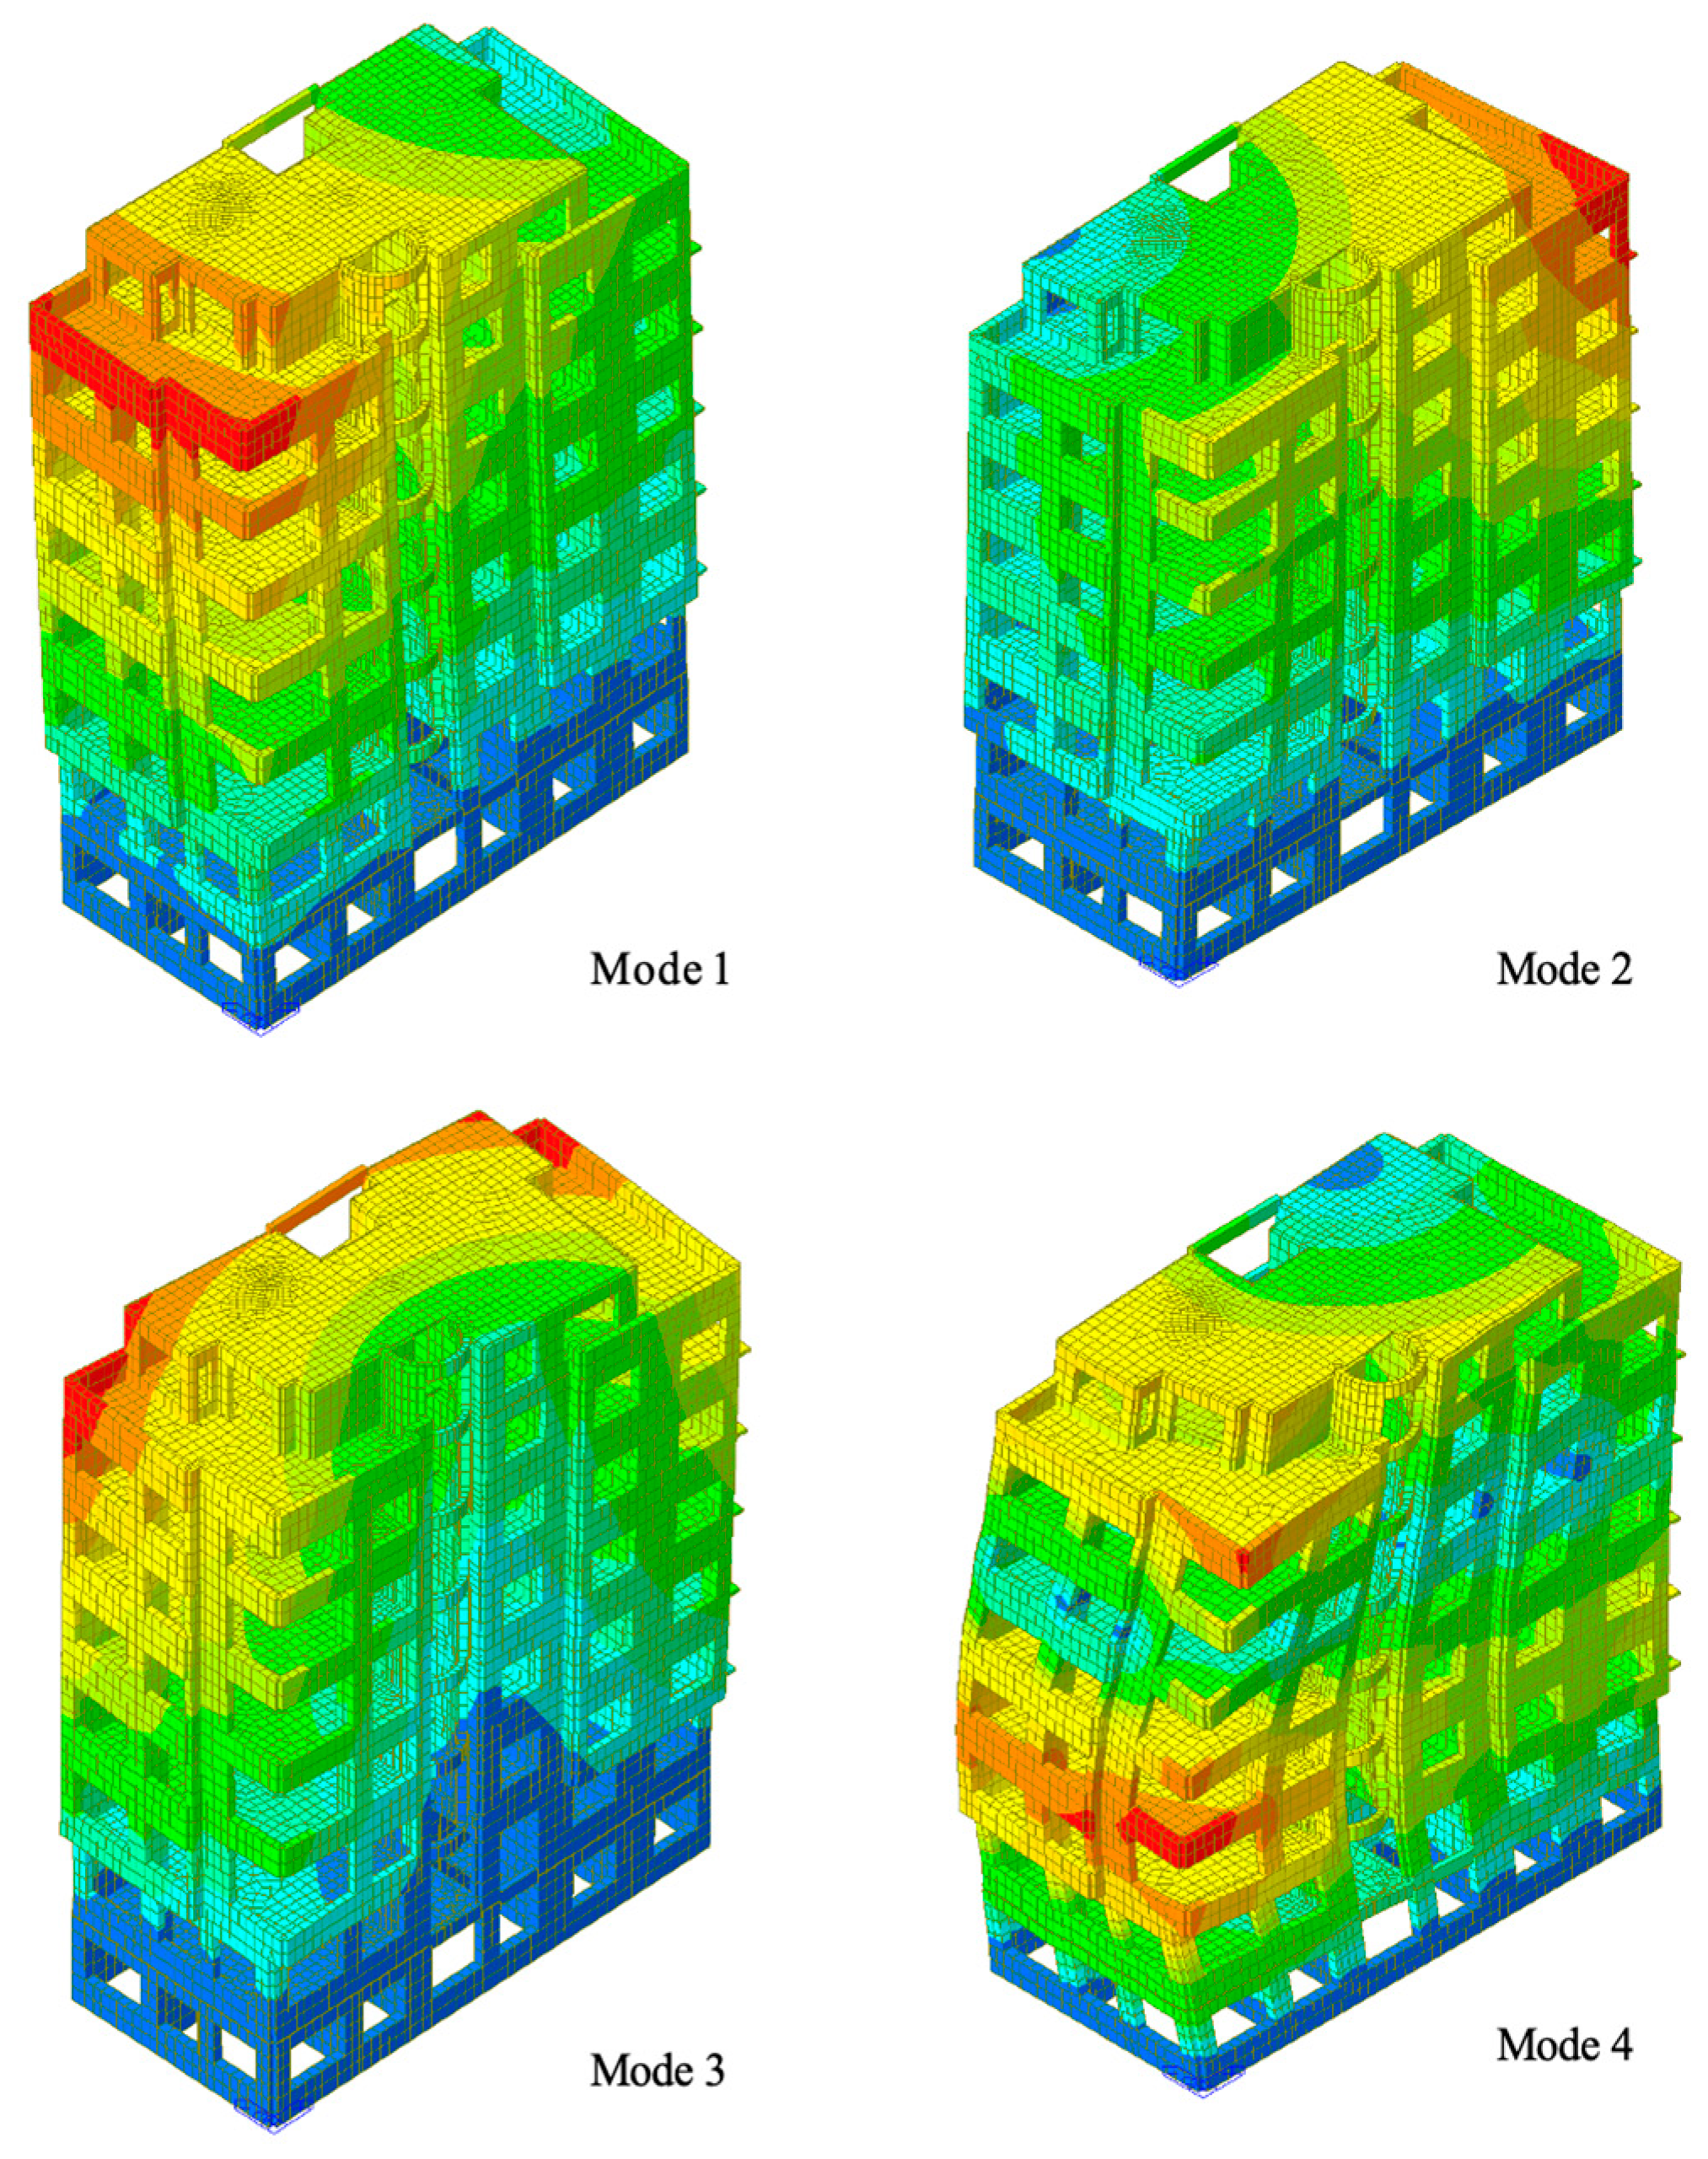
| Mode | Period (s) | Mass-Participation Direction | Mass-Participation Ratios (%) |
|---|---|---|---|
| 1 | 0.795 | y | 49.4 |
| 2 | 0.719 | y | 23.9 |
| 3 | 0.582 | x | 142.2 |
| 4 | 0.247 | y | 4.7 |
| 5 | 0.222 | Y | 10.9 |
| 6 | 0.180 | x | 8.2 |
| 7 | 0.136 | x | 1.3 |
| 8 | 0.122 | y | 3.9 |
| 9 | 0.099 | x | 2.8 |
| 10 | 0.099 | x | 0.9 |
| 11 | 0.088 | y | 2.1 |
| 12 | 0.081 | x | 0.3 |
| Seismic Level | Story | Displacement ∆D, (mm) | Drift Ratio, ∆D/H | Limit Value | Result | ||
|---|---|---|---|---|---|---|---|
| x | y | % | % | % | √/× | ||
| SL-3 | basement | 1.49 | 2.51 | 0.05 | 0.08 | 0.3 (LD) | √ |
| ground | 2.30 | 4.08 | 0.08 | 0.14 | 0.3 (LD) | √ | |
| first | 2.69 | 3.40 | 0.09 | 0.11 | 0.3 (LD) | √ | |
| second | 2.50 | 2.70 | 0.08 | 0.09 | 0.3 (LD) | √ | |
| third | 2.62 | 2.13 | 0.08 | 0.07 | 0.3 (LD) | √ | |
| fourth | 2.28 | 1.25 | 0.07 | 0.04 | 0.3 (LD) | √ | |
| fifth | 2.75 | 0.15 | 0.11 | 0.06 | 0.3 (LD) | √ | |
| sixth | 3.13 | 3.60 | 0.12 | 0.14 | 0.3 (LD) | √ | |
| SL-2 | basement | 4.47 | 5.49 | 0.15 | 0.18 | 0.7 (CD) | √ |
| ground | 7.42 | 8.59 | 0.25 | 0.28 | 0.7 (CD) | √ | |
| first | 8.65 | 7.86 | 0.29 | 0.26 | 0.7 (CD) | √ | |
| second | 7.57 | 6.97 | 0.25 | 0.23 | 0.7 (CD) | √ | |
| third | 7.43 | 6.58 | 0.24 | 0.22 | 0.7 (CD) | √ | |
| fourth | 6.23 | 5.21 | 0.21 | 0.17 | 0.7 (CD) | √ | |
| fifth | 4.62 | 3.18 | 0.18 | 0.13 | 0.7 (CD) | √ | |
| sixth | 4.45 | 3.23 | 0.17 | 0.13 | 0.7 (CD) | √ | |
| SL-1 | basement | 5.58 | 9.94 | 0.19 | 0.33 | 1.0 (PC) | √ |
| ground | 9.31 | 17.17 | 0.31 | 0.57 | 1.0 (PC) | √ | |
| first | 10.87 | 14.90 | 0.36 | 0.49 | 1.0 (PC) | √ | |
| second | 9.46 | 13.68 | 0.31 | 0.46 | 1.0 (PC) | √ | |
| third | 9.24 | 13.39 | 0.30 | 0.45 | 1.0 (PC) | √ | |
| fourth | 7.70 | 11.20 | 0.26 | 0.37 | 1.0 (PC) | √ | |
| fifth | 5.70 | 7.61 | 0.22 | 0.30 | 1.0 (PC) | √ | |
| sixth | 5.75 | 4.56 | 0.23 | 0.18 | 1.0 (PC) | √ | |
| Seismic Level | Ra | Story | Shear Force | * %r | Target Performance Level | Check |
|---|---|---|---|---|---|---|
| SL-3 | 1 | basement | × | 57.53 | LD | × |
| ground | × | 55.09 | × | |||
| first | × | 67.61 | × | |||
| second | × | 64.54 | × | |||
| third | × | 55.32 | × | |||
| fourth | × | 58.12 | × | |||
| fifth | × | 55.80 | × | |||
| sixth | × | 48.24 | × | |||
| SL-2 | 1 | basement | × | 30.92 | CD | √ |
| ground | × | 29.79 | √ | |||
| first | × | 58.38 | × | |||
| second | × | 59.15 | × | |||
| third | × | 53.04 | × | |||
| fourth | × | 55.17 | × | |||
| fifth | × | 48.67 | × | |||
| sixth | × | 30.28 | √ | |||
| SL-1 | 3 | basement | × | 66.82 | PC | × |
| ground | × | 59.43 | × | |||
| first | × | 68.99 | × | |||
| second | × | 63.11 | × | |||
| third | × | 62.84 | × | |||
| fourth | × | 65.74 | × | |||
| fifth | × | 61.43 | × | |||
| sixth | × | 47.88 | × |
| Material | Young’s Modulus (MPa) | Poisson’s Ratio | Tensile Strength (MPa) | Stiffness Reduction Factor |
|---|---|---|---|---|
| brick | 2200 | 0.25 | 0.22 | 0.00001 |
| stone | 2800 | 0.25 | 0.28 | 0.00001 |
| bed joint | 1250 | 0.25 | 0.15 | 0.00001 |
| head joint | 1250 | 0.25 | 0.15 | 0.00001 |
| Seismic Level | Base Shear (kN) | Performance Point (mm) | Drift Ratio, ∆D/H | Limit Ratio | Result | |||
|---|---|---|---|---|---|---|---|---|
| x | x | +x | +y | % | % | % | √/× | |
| SL-3 | 10,995.57 | 8090.55 | 81.08 | 65.43 | 0.036 | 0.080 | 0.3 (LD) | √ |
| SL-2 | 14,361.01 | 10,604.19 | 182.10 | 159.86 | 0.087 | 0.197 | 0.7 (CD) | √ |
| SL-1 | 16,209.01 | 11,997.09 | 258.21 | 231.35 | 0.126 | 0.312 | 1.0 (PC) | √ |
Disclaimer/Publisher’s Note: The statements, opinions and data contained in all publications are solely those of the individual author(s) and contributor(s) and not of MDPI and/or the editor(s). MDPI and/or the editor(s) disclaim responsibility for any injury to people or property resulting from any ideas, methods, instructions or products referred to in the content. |
© 2025 by the authors. Licensee MDPI, Basel, Switzerland. This article is an open access article distributed under the terms and conditions of the Creative Commons Attribution (CC BY) license (https://creativecommons.org/licenses/by/4.0/).
Share and Cite
Boduroglu Yazici, B.; Uzdil, O. Comprehensive Material Characterization and Seismic Performance Evaluation of a Traditional Masonry Residential Building with Reinforced Concrete Slabs. Buildings 2025, 15, 1710. https://doi.org/10.3390/buildings15101710
Boduroglu Yazici B, Uzdil O. Comprehensive Material Characterization and Seismic Performance Evaluation of a Traditional Masonry Residential Building with Reinforced Concrete Slabs. Buildings. 2025; 15(10):1710. https://doi.org/10.3390/buildings15101710
Chicago/Turabian StyleBoduroglu Yazici, Basak, and Oguz Uzdil. 2025. "Comprehensive Material Characterization and Seismic Performance Evaluation of a Traditional Masonry Residential Building with Reinforced Concrete Slabs" Buildings 15, no. 10: 1710. https://doi.org/10.3390/buildings15101710
APA StyleBoduroglu Yazici, B., & Uzdil, O. (2025). Comprehensive Material Characterization and Seismic Performance Evaluation of a Traditional Masonry Residential Building with Reinforced Concrete Slabs. Buildings, 15(10), 1710. https://doi.org/10.3390/buildings15101710