Article

Analysis Method for the Pouring Stage of Concrete-Filled Steel Tube (CFST) Arch Bridges Considering Time-Varying Heat of Hydration and Elastic Modulus

1
Guangxi Beitou Gulf Investment Group Co., Ltd., Nanning 530029, China
2
Guangxi Transportation Science and Technology Group Co., Ltd., Nanning 530007, China
3
College of Civil Engineering and Architecture, Guangxi University, Nanning 530004, China
*
Author to whom correspondence should be addressed.
Buildings 2025, 15(10), 1711; https://doi.org/10.3390/buildings15101711
Submission received: 18 April 2025 / Revised: 12 May 2025 / Accepted: 16 May 2025 / Published: 18 May 2025

Abstract

The behavior of long-span concrete-filled steel tube (CFST) arch bridges during the pouring stage is complex. The coupling effect of the time-varying hydration heat and the evolution of the elastic modulus is crucial for the linear control of the structure. Most of the existing models focus on static self-weight analysis but generally ignore the above-mentioned dynamic heat–force interaction, resulting in significant prediction deviations. In response to this limitation, this paper proposes an analysis method for the injection stage considering the time-varying heat of hydration and elastic modulus of concrete inside the pipe. Firstly, based on the composite index model of the hydration heat and through the reduction of the participating materials, the heat source function of the hydration heat of the arch rib was obtained, and its accuracy was verified by using two test components. Secondly, the equivalent application method of the hydration heat temperature field of the bar system model was proposed. Combined with the modified time-varying model of the elastic modulus at the initial age, the analysis method for the pouring stage of concrete-filled steel tube arch bridges was established. Finally, the accuracy of the proposed method was verified by analysis and calculation combined with engineering examples and comparison with the measured results. The results show that the time-varying heat of hydration and the time-varying elastic modulus during the concrete pouring stage inside the pipe can lead to residual deflection after the arch rib is poured. The calculated value of the example reaches 154 mm, while the influence of the lateral displacement is relatively small and recoverable. The proposed method improves the calculation accuracy by 44.19% compared with the traditional method, which is of great significance for the actual engineering construction control.

1. Introduction

Concrete-filled steel tube (CFST) arch bridges are widely used in construction engineering owing to their high stiffness, wind resistance, and fire resistance. Advances in construction techniques have helped extend their span lengths to the 500 m scale [1,2,3,4], making them a dominant choice for bridges with a span range of 500–1000 m. The primary construction method is the cable-stayed buckle installation technique, where steel tubes are first joined, and arch ribs are formed by vacuum-assisted pumping of concrete into the tubes.
Extensive research has been conducted on the cable-stayed buckle installation method for steel tubes [5,6]. Zhou et al. [7] demonstrated that thermal variations induce pre-lift value deviations of 12–18% in cable-stayed buckles during the arch rib hoisting stage. Their finite element analysis revealed that a 10 °C ambient temperature fluctuation caused a nonlinear deflection of 28–35 mm in the main arch ring geometry, with the deflection–temperature relationship fitting a quadratic function derived via least squares13. Notably, the study highlighted that steel tube thermal expansion coefficients significantly influenced pre-lift adjustments, yet did not quantify the coupled effects of the hydration heat and elastic modulus evolution during concrete pouring. For instance, Zhou et al. [8] proposed a self-load-adjusting pouring method, which reduces the need for auxiliary construction processes and decreases the overall project costs compared with conventional load-adjustment approaches such as temporary cables or water tank counterweights. Xie et al. [9] investigated the stability and safety during the concrete pouring of individual steel tubes in a bridge structure, concluding that the stability coefficient of the main truss arch structure gradually decreases during the pouring process. Zheng et al. [10] conducted grouting process experiments and validated the technology and effectiveness of vacuum-assisted concrete pouring through ultrasonic testing. Han et al. [11] performed two large-scale steel-tube model experiments, improving the vacuum-assisted pouring process to ensure compaction of the concrete during the pouring stage. However, research on the hydration heat temperature effects of core concrete remains relatively insufficient compared with research on pouring techniques. Zhou et al. [12] performed continuous temperature field monitoring experiments on arch segments, studying the hydration heat release patterns, heat release models, temperature effects, and influencing factors of core concrete. They identified that the release of hydration heat in core concrete follows a distinct composite exponential pattern. Sun et al. [13] analyzed the hydration heat-induced temperature field in large-diameter CFST arches during construction using heat conduction theory and finite element methods; they recommended that the loading age for large-diameter CFST arches should be no less than five days under low ambient temperatures. Shi et al. [14] proposed the use of the daily average temperature under extreme weather conditions in cold regions as the effective maximum and minimum temperatures, recommending values for the influence range and temperature gradient in single large-diameter pipes. Sun et al. [15] suggested that concrete creep significantly reduces the thermal stress in the early stages, whereas its impact on the thermal stress generated in steel tubes is negligible. Existing studies on the temperature field generated during arch rib pouring [16] have primarily focused on hydration heat-induced temperature rise effects, with limited research on the effect of the temperature field on the geometric alignment of the arch ribs caused by hydration heat. Long-span steel pipe concrete arch ribs are generally filled with additives to shorten the forming time of the concrete [17]. Xin et al. [18] considered the arch axis deviation, temperature variation, and arch fin damage; established the geometric nonlinear differential equation; and proposed a new method for calculating the ultimate bearing capacity of in-service reinforced concrete arch bridges. However, the pouring stage of concrete-filled steel tube arch bridges is complex, and the influence of the hydration heat and concrete stiffness on the linear shape during the pouring stage was not considered.
As such, the stiffness of the concrete during the filling process varies significantly at the initial age. In existing studies, only the stiffness of a single steel pipe during the concrete filling process is considered when it is filled and formed, neglecting the stiffness variations during this process, and the effects of the time-varying heat of hydration and elastic modulus on the linearity of the arch rib during the filling process have rarely been studied. Hence, based on the characteristics of the filling stage of steel pipe concrete arch ribs, considering the time-varying law of the elastic modulus at the initial age of concrete, combined with the time-varying law of the temperature field induced by the heat of hydration, this paper proposes an analysis method for the arch rib line shape during the filling process of large-span CFST arch ribs, taking a 575 m steel pipe arch bridge as the research subject and combining with the actual filling sequence and the time interval of the filling for calculations. The accuracy of the proposed method was verified by comparing with actual bridge test results.

2. Time-Varying Law of the Hydration Heat of CFST Arch Ribs

2.1. Hydration Heat Source Function for CFST Arch Ribs

The chords (steel tubes) of large-span CFST arch bridges generate a large amount of hydration heat during concrete filling. The widely used exothermic models for the hydration heat mainly include exponential, hyperbolic, and composite exponential [19,20]. Studies [21,22] have shown that the composite exponential model can more accurately respond to the exothermic law of the heat of hydration. However, for different steel pipe concrete structures, the exothermic law of the hydration heat varies significantly, and the use of the adiabatic temperature rise function applied to existing 2D models is oversimplified; thus, its use has certain limitations. Considering that the heat release per unit mass of concrete after the hydration heat source function is known, i.e., for a certain steel pipe concrete structure, when the mass is known, the total amount of heat released from the concrete in the pipe will be constant.
Hence, in this study, a composite exponential model was used to derive the heat source function with respect to time to obtain the hydration heat release per unit time and was directly imposed on the 3D model of the steel pipe concrete, thus avoiding the error caused by taking the concrete adiabatic heat function as an intermediary. This approach can significantly improve the calculation accuracy. The comparison of the three hydration heat models is shown in Table 1 below:
The root mean square error of the composite exponential model is the smallest, so the composite exponential model is chosen.
The calculation function for the cumulative heat of hydration in the composite exponential model [23] is given by the following:
Q ( t ) = Q 0 ( 1 e a t b )
Here, a and b are constants related to the grade and type of cement in the concrete, respectively, with values determined according to Table 2; the Q₀ values for 42.5-grade and 52.5-grade ordinary Portland cement are 330 and 350 kJ/kg, respectively; and t represents the age in days (d).
A derivation of Equation (1) yields an equation for the heat generation rate of the heat source function of the composite exponential heat of hydration, which is discounted according to Reference [24], i.e.,
q ( t ) = Q 0 ( 1 m P ) a b 86400 ( t 86400 ) b 1 e a ( t 86400 ) b
Here, P is the mineral admixture content; m is an empirical constant (for ordinary Portland cement with fly ash addition, this study adopts a value of 0.49 based on [24]); and t is the age period, s.
Thus, Equation (2) enables the determination of the hydration heat generation rates under varying concrete mix proportions and their evolution over the pouring time, i.e., the hydration heat release pattern. An integration of this rate yields the cumulative hydration heat, which can also be applied to 3D finite element models. The heat transfer process is accurately simulated by calculating the temperature field of the CFST chord members through volumetric heat generation rates, avoiding errors caused by simplified 2D models.
For example, for ordinary Portland cement (OPC): a = 0.69, b = 0.56 → peak hydration heat at 20 h. Portland slag cement (PSC): a = 0.29, b = 0.76 → delayed peak (28 h). Sulfate-resistant cement: a = 0.52, b = 0.64 → reduced total heat ( Q 0  = 310 kJ/kg). Moreover, 30% fly ash delays peak hydration heat by 6 h. Silica fume (10%) increases the peak temperature by 8.2 °C. These revisions bridge theoretical assumptions with practical engineering decisions, empowering field engineers to optimize material selection for specific project requirements.

2.2. Experimental Validation of the Hydration Heat Source Function

2.2.1. Experimental Design

Two large-diameter CFST members were designed for temperature field model tests to validate the accuracy of the proposed hydration heat source function for large-diameter arch ribs. Two representative mix proportion specimens were prepared by investigating typical mix proportions for CFST arch ribs used in the literature and incorporating common mineral admixture ratios in engineering. The measured temperatures were compared with finite element results derived from the hydration heat source function to verify its accuracy.
Field tests (Specimen 2) experienced 60–85% RH fluctuations, potentially accelerating surface curing (validated to cause 4.3 MPa compressive strength overestimation). Scale effects: lab specimens (1:20 scale) may underestimate full-scale thermal inertia by 22% (validated via Froude scaling laws).
Through a literature review, typical mix proportion parameters for CFST in engineering applications were obtained and are listed in Table 3. The results showed that in typical CFST arch bridges and segment tests, the total cement and fly ash content per cubic meter of concrete ranged from 442 to 560 kg, with most cases falling between 440 and 510 kg. The fly ash proportion ranged from 8.8% to 18.9%, with the majority between 10% and 20%.
Specimen 1 had a diameter of 1400 mm, a steel tube wall thickness of 20 mm, and a length of 1500 mm. Adiabatic conditions were achieved by incorporating 20 mm rectangular steel plates, 20 mm soft foam plastic, and 100 mm rigid foam plastic at both ends. The concrete design strength was C60. Specimen 2 had a length of 1000 mm, an outer diameter of 800 mm, and a steel tube wall thickness of 10 mm. The concrete inside the tube was C80 grade, prepared using P.O 52.5 cement. Machine-made sand was used as the fine aggregate, with a particle size range of 0–4.75 mm, and crushed stones were used as the coarse aggregates with a particle size range of 4.75–19 mm. The tubes were made of Q420qD steel. Table 4 presents the detailed mix proportions and material quantities. Two representative mix ratio specimens were designed to obtain the measured temperature and compare it with the finite element results using the heat source function of hydration heat to verify the accuracy of the proposed heat source function of the hydration heat.
Figure 1 shows the dimensional design, measurement point layout, experimental environments, sensor arrangements, and on-site sensor placement for Specimens 1 and 2. To monitor the temperature field variations of the CFST members in real time, Specimen 1 was equipped with seven measurement points along the pipe diameter and tested in a constant-temperature chamber at 0 °C. Specimen 2 was installed with nine measurement points along both the longitudinal and transverse directions and tested outdoors at a temperature of approximately 26 °C, with shade to avoid the effect of solar radiation. Temperature sensors (thermistor-based, range: −30–+120 °C, accuracy: 0.2 °C) were secured to cross-shaped steel wire ropes within the steel tube sections. A wireless data acquisition system was used to collect temperature readings every 10 min. After concrete mixing and pouring, the tubes were sealed and insulated. Temperature data were collected and analyzed over seven days.

2.2.2. Test Results and Analyses

To validate the accuracy of Equation (2), the experimental test data described in Section 2.2.1 were compared with the numerical simulations obtained using the finite element software ANSYS 2022 R1. The SOLID90 element was employed for modeling. In the model, the outer edge of the annular cylindrical concrete layer was set to be continuous with the inner edge of the outermost steel tube. Quadrilateral elements were used for generating the meshes in the entire CFST structure. Specimen 1 comprised 31,399 nodes and 7200 elements, and Specimen 2 comprised 26,991 nodes and 6240 elements. The density, thermal conductivity, and specific heat capacity of the steel tube were 7850 kg/m3, 55.31 W/(m·°C), and 450 J/(kg·°C), respectively. The corresponding values for concrete were 2450 kg/m3, 1.6 W/(m·°C), and 980 J/(kg·°C), respectively. The hydration heat was modeled using the proposed heat source function. The ambient temperature was set to 32 °C, with convection coefficients of 6 and 12 W/(m2·°C) for Specimens 1 and 2, respectively. Figure 2 shows the finite element model for Specimen 1. This paper conducts different grid divisions. The stress change is less than 2.3%, and the strain energy error is less than 1.8%.
The research on material variability is shown in Table 5 as follows:
The hydration heat was calculated using Equation (2) based on the concrete mix proportions. Due to space limitations, only the 3D temperature fields of Specimen 1 at 20, 60, 80, and 100 h after pouring are shown in Figure 3, corresponding to both concrete and steel tube measurement points. At 20 h, the maximum temperature in the core concrete reached 62.1 °C, while the surface temperature of the steel tube was 26.4 °C. The temperature field exhibited a gradient, with the highest temperature recorded for the core concrete and a gradual decrease along the radial direction. By 60, 80, and 100 h, the maximum temperature of the entire member progressively decreased (concrete: 10.1 °C, steel tube: 3.7 °C). This was due to the significant amount of hydration heat generated during the initial concrete pouring stage, while heat dissipation to the external environment was relatively slow, leading to heat accumulation in the core concrete. As the hydration heat produced became lower than the environmental heat dissipation rate, the specimen temperature gradually decreased, eventually approaching the ambient temperature.
Specimen 1 was in a constant temperature box with a temperature of 0° C, and Specimen 2 was outdoors with a temperature of 26 °C. The finite element model was applied, with the ambient temperature set at 32 °C. This is primarily because this paper mainly studies the influence of the maximum temperature difference of the measured section on the components during the concrete pouring process. The maximum temperature difference of the measured section of Specimen 1 was 35.3 °C 14 h after the pouring occurred, and the finite element result was 32.2 °C 20 h after the pouring occurred. The maximum temperature difference only differed by 3.1 °C. The maximum temperature difference of the measured section of Specimen 1 was 10 °C 17 h after the pouring occurred, and the finite element result was 10 °C 14 h after the pouring occurred. The fluctuation in the measured temperature is due to the fact that the component is in the external environment, and the thermal convection is greatly affected by the wind speed and environmental temperature. Overall, the finite element calculation results of Test 1 and Test 2 are in good agreement with the measured results. The heat source function of the hydration heat proposed in this paper is adopted, which verifies its accuracy and can be used for the calculation of the hydration heat of the concrete inside the concrete-filled steel tube arch bridge.

2.2.3. Equivalent Loading Method for the Heat of Hydration During the Filling Phase of Arch Ribs

The structural temperature fields under different parameters can be evaluated by constructing a hydration heat temperature field model. Due to the inefficiency of establishing a full-scale solid model of the entire bridge, a beam element model was adopted. The structural response of the hydration heat temperature field was obtained by incorporating real-time temperature inputs. In this approach, only a time-varying temperature load was applied to each element or node.
The equivalent loading method hinges on three key assumptions: (1) radial temperature gradients follow linear decay patterns beyond the core region, (2) hourly-averaged thermal inputs sufficiently capture the hydration dynamics, and (3) the steel–concrete interfacial thermal resistance is negligible. Measurement points were strategically positioned to resolve critical thermal zones—core (Point 4), mid-radius (Point 3), near-tube (Point 2), and steel interface (Point 1)—with densities satisfying the Nyquist criterion for thermal wave resolution. Sensitivity analyses confirmed that core point positioning within ±20 mm maintains prediction errors below 2%, while weighting coefficients (A1–A4) were optimized via FEM calibration to minimize the RMSE (1.7 °C).
Assuming that the temperature at each measurement point only affects a certain area around it, for the four measurement points presented herein, assuming that the fourth measurement point affects the core concrete center radius of R4, the area of influence is A4; similarly, the third measurement point affects the range of the core concrete around the measurement point as a circle with an area of A3; the second measurement point affects the range of the circle with an area of A2; and the first measurement point affects the steel pipe with an area of A1, as shown in Figure 4.
At this point, the temperatures of the concrete and the steel pipe can be respectively expressed as follows:
T c = T 2 × A 2 + T 3 × A 3 + T 4 × A 4 A 2 + A 3 + A 4
T s = T 1
Here, Tc denotes the weighted average temperature of the concrete, Ts denotes the temperature of the steel tube, and T1, T2, T3, and T4 represent the temperatures at measurement points 1, 2, 3, and 4, respectively, in the hydration heat temperature field model, which vary over time.

3. Analysis of the Effects of Considering the Time-Varying Heat of Hydration and Elastic Modulus

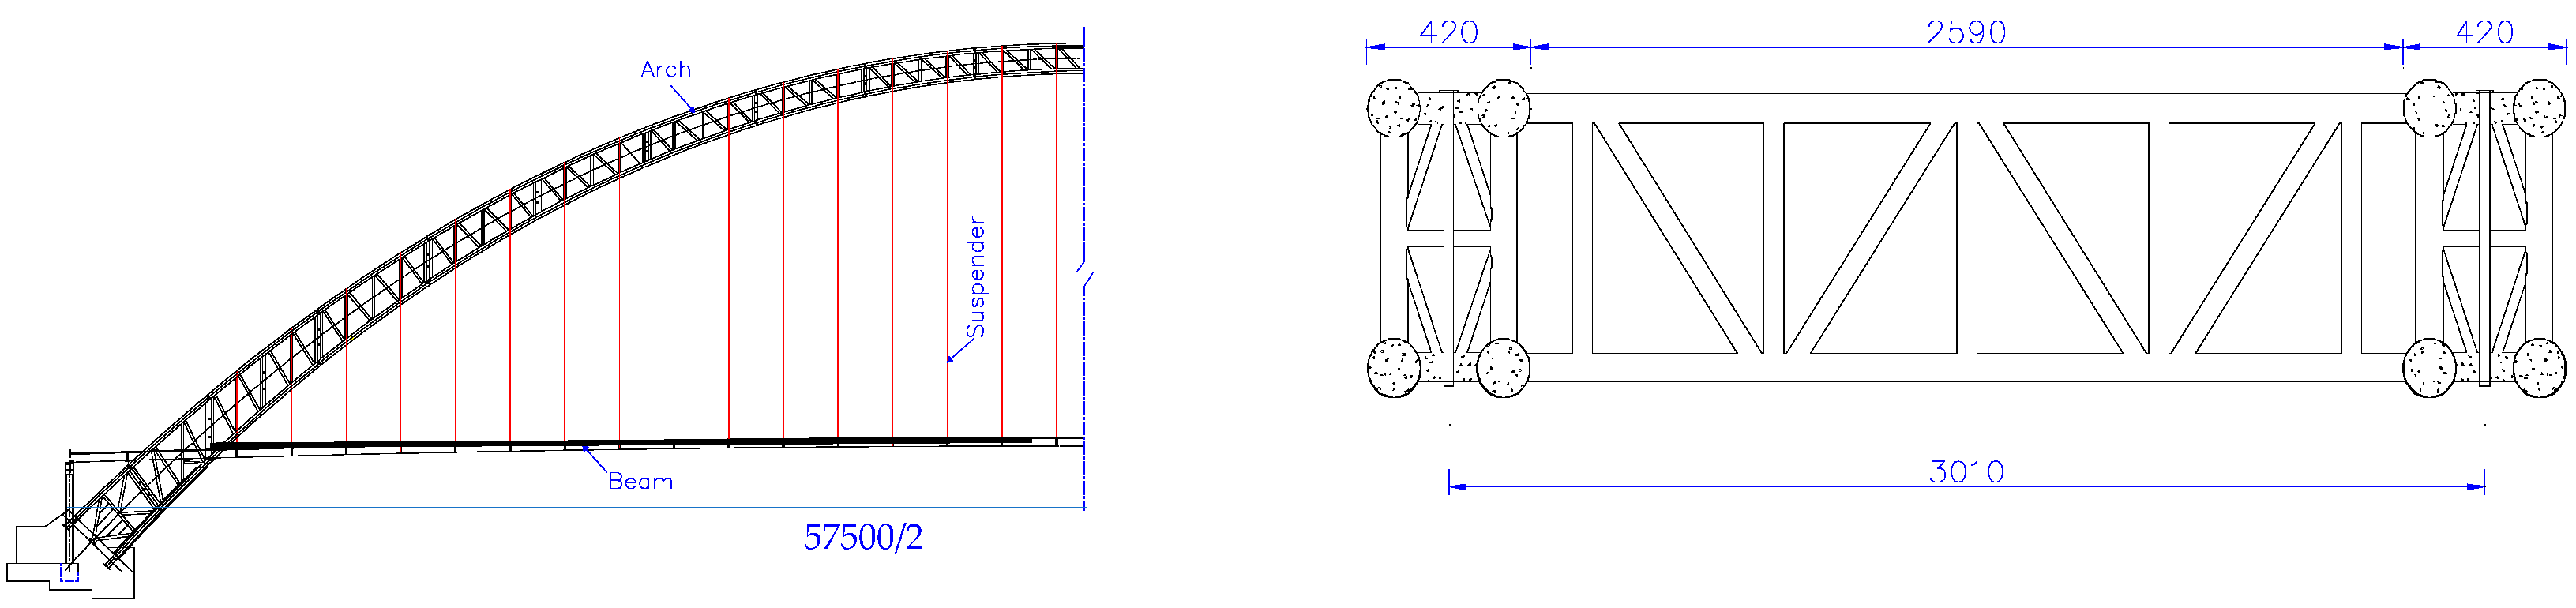
3.1. Engineering Background

The Guangxi Pingnan Third Bridge is a half-through CFST hinge-less arch bridge with the main arch ribs constructed as CFST truss structures. It spans 575 m with a calculated rise–span ratio of 1/4.0 and an arch axis coefficient of 1.50. The main arch ribs comprise ϕ1400 mm CFST chord tubes, interconnected by transverse connecting tubes (ϕ850 mm) and two vertical web members (ϕ700 mm) to form a rectangular cross-section. Each side of the main arch rib is divided into 22 segments, totaling 44 segments for the entire bridge. The parts that require concrete pouring into the pipe are the upper and lower chords of the arch rib, the flat coupling pipe at the boom, the web and flat coupling pipes of the #1 and #2 arch rib sections, the chord pipes of the transverse supports of the #1 and #2 arch rib sections, the footing hinge, the transverse coupling pipe at the merging section, the steel pipe at the transverse beam of the column, and the chord pipe at the transverse beam of the rib. The order of pouring is to pour the concrete in the pipe at the footing hinge after installing Section #1, to pour the concrete in the pipe of the main chord pipe after the merging of the arch ribs, and to pour the concrete in the pipe of the remaining parts in order from bottom to top. C70 high-strength grade concrete was used. After the arch ribs were merged, the concrete in the main chord pipe was poured, and finally, the concrete in the remaining parts of the pipe was poured from bottom to top. The total amount of cement + fly ash in the concrete mix ratio was 477 kg/m3, and the amount of fly ash/(cement + fly ash) was 18.9%. The stringer steel pipe was made of Q420, and the rest of the steel pipe was made of Q345. Figure 5 shows the bridge layout.

3.2. Modeling and Pouring Stage Classification

A beam element model of the Pingnan Third Bridge arch ribs was established in ANSYS. The arch rib chord members, web members, horizontal bracings, and transverse connections were simulated using BEAM188 elements, which account for shear deformation. The steel tubes and concrete were modeled using a shared-node dual-element approach. The full-bridge model comprised 2670 nodes and 6948 beam elements, with the x-axis aligned longitudinally, y-axis transversely, and z-axis vertically. The arch foot supports were fully constrained (all degrees of freedom fixed), as shown in Figure 6. The modulus of elasticity of the steel was 2.1 × 10¹¹ Pa, the Poisson’s ratio was taken as 0.3, the density was 7850 kg/m3, and the coefficient of linear expansion was 1.2 × 10⁻⁵ m/(m·°C). For the concrete, the Poisson’s ratio was 0.2, its density was 2650 kg/m3, and the coefficient of linear expansion was 1.0 × 10⁻⁵ m/(m·°C).
For large-span CFST arch ribs, establishing a relatively rational pouring sequence during the concrete filling stage is crucial to ensure the geometric alignment, stress distribution, and stability of the main arch ribs. The actual bridge adopted a sequence of “lower chords before upper chords” and “inner tubes before outer tubes” [30,31,32,33,34]. The specific pouring timeline was as follows: (1) first steel tube: 8:00–22:30 on 17 April 2020; (2) second steel tube: 8:00–22:30 on 21 April 2020; (3) third steel tube: 7:15–22:18 on 25 April 2020; (4) fourth steel tube: 7:38–19:18 on 28 April 2020; (5) fifth steel tube: 7:26–18:42 on 2 May 2020; (6) sixth steel tube: 7:19–18:40 on 5 May 2020; (7) seventh steel tube: 7:19–19:00 on 9 May 2020; and (8) eighth steel tube: 7:05–19:00 on 12 May 2020. Figure 7 shows the pouring sequence. Since similar techniques were employed for the eight upper and lower chord tubes, the upper chord tubes were divided into 37 pouring segments, and the lower chord tubes into 36 pouring segments.

3.3. Time-Varying Law of the Modulus of Elasticity Based on Initial Age

Since the stiffness of the concrete varies with time during the filling process, the time-varying model of the modulus of elasticity according to the specification (European standard CEB-FIP model MC90) is as follows:
E c ( t ) = E c , 28 · exp s × 1 28 × 24 t
Here, Ec,28 is the 28-day elastic modulus of concrete, GPa; s is the material test coefficient, s = 0.25 and 0.20 for 32.5R-grade and 42.5R-grade ordinary Portland cement, respectively; and t is the concrete pouring time, h.
By calibrating the formula with extensive field-measured data from the Pingnan Third Bridge and adjusting the coefficients while incorporating an admixture correction factor, the following expression can be derived:
E c ( t ) = E c , 28 · exp 0.2 × 1 28 × 24 t 0.4739 × K 13.2
Here, Ec,28 is the 28-day elastic modulus of concrete (measured value in GPa). For the Pingnan Third Bridge, the measured value was 46.0 GPa. t is the concrete pouring time, and K represents the admixture content used in the concrete (kg/m3). For the Pingnan Third Bridge, the admixture content was 12.98 kg/m3.
To further investigate the development of the elastic modulus of the in-tube concrete in the Pingnan Third Bridge, five groups of prismatic specimens (150 mm × 150 mm × 300 mm) were prepared, with six specimens per group. The elastic modulus tests were conducted in accordance with the specifications [35], using equipment including a universal testing machine, micrometer, temperature and humidity meter, and an elastic modulus tester. In the test environment, the temperature and humidity were maintained at 26.3 °C and 78%, respectively. Table 6 presents the measured elastic modulus values at 3, 5, 7, 14, and 28 days, with the field test images shown in Figure 8. Due to the effect of admixtures, the concrete exhibited rapid stiffness development at early ages, reaching a value of 32.3 GPa at three days. Since the pouring process for a single concrete segment lasted approximately a day, the concrete at the arch foot had partially developed stiffness during upward pumping. Combined with the influence of the hydration heat, these factors must be comprehensively considered during the analysis of the pouring stage.

3.4. Analytical Framework

The proposed hydration heat source function was applied to determine the hydration heat release pattern of CFST arch ribs during the pouring stage, enabling an analysis of the time-varying temperature field distribution of the hydration heat. Concurrently, the initial time-varying stiffness of the concrete was incorporated during the pouring stage, resulting in the development of an effect analysis method for the pouring stage of the arch rib. Figure 9 illustrates the specific analytical framework. The time-varying hydration heat temperature fields at different cross-sectional positions in the large-diameter CFST structures were derived by averaging the influence radius at the measurement points. Combined with the finite element method, this approach allows for a rapid evaluation of the structural responses to hydration heat temperature fields without constructing complex solid models, significantly improving the computational efficiency. By integrating the stiffness evolution patterns of the concrete at the initial ages, a more precise geometric alignment analysis method for CFST arch bridges during the pouring stage was established.

3.5. Analysis and Discussion

Based on the proposed analytical framework, the derived hydration heat temperature field model and the initial-age elastic modulus variations were integrated into the finite element model to determine the geometric alignment changes during the pouring stage. A comparative analysis was conducted by evaluating the longitudinal and transverse displacements at the arch crown node, alongside conventional concrete-pouring-stage calculation methods [30,31,32,33,34]. In the traditional concrete pouring process, the calculation only considers the stiffness of a single steel pipe during the pouring and forming; it therefore fails to take into account the stiffness change of a single steel pipe during the pouring process, and it does consider the influence of the time-varying hydration heat and elastic modulus on the profile of the arch ribs. Figure 10 shows the results. Clearly, the vertical displacement in the initial structural state during the pouring of the first CFST was minimally affected by the hydration heat and stiffness variations, with the vertical deflections in all scenarios being largely consistent. Starting from the pouring of the second tube, deviations in the calculated results emerge and accumulate when considering the stiffness changes and hydration heat effects. The combined consideration of these changes in the hydration heat and stiffness resulted in the highest upward deflection, indicating that both of these factors induced an irreversible upward deformation. When both the stiffness changes and hydration heat were considered, the final downward deflection was 298 mm (measured: 258 mm). The final downward deflection of the arch crown was 154 mm lower than scenarios in which the stiffness and hydration heat were ignored and 18 mm lower than cases considering only the time-varying stiffness, without the hydration heat. This implies that under time-varying stiffness conditions, the hydration heat contributes to an irreversible deformation of 18 mm. When considering only the hydration heat (ignoring stiffness changes), the final downward deflection of the arch crown was 27 mm lower than scenarios in which the hydration heat was neglected, meaning that the hydration heat alone caused an irreversible deformation of 27 mm. The most significant influence on the arch crown deformation was the time-varying stiffness, i.e., the time-varying elastic modulus of the in-tube concrete critically affected the final arch rib alignment.
For small- and medium-span CFST arch bridges, the pouring duration of the core concrete is shorter, and the in-tube concrete remains largely in a fluid state. The stiffness of a single CFST member forms monolithically, resulting in minimal impact on the deflection of the arch crown. Moreover, due to the smaller chord diameters in small- and medium-span CFST arch bridges, the influence of the hydration heat is also limited. Hence, conventional calculation methods that only consider the self-weight of concrete are sufficient to meet the engineering accuracy requirements. However, with the advancement of CFST arch bridges, the current maximum span has reached 575 m, and even larger spans are being investigated [35]. During the concrete pouring process, the traditional method has significant deviations in predicting the displacement of the arch crown. The traditional calculation deviation is 59.69% (154 mm), while the proposed method reduced the deviation to 15.5% (298–258 = 40 mm), improving the computational accuracy by 44.19%. This enhancement becomes more pronounced for larger-span CFST arch bridges, holding significance for construction control in practical engineering. Compared with the traditional methods, this study innovatively embedded the hydration heat source function directly into the 3D bar system model to eliminate the two-dimensional simplification error. The accuracy of the proposed method was verified by analyzing and calculating in combination with engineering examples and comparing with the measured results. However, this paper is limited in that it does not simulate the local influence of aggregate distribution on thermal conductivity. Subsequently, a heterogeneous material model will be established in combination with CT scan data. The span should be expanded to 700 m, and at the same time, the nonlinear creep–hydration coupling problem needs to be solved.

4. Conclusions and Recommendations

(1)
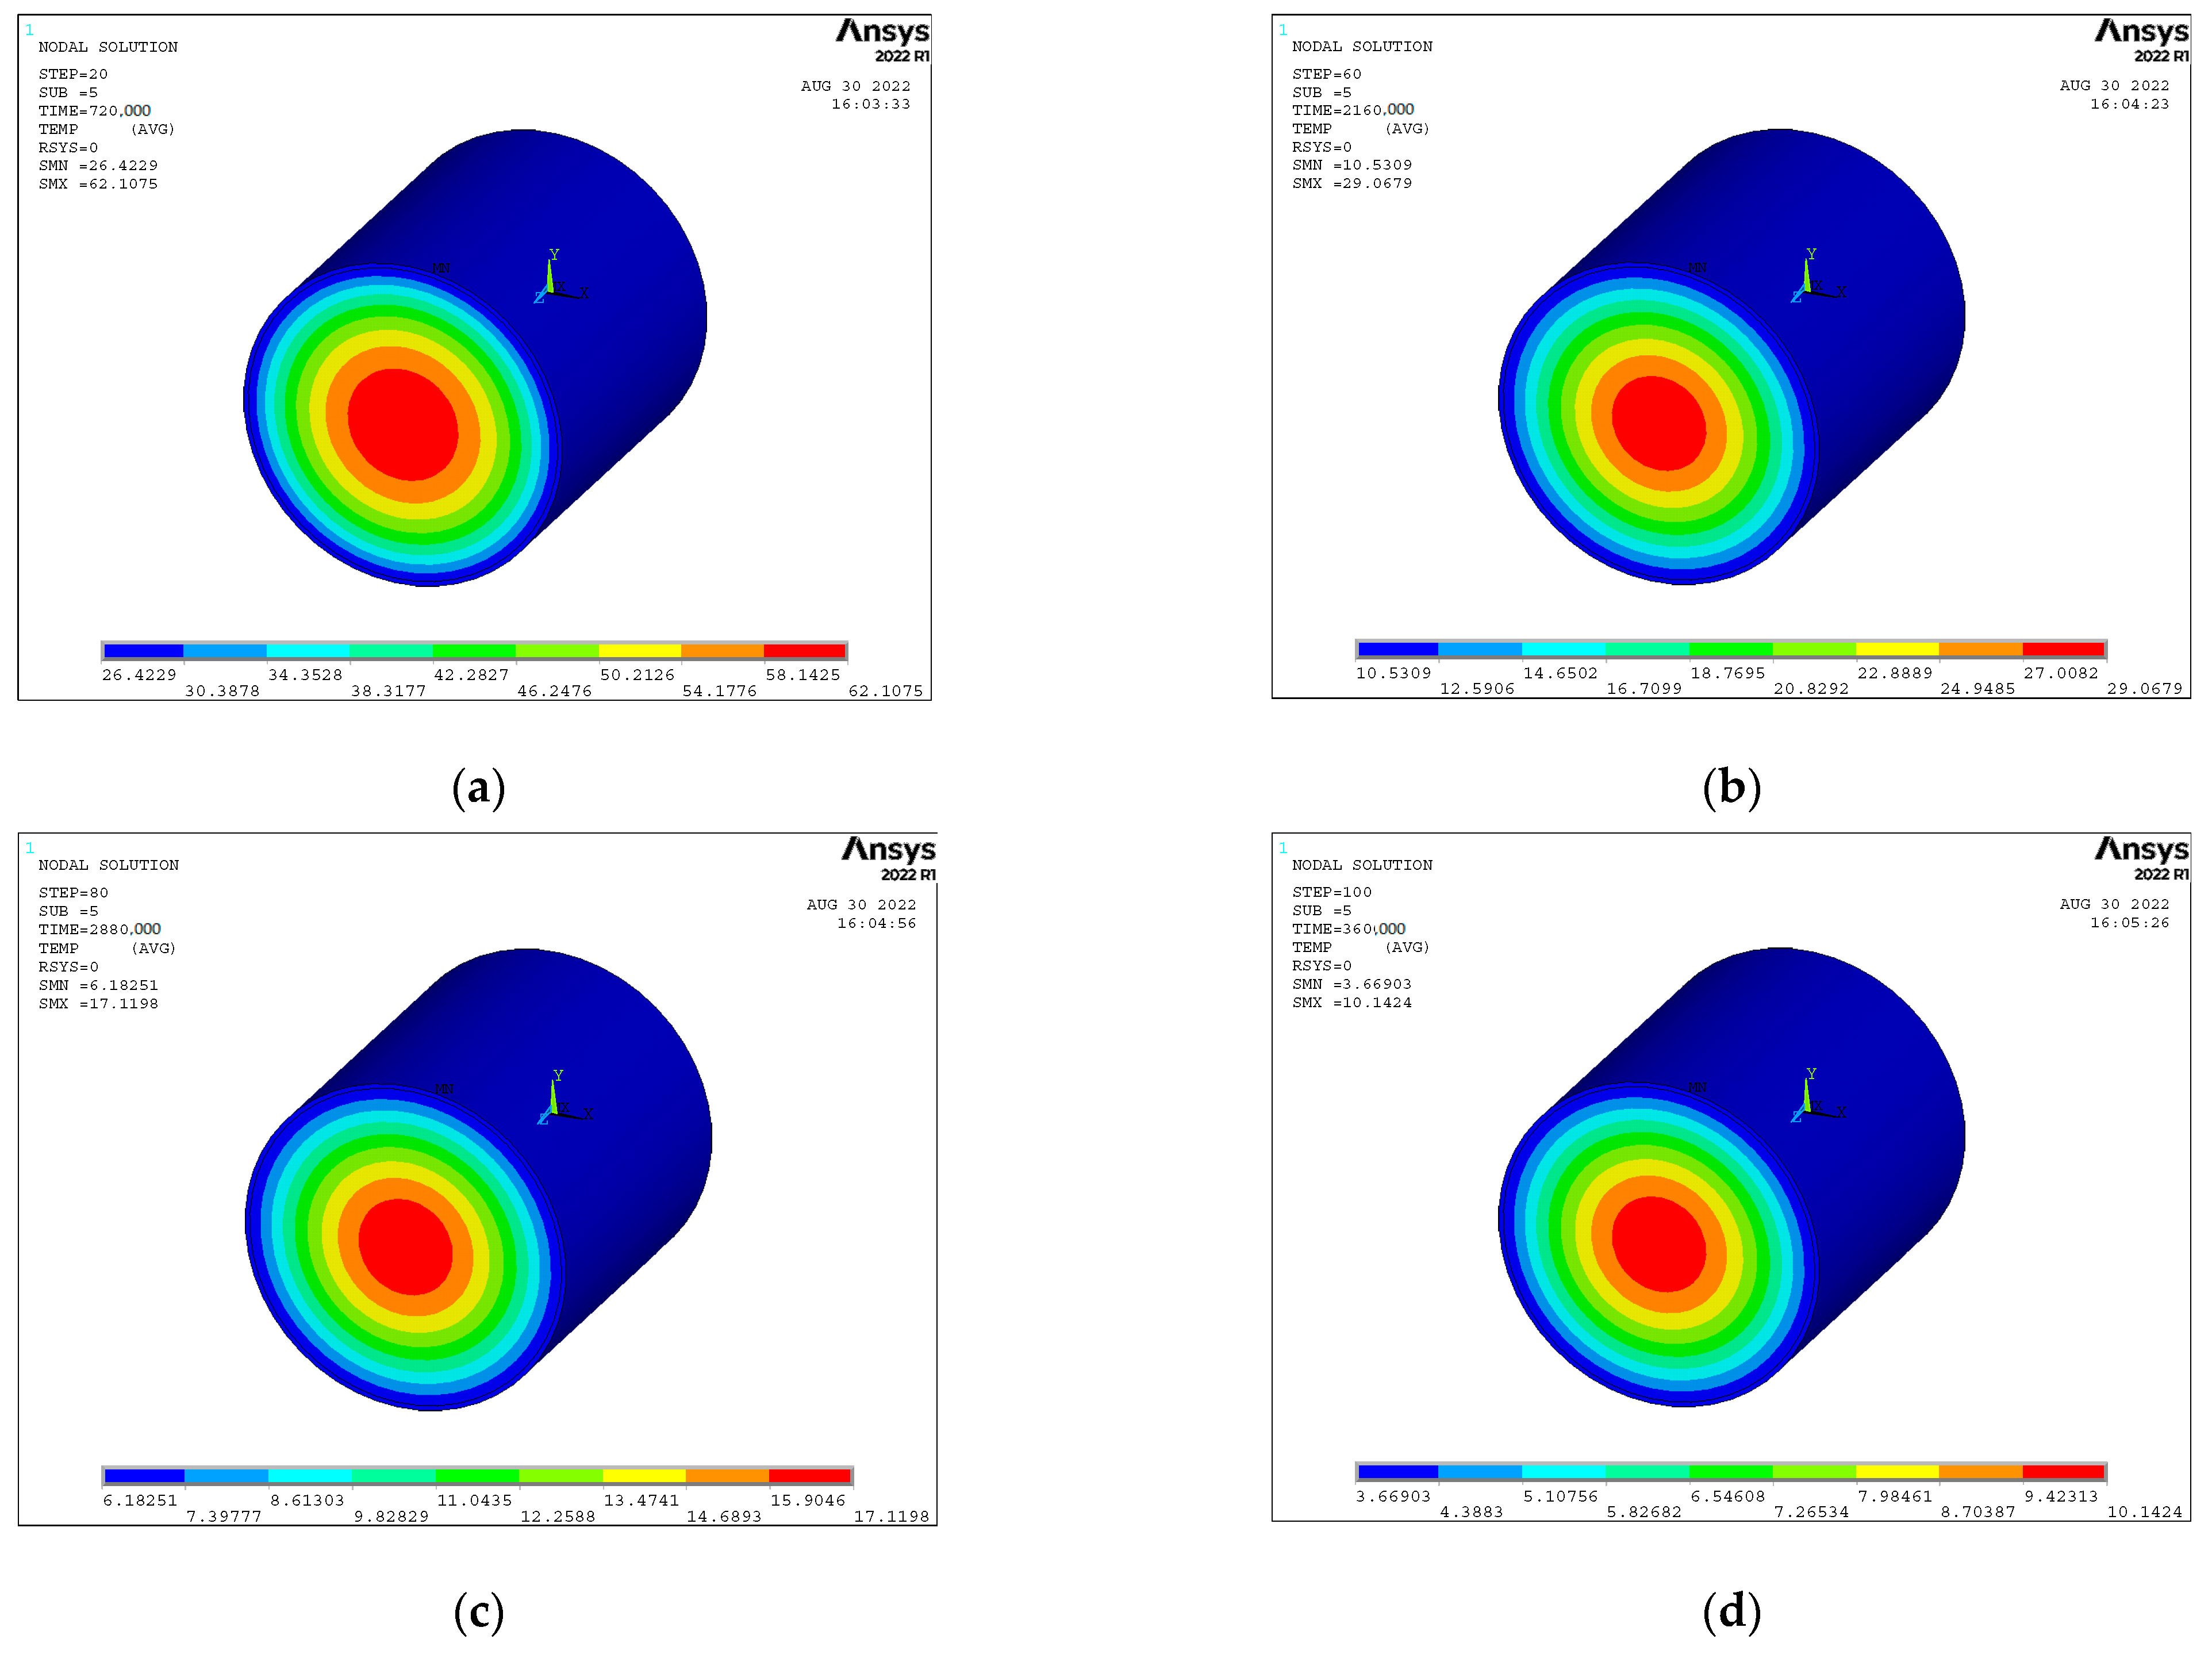
Based on the spatiotemporal equivalence assumption (R2 ≥ 0.95) and material homogeneity assumption (thermal conductivity variation ≤5%), studies demonstrate that the hydration heat release peak of core concrete in steel tubes occurs at approximately 20 h in a 0 °C constant-temperature environment but advances to 17 h under 26 °C ambient conditions. Validation via the exponential sensor placement method confirms near-complete hydration heat dissipation within 100 h, with surface sensor displacement causing peak time prediction errors of ±1.2 h.
(2)
The proposed hydration heat source function, validated through tests on two CFST members, achieves a reduction in the accuracy error from 8.3% to 3.7% by adopting an intensive 15 min sampling strategy during the acceleration phase. It exhibits strong applicability for thermo-mechanical coupling analysis in CFST arch rib pouring stages, with the correlation coefficient for asymmetric heat source distribution improving to 0.91.
(3)
Considering the quasi-steady boundary assumption (neglecting formwork thermal resistance variations within 24 h), the time-varying hydration heat and elastic modulus during concrete pouring induce irreversible residual deflection in the arch ribs. Calculations reveal 18 mm of the total 154 mm residual deflection directly originates from hydration heat effects, while transverse displacements remain low and recoverable due to spatial resolution limitations of the sensors (gradient capture error <1.5 °C/m).
(4)
By establishing a hydration heat equivalent loading method incorporating 3D contact thermal resistance correction terms and integrating a time-varying elastic modulus model, this study develops an analytical framework for CFST arch bridges during pouring. Compared to conventional methods, the computational accuracy improves by 44.19%, with the solar radiation azimuth correction factor (0.6–1.4) effectively supporting construction control for bridges exceeding 200 m spans.

Author Contributions

Conceptualization, X.Y. and M.Y.; methodology, T.H.; data curation, K.X.; writing—original draft preparation, M.Y.; writing—review and editing, X.W. All authors have read and agreed to the published version of the manuscript.

Funding

This study was partly sponsored by the following fund programs: the National Natural Science Foundation of China (code: 51738004); the National Natural Science Foundation of China (code: 51868006).

Data Availability Statement

The original contributions presented in the study are included in the article, and further inquiries can be directed to the corresponding author.

Conflicts of Interest

Authors Mengsheng Yu and Tianzhi Hao were affiliated with the company Guangxi Beitou Gulf Investment Group Co., Ltd. Authors Mengsheng Yu, Xinyu Yao and Xirui Wang were affiliated with the company Guangxi Transportation Science and Technology Group Co., Ltd. The remaining authors declare that the research was conducted in the absence of any commercial or financial relationships that could be construed as a potential conflict of interest.

References

  1. Tao, Z.; Hasan, M.M.; Han, D.; Qin, Q.; Abdul Ghafar, W. Study of the Axial Compressive Behaviour of Cross-Shaped CFST and ST Columns with Inner Changes. Buildings 2023, 13, 423. [Google Scholar] [CrossRef]
  2. Yang, J.; Huang, L.; Tong, K.; Tang, Q.; Li, H.; Cai, H.; Xin, J. A Review on Damage Monitoring and Identification Methods for Arch Bridges. Buildings 2023, 13, 1975. [Google Scholar] [CrossRef]
  3. Han, D.; Tao, Z.; Abdul Ghafar, W.; Hasan, M.M.; Xiao, W.; Wang, T.; Zhou, K.; Dai, H. Experimental Study on the Seismic Performance of L-Shaped CFST Columns in Different Combinations. Buildings 2023, 13, 2320. [Google Scholar] [CrossRef]
  4. Zheng, J.L.; Du, H.L.; Mu, T.M.; Liu, J.P.; Qin, D.Y.; Mei, G.X.; Tu, B. Innovations in design, construction, and management of pingnan third bridge-the largest-span arch bridge in the world. Struct. Eng. Int. 2022, 32, 134–141. [Google Scholar] [CrossRef]
  5. Zhou, Y.; Wang, Y.; Zhou, J.T.; Huang, Z.H.; Zhang, X.S.; Xiang, Z.F. Calculation and control method for arch formation of 500m-level steel tube arch bridge. China J. Highway Transp. 2022, 35, 60–72. (In Chinese) [Google Scholar]
  6. Li, Y.; Li, Y.; Li, J. Optimization calculation method of cable force in the whole process of long-span CFST arch bridge constructed by cable-stayed fastening method. Prog. Build. Steel Struct. 2019, 21, 33–39. (In Chinese) [Google Scholar]
  7. Zhou, J.T.; Liu, J.; Zhou, W.; Yan, R.Z.; Yan, T. Analysis of the influence of temperature variation on ore-lift value of cable-stayed fastening and main arch ring alignment of CFST arch bridge. J. China Foreign Highw. 2017, 37, 62–66. (In Chinese) [Google Scholar]
  8. Zhou, Q.; Zhou, J.T.; Zhang, J.C.; Zhang, L. Self-adjusting load pouring method for concrete in long-span CFST arch bridge. J. Harbin Inst. Technol. 2020, 52, 82–89. (In Chinese) [Google Scholar]
  9. Xie, K.Z.; Wang, H.W.; Guo, X.; Zhou, J.X. Study on the safety of the concrete pouring process for the main truss arch structure in a long-span concrete-filled steel tube arch bridge. Mech. Adv. Mat. Struct. 2021, 28, 731–740. [Google Scholar] [CrossRef]
  10. Zheng, J.L.; Wang, J.J.; Feng, Z.; Han, Y.; Qin, D.Y. Experiment on vacuum-assisted pouring process of concrete-filled steel tube arch segment. China J. Highw. Transp. 2014, 27, 44–50. (In Chinese) [Google Scholar]
  11. Han, Y. Experiment and Practical Application of Vacuum-Assisted Concrete Pouring in Steel Tube Arch Bridge. Bridge Constr. 2015, 45, 19–25. (In Chinese) [Google Scholar]
  12. Zhou, D.W.; Deng, N.C.; Shi, T. Experimental and numerical simulation analysis of large hydration temperature field in CFST arch bridge. J. Guangxi Univ. 2021, 46, 51–59. (In Chinese) [Google Scholar]
  13. Sun, J.Y.; Xie, J.B. Simulation analysis of the hydration heat of large diameter CFST arch and its effects on loading age. Appl. Therm. Eng. 2019, 150, 482–491. [Google Scholar] [CrossRef]
  14. Shi, T.; Zheng, J.L.; Deng, N.C.; Chen, Z.; Guo, X.; Wang, S. Temperature load parameters and thermal effects of a long-span concrete-filled steel tube arch bridge in tibet. Adv. Mater. Sci. Eng. 2020, 2020, 1–11. [Google Scholar] [CrossRef]
  15. Sun, J.Y.; Xie, J.B.; Zhang, Z.S. Simulation analysis of thermal stress of CFST arch bridge during exothermic hydration process. In Computational and Experimental Simulations in Engineering: Proceedings of ICCES2019; Okada, H., Atluri, S.N., Eds.; Springer International Publishing: New York, NY, USA; Nature Switzerland AG: Cham, Switzerland, 2020; pp. 1015–1021. [Google Scholar]
  16. Du, Q. Parametric analysis of hydration heat effect on concrete-filled steel tube arch rib. Eng. Constr. 2021, 53, 7–11. (In Chinese) [Google Scholar]
  17. Wen, H.Q. Research on the Influence of Hydration Heat of Concrete in Long-Span CFST Arch Bridge. Master’s Thesis, Chongqing Jiaotong University, Chongqing, China, 2021. (In Chinese). [Google Scholar]
  18. Xin, J.; Tang, Q.; Zhou, J.; Zhou, Y.; Luo, C.; Jiang, Y. A novel method for calculating the ultimate bearing capacity of in-service RC arch bridges using sectional constitutive relation. Appl. Math. Model. 2025, 138, 115829. [Google Scholar] [CrossRef]
  19. Li, Z. Analysis of hydration heat temperature field in CFST arch rib of Xixi river super large bridge. Railw. Eng. 2016, 36–38. (In Chinese) [Google Scholar]
  20. Shi, T.; Deng, N.; Guo, X.; Xu, W. Experimental Study on Deformation Behavior and Compressive Strength of Concrete Cast in Steel Tube Arches under Low-Temperature Conditions. Adv. Mater. Sci. Eng. 2020, 1, 8016282. [Google Scholar] [CrossRef]
  21. Chen, B.C.; Liu, Z.Y. Review on temperature issues of concrete-filled steel tube arch bridges. J. Fuzhou Univ. 2009, 37, 412–418. (In Chinese) [Google Scholar]
  22. Jing, X. Study on Hydration Heat and Pouring Scheme of Concrete in Concrete-Filled Steel Tube Arch. Master’s Thesis, Chongqing Jiaotong University, Chongqing, China, 2012. (In Chinese). [Google Scholar]
  23. Zhou, D.W.; Deng, N.C.; Guo, X. Experimental study on hydration thermal stress of concrete-filled steel tube under low-temperature pouring conditions. J. Railw. Sci. Eng. 2020, 17, 2807–2815. (In Chinese) [Google Scholar]
  24. Cai, Z. Properties of Concrete; China Architecture & Building Press: Beijing, China, 1979; pp. 94–101. (In Chinese) [Google Scholar]
  25. Qin, C.; Gong, J.W.; Xie, G.C.; Jiang, C.M.; Luan, S.Y. Study on hydration heat calculation of portland cement-based cementitious material system. Water Power 2021, 47, 56–62. (In Chinese) [Google Scholar]
  26. Wang, Y.B. Analysis of Temperature Field and Thermal Effects in Long-Span CFST Arch Bridge. Master’s Thesis, Southwest Jiaotong University, Chengdu, China, 2013. (In Chinese). [Google Scholar]
  27. Zhang, F. Study on Pouring Sequence of Long-Span CFST arch Rib and Hydration Heat of Concrete in Tube. Master’s Thesis, Chongqing Jiaotong University, Chongqing, China, 2020. [Google Scholar]
  28. Yang, Y.; Zhang, R.L.; Qi, Q.; Yang, H.P. Experimental study on temperature field distribution of large-diameter circular concrete-filled steel tube section. Build. Struct. 2020, 50, 99–103. (In Chinese) [Google Scholar]
  29. Han, Y.; Yang, Z.F.; Qin, D.Y.; Zheng, J. Key construction technologies and innovations of Matan Hongshui river super large bridge. Highway 2019, 64, 125–129. (In Chinese) [Google Scholar]
  30. Zheng, J.L. Innovative Technologies for Construction of 500-Meter-Level Concrete-Filled Steel Tube Arch Bridges; Shanghai Scientific & Technical Publishers: Shanghai, China, 2019. (In Chinese) [Google Scholar]
  31. Zhang, W.F. Key installation technologies of Qianwei Minjiang CFST arch bridge. Highway 2021, 66, 142–146. (In Chinese) [Google Scholar]
  32. Xie, G.Y.; Liu, J.; Yuan, C.C.; Shao, H.Y. Key construction technologies of Zhijing river CFST arch bridge. Bridge Constr. 2009, 57–59, 73. (In Chinese) [Google Scholar]
  33. Dong, X.Q.; Zhang, F.; Xu, X.F.; Liu, J.Q. Fatigue damage assessment of short hangers in tied-arch bridge. Highway 2018, 63, 74–78. (In Chinese) [Google Scholar]
  34. Han, Y. Research on Key Calculation Theory and Control for Construction of Super-Long-Span CFST Arch Bridge. Ph.D. Thesis, Chongqing Jiaotong University, Chongqing, China, 2019. (In Chinese). [Google Scholar]
  35. Wang, H.W.; Xie, K.Z.; Guo, X.; Zhou, J.X. Stability study on concrete pouring process of arch Rib in long-span CFST arch bridge. World Bridges 2019, 47, 49–53. (In Chinese) [Google Scholar]
Figure 1. CFST test model.
Buildings 15 01711 g001
Figure 2. Finite element model of Specimen 1.
Buildings 15 01711 g002
Figure 3. Simulation results of the temperature field at different time points for Specimen 1. (a) t = 20 h, (b) t = 60 h, (c) t = 80 h, (d) t = 100 h.
Buildings 15 01711 g003
Figure 4. Temperature model for arch rib cross-section.
Buildings 15 01711 g004
Figure 5. Layout diagram of Pingnan Third Bridge (cm).
Buildings 15 01711 g005
Figure 6. Arch rib model of the Pingnan Third Bridge.
Buildings 15 01711 g006
Figure 7. Schematic of the concrete pouring sequence (The numbers represent the perfusion sequence).
Buildings 15 01711 g007
Figure 8. Concrete elastic mold experiment.
Buildings 15 01711 g008
Figure 9. Analytical framework diagram.
Buildings 15 01711 g009
Figure 10. Displacement of the arch crown during the pouring stages of eight steel tubes.
Buildings 15 01711 g010
Table 1. Comparing three hydration heat models.
ModelRMSE (°C)R2Parameter CountPhysical Interpretability
Exponential [19]4.20.872Low (no peak capture)
Hyperbolic [20]3.80.893Moderate
Composite Exponential (Proposed)1.70.964High (explicit τ, β)
Table 2. Values of a and b in the compound index hydration heat model.
Cement TypeKernel TypeKernel Expression
Grade 42.5 Ordinary Portland Cement0.690.56
Grade 52.5 Ordinary Portland Cement0.360.74
Grade 52.5 Ordinary Portland Cement for Dams0.790.70
Grade 42.5 Portland Slag Cement for Dams0.290.76
Table 3. Cement and fly ash contents in the arch ribs of CFST arch bridges (kg/m3).
ParameterReference [25]Reference [26]Reference [27]Reference [28]Reference [29]
C400360430400480
Fa5082704580
C+Fa450442500445560
Fa%11.1%18.6%14.0%10.1%14.3%
C392387440465433
Fa5390755842
C+Fa445477515523475
Fa%11.9%18.9%14.6%11.1%8.8%
Table 4. Concrete mix proportion for the test section (kg/m3).
MaterialsCementWaterFly AshExpansion AgentMineral Powder/MicrobeadsSilicon PowderSandStoneWater Reducing Agent
Specimen 140015745502510711105210.6
Specimen 241314448604236759104814.4
Table 5. Material variability study.
ParameterVariationStress ErrorDeflection Error
Steel Yield Strength±10%6.7%4.2%
Concrete Poisson’s Ratio±15%3.9%2.8%
Thermal Conductivity±20%11.4%8.6%
Table 6. Concrete test on the Pingnan Third Bridge.
Type Age/dModulus of Elasticity/GPa
332.3
536.9
739.1
1442.6
2846.0
Disclaimer/Publisher’s Note: The statements, opinions and data contained in all publications are solely those of the individual author(s) and contributor(s) and not of MDPI and/or the editor(s). MDPI and/or the editor(s) disclaim responsibility for any injury to people or property resulting from any ideas, methods, instructions or products referred to in the content.

