1. Introduction
Modular or panelized bridges, constructed from stacked rectangular panels configured to function as girder-type structures, have become the preferred solution for rapid bridge deployment. The effectiveness of this approach is evident in systems like the Bailey, Mabey–Johnson, and Acrow, which have proven their versatility across various applications. These systems have been extensively utilized in military operations, temporary civil infrastructure projects, and disaster relief efforts since World War II [
1,
2,
3,
4]. Modular bridge technology remains essential for the construction of both permanent and temporary bridge structures, including interim crossings that facilitate traffic flow during the construction of long-term solutions. Modular bridge construction works by assembling a series of modular shear panels. These panels are connected along their length using pins that join the male and female lugs at the top and bottom chords of the adjacent panels. For example, the Bailey Bridge consists of prefabricated, high-tensile structural steel panels, each measuring 3.05 m in length and 1.52 m in depth. These panels can be configured either laterally, in a side-by-side arrangement, or stacked vertically, facilitating modifications in both load capacity and span length. The system allows for the assembly of up to four Bailey panels in parallel and up to three stories in height [
3].
The design of modular bridges is governed by a set of critical parameters, particularly geometric requirements such as span length, number of lanes, and deck width. The deck width adheres to the following standardized dimensions based on the number of traffic lanes: a single-lane configuration with a normal width of 3.15 m, an extra-wide single lane at 4.20 m, and a two-lane configuration at 7.35 m. Additionally, the efficiency of Bailey bridges is constrained by the uniform cross-sections along the span, which do not vary according to the changing flexural and shear demands. This constraint highlights the need for optimization strategies to enhance the overall efficiency and performance of Bailey bridges [
5,
6]. Furthermore, experimental investigations [
7,
8,
9,
10] underscore the necessity of conducting studies on the actual behavior of Bailey bridges under full-scale, real-world loading conditions. Such studies are crucial for accurately determining the structural capacity and dynamic response of these bridges.
King et al. [
11] performed laboratory loading experiments on a girder constructed from two Bailey-type bridge panels to evaluate its ultimate load-carrying capacity. The study showed that the chord members experienced inelastic lateral buckling. Additionally, the findings suggested that the limited rigidity of the connections had a minimal effect. As a result, they proposed that a two-dimensional nonlinear inelastic analysis may overestimate the bridge’s load-carrying capacity due to its inability to accurately account for out-of-plane stability behavior. King and Duan [
12] conducted a study on a 1/6-scale model of a Bailey, where all member ends were fully welded. The model included one-, two-, and three-bay panels arranged in a single truss, single-story configuration. Structural degradation was simulated by removing or reducing the cross-section of certain members to evaluate their impact on bridge performance. Prokop et al. [
13] carried out numerical analyses on the loading capacity of Bailey bridges to determine the possibility of using them in civilian applications. They focused on whether and to what extent the Bailey bridge system with spans between 12 and 36 m is usable for on-site freight transport with conventional lorries with a total weight of up to 22–28 tons. Results showed that it is possible to decide on the deployment of specific configurations of main girder panels and deck members for Bailey bridge systems for various spans. Parivalla et al. [
10] conducted load tests on a 24.38 m double-lane Bailey bridge to evaluate its performance under IRC Class 24R loading. The results demonstrated that the bridge could safely accommodate up to IRC Class 40R loading without compromising structural integrity. Additionally, the study confirmed that the bridge remained structurally safe even under uncontrolled loading conditions, such as being fully loaded with IRC Class 24R vehicles spaced at a nose-to-tail distance of 1.5 m. Tong et al. [
14] analyzed the structural stability of truss bridges and found that the critical buckling load, when accounting for material and geometric nonlinearity, as well as initial geometric imperfections, was 10% lower than the predictions from a linear buckling analysis. Gocal et al. [
15,
16] compared the effects of various traffic load models, as prescribed by technical standards commonly used in the design of existing road bridges in Slovakia, with those based on the LM1 load model according to Eurocode. Embaby and El Naggar [
17] investigated the performance, load carrying capacity, buckling response, and failure mechanisms of a 45.7 m double truss modular bridge through full-scale field testing and finite element analysis. Their study explored various modeling techniques, considering different end conditions (pinned and rigid), and highlighted the significance of diaphragm action in reducing the tension forces in the lower chord members. Embaby and El Naggar [
17] extended this investigation by examining the effects of reinforcing the top and bottom chords on bridge behavior and reported an increase in the bridge capacity of up to 90% by reinforcing the top chord members.
Tugilimana et al. [
18] proposed a design optimization strategy for modular structures, extending the existing formulation to encompass both module topology and spatial orientation optimization. This approach was further generalized to include the reusability of modules across multiple structures. Additionally, the strategy incorporated practical design considerations, including the use of multiple module types, the accommodation of various load cases, and the ability to compute displacements within an elastic design framework. Gerbo et al. [
5] investigated the design challenges associated with panelized bridge systems, focusing on material efficiency, lateral bracing, and the achievement of longer spans. They developed design forms for a Pratt truss, a bowstring truss, and a network tied arch, each with spans exceeding 91.4 m. These designs were initially validated through linear eigenvalue buckling analyses. Nonetheless, the study acknowledged the need for further detailed analyses, particularly nonlinear buckling analyses that incorporate geometrical nonlinearities, to fully assess the stability and performance of the developed forms. Embaby and El Naggar [
19] conducted a comprehensive investigation on two types of truss panels designed for use in different sections of a bridge span. High shear panels (HSP), featuring heavier cross-sections, were designated for regions subjected to significant shear forces, while standard shear panels (SSP), with lighter cross-sections, were intended for the remaining portions of the bridge. During the experimental phase, the panels were tested to failure, revealing that the high shear panels exhibited an average of 20% greater load capacity compared to the standard shear panels. The study further examined the buckling behavior and nonlinear response of the panels using two distinct finite element modeling approaches, which were beam-column elements and shell elements. They proposed a collective corrective length factor
K =
λe ⋅
λl to be incorporated into AASHTO-LRFD [
20] design specifications for both standard and high shear panels, enabling more accurate predictions of their load-carrying capacity and buckling behavior.
Despite the widespread use and adaptability of modular bridges, the existing literature has largely focused on standard configurations, with limited attention to the effects of vertical stacking, multiple truss lines, or multi-lane setups on structural behavior. Comprehensive investigations into the performance of diverse configurations, such as double-story bridges accommodating multiple lanes, are notably lacking. Critical aspects, including stiffness, buckling resistance, and load distribution characteristics across these advanced configurations, remain insufficiently explored. This study aims to fill this gap by examining the structural behavior, buckling characteristics, and load-carrying performance of modular bridges across these configurations. By combining experimental field testing and advanced finite element modeling, this paper provides a detailed evaluation of the performance differences between single- and double-story modular bridges with double and quadruple truss lines, including their response under single- and multi-lane loading scenarios. The finite element models include a combination of linear and nonlinear analysis to precisely capture the structural response and ultimate load-carrying capacity. Linear analysis evaluates elastic behavior and critical buckling load factors, while nonlinear analysis accounts for material and geometric nonlinearity to simulate the ultimate load conditions. The objective of this study is to identify the structural advantages and limitations of each configuration, including the enhanced stiffness and load-carrying capacity of double-story bridges. Furthermore, the analysis highlights the impact of increasing bridge width on the out-of-plane buckling resistance, potentially reducing structural stability under specific conditions. By addressing the limitations in the existing literature, this research contributes to a deeper understanding of modular bridge behavior across diverse configurations, offering practical insights for optimizing their design and expanding their applications in civil engineering projects.
2. Bridge Description
Figure 1 displays a picture of the double-double truss modular bridge tested in this study. The bridge was fabricated and assembled by Algonquin Bridge (Thorndale, ON, Canada) while
Figure 2a–c presents the bridge plan, elevation, and side view, respectively. The bridge construction involved a total of 120 truss panels, resulting in a two-story structure with an overall span of 45.7 m and a width of 6.094 m. The clear distance between the inner truss lines is 4.820 m. Each truss panel measured 2.941 m in length and 2.235 m in height. Both stories of the bridge were composed of 60 truss panels, organized into 15 rows. Each row contained two double truss lines, referred to as the near-side truss line and far-side truss line. The bridge was mounted on fixed bearings at one end and sliding bearings at the opposite end, with both types of supports resting on pile foundations.
The bridge structure utilized the following two distinct types of truss panels: standard shear panels (SSPs) and high shear panels (HSPs). The HSPs were placed at the bridge ends, with SSPs deployed throughout the rest of the span.
Figure 3, along with
Table 1 and
Table 2, provides details about the components of the SSPs and HSPs, including member descriptions, component types, geometrical properties, and material specifications. The (HSP) utilized hollow structural sections HSS of 76 × 38 × 6.35 mm for both diagonal and vertical members, whereas the (SSP) employed C-sections measuring 75 × 9 mm for the same members. Both types of panels have the same upper and bottom chords, constructed from two box sections of HSS 102 × 51 × 7.9 mm. The two HSS members were spaced 76.2 mm apart to accommodate the depth of the diagonal and vertical members. These HSS 102 × 51 × 7.9 mm chords were connected by 76.2 × 76.2 × 10 mm square plates. All members in both panels were fabricated from 350 W steel, with a yield stress of 350 MPa and a tensile strength of 450 MPa, except for the chord members, which were made from 480 WT steel, having a yield stress of 480 MPa and a tensile strength of 590 MPa. The two stories of the bridge were linked together through 60 mm bolted connections between the top chords of the lower trusses and the bottom chords of the upper trusses using 76.2 × 76.2 × 10 mm square plates for each truss line. Each truss panel from the lower story was connected to the upper story via four joints spaced 725 mm apart, creating a total of 60 connection points along each truss line between the upper and lower trusses. End posts, composed of double channels C 4 × 7.25, were installed at each end of the truss lines, attached to a vertical member of the end truss panel, and connected to the upper and lower chords of the lower trusses using pins. These end posts were anchored to the bridge supports to enhance the structure’s shear capacity.
Transoms, consisting of W 21 × 44 sections, were placed on the lower chords of the truss panels to provide support and stability to the roadway deck. The bridge incorporated two types of vertical bracing systems. One set was placed between adjacent truss lines to provide lateral support within the girders, while a second set ran longitudinally along the bridge, connecting to the transom webs to reinforce their structural stability. To enhance horizontal stability, sway bracing was added at the ends of the lower flange of the transoms. Additionally, bracing plates were installed along the top chords of the upper-story trusses, spanning all bays except the end bays.
3. Instrumentation
The structural behavior and response of the bridge were systematically monitored using strain gauges and linear variable differential transducers (LVDTs). A total of six panels were monitored on each truss line, with four near the bridge ends, where shear forces are expected to be the highest, and two at midspan, an area that is vulnerable to load-induced deformations. Four LVDTs were strategically positioned at the corners of the midspan truss panels to measure vertical deformations. Strain gauges were positioned across the near inner (NI), near outer (NO), far inner (FI), and far outer (FO) truss panels. In total, 152 strain gauges were distributed among the diagonal and vertical members within the end panels, with an additional 24 strain gauges placed along the top, intermediate, and bottom chords of the midspan truss panel.
Figure 4 shows the strain gauge installations on (a) near-end panels 1 and 2 at the bottom story, (b) near-end panels 3 and 4 at the top story of the bridge, and (c) mid-span panels. Similar instrumentation was applied to the far truss panels to ensure the symmetrical behavior of the bridge. The gauge strain range was ±5000 µin/in [±5000 µm/m], the normal operating temperature range was [–75° to +95 °C], and resistance in ohms was 350 ± 0.4%. The strain gauges and LVDTs recorded data at each truck position, which were continuously logged and stored, allowing for a thorough analysis and interpretation of the bridge’s structural response to the applied loads.
The structural behavior of the bridge under operational loads (i.e., standard truck load) was evaluated to assess its performance.
Figure 5 depicts the truck loading positioned in the center lane, highlighting the contact area between the truck tires and the bridge deck, along with their respective dimensions. The test vehicle, weighing a total of 368 kN, had its load distributed across three axles as follows: 47 kN on the front (steering) axle, 143 kN on the middle (driving) axle, and 178 kN on the rear (trailer) axle. To ensure a comprehensive dataset for model validation, the truck was placed at ten predetermined locations along the bridge span, from the fourth to the thirteenth transom, as shown in
Figure 2b. Deflections and strains were meticulously recorded at each position, providing valuable data for analyzing the bridge’s response to the applied loads.
4. Finite Element Analysis
A detailed finite element analysis (FEA) was carried out using a three-dimensional model developed with the Midas Civil software platform 2023 [
21]. The model was designed to accurately simulate the bridge’s structural components; beam–column elements represented the primary bridge members, while the deck was discretized with beam–column elements for ribs and end channels and four-node shell elements for the 4.7625 mm steel top plate. All beam–column elements were divided into segments with a maximum length of 35 cm. Rigid end conditions were applied to all truss members, as they provide a more accurate simulation of the bridge response [
17]. To simulate the double story structure, 5 cm separation was maintained between the bridge’s upper and lower stories, connected by 20 mm cylindrical beam elements for each truss line, simulating the bolts joining the stories. Each truss panel was connected at four points, providing an accurate representation of the structural interaction between the upper and lower stories.
Using the developed FEM, linear and nonlinear analyses were carried out on the test bridge using the traffic load according to Canadian Highway Bridge Design Code [
22]. Different models were conducted to simulate the truck loading for ten positions included in the experimental tests using linear analysis. These FEM models were validated by comparing the deflections and strains obtained from the experimental test. Additionally, a linear buckling analysis was conducted for each bridge configuration to evaluate its structural stability, particularly focusing on the top chord and diagonal members of the truss. The goal was to investigate the potential for out-of-plane buckling and determine the load thresholds at which buckling failure could occur. The buckling analysis included two loading scenarios, with one accounting for the structure’s constant self-weight and the other incorporating variable test loads applied to the deck. Further nonlinear response analyses, including material and geometrical nonlinearity, were conducted to assess the complete behavior and load-bearing capacity of the bridge.
Both analyses were conducted for different configurations of the modular bridge, including single-lane, double-story, double-truss line (SDD) and single-lane, single-story, quadruple-truss line (SSQ) configurations to evaluate the efficiency of utilizing an equivalent quantity of truss panels in horizontal versus vertical stacking. Additionally, the study examined the behavior and capacity changes in double-lane, double-story, double-truss line (DSQ) configurations compared to double-lane, single-story, quadruple-truss line (DSQ) configurations.
5. Experimental and Finite Element Analysis Results Model Validation
This section presents the key findings derived from both field test results and the FEA performed on the modular bridge. The field investigation primarily focused on evaluating the deflection behavior of the bridge and examining axial strains in critical structural components under working load conditions. The data collected during these tests provided valuable insights into the structural performance of the bridge, particularly its response to vehicular loading.
Figure 6 illustrates the deflections recorded by the LVDTs at mid-span, specifically at transoms 8 and 9, for the double-story bridge configuration under ten distinct truck loading positions. The measured deflections were compared with data obtained from full-scale truck loading tests on a single-story bridge, as reported by Embaby and El Naggar [
17]. Specifically, the mid-span deflection recorded when the truck was positioned at transom 4 was 11.725 mm, and this value increased notably to 27.45 mm when the truck was moved to transom 9. Notably, the double-story bridge configuration demonstrated a marked reduction in mid-span deflection, i.e., approximately 42% compared with the single-story bridge under identical truck loading conditions. This highlights the superior stiffness and enhanced load-distribution capabilities of the double-story design.
The finite element model was employed to simulate a truck loading test along the bridge’s center lane, employing linear analysis techniques.
Figure 7 shows the calculated deflections corresponding to the ten truck positions. The simulated deflections at the near and far truss lines are compared with the experimental data collected from field tests. The comparison indicates a good agreement between the calculated and measured predicted deflections, indicating the accuracy and reliability of the finite element model in replicating the bridge’s structural response.
Strain measurements were recorded on the chords during truck loading tests to gain insights into the performance of the double-story bridge.
Figure 8, along with
Figure 4, presents the measured and calculated strain data for the bottom, intermediate, and top chords of the bridge when the truck was positioned at mid-span. Results of the field test indicated that strains in the top and bottom chords of the outer truss line were only slightly higher than those in the corresponding chords of the inner truss line. Additionally, the intermediate chord strains were nearly zero, suggesting that the double-story trusses function as a unified truss structure. The calculated strains agree well with the experimental results, with percentage differences between the finite element model and experimental measurements being less than 10% for all members. Notably, the predicted strains for the intermediate chord were nearly zero, aligning closely with the experimental findings. These observations validate the modeling approach, where the lower and upper stories were connected using rigid links to represent the bolts joining adjacent truss panels in the vertical direction. In addition, the good agreement between the calculated and measured responses verifies the model’s ability to accurately capture the structural behavior of the bridge and demonstrates its effectiveness for analyzing multi-story configurations.
6. Study of Modular Bridge Configurations
6.1. Buckling Analysis
By employing the above validated finite element models for double-story bridges along with single-story bridges developed by Embaby and Elnaggar [
17], linear buckling analyses were conducted on four bridge configurations. These included (SDD), (SSQ), (DDD), and (DSQ).
Figure 9 presents a schematic representation of the various bridge configurations, including (DD) and (SQ) configurations. The analysis was performed using the CL-W truck lane load [
23], considering two loading cases. In the first case, the CL-W truck is positioned in the mid-span of the bridge, which causes moment action (inducing high axial load on the top and bottom chords of the truss), while in the second case, the truck load is positioned at the end of the bridge, causing shear action (inducing high axial load on diagonal and vertical members of the truss). Both load cases include a uniformly distributed load of 9 kN/m across a 3.0 m wide bridge deck. For single-lane bridges, one truck is used for loading, whereas for double-lane bridges, two trucks are employed, with one truck assigned to each lane.
The results of the elastic buckling analysis are expressed by the shapes of buckling modes, which are quantified by the critical buckling load factor (α
cr). Thus, the critical buckling load factor (α
cr) represents an amplifier by which the design live load [
23] would have to be increased to cause elastic instability. It is worth mentioning that the own weight of the bridge is accounted for in the analysis as a constant load case.
Figure 10 shows examples of the buckling mode for the (SSQ) and (SDD) configurations under the load case of traffic load, with the truck load positioned at the mid-span of the bridge and end of the bridge, respectively.
Table 3 compares the buckling load factors (α
cr) for the first two buckling modes for the four bridge configurations under two critical traffic load cases, with one causing moment action and the other causing shear action on the bridge.
For single-lane configurations, the (SDD) configuration exhibited a first buckling mode characterized by buckling at the end post, which is attached to the vertical member of the end truss panel and rests on bridge supports. The buckling load factors (αcr) are 6.85 and 4.99 for the moment action and shear action load cases, respectively. In this mode, the adjacent vertical member of the truss panel, which is connected to the end post, continues to carry the load even after the end post buckles. This behavior is further elaborated in the nonlinear analysis section. Correspondingly, the second buckling mode governs the buckling response of this configuration. The second mode involves buckling of the diagonal member located at the third bay—where standard shear panels are used—at buckling load factors (αcr) of 7.88 and 10.8 for the moment action and shear action load cases, respectively. In the (SSQ) configuration, the first and second buckling modes reveal that the moment action load case induces simultaneous buckling in the mid-span top chords and the diagonal member at the third bay, with buckling load factors (αcr) of 7.464 and 7.54, respectively. These findings indicate that, while the (SDD) and (SSQ) configurations exhibit distinct buckling modes, their buckling load factors (αcr) are close. Furthermore, extending the use of high shear panels to the third and fourth bays in the (SDD) configuration would significantly enhance its buckling resistance compared to the (SSQ) configuration, offering improved structural performance under critical loading conditions.
For double-lane configurations, the (DDD) configuration displays different buckling behaviors depending on the load case. Under the moment action load case, combined buckling of the diagonal and end-post members occurs at a load factor αcr of 2.86, whereas, under shear action, buckling is observed in the diagonal member at the third bay. Specifically, for the (DSQ) configuration, the first buckling mode under the moment action load case is governed by the diagonal member at the third bay (αcr) = 2.74, while in the shear action load case, the second buckling mode dominates, with the diagonal at the third bay buckling at αcr = 3.58.
These results demonstrate that, for this bridge span and truss panels used in its construction, single-lane configurations exhibit high buckling resistance regardless of having two or four truss lines. Furthermore, both single-lane and double-lane configurations, whether single-story or double-story, exhibit close buckling load factors with different modes of buckling.
6.2. Nonlinear Analysis
In the non-linear analysis, material and geometrical nonlinearities are incorporated into the finite element model to simulate buckling-induced material failure. Eight models are developed to analyze four bridge configurations under two loading cases, moment and shear actions. The applied loads include a CL-W truck and a uniformly distributed load, as specified by the Canadian Highway Bridge Design Code [
22]. The loads are incrementally applied in 20 steps, with a maximum of 10 iterations per step. To model the material behavior of the bridge components, a Von Mises criterion is used, with the top and bottom chords having a yield stress of 480 MPa, and the other structural members having a yield stress of 350 MPa. The elastic, perfectly plastic material model is used to simulate the behavior of beam–column elements, while deck members (shell elements) and transoms are assumed to remain within the elastic range. Failure criteria are defined by the hardening parameter at the yield point and stress invariant, where the hardening parameter is correlated by the uniaxial stress, effective stress, and effective plastic strain. The Newton–Raphson approach is used for the nonlinear response analysis.
Figure 11 shows the calculated load-deflection curves for the four different configurations (SDD), (SSQ), (DDD), and (DSQ) due to traffic loading in the midspan of the bridge. Results indicate that adopting a double-story bridge with two truss lines on each side increases the bridge capacity by 36% compared to a single-story bridge with four truss lines. Furthermore, the stiffness of double-story bridges is found to be approximately 2.48 times that of single-story bridges for the single-lane configuration and 2.61 times that for the double-lane configuration. Additionally, single-lane bridges have a 12.5% higher load capacity compared to double-lane bridges. This can be attributed to the increased width of double-lane bridges, which leads to overall buckling behavior, as further discussed in the subsequent section.
Figure 12 and
Figure 13 present the calculated axial stresses for single-lane single- and double-story bridges for moment and shear action load cases, respectively. For single-story bridges, buckling-induced material failure occurs in the top chord under both mid-span and end-span load cases. Similarly, for double-story bridges, buckling-induced material failure is observed in the top chord under the mid-span load case, for diagonal members at the end-bay truss panel under end-span load case. This failure mechanism in case of mid-span load case is due to the occurrence of out-of-plan deformation in the mid-span top chord, which triggers the overall buckling.
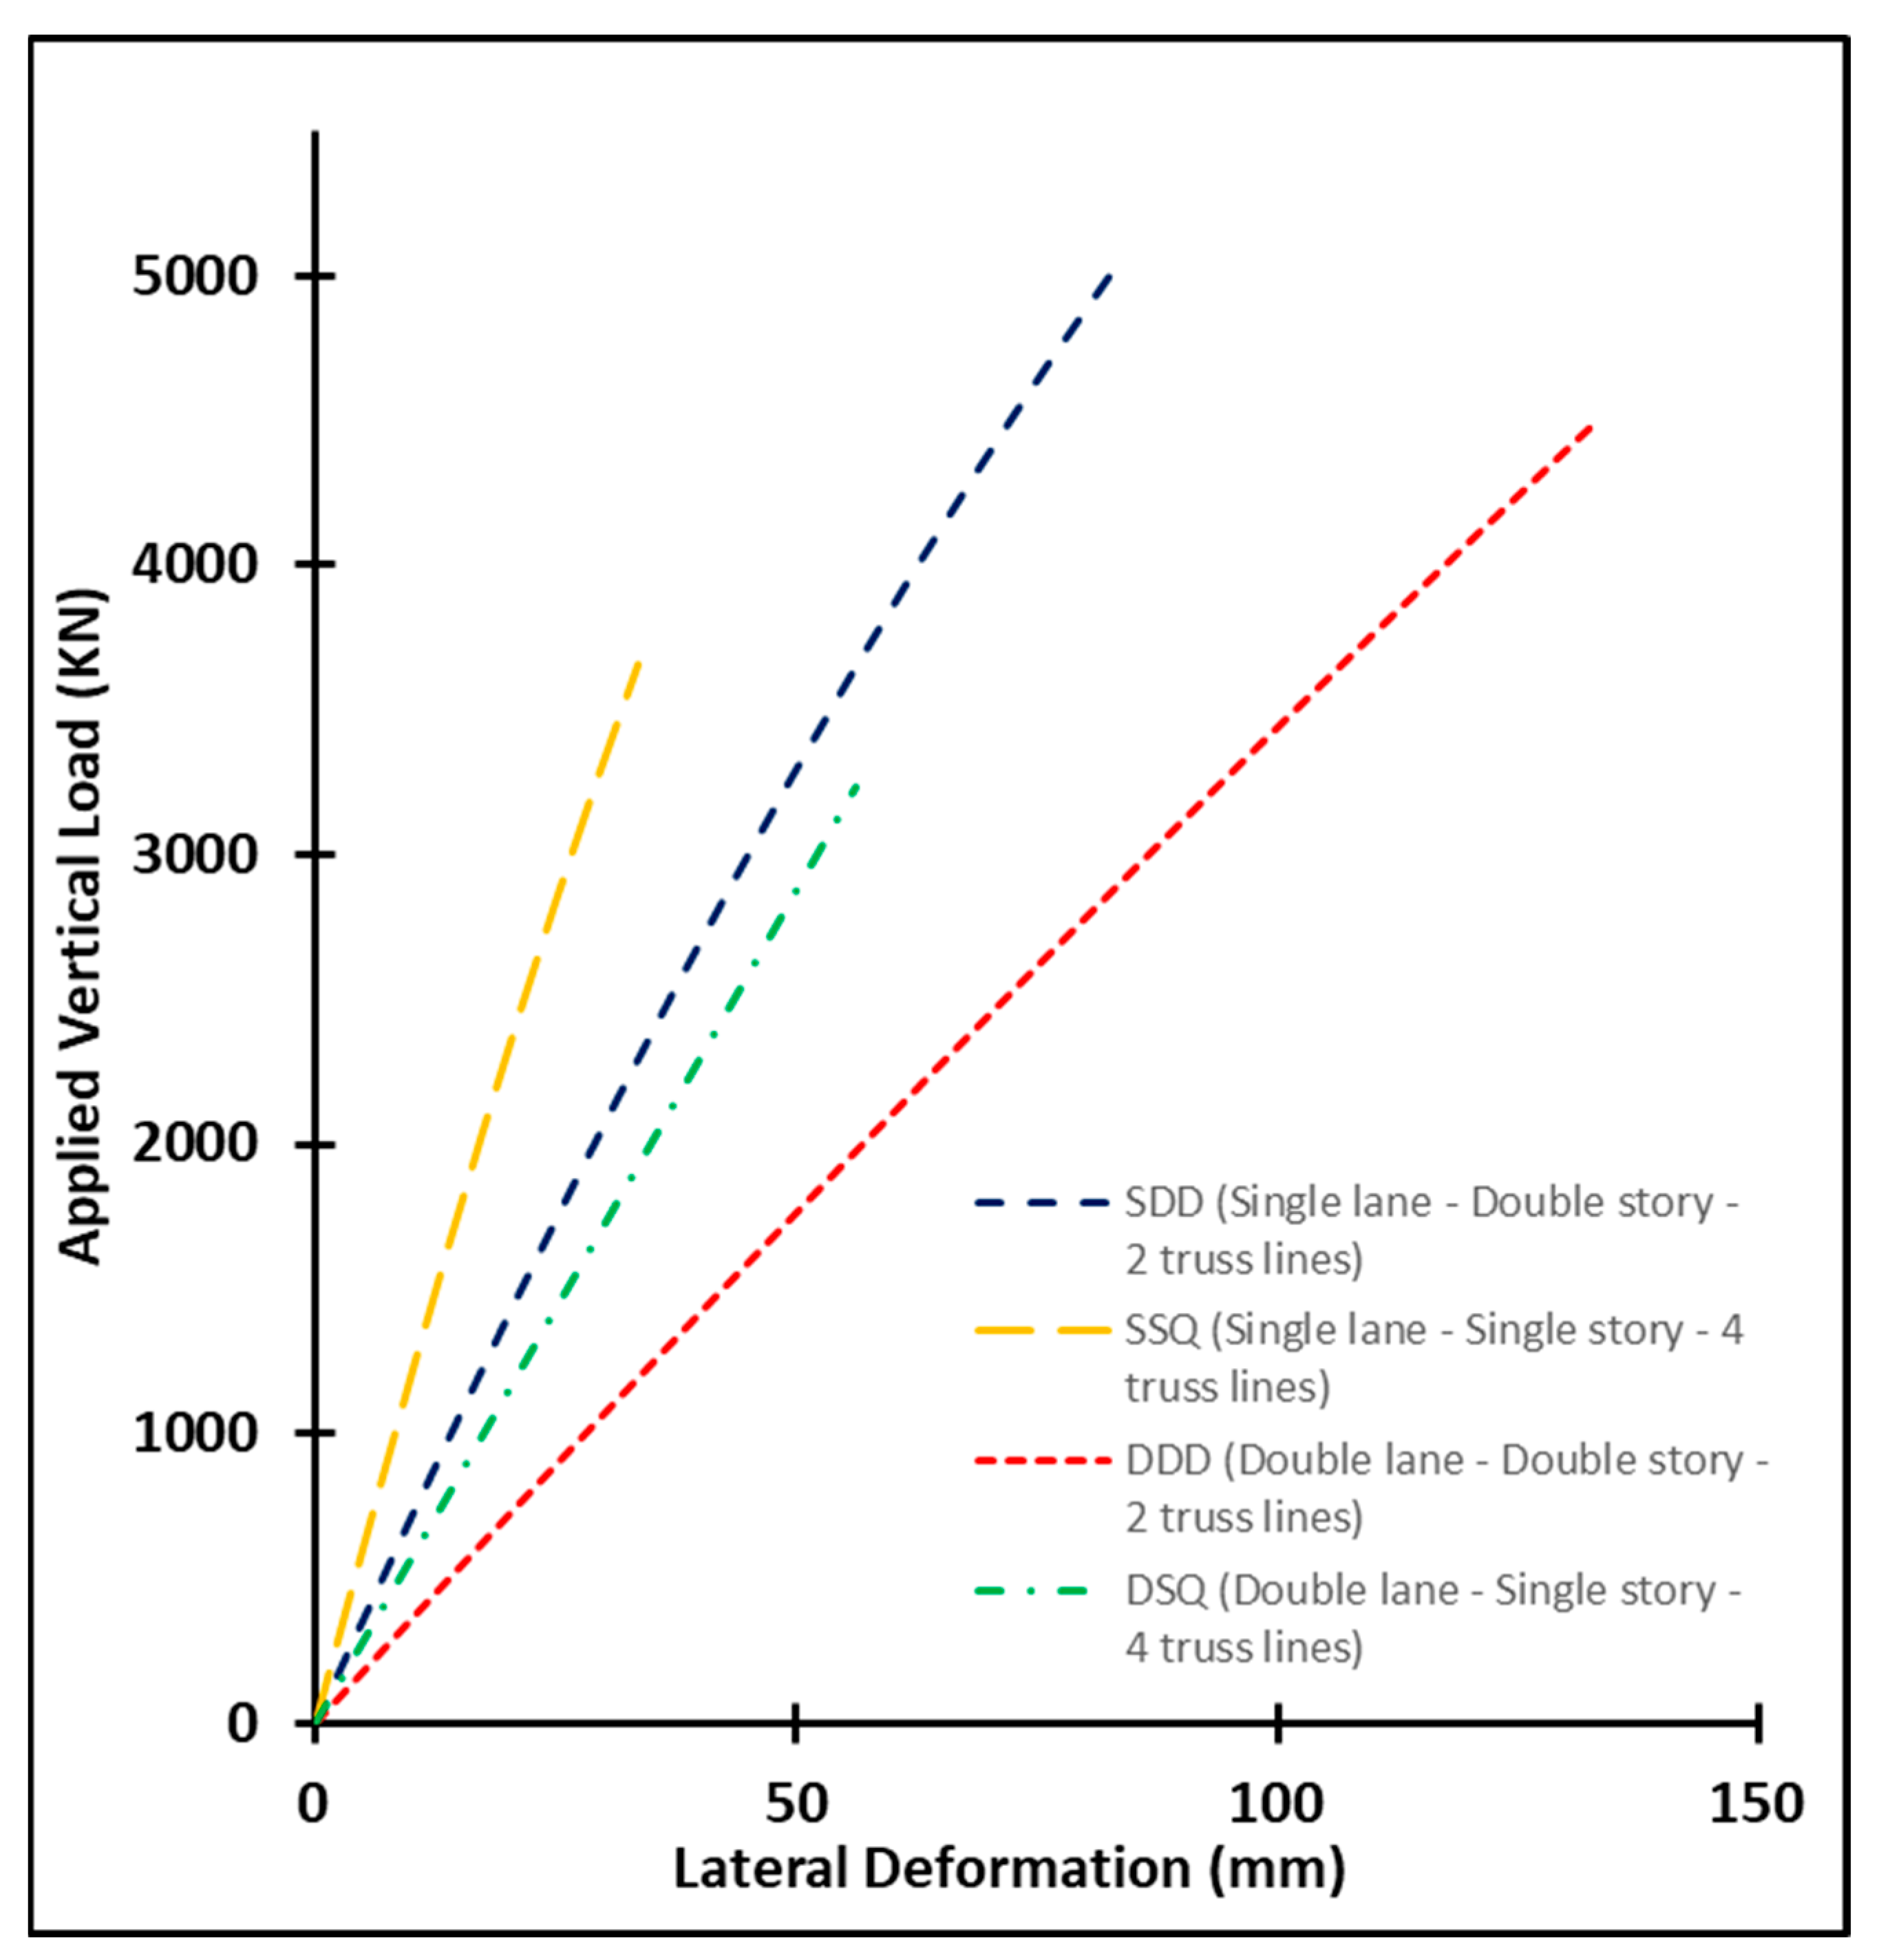
Figure 14 presents the bridge lateral deformations at the maximum load step for (SDD) and (DDD) configurations, while
Figure 15 displays the lateral deformation curves of the top chord at mid-span against the vertical applied load for all configurations. Inspecting these figures reveals that the double-lane configuration is more vulnerable to the out-of-plane deformation of the mid-span top chord by 65% and 40.5% for double-story and single-story bridges, respectively, when compared to single-lane configurations. This is attributed to the greater vertical deformation experienced by the transoms in the double-lane case, which induces rotation at the transom–truss connections. Consequently, the compatibility between the truss and transoms leads to higher out-of-plane deformation. A similar observation was reported by Azizinamini [
23], who conducted failure testing on an existing steel truss bridge. The study revealed that loading the floor beam induced out-of-plane displacements in the vertical members. These displacements subsequently caused out-of-plane rotations in the top compression chords, subjecting them to secondary stresses.
In the single-lane configuration, the slope of the deformation curve for the (SSQ) configuration is 94.7% higher than the slope for the (SDD) configuration, indicating significantly higher out-of-plane stiffness. Similarly, in the double-lane configuration, the slope of the (DSQ) curve surpasses that of the (DDD) curve by 78.9%. These results emphasize the superior out-of-plane stiffness of single-story configurations with quadruple truss lines compared to double-story configurations with double truss lines.
Table 4 summarizes the load capacity and live load factor (α) for each bridge configuration under maximum moment and maximum shear load cases.
Table 4 indicates that the maximum moment load case is critical for both configurations. For single-lane bridges, the double-story bridge has a load capacity of 5065 kN with a corresponding live load factor of 5.47, while the single-story bridge has a load capacity of 3713 kN with a live load factor of 3.98. When compared to the Ultimate Limit State (ULS1) specified by the Canadian Highway Bridge Design Code [
22], the design of both single-lane configurations is conservative for the given span and truss panel arrangement.
For double-lane bridges, buckling-induced material failure is observed in the top chord member under the maximum moment load case for both single- and double-story configurations. This behavior may be attributed to the increased bridge width, which reduces the overall out-of-plane buckling stiffness. Comparing the live load factors (α) with that specified by CHBDC [
22] for load combination ULS1 reveals that, for single-story bridges with four truss lines, the live load factor falls below the ULS1 requirements. However, in the case of double-story bridges with two truss lines, the predicted live load factor satisfies CHBDC [
22] requirements with a reasonable margin of safety. These findings underscore the superior performance, stiffness, and load capacity of the double-story configuration compared to the single-story bridge.
The response analysis reveals a notable difference in failure mechanisms under mid-span loading. For single-lane configurations, both double-story with two truss lines and single-story with four truss lines fail due to material yielding at the top chord, fully utilizing the member’s capacity. This behavior leads to a higher live load factor compared to CHBDC requirements, demonstrating conservative performance and suitability for longer spans. In contrast, double-lane configurations under mid-span loading fail due to buckling caused by significant out-of-plane lateral deformations at the top chord, resulting in pronounced P-delta effects. This mode of failure prevents the full utilization of the member’s capacity.


