Article

Impact of Multi-Defect Coupling Effects on the Safety of Shield Tunnels and Cross Passages

1
Beijing Key Laboratory of Underground Engineering Construction Prediction & Precaution, Beijing Municipal Engineering Research Institute, Beijing 100037, China
2
School of Civil Engineering, Beijing Jiaotong University, Beijing 100044, China
*
Author to whom correspondence should be addressed.
Buildings 2025, 15(10), 1696; https://doi.org/10.3390/buildings15101696
Submission received: 24 April 2025 / Revised: 13 May 2025 / Accepted: 15 May 2025 / Published: 17 May 2025

Abstract

:
As urban rail transit networks age, understanding the synergistic impacts of multi-defect interactions on tunnel structural safety has become critical for underground infrastructure maintenance. This study investigates defect interaction mechanisms in shield tunnels and cross passages of Beijing Metro Line 8, integrating field monitoring, numerical simulations, and Bayesian network analysis. Long-term field surveys identified spatiotemporal coupling characteristics of four key defects—lining leakage, structural voids, material deterioration, and deformation—while revealing typical defect propagation patterns such as localized leakage at track beds and drainage pipe-induced voids. A 3D fluid–solid coupling numerical model simulated multi-defect interactions, demonstrating that defect clusters in structurally vulnerable zones (e.g., pump rooms) significantly altered pore pressure distribution and intensified displacement, whereas void expansion exacerbated lining uplift and asymmetric ground settlement. Stress concentrations were notably amplified at tunnel–cross passage interfaces. The Bayesian network risk model further validated the dominant roles of defect volume and burial depth in controlling structural safety. Results highlight an inverse correlation between defect severity and structural integrity. Based on these findings, a coordinated maintenance framework combining priority monitoring of high-stress interfaces with targeted grouting treatments is proposed, offering a systematic approach to multi-defect risk management that bridges theoretical models with practical engineering solutions.

1. Introduction

After being put into service, urban metro tunnels increasingly suffer from structural defects due to aging, environmental factors, and inherent structural vulnerabilities. Substantial evidence from multiple cities has revealed varying degrees of lining water leakage, voids, material deterioration, and spalling during operation [1,2,3,4,5]. Consequently, it is critical to investigate the mechanical response of metro structures under coupled multi-defect effects and evaluate their structural safety during the operational phase.
The Engineering Bureau of the Ministry of Railways in China categorizes tunnel structural defects into five types: water leakage, structural cracking, frost damage, corrosion, and component damage. The latter further subdivides into track bed failure, tunnel portal damage, and structural collapse based on affected components [6]. Asakura and Lee [7,8] statistically analyzed typical defects in Japanese railway tunnels and classified shield tunnel defects during operation into six categories: segment offset, water seepage, cracks, settlement, cross-section deformation, and concrete material deterioration. Similarly, Huang Cong et al. summarized major defect patterns in operational tunnels, including segment deformation, water leakage, cracks, voids behind linings, and material deterioration [9].
Regarding leakage, voids, and material deterioration, scholars domestically and abroad have conducted systematic research through model tests [10,11,12,13,14,15,16,17,18,19,20,21,22,23,24,25,26], numerical simulations [27,28,29,30,31,32,33,34,35,36,37,38,39,40,41], and theoretical analyses [42,43,44].
Regarding research on tunnel leakage, this study primarily investigates the leakage-induced migration patterns of water and soil in the ground under localized leakage conditions, as well as the mechanical response of tunnel structures, through methodologies including model tests and numerical simulations. Zhang et al. [10] designed a model test device to study water–sand erosion caused by tunnel lining leakage. By integrating a seepage tracer system, they analyzed the seepage field distribution around leakage points and investigated microscopic sand arching effects and flow field variations through particle flow modeling of sandy strata. Li et al. [12] developed a visualized half-scale shield tunnel model to simulate joint leakage under different hydraulic conditions, studying sand loss patterns in confined aquifers and establishing a rotational ellipsoid model to predict erosion processes during leakage. Liu et al. [13] constructed a subsea tunnel leakage simulation system to replicate full-process leakage scenarios, revealing leakage evolution laws and waterproofing failure mechanisms in cross-sea tunnels. Wu et al. [29] implemented a 3D finite element model in Abaqus by embedding 1D leakage elements, analyzing the effects of permeability coefficients and leakage locations (longitudinal/annular joints) on ground settlement and tunnel deformation.
Research on voids behind tunnel linings has also primarily been conducted through model tests and numerical simulation methods. These studies involve comprehensive analysis of stress and deformation characteristics in tunnel structures under various conditions, including voids at different locations behind the lining and with varying void dimensions. Zhang et al. [14] conducted model tests on highway tunnels with dual voids behind linings, finding that voids significantly alter lining axial force distribution and worsen structural stress states, where void enlargement reduces overall axial forces while increasing bending moments. Qin et al. [36] performed plane-strain FEM analyses considering voids at tunnel shoulders and haunches, investigating their impacts on lining and joint performance. Tian et al. [41] proposed a 3D ring-spring model to study the effects of void length and ground stiffness on tunnel longitudinal deformations.
Research on the deterioration of structural materials in tunnels during long-term service has predominantly focused on experimental investigations to characterize performance deterioration patterns of materials. However, relatively limited attention has been given to systematic studies examining variations in the overall mechanical response of tunnel structures induced by localized material deterioration. Liang et al. [21] tested concrete mechanical deterioration under sulfate–chloride solutions with varying pH values, deriving statistical formulas for compressive strength deterioration and constitutive relationships. Nie [22], Rusati et al. [23], Wang et al. [24], Cao et al. [25], and Rohman et al. [26] conducted accelerated corrosion experiments to study concrete strength deterioration under sulfate attack.
Current research on the coupled effects of multiple defects has primarily focused on intelligent recognition of multi-defects and the development of safety assessment models under multi-defect conditions. For instance, Luo et al. [45] introduced a lightweight deep learning model named MTGPR, which employs an optimized CAPW-YOLO framework and hybrid data augmentation techniques to effectively achieve automated identification and classification of multiple tunnel lining defects based on GPR data. Similarly, Li et al. [46] utilized deep learning methods to intelligently recognize and analyze diverse defects in metro shield tunnel linings, revealing the interactions among defect types and their impacts on structural safety. Additionally, Dou et al. [47] proposed a numerical simulation-based model for predicting the bearing capacity of single-ring segments in metro shield tunnels under multi-defect coupling effects, along with a health evaluation methodology. Furthermore, Fu [48] conducted an in-depth analysis of defect types and their causes in metro shield tunnel segment linings through literature review, expert evaluation, fault tree analysis, analytic hierarchy process, subjective–objective weighting, and unascertained measure theory, ultimately establishing a comprehensive safety evaluation model.
Current research predominantly focuses on the stability of the tunnel structure and surrounding rock during the construction period [49,50,51,52], and mainly studies the impact of a single defect. In practice, tunnel defects often result from coupled effects of voids, leakage, and other factors, whereas existing studies typically analyze single defect types, leading to deviations from real-world conditions. Additionally, safety assessments of cross passages—critical weak zones in shield tunnels—remain scarce. This study addresses these gaps by investigating the Anhuaqiao-Andelibei Street section of Beijing Metro Line 8. Field surveys using laser ranging and ground-penetrating radar identified defect mechanisms. Numerical simulations evaluated the coupled effects of leakage, voids, and material deterioration on the mechanical behavior and structural safety of shield tunnel cross passages. The findings provide theoretical and technical support for metro tunnel defect prevention.

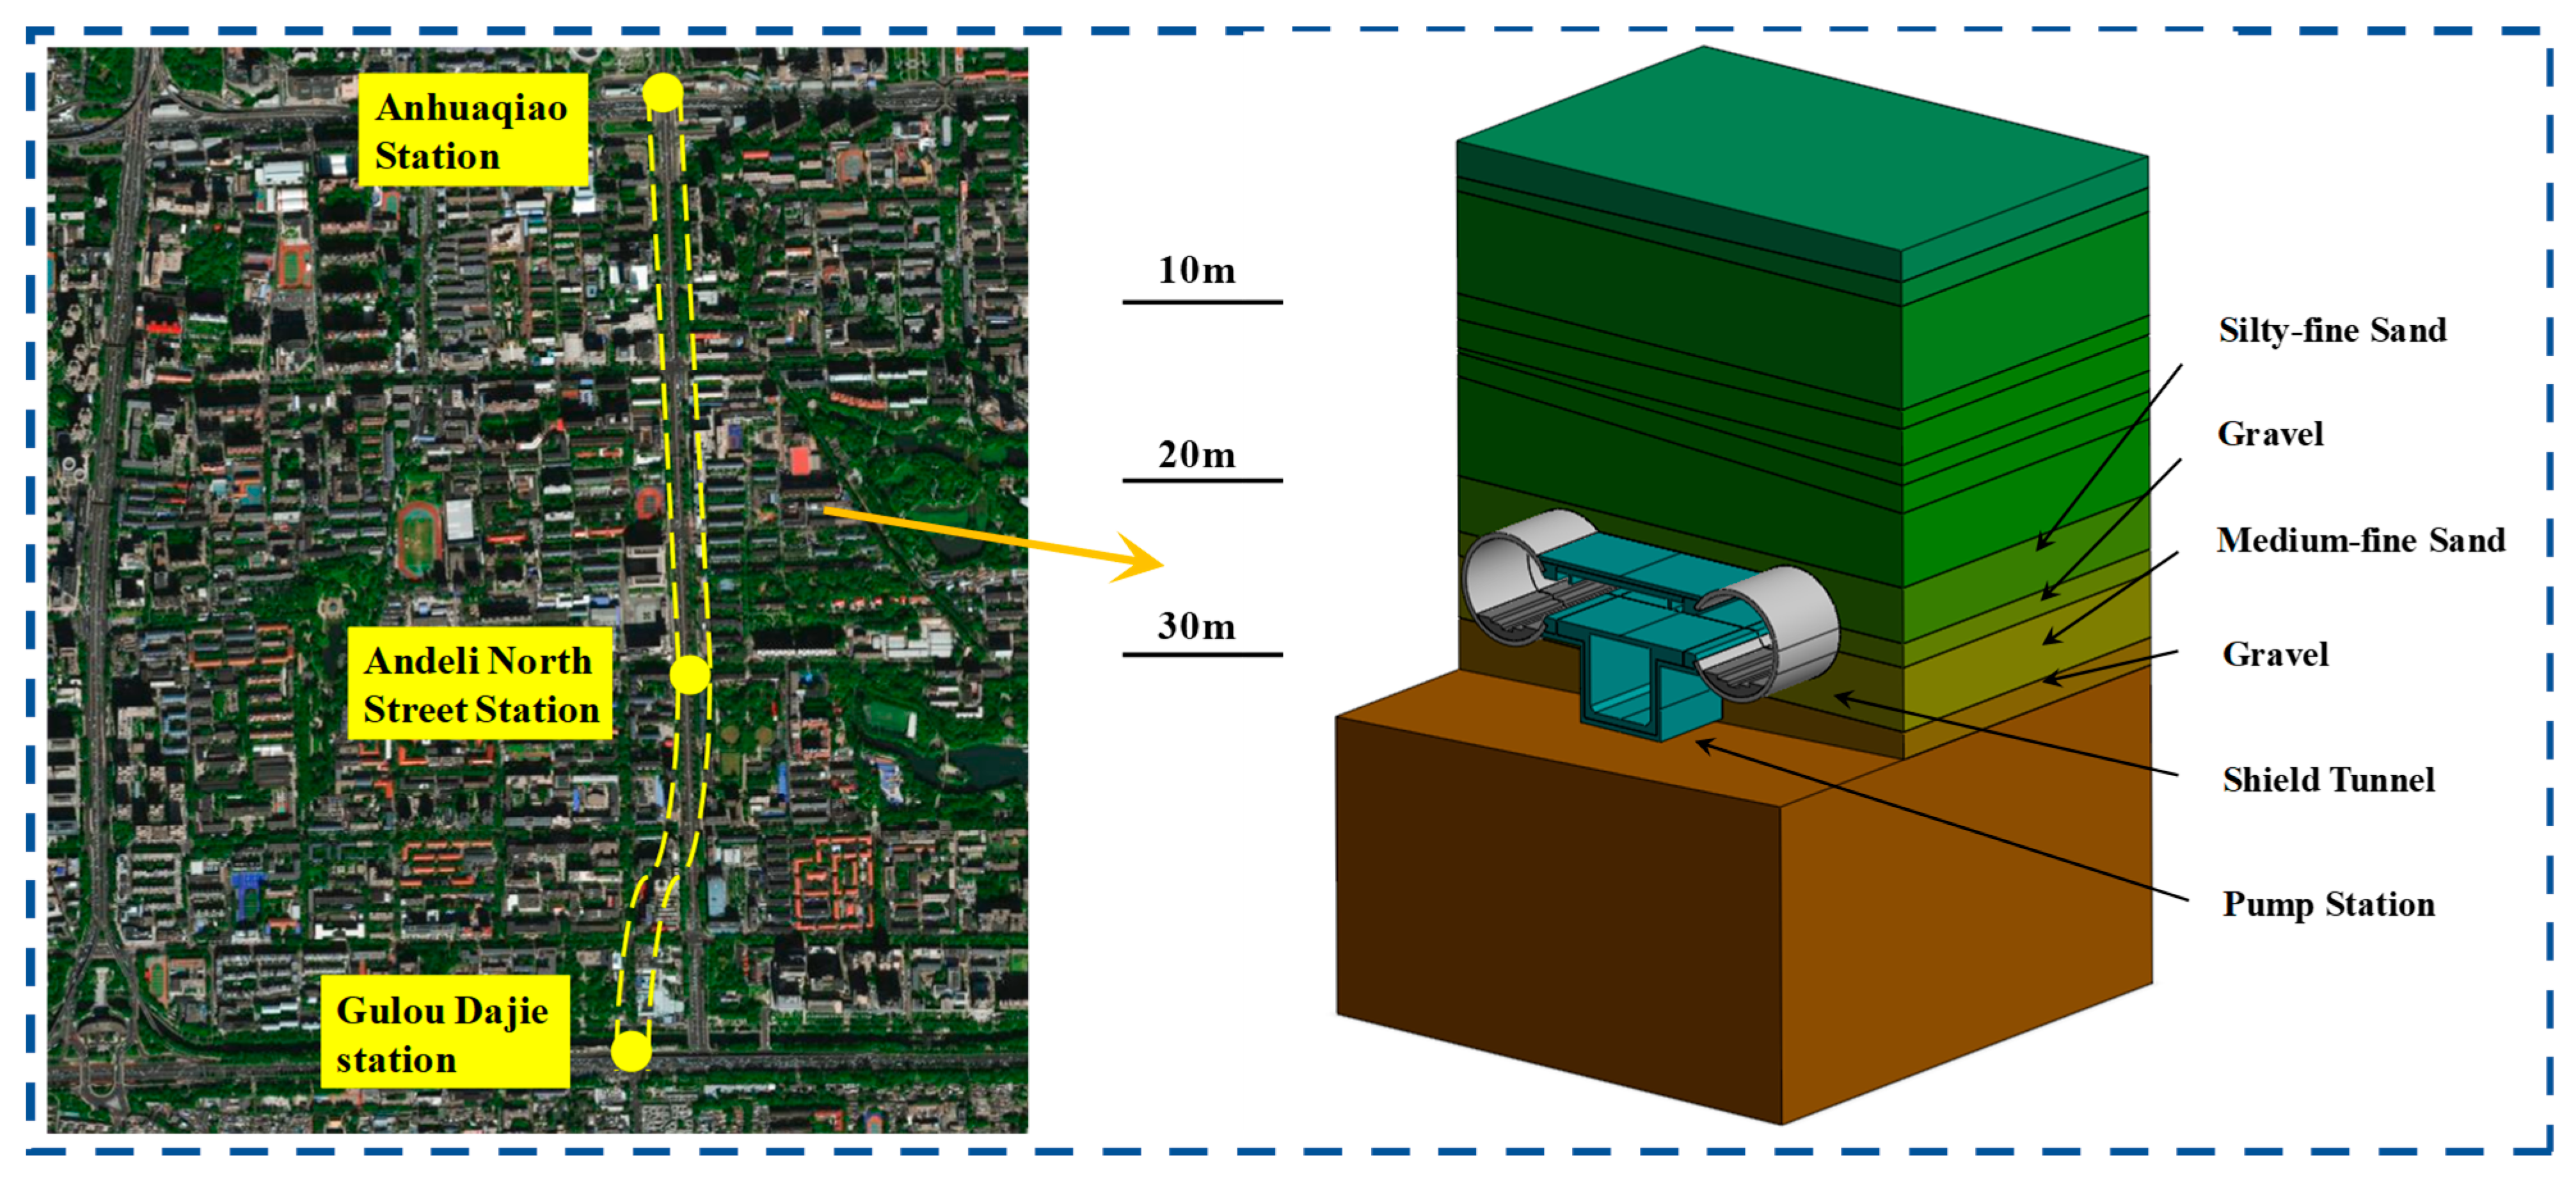
2. Engineering Background

2.1. Project Overview

The project focuses on an operational metro shield tunnel in Beijing, as shown in Figure 1. According to the Chinese rock classification standard, the surrounding rock of the tunnel is classified as Class VI, primarily composed of sandy gravel soil. The rock mass exhibits loose structure and extremely poor self-stabilization capacity, prone to ground settlement and tunnel deformation. The high permeability of sandy gravel soil, combined with frequent groundwater activity, exacerbates leakage risks and structural deterioration. The main structure of the tunnel adopts a flat single-layer precast reinforced concrete segment lining with an external diameter of 6 m, internal diameter of 5.4 m, width of 1.2 m, and thickness of 0.3 m. The segment concrete has a strength grade of C50. A cross passage serving as a pump station is constructed using the mining method in the tunnel section, featuring a composite lining structure. Concrete cutting technology is employed to create sidewall openings at the intersection between the main shield tunnel and the cross passage. Deformation joints are installed at both ends between the main tunnel and the cross passage. The initial support utilizes C25 shotcrete, while the secondary lining employs C40 concrete. A DN200 ductile cast iron pipe connects the pump room to the sump pit of the shield tunnel.

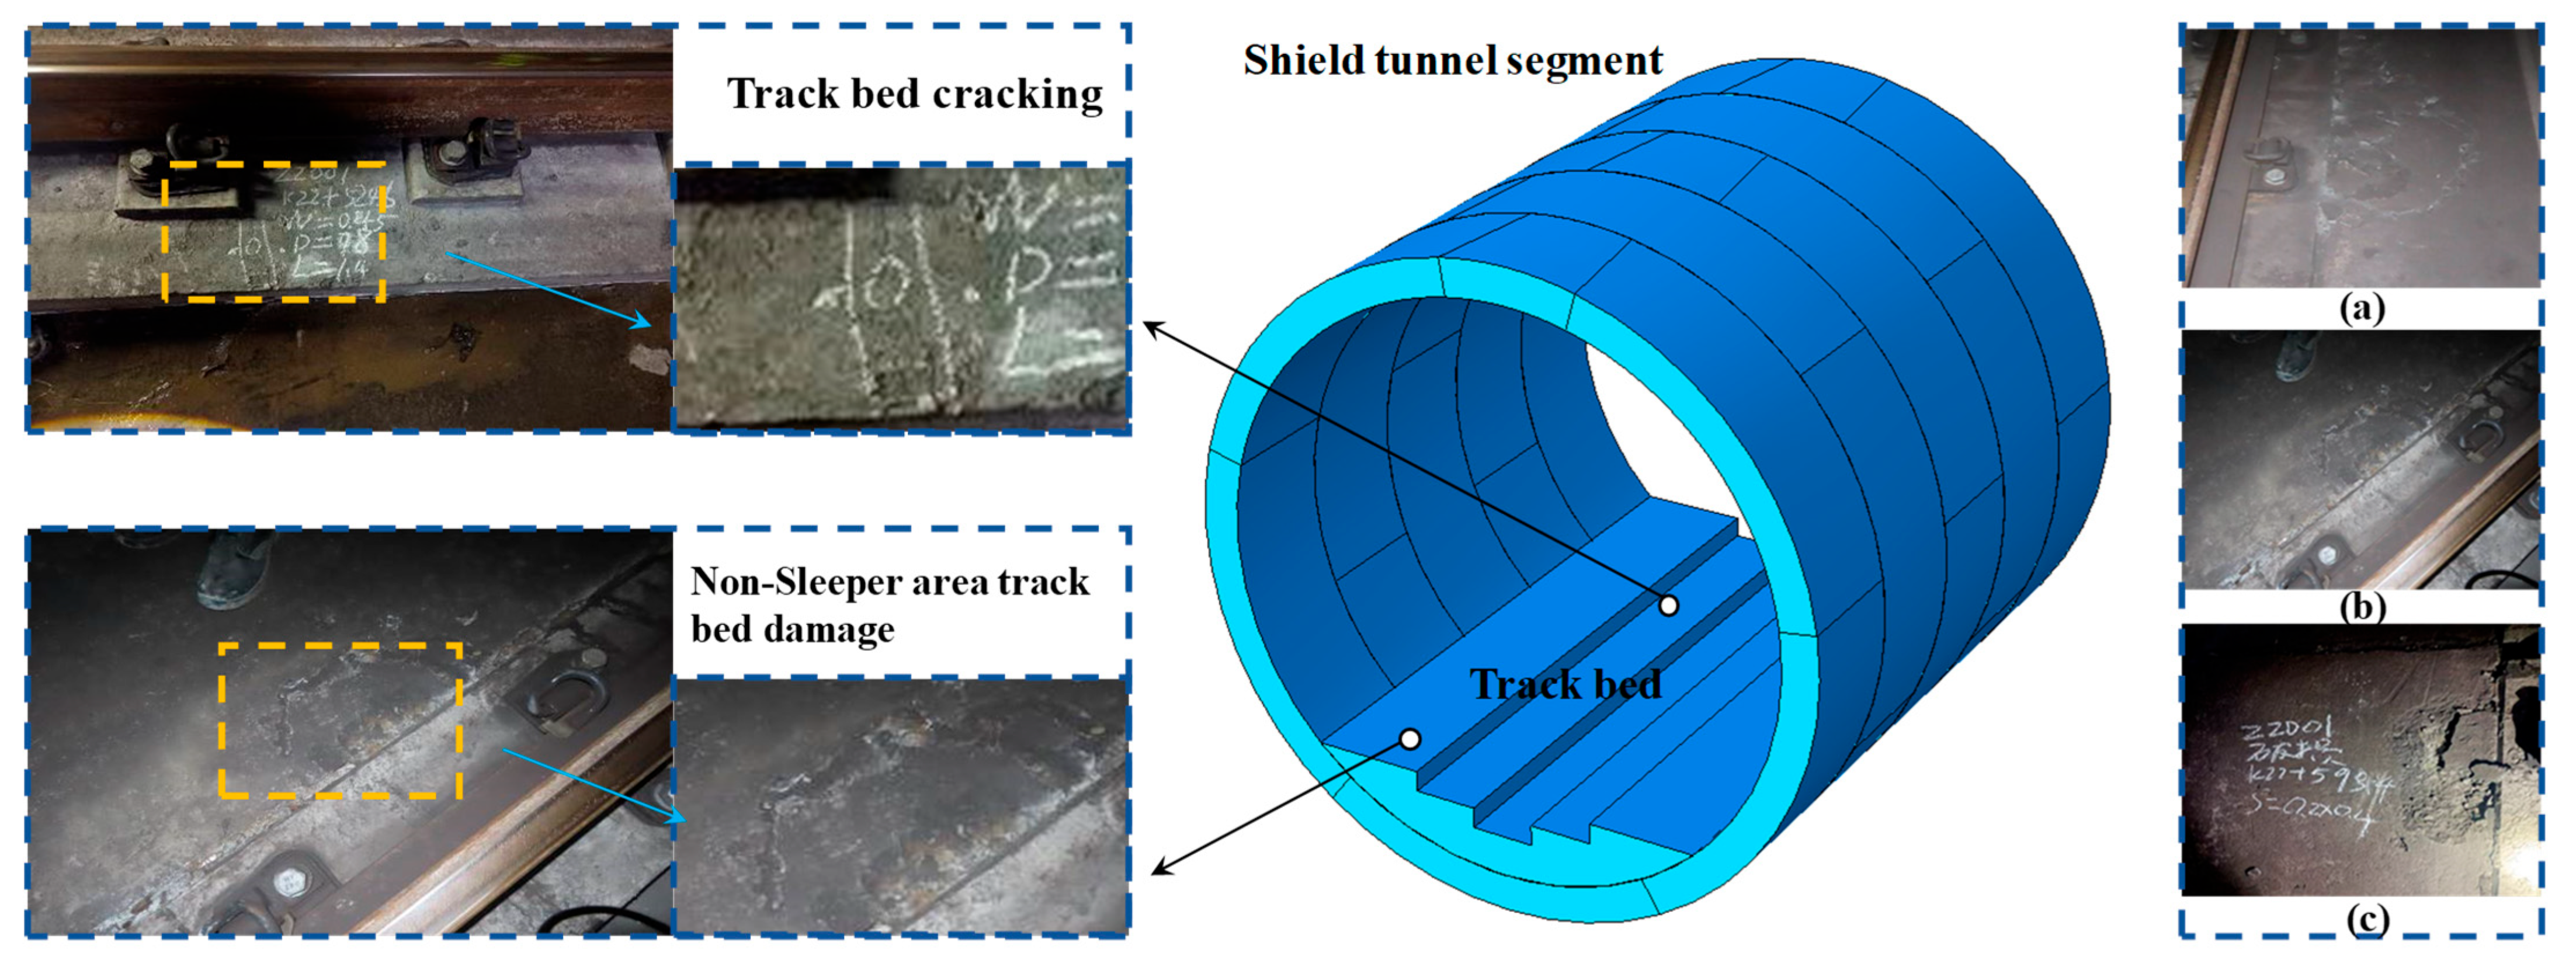
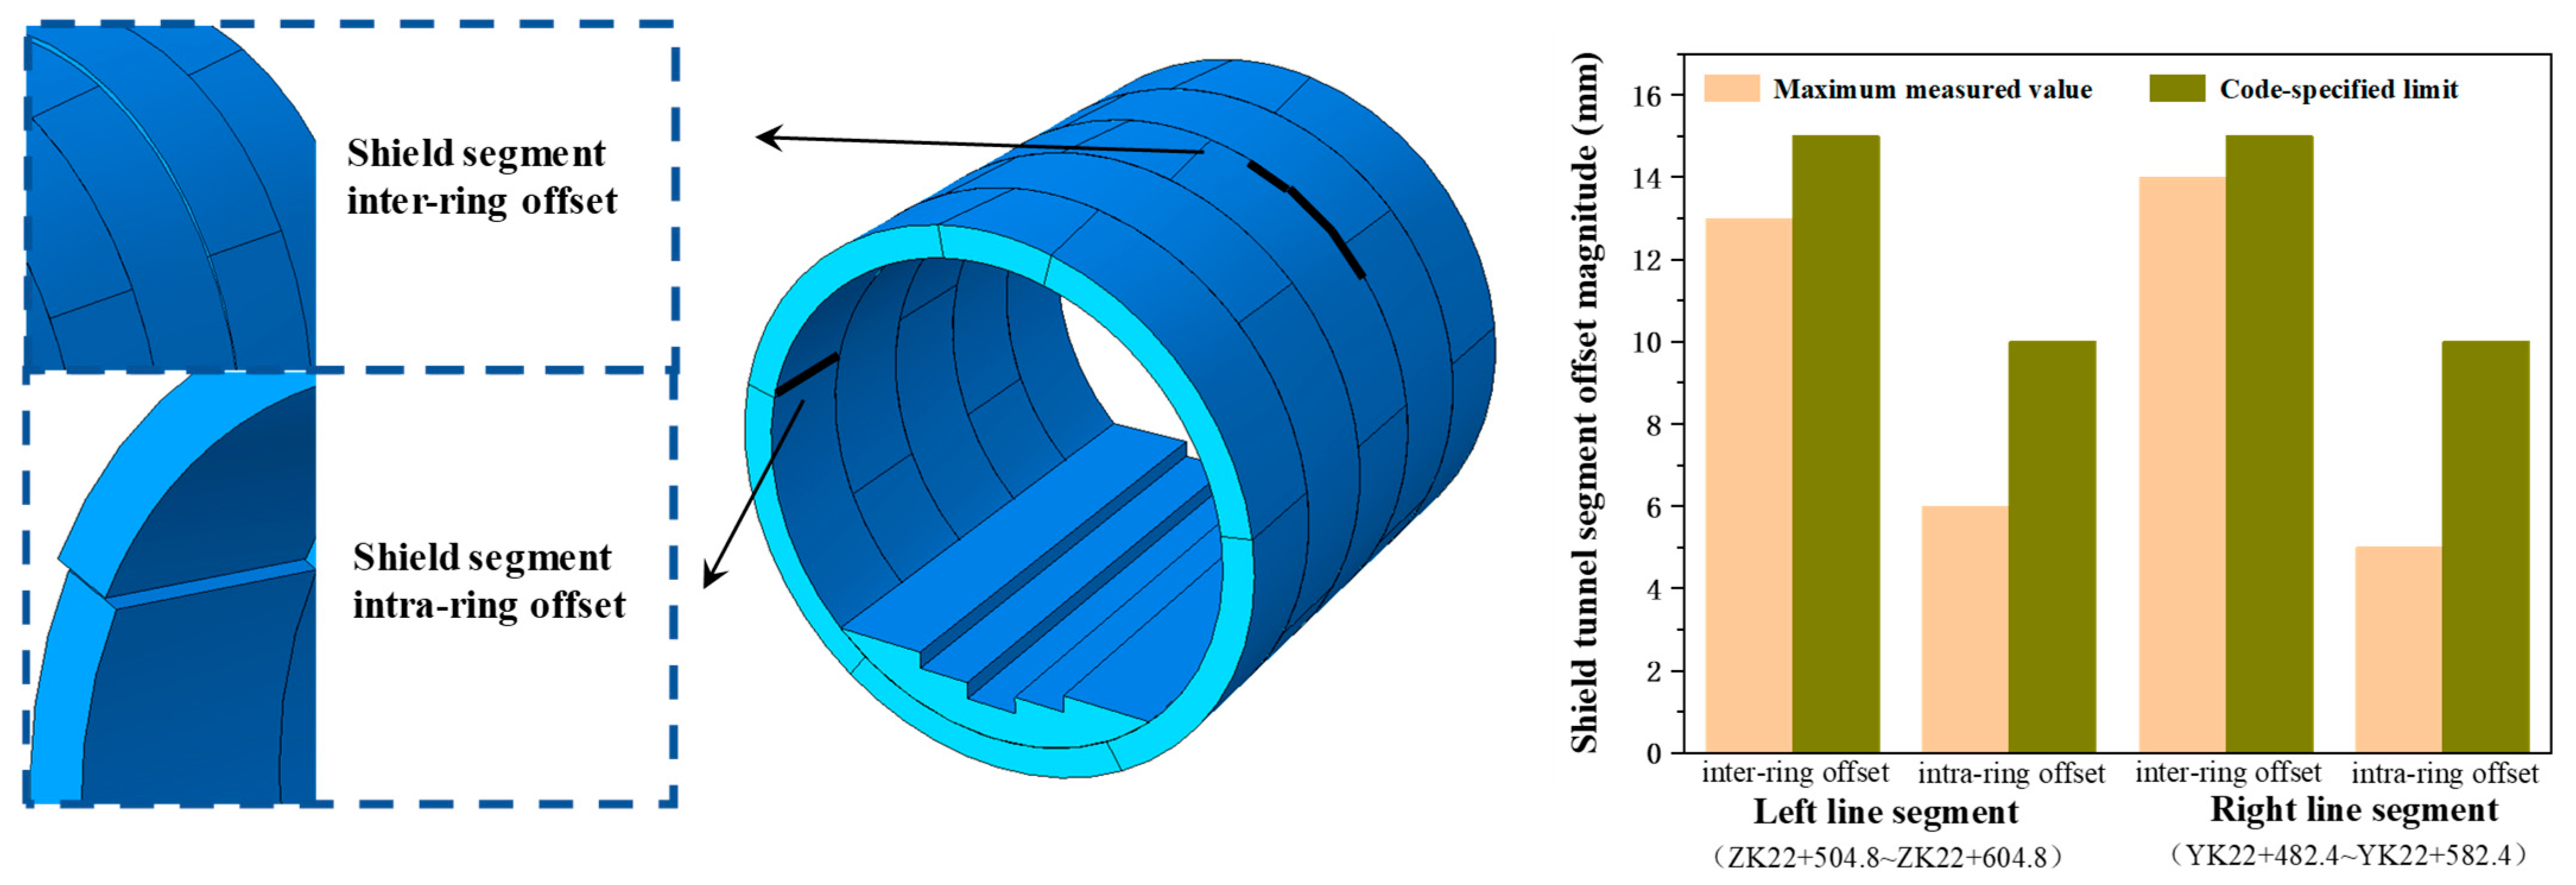
2.2. Engineering Pathologies and Defect Manifestations

The water inflow in the pump room at the connecting passage between Anhua Bridge and Andeli North Street (Left Line Center Mileage ZK22+554.8/Right Line Center Mileage YK22+532.4) has abnormally increased with fine sand mixture. This has resulted in water accumulation within a certain range of the central drainage ditch in adjacent tunnels. The primary hazards in this section include leakage caused by missing drainage pipes in the pump room of the mid-section connecting passage, localized leakage and voiding in the lower foundation concrete structure of the track bed, as well as tunnel deformation, as shown in Figure 2, The blue-bordered areas contain magnified views of defects, with red circles pinpointing defect locations. These conditions pose a serious threat to train operation safety.
(1)
Structural cracking conditions
We conducted visual inspection of surface cracks, laser distance meter positioning, tape measurement of lengths, crack width gauge measurement of widths, and ultrasonic single-side flat measurement (crack depth tester) at maximum-width locations. The inspection revealed that the shield tunnel structure and concrete surfaces of the connecting passage within the section are in good condition, with no apparent concrete spalling or fragmentation. The results are graphically displayed in Figure 3. Blue-bordered areas delineate details of defects, orange frames pinpoint defect coordinates, and blue arrows activate magnified views of corresponding loci. Among them, the left picture shows different types of defects, while the Figure 3a–c illustrate the specific defect conditions of this project. There are two instances of concrete damage in the non-sleeper area of the right-line track bed, as shown in Figure 3a,b, while one instance of concrete damage is present in the non-sleeper area of the left-line track bed, as illustrated in Figure 3c. A total of 16 transverse cracks were detected in the track bed of the Anhua Bridge to Andeli North Street (An-An) section: 15 cracks in the left-line track bed with widths ranging from 0.31 to 1.40 mm, with the widest crack located at ZK22+547.0; and 2 cracks in the right-line track bed with widths between 1.07 and 1.37 mm, with the maximum-width crack positioned at YK22+524.4.
(2)
Segment offset conditions
For the inspection of the offset between and within rings in the shield tunnel segments of the cross-passage section, random sampling was conducted using a straightedge to measure the offset values. Within the inspection scope, the maximum inter-ring offset of the left-line segments was 13 mm, while the maximum intra-ring offset measured 6 mm. For the right-line segments, the maximum inter-ring offset reached 14 mm, and the maximum intra-ring offset was 5 mm. Both inter-ring and intra-ring offsets complied with the allowable deviation requirements specified in the code. The inspection results are as shown in Figure 4. Black contour lines on the shield tunneling model indicate segment offset defects, with directional arrows directing attention to specific defect classifications within blue-bordered analytical zones.
(3)
Tunnel deformation conditions
The tunnel deformation condition was determined by using the steel tape distance measurement method to locate track center points at each cross-section. Total stations were set up at these track center points, with the track centerline as the baseline. Three-dimensional coordinate data of measurement points were collected through the polar coordinate method. MATLAB R2019a was employed to fit elliptical parameters using the acquired data, thereby calculating tunnel ellipticity. Analysis of cross-sectional data revealed that the ellipticity of the right-line tunnel within the inspection scope ranged from 0.9‰ to 9.9‰. Specifically, cross-sections Y+5 (K22+545.250), Y+4 (K22+542.250), Y+3 (K22+539.250), Y+2 (K22+536.250), Y+1 (K22+533.250), and Y-7 (K22+507.550) failed to meet the 6‰ allowable deviation requirement specified in the Code for Construction and Acceptance of Shield Tunnel Engineering (GB50446-2017) [53]. Further measurements of the initial structural clearance convergence values were conducted. Convergence measurement points were installed on tunnel segments by first brushing off surface dust, applying adhesive, and pressing measurement markers onto the segments to expose the adhesive. Observations were performed using a Leica TM50 total station with free stationing. Analysis of cross-sectional data showed that the left-line tunnel structural clearance convergence values within the inspection scope ranged from 5.3850 m to 5.4146 m, while the right-line values ranged from 5.4110 m to 5.4334 m. The tunnel deformation condition is illustrated in Figure 5.
(4)
Cavity conditions behind the lining
As a new technology in non-destructive testing, ground-penetrating radar (GPR) offers advantages of continuity, non-destructiveness, high efficiency, and high precision. Based on the propagation characteristics of electromagnetic waves in lossy media, GPR transmits high-frequency electromagnetic waves in the form of wideband short pulses into the medium. When encountering heterogeneous bodies, partial electromagnetic waves are reflected, with the reflection coefficient determined by the relative dielectric constant of the medium. By processing and interpreting the reflected signals received by the radar mainframe, the identification of hidden targets can be achieved. To investigate whether cavities or loose bodies exist behind the lining, this study employed the SIR-4000 ground-penetrating radar system to detect water-rich cavities in strata, conducting two-dimensional radar detection with the horizontal detection range covering the area traversed by the antenna centerline. The detection results are shown. Through processing of radar data and image analysis (as shown in Figure 6. The red circles represent the areas of loose bodies and water-rich zones.), a total of six loose bodies and five water-rich zones were identified within the detection range.
The statistical data of structural defects identified through monitoring are presented in Table 1.

3. Characteristics and Intrinsic Causes of Engineering Defects

(1)
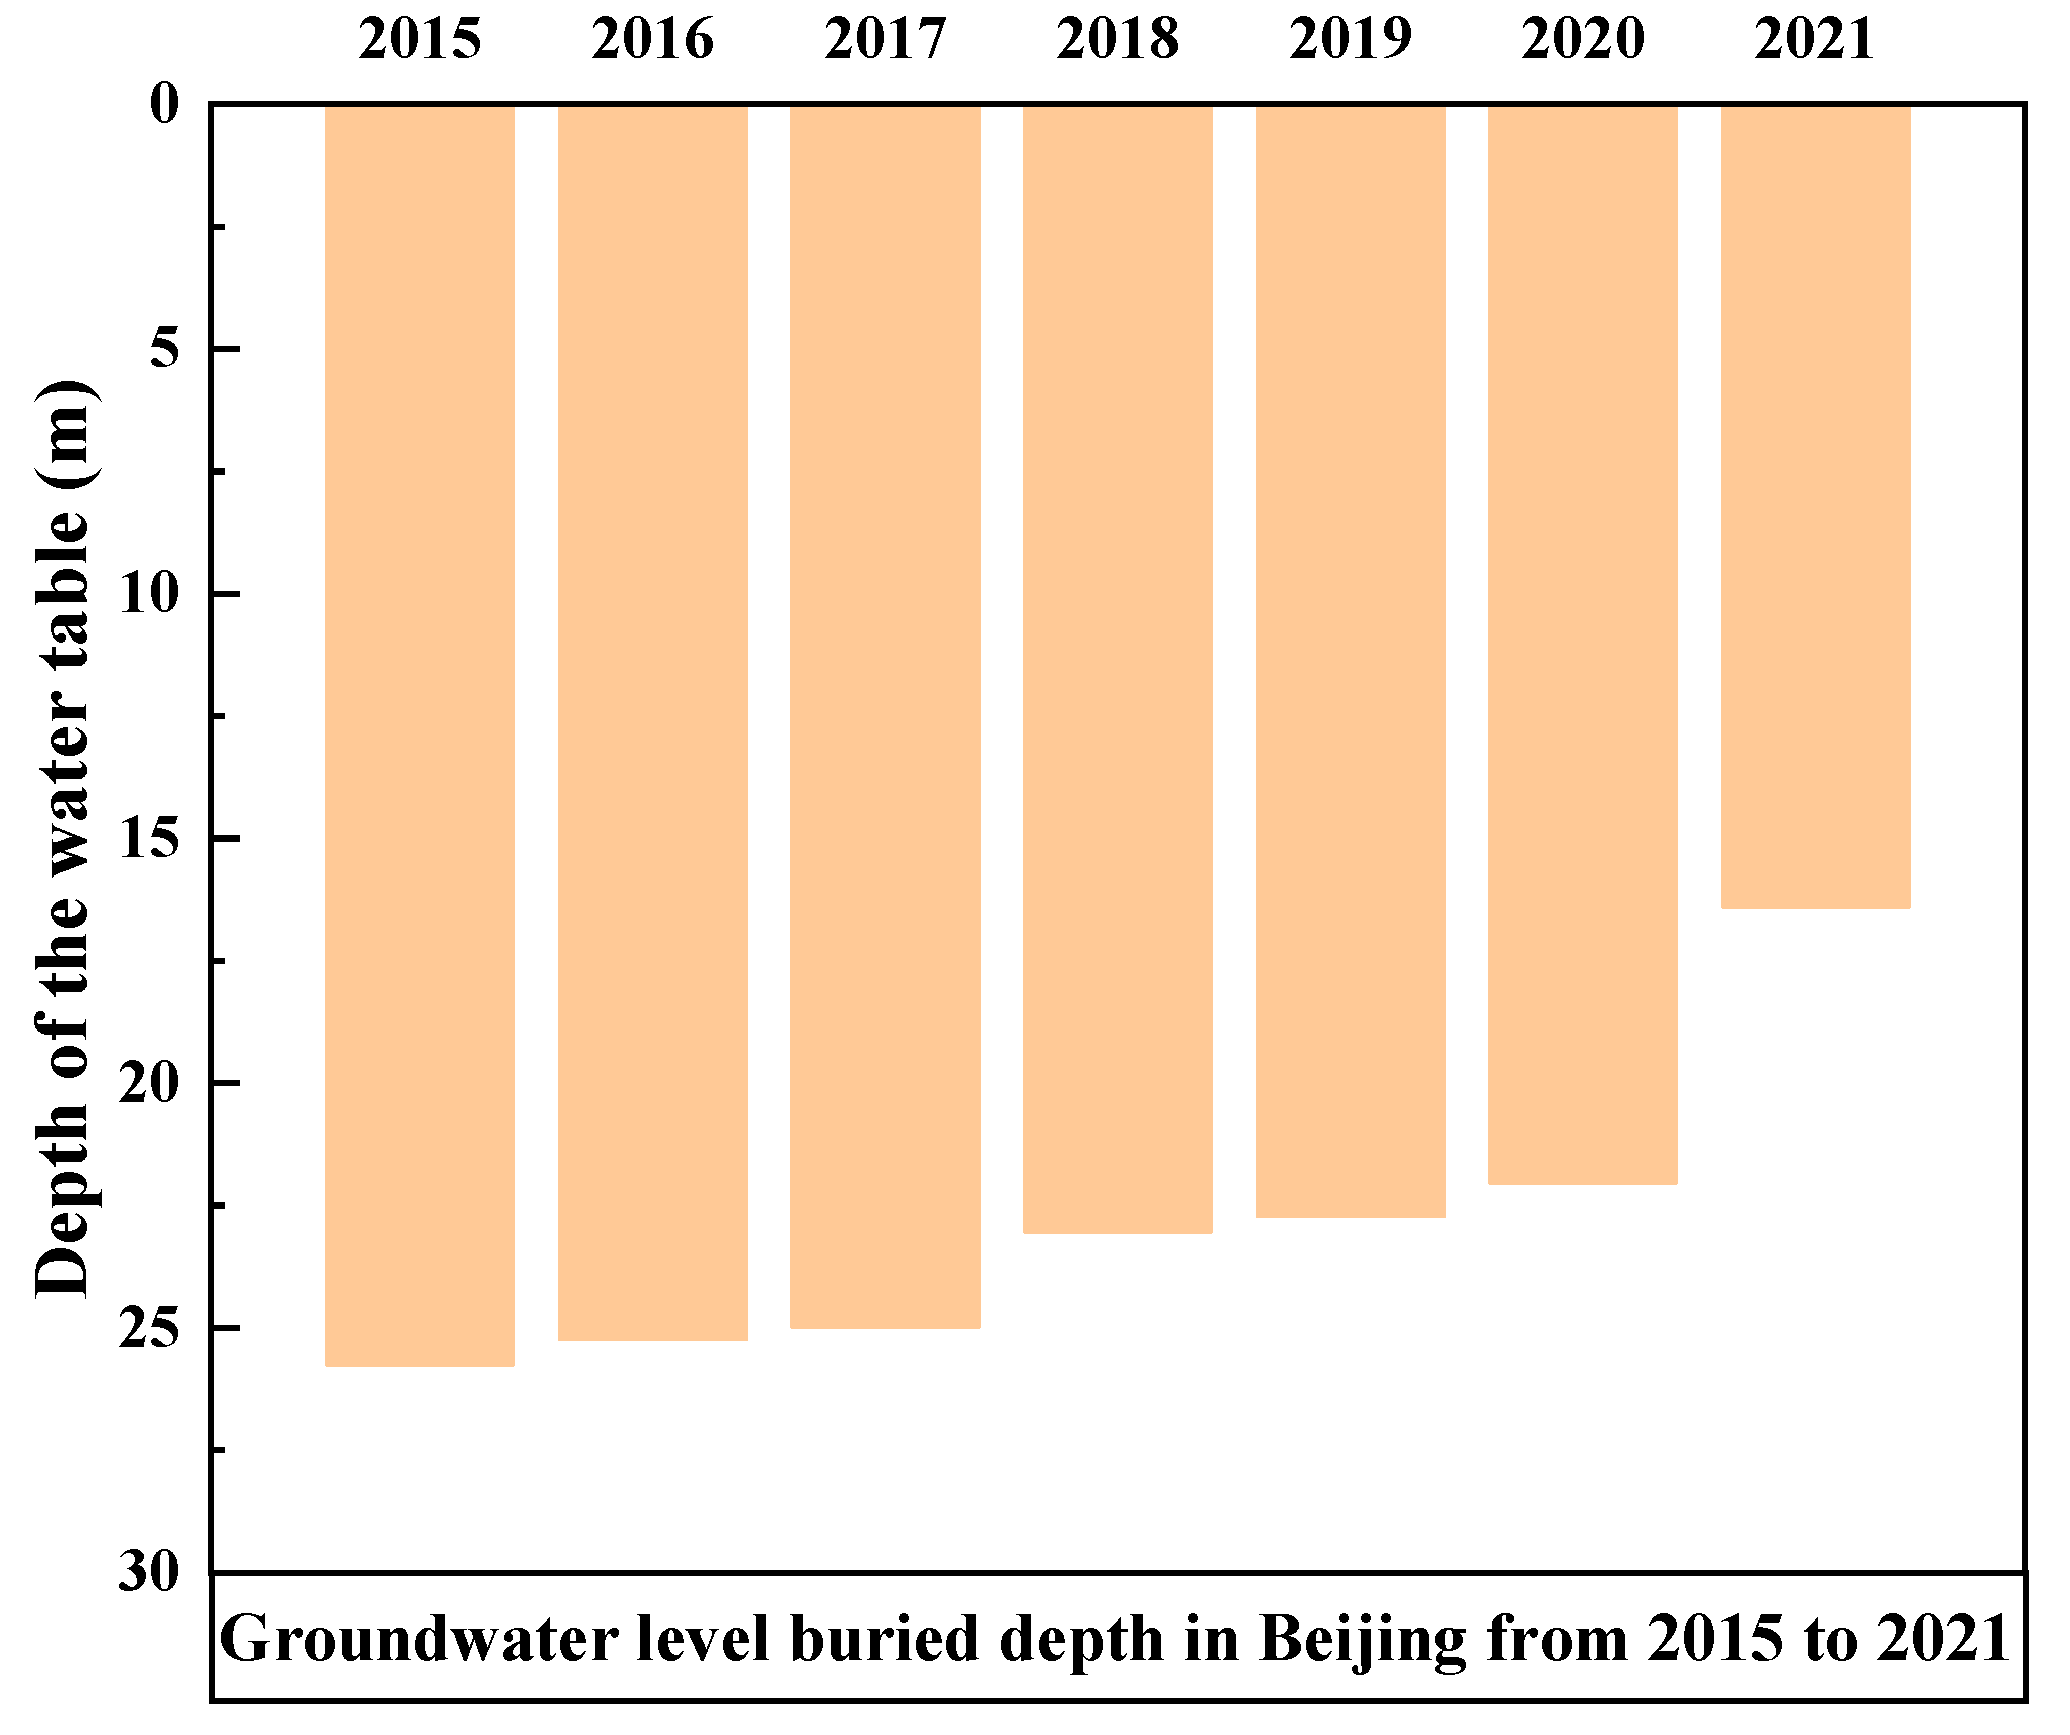
Environmental exposure factors
In recent years, due to the trans-regional water resource allocation of the South-to-North Water Diversion Project and climate change impacts, Beijing’s surface runoff and subsurface runoff have been significantly replenished, resulting in a substantial rise in groundwater levels. According to statistics from the Beijing Water Authority, as shown in Figure 7, as of 28 December 2021, Beijing’s groundwater levels have experienced six consecutive years of recovery, with an average recovery of 9.36 m compared to the same period in 2015. Notably, 2021 witnessed a noticeable acceleration in the rate of water level rise, with the average groundwater burial depth reaching 16.39 m—the highest in two decades. This elevation of groundwater levels has altered the vertical positional relationship between groundwater and urban infrastructure, adversely impacting the safety, serviceability, and durability of Beijing’s metro systems, particularly existing operational lines, by altering structural stress conditions. Concurrently, prolonged submergence of certain structural components below the groundwater level has compromised the durability of concrete structures, leading to pathologies including concrete deterioration and structural leakage.
(2)
Structural intrinsic factors
The combined effects of stratigraphic differential settlement and train-induced vibrations have directly or indirectly triggered cross-sectional deformation and longitudinal differential settlement in tunnels, leading to joint opening, offset, or structural damage, which further exacerbates the development of tunnel pathologies. As shown in Figure 8. The junctions between shield tunnels and cross passages exhibit structurally complex configurations with components of varying stiffness values. Under the persistent influence of metro train vibratory loads and long-term water-rich cavities behind segment linings, these structures are particularly vulnerable to differential deformation. Such deformation induces progressive junction expansion, waterproofing layer failure, and ultimately precipitates more severe structural pathologies through coupled mechanical–hydraulic interactions.
It should be noted that in complex geological environments, with the increase in operational time, material performance deterioration (such as reduced segment bearing capacity and failure of waterproof sealing gaskets) leads to segment defects. In this paper’s tunnel and connecting passage structures, two DN200 ductile iron pipes each are adopted to connect the pump room with the sump pits of the left and right shield tunnels. The ductile iron pipes are laid in the stratum beneath the connecting passage, precisely located within the medium-fine sand layer below the groundwater level. With prolonged operational duration, the material performance deterioration and deterioration of these drainage pipes have caused leakage, allowing groundwater carrying fine sand to enter the pump room through pipe gaps, resulting in water and sand gushing phenomena as illustrated in Figure 9.
To prevent further development of structural defects, immediate remediation was implemented after leakage issues emerged in the pump room of the Anhuaqiao-Andeli North Street section of Beijing Metro Line 8. As shown in Figure 10, a φ108 seamless steel pipe was inserted through grouting holes drilled in the pump room sidewall. Grouting into the stratum near the sidewall aimed to reinforce loose or void-filled ground, thereby mitigating drainage pipe leakage and alleviating water and sand gushing phenomena. Due to the high flow rate in the discharge pipe, which remained unclosed, grout rapidly flowed out through the pipe, accompanied by track bed water backflow. To address this, chemical grouting was first applied for water sealing, followed by backfill grouting in the stratum to ensure comprehensive stabilization.
The embedded pipe grouting method involves pre-installing grouting pipes at leakage points to inject grout into voids, forming a waterproof barrier. The process begins with site investigation to determine pipe layout and surface preparation, followed by precise pipe fixation near cracks. Grout mixtures are then proportioned and injected under controlled pressure to ensure uniform channel filling. Post-injection, pipes are sealed, cured for solidification, and trimmed. Final quality verification includes leakage tests and integrity checks. Critical controls include accurate pipe positioning, optimized injection parameters (pressure/flow rate), and grout curing management to achieve complete defect sealing.

4. Structural Mechanical Response of Tunnel and Connecting Passage Under Coupled Effects of Multiple Defects

To analyze the mechanical response of metro structures under coupled multi-defect interactions during operational phases and investigate the failure mechanisms in tunnel sections and cross passages, a systematic statistical analysis has been conducted on defect distribution and causative factors, revealing that the primary risks in tunnel sections stem from leakage caused by missing sump drainage pipes at cross passage pump rooms in mid-sections, along with localized seepage and voids in the subgrade concrete foundations beneath track beds. Structural cracking predominantly manifests at track bed locations with no observed cracking in shield segments, while detected cracks exhibit minor dimensions exerting negligible impacts on structural mechanical performance. Similarly, structural misalignments and deformations remain within code-specified tolerance limits and are excluded from analytical scope. Material deterioration of shield segments during long-term operation has been incorporated into the analysis due to its potential to exacerbate structural defects. This study employs a comprehensive numerical modeling approach considering coupled effects of structural leakage, voids behind linings, and localized material deterioration to elucidate defect propagation mechanisms and characterize damage severity under varying operational scenarios, supplemented by a comparative analysis between field monitoring data and numerical simulation results to validate computational model reliability.

4.1. Numerical Model

4.1.1. Model and Material Parameters

This study employs FLAC3D finite difference software to establish the numerical simulation model, where tunnel linings and cross passage concrete structures are simulated using linear elastic models with isotropic material properties, while the surrounding soil is modeled via the Mohr–Coulomb constitutive relationship. The computational domain features an average tunnel burial depth of 19.54 m, segment thickness of 300 mm, and external diameter of 6.0 m, with model dimensions spanning 68 m laterally (X-axis), 42 m vertically (Z-axis), and 4 m longitudinally (Y-axis). The shield tunnel segments utilize C40-grade concrete, whereas cross passages employ C50-grade concrete. The mechanical parameters of soil and structure are presented in Table 2. Groundwater conditions are initialized through pore water pressure fields calibrated to actual hydraulic heads. The shield tunnels and connecting passages are primarily situated within medium-fine sand layers. Based on engineering design documentation and relevant standards [54], the permeability coefficient of the medium sand layer is adopted as 1 × 10⁻⁴ m/s in numerical simulations following soil layer homogenization. To ensure computational accuracy, localized mesh refinement is implemented around tunnel geometries, resulting in a 3D numerical model containing 16,248 discrete elements as illustrated in Figure 11. The purple areas represent soil mass, green elements indicate cross passages and pump houses, red components denote shield tunnels. Semi-circular markers along tunnels and connecting corridors signify void defects.
The segment lining structures of shield tunnels are interconnected through bolted joints, where the localized stiffness reduction at connection interfaces leads to diminished global structural rigidity that fails to meet the design stiffness of precast concrete segments; therefore, this study develops a three-dimensional tunnel model based on a homogeneous cylindrical configuration by incorporating bolt-connection effects, which maintains structural continuity while applying stiffness reduction at joint locations to achieve equivalent global rigidity with actual engineering conditions. Due to distinct mechanical behaviors in transverse and longitudinal directions, differential stiffness reduction coefficients are implemented for circumferential and axial rigidity components, respectively.
Transverse effective rigidity ratio of the tunnel: Zhong et al. [55] demonstrated that the transverse effective rigidity ratio ranges between 0.4 and 0.8, while Huang et al. [56] derived a value of approximately 0.7 through model tests. Specifically, the ratio is 0.67 for non-staggered segment assembly and 0.75 for staggered assembly. To balance engineering safety and cost-effectiveness, 0.7 is adopted as an empirical compromise, aligning with the requirements of the modified conventional design method. Therefore, this study adopts a transverse effective rigidity ratio of 0.7.
The longitudinal stiffness efficiency ratio: Its value depends on multiple factors including the transverse stiffness efficiency ratio, segment ring width, and number of bolts at circumferential joints. With the transverse stiffness efficiency ratio being set at 0.7 in this study and combined with field investigation parameters of Beijing Metro operational tunnel structures, the longitudinal stiffness efficiency ratio is determined as 0.1 in the numerical model based on the research findings by Zhong [55].

4.1.2. Boundary Conditions

The boundary conditions of the numerical model were configured as follows: the model top was set as a free boundary, the bottom with vertical displacement constrained to zero, and horizontal displacements fixed at zero for the left/right and front/back sides. Hydraulic boundaries included a free water surface at the top, an impermeable boundary at the bottom, and fixed pore pressure boundaries on the left/right and front/back sides. For simulating leakage scenarios, permeable boundaries were assigned to leakage locations of the tunnel, with flow rate control implemented to simulate varying leakage intensities.

4.1.3. Numerical Calculation Process

The numerical simulation process was conducted as follows: Firstly, initial geostatic stress equilibrium was achieved using FLAC3D’s built-in fluid–solid coupling mode to compute the initial stress field and pore pressure field under gravitational forces and specified boundary conditions. Subsequently, tunnel excavation was simulated by applying the null model in FLAC3D with a stress release rate set to 20%—a value within the commonly adopted 10%~30% range in geotechnical simulations. This parameter incrementally releases surrounding rock stresses to simulate the progressive disturbance effects of phased excavation in real-world construction. The approach avoids numerical instability caused by instantaneous unloading and better reflects the interaction between support structures and surrounding rock [57]. Shield tunnel segments and connecting passage structures were then generated. Finally, defect simulations were performed by defining defect zones to control void sizes, leakage rates, and lining deterioration levels, enabling multi-scenario defect modeling in targeted regions. Structural mechanical responses were monitored throughout the process.

4.2. Calculation Cases

To further investigate the coupled effects of multiple defects on tunnel sections and connecting passages, numerical simulation conditions were designed to account for the simultaneous occurrence of multiple defects at varying structural locations, with defect position alterations implemented for scenario modeling. Specific numerical calculation conditions are detailed in Table 3, and corresponding defect locations are illustrated in Figure 12. The red circles pinpoint defect locations.
Based on field investigations and relevant code standards [58,59], water seepage pathologies are simulated at four intensity levels: damp infiltration (0.1 m3/d), dripping leakage (0.5 m3/d), linear flow (1 m3/d), and water gushing (5 m3/d). The three-dimensional geometric characteristics of lining-back voids are defined by length, width, and depth dimensions. Liu [60] demonstrated that cavity geometry exerts negligible influence on the magnitude and distribution patterns of surrounding rock pressure, thereby justifying the exclusion of cavity shape effects in computational modeling. Concurrently, according to research by Liu et al. [61], typical void widths behind tunnel linings predominantly measure 1.5 m with depths averaging 0.25 cm. Consequently, this study parametrizes void widths as 1 m, 1.5 m, and 2 m, with a uniform depth of 0.3 cm, as schematically illustrated in Figure 13. The localized deterioration of tunnel structures is simulated through elastic modulus reduction in material properties, with the deterioration zones confined to the structural regions corresponding to void-affected areas. Here, a deterioration degree of 80% corresponds to reducing the elastic modulus to 80% of its initial value, while 60% corresponds to 60% retention. These reduction ratios are defined based on empirical thresholds established in prior studies [21,22].

4.3. Analysis of Numerical Calculation Results

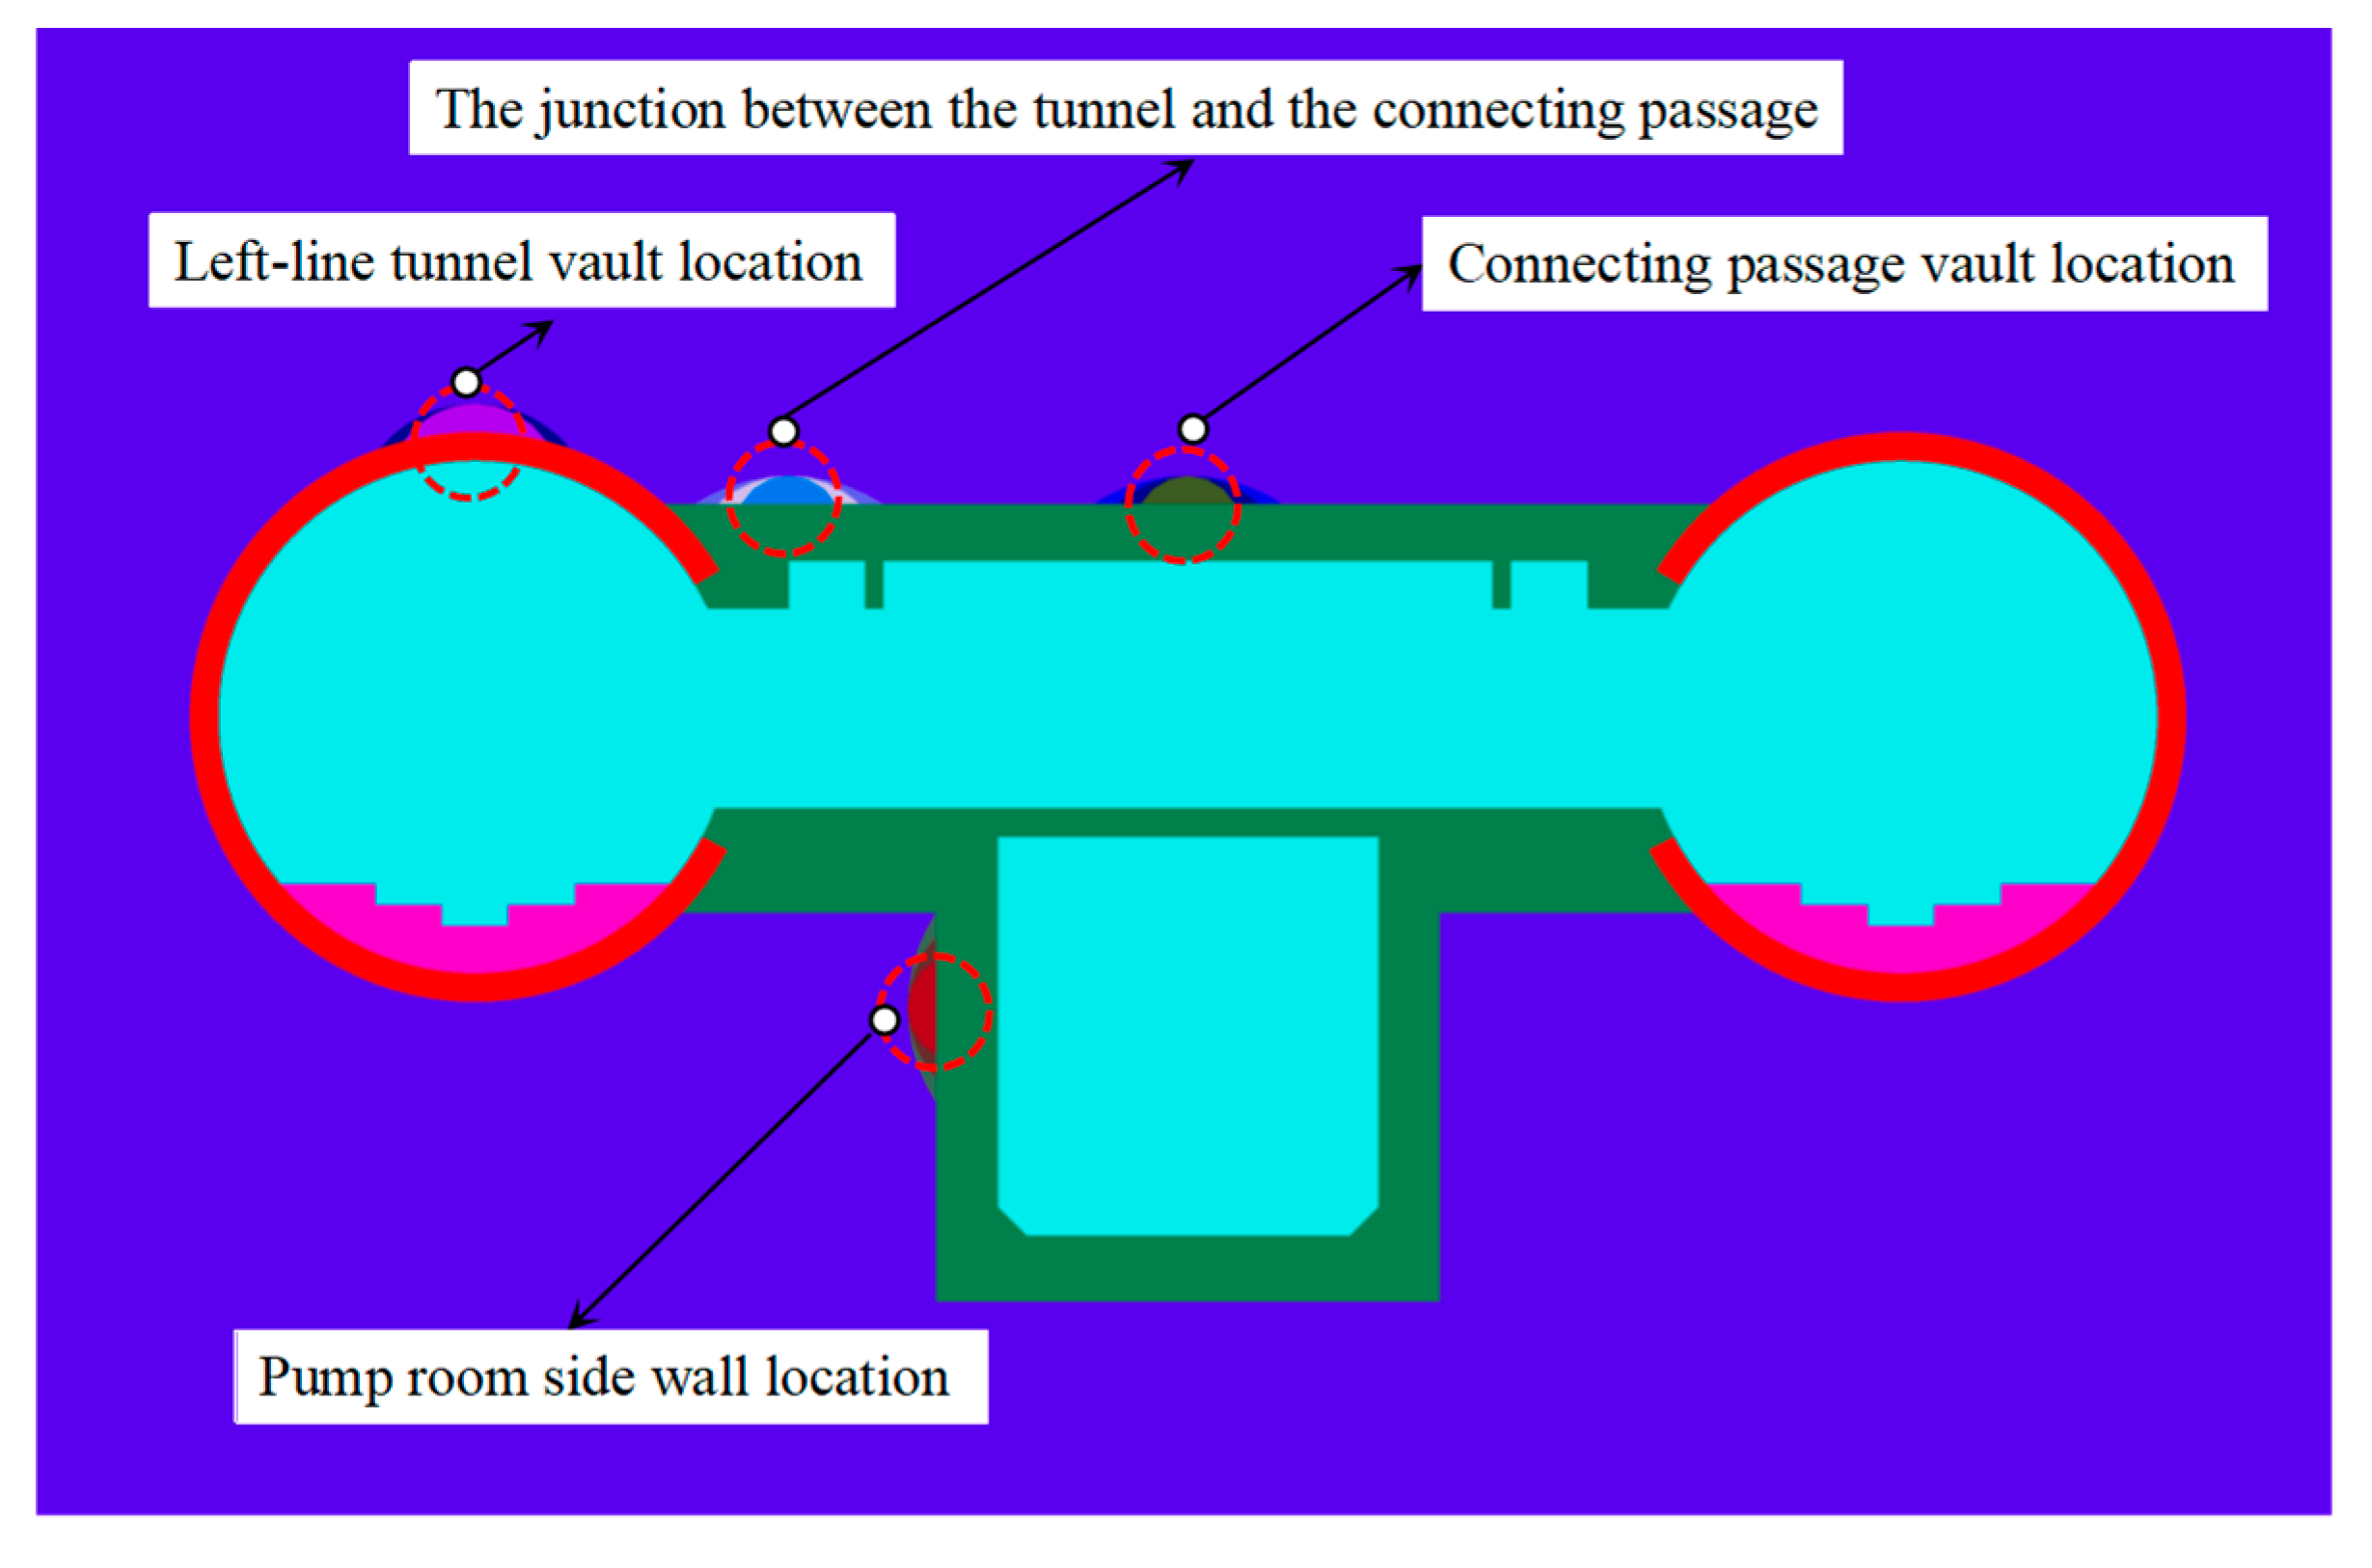
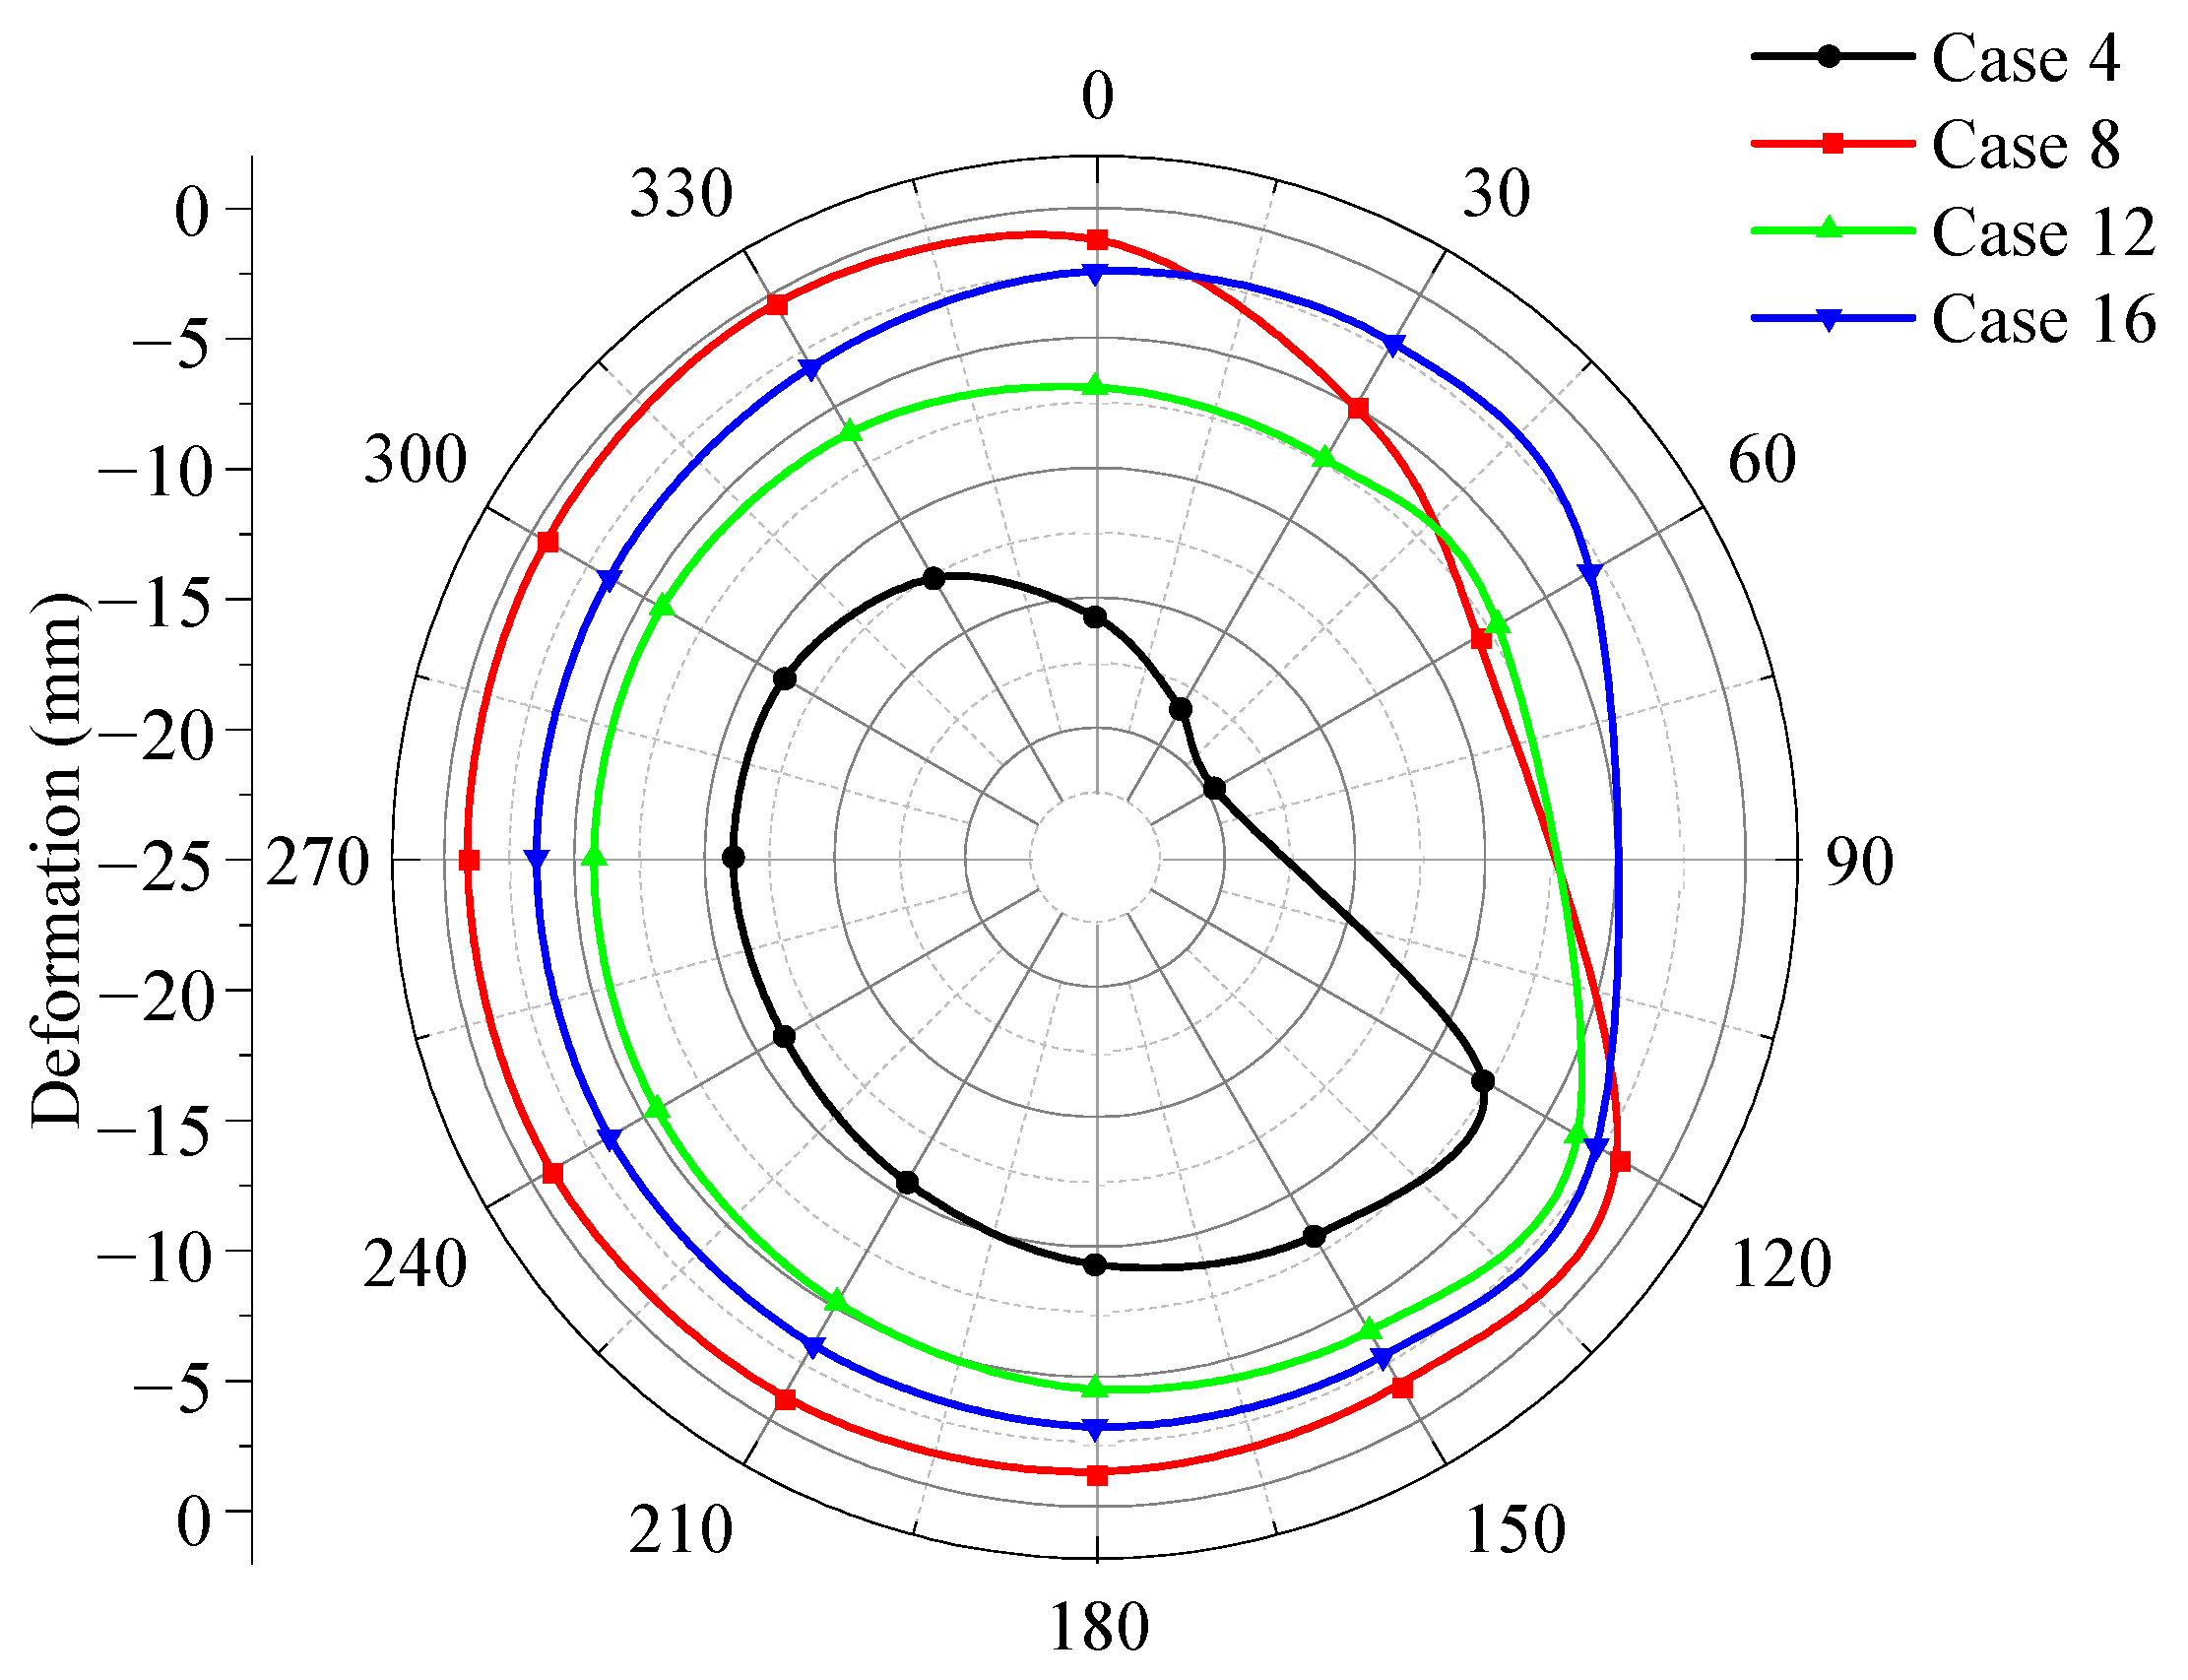
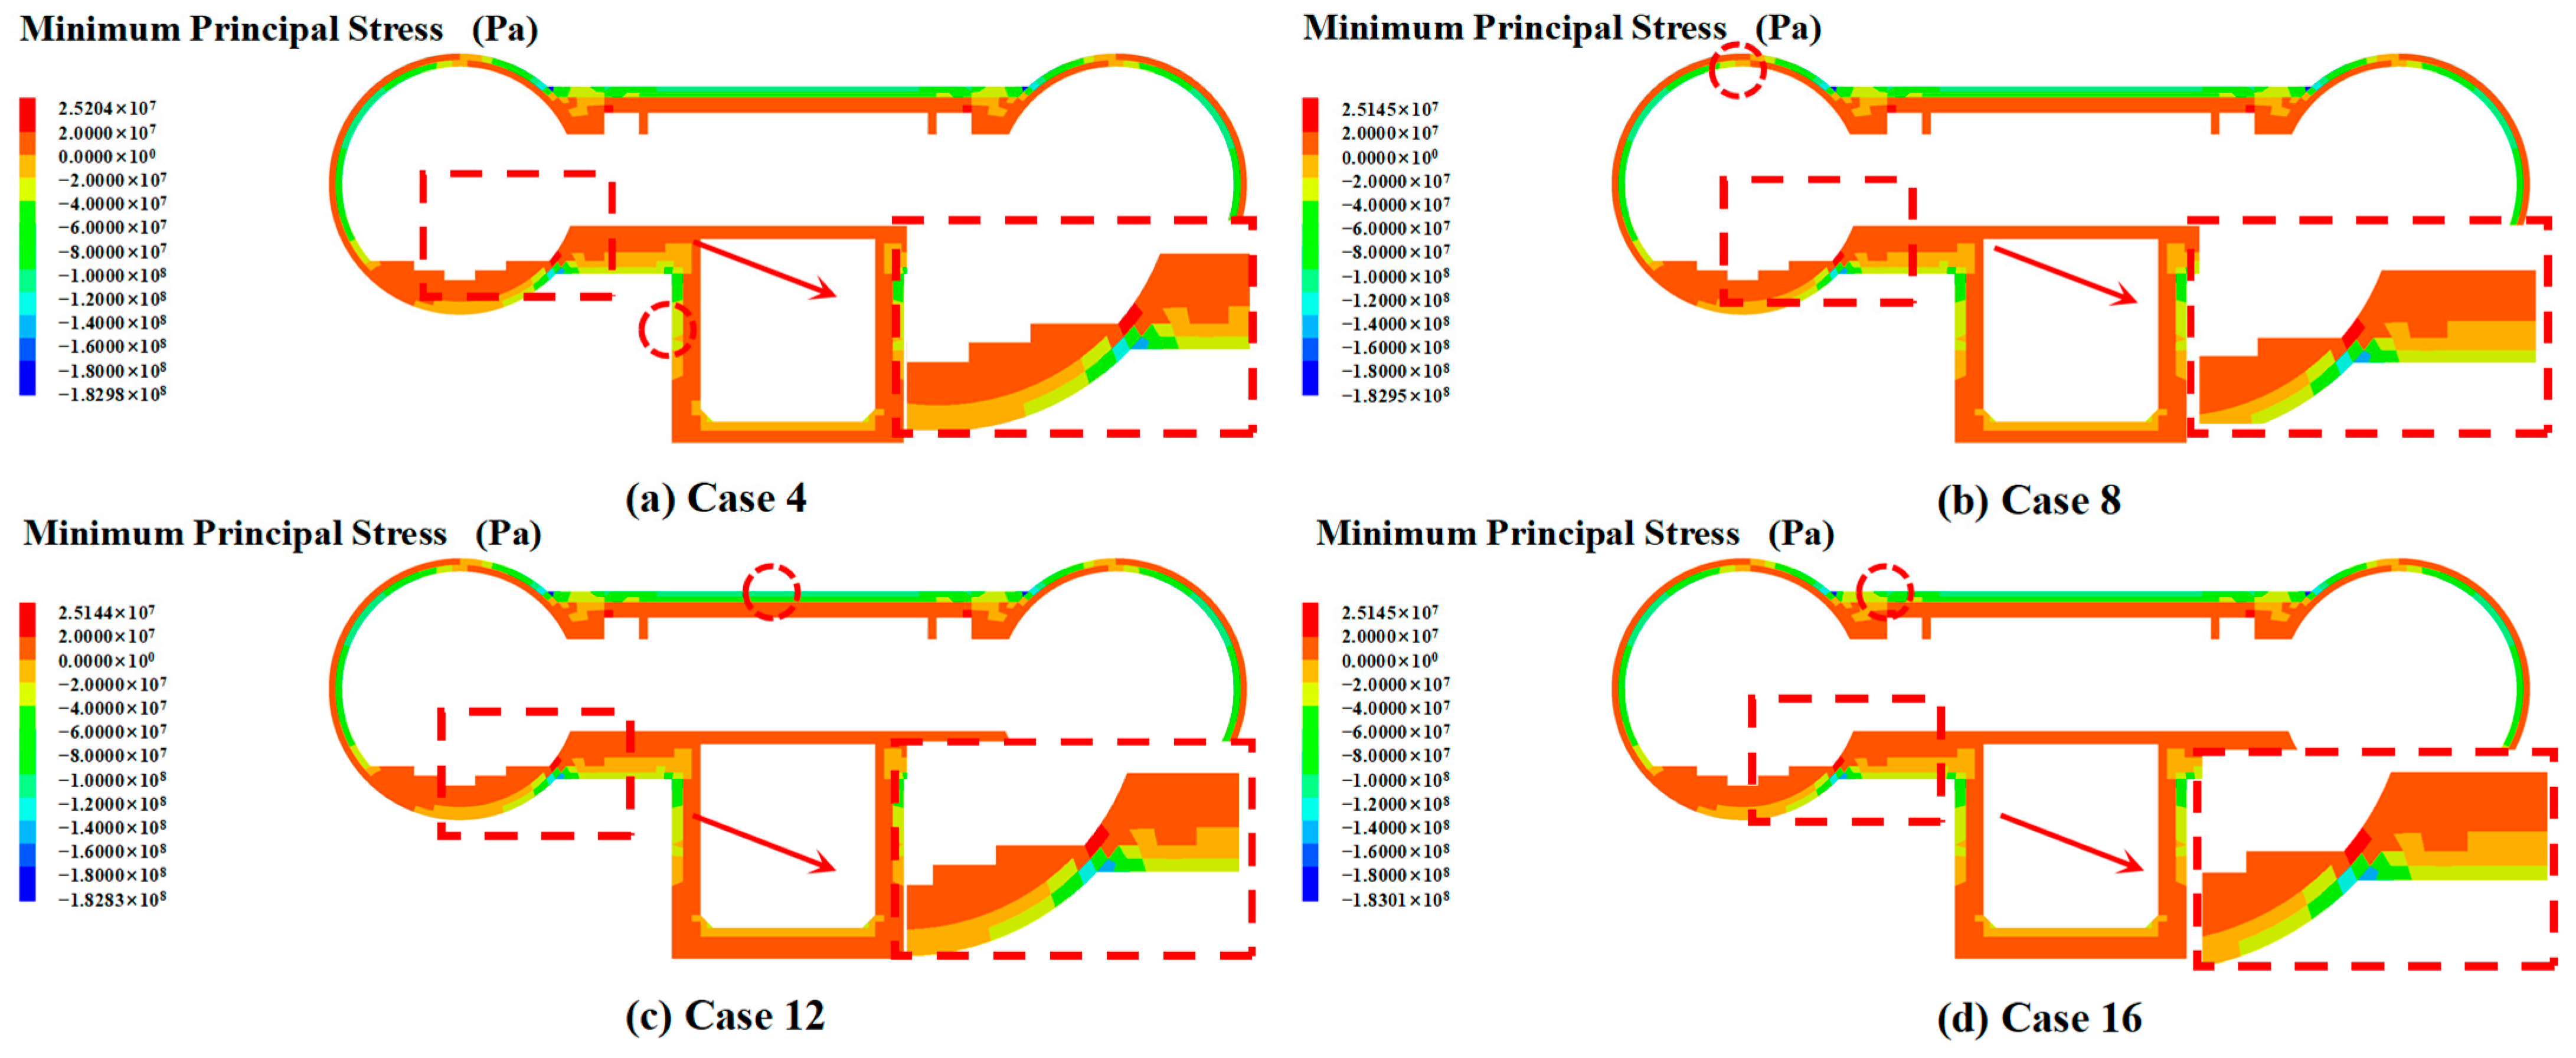
4.3.1. Influence Patterns of Defect Locations on Structural

When defects were located at the pump room sidewall, left tunnel crown, connecting passage crown, and tunnel–connecting passage junction, respectively, the pore water pressure variation patterns in the ground induced by leakage were calculated as shown in Figure 14. Under water gushing defects at different locations, the maximum pore pressure reduction (35 kPa) at the metro structure top was observed when defects occurred at the left tunnel crown, while the maximum reduction at the structure bottom (52.7 kPa) was identified for defects at the pump room sidewall. Defects at the pump room sidewall caused broader pore pressure reduction zones in the bottom strata, whereas defects at the left tunnel crown, connecting passage crown, or tunnel–connecting passage junction predominantly influenced pore pressure reduction in strata above the tunnel crown. As leakage positions shifted downward, the primary pore pressure reduction zones migrated correspondingly, with both the affected area and reduction magnitude expanding rapidly when leakage approached the tunnel invert. The burial depth of leakage locations exhibited a direct proportionality to both the dissipation magnitude of pore water pressure and its spatial influence range.
When coupled multiple defects occur at different tunnel locations, both the maximum structural displacement and deformation patterns undergo changes as illustrated in Figure 15. The maximum structural displacements under coupled defects at the pump room sidewall, left tunnel crown, connecting passage crown, and tunnel–connecting passage junction are 22.4 mm, 18.0 mm, 7.0 mm, and 12.3 mm, respectively. The displacement at the pump room sidewall under coupled defects reaches 320% of that observed at the connecting passage crown. Additionally, the maximum structural deformation during pump room sidewall defects appears near the connecting passage crown, whereas defects at the connecting passage crown shift peak displacement to the tunnel–connecting passage junction. For defects at the left tunnel crown or tunnel–connecting passage junction, maximum deformation concentrates near the connecting passage crown. Consequently, deformation monitoring between the connecting passage crown and tunnel–connecting passage junction should be prioritized during operational phases, with immediate remediation required when defects emerge near lower structural zones to prevent progressive failure.
Figure 16 displays the settlement trough curves under different defect locations. By comparing the morphological characteristics of these curves, it is evident that defects at the pump room sidewall induce the maximum depth and width of surface settlement, while defects at the center of the connecting passage crown result in the smallest surface settlement. As the burial depth of defect locations increases, surface settlements become more pronounced due to the expanded influence zone of affected soil in the stratum and the enhanced cumulative surface settlement transmitted to the ground. When defects are located directly above the structure, settlement trough curves exhibit symmetrical distribution about the structural axis. Conversely, defects at the tunnel crown or tunnel–connecting passage junction cause asymmetric settlement profiles, with settlement values on the defect-affected side significantly exceeding those on the defect-free side.
Figure 17 illustrates the deformation of the left tunnel under different defect locations. When defects occur at the pump room sidewall, the left tunnel exhibits the largest overall deformation, with the most pronounced deformation observed within the 0° to 60° circumferential range. Conversely, defects at the junction between the shield tunnel and connecting passage result in minimal deformation within the 0° to 60° range. Due to the coupled effects of multiple defects, the lining in this segment deforms outward (uplift) relative to the overall tunnel profile. This behavior is attributed to the loss of surrounding rock constraint in voided zones, causing the lining to deform inward into the cavity both longitudinally and circumferentially, further influencing adjacent lining segments. When defects develop at the shield tunnel crown, minimal deformation occurs within the 120° to 360° circumferential range.
Figure 18 and Figure 19, respectively, present the major and minor principal stress contour maps of the tunnel structure under varying defect locations. The structural stress distribution exhibited minimal temporal variation during the computational process, with no plastic zones developed. Comparative analysis reveals negligible discrepancies in stress patterns across different working conditions. Notably, stress concentrations manifested peak values at the junctions between twin tunnels and cross passage structures, where the most pronounced stress variations were observed. This finding underscores the necessity to prioritize the mechanical conditions at tunnel–cross passage interfaces in pathology prevention and mitigation strategies.

4.3.2. Influence Patterns of Defect Severity on Structural Response

(1)
Influence patterns of leakage intensity on structural response
Displacement contour maps of the structure under four leakage intensities (damp stains: 0.1 m3/d; dripping leakage: 0.5 m3/d; linear flow: 1 m3/d; water gushing: 5 m3/d) at the connecting passage crown were plotted as shown in Figure 20 to investigate the influence of leakage intensity on structural deformation of the shield tunnel and connecting passage. The impact of leakage on structural displacement is primarily localized near leakage points, with vertical displacement exhibiting a positive correlation to leakage intensity. At damp stain intensity (0.1 m3/d), the crown displacement of the connecting passage measures 3.80 mm, whereas under water gushing (5 m3/d), the displacement increases to 4.52 mm, representing an 18.9% escalation.
Settlement trough curves of the ground surface under four leakage intensities (damp stains, dripping leakage, linear flow, and water gushing) at the connecting passage crown were plotted as shown in Figure 21. The results indicate that damp stains, characterized by minimal water infiltration, exert weaker influence on surface settlement and achieve stabilization more rapidly. The central surface settlement induced by linear flow leakage amounts to 103% of that caused by damp stains, while water gushing leakage elevates settlement to 107% of the damp stain-induced value.
Given the significant impact of tunnel deformation on metro operational safety and to further investigate structural deformation patterns, deformation diagrams of the left tunnel under four leakage intensities (damp stains, dripping leakage, linear flow, and water gushing) at the connecting passage crown were plotted as shown in Figure 22. Variations in leakage intensity at the connecting passage crown exhibit limited influence on pipeline deformation. Damp stains, characterized by minimal water infiltration, induce weaker structural deformation in the tunnel. However, as leakage intensity increases, the upper-right deformation of the left tunnel structure becomes notably pronounced due to its proximity to leakage points.
(2)
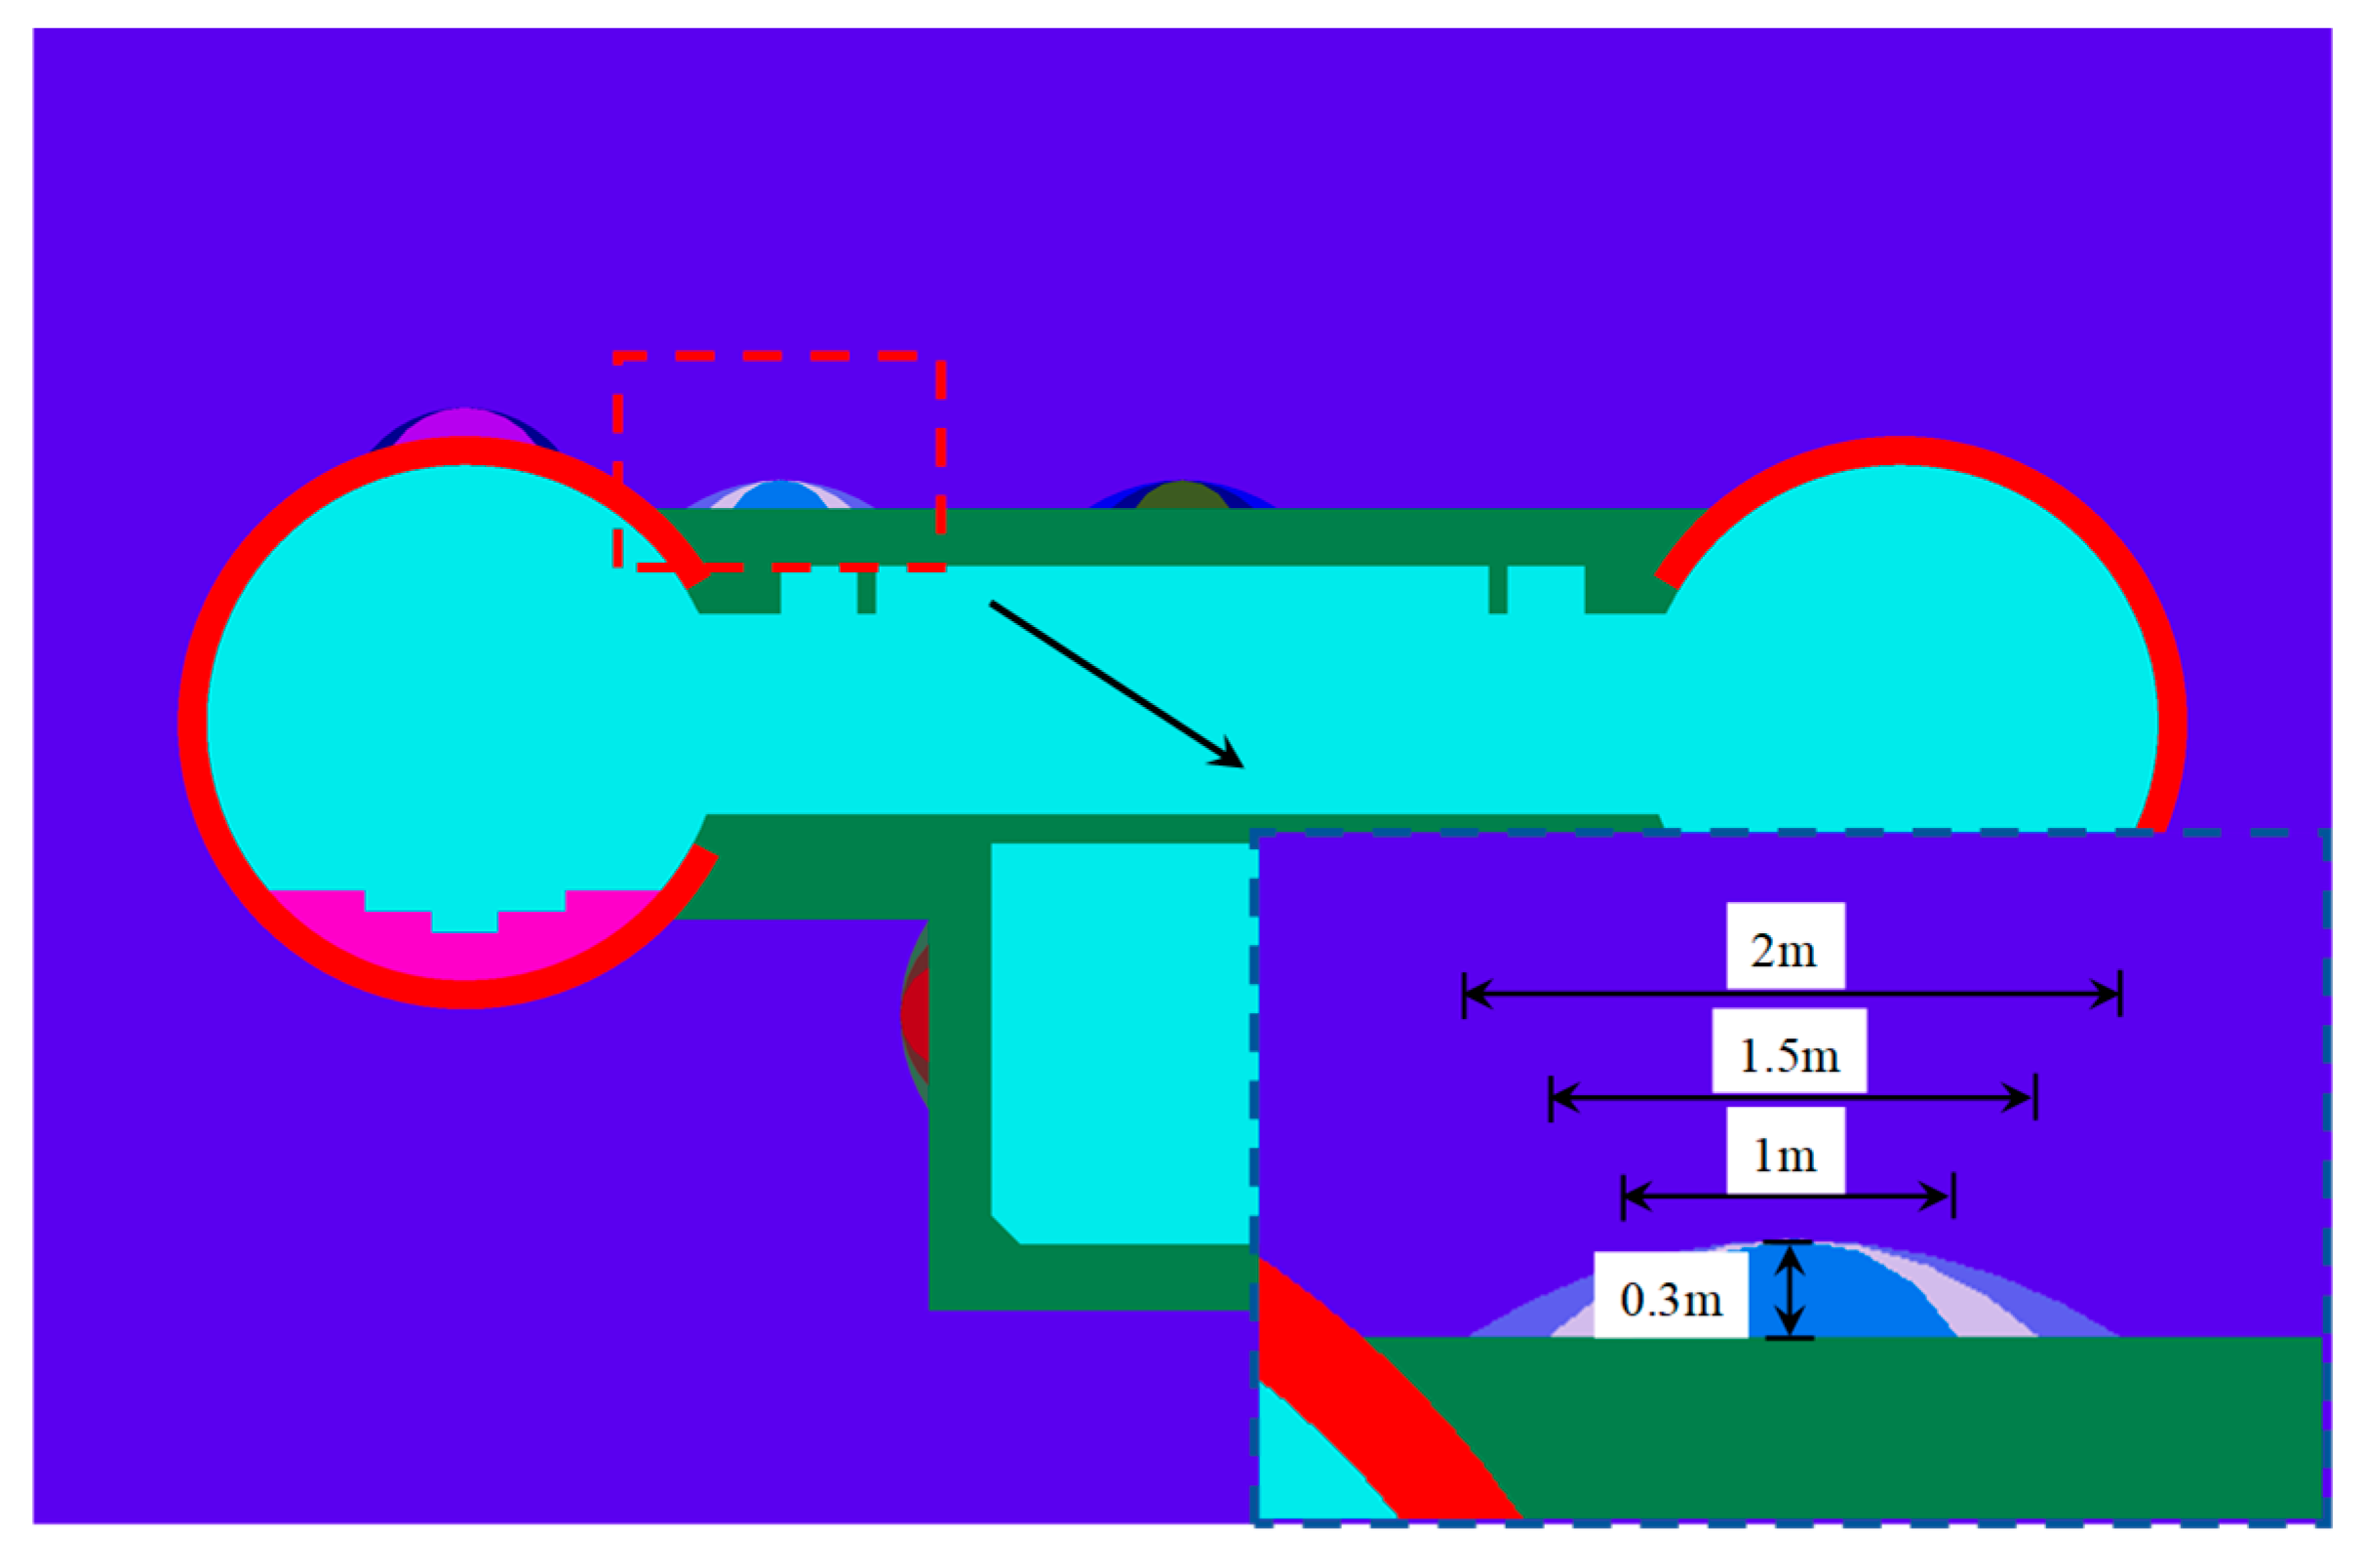
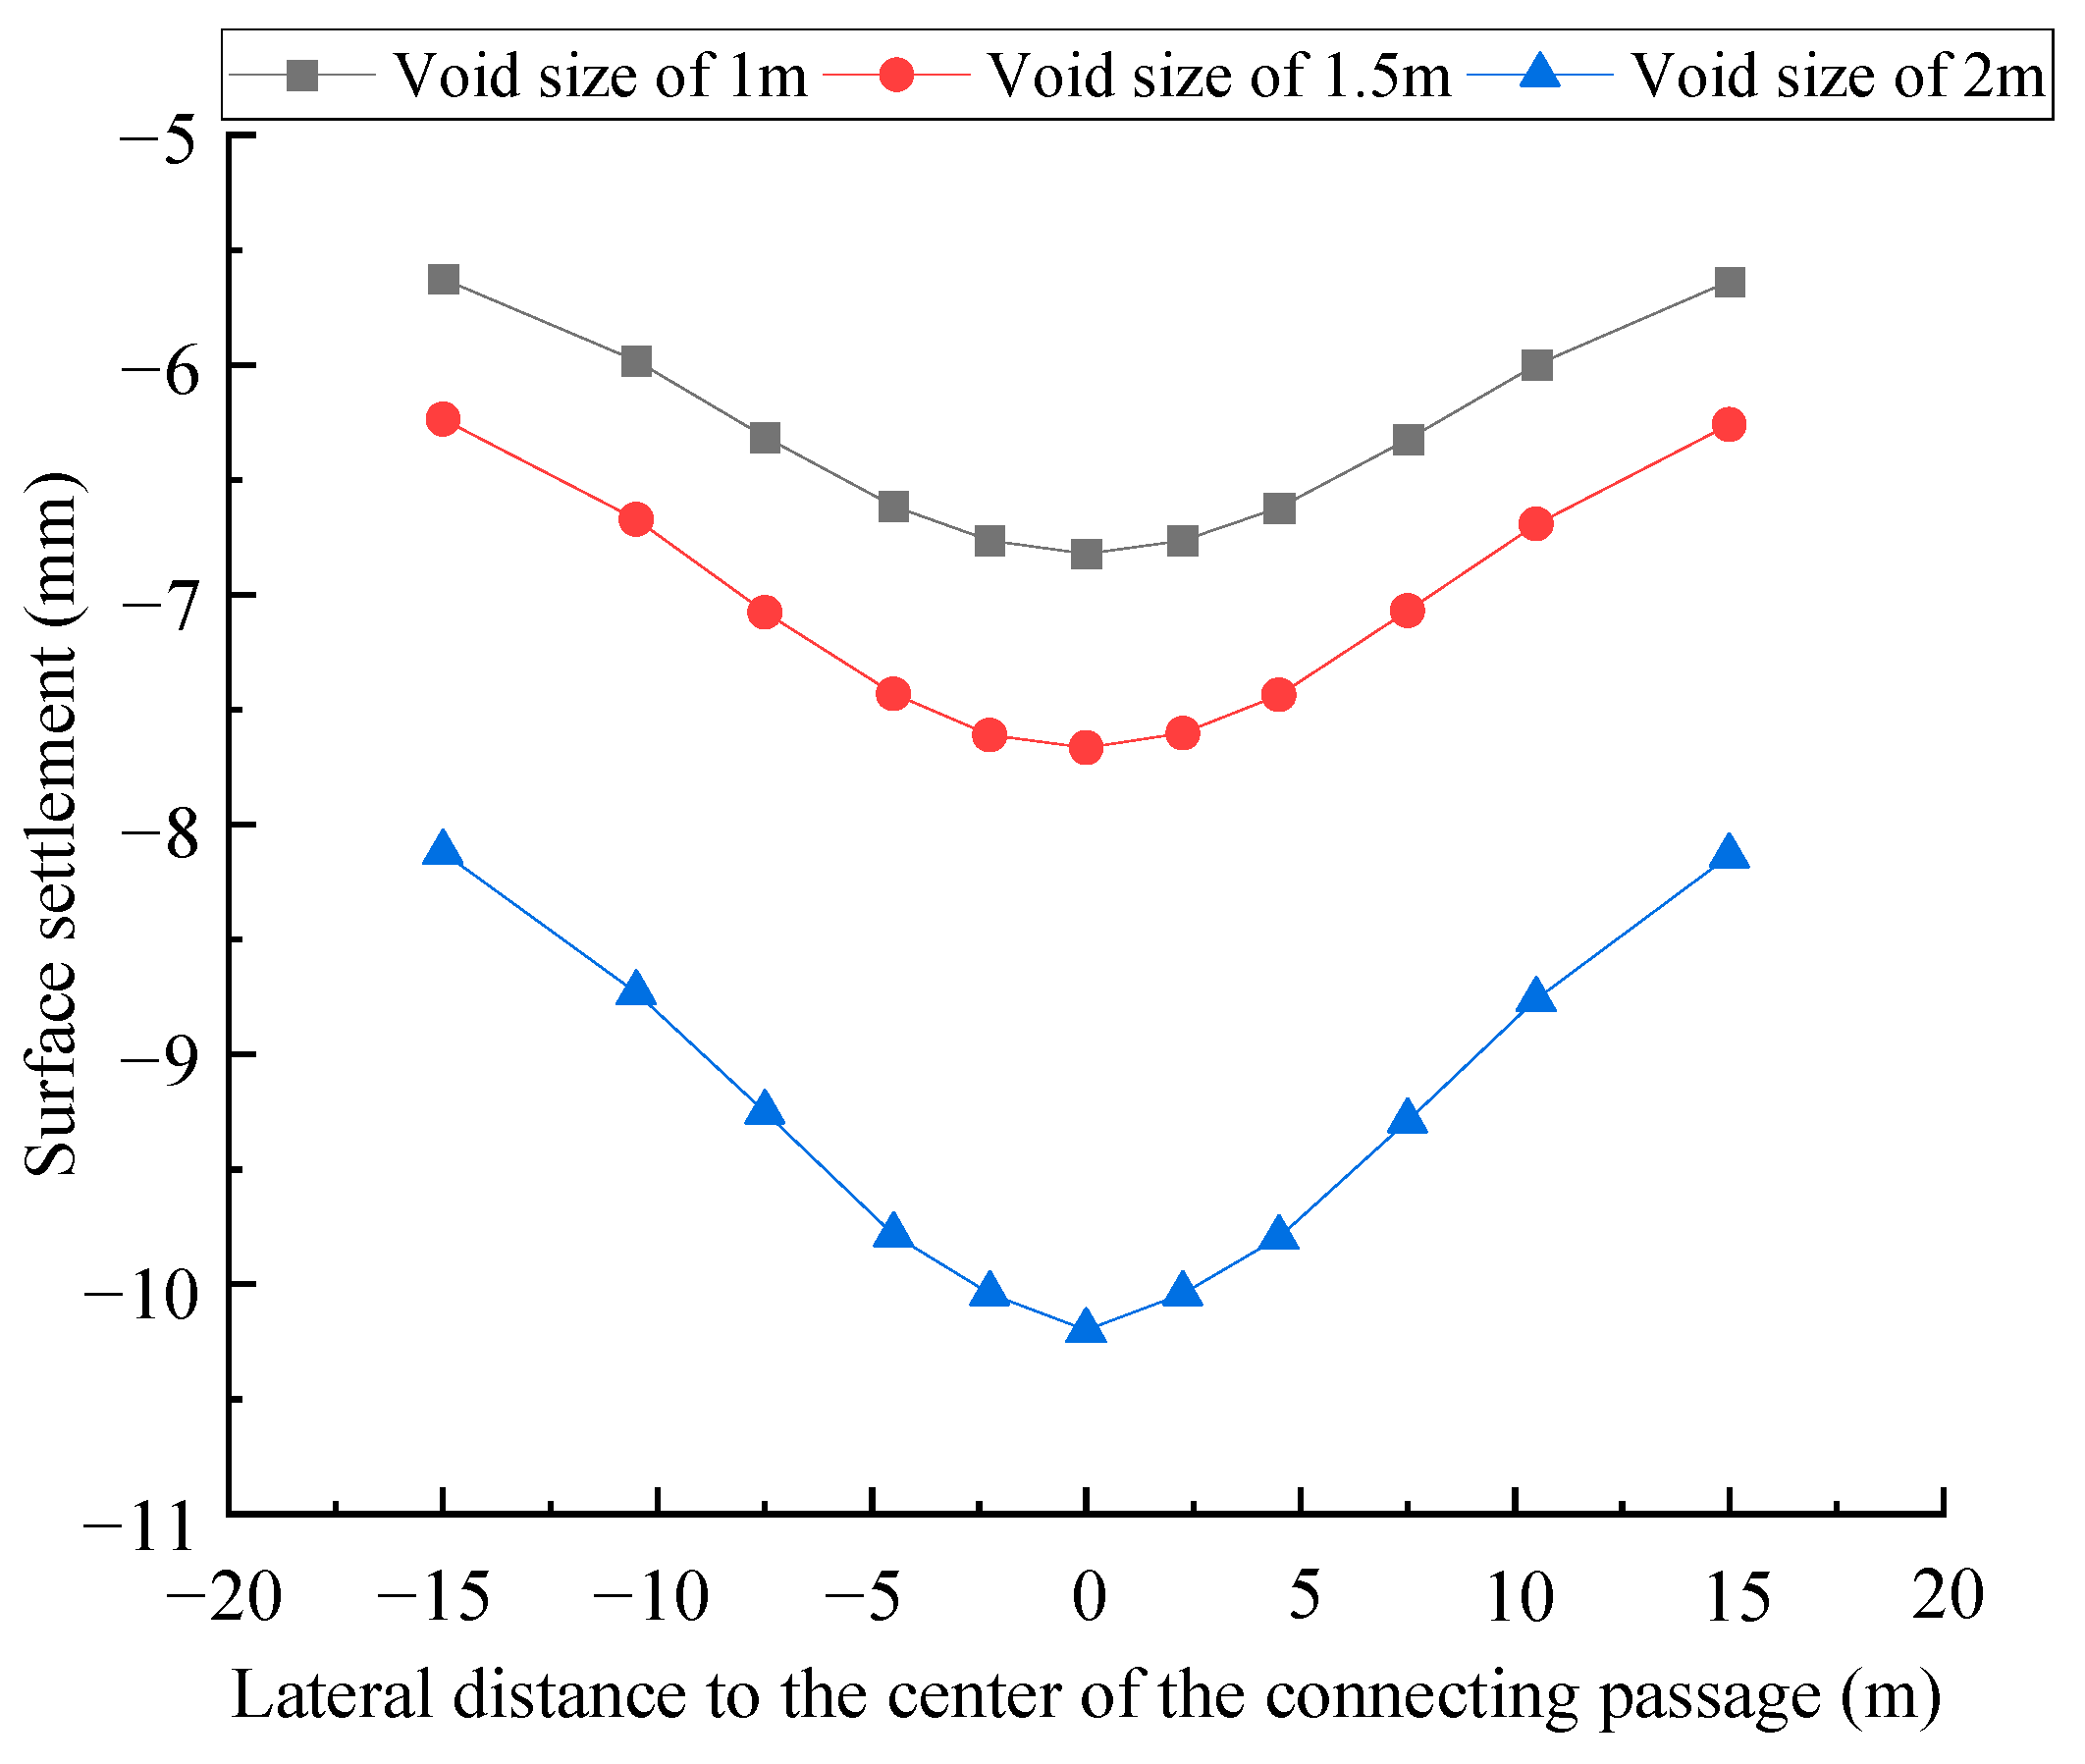
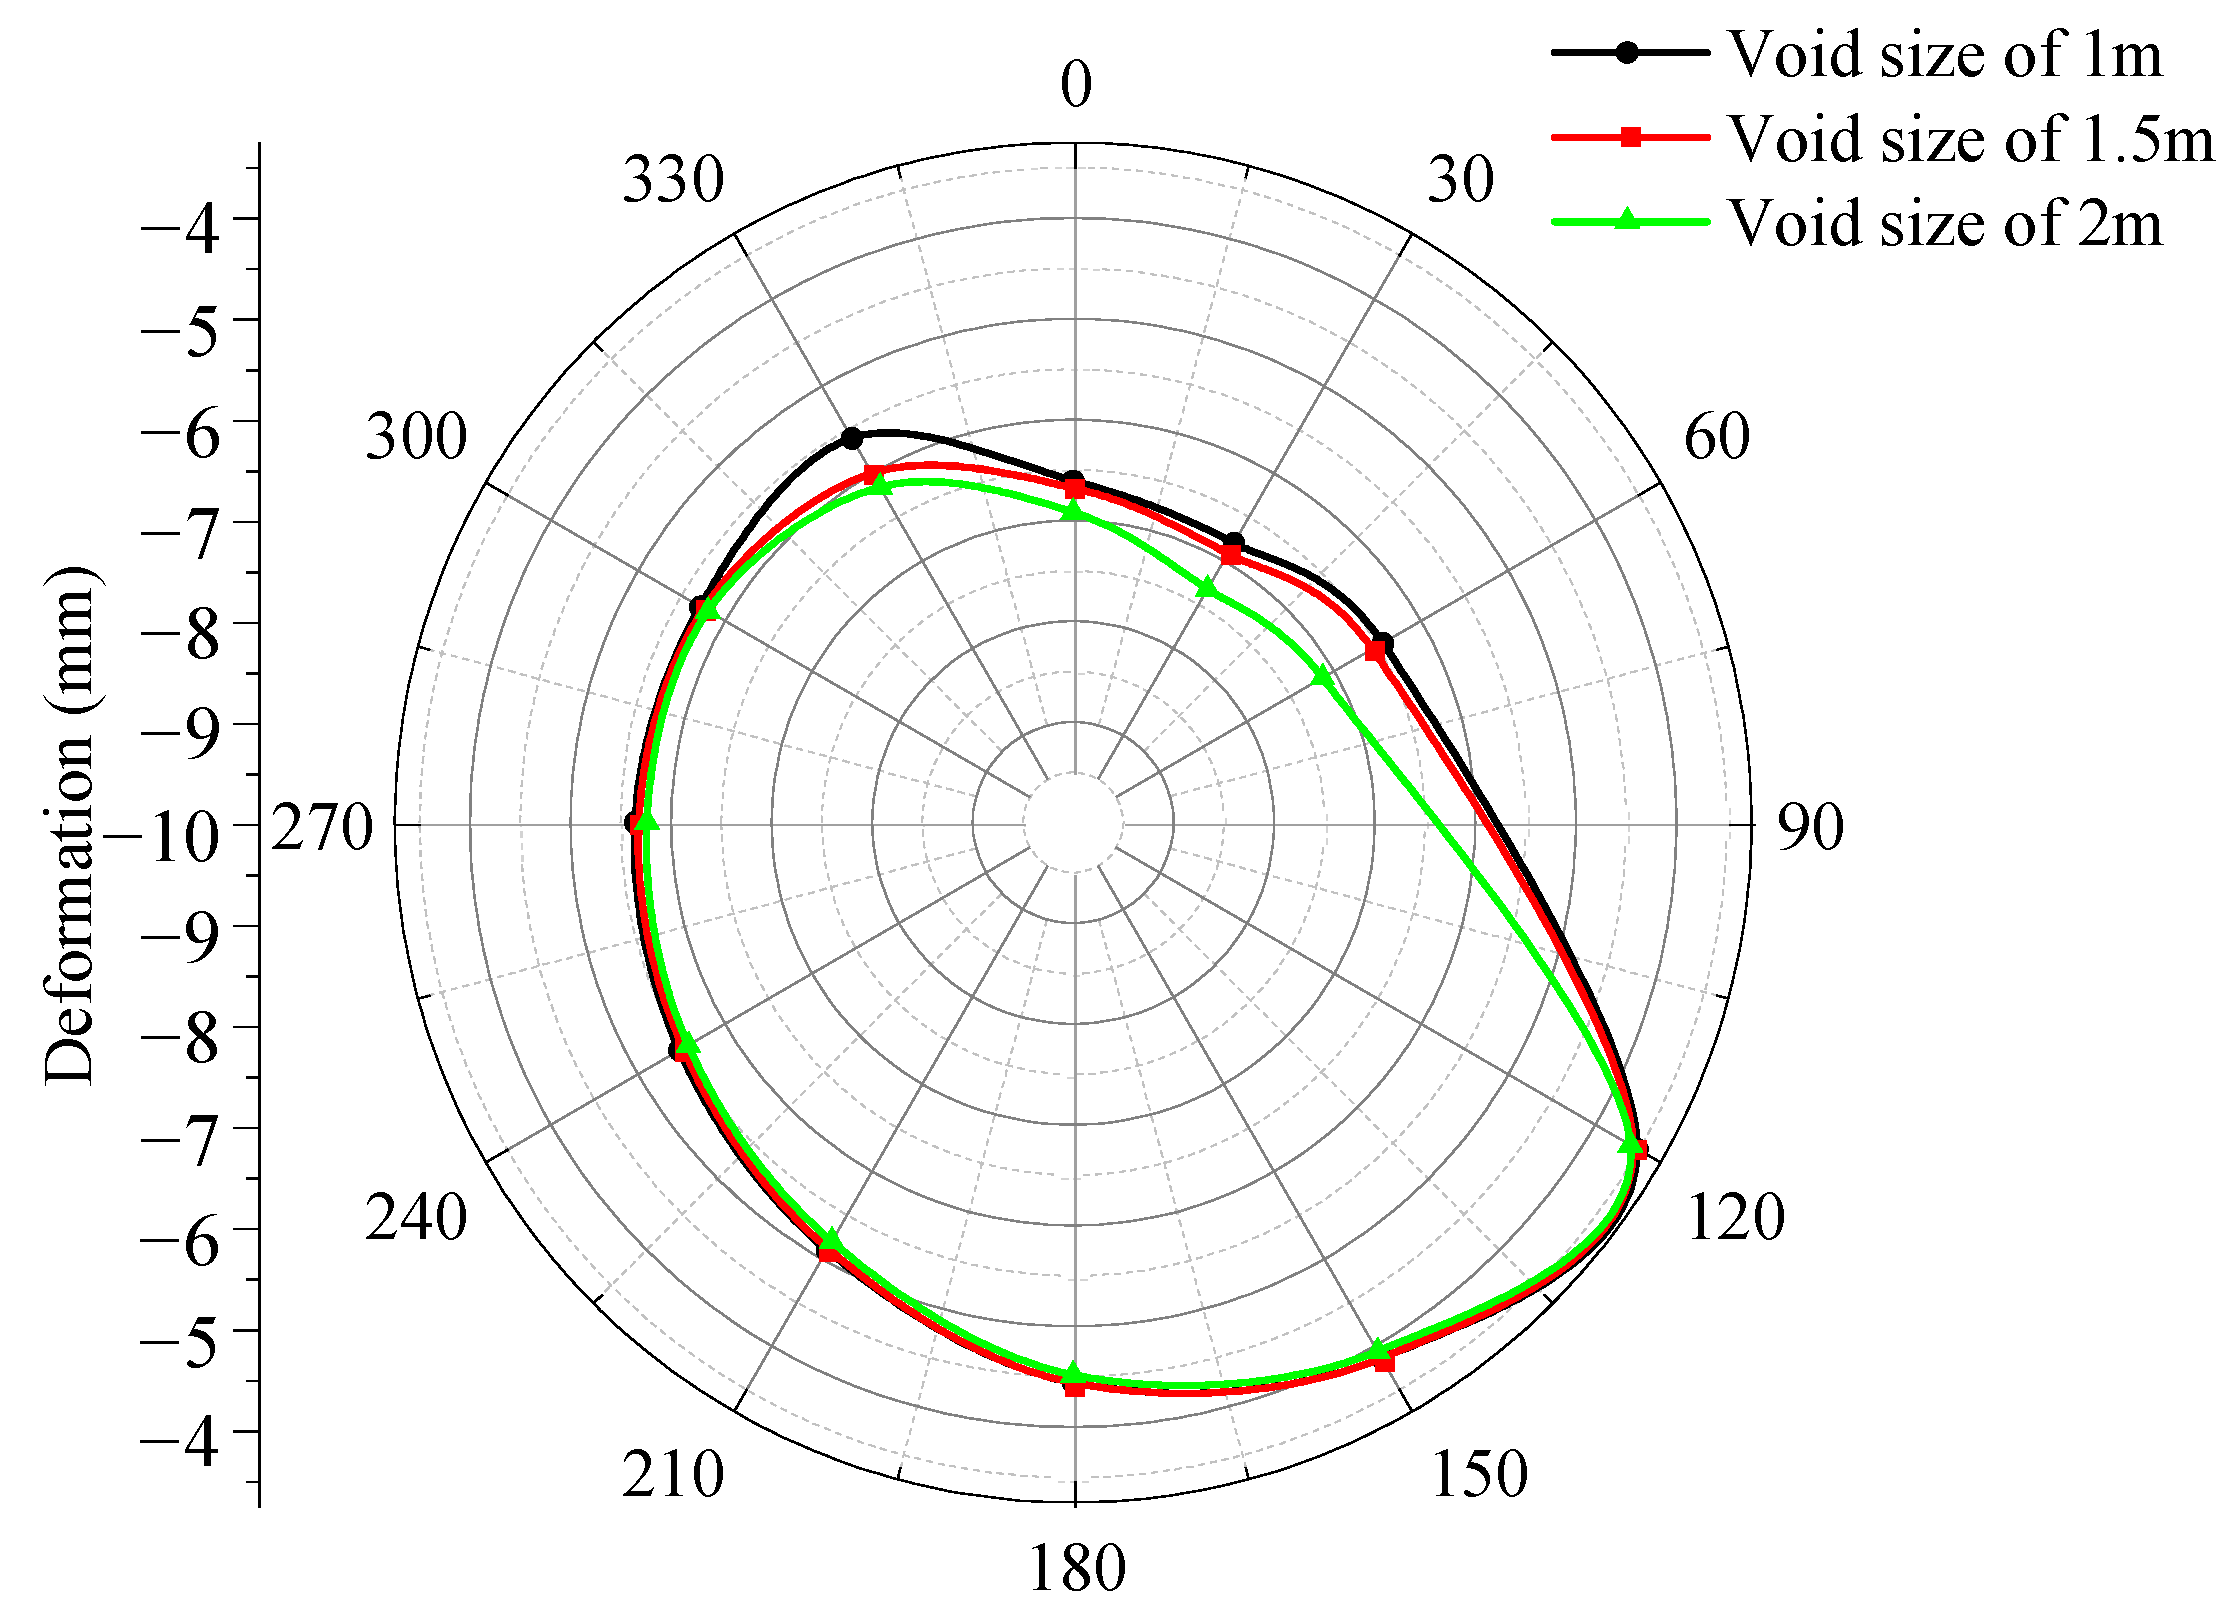
Influence patterns of void size on structural response
To investigate the influence of void size on the structural deformation of shield tunnels and connecting passages, Figure 23 presents displacement contour maps of the structure under void sizes of 1 m, 1.5 m, and 2 m at the crown of the connecting passage. Under defect conditions, both the shield tunnel and connecting passage experience overall settlement. When voids exist at the crown of the connecting passage, the vertical displacement of the lining along the longitudinal centerline of the voided zone significantly decreases, indicating that the lining in this area exhibits upward heave relative to the overall tunnel profile. This phenomenon is attributed to the loss of surrounding rock constraint in the voided area, which causes the lining to deform inward into the cavity both longitudinally and circumferentially, resulting in vertical upward displacement. As the void size increases, the heave displacement at the center of the voided zone intensifies markedly. When the void size reaches 2 m, the vertical displacement at the crown can reach 4.52 mm.
As shown in Figure 24, when voids are located above the connecting passage crown, their presence significantly increases both the width and depth of the surface settlement trough, with larger voids inducing more pronounced increases. Conversely, voids positioned on the tunnel’s right side primarily enlarge the trough width on the void-affected side while moderately increasing trough depth.
As shown in Figure 25, structural deformation diagrams of the left tunnel line under varying void dimensions were plotted. Due to the significant distance of defect locations from critical structural zones, the influence of void size variations on structural deformations remains relatively minor. Notably, as void dimensions increase, deformation magnitudes at all monitoring positions along the left tunnel exhibit marginal reductions, with the most pronounced mitigation observed within the 0° to 120° circumferential positions (right upper quadrant).
(3)
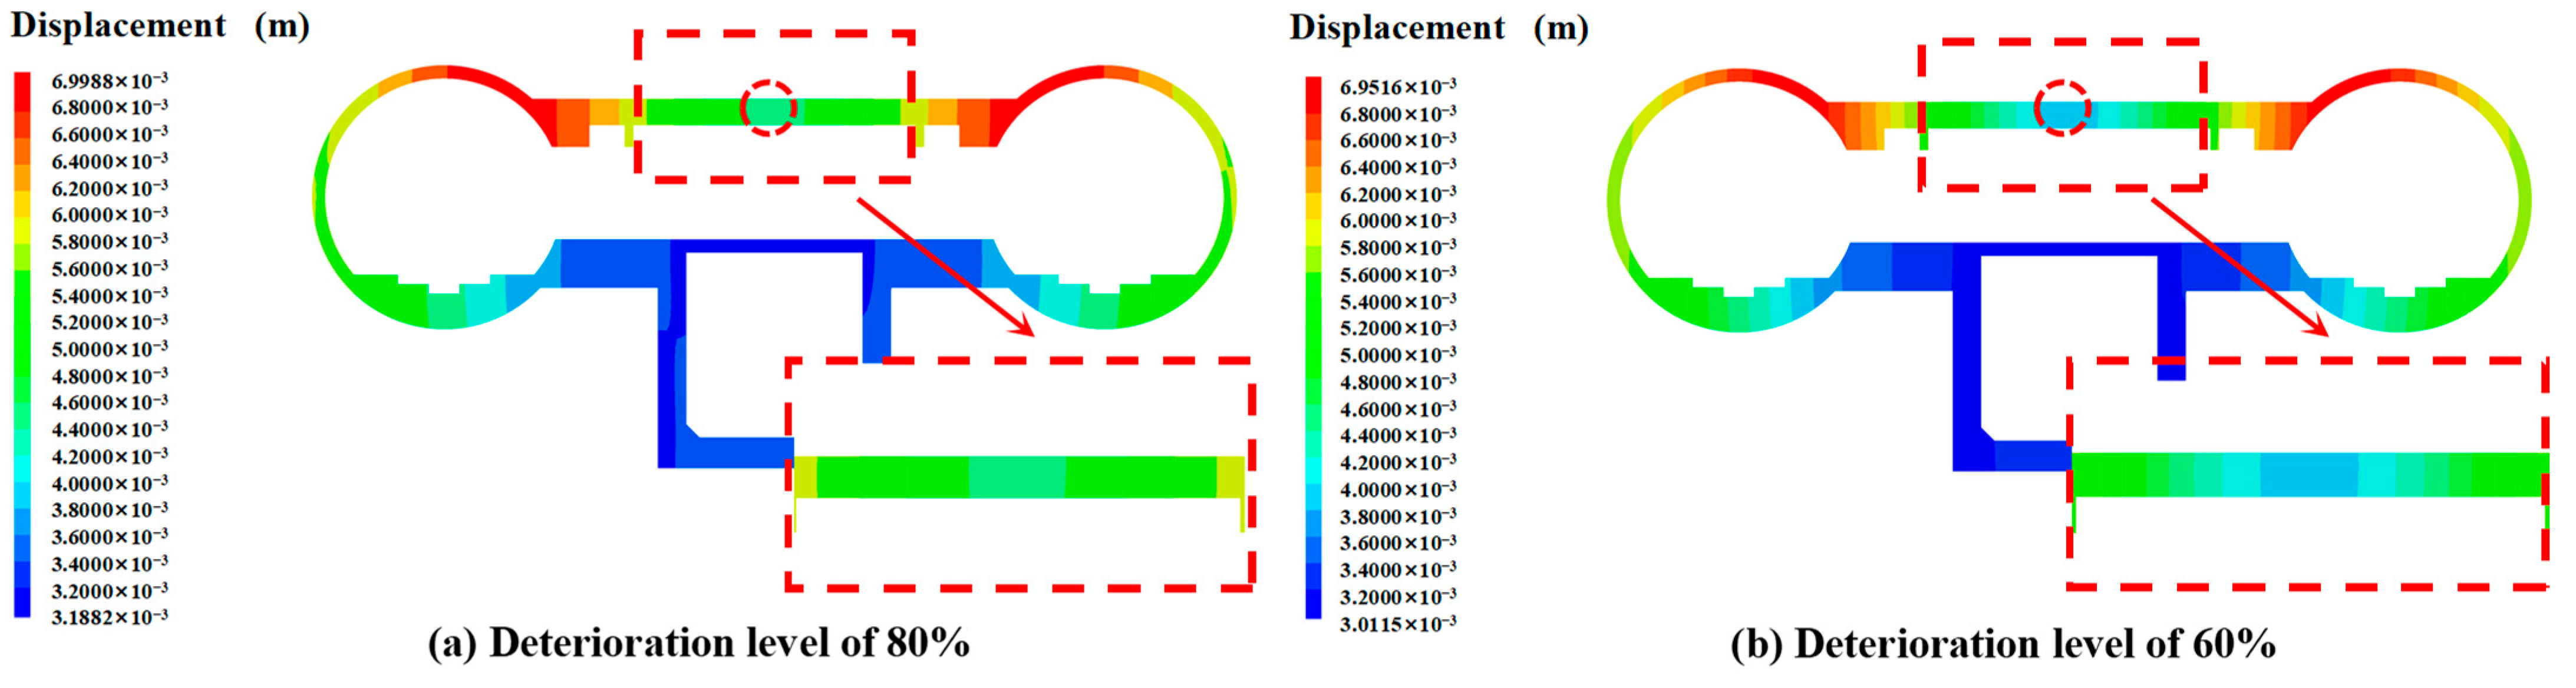
Influence Patterns of Structural Deterioration Level
The structural displacement contour plots of the connecting passage vault under different deterioration levels are shown in Figure 26. From Figure 26, it can be concluded that when structural deterioration occurs at the vault position of the connecting passage, the vertical displacement of the lining at the center area of the connecting passage vault significantly decreases with increasing deterioration level, indicating that this section of lining exhibits an upward heave state relative to the entire tunnel structure. This phenomenon is attributed to the loss of surrounding rock constraint in the lining void area, causing the lining to exhibit compressive deformation towards the void cavity in both longitudinal and circumferential directions. Concurrently, the reduction in lining thickness decreases the cross-sectional moment of inertia and reduces bending stiffness, collectively leading to increased heave displacement.
The surface settlement troughs under varying levels of deterioration at the connecting passage crown are plotted in Figure 27, revealing that surface settlement increases slightly with the escalation of structural deterioration levels. Specifically, the central surface settlement induced by defects at the 60% deterioration level measures 104% of that caused by the 80% deterioration level.
The structural deformation diagram of the left tunnel line under varying deterioration levels at the connecting passage crown is plotted in Figure 28, revealing that variations in deterioration levels at the connecting passage crown exhibit limited influence on pipeline deformation. However, as structural deterioration intensifies, due to their proximity to leakage points, the upper-right deformation of the left tunnel structure becomes notably pronounced.

5. Bayesian Network-Based Safety Risk Assessment Method for Shield Tunnels and Connecting Passages

The Bayesian Network method, originating in the 1980s, is a risk analysis and prediction technique based on graph theory and probability theory. It utilizes Bayesian formulas to construct Bayesian structural networks, providing a method to intuitively visualize knowledge through diagrams [62].

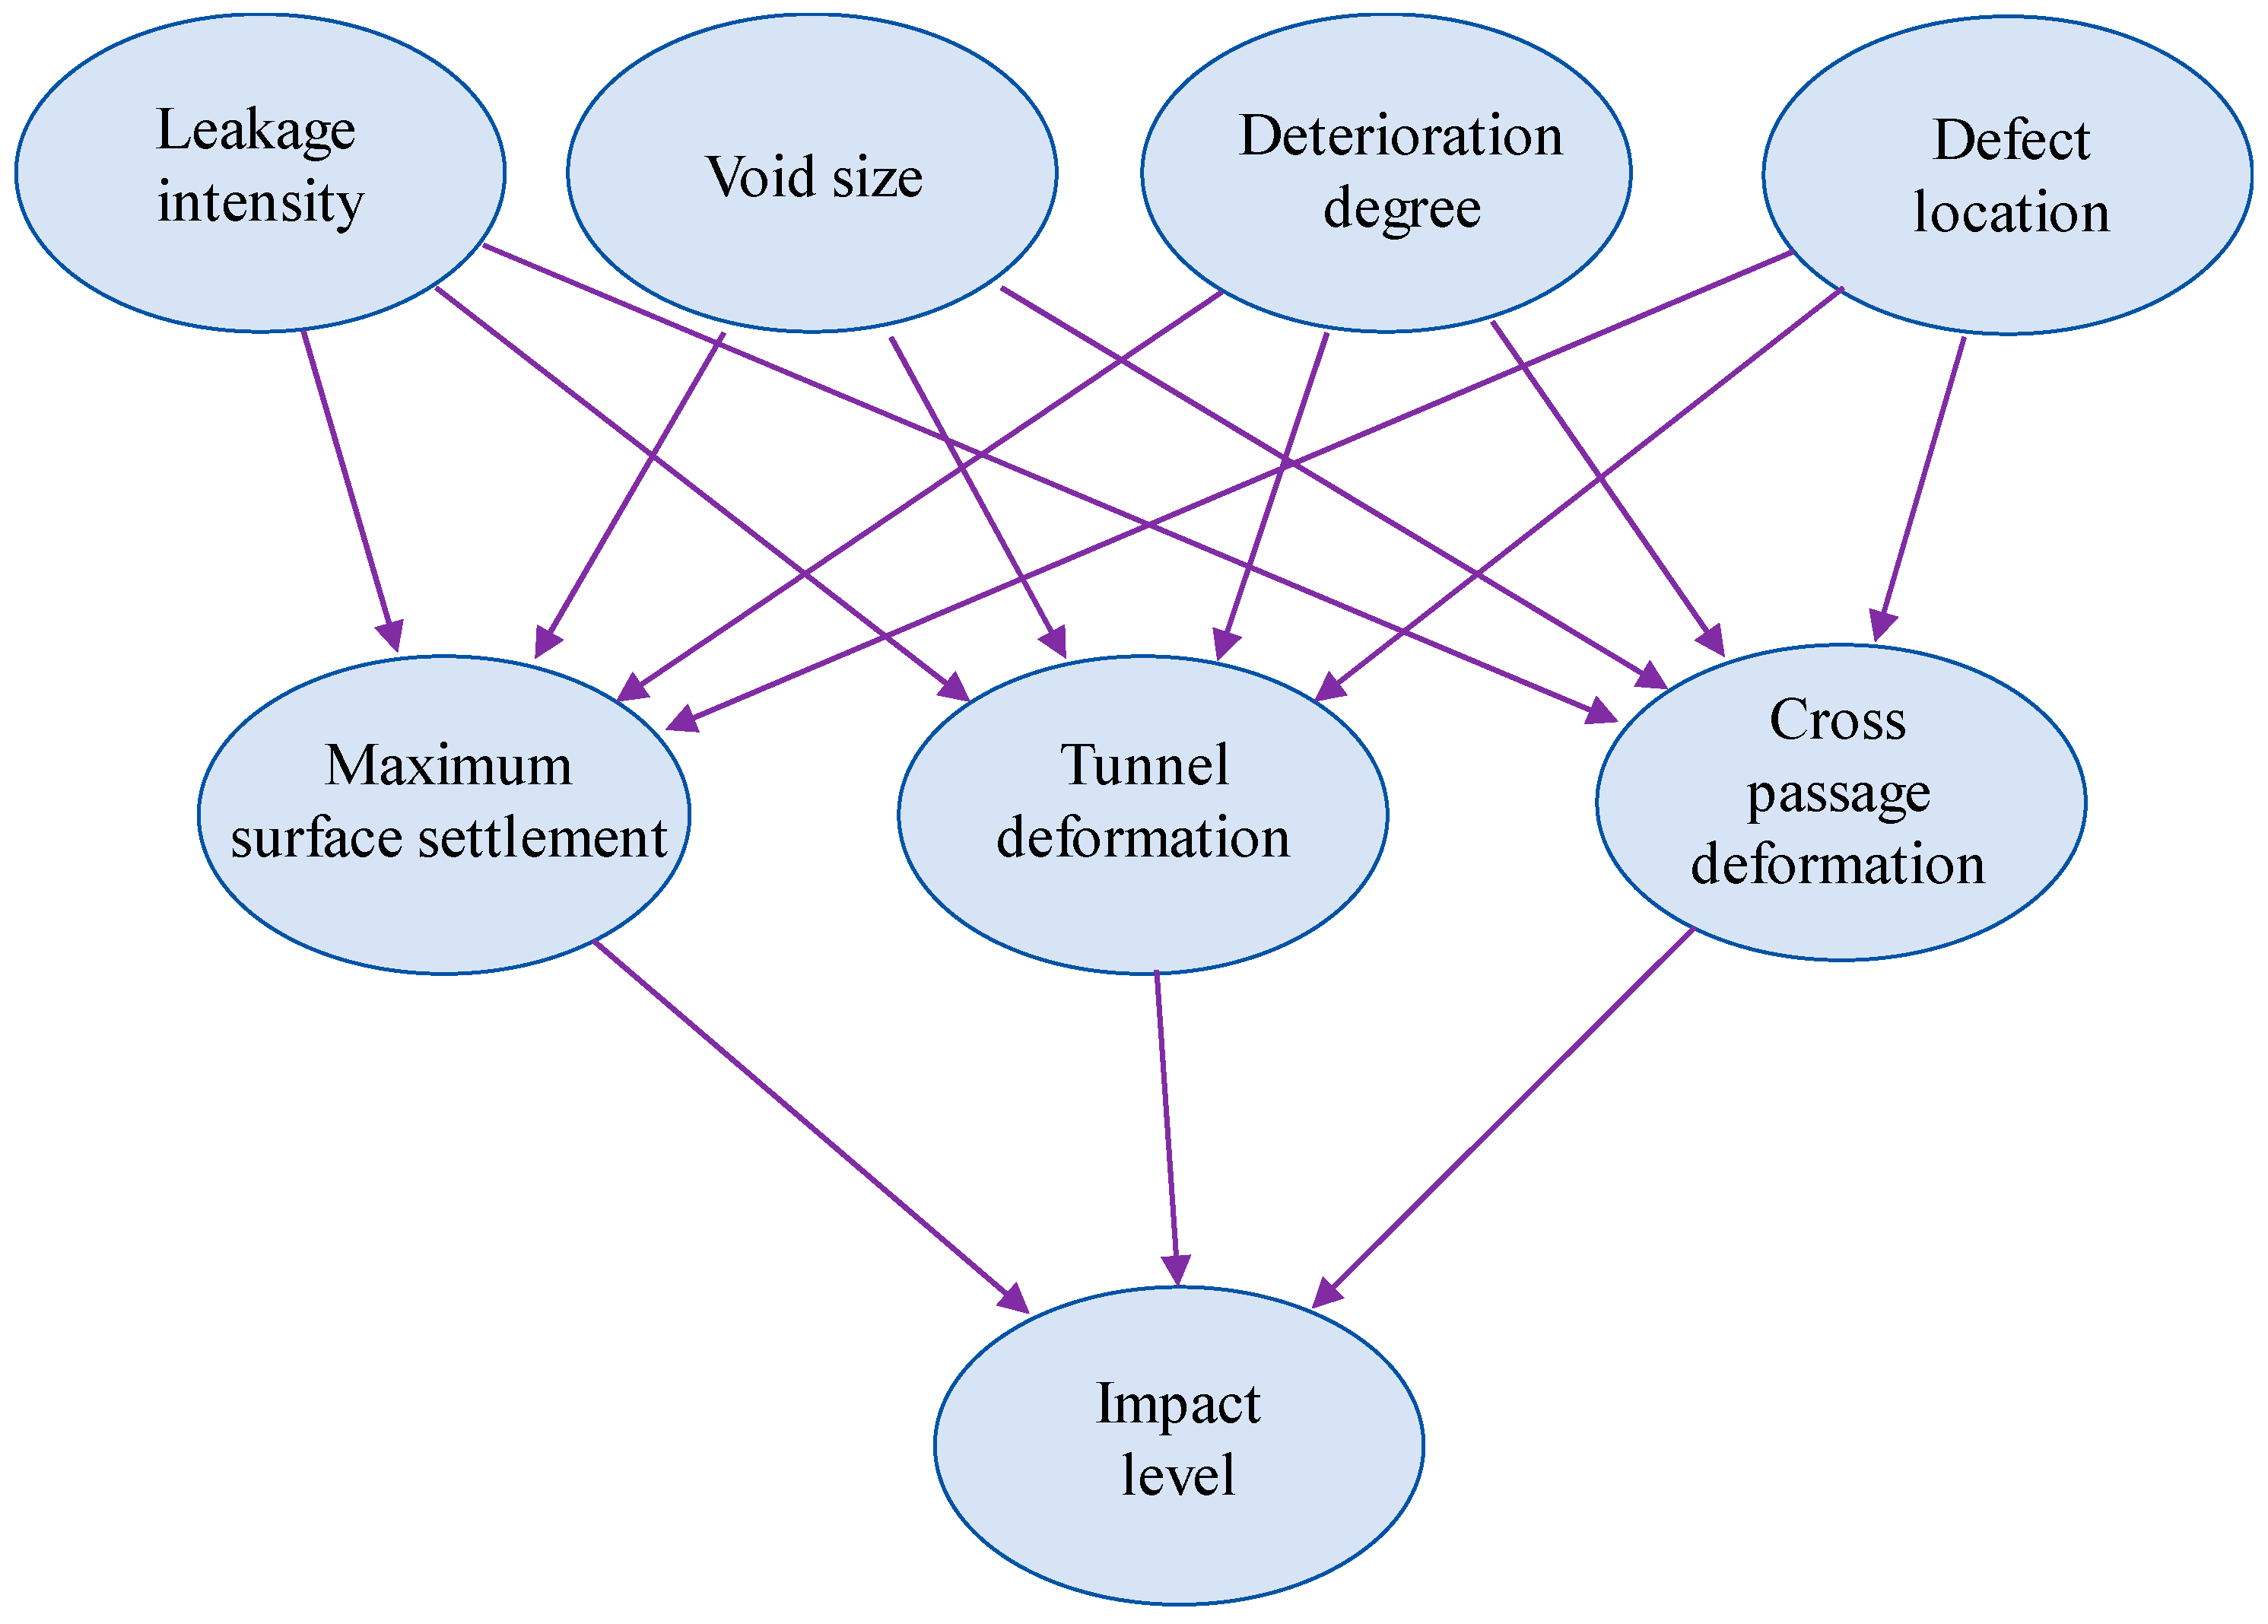
5.1. Establishment of Bayesian Network Model

The safety impacts of multi-defect coupling effects on shield tunnels and connecting passages are complex and involve numerous factors. This section employs the results of extensive numerical simulations as prior knowledge for the Bayesian network structure and conducts parameter learning based on this foundation, ultimately constructing the Bayesian network topology structure diagram shown in Figure 29.
The diagram specifies risk indicators such as maximum surface settlement, tunnel deformation, and connecting passage deformation in addition to risk factors such as leakage degree, void size, deterioration level, and defect location.
Regarding the analysis of the impact of multi-defect coupling effects on the safety of shield tunnels and cross passages, current related research findings remain relatively limited, and accessible reference data are comparatively scarce. Consequently, it is feasible to adopt expert scoring methodologies to categorize risk indicators and utilize the “1–9 scale method” to determine the weighting coefficients of these risk indicators. Referencing the Technical Specification for Monitoring and Measurement of Metro Engineering (DB11 490-2024), the risk level classifications for indicators and corresponding risk factors are defined as shown in Table 4.
After importing the data into the Bayesian network model, the distributions of input and output samples are obtained as shown in Figure 30.

5.2. Analysis of Safety Risk Factors

To gain clearer insights into the influencing factors of shield tunnels and connecting passage structures during actual operational processes, this section analyzes the probabilities of risk factors leading to different impact levels based on the previously established safety impact analysis model for shield tunnels and connecting passage structures.
Figure 31, Figure 32 and Figure 33 demonstrate the most unfavorable states and probabilities of structural risk factors obtained when the safety factor is set to a fixed value. By defining the impact level to a specific classification, the most unfavorable states and probabilities of risk factors can be derived through the established Bayesian network model. Figure 31, Figure 32 and Figure 33 correspond to scenarios involving Level III to Level I risk indicators, with higher levels indicating greater hazard severity at the location.
The figure reveals that when the impact level is Level 3, the probabilities of leakage degrees are similar except for the relatively low probability of wet stains, with the highest probability observed for a void size of 2 m, a deterioration degree of 60%, and defect locations at the pump room side wall. This indicates that larger void sizes, higher deterioration degrees, and deeper burial depths of defect locations correspond to higher risk levels, as deeper defect burial depths exert greater influence due to the expansion of soil volume affected by defects in the stratum. When the impact level is Level 1, the highest probabilities are associated with a leakage degree of wet stains, a void size of 1 m, and a deterioration level of 80%, suggesting that such coupled defects do not pose significant hazards to structural integrity or lead to accidents under these conditions.
Based on the aforementioned research findings, structural safety exhibits a negative correlation with the leakage degree, void size, deterioration level, and burial depth of defect locations. Specifically, the scenario where the leakage degree corresponds to water gushing, void size reaches 2 m, deterioration level measures 0.6 m, and defects occur at the pump room side wall is identified as the most unfavorable state among risk factors. After inputting these four risk factors under their most adverse conditions into the model, the probability distribution of risk levels obtained is presented in Table 5.
The final influence levels under the most unfavorable conditions are as follows:
T X i = k 3 P k × k
Pk denotes the probability of the influence level being k, where k represents the influence level (k = 1, 2, 3).
The calculated results indicate that the final influence level of risk factor X1 (leakage intensity) under water gushing conditions is 2.03, X2 (void size) at 2 m is 2.37, X3 (deterioration level) at 60% is 2.15, and X4 (defect location) at the sidewall position is 2.43. It is evident that when any of the four influencing factors is in its most unfavorable state, the influence level T consistently reaches the highest severity tier.
This study employs the sensitivity performance measure (SPM, Sensitivity Performance Measure) proposed by Zhang [63] for sensitivity analysis. The calculation formula for the sensitivity indicator SPM(Xi) of the root node Xi is shown in the equation. When SPM(Xi) approaches 1, it indicates that this factor is more likely to act as a direct contributor to risk events.
S P M ( X i ) = 1 Q i 1 Q i P ( T = t X i = x i ) P ( T = t ) P ( T = t ) ,   i = 1 , 2 , n
Here, t denotes a risk event with P states, typically selecting states of greater impact as the research focus, while xi represents the influencing factor Xi with Qi states. SPM(Xi) can be regarded as a sensitivity indicator quantifying the contribution degree of the influencing factor to the occurrence of risk events.
Through the Bayesian network methodology, the contributions of various risk factors to the influence level can be quantitatively determined. In this analysis, T = 3 is selected as the primary research focus to facilitate sensitivity analysis. Based on the aforementioned formula, the sensitivity performance measures SPM(Xi) for each indicator are calculated. When the leaf node risk level reaches the most hazardous state (T = 3), void size X4 is identified as the most sensitive factor, with the ranking order X2 > X4 > X3 > X1. Consequently, under the current prior knowledge framework, void size is recognized as the critical influencing factor for safety, implying that an increase in void dimensions elevates safety risks, necessitating timely attention and protective measures.

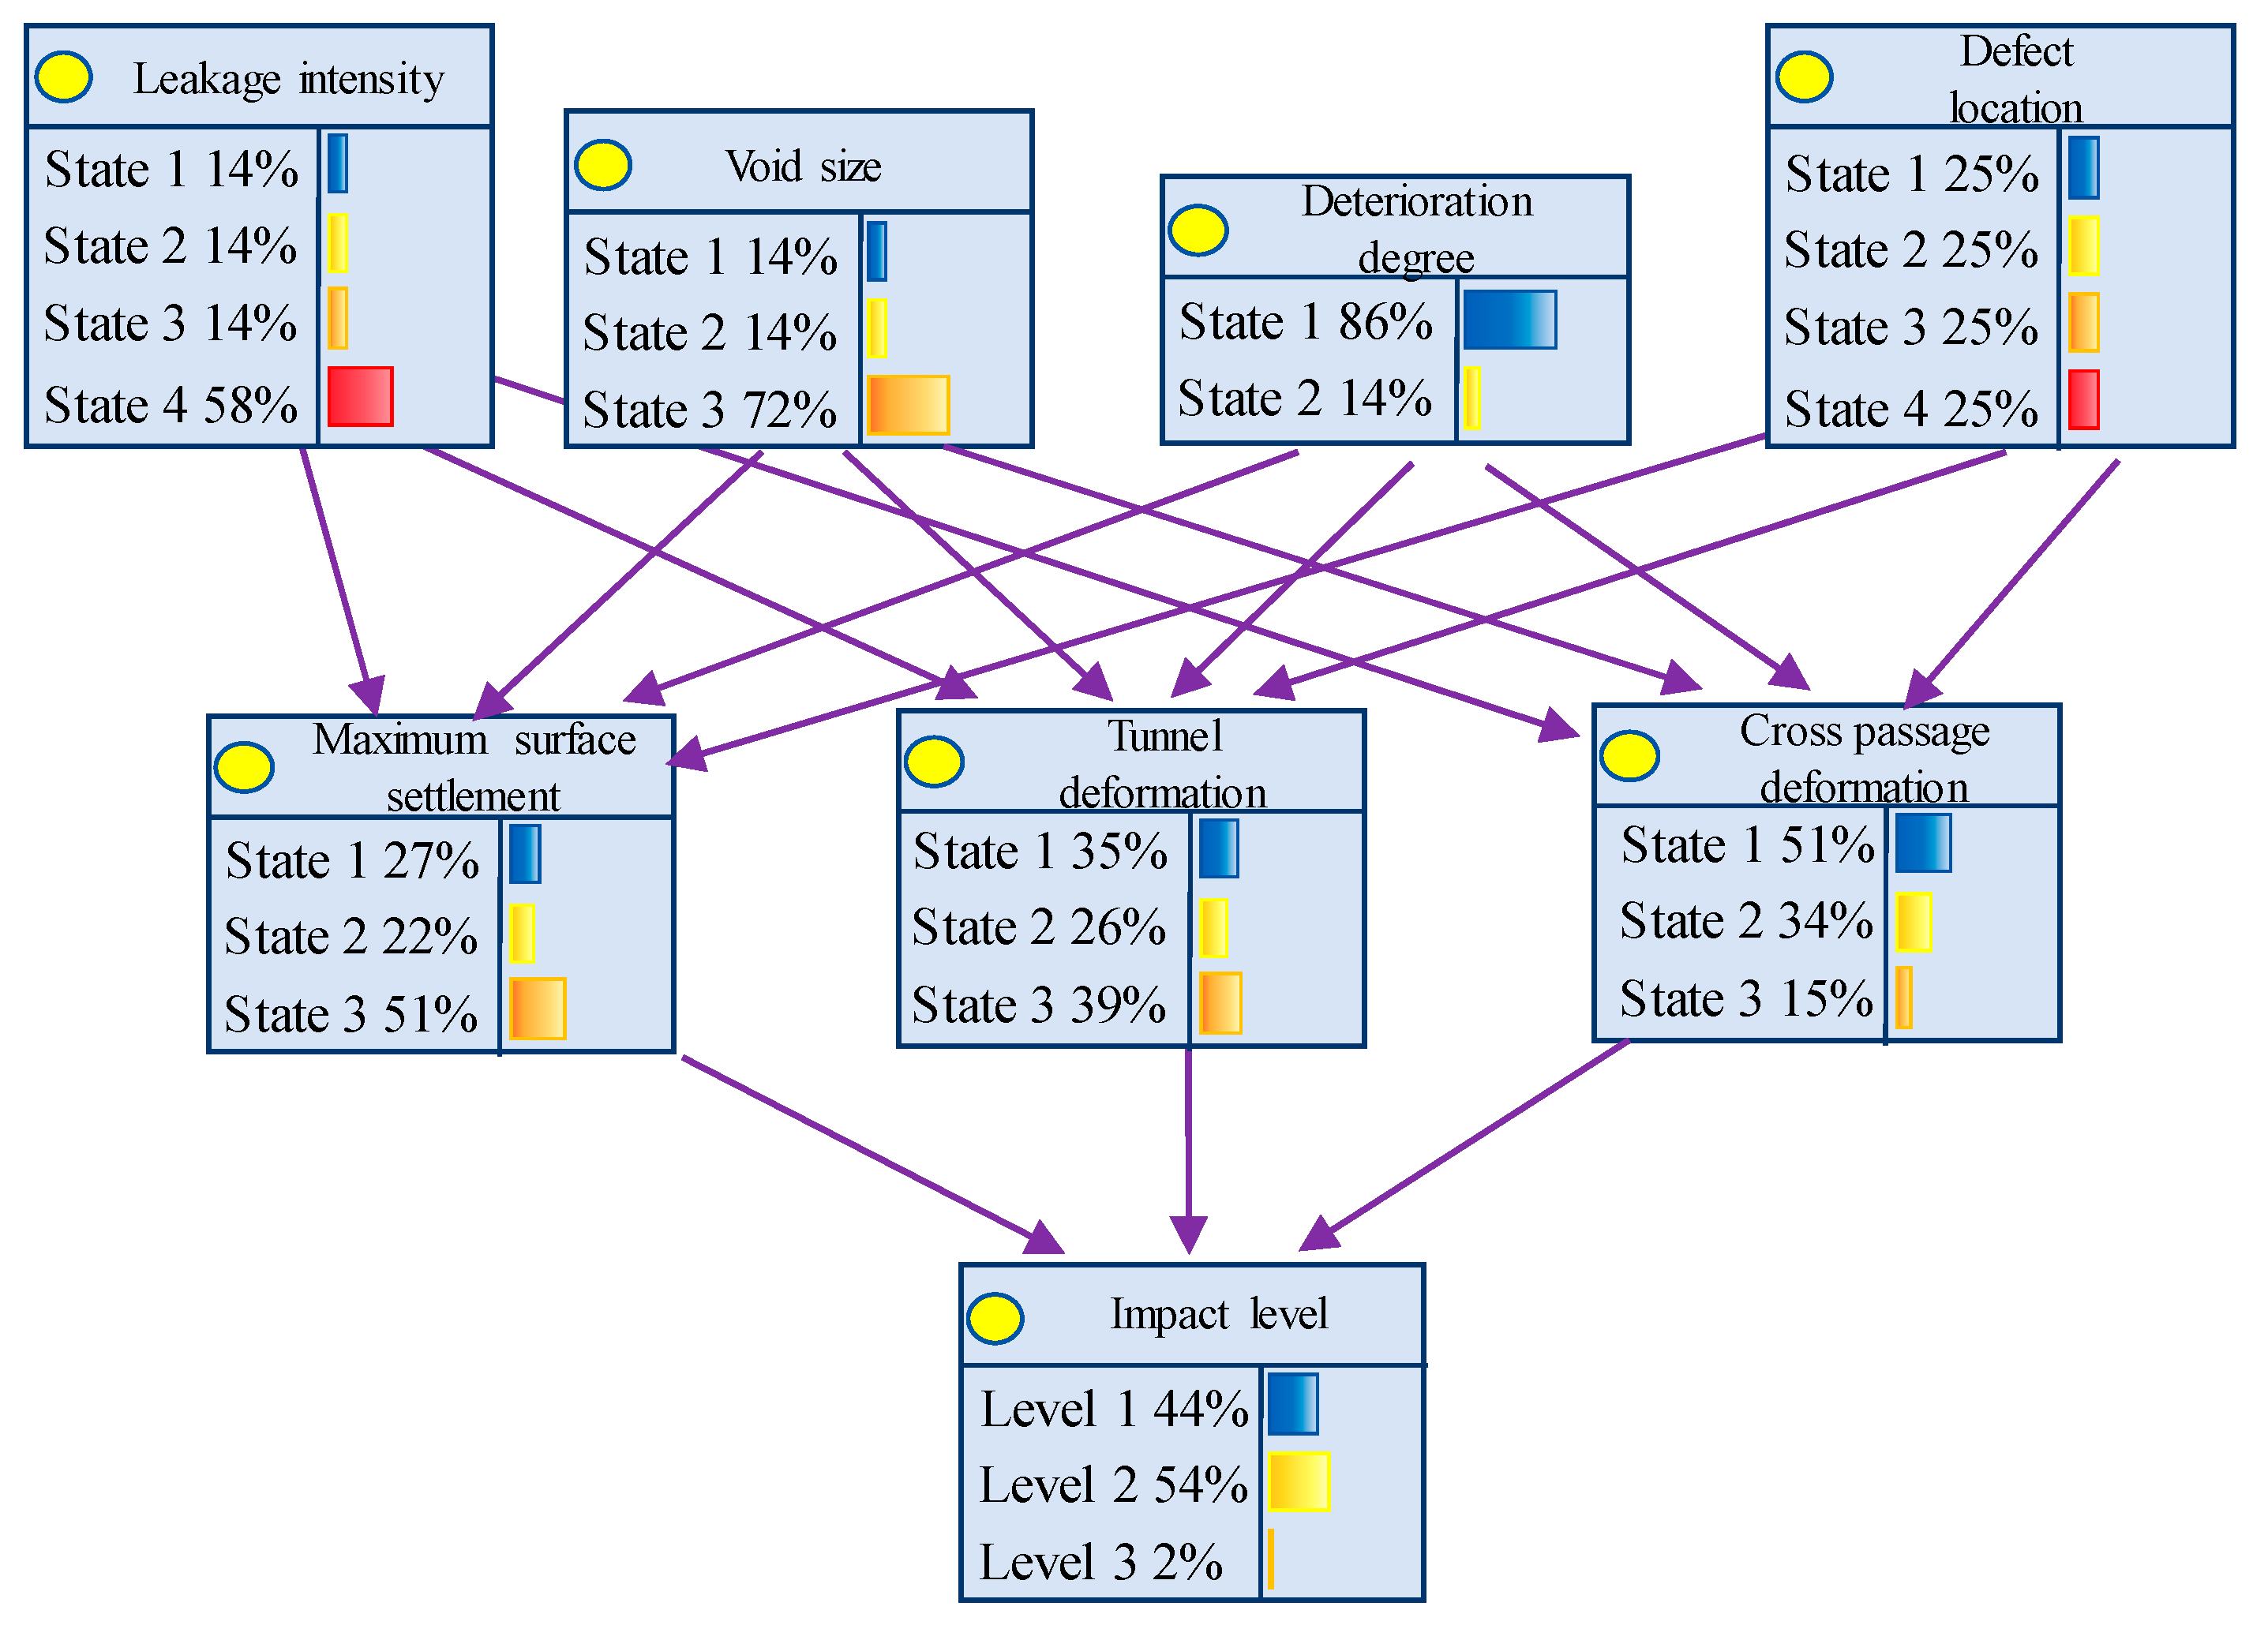
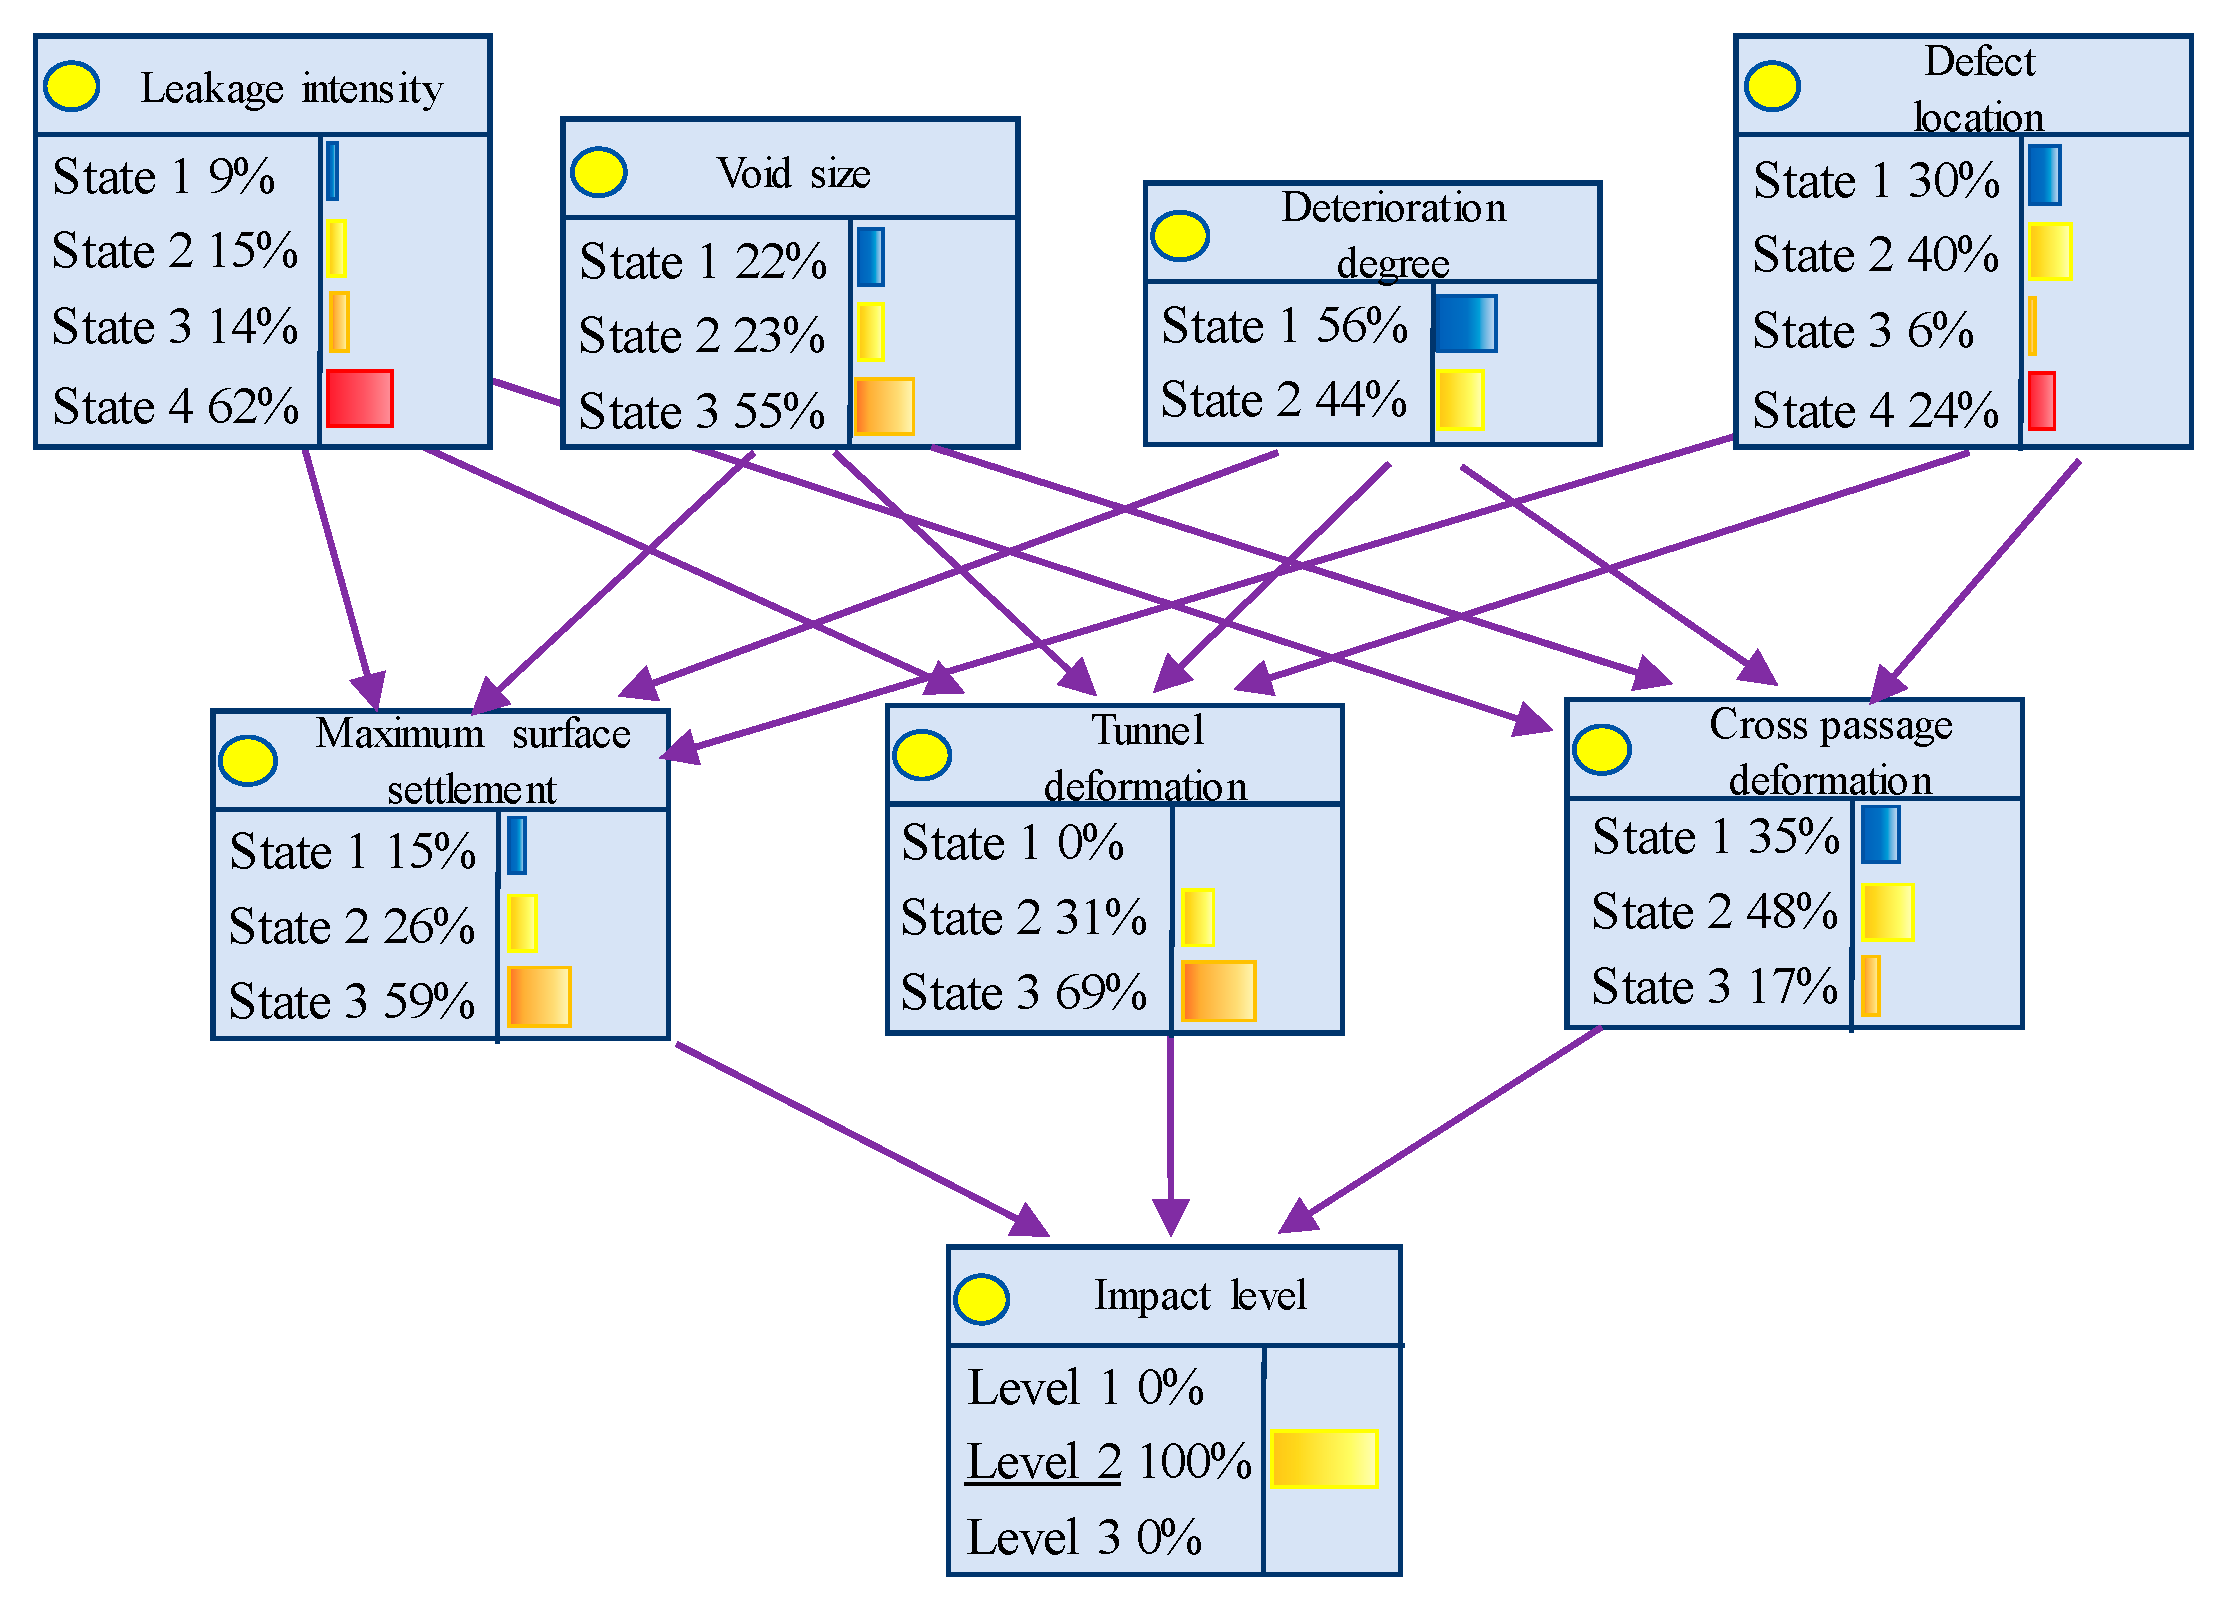
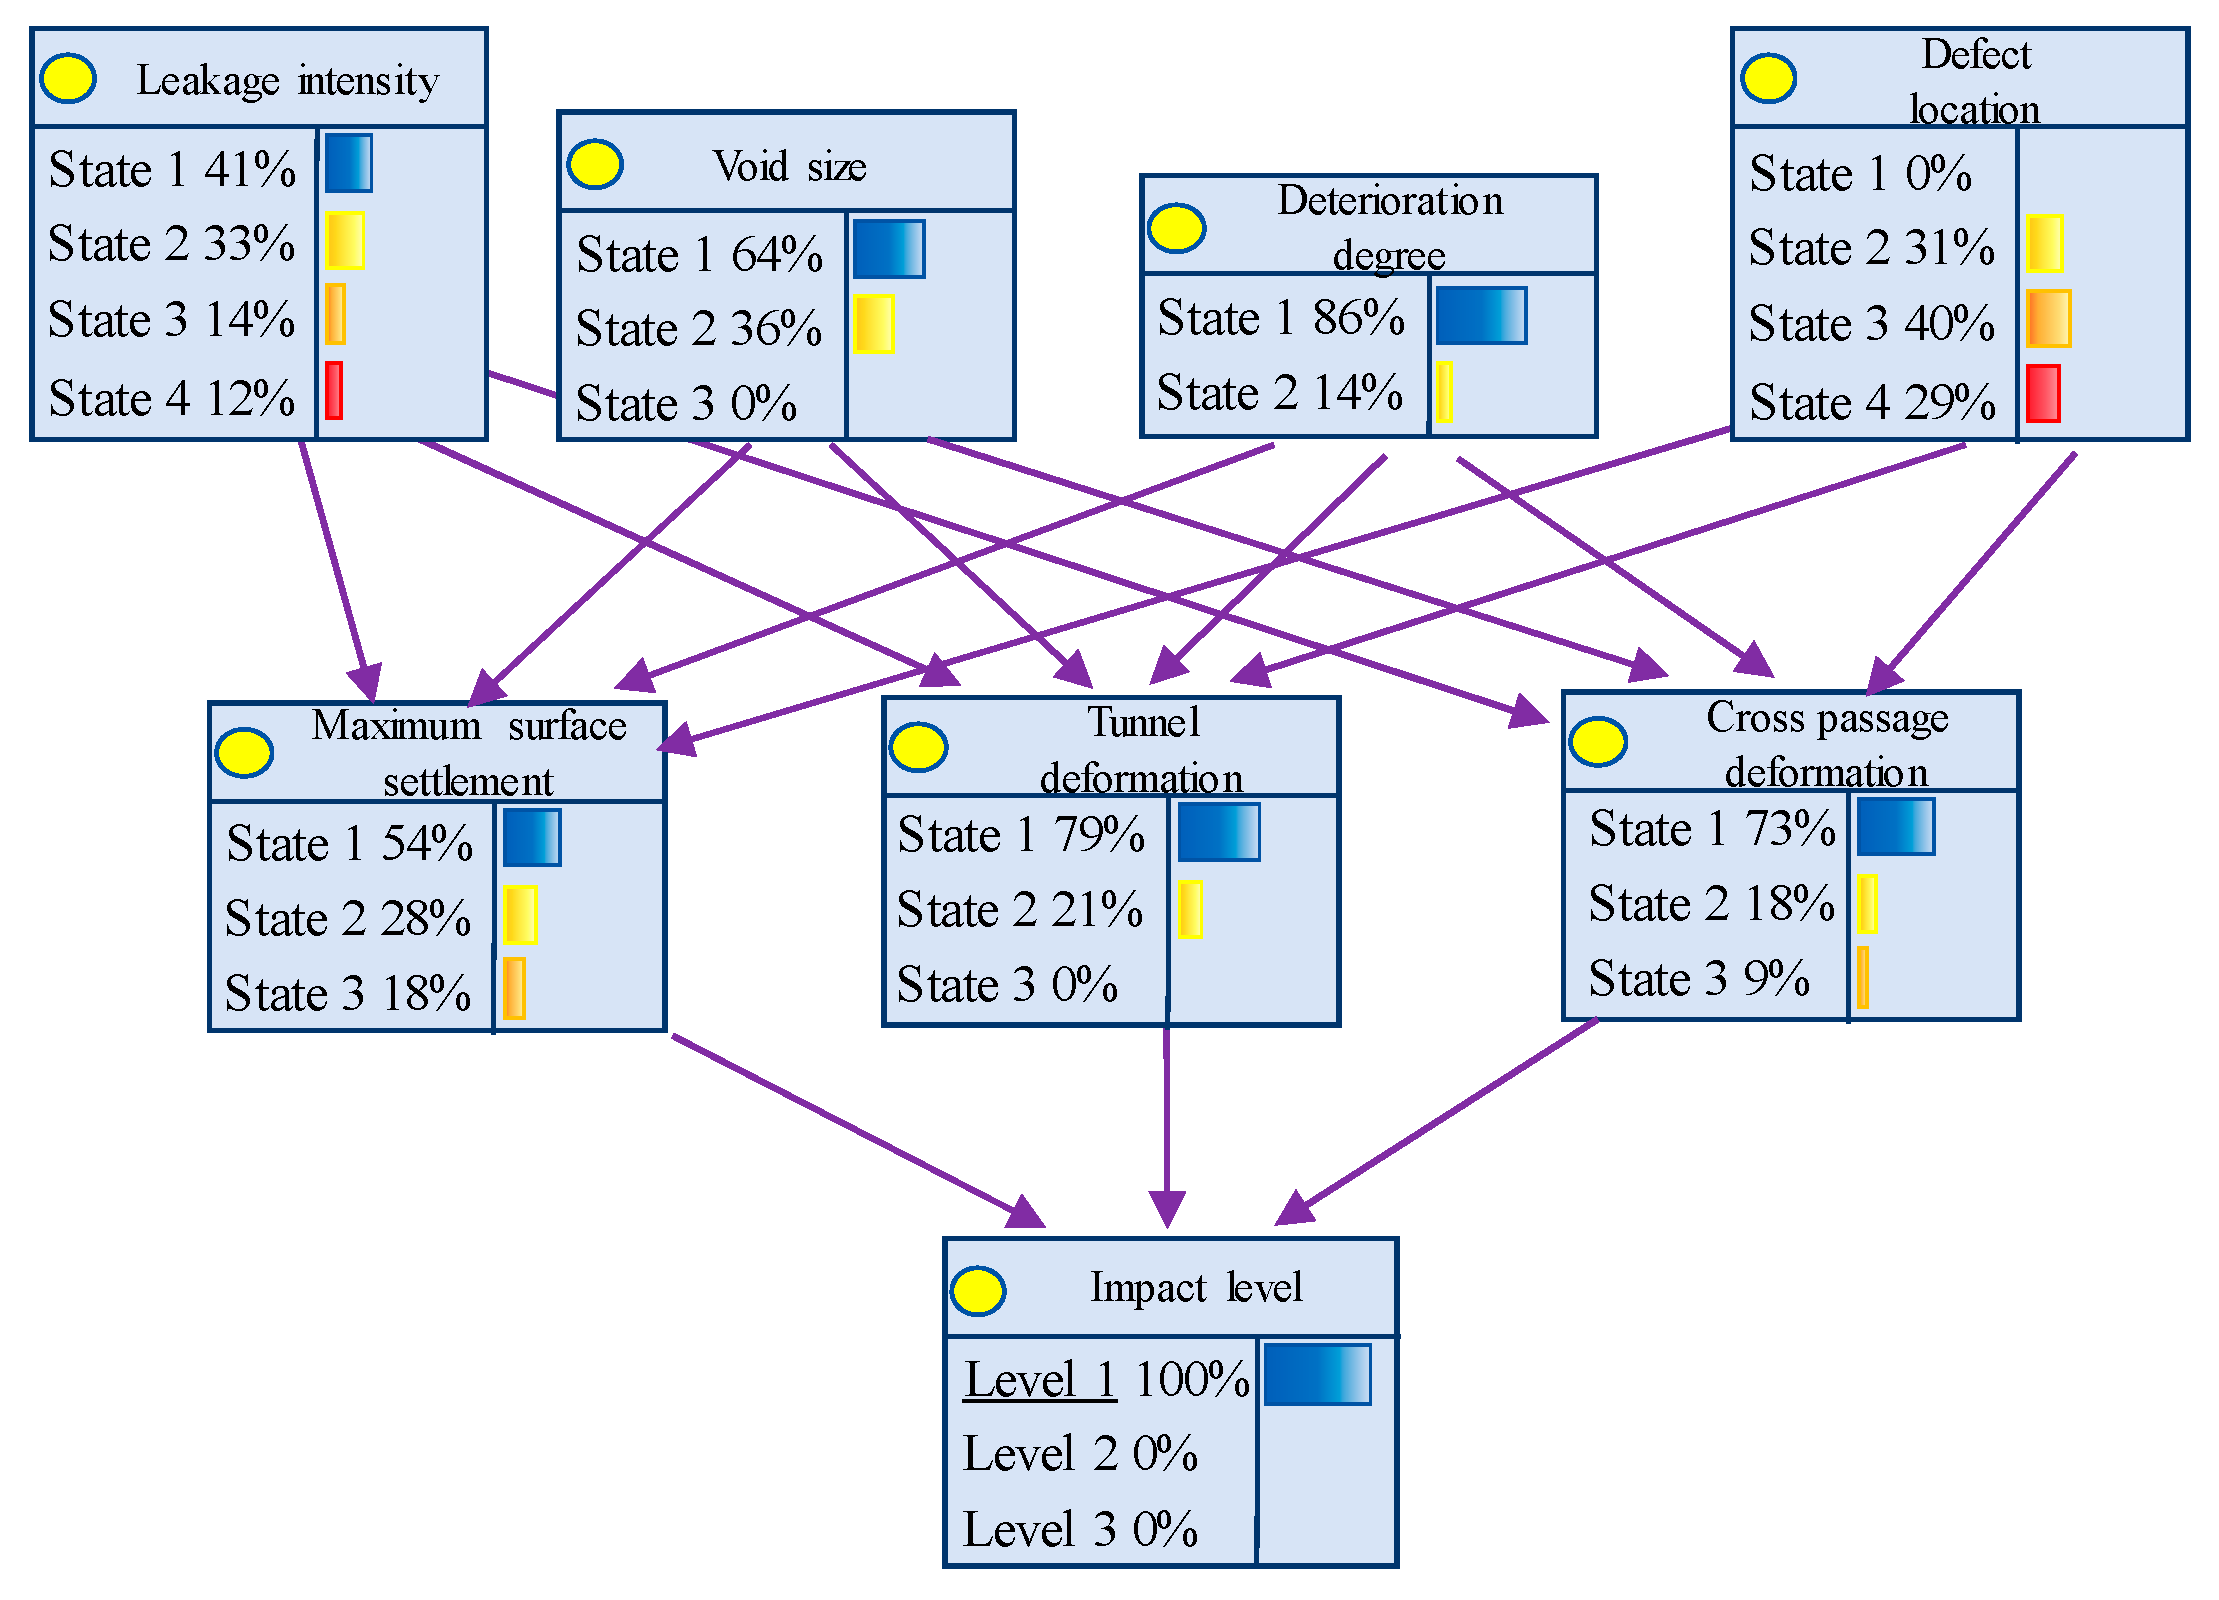
5.3. Safety Risk Prediction for Shield Tunnels and Connecting Passages

When conducting safety inspections for shield tunnels and cross passages, if information on existing defects and structural monitoring data are acquired, inputting risk factors as prior knowledge into the Bayesian network model enables the derivation of probability distributions for corresponding influence levels, as demonstrated in Table 6, thereby facilitating the proactive formulation of preventive measures.
When the leakage intensity is damp stains, void size is 1 m, deterioration level is 80%, and defect location is at the left tunnel crown, the probability of safety influence level being Grade 1 reaches 90%, indicating that defects under this condition exert minimal impact on the safety of shield tunnels and cross passages, with partial risk indicators remaining within specified safety limits, thereby obviating the need for stringent risk mitigation measures. Conversely, when leakage intensity is a linear flow with a void size of 1.5 m, deterioration level of 60%, and defect location at the cross passage crown, or when leakage intensity is a dripping flow with a void size of 2 m, deterioration level of 80%, and defect location at the pump room sidewall, the probability of safety influence level reaching Grade 3 peaks at 57% and 74%, respectively, under these two working conditions. Consequently, it can be concluded that defects under these scenarios significantly compromise structural safety, necessitating targeted preventive measures and enhanced monitoring protocols.
Based on the Bayesian network model established in this study, further analysis reveals that when multiple defects co-occur in shield tunnels and connecting passages, void size and defect location exhibit particularly significant effects on structural safety. Specifically, when the void size reaches 1.5 m and the defect location is at the pump room sidewall, the impact level is highly likely to reach the maximum risk grade. In such scenarios, enhanced monitoring and targeted mitigation measures must be implemented promptly to control the progression of structural defects and ensure operational safety. Compared to traditional safety assessment methods, the core advantages of Bayesian networks in the tunnel engineering domain lie in their probabilistic uncertainty management and dynamic data integration capabilities, which enable intuitive quantification of multi-defect coupling risks (e.g., leakage, voids, and material degradation) and reveal causal chains. Additionally, they support real-time updates to adapt to operational environmental changes. The model exhibits strong scalability, as its modular structure and parameter flexibility allow rapid adaptation to diverse metro systems. By adjusting risk factor definitions (e.g., stratum permeability, structural types) and calibrating conditional probabilities, the framework can adapt to complex conditions such as soft soil, rock strata, or high groundwater levels. Combined with cross-system case database accumulation, it facilitates the construction of a universal risk assessment framework, significantly improving lifecycle risk prediction efficiency and providing a unified tool foundation for intelligent maintenance of global metro networks.

6. Conclusions

Based on the engineering case of defects in the Anhuaqiao-Andeli North Street section of Beijing Metro Line 8, this paper summarizes the defect conditions in shield tunnel sections and connecting passages, investigates their causes and mechanisms, and reveals the ground deformation patterns and mechanical characteristics of segment structures under coupled multi-defect interactions in tunnels with connecting passages and pump room structures through numerical simulations. Finally, based on extensive numerical simulation results under various working conditions, a Bayesian network model is established to predict defect risks in shield tunnels and connecting passages. The specific research conclusions are as follows:
(1)
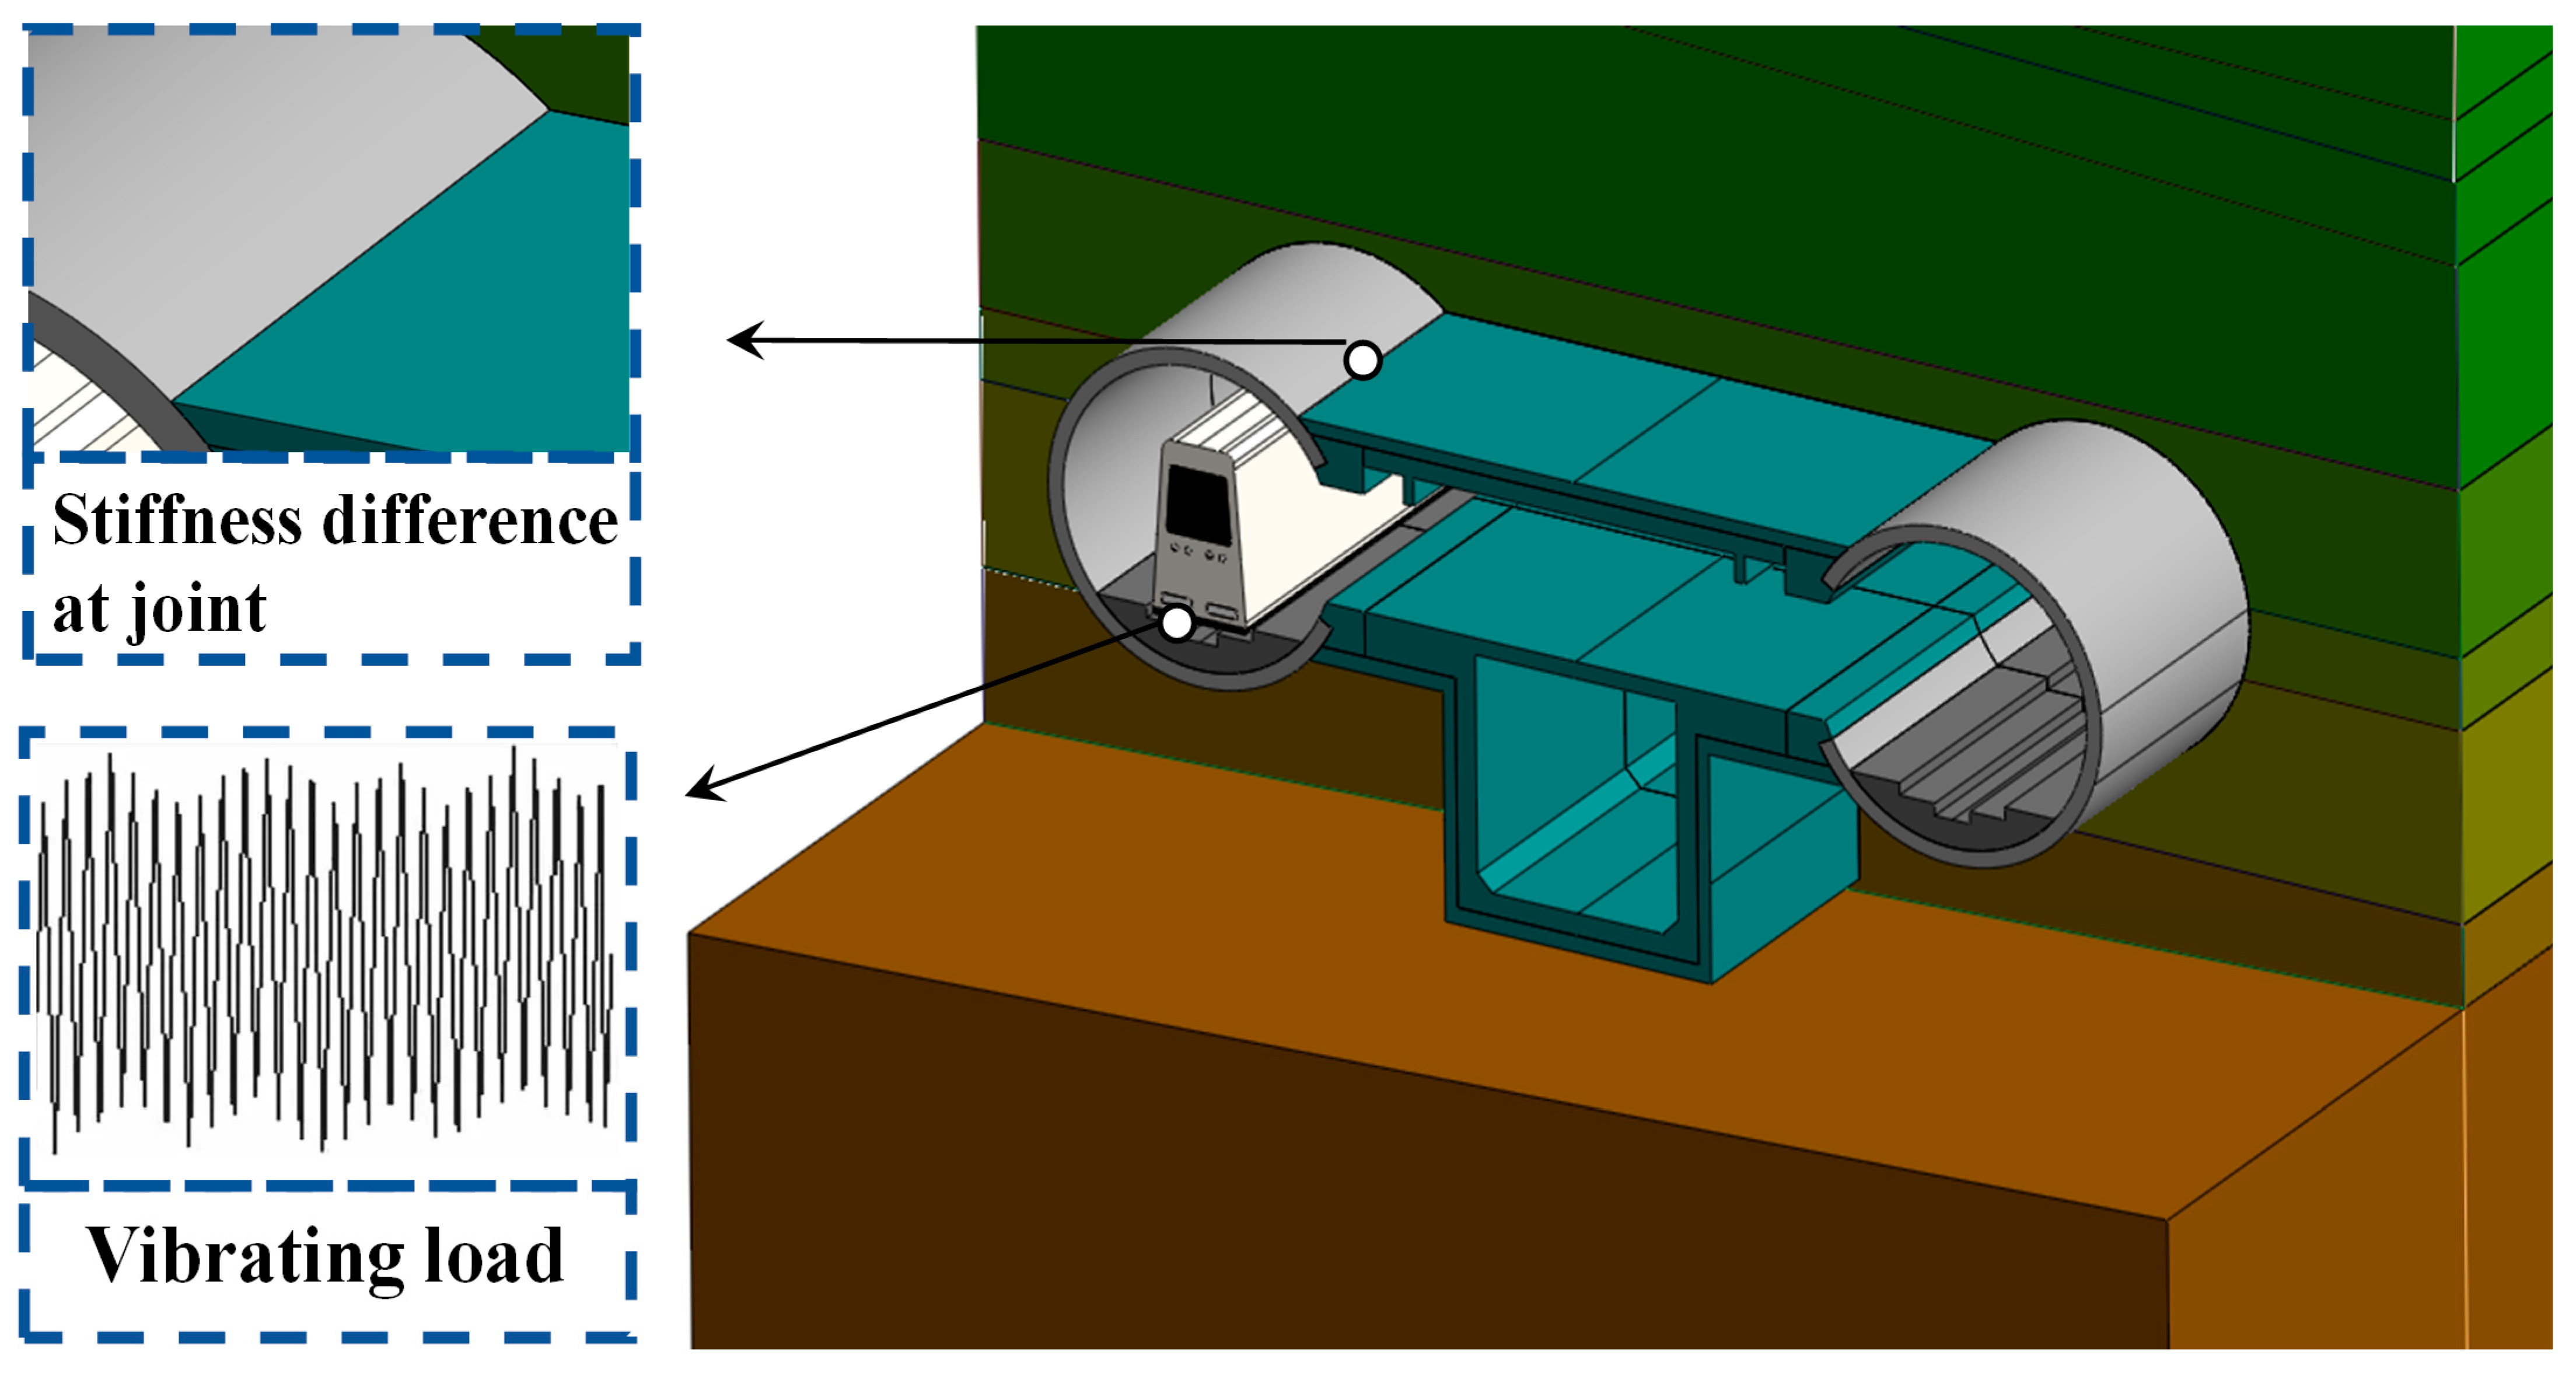
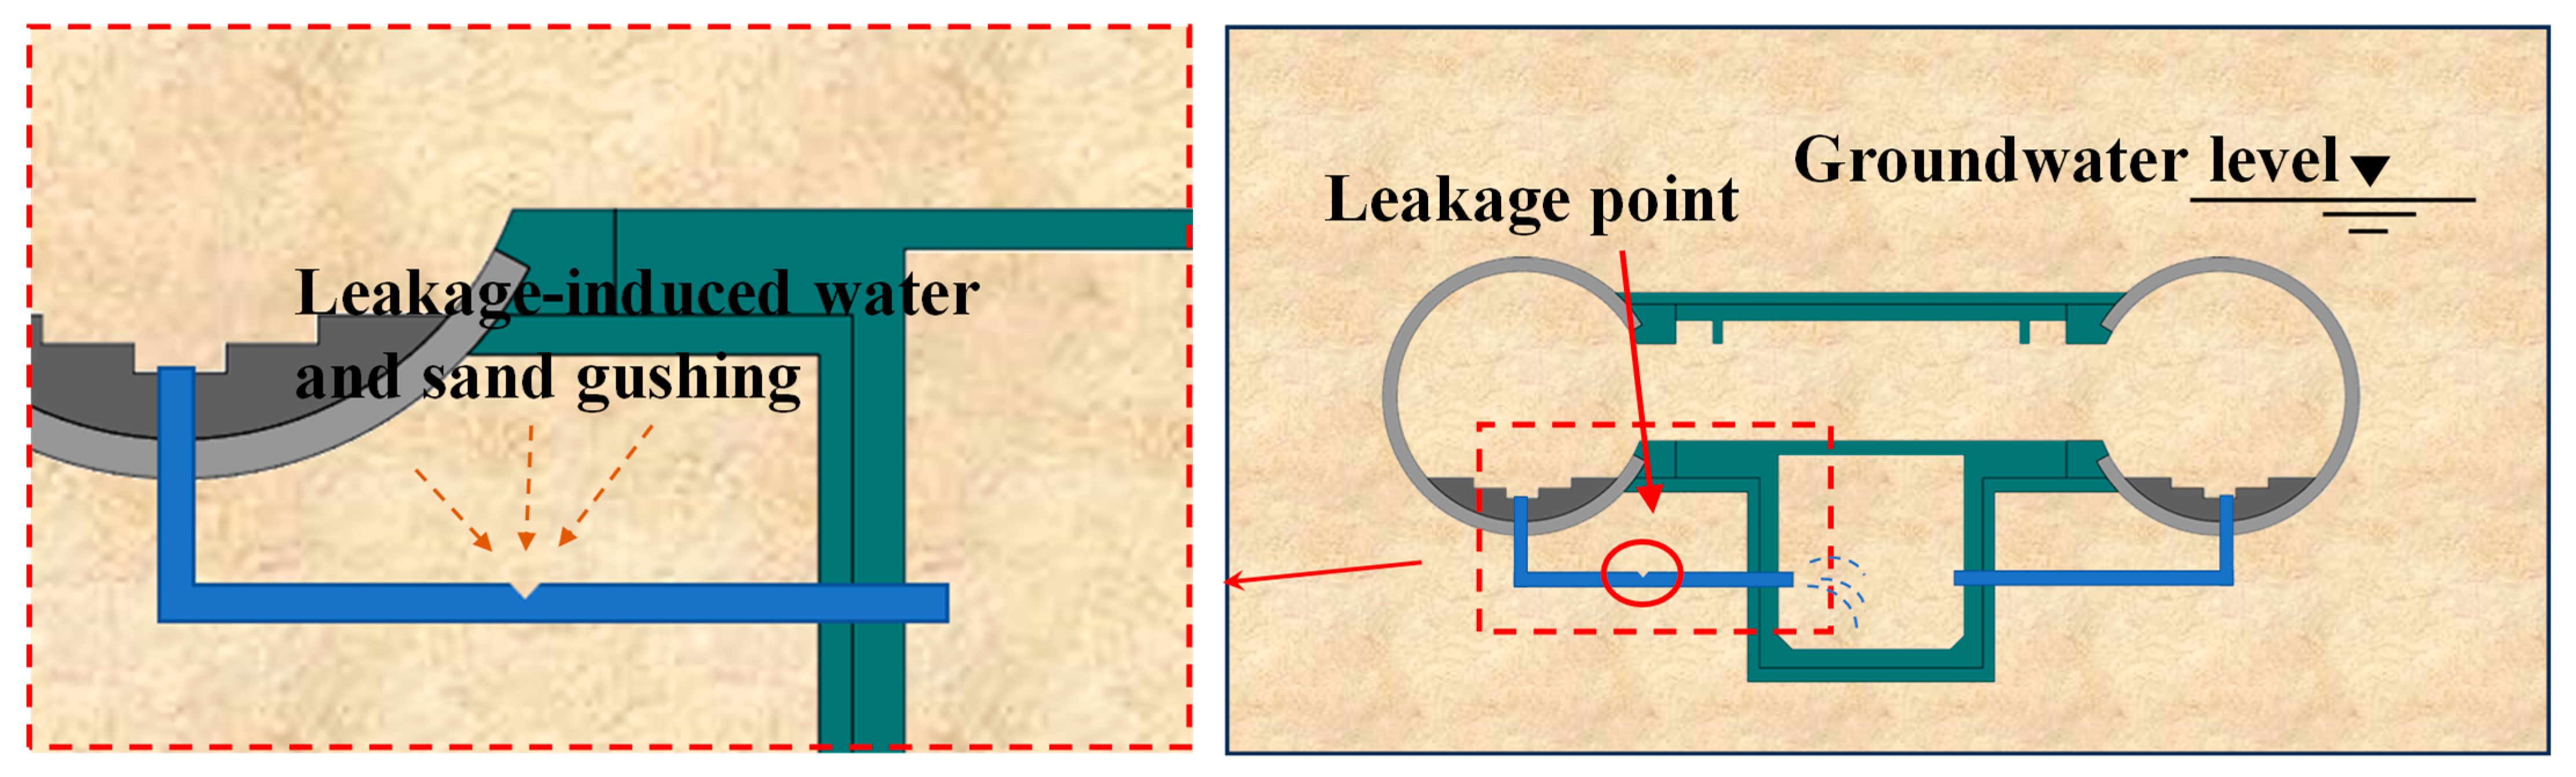
Statistical analysis indicates that the primary potential hazards in the section include leakage caused by missing drainage pipes in the pump room of the connecting passage located in the middle section, as well as partial leakage in the lower-layer foundational concrete structure of the track bed, voids, and tunnel deformation. Through comprehensive analysis, the core factors contributing to structural defects are non-uniform deformation at segment joints and train vibration effects. The rise in groundwater levels forming water-rich zones serves as the primary source of tunnel defects, and the deterioration of structural defects exacerbates structural damage.
(2)
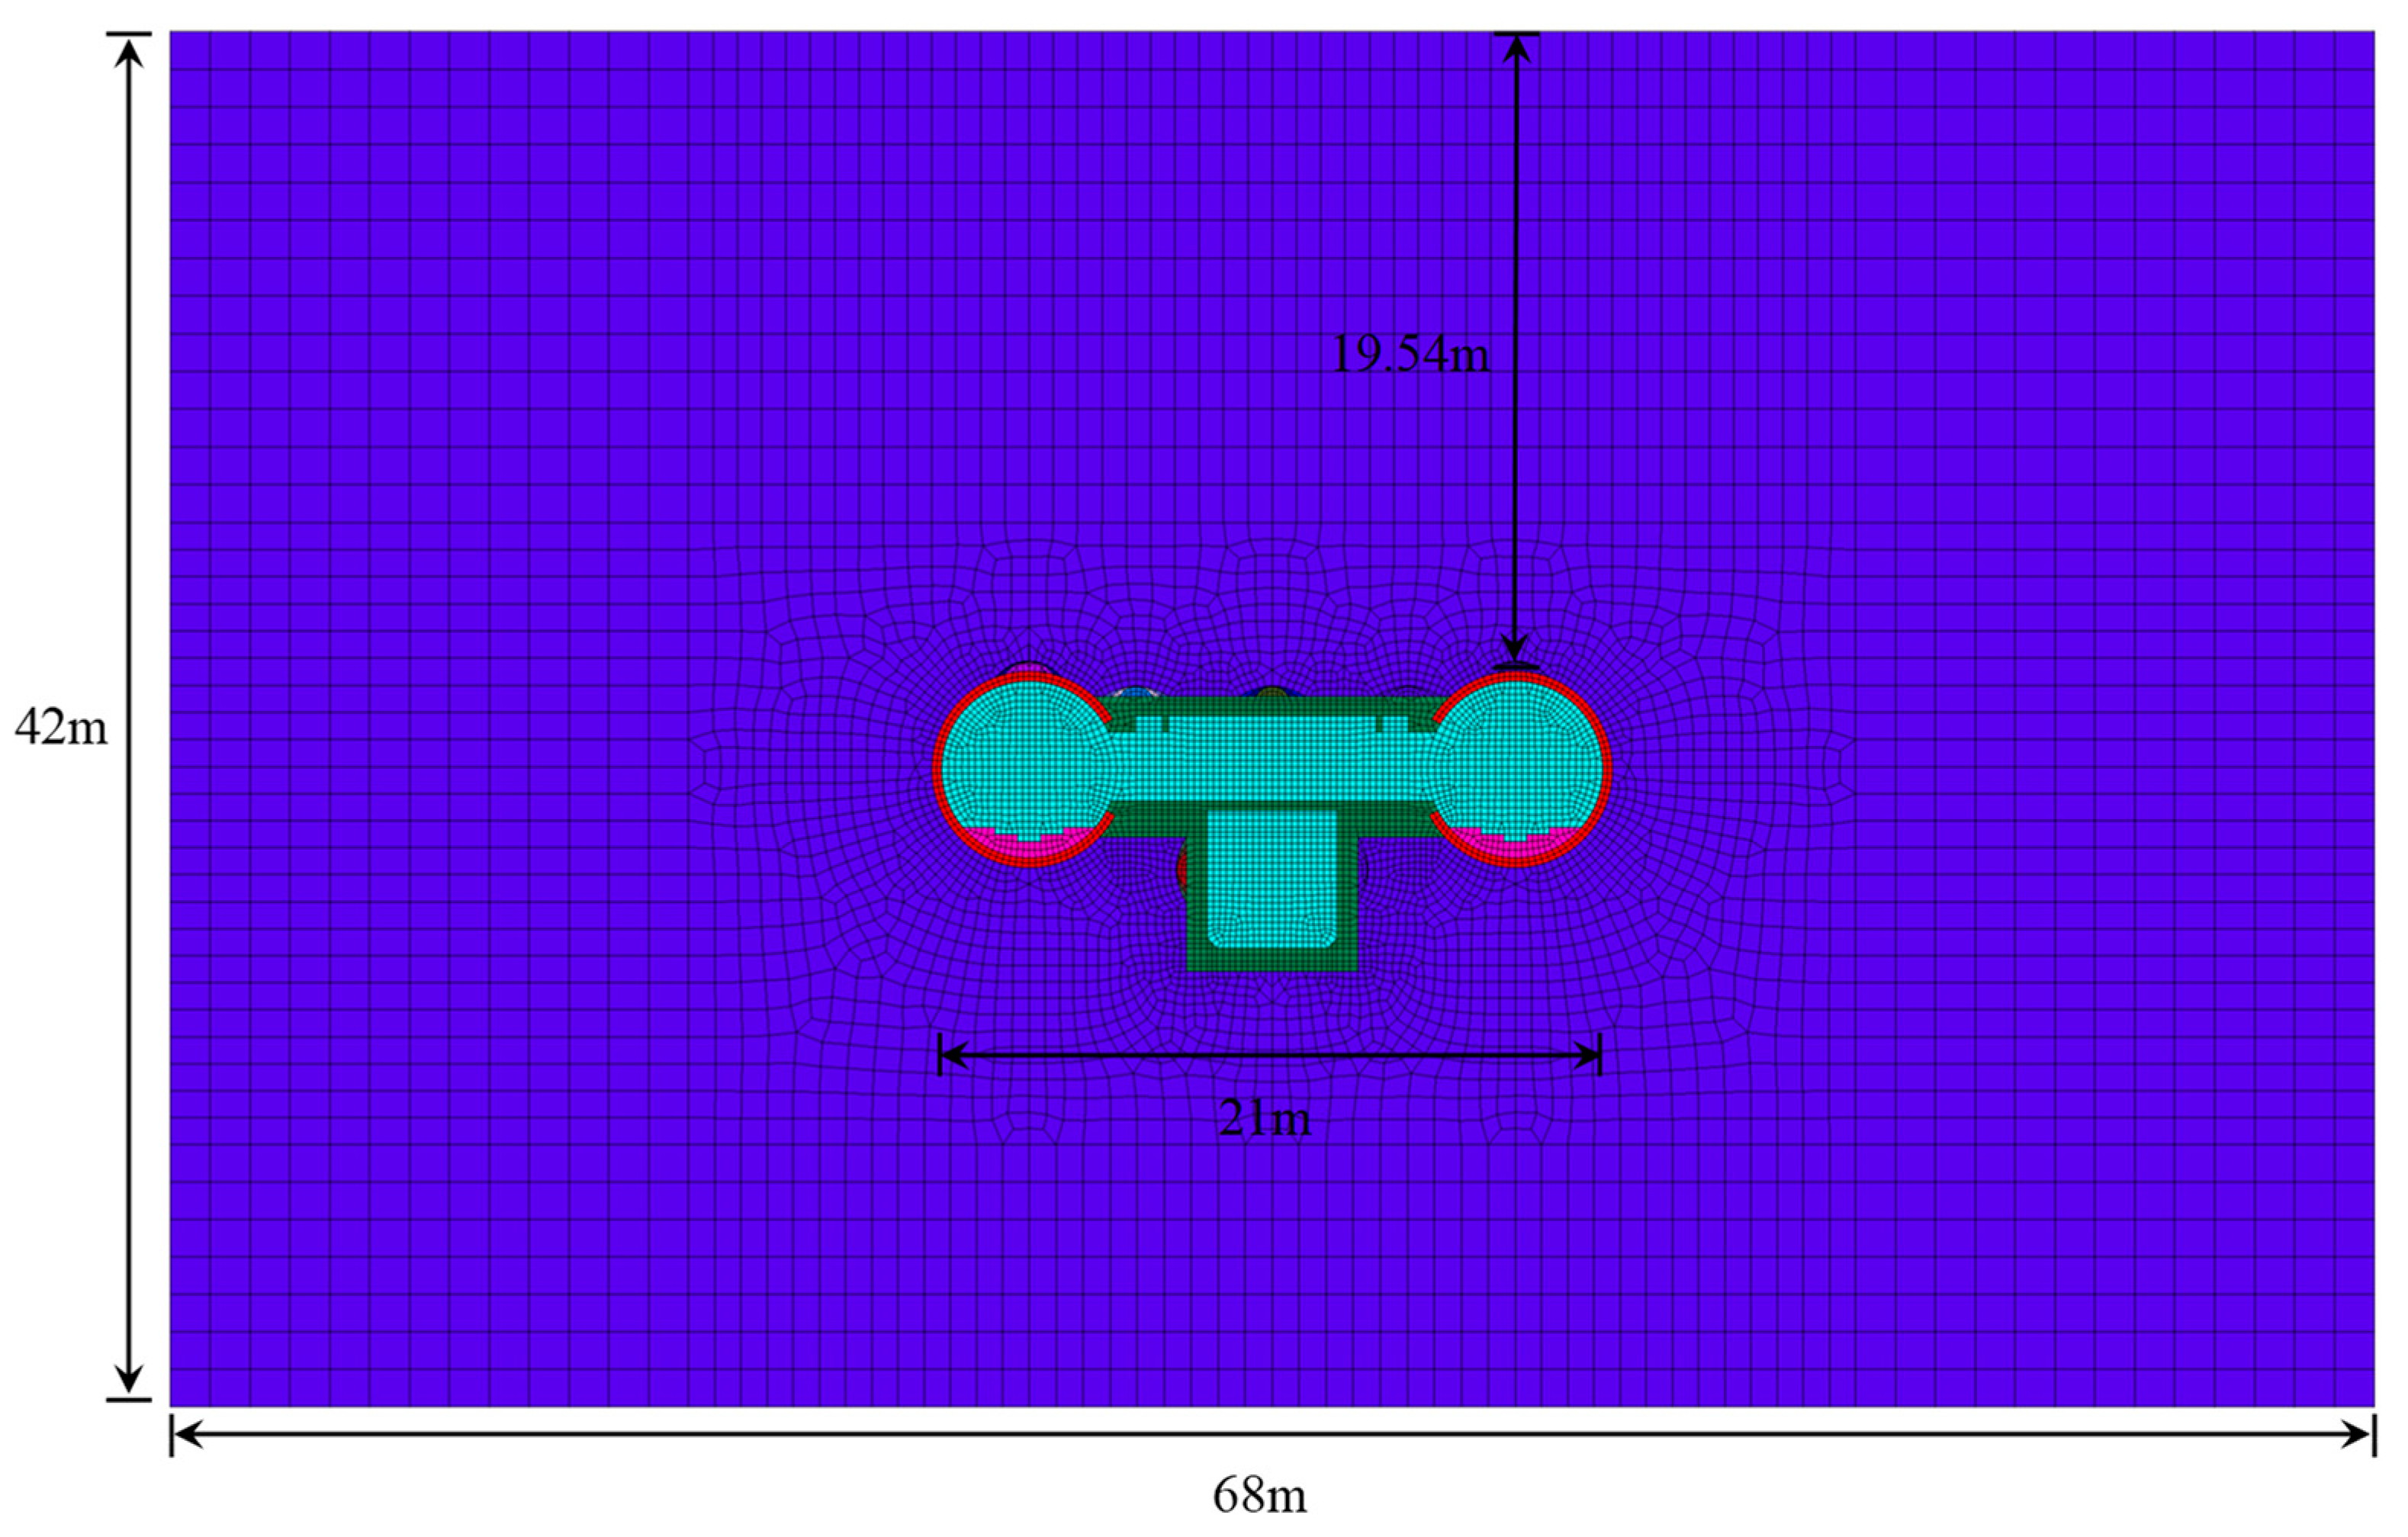
Numerical simulations were conducted to investigate the impacts of multi-defect coupling effects on shield tunnels and connecting passages. The results demonstrate that when structural defects are closer to the bottom, the dissipation values of pore water pressure in the stratum near leakage areas increase, the volume of affected soil expands, and cumulative surface settlement values escalate, leading to more pronounced ground and structural deformations. Peak principal stresses and the most significant stress variations occur at the connection zones between twin tunnels and the connecting passage, indicating that special attention should be paid to stress states at these locations during defect prevention and control.
(3)
Under multi-defect coupling conditions, void size variations exert the most significant influence on structural stress states. Due to the loss of surrounding rock constraints in lining void areas, the lining exhibits compressive deformation toward void cavities in both longitudinal and circumferential directions, with deformation trends becoming more pronounced as void sizes increase. Larger voids notably widen and deepen surface settlement troughs.
(4)
The established Bayesian network model enables safety risk diagnosis for existing defects. Analysis reveals that structural safety negatively correlates with leakage degree, void size, deterioration level, and burial depth of defect locations. Void size emerges as a critical influencing factor for safety, where increased void dimensions elevate safety risks, necessitating timely monitoring and protective measures.
This study primarily investigates the causes of defects and multi-defect coupling effects in the Anhuaqiao-Andeli North Street section of Beijing Metro Line 8, proposing preliminary measures for metro structural defect management. Future research should focus on evaluating the effectiveness, feasibility, and durability of various defect remediation strategies.

Author Contributions

Conceptualization, X.N., H.X. and W.L.; Formal analysis, H.X.; Methodology, X.N.; Software, H.X.; Supervision, Z.X.; Validation, H.X.; Visualization, W.S.; Writing—original draft, X.N.; Writing—review and editing, H.X. and W.L. All authors have read and agreed to the published version of the manuscript.

Funding

This research was funded by “Jie Bang Gua Shuai” Technology Project of Beijing Construction Engineering Group (No. RGGA500620230001).

Data Availability Statement

The data presented in this study are available on request from the corresponding author due to privacy and property rights issues.

Conflicts of Interest

The authors declare no conflicts of interest.

References

  1. Liu, X.; Sun, Q.H. Analysis of progressive collapse characteristics of shield tunnels. Tunn. Constr. 2021, 41, 913–922. [Google Scholar]
  2. Liu, Y.J. Research on Structural Safety and Dynamic Characteristics of Beijing Metro Shield Tunnels Under Defect Conditions. Master’s Thesis, Beijing Jiaotong University, Beijing, China, 2019. [Google Scholar]
  3. Guo, Y.X. Study on treatment methods for segment damage and defects in shield tunnels. Mod. Urban Transit 2020, 5, 55–60. [Google Scholar]
  4. Huang, J.; Zhang, D.L.; Liang, W.H.; Dong, F.; Li, A.; Zhao, G.; Yang, K.; Niu, X.K. Review of safety control technologies for tunnel structures during service period. Railw. Stand. Des. 2024, 68, 1–19. [Google Scholar]
  5. Dong, F.; Fang, Q.; Zhang, D.L. Analysis of defect conditions in Beijing Metro operational tunnels. China Civ. Eng. J. 2017, 50, 104–113. [Google Scholar]
  6. Ministry of Railways Maintenance Bureau. Railway Maintenance Technical Manual (Tunnels); China Railway Publishing House: Beijing, China, 1997. [Google Scholar]
  7. Asakura, T.; Kojima, Y. Tunnel maintenance in Japan. Tunn. Undergr. Space Technol. 2003, 18, 161–169. [Google Scholar] [CrossRef]
  8. Lee, W.F.; Ishihara, K. Piping failure of a metro tunnel construction. In Proceedings of the International Conference on Forensic Geotechnical Engineering, Mumbai, India, 10–12 December 2015; Springer: New Delhi, India, 2016; pp. 123–140. [Google Scholar]
  9. Huang, C.; Chen, W.J.; Su, D.; Lei, G.P. Review on causes of subway tunnel structural defects and fault tree models. Mod. Tunn. Technol. 2020, 57, 264–272. [Google Scholar]
  10. Zhang, Z.G.; Mao, M.D.; Pan, Y.T.; Zhang, M.; Ma, S.; Cheng, Z.; Wu, Z. Experimental study for joint leakage process of tunnel lining and particle flow numerical simulation. Eng. Fail. Anal. 2022, 141, 106715. [Google Scholar] [CrossRef]
  11. Wu, C.X.; Wang, M.W.; Zeng, R.K.; Li, Y.L.; Lu, P.; Zhang, Y.L. Zoning of surrounding rock settlement during joint leakage of underwater shallow-buried shield tunnels. Railw. Eng. 2023, 63, 94–98. [Google Scholar]
  12. Li, R.; Lei, H.; Ma, C.; Liu, Y.; Liu, N. The development of sand erosion induced by shield-tunnel joint leakage. Eng. Fail. Anal. 2023, 153, 107560. [Google Scholar] [CrossRef]
  13. Liu, Y.K.; Wu, Y.; Li, W.H.; Zhang, Q.-S.; Liu, R.T.; Bai, J.-W. Development of a water leakage model test system and investigation of the water leakage behavior in subsea shield tunnels during operation. Measurement 2024, 233, 114723. [Google Scholar] [CrossRef]
  14. Zhang, C.P.; Feng, G.; Zhang, X.; Han, K.H.; Zhang, D.L. Safety state analysis of tunnel structures under the influence of dual voids behind linings. Chin. J. Geotech. Eng. 2015, 37, 487–493. [Google Scholar]
  15. Ding, Z.D.; Ji, X.F.; Li, X.Q.; Ren, Z.; Zhang, S. Influence of symmetric and asymmetric voids on mechanical behaviors of tunnel linings: Model tests and numerical simulations. Symmetry 2019, 11, 774. [Google Scholar] [CrossRef]
  16. Wang, S.H.; Wang, P.Y.; Liu, Y.; Zhu, B.Q. Experimental study on failure modes of tunnels under void conditions at different locations. J. Northeast. Univ. (Nat. Sci.) 2020, 41, 863–869. [Google Scholar]
  17. Shi, Y.; Chen, Z.; Wei, D.; Zhang, T.; Zhou, X.; Zhao, X.; Hu, J.; Zhou, Y. Analysis of structural response of subway shield tunnel lining under the influence of cavities. Adv. Civ. Eng. 2021, 2021, 6682283. [Google Scholar] [CrossRef]
  18. Li, F.H.; Li, R.; Jiang, Y.L.; Gao, H.; Wang, Y.B.; Wang, P.X. Experimental study on the influence of void grouting behind secondary lining with formwork on lining mechanical behavior. Mod. Tunn. Technol. 2021, 58, 147–158. [Google Scholar]
  19. Li, J.C.; Wang, Z.Y.; Tan, Y.; Cao, Y.-C. Failure evolution and mechanism of ground collapse due to exfiltration of shallowly buried water pipeline. Eng. Fail. Anal. 2024, 162, 108342. [Google Scholar] [CrossRef]
  20. Li, Y.; Yu, G.; He, L.; Cui, Y. Microscopic investigation of the occurring process of contact erosion. Soils Found. 2025, 65, 101234. [Google Scholar] [CrossRef]
  21. Liang, Y.N.; Yuan, Y.S. Effects of sulfate erosion environmental factors on concrete performance degradation. J. China Univ. Min. Technol. 2005, 34, 452–457. [Google Scholar]
  22. Nie, L.; Xu, J.; Bai, E. Dynamic stress-strain relationship of concrete subjected to chloride and sulfate attack. Constr. Build. Mater. 2018, 165, 232–240. [Google Scholar] [CrossRef]
  23. Rusati, P.K.; Song, K.I. Magnesium chloride and sulfate attacks on gravel-sand-cement inorganic binder mixture. Constr. Build. Mater. 2018, 187, 565–571. [Google Scholar] [CrossRef]
  24. Wang, H.; Huang, X.; Jin, G.L. Evolution of physical and mechanical properties of concrete specimens under acid corrosion. Hazard Control Tunn. Undergr. Eng. 2023, 5, 57–64. [Google Scholar]
  25. Cao, S.Y.; Zhu, B.L. Properties of corroded concrete and reinforced concrete. J. Tongji Univ. 1990, 18, 239–242. [Google Scholar]
  26. Rahman, M.M.; Bassuoni, M.T. Thaumasite sulfate attack on concrete: Mechanisms, influential factors and mitigation. Constr. Build. Mater. 2014, 73, 652–662. [Google Scholar] [CrossRef]
  27. Shin, J.H.; Kim, S.H.; Shin, Y.S. Long-term mechanical and hydraulic interaction and leakage evaluation of segmented tunnels. Soils Found. 2012, 52, 38–48. [Google Scholar] [CrossRef]
  28. Zhang, D.M.; Ma, L.X.; Zhang, J.; Hicher, P.; Juang, C. Ground and tunnel responses induced by partial leakage in saturated clay with anisotropic permeability. Eng. Geol. 2015, 189, 104–115. [Google Scholar] [CrossRef]
  29. Wu, H.N.; Shen, S.L.; Chen, R.P.; Zhou, A. Three-dimensional numerical modelling on localized leakage in segmental lining of shield tunnels. Comput. Geotech. 2020, 122, 103549. [Google Scholar] [CrossRef]
  30. Li, Q.T. Numerical simulation and analysis of structural defects in soft soil metro shield tunnels. Railw. Stand. Des. 2021, 65, 95–103. [Google Scholar]
  31. Zhang, X. Study on the Influence of Joint Leakage and Soil Permeability Anisotropy on Shield Tunnel Seepage. Ph.D. Thesis, Zhejiang University, Hangzhou, China, 2022. [Google Scholar]
  32. Gong, C.; Wang, Y.; Peng, Y.H.; Ding, W.; Lei, M.; Da, Z.; Shi, C. Three-dimensional coupled hydromechanical analysis of localized joint leakage in segmental tunnel linings. Tunn. Undergr. Space Technol. 2022, 130, 104742. [Google Scholar] [CrossRef]
  33. Liu, Y.J.; Yang, J.; Yin, Z.Y. Numerical analysis of the impact of internal erosion on underground structures: Application to tunnel leakage. Rock Soil Mech. 2022, 43, 1383–1390. [Google Scholar]
  34. Zhang, X.; Zhou, J.; Jiang, Y.C.; Horris, K.N. Numerical simulation of the influence of joint leakage and soil permeability anisotropy on shield tunnel seepage. J. Cent. South Univ. (Nat. Sci. Ed.) 2023, 54, 1012–1022. [Google Scholar]
  35. Park, D. Numerical investigation on the effect of water leakage on the ground surface settlement and tunnel stability. Tunn. Undergr. Space Technol. 2024, 146, 105621. [Google Scholar] [CrossRef]
  36. Qin, X.; Zhang, G.; Ge, R. Effect of erosion void on segmental tunnel lining: 2D numerical investigation. Transp. Geotech. 2022, 37, 100846. [Google Scholar] [CrossRef]
  37. Ye, Z.J.; Yang, Y.D. Three-dimensional effects of multiple voids behind lining on the mechanical behavior of tunnel structure. Ain Shams Eng. J. 2022, 13, 101732. [Google Scholar] [CrossRef]
  38. Qiao, J.; Sun, Y.; Hu, J.; Zhang, W. Mechanical behavior of secondary lining vault void and mold grouting repair considering contact effect. Structures 2023, 56, 105003. [Google Scholar] [CrossRef]
  39. Wang, D.K.; Luo, J.J.; Wang, G.Q.; Li, F.L.; Hou, Y.J. Dynamic response of heavy-haul railway tunnels under conditions of water-rich surrounding rock and voids at tunnel bottom. J. Harbin Inst. Technol. 2023, 55, 33–42. [Google Scholar]
  40. Zhang, H.Q.; Ding, Z.D.; Yuan, H. Seismic vulnerability study of highway tunnels considering lining thinning and voids. J. Nat. Disasters 2024, 33, 164–174. [Google Scholar]
  41. Tian, C.; Huang, L.; Liang, Y. Longitudinal deformation mechanism of shield tunnels caused by erosion voids in the underlying soil. Tunn. Undergr. Space Technol. 2025, 157, 105890. [Google Scholar] [CrossRef]
  42. Yasuda, N.; Tsukada, K.; Asakura, T. Elastic solutions for circular tunnel with void behind lining. Tunn. Undergr. Space Technol. 2017, 70, 274–285. [Google Scholar] [CrossRef]
  43. Shao, S.; Wu, Y.M.; Fu, H.L. Modified calculation model for internal forces of tunnel vault voids with insufficient thickness based on load-structure method. Mod. Tunn. Technol. 2022, 59, 188–196. [Google Scholar]
  44. Xie, S.L.; Hu, A.F.; Xiao, Z.R.; Wang, M.-H.; Hu, X.-J.; Della Vecchia, G.; Mariani, S. Analysis of two-dimensional consolidation behavior of soils under cyclic loading considering exacerbated tunnel leakage. Comput. Geotech. 2024, 174, 106124. [Google Scholar] [CrossRef]
  45. Luo, T.X.; Zhou, Y.F.; Zheng, Q.Z.; Hou, F.; Lin, C. Lightweight deep learning model for identifying tunnel lining defects based on GPR data. Autom. Constr. 2024, 165, 105506. [Google Scholar] [CrossRef]
  46. Zhou, Z.; Li, S.; Yan, L.; Zhang, J.; Zheng, Y.; Yang, H. Intelligent recognition of tunnel lining defects based on deep learning: Methods, challenges and prospects. Eng. Fail. Anal. 2025, 170, 109332. [Google Scholar] [CrossRef]
  47. Dou, H.; Lv, Y.; Sun, X.; Liu, X.; Li, Z. Research on health evaluation method of single ring segment of subway shield tunnel under multi-defect coupling. Railw. Stand. Des. 2025, 69, 11–19. [Google Scholar]
  48. Fu, S. Research on the Evaluation of Safety Status of Tube Sheet Structure of Metro Shield Tunnel. Master’s Thesis, Xi’an University of Architecture and Technology, Xi’an, China, 2024. [Google Scholar]
  49. Tu, S.Q.; Li, W.; Zhang, C.P.; Liu, T.X.; Wang, L.B.; Jin, Z.X. Model test and discrete element method simulation of tunnel face stability in sand-gravel inclined layered stratum. Comput. Geotech. 2024, 172, 106456. [Google Scholar] [CrossRef]
  50. Tu, S.Q.; Li, W.; Zhang, C.P.; Chen, W. Effect of inclined layered soils on face stability in shield tunneling based on limit analysis. Tunn. Undergr. Space Technol. 2023, 131, 104773. [Google Scholar] [CrossRef]
  51. Jin, Z.X.; Zhang, C.P.; Li, W.; Tu, S.Q.; Wang, L.B.; Wang, S.X. Stability analysis for excavation in frictional soils based on upper bound method. Comput. Geotech. 2024, 165, 105916. [Google Scholar] [CrossRef]
  52. Liu, T.X.; Zhang, C.P.; Li, W.; Tu, S.Q.; Wang, L.B.; Jin, Z.X. Face failure mechanism of fault tunnels under high-temperature and high-pressure conditions using the discrete element method. Comput. Geotech. 2025, 179, 107059. [Google Scholar]
  53. GB 50446-2017; Code for Construction and Acceptance of Shield Tunneling Method. China Architecture & Building Press: Beijing, China, 2017.
  54. DB11/685-2021; Code for Design of Stormwater Management and Harvest Engineering in Sponge City Construction. Beijing Municipal Government Publications: Beijing, China, 2021.
  55. Zhong, X.C.; Zhang, J.R.; Qin, J.S.; Zhu, W. Simplified calculation model and influencing factors analysis of equivalent longitudinal bending stiffness for shield tunnels. Rock Soil Mech. 2011, 32, 132–136. [Google Scholar]
  56. Huang, H.W.; Xu, L.; Yan, J.L. Study on transverse rigidity efficiency of shield tunnels. Chin. J. Geotech. Eng. 2006, 28, 11–18. [Google Scholar]
  57. Zhang, Y.; Lu, H.F.; Yao, D.X. Study on Deformation and Failure Characteristics of Roof and Floor Mining Based on FLAC3D Model Ubiquitous. Mine Eng. 2020, 08, 361–367. [Google Scholar] [CrossRef]
  58. Xue, S.Z. Waterproofing Technology for Underground Buildings, 1st ed.; China Architecture & Building Press: Beijing, China, 2003. [Google Scholar]
  59. GB 50108-2008; Technical Code for Waterproofing of Underground Works. China Planning Press: Beijing, China, 2008.
  60. Liu, H.J. Research on Computational Models for Health Diagnosis of Highway Tunnels. Ph.D. Thesis, Tongji University, Shanghai, China, 2003. [Google Scholar]
  61. Liu, H.R.; Zhong, Z.L. Influence of vault voids on stability of tunnel surrounding rock and primary support structure. Chin. J. Undergr. Space Eng. 2014, 10, 619–623. [Google Scholar]
  62. Wang, T.; Liao, B.C.; Ma, X. Bayesian network-based probabilistic assessment method for construction safety risks. China Civ. Eng. J. 2010, 43, 384–391. [Google Scholar]
  63. Zhang, L.M. Safety Risk Management of Buildings Induced by Subway Shield Under Uncertain Conditions. Ph.D. Thesis, Huazhong University of Science and Technology, Wuhan, China, 2014. [Google Scholar]
Figure 1. Schematic of tunnel section.
Buildings 15 01696 g001
Figure 2. Tunnel defect conditions.
Buildings 15 01696 g002
Figure 3. Structural cracking conditions.
Buildings 15 01696 g003
Figure 4. Segment offset conditions.
Buildings 15 01696 g004
Figure 5. Tunnel deformation conditions.
Buildings 15 01696 g005
Figure 6. Cavity conditions behind the lining.
Buildings 15 01696 g006
Figure 7. Temporal variation of groundwater table in Beijing (2015–2021).
Buildings 15 01696 g007
Figure 8. Structural stiffness variation and train-induced vibrations.
Buildings 15 01696 g008
Figure 9. Schematic diagram of pathological causation mechanisms in cross passage structures.
Buildings 15 01696 g009
Figure 10. Schematic diagram of defect remediation using the embedded pipe grouting method.
Buildings 15 01696 g010
Figure 11. Numerical calculation model.
Buildings 15 01696 g011
Figure 12. Schematic diagram of defect occurrence locations.
Buildings 15 01696 g012
Figure 13. Schematic diagram of void sizes.
Buildings 15 01696 g013
Figure 14. Pore water pressure contour map at different defect locations.
Buildings 15 01696 g014
Figure 15. Structural displacement contour map at different defect locations.
Buildings 15 01696 g015
Figure 16. Surface settlement at different defect locations.
Buildings 15 01696 g016
Figure 17. Deformation of the left tunnel line at various defect locations.
Buildings 15 01696 g017
Figure 18. Structural major principal stress contour map at different defect locations.
Buildings 15 01696 g018
Figure 19. Structural minor principal stress contour map at different defect locations.
Buildings 15 01696 g019
Figure 20. Structural displacement contour map at different leakage intensities.
Buildings 15 01696 g020
Figure 21. Surface settlement under different leakage degrees.
Buildings 15 01696 g021
Figure 22. Deformation of left-line tunnel under different leakage degrees.
Buildings 15 01696 g022
Figure 23. Structural displacement contour plots under different void sizes.
Buildings 15 01696 g023
Figure 24. Surface settlement under different void sizes.
Buildings 15 01696 g024
Figure 25. Deformation of left-line tunnel under different void sizes.
Buildings 15 01696 g025
Figure 26. Structural displacement contour plots under different deterioration levels.
Buildings 15 01696 g026
Figure 27. Surface settlement under different deterioration levels.
Buildings 15 01696 g027
Figure 28. Deformation of left-line tunnel under different deterioration levels.
Buildings 15 01696 g028
Figure 29. Bayesian network topology structure diagram.
Buildings 15 01696 g029
Figure 30. Safety risk analysis model for shield tunnels and connecting passage structures.
Buildings 15 01696 g030
Figure 31. Probability distribution under maximum impact level.
Buildings 15 01696 g031
Figure 32. Probability distribution under impact level 2.
Buildings 15 01696 g032
Figure 33. Probability distribution under impact level 1.
Buildings 15 01696 g033
Table 1. Statistical summary of structural defects identified through monitoring.
Types of DefectsLocation of DefectsCharacterization of Defects
Structural crackingRight-side wall of Left Line (YK22+523.9)Segment cracking: Width = 0.24 mm, length = 0.4 m, depth = 98 mm
Right-side wall of Left Line (ZK22+528.2)Grouting hole leakage
Left-side track bed (non-sleeper area) of Right Line (YK22+576.4)Concrete spalling
Left-side track bed (non-sleeper area) of Right Line (YK22+561.4)Concrete spalling
Left-side track bed (non-sleeper area) of Left Line (ZK22+593.4)Concrete spalling
Track bed of Left LineTotal 15 cracks: Crack widths range from 0.27 mm to 1.40 mm. The maximum width (1.40 mm) is located at ZK22+547.0.
Track bed of Right LineTotal 2 cracks: Crack widths range from 1.07 mm to 1.37 mm. The maximum width (1.37 mm) is located at YK22+524.4.
Segment offsetSegments of Left LineMaximum inter-ring offset = 13 mm, maximum intra-ring offset = 6 mm
Segments of Right LineMaximum inter-ring offset = 14 mm, maximum intra-ring offset = 5 mm
Tunnel deformationLeft LineInitial structural clearance convergence measurements: 5.3500 m to 5.4148 m
Right LineThe initial measurement results of structural clearance convergence in the Right Line tunnel range from 5.3723 m to 5.4076 m; the maximum ovality is 9.9‰, exceeding the allowable deviation requirement of 6‰ specified in the code.
Void behind the liningZK22+504.8(YK22+482.4)~
ZK22+604.8(YK22+582.4)
A total of 6 loose zones, 5 water-rich zones, and 4 delamination locations between the track bed and tunnel invert have been identified.
Table 2. Mechanical parameters of soil and structure.
ParameterMaterial TypeDensity (kg/m3)Elastic Modulus (GPa)Poisson’s RatioInternal Friction AngleCohesion (kPa)
Soil massSandy soil20000.0250.35320.1
Shield tunnel segmentC50 concrete250034.50.16--
Connecting passage and pump roomC40 concrete250030.00.18--
Table 3. Calculated working conditions.
CasesCoupled Multiple Defect LocationsLeakage IntensityVoid SizeDeterioration LevelObjective
1Pump room side wall locationDamp stain2 m80%Investigate the influence patterns of leakage intensity, void size, and structural deterioration level on the structural behavior of shield tunnels and cross passages.
2Dripping leakage
3Linear seepage
4Water gushing
5Left-line tunnel vault locationDamp stain2 m80%
6Dripping leakage
7Linear seepage
8Water gushing
9Connecting passage vault locationDamp stain2 m80%
10Dripping leakage
11Linear seepage
12Water gushing
13The junction between the tunnel and the connecting passageDamp stain2 m80%
14Dripping leakage
15Linear seepage
16Water gushing
17Pump room side wall locationWater gushing1 m80%
18Water gushing1.5 m80%
19Left-line tunnel vault locationWater gushing1 m80%
20Water gushing1.5 m80%
21Connecting passage vault locationWater gushing1 m80%
22Water gushing1.5 m80%
23The junction between the tunnel and the connecting passageWater gushing1 m80%
24Water gushing1.5 m80%
25Pump room side wall locationWater gushing2 m60%
26Left-line tunnel vault locationWater gushing2 m60%
27Connecting passage vault locationWater gushing2 m60%
28The junction between the tunnel and the connecting passageWater gushing2 m60%
Table 4. Parameter grading of Bayesian network model.
Parameter VariableLevel ClassificationParameter VariablesLevel Classification
Leakage severity X11: Damp stain
2: Dripping leakage
3: Linear seepage
4: Water gushing
Maximum surface settlement A11: A1 < 10 mm
2: 10 mm ≤ A1 < 15 mm
3: 15 mm ≤ A1
Void size X21: 1 m
2: 1.5 m
3: 2 m
Tunnel deformation A21: A2 < 5 mm
2: 5 mm ≤ A2 < 10 mm
3: 10 mm ≤ A2
Deterioration severity X31: 80%
2: 60%
Cross passage deformation A31: A3 < 5 mm
2: 5 mm ≤ A3 < 10 mm
3: 10 mm ≤ A3
Defect location X41: Pump room side wall location
2: Left-line tunnel vault location
3: Connecting passage vault location
4: The junction between the tunnel and the connecting passage3: 4.5 m
Impact level T1: 1 ≤ T < 2
2: 2 ≤ T < 3
3: 3 ≤ T < 4
Table 5. Probability distribution of risk levels under different risk factors.
Risk ContributorsProbability of Impact Levels
Leakage severity X1 = Water gushingLevel 1: 32%; Level 2: 33%; Level 3: 35%
Void size X2 = 2 mLevel 1: 16%; Level 2: 31%; Level 3: 53%
Deterioration severity X3 = 60%Level 1: 25%; Level 2: 35%; Level 3: 40%
Defect location X4 = Pump room sidewall locationLevel 1: 19%; Level 2: 19%; Level 3: 62%
Table 6. Safety risk prediction for shield tunnels and connecting passages under different conditions.
No.Known Influencing FactorsImpact Level Probability Distribution
Leakage SeverityVoid Size/mDeterioration LevelDefect LocationLevel 1Level 2Level 3
1Damp stain180%Left-line tunnel vault location90%10%0
2Linear seepage1.560%Connecting passage vault location043%57%
3Dripping leakage280%Pump room side wall location026%74%
Disclaimer/Publisher’s Note: The statements, opinions and data contained in all publications are solely those of the individual author(s) and contributor(s) and not of MDPI and/or the editor(s). MDPI and/or the editor(s) disclaim responsibility for any injury to people or property resulting from any ideas, methods, instructions or products referred to in the content.

