Abstract
The Tunnel Boring Machine (TBM) method has gained attention as an eco-friendly tunneling technique, effectively reducing noise, vibration, and carbon emissions compared to conventional blasting methods. However, ground settlement and volume loss are inevitable during TBM excavation due to the deformation of the surrounding ground, which may even lead to ground collapse in severe cases. In this study, a Shield TBM model, validated using field data, was employed to perform numerical analyses on parameters such as tunnel diameter, ground elastic modulus, face pressure, and backfill pressure. Based on the simulation results, the influence of each parameter on settlement was evaluated, and a predictive model for estimating maximum settlement was developed. The proposed model was statistically validated using p-value assessment, variance inflation factor (VIF), coefficient of determination (R2), and residual analysis. Furthermore, the prediction model showed high agreement with the field data, yielding a prediction error of 8.25%. This study emphasizes the applicability of verified numerical modeling for accurately predicting ground settlement in Shield TBM tunneling and provides a reliable approach for settlement prediction under varying construction conditions.
1. Introduction
The trend of population concentration in urban areas continues to increase, leading to escalating issues such as traffic congestion and environmental concerns. The development of underground spaces has been proven to be highly effective in mitigating these challenges [1,2]. For example, in South Korea, the government is promoting the underground relocation of four existing expressways that pass through urban areas to address these challenges (Figure 1). Among them, the Gyeongbu Expressway (Hwaseong–Seoul) and the Gyeongin Expressway (Incheon–Seoul) have passed the preliminary feasibility study and are scheduled to begin construction by 2028.
The increasing demand for underground space development has led to a corresponding rise in the application of Tunnel Boring Machines (TBMs). Compared to the conventional drill-and-blast method, TBM offers several advantages, including reduced noise and vibration, enhanced construction safety, and accelerated excavation rates [3]. Notable incidents, including the 2017 collapse of the Rastatt railway tunnel in Germany and the 2020 ground subsidence at the Tokyo Outer Ring Road construction site in Japan, highlight that ground settlement and ground loss remain inherent geotechnical risks in TBM tunneling. Such a settlement, if not properly predicted and managed, can in severe cases result in structural failure of the tunnel [4,5]. Therefore, accurate prediction of TBM-induced ground settlement is essential to ensure construction safety and minimize the risk of damage [6].
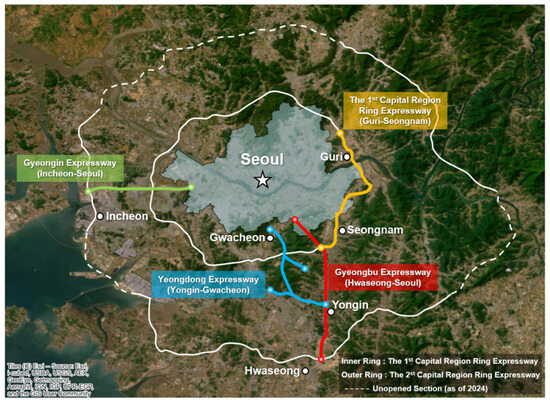
Figure 1.
Planned underground expressway projects in South Korea [7].
Methods for predicting ground settlement induced by tunnel excavation can be categorized into empirical, theoretical, and numerical approaches. Empirical methods primarily rely on settlement data observed under greenfield conditions, from which statistical trends have been derived [8,9,10,11,12]. Theoretical methods explain ground settlement behavior using ground models based on linear elasticity [13,14,15]. However, these empirical and theoretical approaches have limitations in capturing complex excavation conditions and soil–structure interactions, and they often fail to fully account for the key factors influencing ground settlement [16]. Various studies have proposed equations to predict the maximum settlement [14,15,17]. Nevertheless, differences between measured and predicted settlements have been noted, which complicates the task of achieving accurate predictions [18,19]. To address these limitations, numerical approaches have been increasingly adopted, as they enable more detailed modeling of actual construction environments where multiple parameters interact simultaneously [20,21,22,23,24]. Shield TBM tunneling involves multiple interacting factors, including face pressure, backfill pressure, and structural components such as the shield, segments, and grout. Therefore, it is essential to implement a numerical analysis model capable of accurately capturing these interactions.
In this study, the settlement behavior induced by Shield TBM tunneling is analyzed through three-dimensional numerical analysis, and a predictive model is developed to estimate maximum settlement. To conduct the analysis, a three-dimensional numerical model was developed to reflect field conditions and data. The model was validated using field data from the Tehran Metro Line 7 project by comparing the observed maximum settlements with the predictions obtained from the numerical analysis. The validated numerical model was subsequently employed to investigate ground settlement behavior induced by Shield TBM tunneling, with a focus on key parameters such as tunnel diameter, ground elastic modulus, face pressure, and backfill pressure. Based on the results of 320 numerical simulations, a predictive model for estimating maximum settlement was proposed. The proposed model was statistically validated using p-value analysis, variance inflation factor (VIF) analysis, and residual diagnostics. Additionally, the applicability of the model was assessed by comparing the predicted maximum settlement with field measurements obtained from the Hong Kong subway project. As a result, the proposed model and field data comparison showed an error of 0.99 mm, corresponding to a deviation of 8.25%, indicating high prediction accuracy.
2. Ground Settlement
Tunnel excavation causes stress redistribution in the ground and a reduction in ground strength. As a result, the overlying ground loses its bearing capacity, inevitably leading to ground settlement. Ground settlement can impact existing structures and, under severe conditions, may result in both structural damage and ground failure. Therefore, predicting ground settlement in advance during tunnel excavation is essential [25].
Peck [8] proposed, based on empirical observations, that the settlement profile at the ground surface due to tunneling can be approximated by a Gaussian function. Assuming undrained conditions and incompressible soil behavior, the point at which the settlement trough reaches its maximum should be located directly above the tunnel centerline. The settlement Sv(x) can be calculated by using Equation (1), and the corresponding settlement trough is shown in Figure 2.
where Smax is the maximum settlement, i is the inflection point, and x is the horizontal distance from the tunnel’s center.
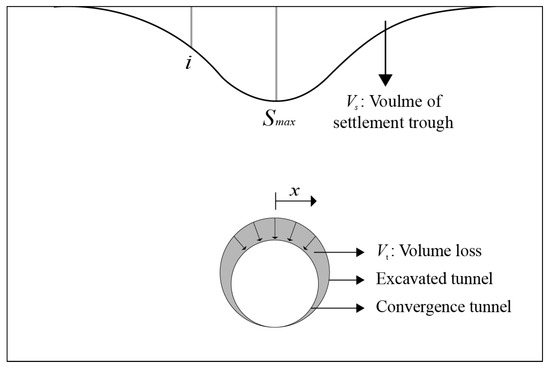
Figure 2.
Simulation of ground settlement trough [25].
Figure 3 presents the settlement trough modeled by a Gaussian curve. The maximum slope of the Gaussian curve is derived from the first derivative of Equation (1), as shown in Equation (2), which describes the variation in the settlement rate along the profile of the trough. The maximum slope is calculated as 0.606 Smax/i, indicating the point of greatest inclination in the settlement trough. Similarly, the curvature of the Gaussian curve is obtained through the second derivative of Equation (1), as defined in Equation (3).
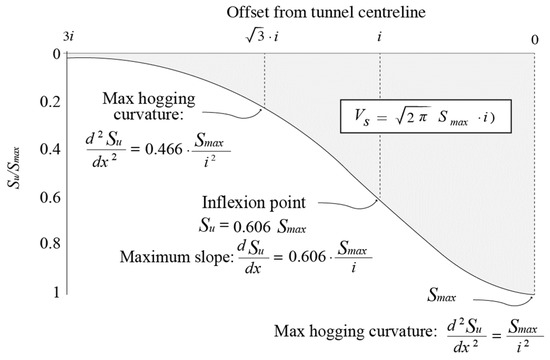
Figure 3.
Settlement trough expressed by gaussian curve [26].
Attlewell and Woodman [27] extended the Gaussian-based approach originally proposed by Peck [8] and introduced a set of equations to estimate maximum settlement and the inflection point. Equation (4) defines the maximum settlement, while Equation (5) calculates the inflection point based on the volume of the settlement trough. The constants corresponding to different ground types are provided in Table 1.
where Vs is the volume of the settlement trough, A is the excavation area of the tunnel, K and n are constants according to ground type, Zo is the tunnel-axis depth, and R is the radius of the tunnel.

Table 1.
Constant values K and n [27].
These analytical approaches have formed the basis for numerous studies focused on characterizing settlement trough geometry using key parameters such as the maximum settlement and the inflection point. For example, He et al. [28] demonstrated that the maximum settlement is significantly affected by the tunnel diameter and the soil elastic modulus. Chakeri et al. [29] proposed a numerical relationship for estimating the inflection point based on settlement trough behavior. Papadopoulou [30], through a parametric study using field data, reported that the actual inflection point often lies slightly below the value predicted by the Gaussian curve.
Although these studies have deepened the understanding of settlement trough behavior, most have been limited to two-dimensional (2D) analyses or simplified assumptions that do not fully capture the complex interactions involved in Shield TBM tunneling. In particular, research that simultaneously considers tunnel geometry, ground properties, and construction parameters in a 3D context remains limited. These limitations underscore the necessity for more advanced approaches capable of capturing the complex ground deformation mechanisms arising from Shield TBM excavation.
3. Three-Dimensional Numerical Simulation
3.1. Numerical Modeling
Generally, most investigations involve 2D numerical analysis. However, this method fails to incorporate the deformation effects of the excavation process in the third dimension [31]. This limitation can be solved by three-dimensional numerical analysis. Three-dimensional numerical models are widely recognized for their superior accuracy in predicting ground deformations compared to 2D models when validated against field measurements [32,33]. In Shield TBM tunneling, 3D numerical analysis enables more accurate settlement prediction by accounting for the effects of support materials and applied pressures [31,34]. Also, simulating the sequential excavation process allows for detailed analysis of both temporal and spatial ground behavior during tunnel advancement.
In this study, numerical analyses were conducted using Midas GTS NX 2024 v1.1, a finite element method (FEM) software. Accurate simulation of Shield TBM tunneling depends heavily on the appropriate selection of domain size. Tunnel excavation redistributes stress in the surrounding ground, influencing regions beyond the immediate tunnel boundary. Since ground settlement primarily occurs above and around the tunnel, the simulation domain must be large enough to reflect these effects. Based on prior research, the domain in this study was set to at least three to four times the tunnel diameter to ensure reliable results [35,36].
Geological properties were modeled using the Mohr-Coulomb failure criterion. The structural components of the Shield TBM—including the shield, segment, and grout—were modeled using an elastic material model [15]. For the shield and segment, two-dimensional shell elements were adopted, as they are suitable for representing thin-walled structures [24]. To account for the time-dependent behavior of support materials, the hardening characteristics of the grout were incorporated into the numerical model. Figure 4 presents the variation in grout strength over time as applied in the analysis [37]. The maximum elastic modulus shown in Figure 4 is 3 GPa, and the time-dependent modulus of the field grout was proportionally scaled based on this reference curve. To accurately capture these material properties and simulate tail void filling, the grout was modeled using three-dimensional solid elements, which proved effective for representing its mechanical behavior during tunnel advancement [38].
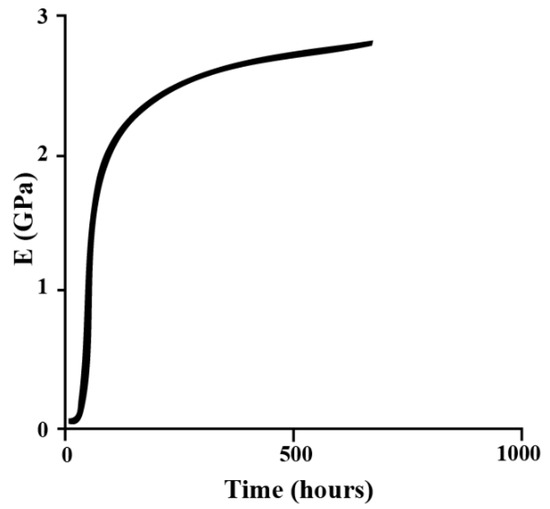
Figure 4.
Hardening relationship between time and elastic modulus of grout [24].
The face pressure was simulated by applying stress directly to the tunnel face. Although face pressure generally varies with depth in Shield TBM construction, it was assumed to be uniformly distributed in this study. During excavation, the applied face pressure was removed. Subsequently, as the shield advanced, the face pressure was reapplied to the newly exposed tunnel face. Following this, backfill pressure was simulated at the tail void to reflect the pressure exerted after the installation of the segment and the injection of grout. This step was included to model the support mechanism acting behind the shield during tunnel advancement. Figure 5 shows the face pressure and the backfill pressure simulation.
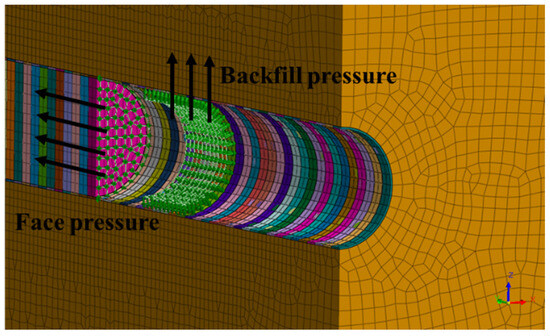
Figure 5.
Schematic diagram of face pressure and backfill pressure.
The sequential process of Shield TBM tunneling simulated in this study is illustrated in Figure 6. The sequence begins with tunnel excavation, followed by shield advancement. Once the shield has progressed, face pressure is applied to the newly exposed tunnel face. Subsequently, lining segments are installed, and grout is injected into the tail void. Backfill pressure is then applied, and this entire cycle is repeated iteratively. Grouting was modeled using the simultaneous injection method. The elastic modulus of the grout was updated daily to simulate time-dependent curing behavior. Since more than 80% of the total strength develops within the first day, backfill pressure was applied for only one day. Each segment ring measures 1.5 m in length, and the daily excavation rate was assumed to be five rings (7.5 m) for the numerical analysis.
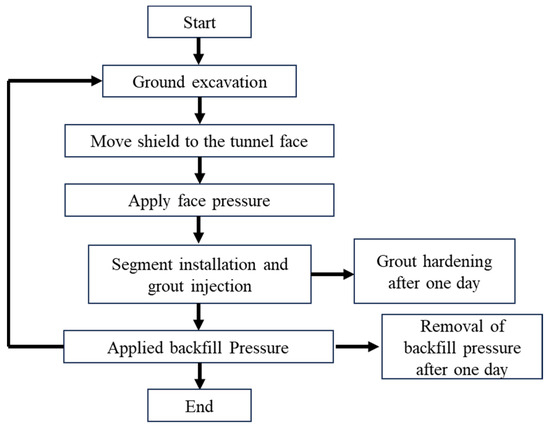
Figure 6.
Tunneling process of Shield TBM in numerical analysis.
3.2. Validation of Numerical Model
To validate the numerical model developed for Shield TBM tunneling, field data from the Tehran Metro Line 7 project were employed in this study [18]. Figure 7 shows the main route of Tehran Metro Line 7, the section considered in numerical analysis, and the geological profile of that section. The tunnel was excavated at a depth of 20.8 m. The Shield TBM used in the project had a diameter of 9.2 m and a shield length of 9.0 m. The lining segments had an external diameter of 8.85 m, with each ring measuring 1.5 m in length and 0.35 m in thickness. The geotechnical properties of the ground, used as input parameters for the numerical analysis, are summarized in Table 2. The material properties of the shield, segments, and grout are listed in Table 3. The ground was modeled using the Mohr–Coulomb failure criterion, and the structural components were modeled using elastic material models.
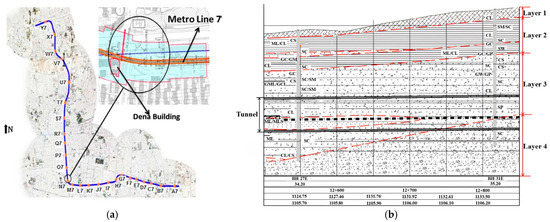
Figure 7.
Tehran Metro Line 7: (a) Main route and the analyzed section [18]; (b) geological profile of the analyzed section, reported by Zaminfanavaran Consulting Engineers (ZAFA, 2007) as cited in Chakeri et al. [18].

Table 2.
Geological properties of Tehran Metro Line 7, reported by Zaminfanavaran Consulting Engineers (ZAFA, 2007) as cited in Chakeri et al. [18].

Table 3.
Properties of structural materials.
The elastic modulus of the fully hardened grout was set to 1 MPa. The numerical analysis was performed by adjusting the degree of grout hardening daily, according to the ratio curve presented in Figure 3. In this study, the face pressure was set to 55 kPa based on previous research [18]. As previous studies did not take backfill pressure into account, this study referred to the Korean Design Standard for Tunnel Structures–TBM Tunnel (KDS 27 25 00) [39], which recommends applying a backfill pressure 0.2 bar greater than the face pressure. Accordingly, the backfill pressure was set to 75 kPa.
Figure 8 illustrates the dimensions of the numerical analysis domain used in this study. The domain was defined as 120 m in the direction of tunnel advancement, 90 m in the transverse direction from the tunnel centerline, and 60 m in height. The maximum settlement measured at the Tehran Metro Line 7 site ranged from 6.9 mm to 7.1 mm [18], whereas the numerical analysis conducted in this study yielded a value of 7.5 mm. The difference between the numerical result and the field measurements was 0.4 mm, corresponding to a deviation of 5.63% (Figure 9).
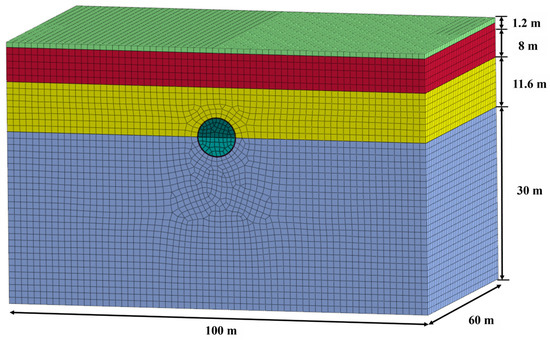
Figure 8.
Domain size of numerical analysis model of Tehran Metro Line 7.
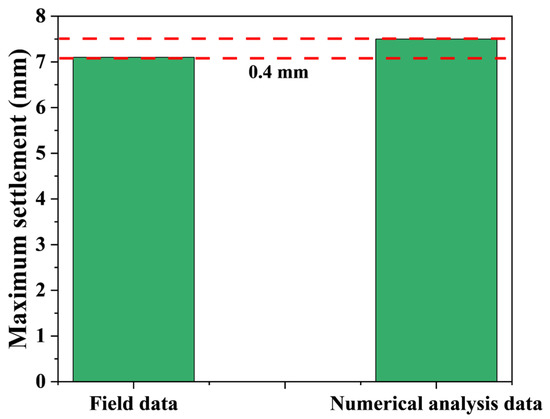
Figure 9.
Comparison of field data and numerical analysis data.
These results indicate that the developed numerical model provides a reliable representation of the field conditions observed at the Tehran Metro Line 7 site. This reliability is further supported by the fact that the 3D numerical analysis incorporates key parameters, including the structural components of the Shield TBM, face pressure, and backfill pressure. Therefore, the proposed model is considered suitable for simulating ground settlement behavior in Shield TBM tunneling.
4. Results and Discussion
4.1. Analysis of Numerical Simulations
To analyze the effects of various conditions on ground settlement, the previously validated numerical modeling approach was applied consistently. Figure 10 presents the analysis domain, where the tunnel depth is set to 18 m. The material properties of the TBM components were kept identical to those used in the model validation.
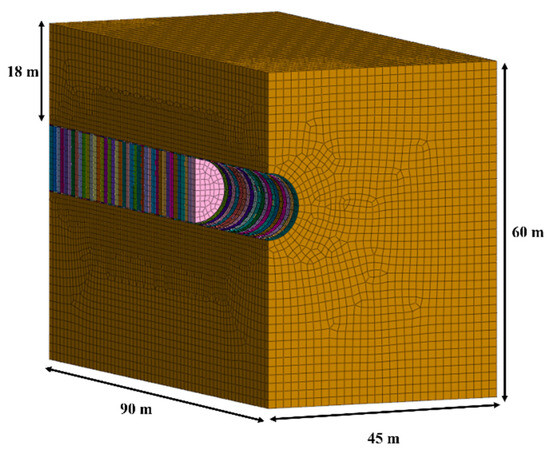
Figure 10.
Domain size of numerical analysis model.
The parameters considered in the analysis include the tunnel diameter (D), the elastic modulus (E) of the ground, the face pressure (FP), and the backfill pressure (BP). Tunnel diameters of 3 m, 6 m, 9 m, and 12 m were analyzed, and ground elastic moduli of 50 MPa, 100 MPa, 200 MPa, and 400 MPa were applied. The ground was modeled as a single layer of weathered rock, with its properties summarized in Table 4. Face pressure was calculated based on Rankine’s active earth pressure theory, and the theoretical values applied to the tunnel face were determined using Equation (6) [40]. In this study, the concept of FPref, defined relative to the maximum face pressure, was adopted [41]. An FPref value of 1.0 corresponds to the maximum face pressure. FPref is defined by Equation (7), and five face pressure conditions were considered in the parametric study: FPref = 0.25, 0.5, 0.75, 1.0, and 1.25. Backfill pressure was applied in four cases by adding 0.2, 0.8, 1.4, and 2.0 bar to the corresponding face pressure values.
where FPmax is the maximum face pressure, ϕ′ is the effective friction angle, σz′ is the vertical effective stress, and u is the pore water pressure.

Table 4.
Geological properties of ground.
4.1.1. Analysis of the Effect of Tunnel Diameter on Settlement
The tunnel diameter has been studied as a significant factor influencing ground settlement induced by tunnel excavation [18,42,43]. In this study, to isolate the influence of diameter, the elastic modulus of ground, face pressure, and backfill pressure were held constant throughout the analysis. The elastic modulus was set to 50 MPa, the face pressure was applied as FPref = 1.0 (177.66 kPa), and the backfill pressure was defined as the face pressure increased by 0.2 bar (197.66 kPa), as summarized in Table 5.

Table 5.
Analysis conditions for evaluating the effect of tunnel diameter.
Figure 11 illustrates the settlement trough for different tunnel diameters. An increase in tunnel diameter results in a wider trough, indicating a broader zone of ground disturbance caused by excavation. When the tunnel diameter was 3 m, the maximum surface settlement was 4.47 mm. For diameters of 6 m, 9 m, and 12 m, the settlement increased to 9.84 mm, 15.99 mm, and 25.13 mm, respectively. The settlement increased by 120.10% from 3 m to 6 m, by 62.44% from 6 m to 9 m, and by 57.14% from 9 m to 12 m. These results indicate that surface settlement increases significantly with tunnel diameter, which is consistent with the findings of previous studies [18,42,43].
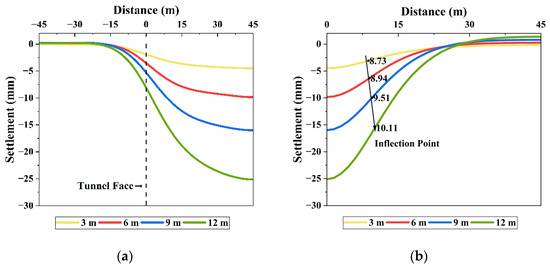
Figure 11.
Settlement troughs for different tunnel diameters: (a) longitudinal direction; (b) transverse direction.
Figure 11b shows that the inflection point moves farther from the tunnel centerline as the tunnel diameter increases. This trend aligns with the observations of Chakeri et al. [29] and Sohaei et al. [44], who reported that larger tunnel diameters lead to broader settlement troughs due to outward-shifting inflection points.
Several previous studies have proposed empirical equations for predicting inflection points. However, most are based on conventional tunneling methods or are limited to soil and clay ground conditions [15,45,46]. Arioglu [47] proposed an empirical equation (Equation (8)) to estimate inflection points in various soil types during Shield TBM excavation. In this study, a modified version of Arioglu’s equation was developed based on numerical analysis results to predict inflection points under weathered rock conditions, taking into account variations in tunnel diameter.
Regression analysis was performed to calibrate the modified equation, and the resulting coefficient and exponent were determined to be 0.837 and 1.051, respectively. Based on these values, a new empirical equation for predicting the inflection point in Shield TBM tunneling under weathered rock conditions, with consideration of tunnel diameter, was established as Equation (9). Figure 12 presents a comparison between the inflection points obtained from numerical simulations and those predicted by the regression model. The coefficient of determination (R2) was 0.985, indicating a strong correlation between the predicted and simulated results.
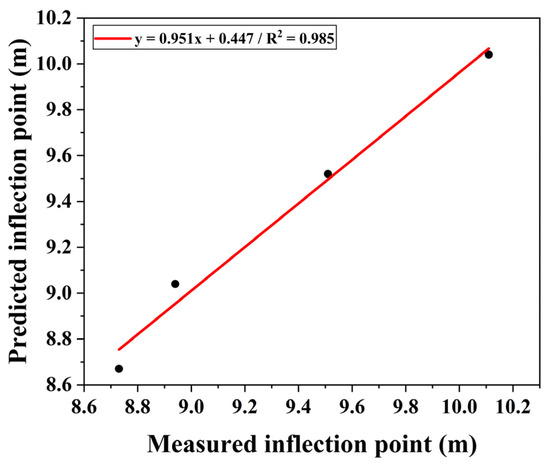
Figure 12.
Comparison of the predictive equation for the inflection point with numerical analysis results.
4.1.2. Analysis of the Effect of Elastic Modulus on Settlement
Among various geotechnical parameters—such as cohesion, friction angle, and elastic modulus—previous studies have identified the elastic modulus as the parameter with the greatest influence on tunneling-induced settlement [48,49]. Accordingly, this study analyzed the effect of ground elastic modulus variations on settlement behavior. To isolate its impact, the tunnel diameter, face pressure, and backfill pressure were kept constant throughout the analysis. The tunnel diameter was set to 12 m, the face pressure was applied at FPref = 1.0 (177.66 kPa), and the backfill pressure was defined as the face pressure plus 0.2 bar (197.66 kPa), as summarized in Table 6.

Table 6.
Analysis conditions for evaluating the effect of elastic modulus.
Figure 13 shows the settlement troughs corresponding to different values of ground elastic modulus. As the elastic modulus increased, excavation-induced settlement exhibited a clear decreasing trend. This indicates that greater ground strength reduces the impact of tunneling on surrounding ground behavior. At an elastic modulus of 50 MPa, the maximum settlement was 25.13 mm. As the modulus increased to 400 MPa, the maximum settlement decreased to 4.57 mm, representing a total reduction of 81.82%. These findings are consistent with previous studies, confirming that increased elastic modulus improves ground stiffness and reduces settlement [48,49,50].
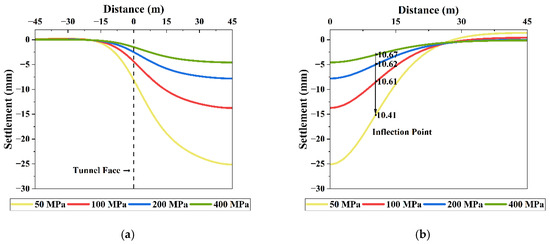
Figure 13.
Settlement troughs for different elastic modulus: (a) longitudinal direction; (b) transverse direction.
An analysis of the inflection points from the transverse settlement trough revealed that their positions remained nearly constant despite variations in elastic modulus. This indicates that the influence of elastic modulus on the inflection point location in the transverse direction is negligible.
4.1.3. Analysis of the Effect of Face Pressure on Settlement
Shield TBM controls surface settlement and prevents face collapse by applying face pressure, making it a critical factor in tunneling operations [51,52]. In this study, five face pressure conditions were considered using FPref values of 0.25, 0.5, 0.75, 1.0, and 1.25. The corresponding face pressures were 44.42 kPa, 88.83 kPa, 133.25 kPa, 177.66 kPa, and 222.08 kPa, respectively. The tunnel diameter and ground elastic modulus were fixed at 12 m and 50 MPa. Backfill pressure was defined as the face pressure plus 0.2 bar. The detailed analysis conditions are summarized in Table 7.

Table 7.
Analysis conditions for evaluating the effect of face pressure.
Figure 14a illustrates the longitudinal settlement troughs under different face pressure conditions. As the face pressure increased, excavation-induced settlement showed a decreasing trend. When FPref exceeded 0.75, the shape of the longitudinal settlement trough remained nearly unchanged. This behavior is attributed to the fact that higher face pressure limits the release of effective stress in the ground, thereby enhancing ground stability [53].
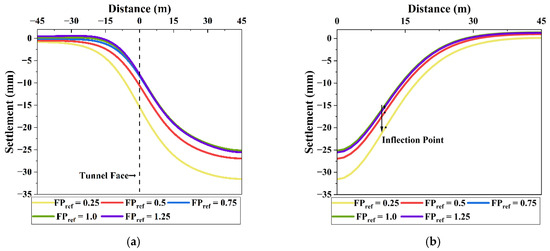
Figure 14.
Settlement troughs for different face pressure: (a) longitudinal direction; (b) transverse direction.
At FPref = 0.25, the maximum settlement was 31.54 mm. As FPref increased to 1.0, the settlement decreased to 25.15 mm, representing a reduction of 20.27%. However, when FPref was further increased to 1.25, the maximum settlement slightly increased to 25.55 mm. This suggests that excessive face pressure may induce additional ground deformation, which is consistent with the findings of Kim et al. [54].
An analysis of the inflection points derived from the transverse settlement trough revealed that their positions remained nearly constant (Figure 14b). This suggests that face pressure has a negligible influence on the inflection points in the transverse direction.
4.1.4. Analysis of the Effect of Backfill Pressure on Settlement
To analyze settlement behavior under varying backfill pressure, the tunnel diameter, elastic modulus, and face pressure were held constant. The tunnel diameter and elastic modulus were set to 12 m and 50 MPa, respectively, and the face pressure was fixed at 177.66 kPa (FPref = 1.0). Backfill pressures were applied by adding 0.2, 0.8, 1.4, and 2.0 bar to the face pressure, resulting in 197.66, 257.66, 317.66, and 377.66 kPa, respectively, as summarized in Table 8.

Table 8.
Analysis conditions for evaluating the effect of backfill pressure.
Figure 15 illustrates a decreasing trend in settlement with increasing backfill pressure, consistent with the findings of previous studies on the influence of backfill pressure on ground deformation [43,55]. However, the overall effect was relatively minor, suggesting that most ground deformation had already occurred prior to the application of backfill pressure. The grout used in this study achieved over 80% of its final strength within one day of injection. Furthermore, the use of the simultaneous injection method is considered to have contributed to reducing variations in settlement [56].
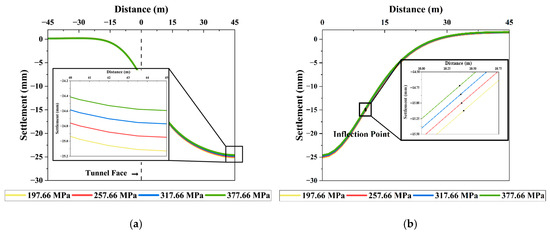
Figure 15.
Settlement troughs for different backfill pressure: (a) longitudinal direction; (b) transverse direction.
An analysis of the inflection points derived from the settlement troughs showed that the values remained nearly constant, suggesting that backfill pressure has minimal influence on the inflection point of the longitudinal settlement trough.
4.2. Prediction Model of Maximum Settlement
In this study, a total of 320 numerical analyses were conducted by varying four parameters—tunnel diameter (4 values), ground elastic modulus (4 values), face pressure (5 values), and backfill pressure (4 values)—to develop a predictive model for maximum settlement. Based on the simulation results, Equation (10) presents the predictive model derived through regression analysis.
To verify the reliability and applicability of the proposed model, p-values and variance inflation factors (VIFs) were examined, the coefficient of determination (R2) and residuals were analyzed, and the model predictions were compared with field measurements.
4.2.1. Verification of p-Value and Variance Inflation Factor
The statistical validity and multicollinearity of each variable in the proposed prediction model were evaluated using the p-value and VIF. A p-value below 0.05 indicates statistical significance, whereas a value above 0.05 suggests the variable may be insignificant and unnecessary in the model. A VIF greater than 10 indicates multicollinearity, in which case the variable should be excluded from the model [57]. As shown in Table 9, all variables in Equation (10) have p-values below 0.05 and VIF values under 10, confirming the statistical reliability of the proposed model.

Table 9.
p-values and VIFs of each term in the proposed prediction model.
4.2.2. Verification of Coefficient of Determination and Residual Analysis
Figure 16 illustrates the correlation between the maximum settlement values obtained from numerical analysis and those predicted by Equation (10). The R2 is 0.976, indicating a strong agreement between predicted and simulated values, and confirming the model’s high accuracy.
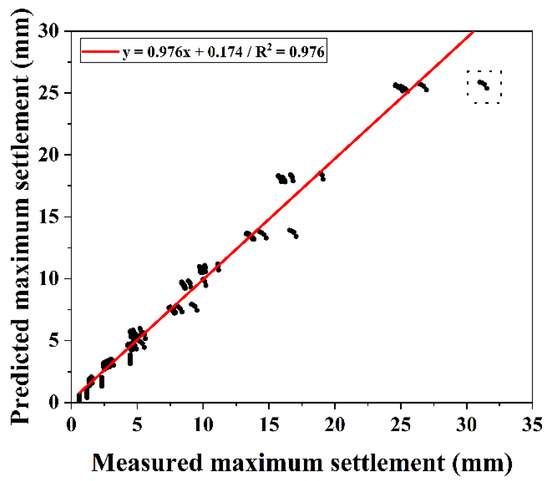
Figure 16.
Relationships between measured maximum settlement and predicted maximum settlement.
Residual analysis is an important step in regression modeling, used to assess model adequacy by comparing observed and predicted values [58]. Figure 17 presents the diagnostic results for the proposed model. As shown in Figure 17a, the kernel density estimation displays a symmetric distribution centered at zero, indicating no systematic bias. Figure 17b shows a Q–Q plot in which most residuals closely follow the reference line, confirming normality. The estimated mean (μ = −2.62331 × 10⁻¹³) is effectively zero, and the standard deviation (σ = 1.06612) is close to one, further supporting the assumption of normally distributed residuals.
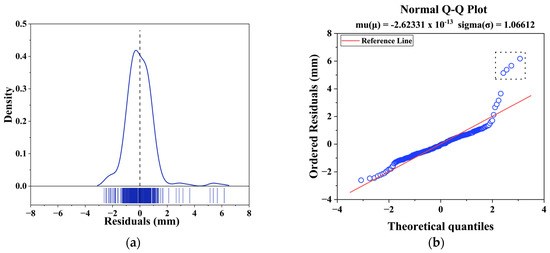
Figure 17.
Residual analysis results of the proposed prediction model: (a) kernel density estimation of residuals; (b) normal Q–Q plot of residuals.
The statistical validation conducted in the previous analysis confirms the high reliability and accuracy of the proposed model. However, as indicated by the dashed boxes in Figure 16 and Figure 17b, several outliers were observed where predicted values deviated from the simulated data. These cases correspond to conditions with a tunnel diameter of 12 m, an elastic modulus of 50 MPa, and an FPref of 0.25. This combination reflects a scenario involving a large tunnel, weak ground, and insufficient face pressure. These results suggest that the model requires further refinement to better capture the influence of face pressure variations in large-diameter tunnels excavated under weak ground conditions.
4.2.3. Comparison of Field Data and Prediction Model
A comparative analysis was conducted using field data from the Hong Kong subway project [59] to evaluate the applicability of the proposed maximum settlement prediction model to Shield TBM tunneling. The data used in this study were obtained from a 1.7 km TBM tunnel section starting at Diamond Hill on the Tuen Ma Line, constructed as part of the Sha Tin to Central Link Project (Figure 18). Figure 19 shows the geological section of the construction site, and Table 10 summarizes the ground properties. The field consists of completely decomposed granite (CDG), a type of weathered granite suitable for model comparison. The Shield TBM used in this project had a diameter of 7.45 m with an overburden depth of 14.68 m. The applied face and backfill pressures were 244 kPa and 400 kPa, respectively.
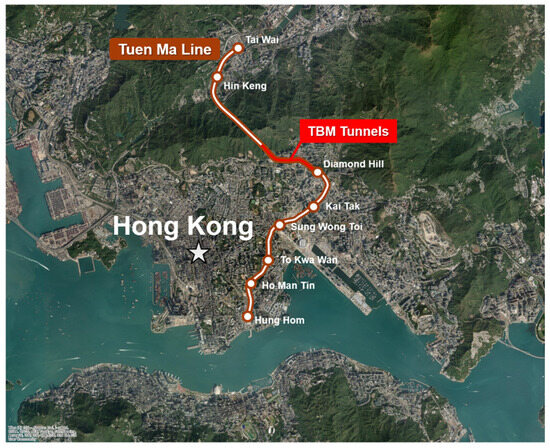
Figure 18.
The section using TBM in Hong Kong subway project.
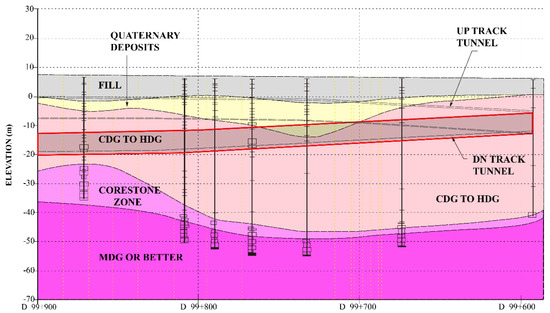
Figure 19.
Geological section of Hong Kong subway project [59].

Table 10.
Geological properties of Hong Kong subway [59].
The field measurement indicated a maximum settlement of approximately 12 mm, while the predicted value from the proposed model was 12.99 mm (Figure 20). The difference of 0.99 mm corresponds to a deviation of 8.25%, demonstrating a strong agreement between the model prediction and the field observation.
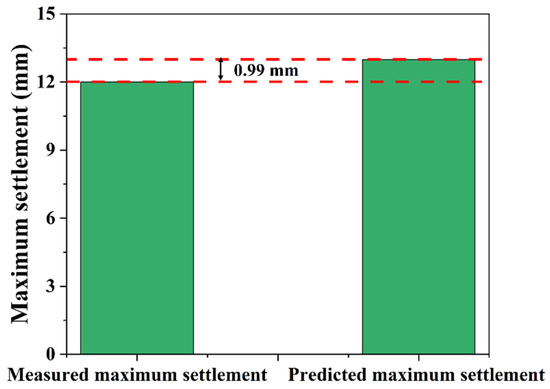
Figure 20.
Comparison of measured maximum settlement and predicted maximum settlement.
5. Conclusions
In this study, a 3D numerical analysis model validated with field data was employed to investigate ground settlement behavior in relation to parameters such as tunnel diameter, ground elastic modulus, face pressure, and backfill pressure. Based on the statistical reliability of the simulation results and their consistency with field measurements, a predictive model for estimating maximum ground settlement was developed. The conclusions are as follows:
- Based on the analysis of inflection points derived from the transverse settlement trough, an empirical equation was proposed and validated by its strong correlation with the numerical simulation results.
- Settlement generally decreases with increasing face pressure. However, when FPref exceeds 1.0, settlement begins to increase again. This suggests that excessive face pressure may induce additional ground deformation, highlighting the need for careful pressure control.
- Maximum settlement decreases with increasing backfill pressure. However, its influence is relatively limited compared to other parameters, as it is applied after most ground deformation has already occurred.
- The statistical reliability of the proposed model was confirmed through p-value analysis, variance inflation factor (VIF), and residual diagnostics. However, the model showed notable deviations under conditions involving large tunnel diameters, weak ground, and low face pressure, indicating the need for further refinement to improve its performance in such scenarios.
- The comparison with field measurements showed a prediction error of 0.99 mm, corresponding to an 8.25% deviation, indicating high predictive accuracy. The findings of this study are expected to serve as a valuable reference for estimating ground settlement induced by Shield TBM tunneling.
Additional research will address the limitations noted in Conclusion 4. This study employed a validated numerical model under fixed tunnel depth and uniform weathered rock conditions. Future work will expand the model’s applicability by analyzing settlement under variable tunnel depths and complex ground profiles. A machine learning-based approach will also be investigated to develop a prediction model adaptable to various tunneling conditions.
Author Contributions
Conceptualization, J.-S.Y.; methodology, H.-K.Y.; software, J.-S.Y.; validation, J.-S.Y.; investigation, J.-S.Y.; data curation, J.-S.Y.; writing—original draft preparation, J.-S.Y.; writing—review and editing, H.-E.K., S.-P.H., and W.-S.K.; supervision, H.-E.K. All authors have read and agreed to the published version of the manuscript.
Funding
This research was supported by the Korea Institute of Civil Engineering and Building Technology (KICT) through the project titled “Geotechnical Stabilization Study Service for Land Utilization of the JND Post-Management Landfill Site (Project No. 20250407-001)”, funded by JND Co., Ltd.
Data Availability Statement
The original contributions presented in the study are included in the article, further inquiries can be directed to the corresponding author.
Conflicts of Interest
The authors declare no conflict of interest.
References
- Wu, H.N.; Shen, S.L.; Yang, J. Identification of tunnel settlement caused by land subsidence in soft deposit of shanghai. J. Perform. Constr. Facil. 2017, 31, 04017092. [Google Scholar] [CrossRef]
- Lai, J.; Zhou, H.; Wang, K.; Qiu, J.; Wang, L.; Wang, J.; Feng, Z. Shield-driven induced ground surface and Ming Dynasty city wall settlement of Xi’an metro. Tunn. Undergr. Space Technol. 2020, 97, 103220. [Google Scholar] [CrossRef]
- Huang, M.; Lu, Y.; Zhen, J.; Lan, X.; Xu, C.; Yu, W. Analysis of face stability at the launch stage of shield or TBM tunnelling using a concrete box in complex urban environments. Tunn. Undergr. Space Technol. 2023, 135, 105067. [Google Scholar] [CrossRef]
- Ou, C.Y.; Hsieh, P.G.; Chiou, D.C. Characteristics of ground surface settlement during excavation. Can. Geotech. J. 1993, 30, 758–767. [Google Scholar] [CrossRef]
- Zhao, C.; Schmüdderich, C.; Barciaga, T.; Röchter, L. Response of building to shallow tunnel excavation in different types of soil. Comput. Geotech. 2019, 115, 103165. [Google Scholar] [CrossRef]
- Yun, J.S.; Kim, H.E.; Yoo, H.K. Three-dimensional modeling and analysis of ground settlement due to twin tunneling using GIS. Sustainability 2024, 16, 5891. [Google Scholar] [CrossRef]
- Kim, H.E.; Kim, M.S.; Yoo, W.K.; Kim, C.Y.; Yun, J.S. Experimental investigation on joint effects in rock cutting with a conical pick under unrelieved cutting conditions. Appl. Sci. 2025, 15, 5578. [Google Scholar] [CrossRef]
- Peck, R.B. Deep excavation and tunnelling in soft ground. In Proceedings of the 7th International Conference on Soil Mechanics and Foundation Engineering (ICSMFE), Mexico City, Mexico, 25–29 August 1969. [Google Scholar]
- O’reilly, M.P.; New, B.M. Settlements above tunnels in the united kingdom—Their magnitude and prediction. In Proceedings of the 3rd International Symposium on Tunnelling ’82, Brighton, UK, 7–11 June 1982; pp. 173–181. [Google Scholar]
- Mair, R.J.; Taylor, R.N.; Bracegirdle, A. Subsurface settlement profiles above tunnels in clays. Géotechnique 1993, 43, 315–320. [Google Scholar] [CrossRef]
- Mair, R.J.; Taylor, R.N. Bored tunnelling in the urban environments. In Proceedings of the 14th International Conference on Soil Mechanics and Foundation Engineering, Hamburg, Germany, 6–12 September 1997. [Google Scholar]
- Maroof, A.; Mohammadzadeh, D.; Karballaeezadeh, N.; Bajgiran, K.S.; Mosavi, A.; Felde, I. Investigation of empirical and analytical methods accuracy for surface settlement prediction in train tunnel excavation projects. Acta Polytech. Hung. 2024, 21, 167–186. [Google Scholar] [CrossRef]
- Sagaseta, C. Analysis of undrained soil deformation due to ground loss. Géotechnique 1987, 37, 301–320. [Google Scholar] [CrossRef]
- Verruijt, A.; Booker, J.R. Surface settlements due to deformation of a tunnel in an elastic half plane. Géotechnique 1996, 46, 753–756. [Google Scholar] [CrossRef]
- Loganathan, N.; Poulos, H.G. Analytical prediction for tunneling-induced ground movements in clays. J. Geotech. Geoenviron. Eng. 1998, 124, 846–856. [Google Scholar] [CrossRef]
- Moeinossadat, S.R.; Ahangari, K. Estimating Maximum Surface Settlement Due to EPBM Tunneling by Numerical-Intelligent Approach—A Case Study: Tehran Subway Line 7. Transp. Geotech. 2019, 18, 92–102. [Google Scholar] [CrossRef]
- Herzog, M. Surface Subsidence above Shallow Tunnels. Bautechnik 1985, 62, 375–377. [Google Scholar]
- Chakeri, H.; Ozcelik, Y.; Unver, B. Effects of important factors on surface settlement prediction for metro tunnel excavated by EPB. Tunn. Undergr. Space Technol. 2013, 36, 14–23. [Google Scholar] [CrossRef]
- Park, H.; Oh, J.Y.; Chang, S.; Lee, S. Case study of volume loss estimation during slurry TBM tunnelling in weathered zone of granite rock. J. Korean Tunn. Undergr. Space Assoc. 2016, 18, 61–74. [Google Scholar] [CrossRef]
- Finno, R.J.; Harahap, I.S.; Sabatini, P.J. Analysis of braced excavations with coupled finite element formulations. Comput. Geotech. 1991, 12, 91–114. [Google Scholar] [CrossRef]
- Ercelebi, S.; Copur, H.; Ocak, I. Surface settlement predictions for Istanbul Metro tunnels excavated by EPB-TBM. Environ. Earth Sci. 2011, 62, 357–365. [Google Scholar] [CrossRef]
- Xie, X.; Yang, Y.; Ji, M. Analysis of ground surface settlement induced by the construction of a large-diameter shield-driven tunnel in Shanghai, China. Tunn. Undergr. Space Technol. 2016, 51, 120–132. [Google Scholar] [CrossRef]
- Do, T.N.; Wu, J.H.; Lin, H.M. Investigation of sloped surface subsidence during inclined seam extraction in a jointed rock mass using discontinuous deformation analysis. Int. J. Geomech. 2017, 17, 04017021. [Google Scholar] [CrossRef]
- Alsirawan, R.; Sheble, A.; Alnmr, A. Two-dimensional numerical analysis for tbm tunneling-induced structure settlement: A proposed modeling method and parametric study. Infrastructures 2023, 8, 88. [Google Scholar] [CrossRef]
- Yun, J.S.; Kim, H.E.; Nam, K.M.; Jung, Y.R.; Cho, J.E.; Yoo, H.K. Analysis of the influence of existing parallel tunnels according to the location of the new tunnel. J. Korean Tunn. Undergr. Space Assoc. 2022, 24, 193–215. [Google Scholar]
- Marshall, A. Tunnelling in Sand and Its Effect on Pipelines and Piles. Ph.D. Thesis, University of Cambridge, Cambridge, UK, 2009. [Google Scholar]
- Attewell, P.; Woodman, J. Predicting the dynamics of ground settlement and its derivatives caused by tunnelling in soil. Ground Eng. 1982, 15, 13–20. [Google Scholar]
- He, R.; Zhou, Z.; Li, S.; Vanapalli, S. Investigating surface settlements during shield tunneling using numerical analysis. Sustainability 2025, 17, 20. [Google Scholar] [CrossRef]
- Chakeri, H.; Unver, B.; Ozcelik, Y. A novel relationship for predicting the point of inflexion value in the surface settlement curve. Tunn. Undergr. Space Technol. 2014, 43, 266–275. [Google Scholar] [CrossRef]
- Papadopoulou, K.V. Surface Settlements Induced by Shallow Tunnels—The Case of Athens Metro. In Expanding Underground—Knowledge and Passion to Make a Positive Impact on the World; CRC Press: Boca Raton, FL, USA, 2023; pp. 843–851. [Google Scholar]
- Tyrer, J.; Paraskevopoulou, C.; Shah, R.; Miller, R.; Kavvadas, M. Tunnelling with full-face shielded machines: A 3D numerical analysis of an earth pressure balance (EPB) excavation sequence using the finite element method (FEM). Geosciences 2023, 13, 244. [Google Scholar] [CrossRef]
- Galli, G.; Grimaldi, A.; Leonardi, A. Three-dimensional modelling of tunnel excavation and lining. Comput. Geotech. 2004, 31, 171–183. [Google Scholar] [CrossRef]
- Janin, J.P.; Dias, D.; Emeriault, F.; Kastner, R.; Le Bissonnais, H.; Guilloux, A. Numerical back-analysis of the Southern Toulon tunnel measurements: A comparison of 3D and 2D approaches. Eng. Geol. 2015, 195, 42–52. [Google Scholar] [CrossRef]
- Kavvadas, M.; Litsas, D.; Vazaios, I.; Fortsakis, P. Development of a 3D finite element model for shield EPB tunnelling. Tunn. Undergr. Space Technol. 2017, 65, 22–34. [Google Scholar] [CrossRef]
- Gamnitzer, P.; Neuner, M.; Schreter-Fleischhacker, M.; Dummer, A.; Mader, T.; Smaniotto, S.; Hofstetter, G. Key features of numerical models for the FE-simulation of deep tunnel advance by the NATM. Undergr. Space 2024, 14, 357–376. [Google Scholar] [CrossRef]
- Mao, Z.; Ding, T.; Hu, F.; Ye, S.; Ding, L.; Zhang, X.; Li, P.; Li, N. The impact of different excavation support structures on the deformation and stability of adjacent station and tunnels. Buildings 2025, 15, 493. [Google Scholar] [CrossRef]
- Comodromos, E.M.; Papadopoulou, M.C.; Konstantinidis, G.K. Numerical assessment of subsidence and adjacent building movements induced by TBM-EPB tunneling. J. Geotech. Geoenviron. Eng. 2014, 140, 04014061. [Google Scholar] [CrossRef]
- Zeng, Y.; Wang, S.; Zhang, X.; Luo, M.; Zhu, J.; Bian, Y.; Gong, C.; Fu, Y.; Lv, Q.; Liang, N.; et al. Synchronous grouting analysis of shield tunneling through high water pressure fault fracture zone. Appl. Sci. 2023, 13, 12972. [Google Scholar] [CrossRef]
- KDS 27 25 00:2023; Design Standard for Tunnel Structures—TBM Tunnel. Ministry of Land, Infrastructure and Transport: Sejong, Republic of Korea, 2023.
- An, J.B.; Kang, S.J.; Kim, J.; Cho, G.C. Numerical evaluation of surface settlement induced by ground loss from the face and annular gap of EPB shield tunneling. Geomech. Eng. 2022, 29, 291–300. [Google Scholar]
- Do, N.A.; Dias, D.; Vu, T.T.; Dang, V.K. Impact of the shield machine’s performance parameters on the tunnel lining behaviour and settlements. Environ. Earth Sci. 2021, 80, 507. [Google Scholar] [CrossRef]
- Aswathy, M.S.; Vinoth, M.; Mittal, A. Impact of governing factors on prediction of tunneling induced surface settlement in young alluvium deposit. Indian Geotech. J. 2021, 52, 13–27. [Google Scholar] [CrossRef]
- Wang, F.; Du, X.; Li, P. Predictions of ground surface settlement for shield tunnels in sandy cobble stratum based on stochastic medium theory and empirical formulas. Undergr. Space 2023, 11, 189–203. [Google Scholar] [CrossRef]
- Sohaei, H.; Hajihassani, M.; Namazi, E.; Marto, A. Experimental study of surface failure induced by tunnel construction in sand. Eng. Fail. Anal. 2020, 118, 104897. [Google Scholar] [CrossRef]
- Attewell, P.; Farmer, I. Ground disturbance caused by shield tunnelling in a stiff, overconsolidated clay. Eng. Geol. 1974, 8, 361–381. [Google Scholar] [CrossRef]
- Mair, R. Geotechnical aspects of soft ground tunnelling. In Proceedings of the 1st International Symposium on Construction Problems in Soft Soils, Singapore, 1–3 December 1983. [Google Scholar]
- Arioglu, E. Surface Movements Due to Tunnelling Activities in Urban Areas and Minimization of Building Damages; Short Course, Istanbul Technical University, Mining Engineering Department: Istanbul, Turkey, 1992. [Google Scholar]
- Ahmadi, M.; Shirazi, M. Longitudinal settlement profile in EPB shield tunneling. In Proceedings of the 3rd Iranian Conference on Geotechnical Engineering, Tehran, Iran, 23 October 2018. [Google Scholar]
- Kim, H.E.; Nam, K.M.; Ha, S.G.; Yoo, H.K. A numerical study on the behavior of existing and enlarged tunnels when widened by applying the pre-cutting method. J. Korean Tunn. Undergr. Space Assoc. 2020, 22, 451–468. [Google Scholar]
- Ma, F.; Li, S.; Wang, Q. Study on the impact of deep foundation excavation of reclaimed land on the deformation of adjacent subway tunnels. Buildings 2024, 14, 1771. [Google Scholar] [CrossRef]
- Ding, W.; Wang, H.; Liu, K.; Hou, M.; Chen, R. Stability evaluation model of a tunnel face excavated by the benching method in a soft silty clay layer. Int. J. Geomech. 2021, 21, 04021022. [Google Scholar] [CrossRef]
- Liu, W.; Liang, J.; Xu, T. Tunnelling-induced ground deformation subjected to the behavior of tail grouting materials. Tunn. Undergr. Space Technol. 2023, 140, 105253. [Google Scholar] [CrossRef]
- Min, K.C. Numerical investigation on the effects of TBM face support pressures—A parametric study. J. Teknol. (Sci. Eng.) 2025, 87, 351–360. [Google Scholar]
- Kim, K.S.; Oh, J.Y.; Lee, H.B.; Kim, D.K.; Choi, H.S. Critical face pressure and backfill pressure in shield TBM tunneling on soft ground. Geomech. Eng. 2018, 15, 823–831. [Google Scholar]
- Feng, X.; Wang, P.; Liu, S.; Wei, H.; Miao, Y.; Bu, S. Mechanism and law analysis on ground settlement caused by shield excavation of small-radius curved tunnel. Rock Mech. Rock Eng. 2022, 55, 3473–3488. [Google Scholar] [CrossRef]
- Zhang, Q.; Zhang, X.P.; Wang, H.J.; Liu, Q.S.; Xu, D.; Tang, S.H. Numerical study of the effect of grout material properties on ground deformation during shallow TBM tunneling. KSCE J. Civ. Eng. 2022, 26, 3590–3599. [Google Scholar] [CrossRef]
- Hong, J.P.; Ko, T.Y. Application of multiple linear regression analysis and tree-based machine learning techniques for cutter life index (CLI) prediction. Tunn. Undergr. Space 2023, 33, 594–609. [Google Scholar]
- Shin, H.; Bang, E.S. Estimation of soil depth using improved topographic attributes in mountainous area. J. Korean Geotech. Soc. 2024, 40, 125–137. [Google Scholar]
- Jun, G.; Kim, D. A study on key factors of ground settlement due to shield TBM excavation using numerical analysis and field measurement comparison. J. Korean Geosynth. Soc. 2017, 16, 63–72. [Google Scholar] [CrossRef][Green Version]
Disclaimer/Publisher’s Note: The statements, opinions and data contained in all publications are solely those of the individual author(s) and contributor(s) and not of MDPI and/or the editor(s). MDPI and/or the editor(s) disclaim responsibility for any injury to people or property resulting from any ideas, methods, instructions or products referred to in the content. |
© 2025 by the authors. Licensee MDPI, Basel, Switzerland. This article is an open access article distributed under the terms and conditions of the Creative Commons Attribution (CC BY) license (https://creativecommons.org/licenses/by/4.0/).