Article

A Flood Prevention Design for Guangzhou Metro Stations Under Extreme Rainfall Based on the SCS-CN Model

by
Xin Chen
1,
Hongyu Kuai
2,
Xiaoqian Liu
2 and
Bo Xia
2,*
1
Guangzhou Metro Design & Research Institute Co., Ltd., Guangzhou 510010, China
2
School of Architecture, Chang’an University, Xi’an 710064, China
*
Author to whom correspondence should be addressed.
Buildings 2025, 15(10), 1689; https://doi.org/10.3390/buildings15101689
Submission received: 7 April 2025 / Revised: 6 May 2025 / Accepted: 11 May 2025 / Published: 16 May 2025

Abstract

With the intensification of global climate change, the underground rail transit system of Guangzhou, as a major coastal city, faces severe flood risks. Through field investigations of 313 metro stations, this study identified 472 flood-related risk points, primarily involving water backflow at low-lying stations, insufficient elevation of structural components, and the threat of overbank flooding from adjacent rivers. By integrating GIS-based spatial analysis with the SCS-CN runoff model, an extreme rainfall scenario (534.98 mm) was simulated, revealing a maximum runoff depth of 484.23 mm. Based on these results, it is recommended to raise the flood protection design elevation to 582 mm and install additional waterproof barriers. Optimization strategies include establishing flood protection standards for new stations based on site topography and runoff volume, elevating station platforms or adding waterproof structures at existing stations, and upgrading drainage systems with real-time monitoring and early-warning mechanisms. This study emphasizes the necessity for Guangzhou’s metro system to integrate climate-adaptive urban planning and technological innovation to enhance flood resilience and promote sustainable urban development.

1. Introduction

In recent years, rapid urbanization has significantly altered urban rainfall–runoff processes and led to a notable increase in the frequency of extreme rainfall events in China [1]. Many regions have experienced rare and prolonged heavy rainfall, resulting in cascading disasters such as flash floods, urban waterlogging, landslides, and mudslides. These events pose serious threats to public safety and property and present growing challenges to both urban and rural drainage systems. Although heavy rainfall has severely impacted rural areas, its consequences are often more acute in urban settings where existing drainage infrastructure is under unprecedented stress. Simultaneously, due to limited above-ground space, the development of underground structures—such as metro systems, subterranean shopping centers, and underground parks—has accelerated. However, these developments have introduced new vulnerabilities as underground spaces are more prone to damage from extreme natural hazards, including settlement, inundation, and structural failure during flood events.
In response to these challenges, research on metro flood prevention has increasingly shifted from broad regional flood risk assessments toward detailed evaluations of inundation scenarios specific to underground infrastructure [2]. Initially focused on risk estimation, recent studies emphasize the need to upgrade and reinforce existing facilities. Internationally, flood risk assessment frameworks have become more systematic. For example, Lyu et al. (2019) categorized flood risk assessment methods into four main types, statistical analysis, multi-criteria decision-making, GIS and remote sensing-based spatial analysis, and scenario simulation, establishing a foundation for quantitative flood risk evaluation [2]. Aokia et al., using the Tokyo Metro as a case study, developed a hierarchical system of waterproof gates and dynamic drainage mechanisms to manage the compound threats of sea-level rise and extreme precipitation [3]. Similarly, Marttello et al. constructed a flood loss prediction model for coastal rail systems, emphasizing the integration of climate scenarios (e.g., RCP 8.5) into full life-cycle infrastructure planning [4]. In China, research has primarily focused on integrating regional case studies with technological approaches. Qiu Hongsheng et al. applied numerical simulation methods to analyze water ingress impacts on underground tunnel structures [5]. Lyu et al. (2019) combined GIS and the SWMM model to investigate flood risk spatial distributions in the Guangzhou Metro, proposing a station avoidance principle for high-risk zones [6]. Jiang Yuchao et al. developed a dynamic model to simulate metro waterlogging under extreme rainfall, quantifying the influence of permeable and impermeable surfaces on flood propagation [7]. Researchers like Quan Xiaofeng and Xie Qiaojun have optimized flood prevention standards for Shanghai and Guangzhou, promoting detailed flood prevention provisions in the “Metro Design Specifications” [8,9].
Major cities such as Guangzhou, Shenzhen, and Zhengzhou have established extensive metro networks. As the backbone of urban transportation, metro systems alleviate traffic congestion, enhance travel efficiency, and stimulate economic development. With ongoing urbanization and population growth, metros have become essential to daily urban life. However, the growing intensity and frequency of extreme rainfall events pose significant challenges to metro operations, including risks of flood intrusion, infrastructure damage, service disruption, and threats to passenger safety. Therefore, it is imperative to strengthen flood prevention systems, improve emergency response capabilities, modernize infrastructure, and integrate climate resilience into urban planning and design to ensure the safe and sustainable operation of metro systems.
Located in southern coastal China, Guangzhou is subject to a subtropical monsoon climate, facing persistent threats of high-intensity rainfall throughout the year. Particularly concerning is the increasing frequency and severity of short-duration, high-intensity rainfall events, which pose a critical risk to metro system safety. Urbanization has also led to a rise in impervious surfaces, intensifying flooding and waterlogging. Furthermore, Guangzhou’s complex terrain, dense population, and high concentration of assets magnify the potential impact of flood disasters. Consequently, the development and implementation of scientific and systematic flood prevention strategies are essential for protecting life and property, supporting sustainable urban development, and enhancing the city’s resilience.
Although China’s metro construction began relatively late, significant progress has been made in metro flood prevention theory, risk assessment, and emergency response strategies [10]. Nonetheless, practical challenges remain—particularly in the context of increasingly frequent extreme rainfall. Enhancing metro flood resilience in a scientific and rational manner has thus emerged as a key concern for urban sustainability. This study aims to address this gap by conducting field surveys on the current flood protection status of Guangzhou metro stations, employing the SCS-CN runoff model and simulating extreme rainfall events to systematically assess metro flood risks and propose targeted optimization strategies.

2. Analysis of the Flood Prevention Status of the Guangzhou Metro

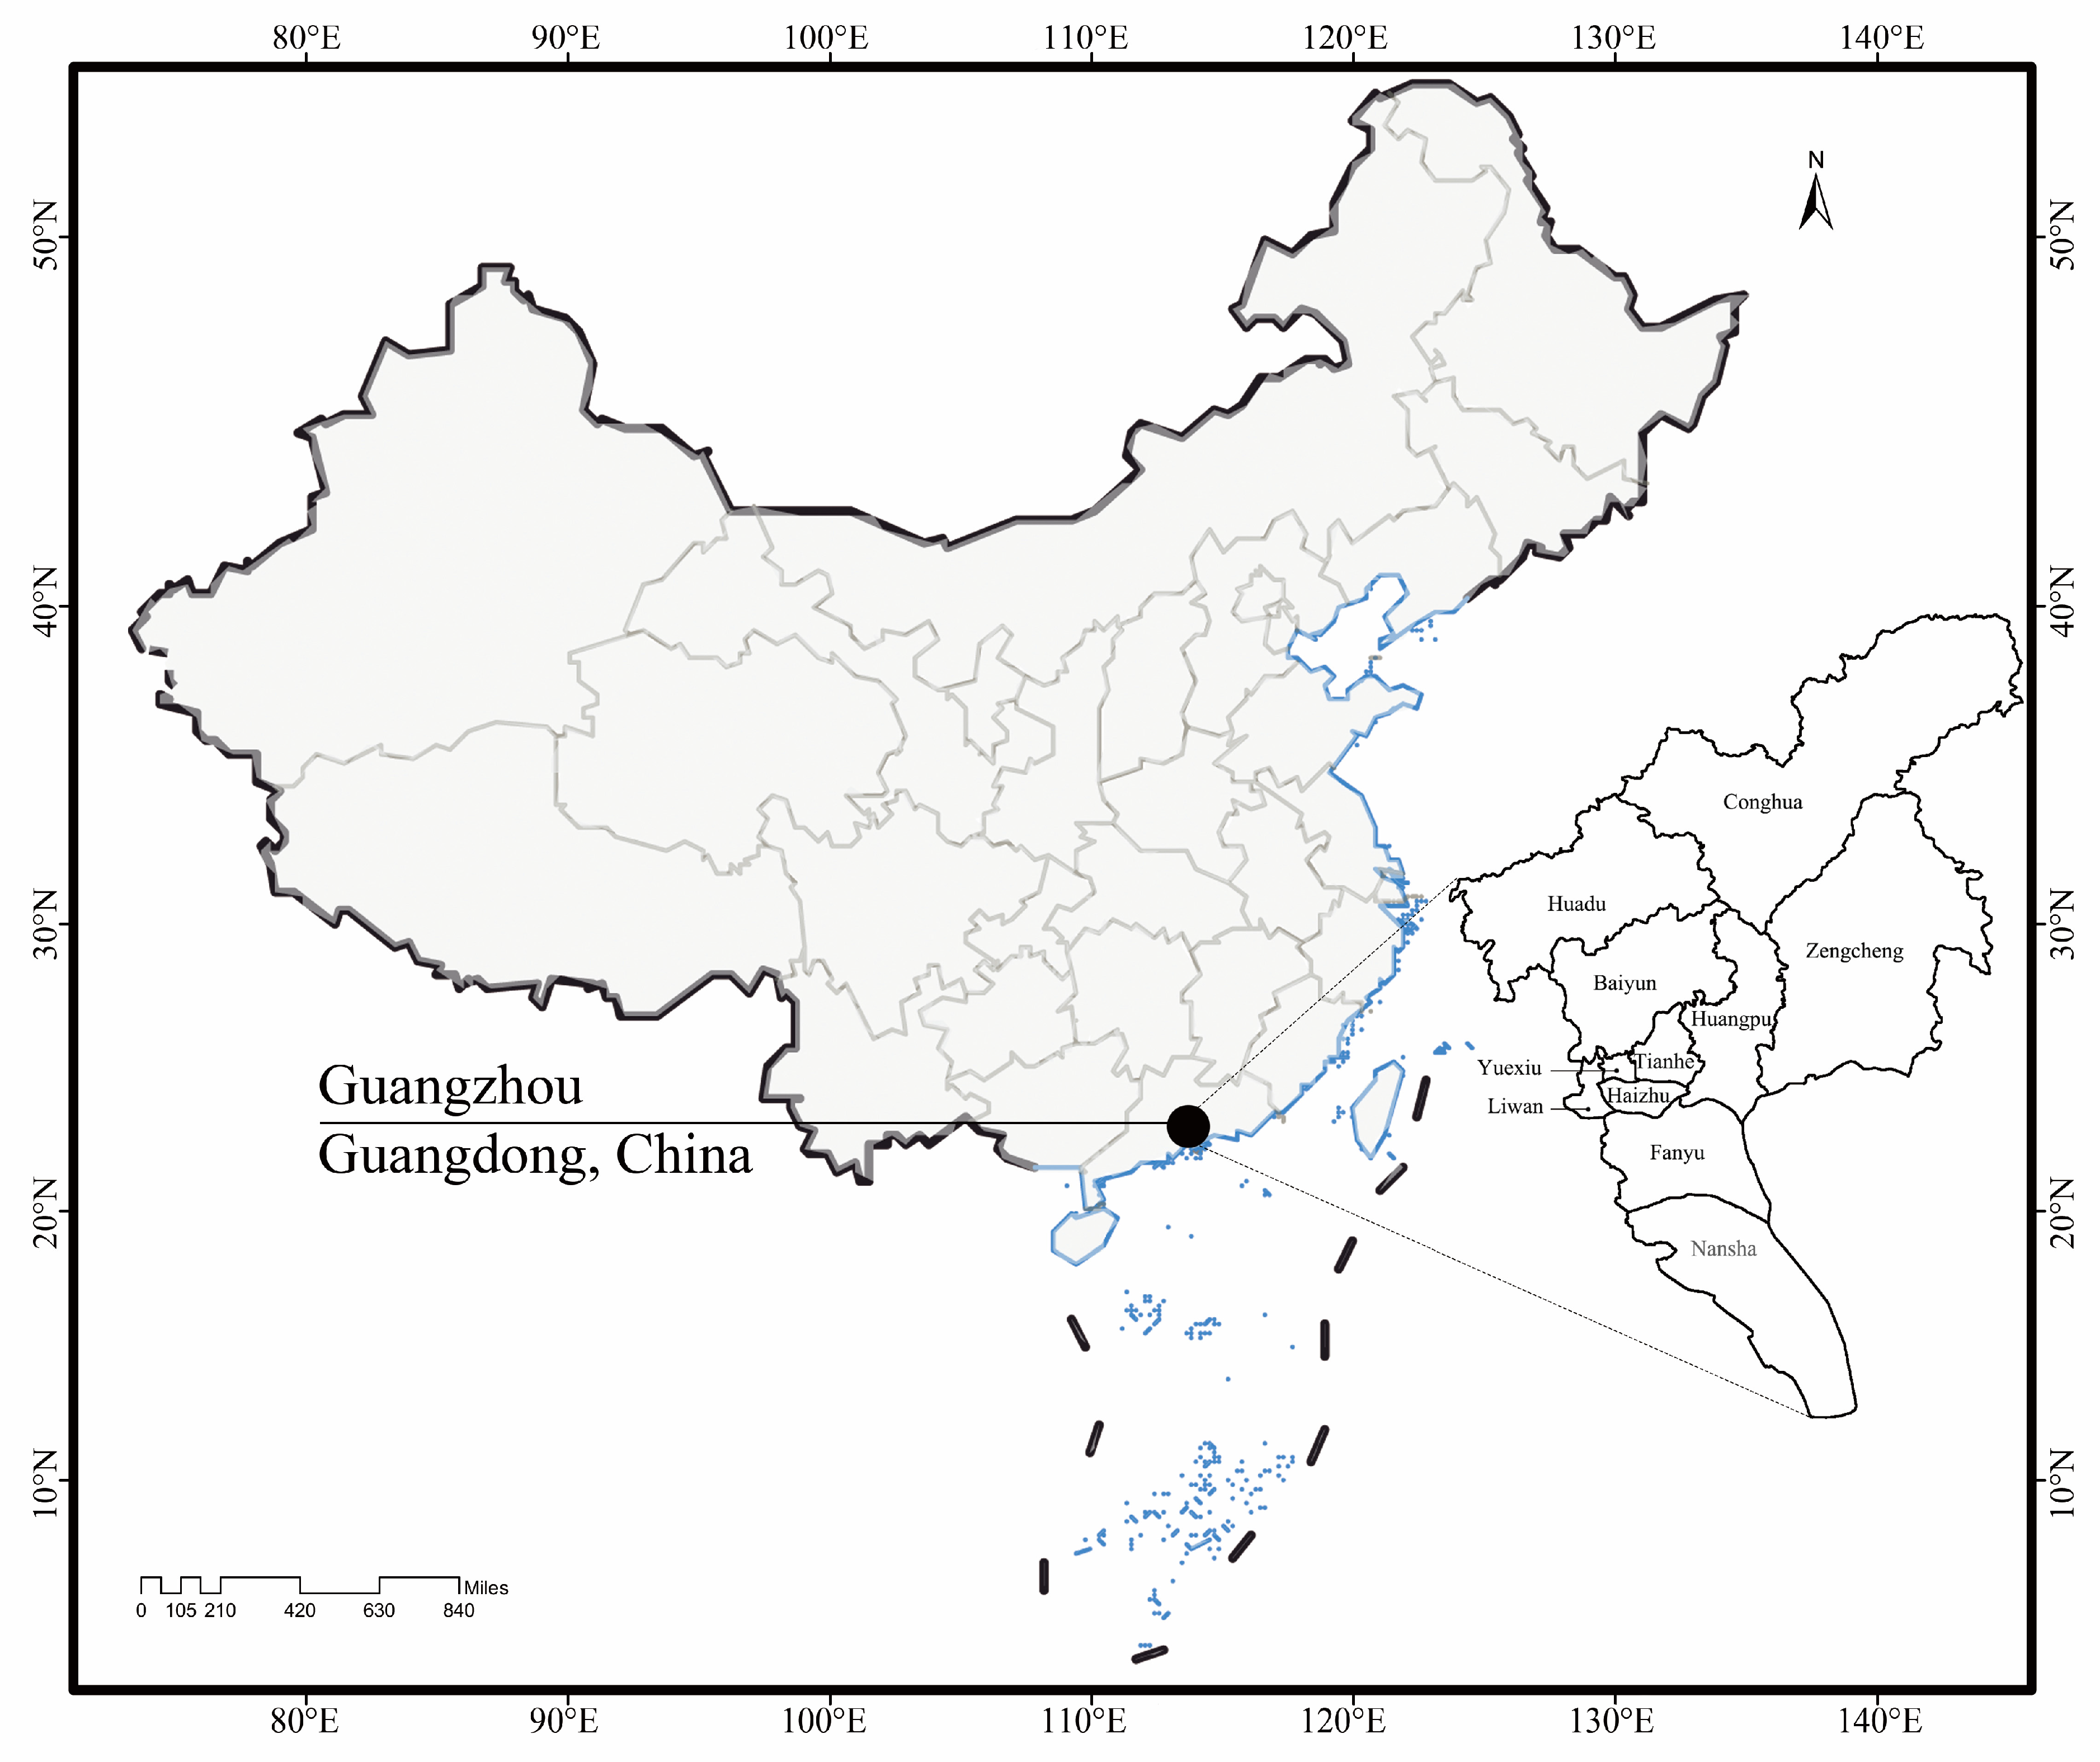
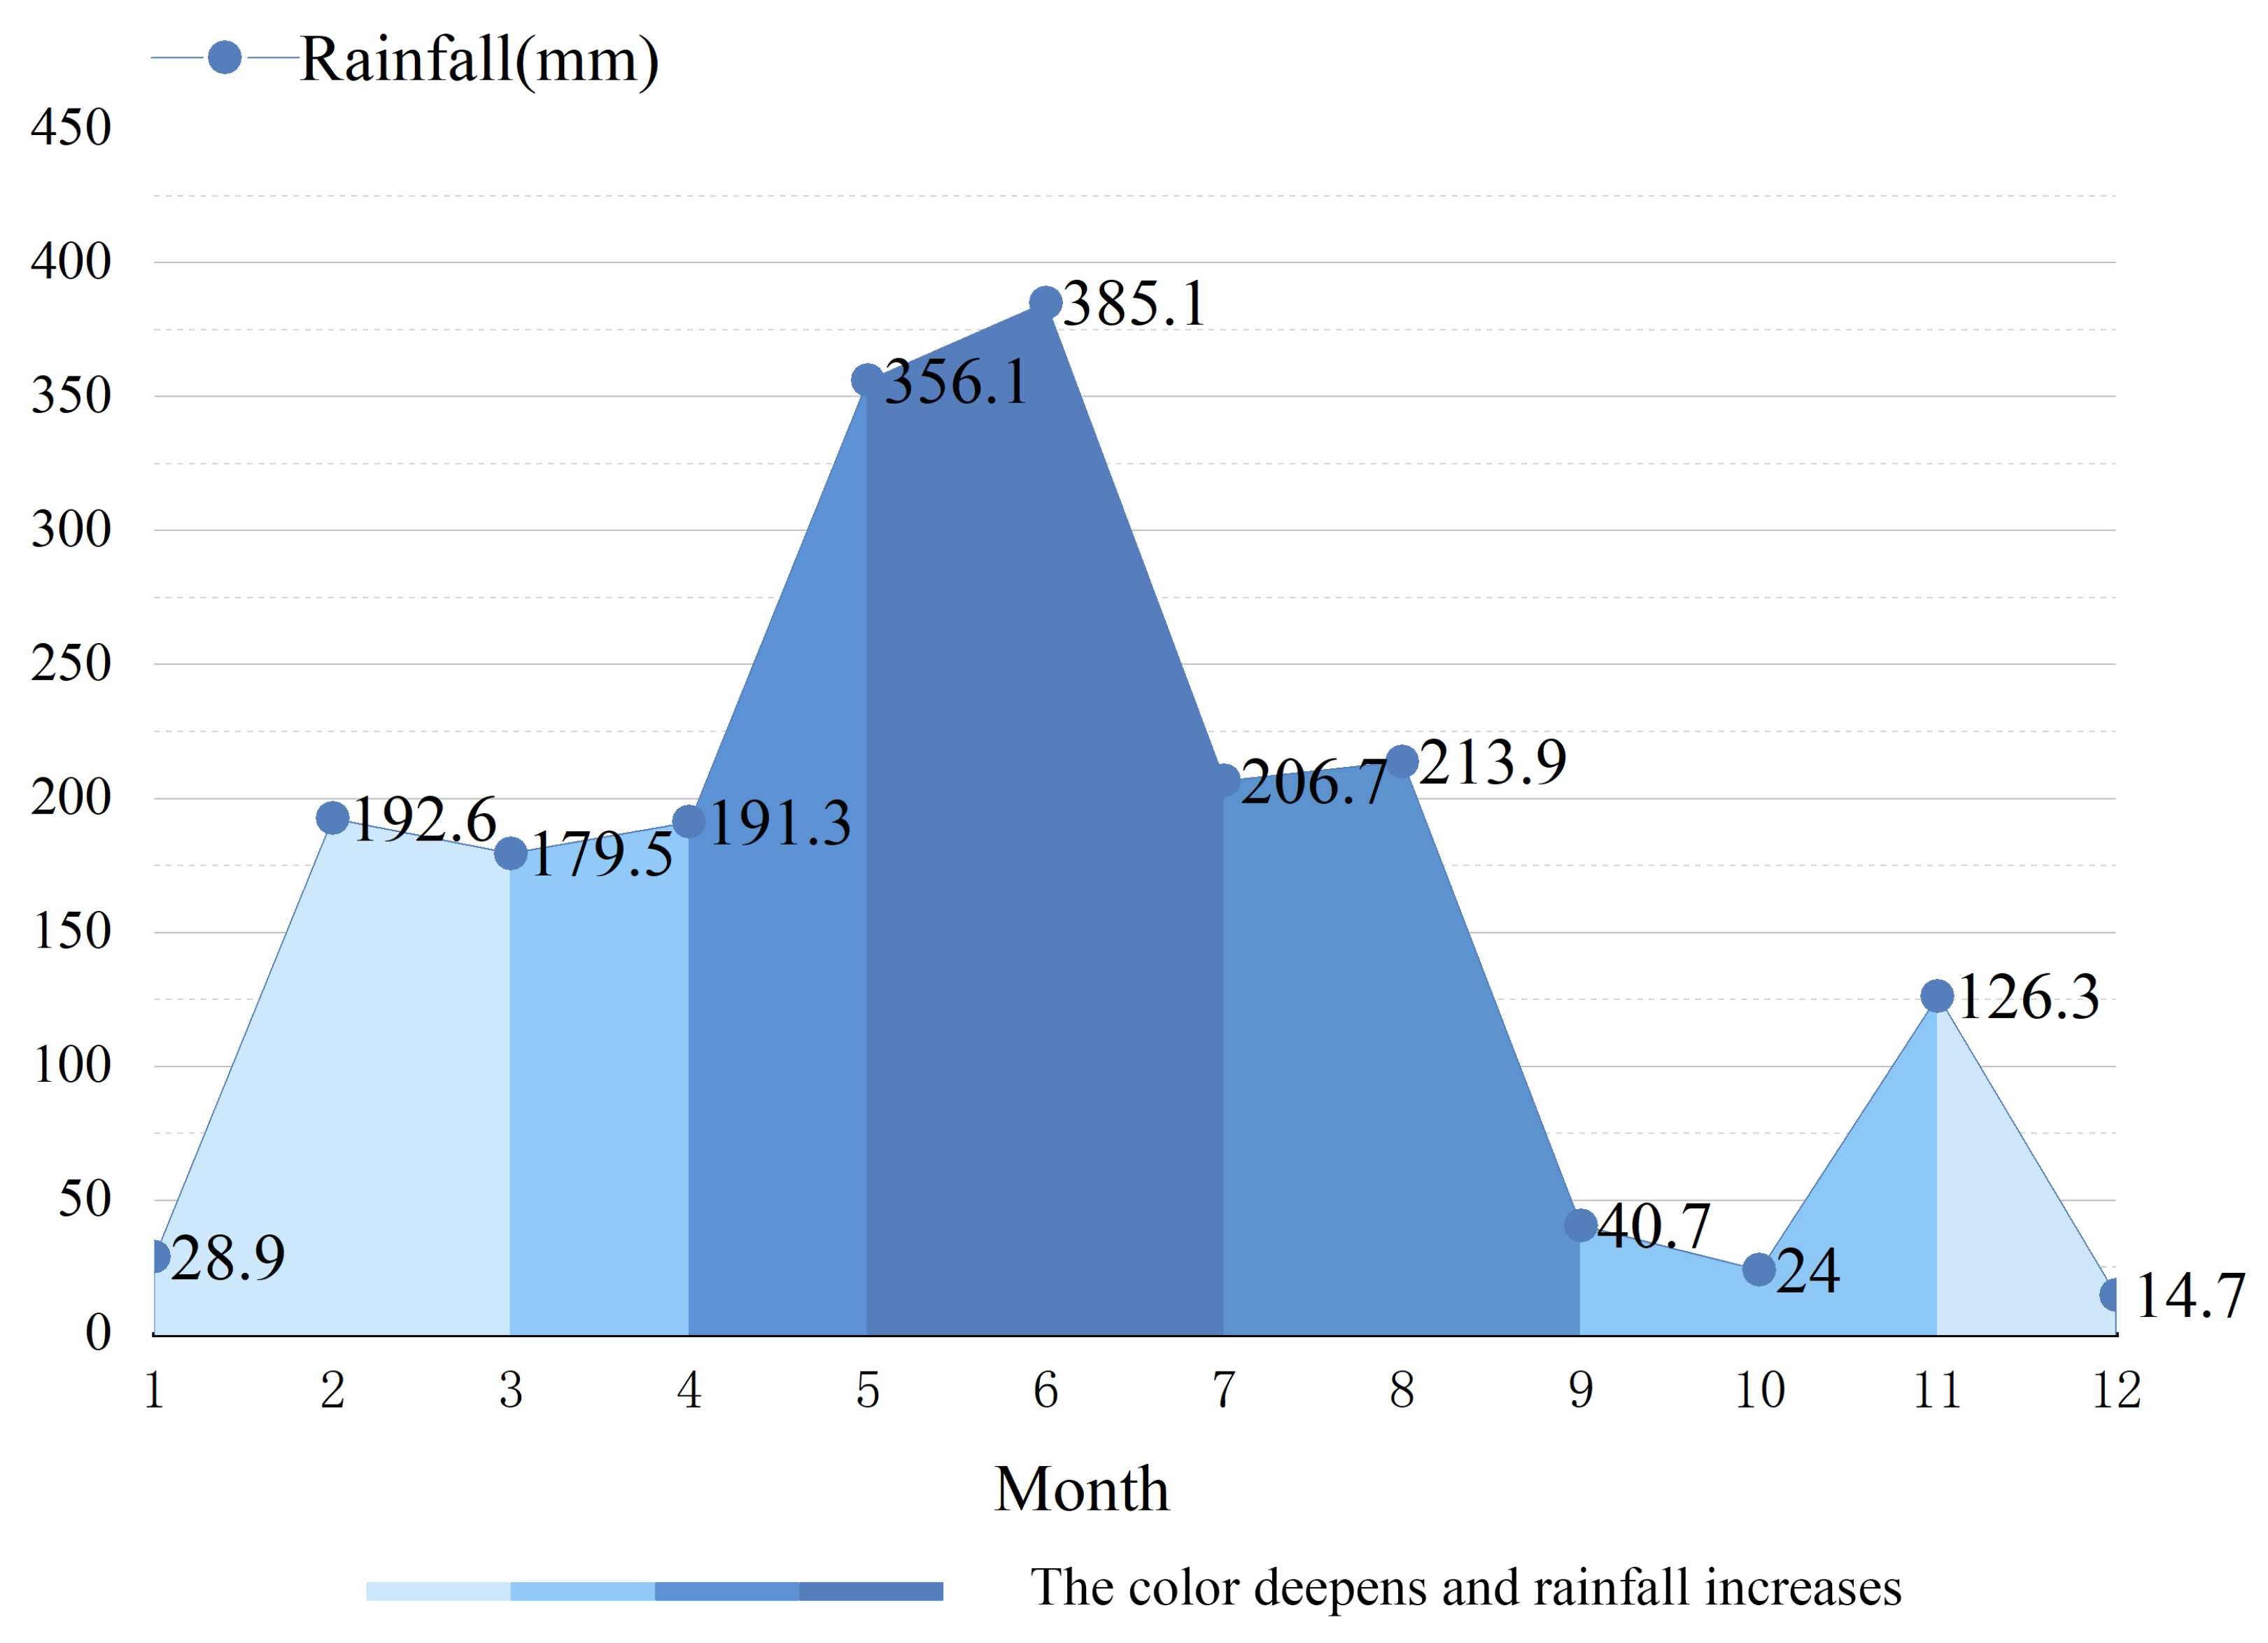
2.1. Climate and Flood Risk of the Guangzhou Metro

Guangzhou is located in the southern coastal region of China and is influenced by a subtropical monsoon climate with abundant rainfall, as illustrated in Figure 1. The annual precipitation typically ranges between 1500 and 2000 mm, with some areas even exceeding 2000 mm. The flood season (April to September) is characterized by concentrated rainfall, especially from May to August, during which rainfall can account for over 70% of the total annual precipitation, as shown in Figure 2 and Figure 3.
Rainfall intensity increases significantly during the flood season, particularly during the typhoon period, when short-duration, high-intensity rainfall events are becoming increasingly frequent and severe. On 22 May 2020, Guangzhou’s Huangpu and Zengcheng districts were hit by an extreme rainfall event, commonly referred to as the “5·22” storm. This event was characterized by intense precipitation over a short duration, extensive spatial coverage, and rapid accumulation rates. In some locations, the total rainfall over a 180 min period reached 302.2 mm—well above the threshold for a once-in-a-century storm. As a result, severe waterlogging and backflow occurred at multiple metro stations, including the Guanhu and Xinsha stations on Line 13, ultimately leading to the complete suspension of metro services, as shown in Figure 4 and Figure 5 [11].
Furthermore, several stations along Line 13—such as Guanhu and Xinsha—are situated in low-lying areas formed by natural bowl-shaped topography, surrounded by mountains on three sides. This geomorphology causes mountain floodwaters and surface runoff to converge, making these metro stations natural discharge points for excess water. Similarly, Nan’gang station, located near Longtou Mountain Forest Park, is positioned in a topographical depression. These geographical conditions significantly increase the likelihood of water accumulation during periods of heavy rainfall, as illustrated in Figure 6. The “5·22” rainfall event not only resulted in substantial economic losses but also highlighted the vulnerability of Guangzhou’s underground transportation infrastructure under extreme weather conditions—particularly the inadequacy of flood prevention standards and the limited drainage capacity of the urban system.
Against the backdrop of accelerating global climate change, extreme weather events are becoming more frequent and more destructive. Guangzhou, a major coastal city with an annual average precipitation of approximately 2000 mm, is especially vulnerable. Notably, 23% of the central urban area lies below the once-in-a-century tidal level of the Pearl River. When combined with extreme rainfall during the typhoon season, the risk of urban waterlogging is significantly magnified. This situation is particularly critical for the metro system, which constitutes the core of the city’s underground transport network. Approximately 76% of metro track segments are located below the elevation of adjacent municipal roads, increasing their susceptibility to flooding.
During the 2021 “5·22” extreme rainfall event, key transfer stations such as Zhujiang New Town experienced backflow incidents, exposing three critical systemic vulnerabilities: (1) a misalignment between the existing flood protection standard (a 1-in-100-year event) and the actual recurrence frequency of extreme weather; (2) the absence of an integrated, multi-scale flood risk coupling assessment system; and (3) the lack of a real-time monitoring system, an early-warning mechanism, and an emergency response mechanism. These infrastructure weaknesses contributed to cascading failures, where localized flooding rapidly escalated into widespread metro service disruptions. The event impacted more than 10 million passengers and caused direct economic losses amounting to hundreds of millions of yuan.
Therefore, in-depth research into metro system flood vulnerability is urgently needed to define scientifically grounded flood prevention standards, implement targeted mitigation strategies, ensure passenger safety, and maintain continuous and stable metro operations—thereby reinforcing the resilience of urban infrastructure in the face of climate uncertainty.

2.2. Survey on the Flood Prevention Status of the Guangzhou Metro

2.2.1. Survey Plan

The survey aimed to analyze the existing flood prevention design issues of Guangzhou metro stations, providing a basis for the optimization of flood control facilities. By the end of 2023, the Guangzhou Metro operated 16 lines with a total of 313 stations. The specific survey methods and contents are as follows:
  • Elevation Measurement at Entrances and Ventilation Shafts:
The actual elevations of entrances, ventilation shafts, fire exits, accessible elevator entrances, cooling towers, and other key facilities at existing metro stations were measured. A total of 3069 elevation measurements were completed. The measured elevations were compared with the design elevations and combined with the flood prevention assessment results from the construction period, from which the adequacy of the on-site facilities in meeting flood prevention standards was evaluated. Level measurement was used for Line 13 and Line 14, while high-precision GPS measurement was employed for other lines.
  • Verification of Height Above Ground for Entrances and Ventilation Shafts:
The height from the ground to various station facilities such as entrances, ventilation shafts, section ventilation shafts, fire exits, accessible elevator entrances, and cooling towers was measured using a measuring rod. The measurements were compared with the relevant standards from the Metro Design Code [12], and evaluations were made based on these standards, the actual operational conditions, and the required specifications.
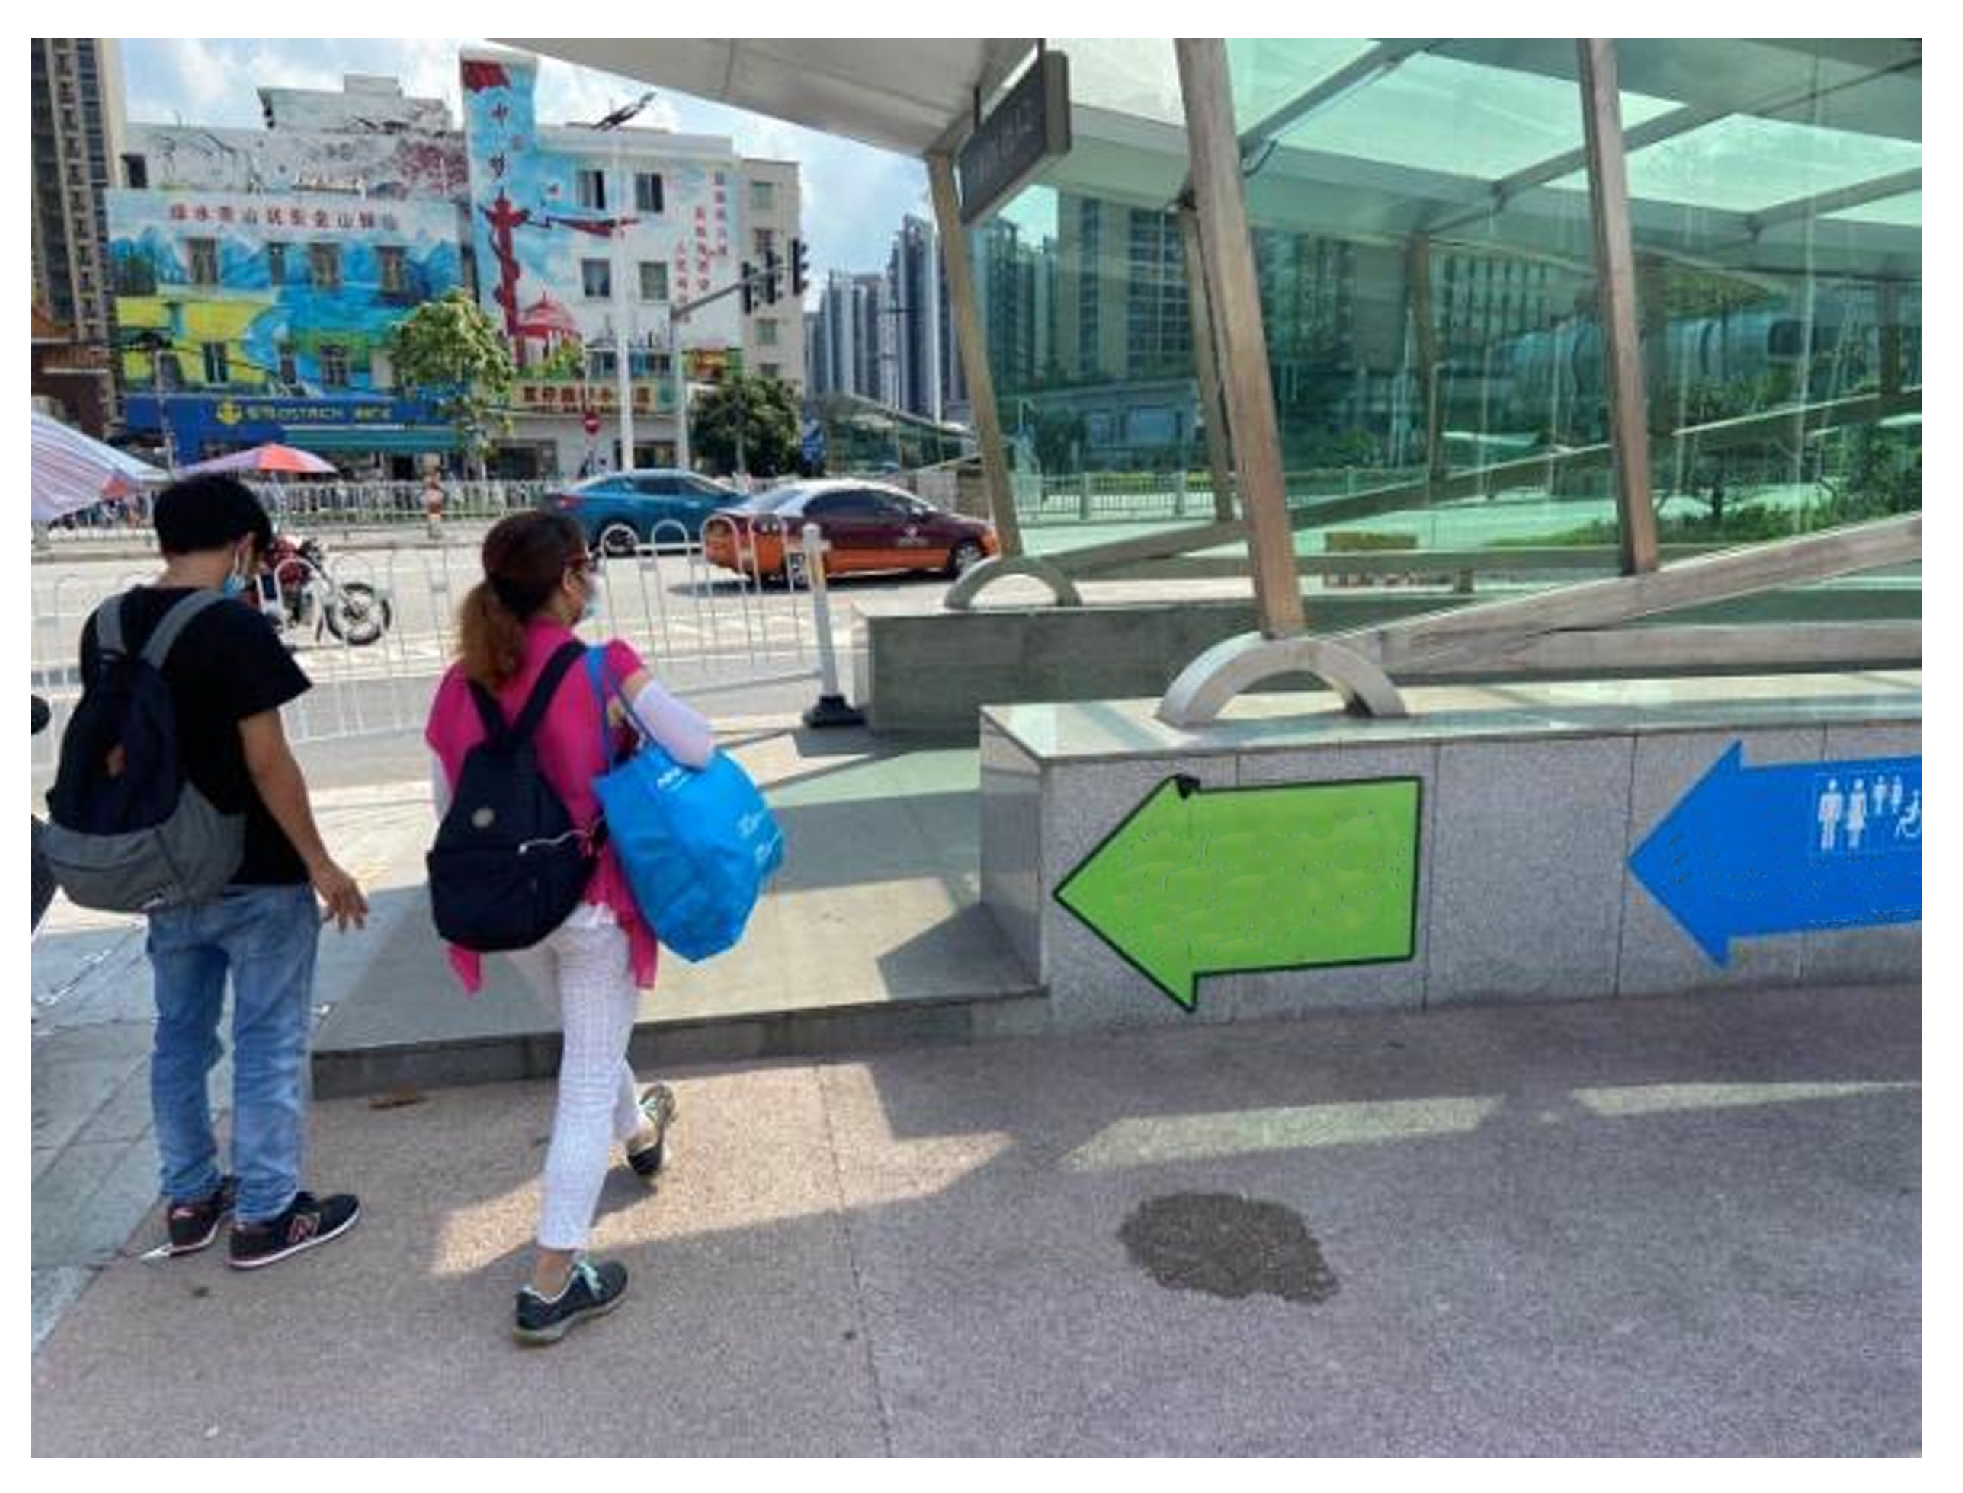
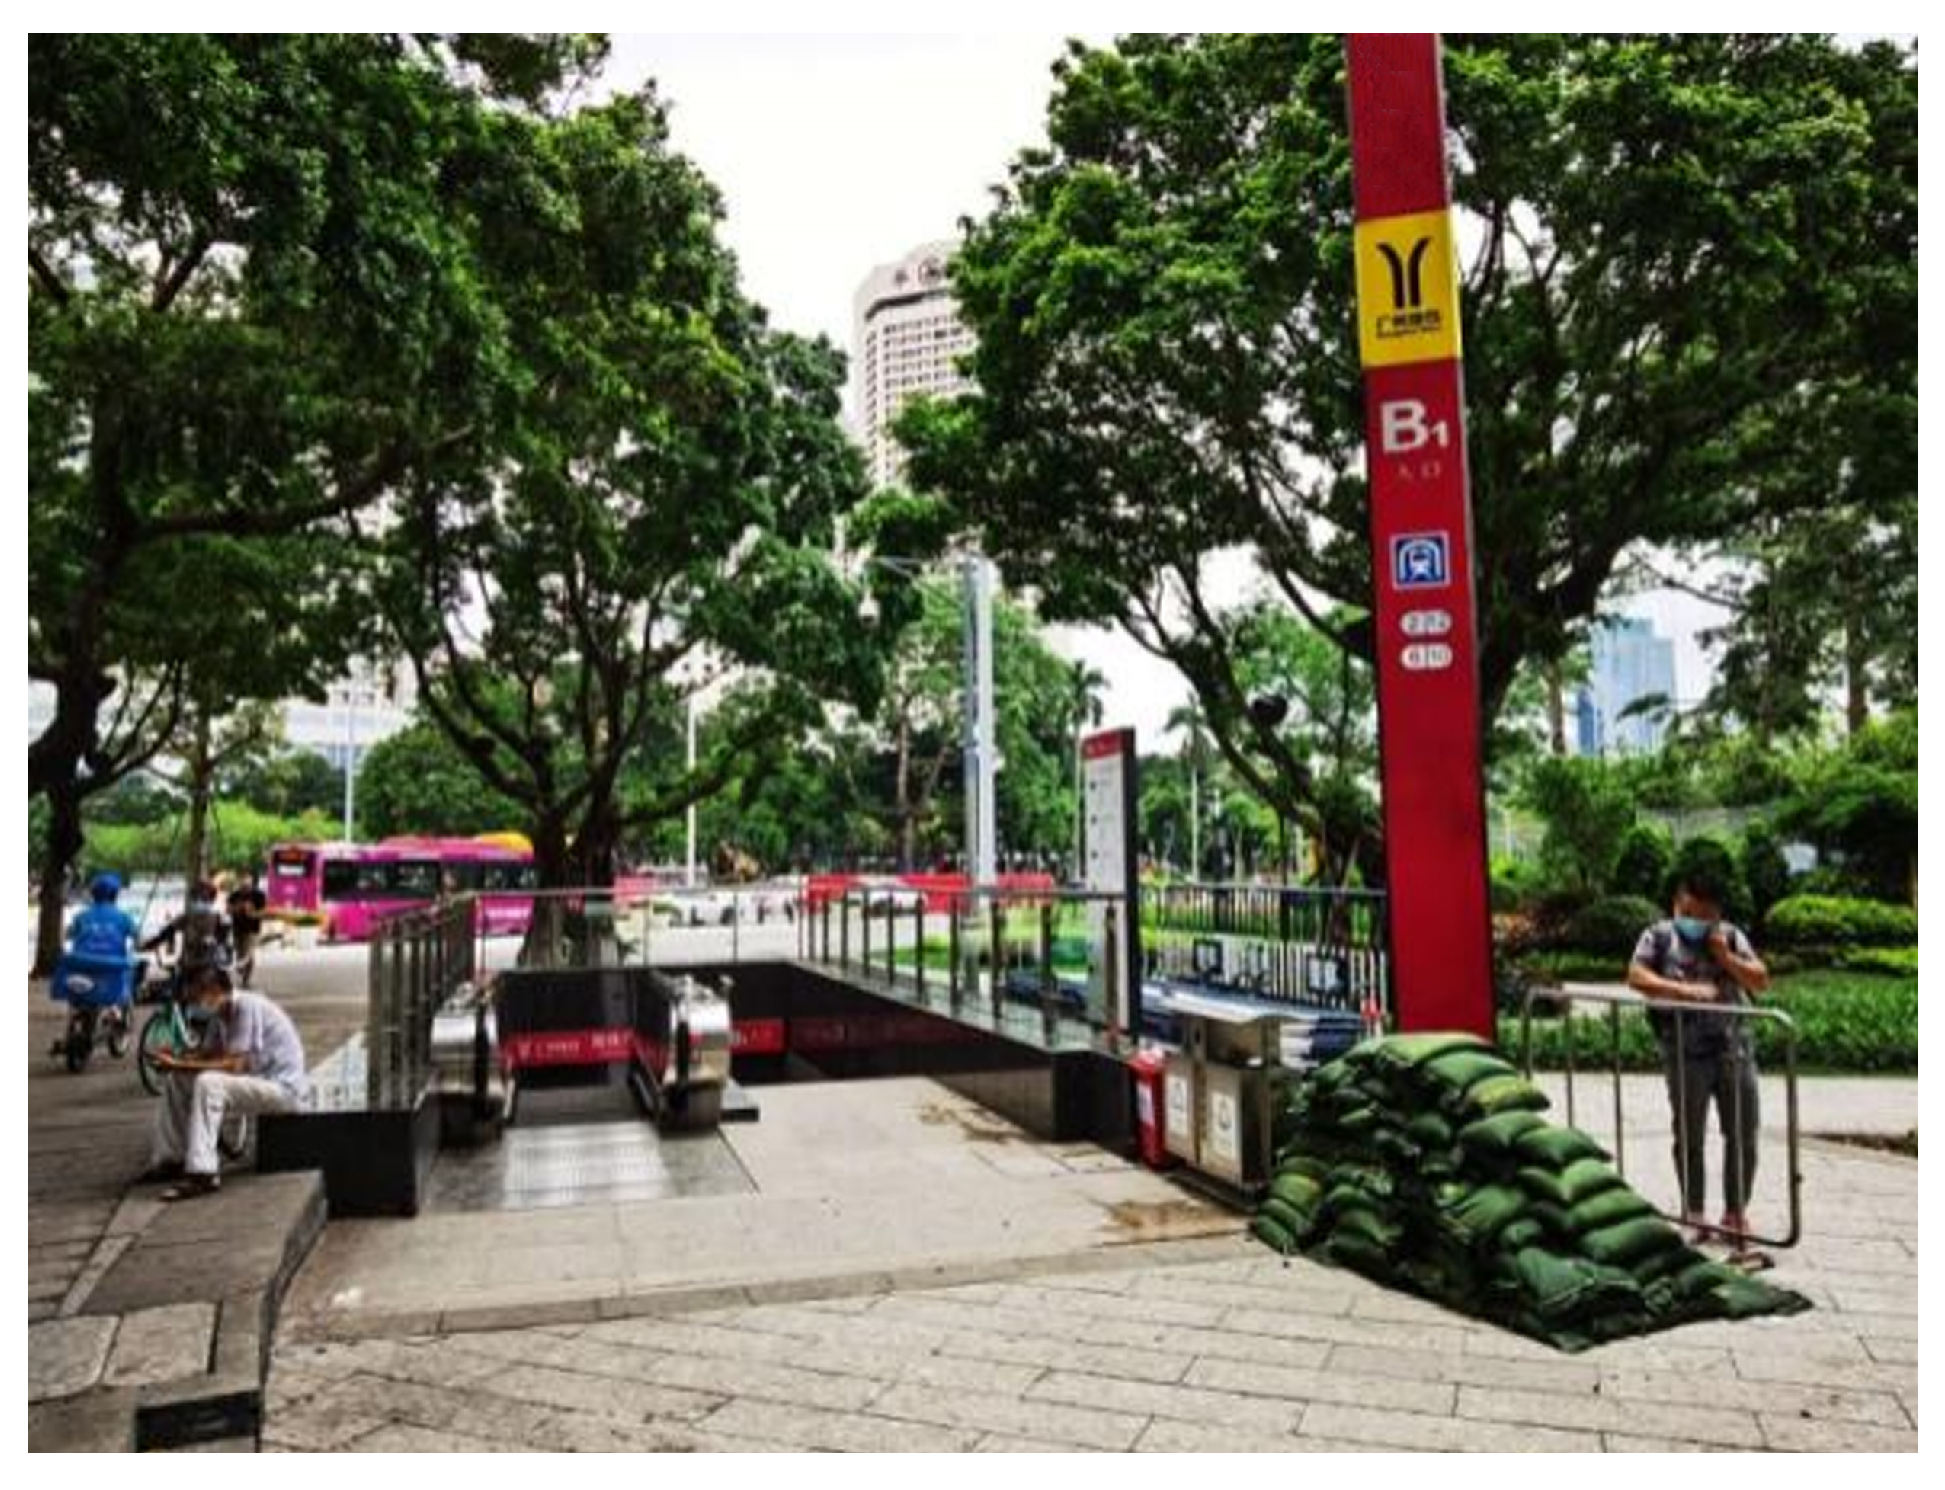
  • Environmental Survey of Entrance and Ventilation Shaft Facilities:
A comprehensive survey was conducted regarding the historical water levels at entrances, ventilation shafts, fire exits, accessible elevator entrances, cooling towers, and other facilities. This survey also included an assessment of surrounding drainage conditions and the relative elevations of these facilities in relation to the surrounding environment. This evaluation aimed to identify potential water accumulation risks and determine whether flood prevention measures are adequate.

2.2.2. Analysis of Flood Prevention Issues in the Guangzhou Metro

Through the survey of 16 operational lines and 313 stations of the Guangzhou Metro, a total of 472 issues related to flood prevention were identified. These issues can be categorized into four main aspects:
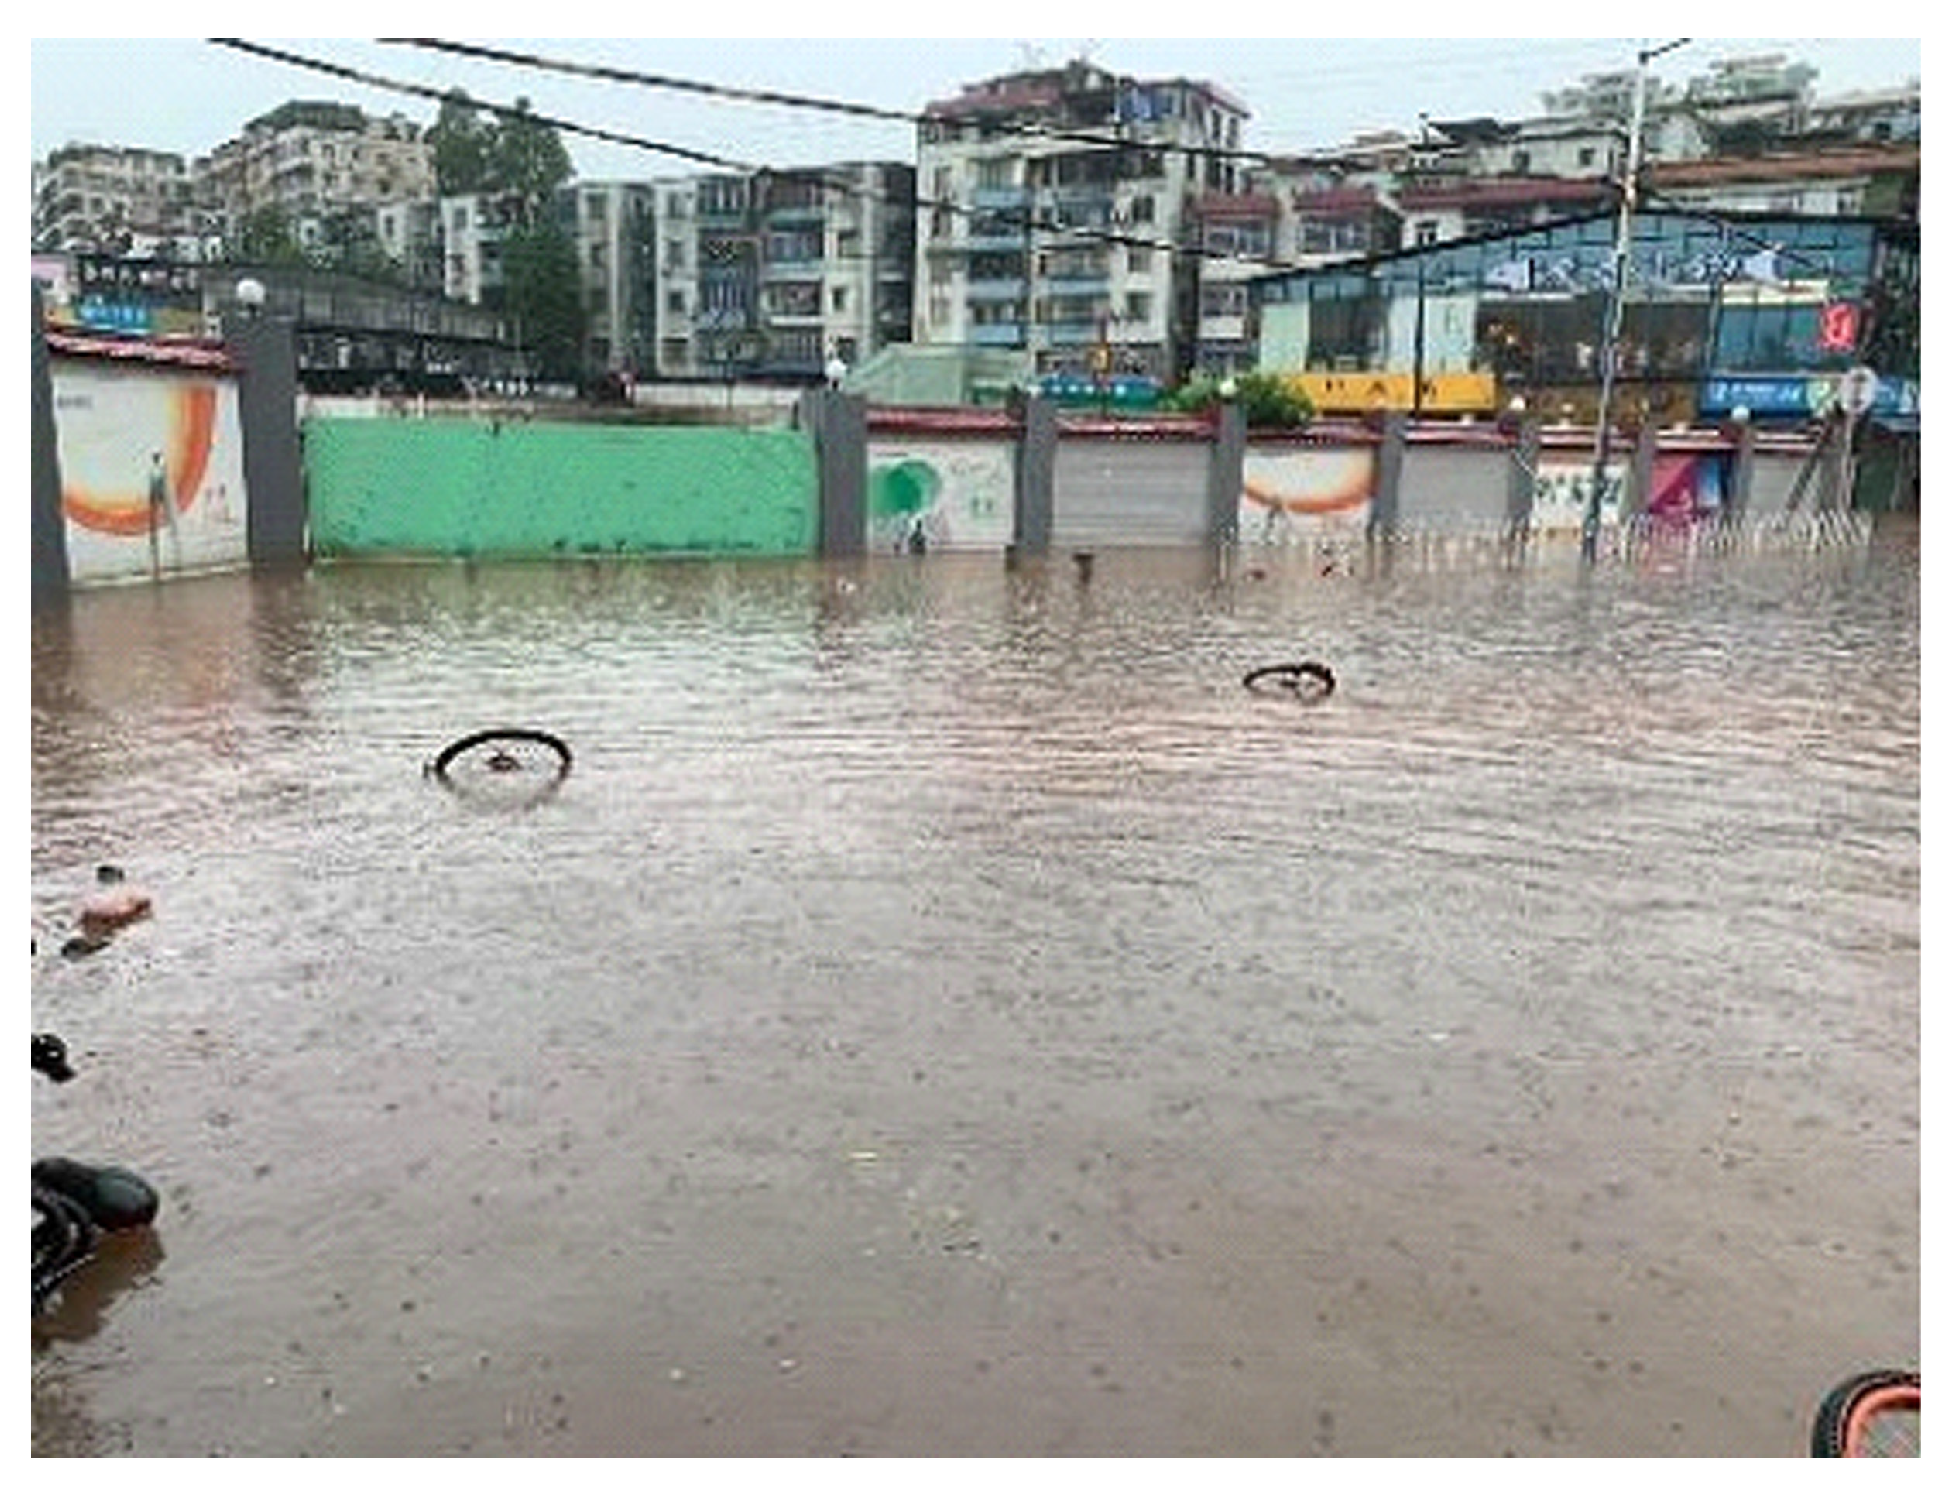
  • Flooding Due to Low Elevation or Steep Road Gradients:
Some metro stations are situated in low-lying areas or at the bottom of sloped terrain, making them highly susceptible to water accumulation during heavy rainfall events. For stations located at the lowest point along an inclined roadway, rainwater naturally converges and flows downhill toward the station. Similarly, stations with ground elevations lower than the surrounding municipal roads are at an increased risk as surface runoff from adjacent areas tends to flow directly into the station premises. This topographical vulnerability is illustrated in Figure 7.
2.
Insufficient Structural Height:
At certain stations, the structural elevation of equipment and facilities is lower than the design specifications or the height of exposed structures above ground fails to meet the required standards. These deficiencies significantly increase the risk of flooding when rainwater accumulates. For instance, at Zhongxin station the sunken cooling tower has a ground clearance of only 0.05 m, rendering it particularly vulnerable during periods of intense rainfall. Rainwater can easily infiltrate the cooling tower, potentially disrupting the normal operation of equipment. This condition is illustrated in Figure 8.
3.
Significant Impact from Municipal Engineering:
At some stations the external roads were built after the station, resulting in an insufficient elevation difference at the station entrances. Additionally, some stations are affected by poor municipal drainage systems, causing rainwater to overflow the station’s entrance steps and even backflow into the station. Moreover, certain stations are connected to municipal pedestrian overpasses where the ground-level entrance steps are too low and no flood barriers are installed, which allows rainwater to backflow into the station through the overpass. As shown in Figure 9, at the Conghua passenger station (D entrance) the ground-level entrance only has one step and no flood barrier is present, allowing rainwater to flow into the station during heavy rainfall.
4.
Flooding from Nearby Waterways:
Some metro stations are located adjacent to major water bodies, such as the Pearl River or the left bank of the Liuxi River. These areas are susceptible to riverine flooding, and there have been instances where river water has overtopped embankments and inundated station stairways. Additionally, such stations face heightened risks of water intrusion through ventilation shafts during high-water events. For example, at Haizhu Square station—situated near the Pearl River—heavy rainfall in June 2022 led to a significant rise in water levels, resulting in flooding along the Haizhu Square road section. Rainwater even backflowed from roadside drainage outlets directly into the station interior, as shown in Figure 10.
In summary, the field survey revealed that several Guangzhou Metro stations are prone to flooding during extreme rainfall events due to a combination of factors, including low-lying terrain, inadequate structural elevation, and insufficient elevation differences at station entrances. Additionally, the risk of rainwater backflow further exacerbates the vulnerability of these stations. These issues substantially affect metro operations during flood events and underscore the critical importance of entrance elevation design in flood mitigation strategies. Accordingly, accurately determining the design elevation for different components of metro stations—particularly entrances—emerges as a key challenge in enhancing the flood resilience of underground infrastructure.

3. Flood Prevention Design Methodology for Metro Systems

As a vital component of urban transportation, the scientific rigor and forward-looking nature of flood prevention design for metro systems are critical to ensuring operational safety and safeguarding passengers’ lives and property. Within this context, several key issues must be addressed in metro flood prevention planning, including the rational selection of design flood frequency, the accurate assessment of flood hazards, and the scientifically grounded calculation of flood protection water levels at metro stations. This section will examine these issues from the following three perspectives: (1) the selection of appropriate flood defense frequency, (2) flood hazard assessment, and (3) methodologies for calculating design flood protection water levels at metro stations. The objective is to provide a robust scientific basis and technical guidance for enhancing the flood resilience of the Guangzhou Metro system in response to the escalating challenges posed by extreme rainfall events.

3.1. Selection of Defense Frequency

The selection of defense frequency is directly related to the safety and functionality of buildings, especially for critical infrastructure. As a core component of urban infrastructure, metro systems bear significant transportation loads and their flood prevention design must therefore adhere to elevated safety standards [13]. According to the Metro Design Code, the design flood level for metro stations and associated facilities should follow a higher standard, typically corresponding to a 100-year return period. This is intended to ensure that metro systems remain operational during extreme weather events, thereby safeguarding passenger safety [12]. For stations deemed particularly important, or for key infrastructure components, the design return period may be increased to 200 years to mitigate the impacts of more severe flood scenarios.
However, with the increasing frequency of extreme weather events and the nonlinear impacts of global climate change, traditional probabilistic models based on historical data—such as regional rainfall intensity formulas—may significantly underestimate future flood risks. Therefore, this study proposes an upward adjustment of the design flood defense frequency, taking into account both the current hydrometeorological conditions and emerging climate-related challenges.

3.2. Flood Hazard Assessment

Geographic information systems (GISs) are powerful tools for spatial analysis, capable of efficiently processing and analyzing geographic and spatial datasets. Their core strength lies in the ability to integrate diverse factors—such as topography, land use, and soil characteristics—thereby offering detailed spatial distribution insights essential for flood risk assessment. GIS technology has been widely adopted in the domain of flood hazard analysis. For example, Liu et al. incorporated variables including slope, land use, and soil type into a rainfall–runoff model and employed GIS to estimate the spatial distribution of surface runoff [14]. Similarly, Elkhrachy used satellite imagery and GIS techniques to generate flash-flood hazard maps for the Najran region in Saudi Arabia [15]. These studies illustrate that GIS not only provides robust technical support for local governments in land-use planning and emergency response coordination but also forms a solid analytical foundation for flood risk assessment and management.
In the present study, GIS technology is employed to integrate flood risk assessment with spatial datasets pertaining to metro infrastructure, thereby directly supporting scientific decision-making in metro flood prevention design. By conducting terrain and hydrological analyses within the GIS framework, this approach enables the precise delineation of flood inundation areas and associated risk levels [16]. Based on these results, targeted mitigation strategies can be proposed—such as rerouting metro lines to avoid high-risk zones or reinforcing structural designs by elevating station entrances and installing flood barriers—to effectively reduce flood-related vulnerabilities.
Specifically, this study applies GIS (ArcMap 10.8) to assess the flood risk of Xinsha station along Guangzhou Metro Line 13 and its surrounding catchment area under extreme rainfall scenarios. The analysis of flood-prone areas and corresponding risk levels provides a scientific basis for formulating adaptive and site-specific flood prevention measures at this critical station.

3.3. Calculation Method for Flood Prevention Design Water Level at Metro Stations

The key to metro flood prevention design is determining the runoff volume after rainfall, as the runoff directly impacts the drainage capacity and flood safety of the metro system under extreme weather conditions such as heavy rainstorms. This study uses the SCS curve number (SCS-CN) method to calculate the runoff volume.
The SCS-CN model is an empirical method developed to estimate direct surface runoff from specific rainfall events, as represented by Formulas (1) and (2) [17]. Originally proposed by the United States Soil Conservation Service in the 1950s, the model is particularly well-suited for estimating runoff across a variety of watershed types, including agricultural, forested, and urbanized areas [18]. A key advantage of the SCS-CN method is its reliance on a single comprehensive parameter: the curve number (CN). This dimensionless value encapsulates the hydrological response of a watershed and is primarily influenced by factors such as soil type, land use, vegetation cover, and antecedent moisture conditions [18]. The CN value reflects the watershed’s capacity for infiltration and water retention. It typically ranges from 30 to 100, with higher values indicating reduced infiltration capacity and a greater potential for surface runoff.
The curve number is determined empirically and varies according to local physical and environmental conditions. In this study, CN values were assigned based on the specific soil types and land-use classifications within the Guangzhou region, as informed by existing literature and local datasets [19]. This can be seen in the following:
S = 25400 C N 254
Q = R 0.2 S 2 R + 0.8 S , R > 0.2 S 0 , R 0.2 S
where Q (mm) is the runoff depth (mm), R (mm) is the total rainfall from a single event (mm), and S is the potential maximum retention of the underlying surface.
The SCS-CN method includes several key steps for runoff calculation. First, in the SCS-CN model the total rainfall amount (R) needs to be clarified as it is central to calculating the runoff volume (Q). The total rainfall amount (R) refers to the depth of rainwater that accumulates on the horizontal surface during a rainfall event, measured in millimeters (mm). The proportion of total rainfall (R) that converts into runoff (Q) depends on the watershed’s ability to store water, known as the potential maximum retention (S). Next, based on the land-use type, soil type, vegetation cover, and moisture condition of the watershed, an appropriate CN value is selected and the potential maximum retention (S) is calculated using Formula (1). Then, using the relationship between the initial loss and maximum retention, the initial loss (I) is determined. Initial loss is typically caused by surface evaporation, infiltration, and other factors, representing the initial consumption of moisture at the beginning of rainfall. Mockus, through the analysis of a large amount of rainfall data from the U.S., empirically proposed a relationship between initial loss and the local soil’s potential retention capacity, expressed as I = 0.2 S. This empirical ratio, first introduced by the USDA SCS, is widely used in the SCS-CN method to estimate the runoff volume from rainfall [20,21,22].
Finally, the runoff volume (Q) is calculated using Formula (2). Through these steps, the SCS-CN method can effectively estimate runoff volume under specific rainfall conditions. It is important to note that runoff will only occur when the total rainfall amount (R) exceeds the initial loss (I).
The total rainfall amount (R) is generally calculated using rainfall intensity formulas. It is influenced by factors such as storm intensity, frequency, and duration. Storm intensity is a critical indicator for describing urban rainstorms—the greater the intensity, the heavier the rainfall. Storm conditions vary across regions due to differences in climate, geography, seasonal changes, and historical rainfall records. In China, specific rainfall intensity formulas have been developed for different regions, providing localized values based on regional climatic characteristics, geographical conditions, and long-term historical data.
During the Zhengzhou “7.20” storm event, daily rainfall reached 552.5 mm, with 201.9 mm falling between 16:00 and 17:00—surpassing the historical hourly rainfall record of 198.5 mm set on 5 August 1975. In the Guangzhou “5.22” storm, meteorological data showed that some stations in Zengcheng recorded rainfall totals of 302.2 mm over 180 min, far exceeding the standard for a 100-year return period. Moreover, over 75% of the daily rainfall consisted of short-duration, high-intensity rainfall exceeding 20 mm/h [11,23]. These cases reveal the limitations of traditional rainfall intensity formulas in capturing extreme rainfall events.
Traditional formulas are typically derived from historical observations spanning 50 to 100 years and are based on the assumption of a stable climate system. However, global warming—by increasing atmospheric moisture capacity and enhancing local convection—has altered the physical mechanisms behind extreme precipitation. As a result, current rainfall intensity formulas may underestimate both the frequency and magnitude of future extreme events. This limitation has been confirmed in the research conducted by Yuchao Jiang et al. [7].
Meanwhile, multiple climate simulation studies conducted in southern China indicate that climate change is a major driver of the increasing frequency and intensity of heavy rainfall events. Projections suggest that such extreme precipitation events may become even more frequent and intense in the future, highlighting the potential inadequacy of current flood protection elevations and waterproofing measures that are based solely on historical data and empirical rainfall intensity formulas [24,25]. Therefore, in this study, reference is made to the daily rainfall from the Zhengzhou “7.20” storm and the 180 min rainfall from the Guangzhou “5.22” storm in Zengcheng to calculate the return period (P) using the rainfall intensity formula.

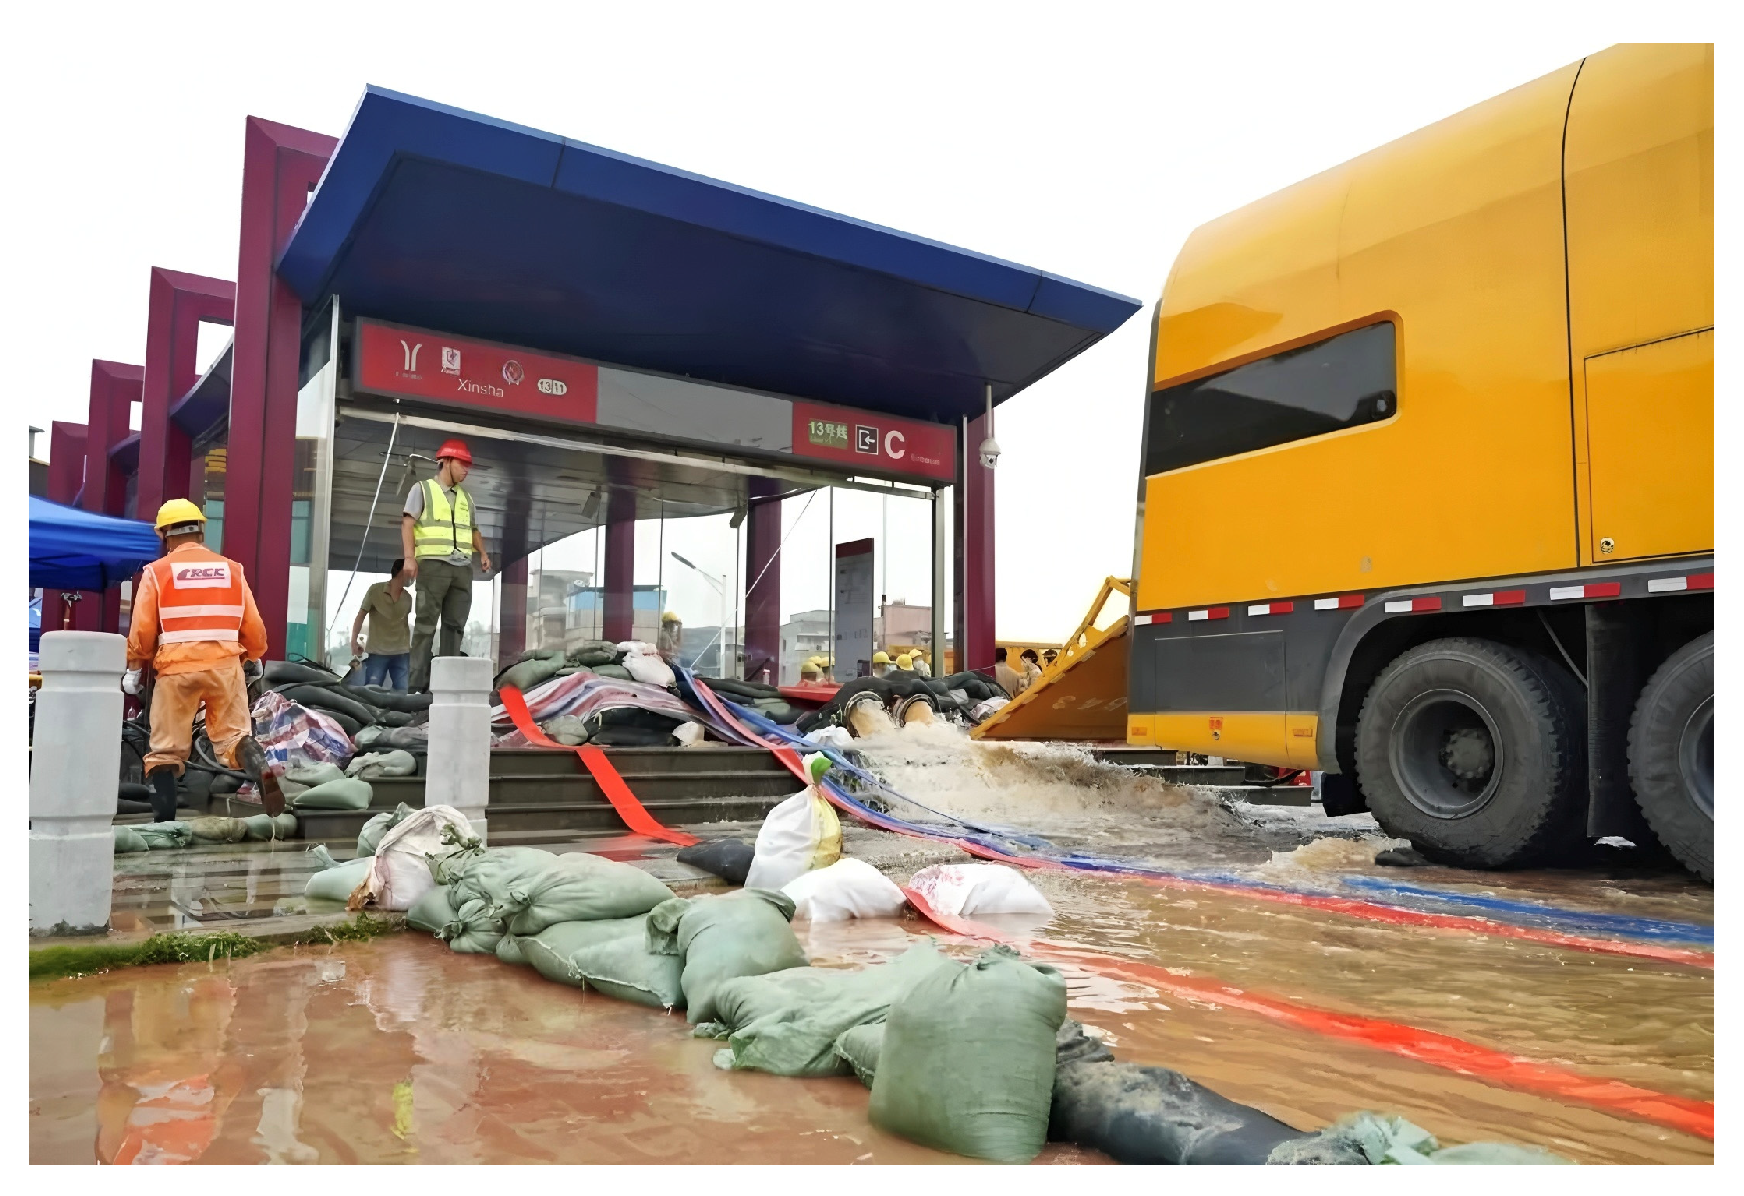
3.4. Flood Control Design for Xinsha Station on Guangzhou Metro Line 13 Based on the SCS-CN Model

This study focuses on Guangzhou Metro Line 13 due to the typicality and specificity of its station locations, as well as the flood risk issues exposed during extreme rainfall events. However, it should not be assumed that resolving the flooding problems of Line 13 will address those of all other metro lines in Guangzhou. Several stations on Line 13—such as Guanhu station and Xinsha station—are located in low-lying basin areas with funnel-shaped topography where mountain floods and surface runoff converge. Moreover, their proximity to nearby rivers increases the risk of riverine overflow. These characteristics make the stations particularly vulnerable to flooding and backflow during heavy rainfall events, making them representative case studies for metro flood control research. Nevertheless, Guangzhou’s metro system comprises numerous lines, each facing distinct geographical conditions, drainage environments, and elevation profiles. Consequently, other lines may be subject to different types and levels of flood risk. While addressing the challenges on Line 13 can provide a valuable reference for similar stations, the overall flood prevention design for the Guangzhou Metro system must be optimized according to the specific conditions of each individual line.
Xinsha station, the eastern terminus of Guangzhou Metro Line 13, is an underground station located between Xinjie village and Shixia village in Xintang town, Zengcheng district, Guangzhou, beneath Xinsha avenue. The station was opened to the public on 28 December 2017 as part of the first phase of Line 13. The location of the station is shown in Figure 11.

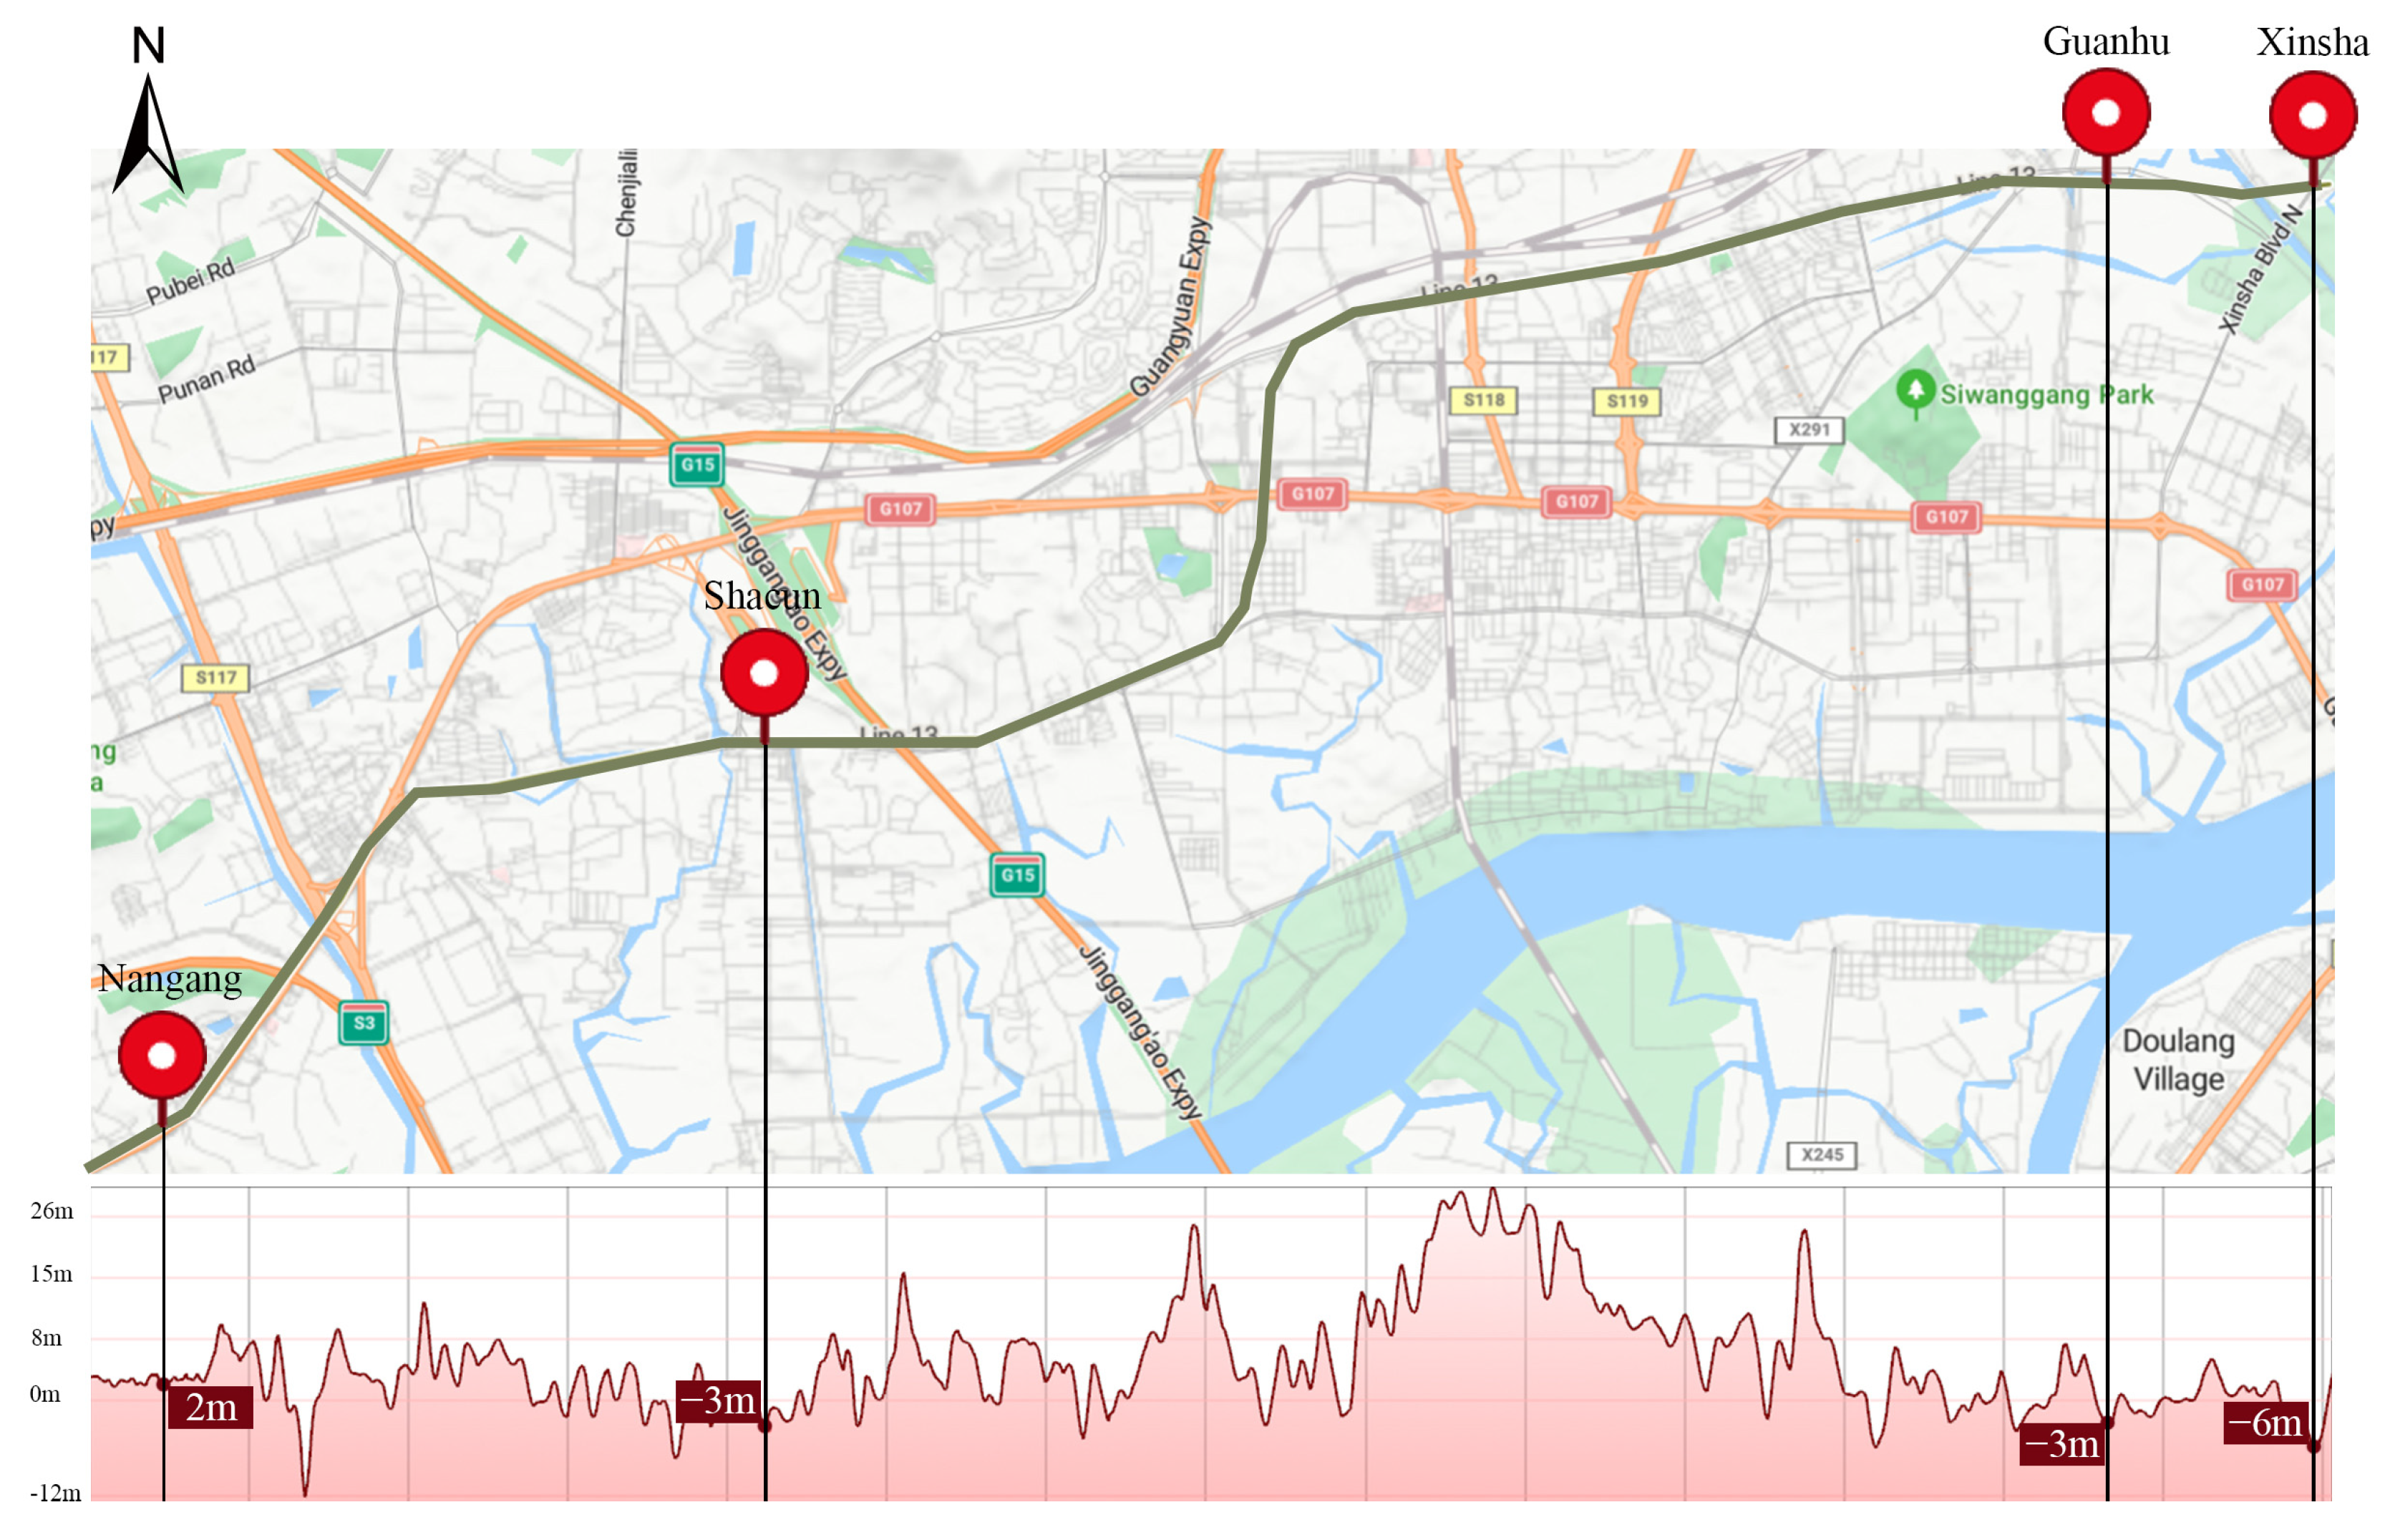
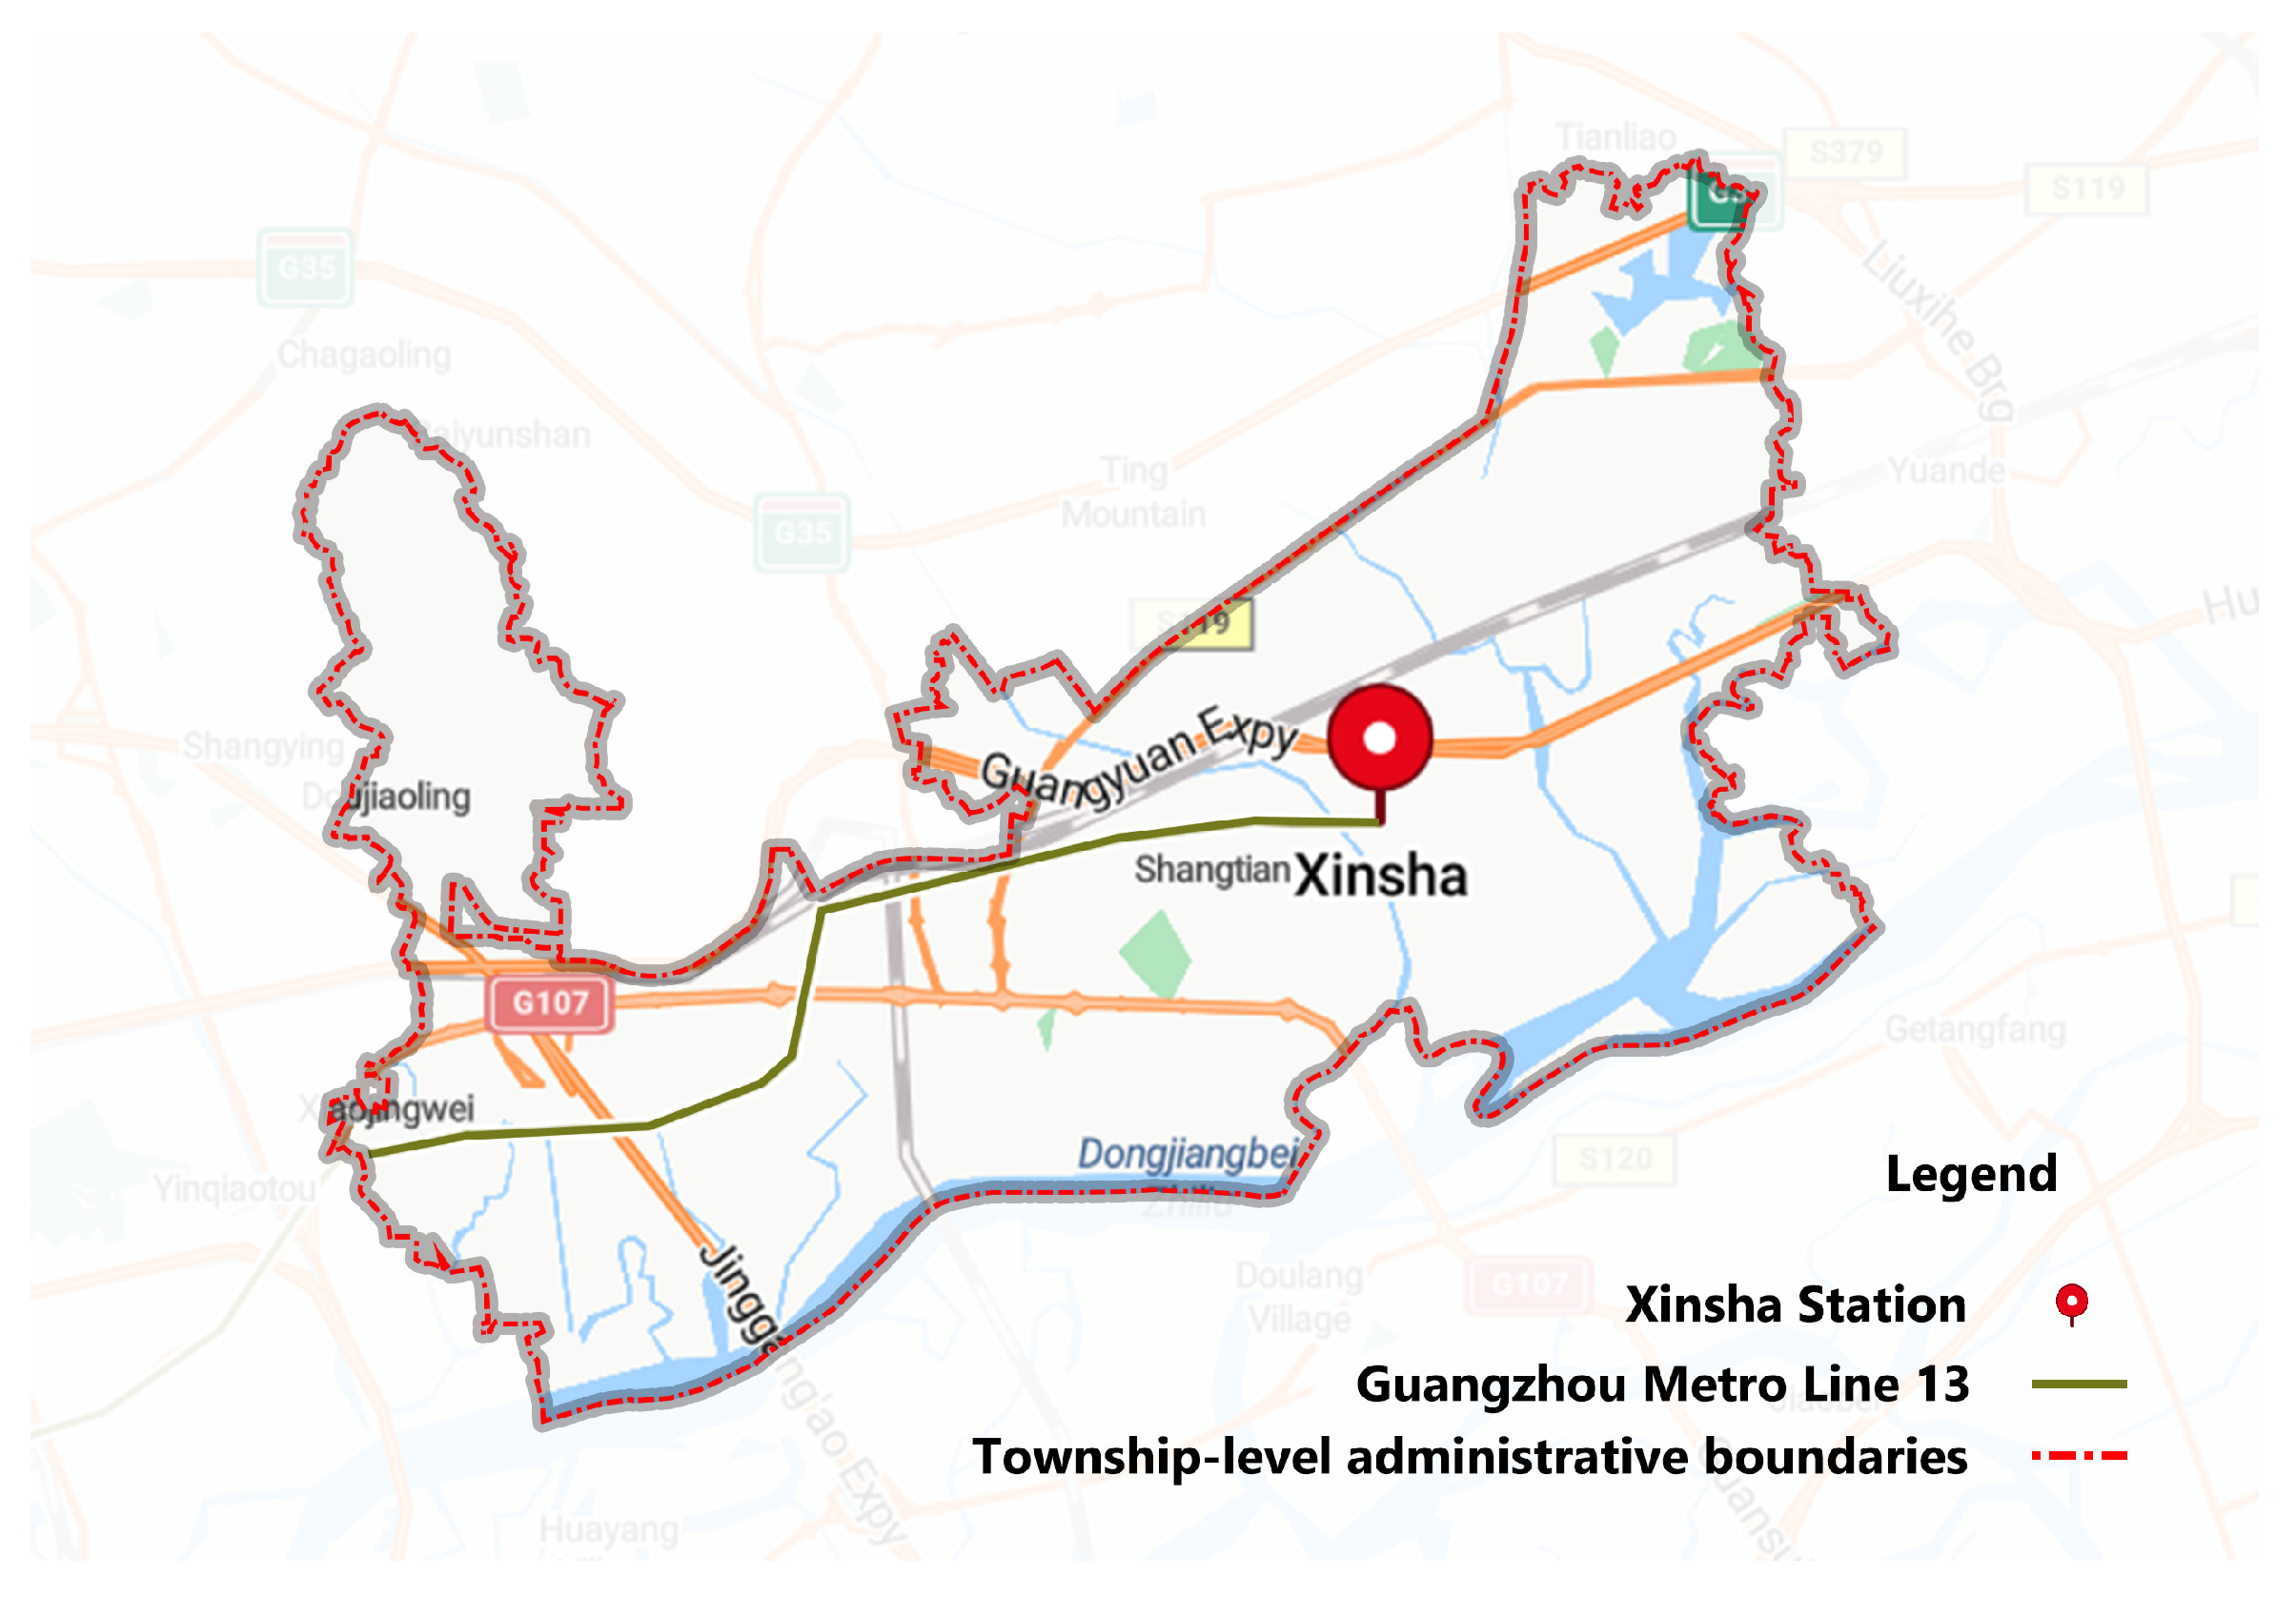
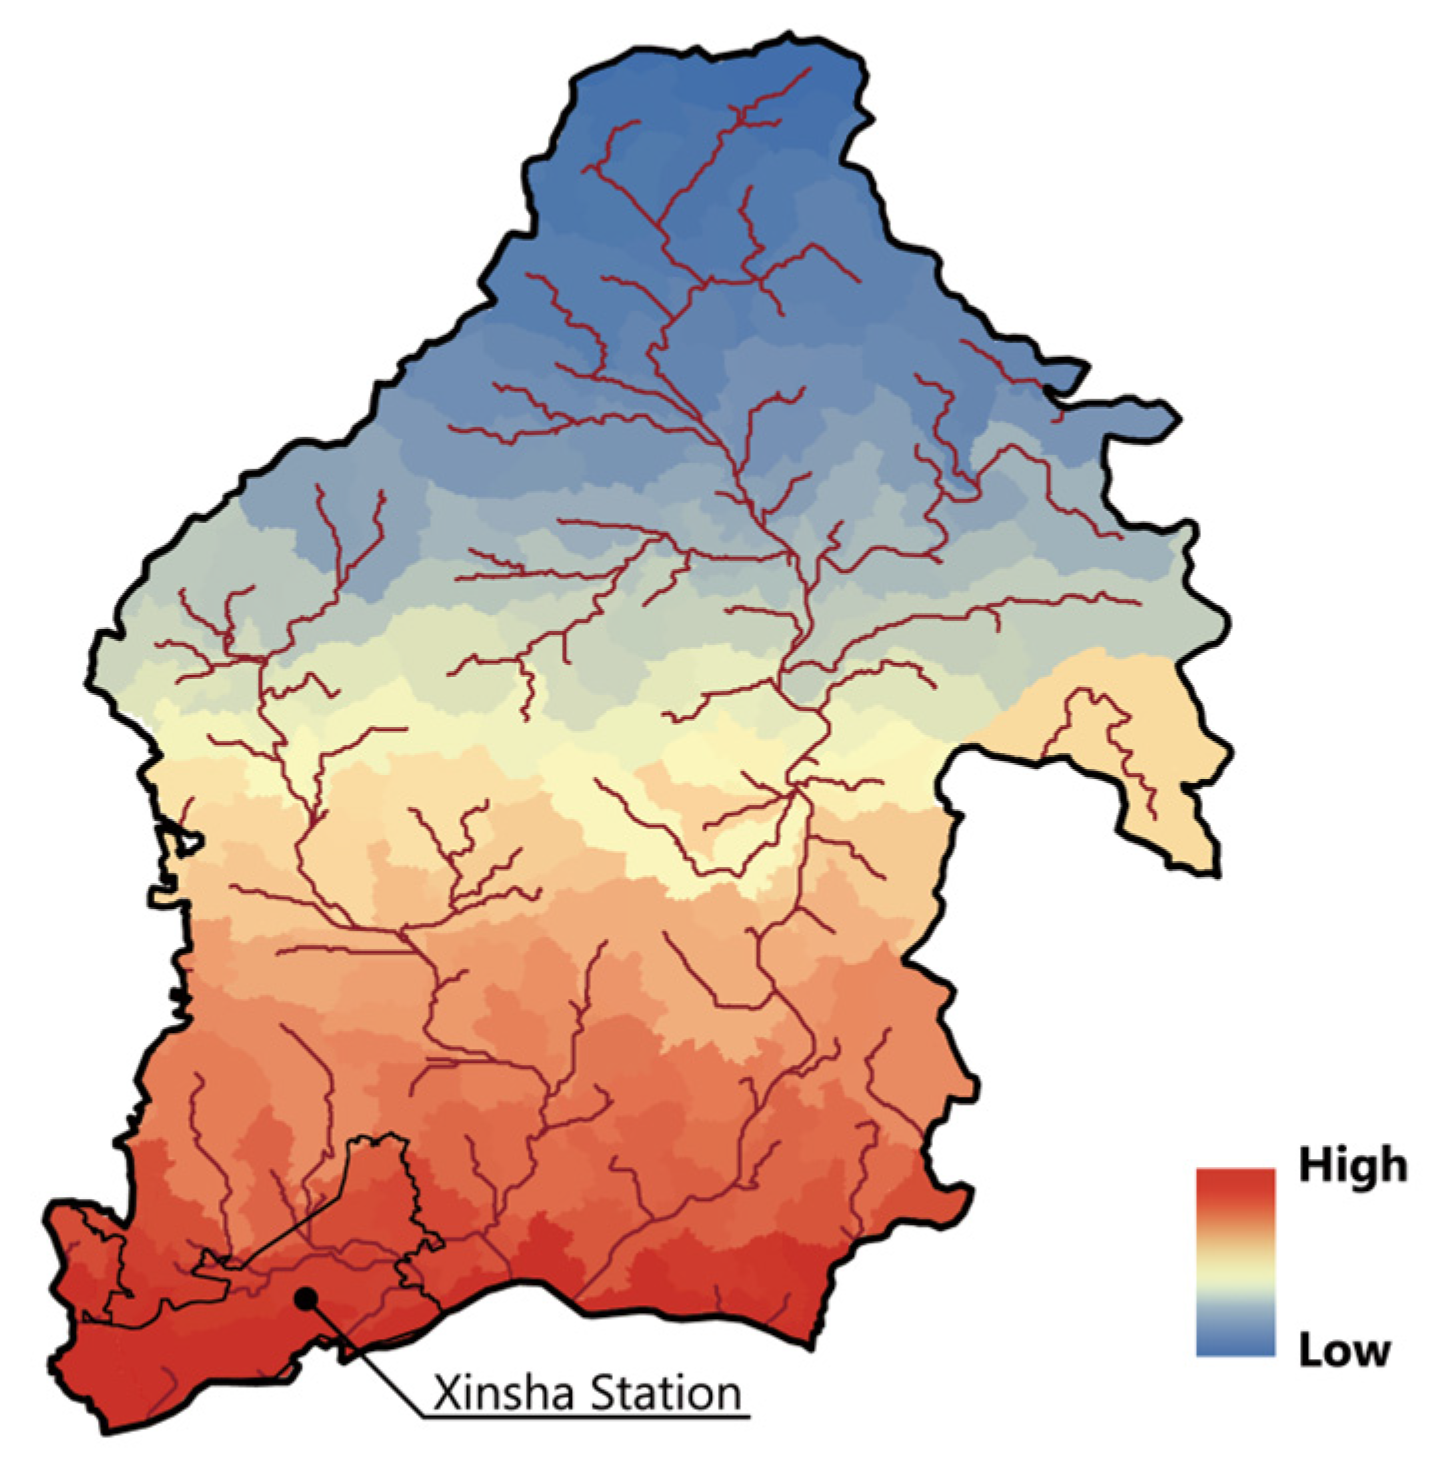
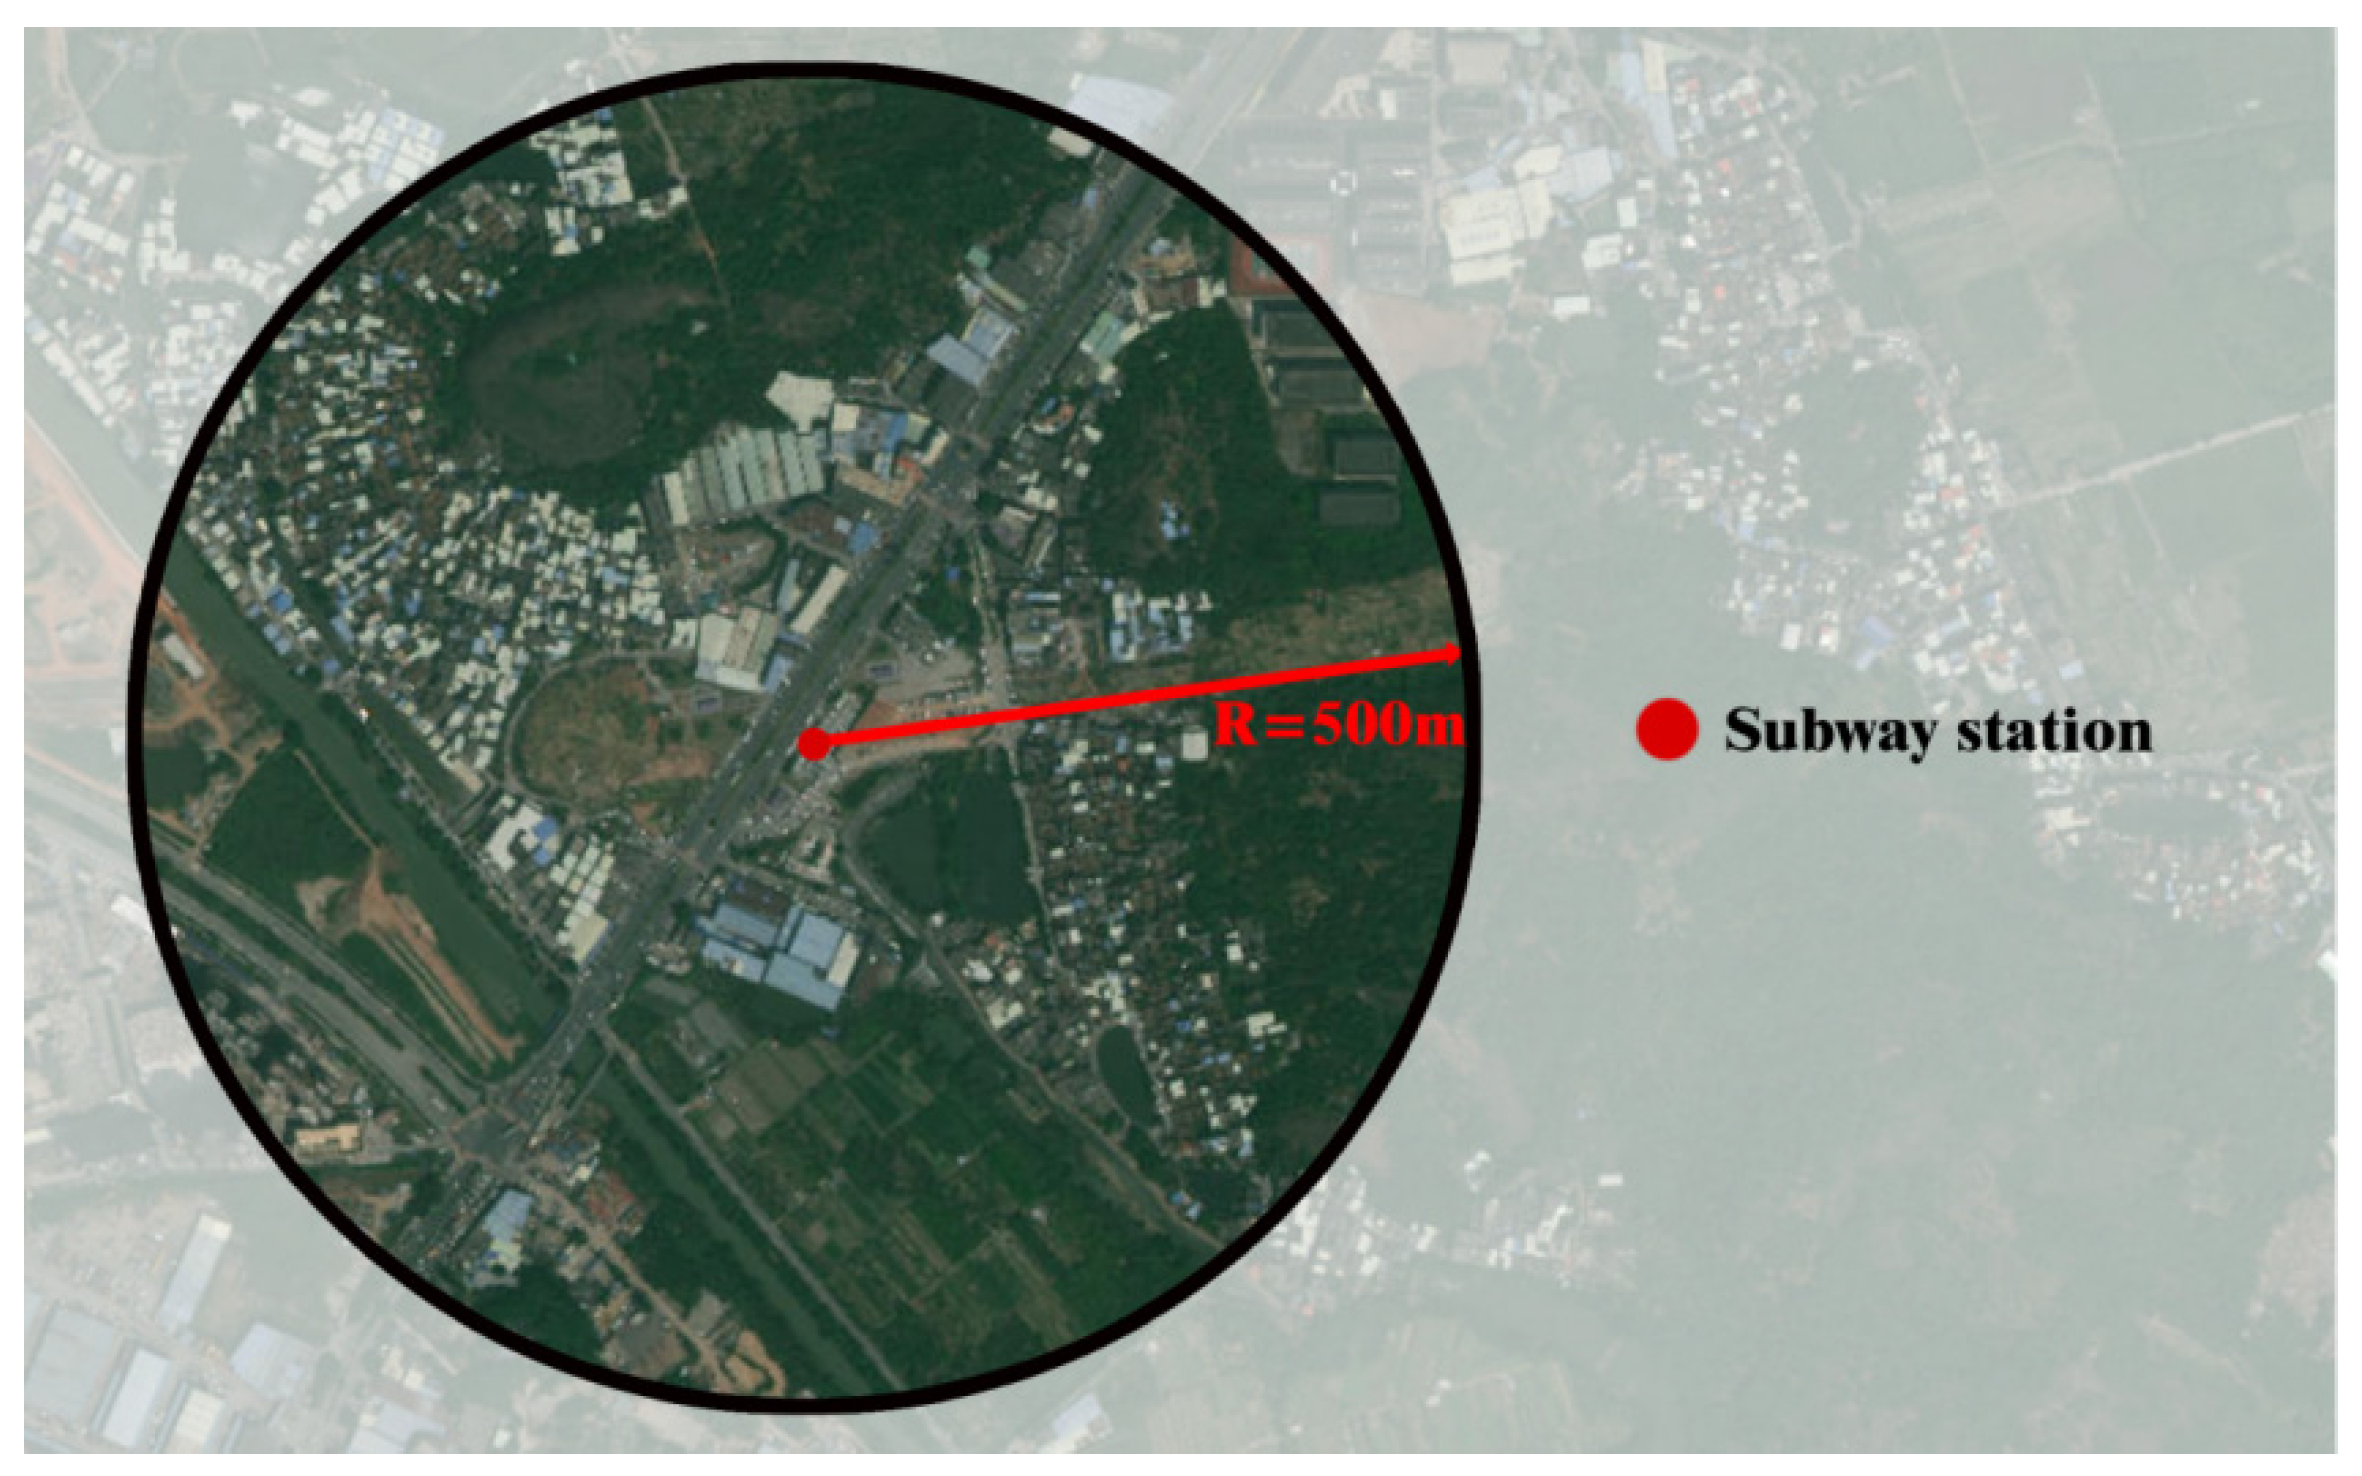
3.4.1. Location and Flood Risk Assessment of Xinsha Station

Xinsha station is located in Xintang town, Zengcheng district, Guangzhou. The flood risk in the Zengcheng district of Guangzhou was assessed using GIS (ArcMap 10.8), as shown in Figure 12. The DEM elevation data were sourced from the Geospatial Data Cloud (https://www.gscloud.cn/search, accessed on 1 December 2024). It is evident that the southern part of the Zengcheng district is at a higher risk of flooding.
After evaluating the flood risk levels in the region, a risk assessment of the metro station was conducted. It was found that Xinsha station is situated in the central part of Xintang town, near the northern tributary of the Dongjiang River, and is therefore at high risk of flooding during heavy rainfall. In this study, the assessment area is centered around Xinsha station, with a radius of 500 m. This range is chosen based on the need for passengers to evacuate to safety quickly in the case of an emergency. Metro station evacuation designs should ensure that all passengers are evacuated to a safe area within 6 min [26]. This is depicted in Figure 13.

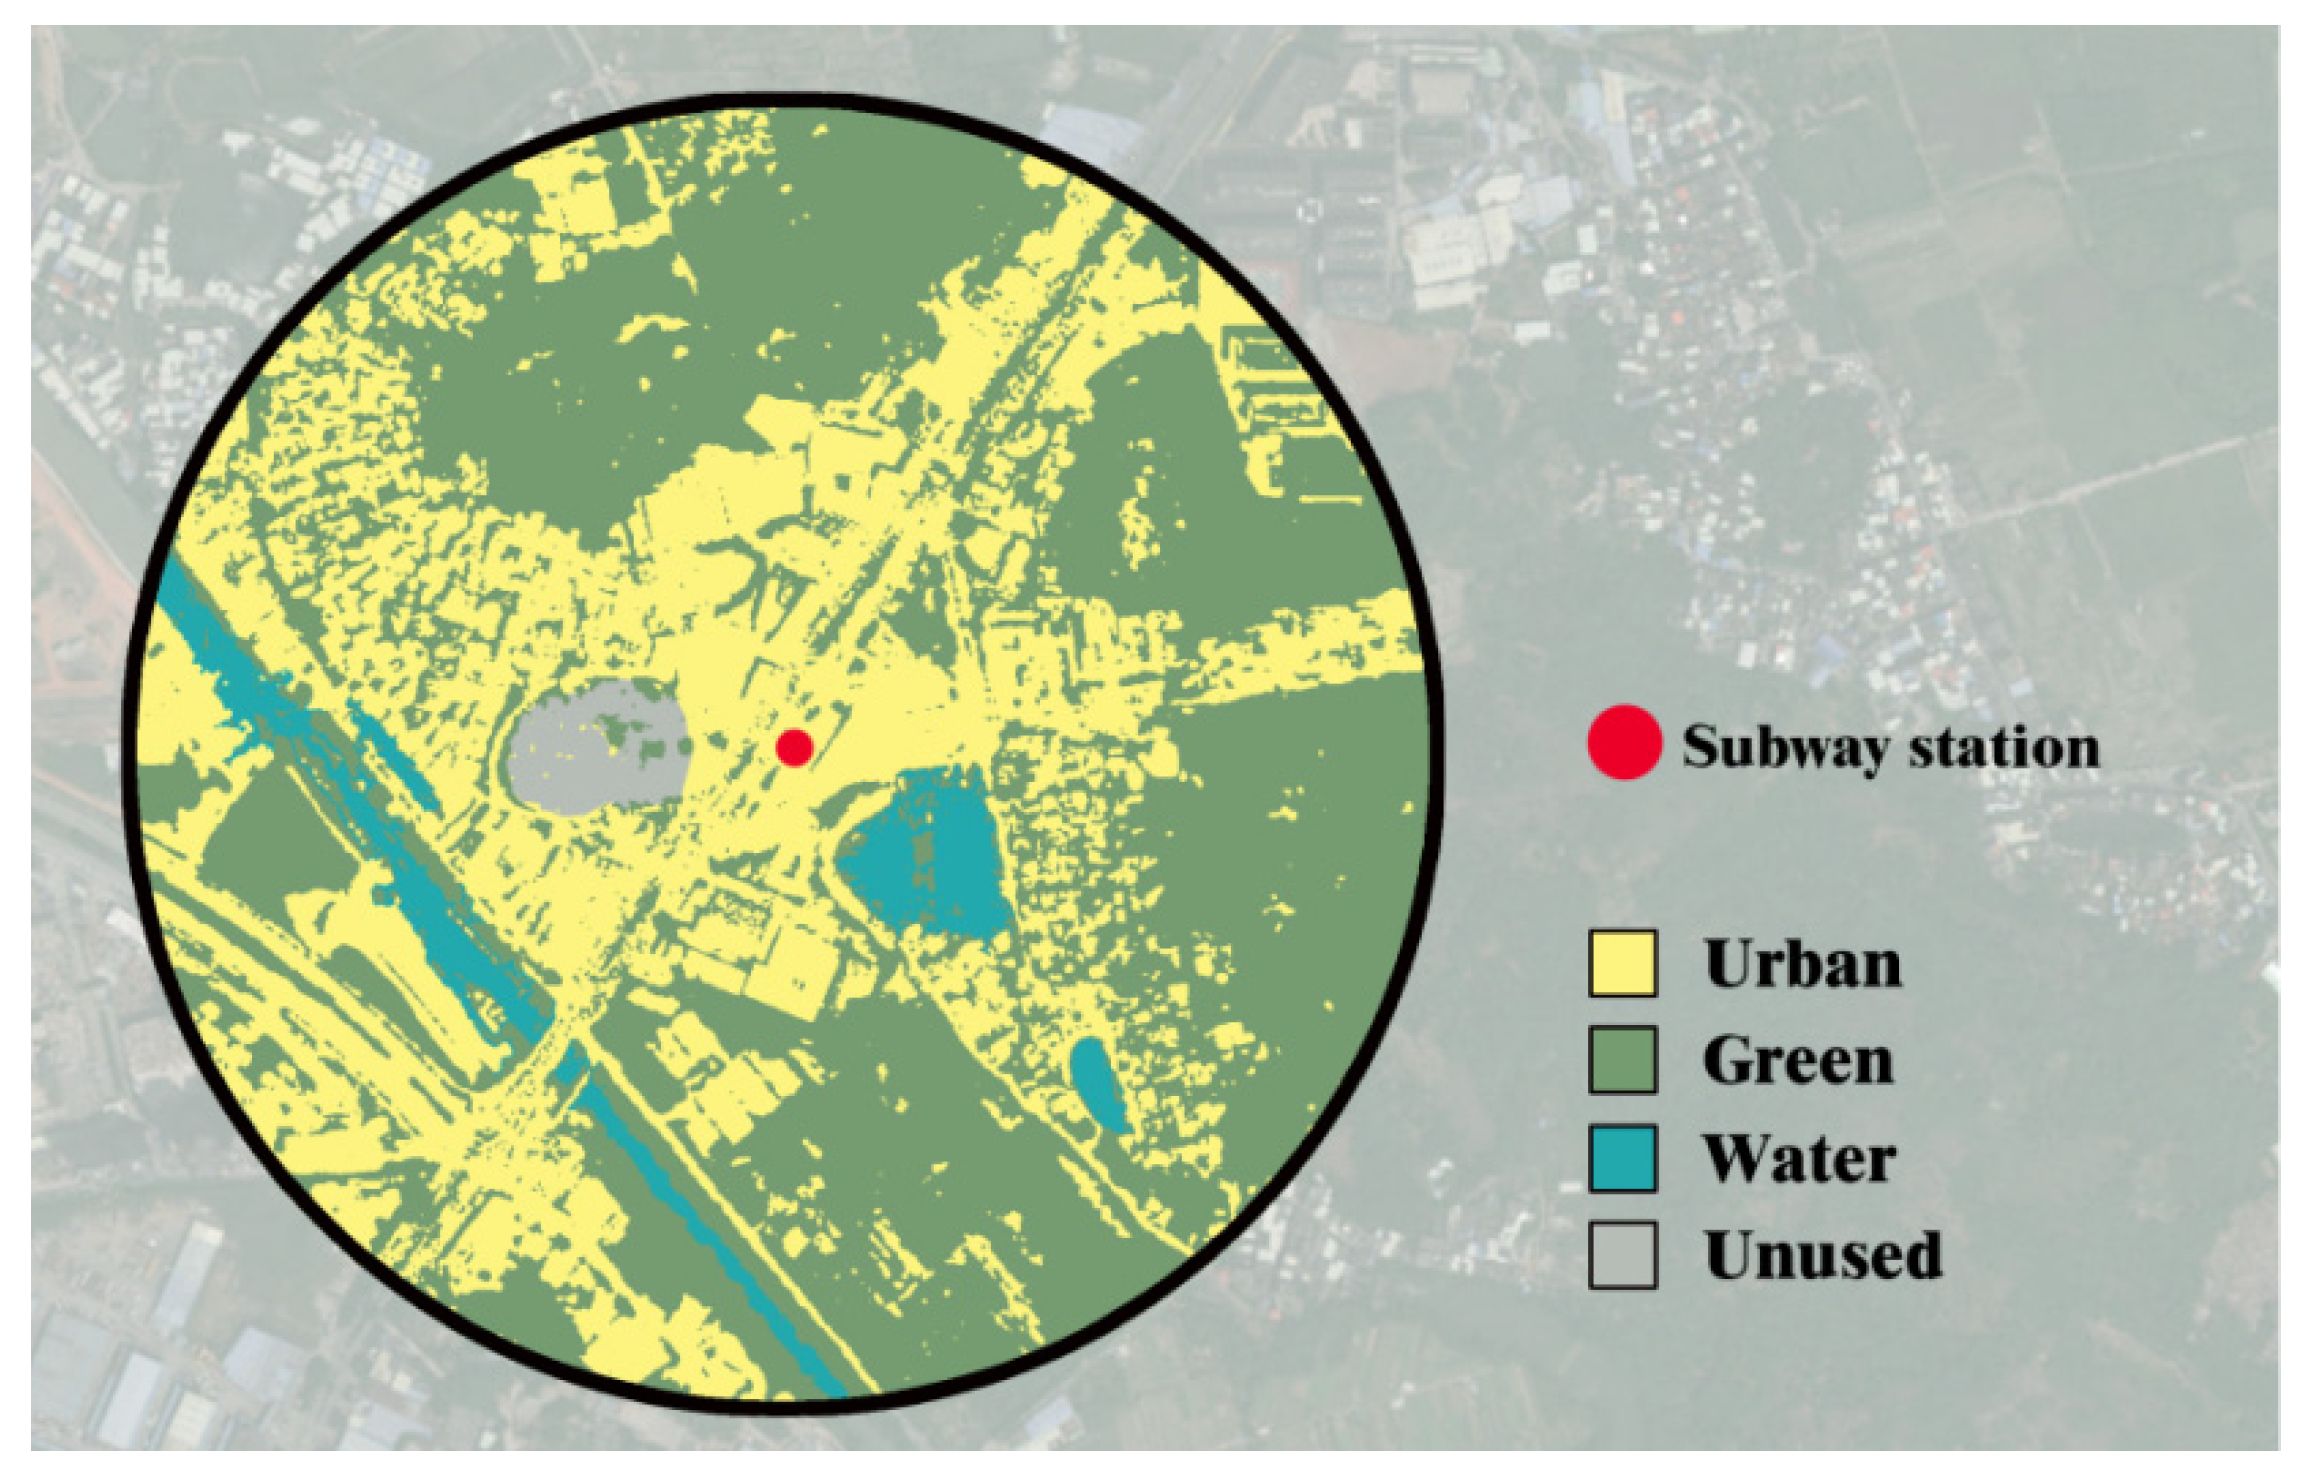
3.4.2. Calculation of Surface Runoff at Xinsha Station

In the SCS-CN model, surface runoff is calculated using Formulas (1) and (2). To begin, the total rainfall amount (R) for a single event must be determined. The rainfall intensity formula for Zengcheng district, Guangzhou, is as follows:
q = 10.168 × 1 + 0.672 lg P t + 8.025 0.613
q = 27.602 × 1 + 0.672 lg P t + 18.671 0.784
where t is the rainfall duration and P represents the design frequency, which corresponds to the design rainfall amount (mm/min).
Formula (3) represents the short-duration rainfall intensity formula, while Formula (4) is for long-duration rainfall intensity. However, due to the increasing frequency of extreme weather events in recent years, relying solely on a 100-year or 200-year return period for design flood frequency carries significant risk. Traditional rainfall intensity formulas may underestimate future rainfall intensity and frequency, posing considerable limitations. For example, the 2020 Guangzhou “5·22” heavy rainfall event had a 180 min rainfall of 302.2 mm, which, when calculated using Formula (3), resulted in a return period of 40,000 years. Similarly, the 2021 Zhengzhou “7.20” event, with a single-day rainfall of 552.5 mm, led to an estimated return period of 40,000 years using Formula (4). Designing according to a 40,000-year return period would significantly increase the cost of flood control facilities. Therefore, based on the risk–cost trade-off principle, the design should be optimized within acceptable risk levels.
In this study, a 24 h (1440 min) rainfall duration is considered, with a return period of 40,000 years, and a comparison is made with a 200-year return period to explore flood control design requirements in light of both regulatory standards and recent extreme weather events. Using Formula (4), it was calculated that for a 200-year return period the total rainfall for the entire day would be 334.71 mm, whilst for a 40,000-year return period the total rainfall would be 534.98 mm.
Using GIS software (ArcMap 10.8), land-use types around the metro station were classified. This software analyzes land cover and usage through remote sensing images, helping to identify and categorize different land types. In this study, land use was classified into four categories, as shown in Figure 14.
After dividing the area surrounding the metro station into four subzones, CN values for different land types were assigned based on the specific soil types and land-use classifications of Guangzhou [19]. The surface runoff depth was then calculated using the SCS curve model using Formulas (1) and (2). When the total daily rainfall is 534.98 mm, the surface runoff depth is 484.23 mm, and when the total daily rainfall is 334.71 mm, the surface runoff depth is 284.38 mm. It is evident that, according to the “Metro Design Code”, which stipulates that the ground elevation of metro station entrances, emergency exits, and elevators should be 300–450 mm higher than the surrounding ground level [12], it is capable of withstanding rainfall events with a 200-year return period.
However, due to limitations in the model, additional safety margins should be incorporated into the design. For instance, the ground elevation of metro station entrances, ventilation shafts, and other critical infrastructure should be raised further to prevent reverse water flow under extreme rainfall conditions. It is recommended that a safety margin of 15–20% be applied to key infrastructure such as station entrances and pumping stations. Therefore, based on the calculated runoff depth of 484.23 mm, flood barriers or removable flood shields should be installed at all entrances. With a 20% safety margin, the effective flood protection height should be at least 582 mm.
In addition to station entrances, flood protection measures should also be applied to other vulnerable components, such as ventilation shafts and cooling towers. Furthermore, as most of Guangzhou’s drainage systems are designed based on a 1-year return period discharge standard [27], the intensity of extreme rainfall far exceeds local drainage capacity. To address this, upgrades to the urban drainage system—such as increasing pipe diameters, enhancing the capacity and number of pumping stations, and ensuring unobstructed drainage—should be prioritized. Regular inspections and maintenance of drainage facilities are also essential to prevent clogging and ensure system reliability.

4. Discussion

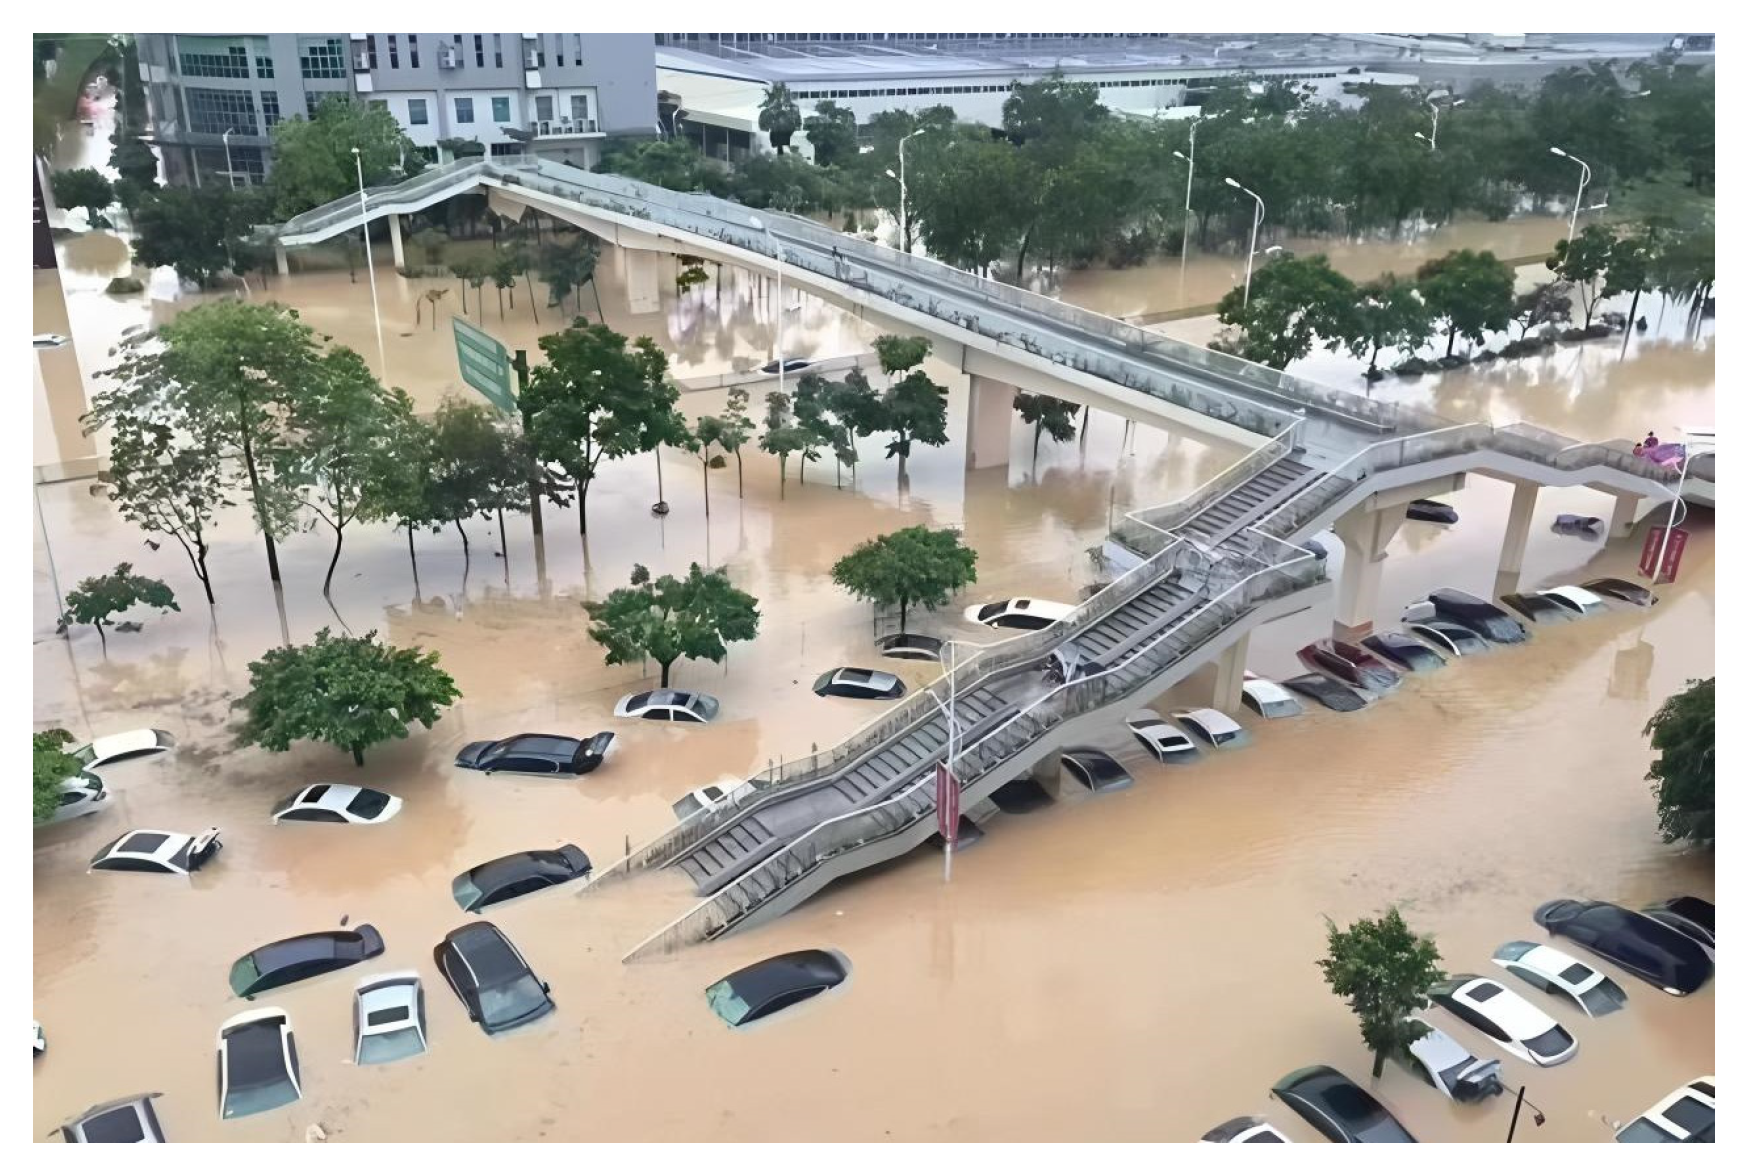
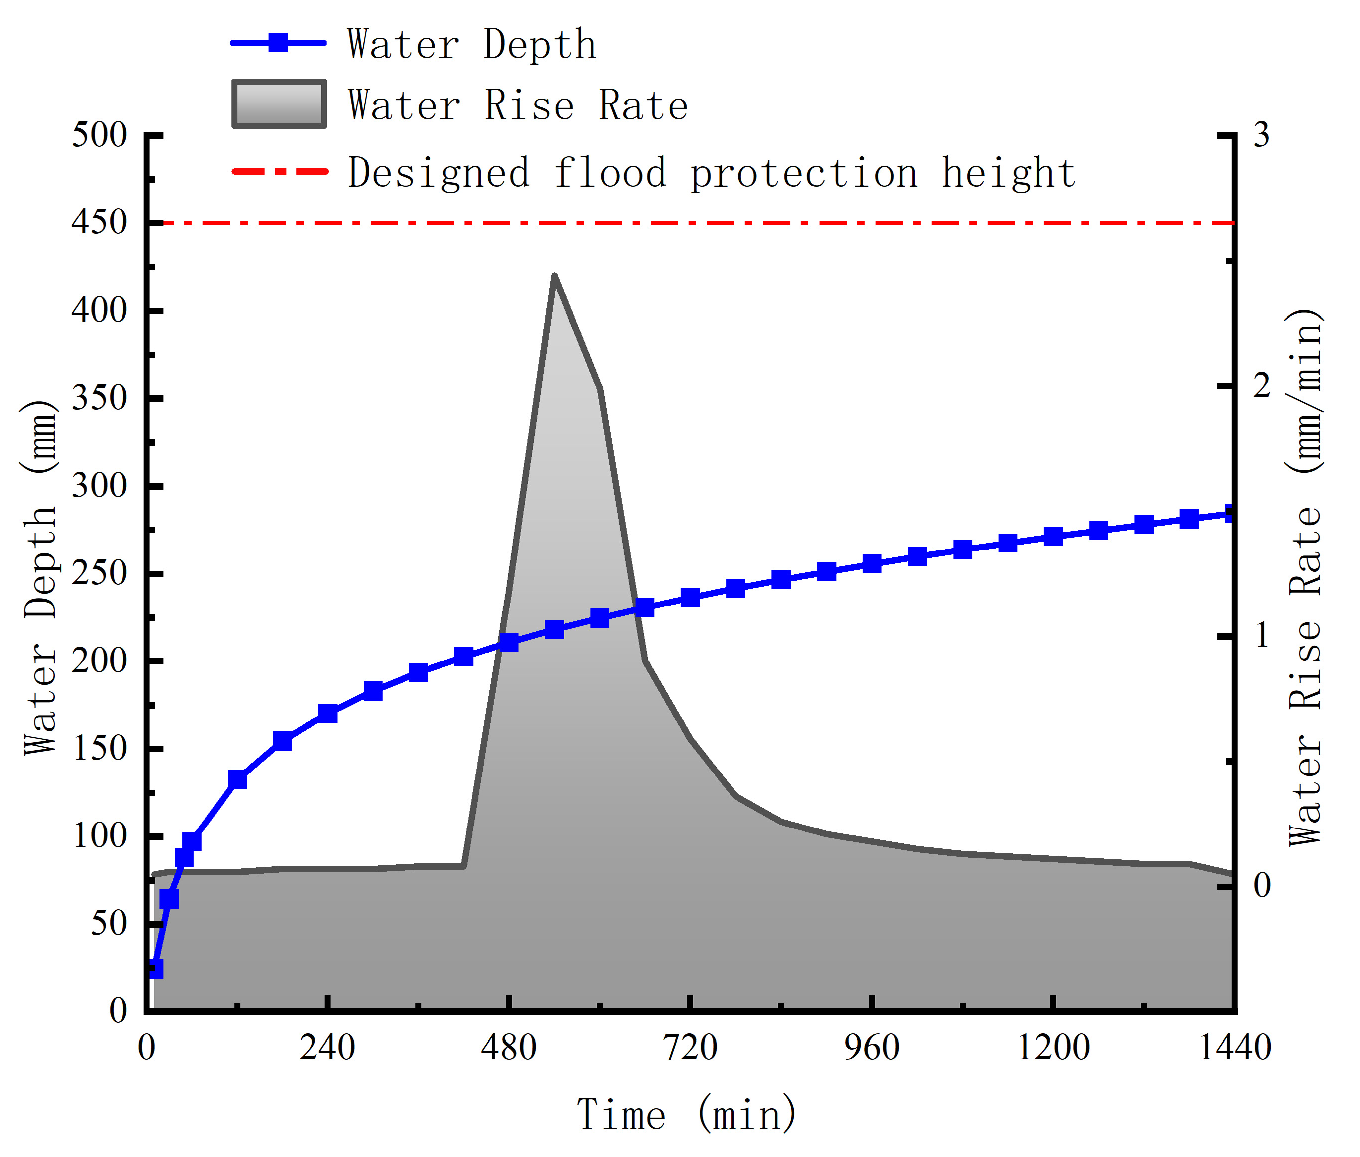
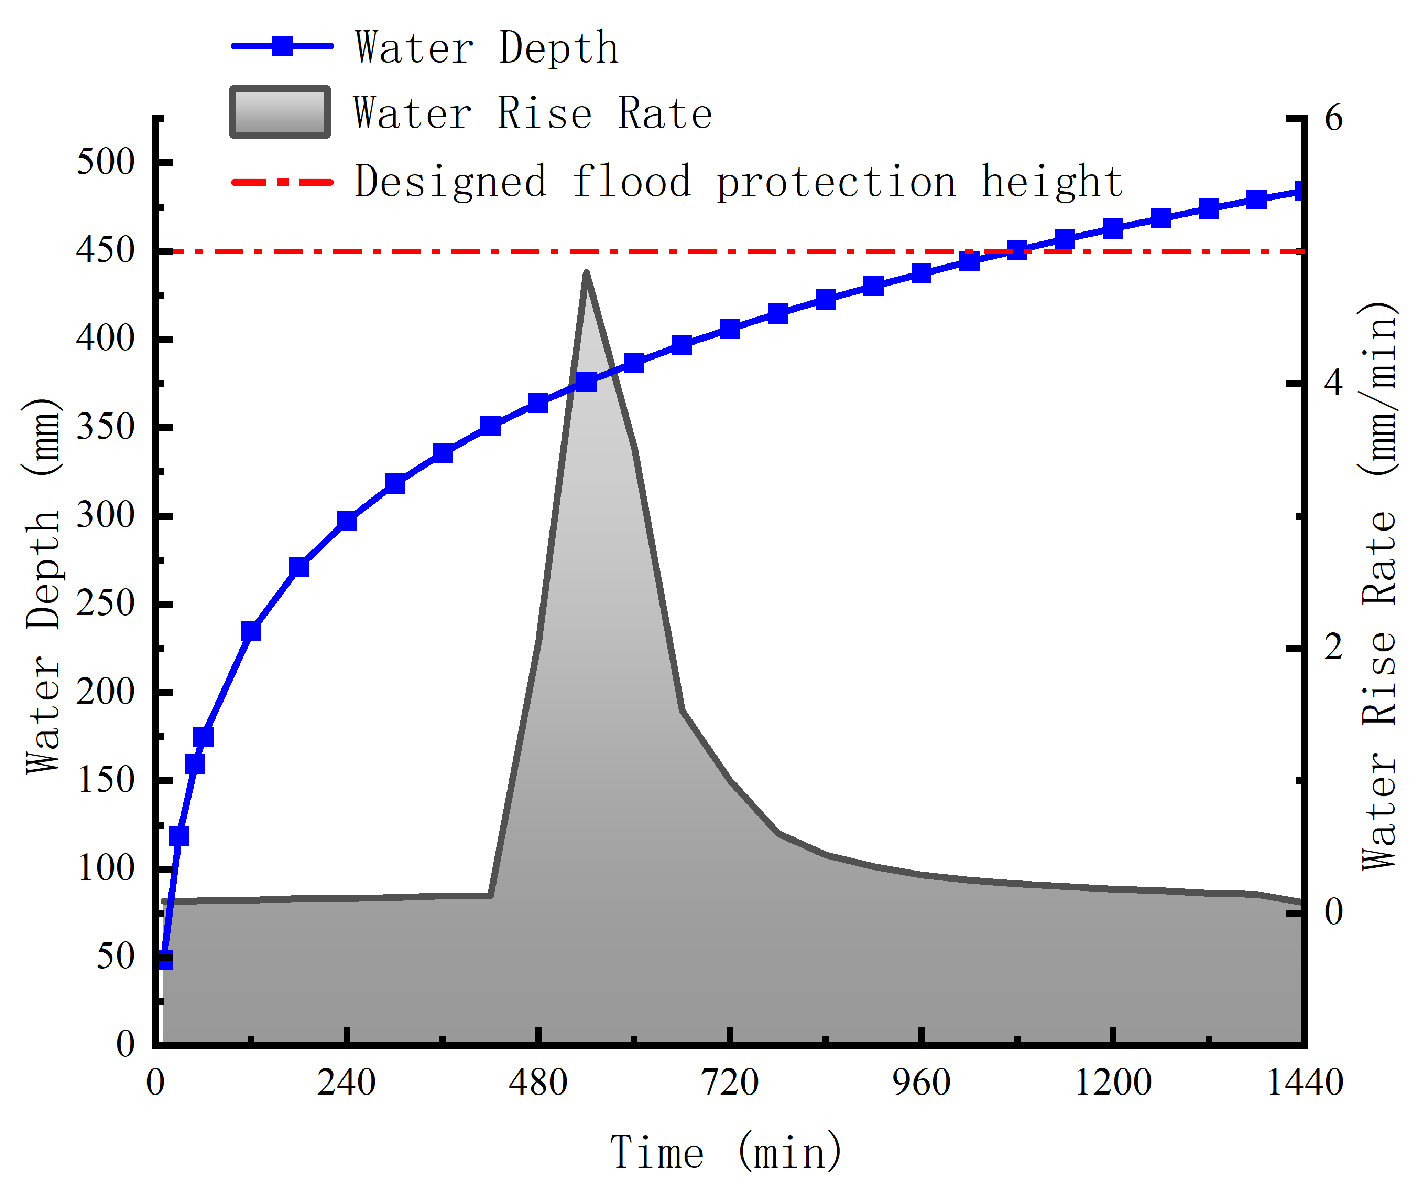
4.1. Flood Damage Process at Guangzhou Metro Stations Under Extreme Rainfall Conditions

Under extreme rainfall conditions, the flood damage process at metro station entrances follows the following sequence: “extreme rainfall—surface water accumulation—water intrusion into the metro system—internal flooding”. During extreme rainfall, water quickly accumulates near metro station entrances. Once the water level exceeds the design elevation of the entrance, the accumulated water begins to infiltrate the metro system, causing internal flooding. As rainfall intensity and volume continue to increase, if there are no effective flood control measures, the water level will keep rising until the area is submerged. In the absence of drainage facilities, it takes only 20–30 min for accumulated water to submerge a five-hundred square meter area. Furthermore, due to water pressure, when the water depth reaches 30–50 cm it obstructs the ability of individuals to open doors and escape, leading to potential casualties [28,29].
The internal flooding process at Guangzhou metro stations can be simulated using the water accumulation and flooding model proposed by Yuchao Jiang et al. [7]. By incorporating factors such as regional rainfall intensity, surface infiltration rate, water evaporation rate, local runoff volume, and land-use-specific area data, the rate of water level rise over time can be calculated using Formulas (5) and (6). Based on this, the water depth at a given time can be derived using Formula (7), which corresponds to the runoff volume results presented in Section 3.4 of this paper.
(1)
For a permeable surface it is calculated as follows:
h t = i + ( u ) f e + ( Q / A i ) t
(2)
For an impermeable surface it is calculated as follows:
h t = β × ( i + ( u ) f c i t y e + ( Q / A i ) t )
Water depth is calculated as follows:
h T = t 0 + Δ t = t 0 t 0 + Δ t h t d t
where h t is the water depth rising rate (m/s); h is the water depth (m); i is the rainfall intensity (m/s); u is the rising rate of floodwater at the river–storm surge boundary (m/s); f is the infiltration rate (m/s); fcity is the equivalent drainage rate (m/s); e is the evaporation rate (m/s); Q is the runoff volume (m3); Ai is the area of different land-use types (m2); β is the topographic correction factor; t0 is the initial time, at which the runoff volume is zero; and ∆t is the time interval for calculation (s).
When the water depth exceeds the design flood height, water begins to infiltrate the metro station. If rainfall continues, the water level inside the station will keep rising. The portion of the water depth that surpasses the design protection height is defined as the inundation depth. As indicated by Formula (8), there exists a relationship between unit discharge and inundation depth, which can be shown as follows [30]:
q = 1.98 × ( h h 0 ) 1.621
where q is the unit flow (m3/s/m), h is the actual water depth, and h0 is the designed flood protection height.
Guided by the safety evacuation criteria proposed by TODA [31], which evaluates different unit flow values, a unit flow of q = 0.05 m3/s/m indicates “safe evacuation conditions”, q = 0.28 m3/s/m indicates “critical evacuation conditions,” and q = 0.60 m3/s/m indicates “extreme evacuation conditions”. This means that when water begins to infiltrate the metro, up to the point where q reaches 0.05 m3/s/m, it represents a safe range for individual evacuation. If rainfall continues and q reaches q = 0.28 m3/s/m, individuals can still evacuate, but it becomes critical. If q exceeds this range and continues to rise, safe evacuation will no longer be possible. Research has confirmed that when q = 0.28 m3/s/m, it marks the limit beyond which individual evacuation is impossible.
This study takes Xinsha station as the research subject, and based on the water accumulation and flooding model it simulates and compares two extreme rainfall scenarios, the 40,000-year return period and the 200-year return period, as shown in Figure 15 and Figure 16. The simulation results indicate that in both scenarios, the water level rises gradually over time, and as time progresses the rate of water rise slows down. The trend in the rate of water rise is consistent in both cases, initially rising slowly, reaching the highest rate around 6 h, and then gradually decreasing. At this point, the water rise rates are 2.44 mm/min and 4.84 mm/min, respectively. This suggests that during the early stages of rainfall, the rate of water rise is relatively slow, but as the rainfall continues the rate of water rise accelerates, peaking and then gradually slowing down.
In terms of the two different return periods, under the 200-year return period rainfall conditions the water depth after 24 h is 284.38 mm, which does not exceed the design flood height, indicating that the current design height at Xinsha station is sufficient to withstand extreme rainfall conditions with a 200-year return period. According to Formula (8), no unit flow will occur, indicating low safety risk. Under the 40,000-year return period rainfall conditions the water level begins to rise gradually, and after 18 h it exceeds the design flood height and starts to invade the metro station. At this point, the water rise rate is 0.11 mm/min. After 24 h the water depth reaches 484.23 mm, exceeding the design flood height by 34.23 mm. By substituting this water depth and the design flood height at Xinsha station’s entrances into Formula (8), the unit flow q under the 40,000-year return period scenario is calculated as 0.0045 m3/s/m, which is far below the safety threshold of 0.05 m3/s/m. This indicates that, under the simulated conditions, individuals can safely evacuate.
Based on the parameters obtained from the two simulated scenarios, the current design height at Xinsha station can effectively withstand extreme rainfall conditions with a 200-year return period. However, under the extreme conditions of the 40,000-year return period, while the water will slowly invade the metro station individuals can still evacuate safely. It is worth noting that the 40,000-year return period used in this simulation refers to the rainfall intensity from the 2020 Guangzhou “5·22” storm, with the 180 min rainfall in Zengcheng used as the reference for further study. Given this, for safety design considerations, it is still advisable to raise the design flood height to prevent water infiltration during future extreme rainfall events, thereby reducing potential property damage and safety risks. This recommendation is not only applicable to Xinsha station but also provides valuable insight for the flood control design of other similar metro stations.

4.2. Flood Control Design Optimization Strategy for the Guangzhou Metro

Extreme rainfall events have a profound impact on metro stations, potentially causing flooding and water accumulation that threaten passenger safety and may necessitate operational adjustments or even service suspensions. In addition, extreme weather conditions can damage critical metro infrastructure such as signaling systems and electrical equipment, thereby increasing operational risks. To address these challenges, metro systems must strengthen flood prevention and drainage measures and improve emergency response plans. These improvements include establishing early warning systems, preparing emergency supplies, and conducting regular emergency drills. Furthermore, urban planning and metro station design should incorporate strategies to enhance disaster resilience, thereby improving the metro system’s capacity to withstand extreme weather conditions. Collectively, these measures form a comprehensive strategy for metro systems to mitigate the impacts of extreme rainfall.

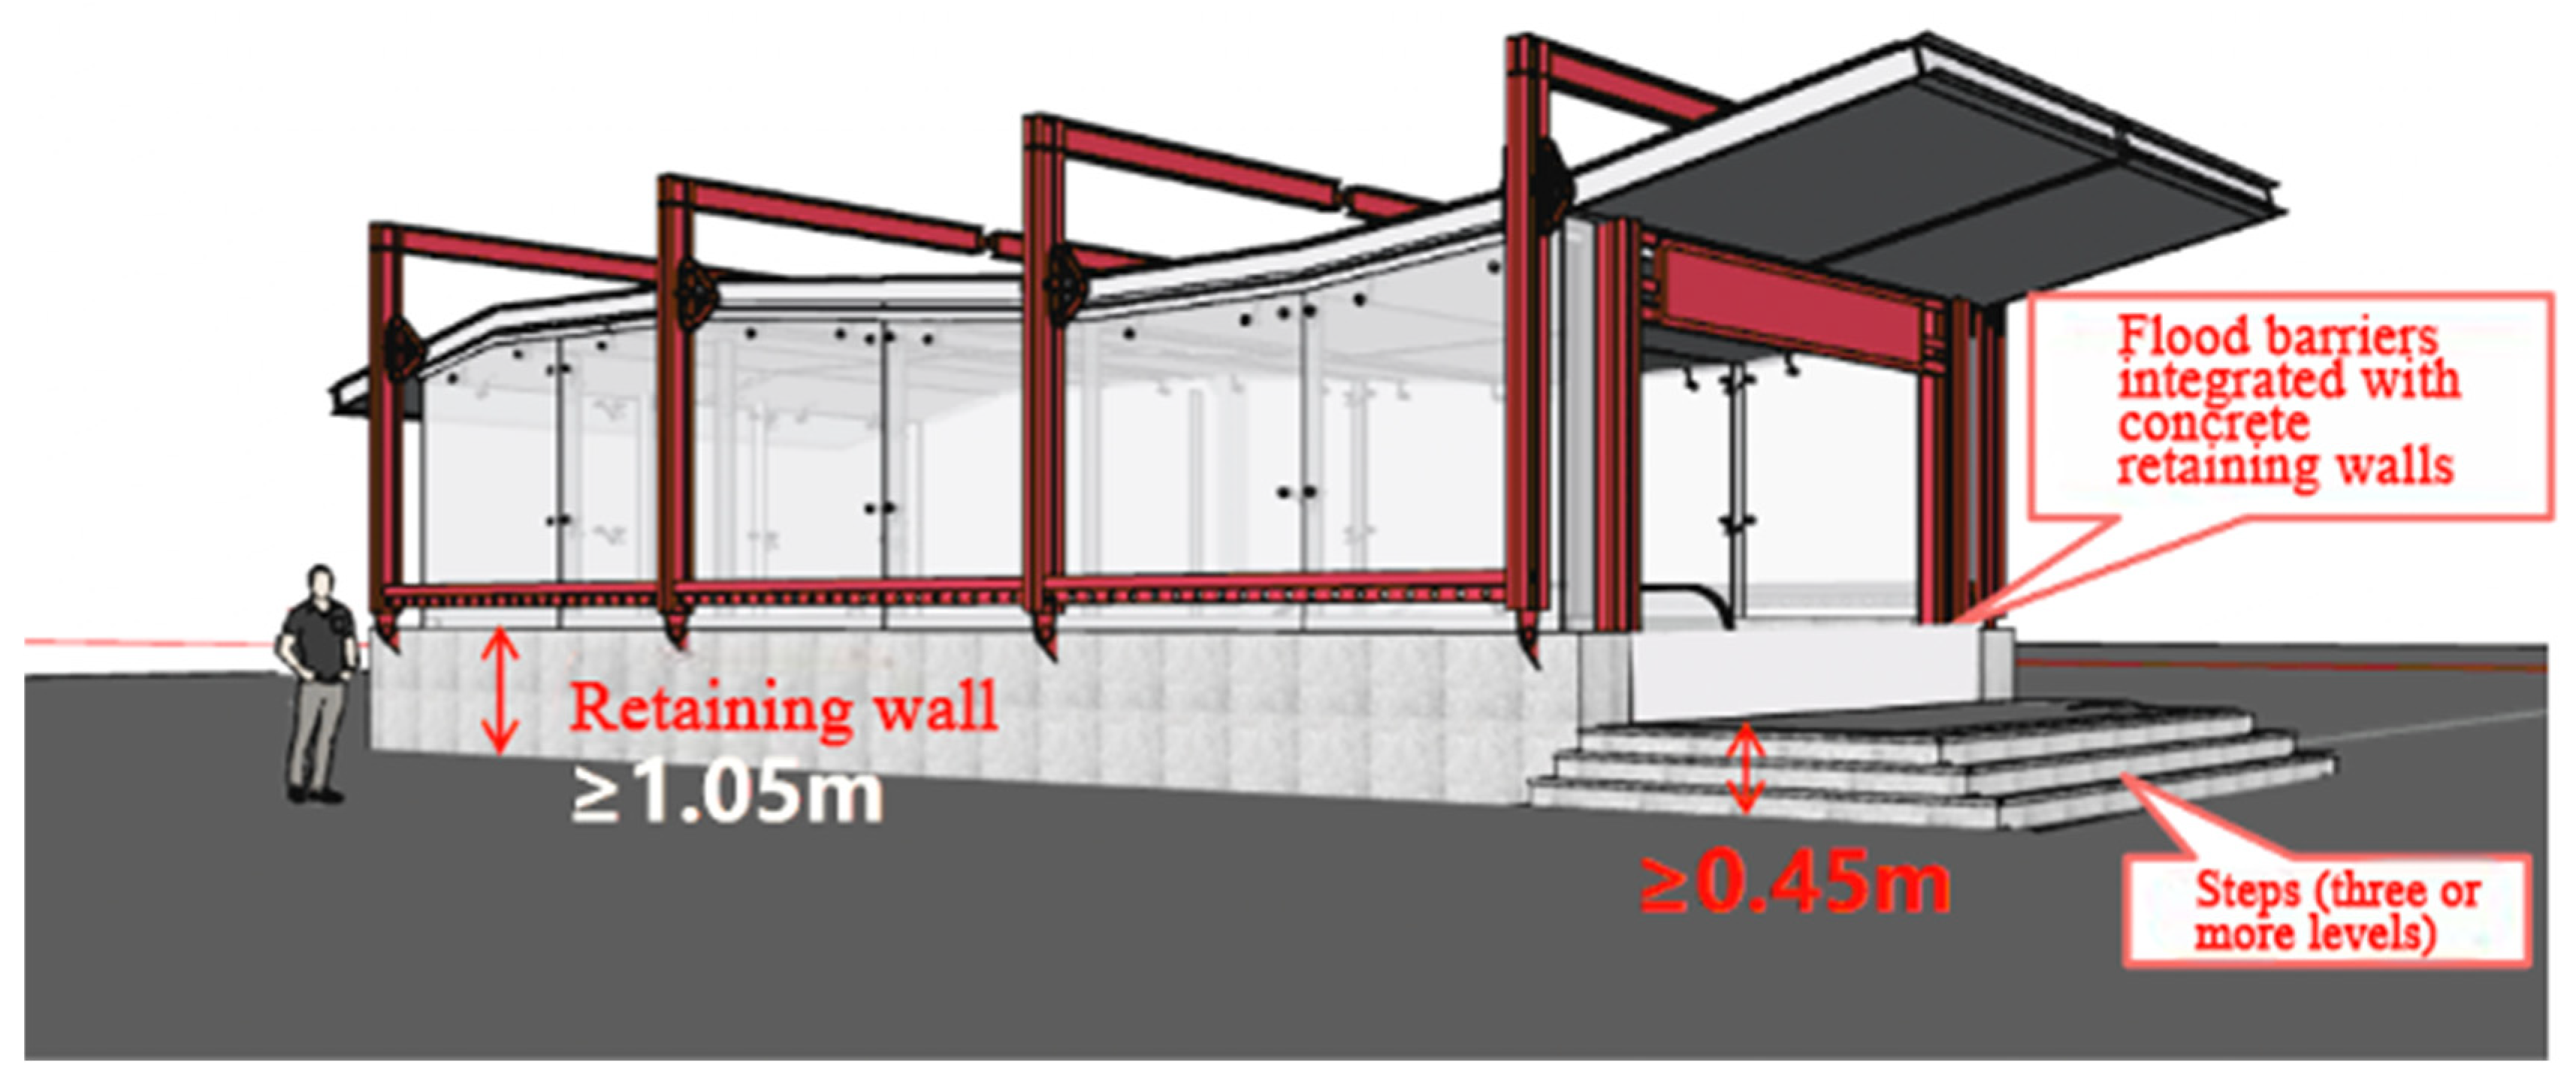
4.2.1. Flood Protection Design Elevation for Metro Stations

For newly constructed metro stations, the first step is to determine the design flood elevation for entrances. This elevation should exceed the recommended comprehensive flood protection level, the existing road elevation, and the planned road elevation. Additionally, using the runoff calculation formulas presented in Section 3 of this study the maximum runoff depths corresponding to different design return periods should be computed. The highest value among these four factors should be adopted as the design flood elevation to ensure project safety. According to the flood risk distribution map of the Zengcheng district, the southern part of the district is more prone to flooding, and Xinsha station—located in the southern area—falls within this high-risk zone. In contrast, the northern part of the district features higher terrain. For new stations situated in northern areas near Xinsha station, the maximum runoff depth calculated in this study can serve as the basis for elevation design.
For existing metro stations that do not meet current flood protection requirements, flood barriers should be added in accordance with the original design. If the entrance platform elevation is insufficient to meet the design flood level, several measures can be considered, such as adjusting the slope within the red-line boundary, raising the outdoor ground elevation, or adding steps at the entrance. However, it is recommended that no more than six steps be added. If the required height difference exceeds what can be accommodated by six steps, it is advisable to create tiered platforms using adjacent flat areas [13].
In addition to station entrances, regulations stipulate that flood barriers with a minimum height of 1.2 m must be installed at underground connections to adjacent buildings [13]. Each station should include two flood control equipment storage rooms positioned diagonally opposite each other. For transfer stations where terrain elevation does not vary significantly, the higher of the two lines’ flood protection elevations should be used as the design standard. However, if the flood protection level difference between the two lines exceeds 0.5 m, an engineering evaluation and corresponding modifications will be required, as shown in Figure 17.
For ancillary metro facilities, such as emergency exits and wind towers, it is recommended to implement comprehensive flood protection measures during initial construction. Safety exits built in conjunction with passenger entrances should adhere to the same flood protection standards as the entrances. The flood protection elevation of ancillary structures should match that of the entrances. Wind tower openings should be positioned above the projected flood level and any additional surge caused by strong winds to ensure continuous functionality during flood events. The design should fully integrate flood control features and account for surrounding terrain conditions. For low wind towers, the vertical distance between the tower top and the ground should not be less than 1.5 m. For high wind towers adjacent to roads, the bottom of the wind opening should be at least 2 m above ground level, whilst in green areas this distance should not be less than 1.5 m [32].

4.2.2. Integrated Optimization of Drainage Systems and Implementation of Intelligent Drainage Management

To further enhance flood prevention design, an integrated optimization of the drainage system should be implemented in conjunction with the adoption of intelligent drainage management. The metro flood prevention system must be planned in coordination with the city’s overall drainage infrastructure, utilizing regional hydrological system optimization to mitigate waterlogging risks. For instance, Guangzhou has been divided into 1016 stormwater drainage zones and has established a blue–green–gray integrated flood control system. This system incorporates the construction of major stormwater trunk pipelines, retention basins, and pumping stations to achieve a drainage capacity capable of managing events with a 3-to-5-year return period, while also providing resilience against 100-year extreme rainfall events [33]. The system design must dynamically track changes in the surrounding environment and reassess the flood protection elevation based on variations in topographical gradients or local hydrological conditions, thereby ensuring the safety of station platform elevations. On the technical side, real-time monitoring of both internal and external data is achieved using water level sensors, flow meters, and related equipment. Supported by Internet of Things (IoT) technologies, intelligent control of the drainage system is enabled [34]. Coordinated scheduling across multiple stations further enhances the responsiveness and efficiency in coping with extreme rainfall events.

4.3. Advantages and Limitations of the SCS-CN Method in Metro Flood Control Design

Understanding the runoff process is essential for flood prediction, the design of preventive measures, and addressing soil erosion across various disciplines. However, runoff is a highly complex process influenced by numerous interacting factors. To analyze this complexity, researchers have proposed a range of hydrological models which can generally be categorized into fully distributed models, semi-distributed models, and spatially lumped models. Among these, spatially lumped models have the lowest parameter complexity. The SCS-CN model adopted in this study is one of the simplest and most widely applied models in this category. It can be integrated into various modeling frameworks, including those for soil erosion and flood control [20,35,36,37].
As previously noted, the SCS-CN model estimates runoff based solely on the curve number (CN), which is primarily determined by hydrological conditions, land use, and soil type [38]. The key advantage of this model lies in its simplicity, it requires calibration of only a single parameter (CN) which makes it straightforward to operate, easy to understand and apply, and reliant on input data that are typically easy to obtain. In contrast, fully distributed models involve numerous parameters that are often difficult to collect and calibrate. In the case of the SCS-CN model, in addition to basic input data many parameter values can be directly selected from empirical reference tables or established databases.
The SCS-CN method is widely applied in practice due to its simplicity, but it has limitations stemming from its empirical nature. The CN values were originally developed by the U.S. Natural Resources Conservation Service based on data from agricultural sites in the Midwest [20], and thus require cautious application in different climatic regions. Studies indicate that the method performs well in humid and subhumid areas, particularly in first- and second-order basins and pasturelands, but is less accurate in forested regions [20,39]. Moreover, the method assumes spatial homogeneity in runoff generation, which may introduce errors in heterogeneous or erosion-affected watersheds, or in areas with uneven pollutant loads [36,40]. Guangzhou, with an annual rainfall of approximately 1600–1900 mm, shares similar climatic conditions with the regions where CN values were originally derived, thereby reducing potential application errors. Compared to models requiring numerous complex parameters, the SCS-CN method offers both operational simplicity and a transparent calculation process. Given these advantages, this study adopts the SCS-CN method as the primary approach for runoff estimation.
In summary, while the SCS-CN model is conceptually simple and easy to operate due to its reliance on a single parameter, this also results in high sensitivity to that parameter. To assess the sensitivity of runoff prediction to variations in CN values, we conducted perturbation experiments by adjusting CN by ±5 and ±10. The results indicate that an increase of 5 in the CN value leads to an average runoff increase of approximately 2% to 4%, whereas a decrease of 5 results in a runoff reduction of about 3% to 4%. These effects are particularly pronounced under high-intensity rainfall scenarios. These findings underscore the significant impact of CN selection on prediction accuracy and highlight the necessity of calibrating CN values using local field data.
This study conducted a systematic flood risk assessment of the Guangzhou metro system under extreme rainfall conditions, employing the SCS-CN method with Xinsha station as a case study. The proposed approach can be extended to metro systems in other cities across diverse climatic zones, where CN values may be refined using empirical data. This would support the development of region-specific reference databases for both research and engineering design. In practical applications, model parameters should be adjusted according to local hydrometeorological conditions, topography, and other regional characteristics to improve predictive accuracy. Given the spatial variability of natural conditions, locally adapted parameter settings are essential to ensure model reliability and applicability.

5. Conclusions

This study conducted an on-site investigation of the current flood prevention conditions of the Guangzhou metro system. Using the SCS-CN model, the design protection elevation at metro station entrances was calculated and optimization strategies for both new and existing stations were proposed. The main conclusions are as follows:
  • Field investigations revealed multiple deficiencies in flood protection at metro stations across Guangzhou, including low-lying terrain with water accumulation, insufficient elevation differences at entrances, inadequate drainage capacity, and risks of backflow from nearby rivers.
  • Based on the analysis of the “7·20” Zhengzhou and “5·22” Guangzhou extreme rainfall events and using Xinsha station as a case study, runoff depth under high-return-period rainfall was calculated. To ensure adequate safety margins, an increase in the flood protection elevation is recommended.
  • Under extreme rainfall, the flood progression at metro entrances typically follows the sequence: “extreme precipitation → surface water accumulation → intrusion → internal inundation”. Simulation results suggest that Xinsha station allows for a certain time window and conditions for safe evacuation, but raising the protection threshold remains necessary to cope with extreme events.
  • It is recommended that metro station protection elevations be determined based on topography and rainfall conditions, with the addition of supplementary protective structures. Furthermore, an integrated “blue–green–gray” drainage system should be developed, and monitoring and early-warning capabilities strengthened to achieve intelligent, system-level flood management.
This research provides a theoretical foundation for establishing flood protection standards for urban metro systems. The proposed framework can be extended to cities in different climate zones, enabling the construction of region-specific CN parameter databases. This supports the advancement of metro flood control design toward greater standardization and precision, enhancing system resilience and adaptability to climate change.

Author Contributions

X.C.: methodology, investigation, formal analysis, data curation, and writing—original draft preparation. H.K.: investigation and conceptualization. X.L.: investigation and conceptualization. B.X.: validation and supervision. All authors have read and agreed to the published version of the manuscript.

Funding

This research was funded by the General Program of the National Natural Science Foundation of China “Construction and Application of Climate Parameter Models for High-Density Urban Buildings”, grant number [52278087]. The Article Processing Charge (APC) was funded by Guangzhou Metro Design & Research Institute Co., Ltd., Guangzhou, China.

Data Availability Statement

The original contributions presented in this study are included in the article. Further inquiries can be directed to the corresponding author.

Conflicts of Interest

Author Xin Chen was employed by the Guangzhou Metro Design & Research Institute Co., Ltd. The remaining authors declare that the research was conducted in the absence of any commercial or financial relationships that could be construed as a potential conflict of interest. The sponsors had no role in the design, execution, interpretation, or writing of the study.

References

  1. Chen, X.; Zhang, H.; Chen, W.; Huang, G. Urbanization and Climate Change Impacts on Future Flood Risk in the Pearl River Delta under Shared Socioeconomic Pathways. Sci. Total. Environ. 2021, 762, 143144. [Google Scholar] [CrossRef] [PubMed]
  2. Lyu, H.-M.; Shen, S.-L.; Zhou, A.; Yang, J. Perspectives for Flood Risk Assessment and Management for Mega-City Metro System. Tunn. Undergr. Space Technol. 2019, 84, 31–44. [Google Scholar] [CrossRef]
  3. Aoki, Y. Anti-Inundation Measures for Underground Stations of Tokyo Metro. Procedia Eng. 2016, 165, 2–10. [Google Scholar] [CrossRef]
  4. Martello, M.V.; Whittle, A.J. Estimating Coastal Flood Damage Costs to Transit Infrastructure under Future Sea Level Rise. Commun. Earth Environ. 2023, 4, 137. [Google Scholar] [CrossRef]
  5. Qiu, H.; Qiu, R.; Luo, G.; Ayasrah, M.; Wang, Z. Study on the Mechanical Behavior of Fluid—Solid Coupling in Shallow Buried Tunnels under Different Biased Terrain. Symmetry 2022, 14, 1339. [Google Scholar] [CrossRef]
  6. Lyu, H.-M.; Shen, S.-L.; Yang, J.; Yin, Z.-Y. Inundation Analysis of Metro Systems with the Storm Water Management Model Incorporated into a Geographical Information System: A Case Study in Shanghai. Hydrol. Earth Syst. Sci. 2019, 23, 4293–4307. [Google Scholar] [CrossRef]
  7. Jiang, Y.; Gao, Y.; Yuan, Q.; Li, X.; Sun, K.; Sun, L. Simulation and Risk Assessment of Flood Disaster at the Entrance to a Rail Transit Station under Extreme Weather Conditions—A Case Study of Wanqingsha Station of Guangzhou Line 18. Water 2024, 16, 2024. [Google Scholar] [CrossRef]
  8. Quan, R.; Zhang, L.; Liu, M.; Lu, M.; Wang, J.; Niu, H. Risk Assessment of Rainstorm Waterlogging on Subway in Central Urban Area of Shanghai, China Based on Scenario Simulation. In Proceedings of the 2011 19th International Conference on Geoinformatics, Shanghai, China, 24–26 June 2011; pp. 1–6. [Google Scholar] [CrossRef]
  9. Xie, Q.; Luo, W.; Ouyang, Y.; Zhou, P.; Li, X. Study on Flood Protection Water Level and Early Warning for Huangpu Road Station of Wuhan Metro. Mod. Urban Rail Transit 2020, 71–75. (In Chinese) [Google Scholar] [CrossRef]
  10. Yin, F.; Li, X.Y. Flood Prevention Design for Rail Transit Engineering During the Rainy Season. Eng. Constr. Des. 2022, 57–59. (In Chinese) [Google Scholar]
  11. Wang, T.; Hu, L.; Chen, Z.G. Causes and Solutions for the Submersion of Guangzhou Metro Caused by the “5·22” Rainstorm in 2020. Guangdong Meteorol. 2020, 42, 52–55. (In Chinese) [Google Scholar]
  12. GB 50157-2013; Code for Design of Metro (Including Clause Explanations). Standardization Administration of China (SAC): Beijing, China, 2013. (In Chinese)
  13. Tang, S.M.; Li, X. Study on Design Flood Level for Hefei Metro Line 5 Station. Chin. J. Undergr. Space Eng. 2018, 14, 881–886, 899. (In Chinese) [Google Scholar]
  14. Liu, Y.B.; Gebremeskel, S.; De Smedt, F.; Hoffmann, L.; Pfister, L. A Diffusive Transport Approach for Flow Routing in GIS-Based Flood Modeling. J. Hydrol. 2003, 283, 91–106. [Google Scholar] [CrossRef]
  15. Elkhrachy, I. Flash Flood Hazard Mapping Using Satellite Images and GIS Tools: A Case Study of Najran City, Kingdom of Saudi Arabia (KSA). Egypt. J. Remote Sens. Space Sci. 2015, 18, 261–278. [Google Scholar] [CrossRef]
  16. Ni, J.D. Discussion on Flood Prevention Planning and Design for Metro Systems. Mod. Urban Rail Transit 2022, 77–80. (In Chinese) [Google Scholar]
  17. Ma, L.J.; Wang, C.T.; Wang, W.J.; Zhang, L.L.; Huang, H.P.; Zhang, S.T. Regional Runoff Characteristics in Zhengzhou City Based on SCS-CN Model. Bull. Soil Water Conserv. 2022, 42, 203–209, 381. (In Chinese) [Google Scholar]
  18. Ren, B.Z. Study on Design Storm and Runoff Calculation Model in Urban Areas. Ph.D. Thesis, Chongqing University, Chongqing, China, 2004. (In Chinese). [Google Scholar]
  19. Xu, J.; Zhao, Y.; Zhong, K.; Liu, X. Runoff simulation of main urban area in Guangzhou city based on the improved linear spectral mixture analysis and SCS-CN models. Trop. Geogr. 2016, 36, 969–975. [Google Scholar]
  20. Ponce, V.M.; Hawkins, R.H. Runoff Curve Number: Has It Reached Maturity? J. Hydrol. Eng. 1996, 1, 11–19. [Google Scholar] [CrossRef]
  21. Bhuyan, S.J.; Mankin, K.R.; Koelliker, J.K. Watershed–Scale AMC Selection for Hydrologic Modeling. Trans. ASAE 2003, 46, 303. [Google Scholar] [CrossRef]
  22. Zhang, Y.X.; Mu, X.M.; Wang, F. Calibration of Parameter λ in the Runoff Curve Number Model (SCS-CN) in Loess Hilly Region. Agric. Res. Arid Areas 2008, 124–128. (In Chinese) [Google Scholar]
  23. He, Y.P.; Chen, Y.; Xiao, T.G. Mesoscale Characteristics Analysis of the “5·22” Extreme Rainstorm Process Under Northwest Airflow Control in Guangzhou. J. Chengdu Univ. Inf. Technol. 2023, 38, 440–449. (In Chinese) [Google Scholar] [CrossRef]
  24. Pei, F.; Wu, C.; Liu, X.; Hu, Z.; Xia, Y.; Liu, L.A.; Xu, L. Detection and attribution of extreme precipitation changes from 1961 to 2012 in the Yangtze River Delta in China. Catena 2018, 169, 183–194. [Google Scholar] [CrossRef]
  25. Wu, J.; Li, J.; Zhu, Z.; Hsu, P.C. Factors determining the subseasonal prediction skill of summer extreme rainfall over southern China. Clim. Dyn. 2023, 60, 443–460. [Google Scholar] [CrossRef]
  26. GB/T 33668-2017; National Technical Committee 351 on Public Safety Fundamentals of Standardization Administration of China (SAC/TC 351). Metro Safety Evacuation Specification. China Standards Press: Beijing, China, 2017. (In Chinese)
  27. Chen, W.L.; Xia, J. Causes and Countermeasures of Urban Flooding in Guangzhou “5·22”. China Water Resour. 2020, 4–7. (In Chinese) [Google Scholar]
  28. Shen, R.Z. Mechanism of Flood Intrusion in Underground Spaces and Research on Flood Prevention Countermeasures. Ph.D. Thesis, Tianjin University, Tianjin, China, 2025. (In Chinese). [Google Scholar]
  29. Huo, K.; Qin, R.; Zhao, J.; Ma, X. Long-term tracking of urban structure and analysis of its impact on urban heat stress: A case study of Xi’an, China. Ecol. Indic. 2025, 174, 113418. [Google Scholar] [CrossRef]
  30. Ishigaki, T.; Toda, K.; Baba, Y.; Inoue, K.; Nakagawa, H. Experimental study on evacuation from underground space by using real size models. Proc. Hydraul. Eng. 2006, 50, 583–588. [Google Scholar] [CrossRef]
  31. Toda, K.; Oyagi, R.; Inoue, K.; Aihata, S. On the Inundation Process in the Underground Space in Urban Flooding. Kyoto Daigaku Bōsai Kenkyūjo Nenpō 2004, 47, 293–302. [Google Scholar]
  32. Zhu, K.Q. Research on Flood Control Design of Nanjing Metro Jiangxinzhou Station. Heilongjiang Sci. Technol. Commun. 2020, 43, 3. (In Chinese) [Google Scholar]
  33. Guangzhou Water Affairs Bureau. Comprehensive Planning for Urban Drainage (Rainwater) and Waterlogging Prevention in Guangzhou (2022–2035); Guangzhou Municipal Government: Guangzhou, China, 2024. [Google Scholar]
  34. Guangzhou Water Affairs Bureau. Special Planning for the “Smart Drainage” Project in Guangzhou (2019–2021); Guangzhou Municipal Government: Guangzhou, China, 2019. [Google Scholar]
  35. Hawkins, R.H. Curve Number Method: Time to Think Anew? J. Hydrol. Eng. 2014, 19, 1059. [Google Scholar] [CrossRef]
  36. Garen, D.C.; Moore, D.S. CURVE NUMBER HYDROLOGY IN WATER QUALITY MODELING: USES, ABUSES, AND FUTURE DIRECTIONS. J. Am. Water Resour. Assoc. 2005, 41, 377–388. [Google Scholar] [CrossRef]
  37. Beven, K.J. Rainfall-Runoff Modelling: The Primer, 2nd ed.; Wiley-Blackwell: Chichester, UK; Hoboken, NJ, USA, 2012. [Google Scholar]
  38. Bartlett, M.S.; Parolari, A.J.; McDonnell, J.J.; Porporato, A. Beyond the SCS-CN Method: A Theoretical Framework for Spatially Lumped Rainfall-runoff Response. Water Resour. Res. 2016, 52, 4608–4627. [Google Scholar] [CrossRef]
  39. Tedela, N.H.; McCutcheon, S.C.; Rasmussen, T.C.; Hawkins, R.H.; Swank, W.T.; Campbell, J.L.; Adams, M.B.; Jackson, C.R.; Tollner, E.W. Runoff Curve Numbers for 10 Small Forested Watersheds in the Mountains of the Eastern United States. J. Hydrol. Eng. 2012, 17, 1188–1198. [Google Scholar] [CrossRef]
  40. Hawkins, R.H. Distribution of Loss Rates Implicit in the SCS Runoff Equation. Hydrol. Water Resour. Ariz. Southwest 1982, 12, 47–52. [Google Scholar]
Figure 1. Location map of Guangzhou.
Buildings 15 01689 g001
Figure 2. Annual precipitation in Guangzhou in 2022. Figures created by the author, data from the “2023–2024 China Statistical Yearbook”.
Buildings 15 01689 g002
Figure 3. Annual precipitation in Guangzhou in 2023. Figures created by the author, data from the “2023–2024 China Statistical Yearbook”.
Buildings 15 01689 g003
Figure 4. Emergency response at Xinsha station.
Buildings 15 01689 g004
Figure 5. Flooding incident photo.
Buildings 15 01689 g005
Figure 6. Elevation configuration of some stations on Line 13.
Buildings 15 01689 g006
Figure 7. Water accumulation at Yuan Cun station.
Buildings 15 01689 g007
Figure 8. Sunken cooling tower at Zhongxin station.
Buildings 15 01689 g008
Figure 9. Conghua passenger station D entrance.
Buildings 15 01689 g009
Figure 10. Haizhu square station B entrance.
Buildings 15 01689 g010
Figure 11. Location map of Xinsha.
Buildings 15 01689 g011
Figure 12. Flood risk distribution map of Zengcheng district.
Buildings 15 01689 g012
Figure 13. Risk assessment area around Xinsha station.
Buildings 15 01689 g013
Figure 14. Land-use types around the metro station.
Buildings 15 01689 g014
Figure 15. Precipitation and water accumulation process at the entrance under the 200-year return period scenario.
Buildings 15 01689 g015
Figure 16. Precipitation and water accumulation process at the entrance under the 40,000-year return period scenario.
Buildings 15 01689 g016
Figure 17. Schematic diagram of flood prevention design of subway station entrance.
Buildings 15 01689 g017
Disclaimer/Publisher’s Note: The statements, opinions and data contained in all publications are solely those of the individual author(s) and contributor(s) and not of MDPI and/or the editor(s). MDPI and/or the editor(s) disclaim responsibility for any injury to people or property resulting from any ideas, methods, instructions or products referred to in the content.

