
How Does the Platform Economy Affect Urban System: Evidence from Business-to-Business (B2B) E-Commerce Enterprises in China


Abstract
1. Introduction
2. Literature Review
2.1. Urban System Theory
2.2. Platform Economy and the Urban System
3. Materials and Methods
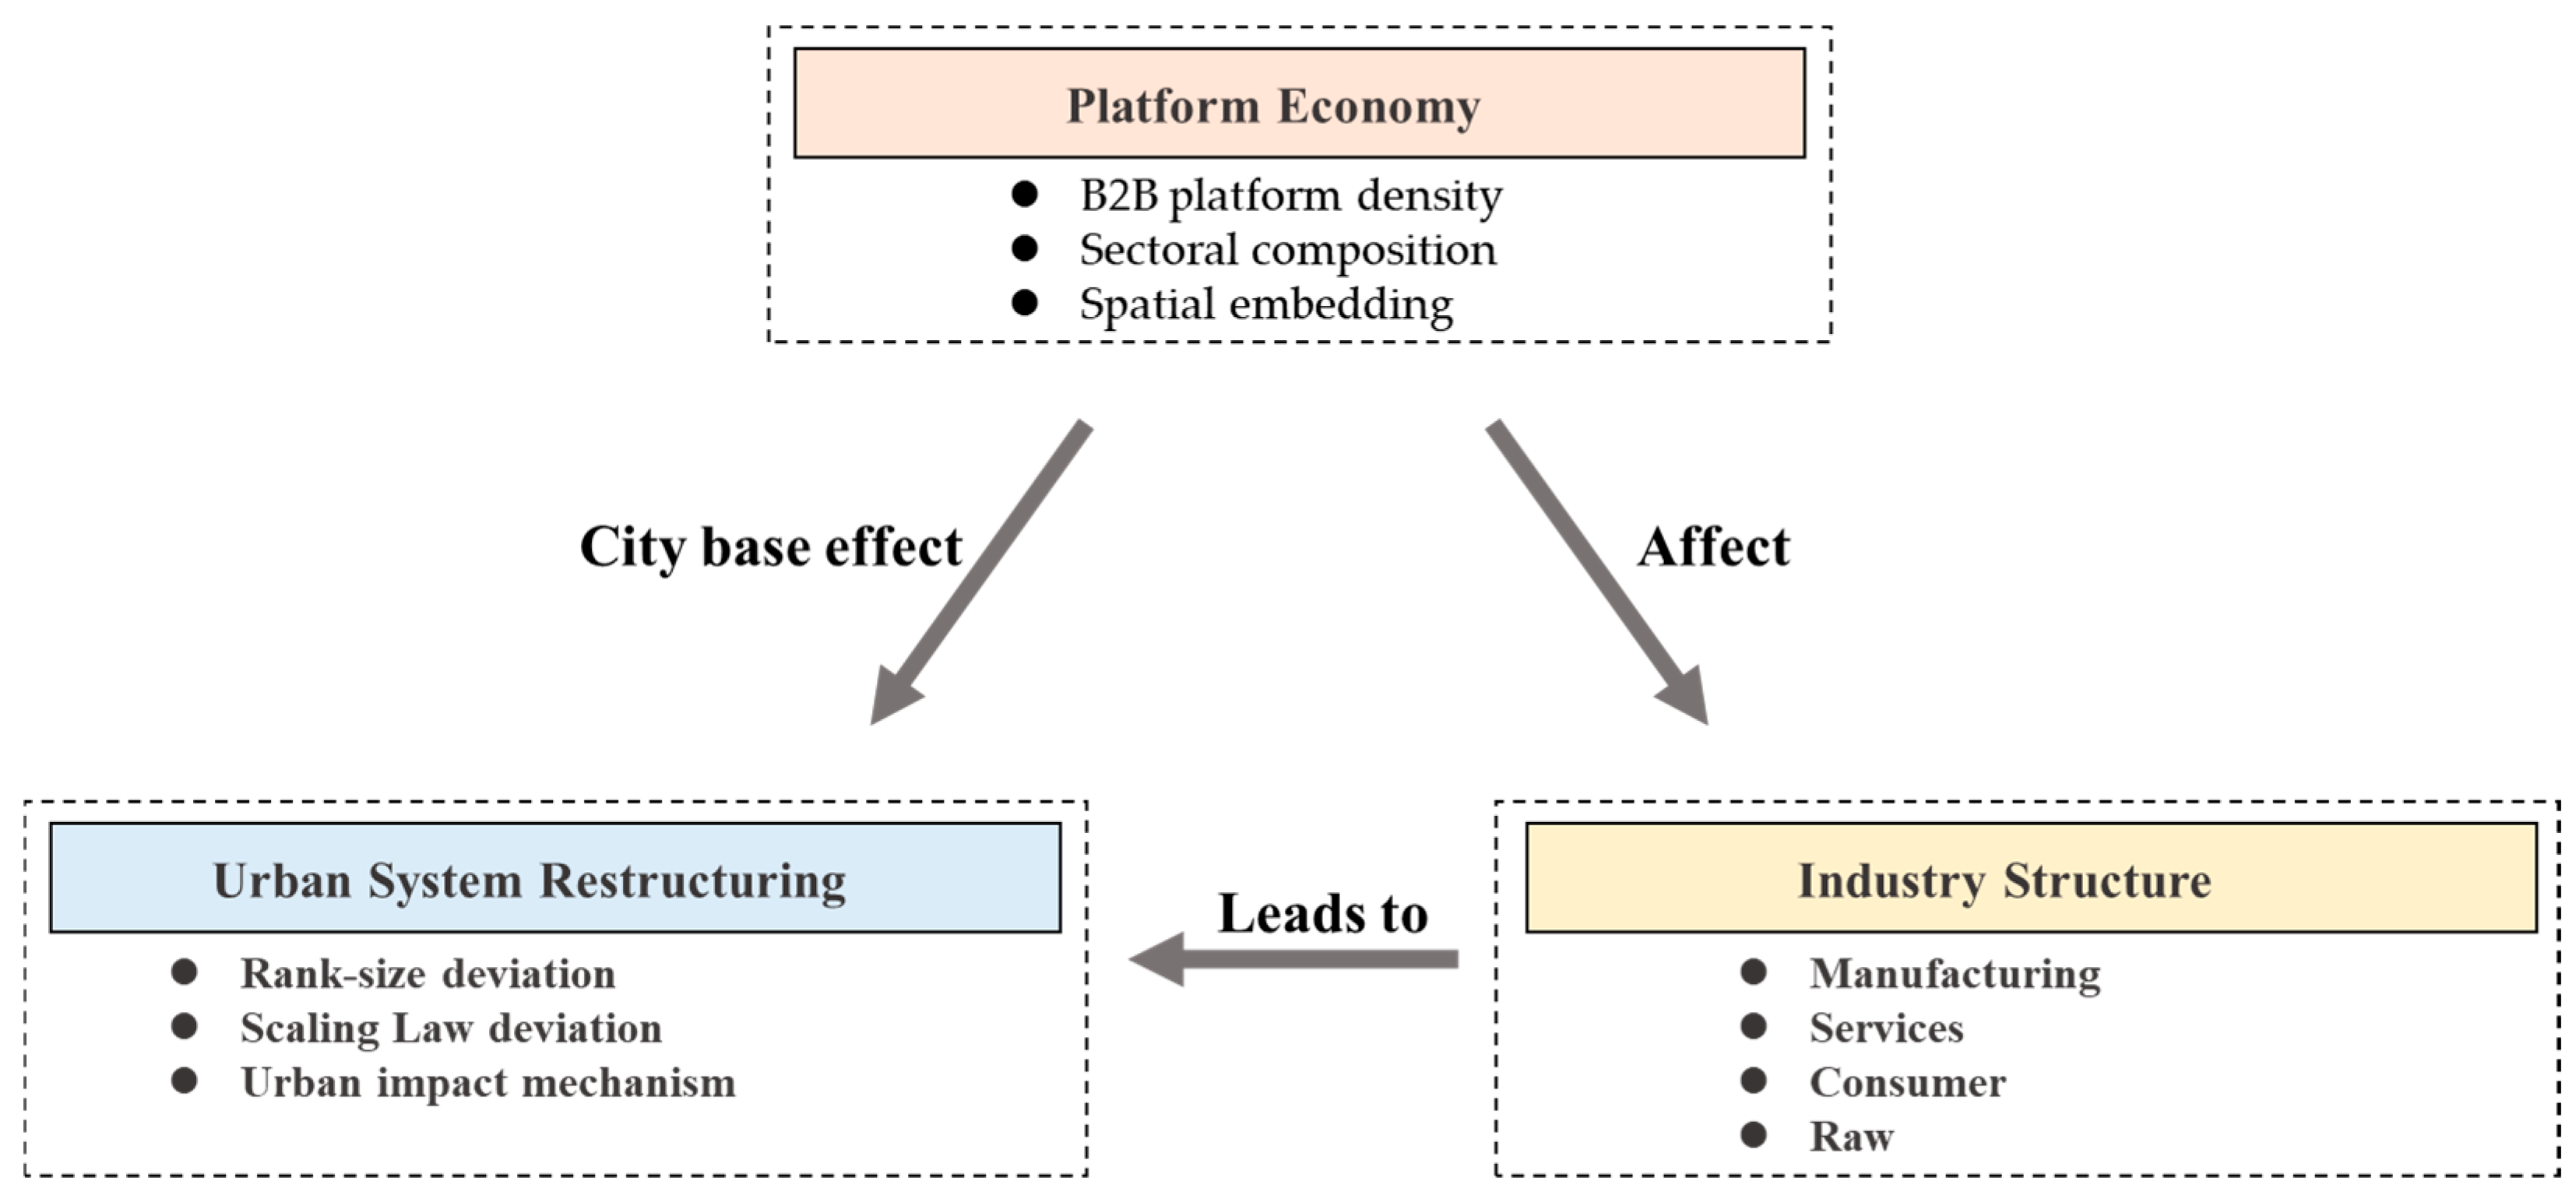
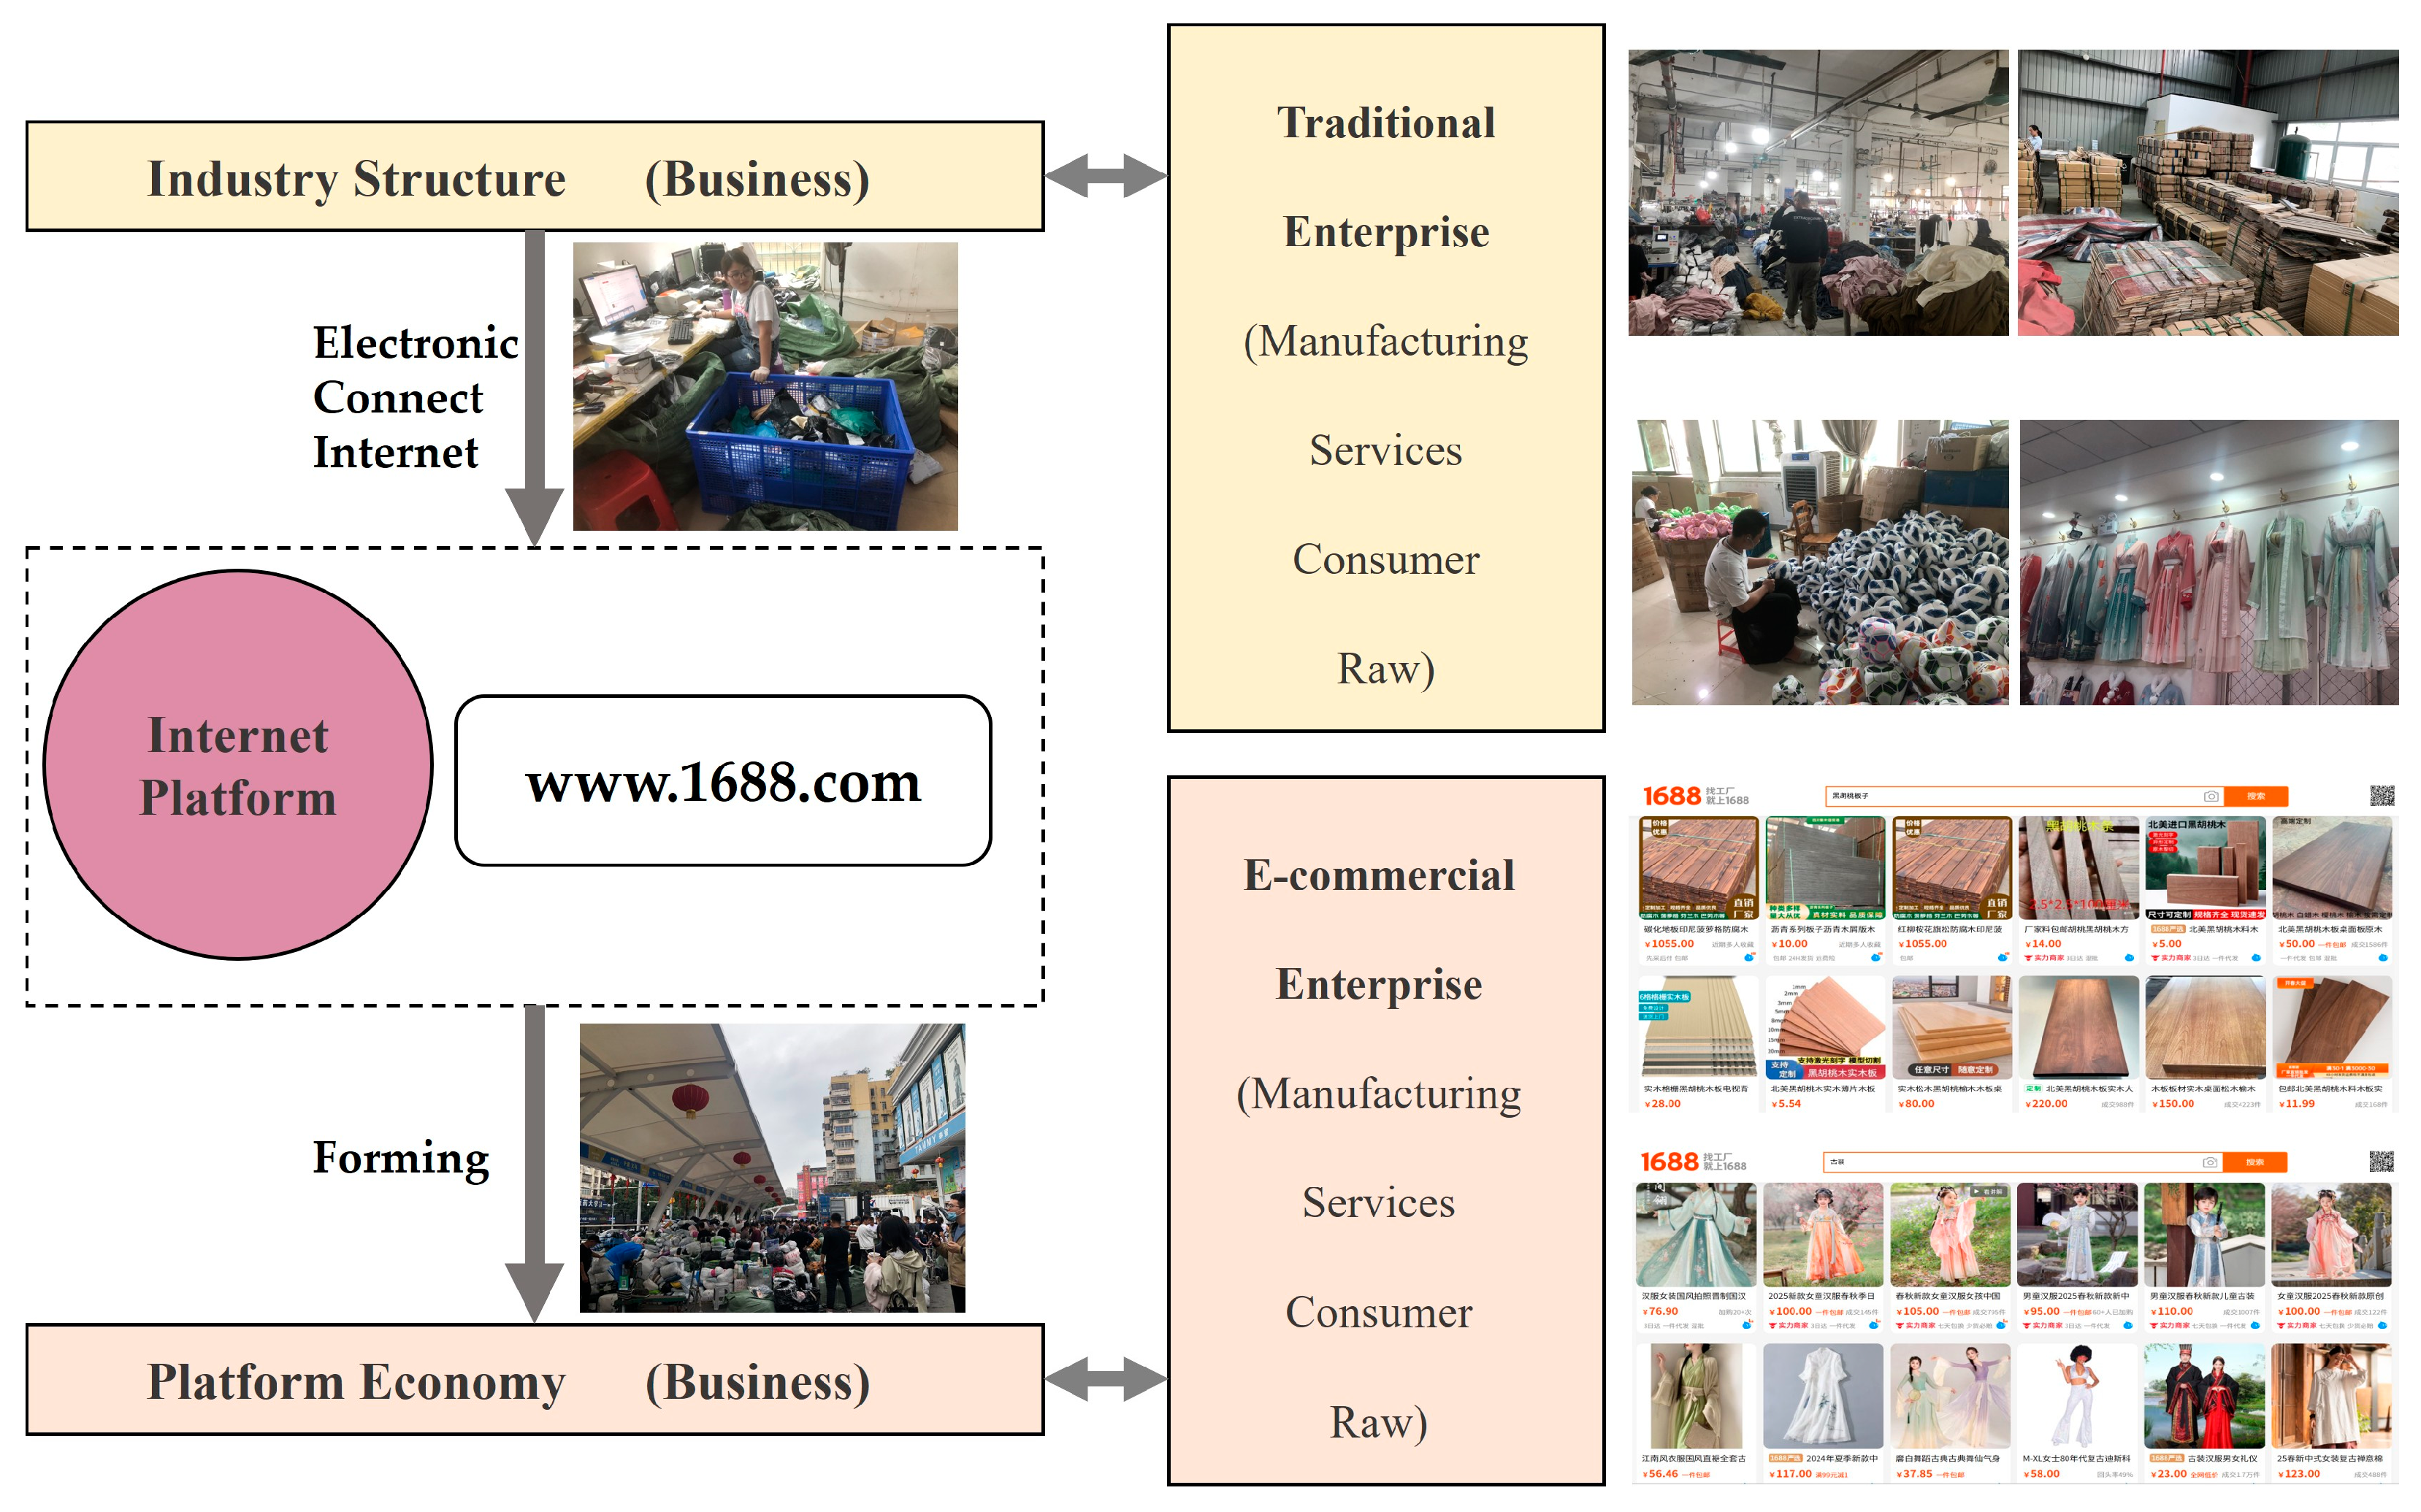
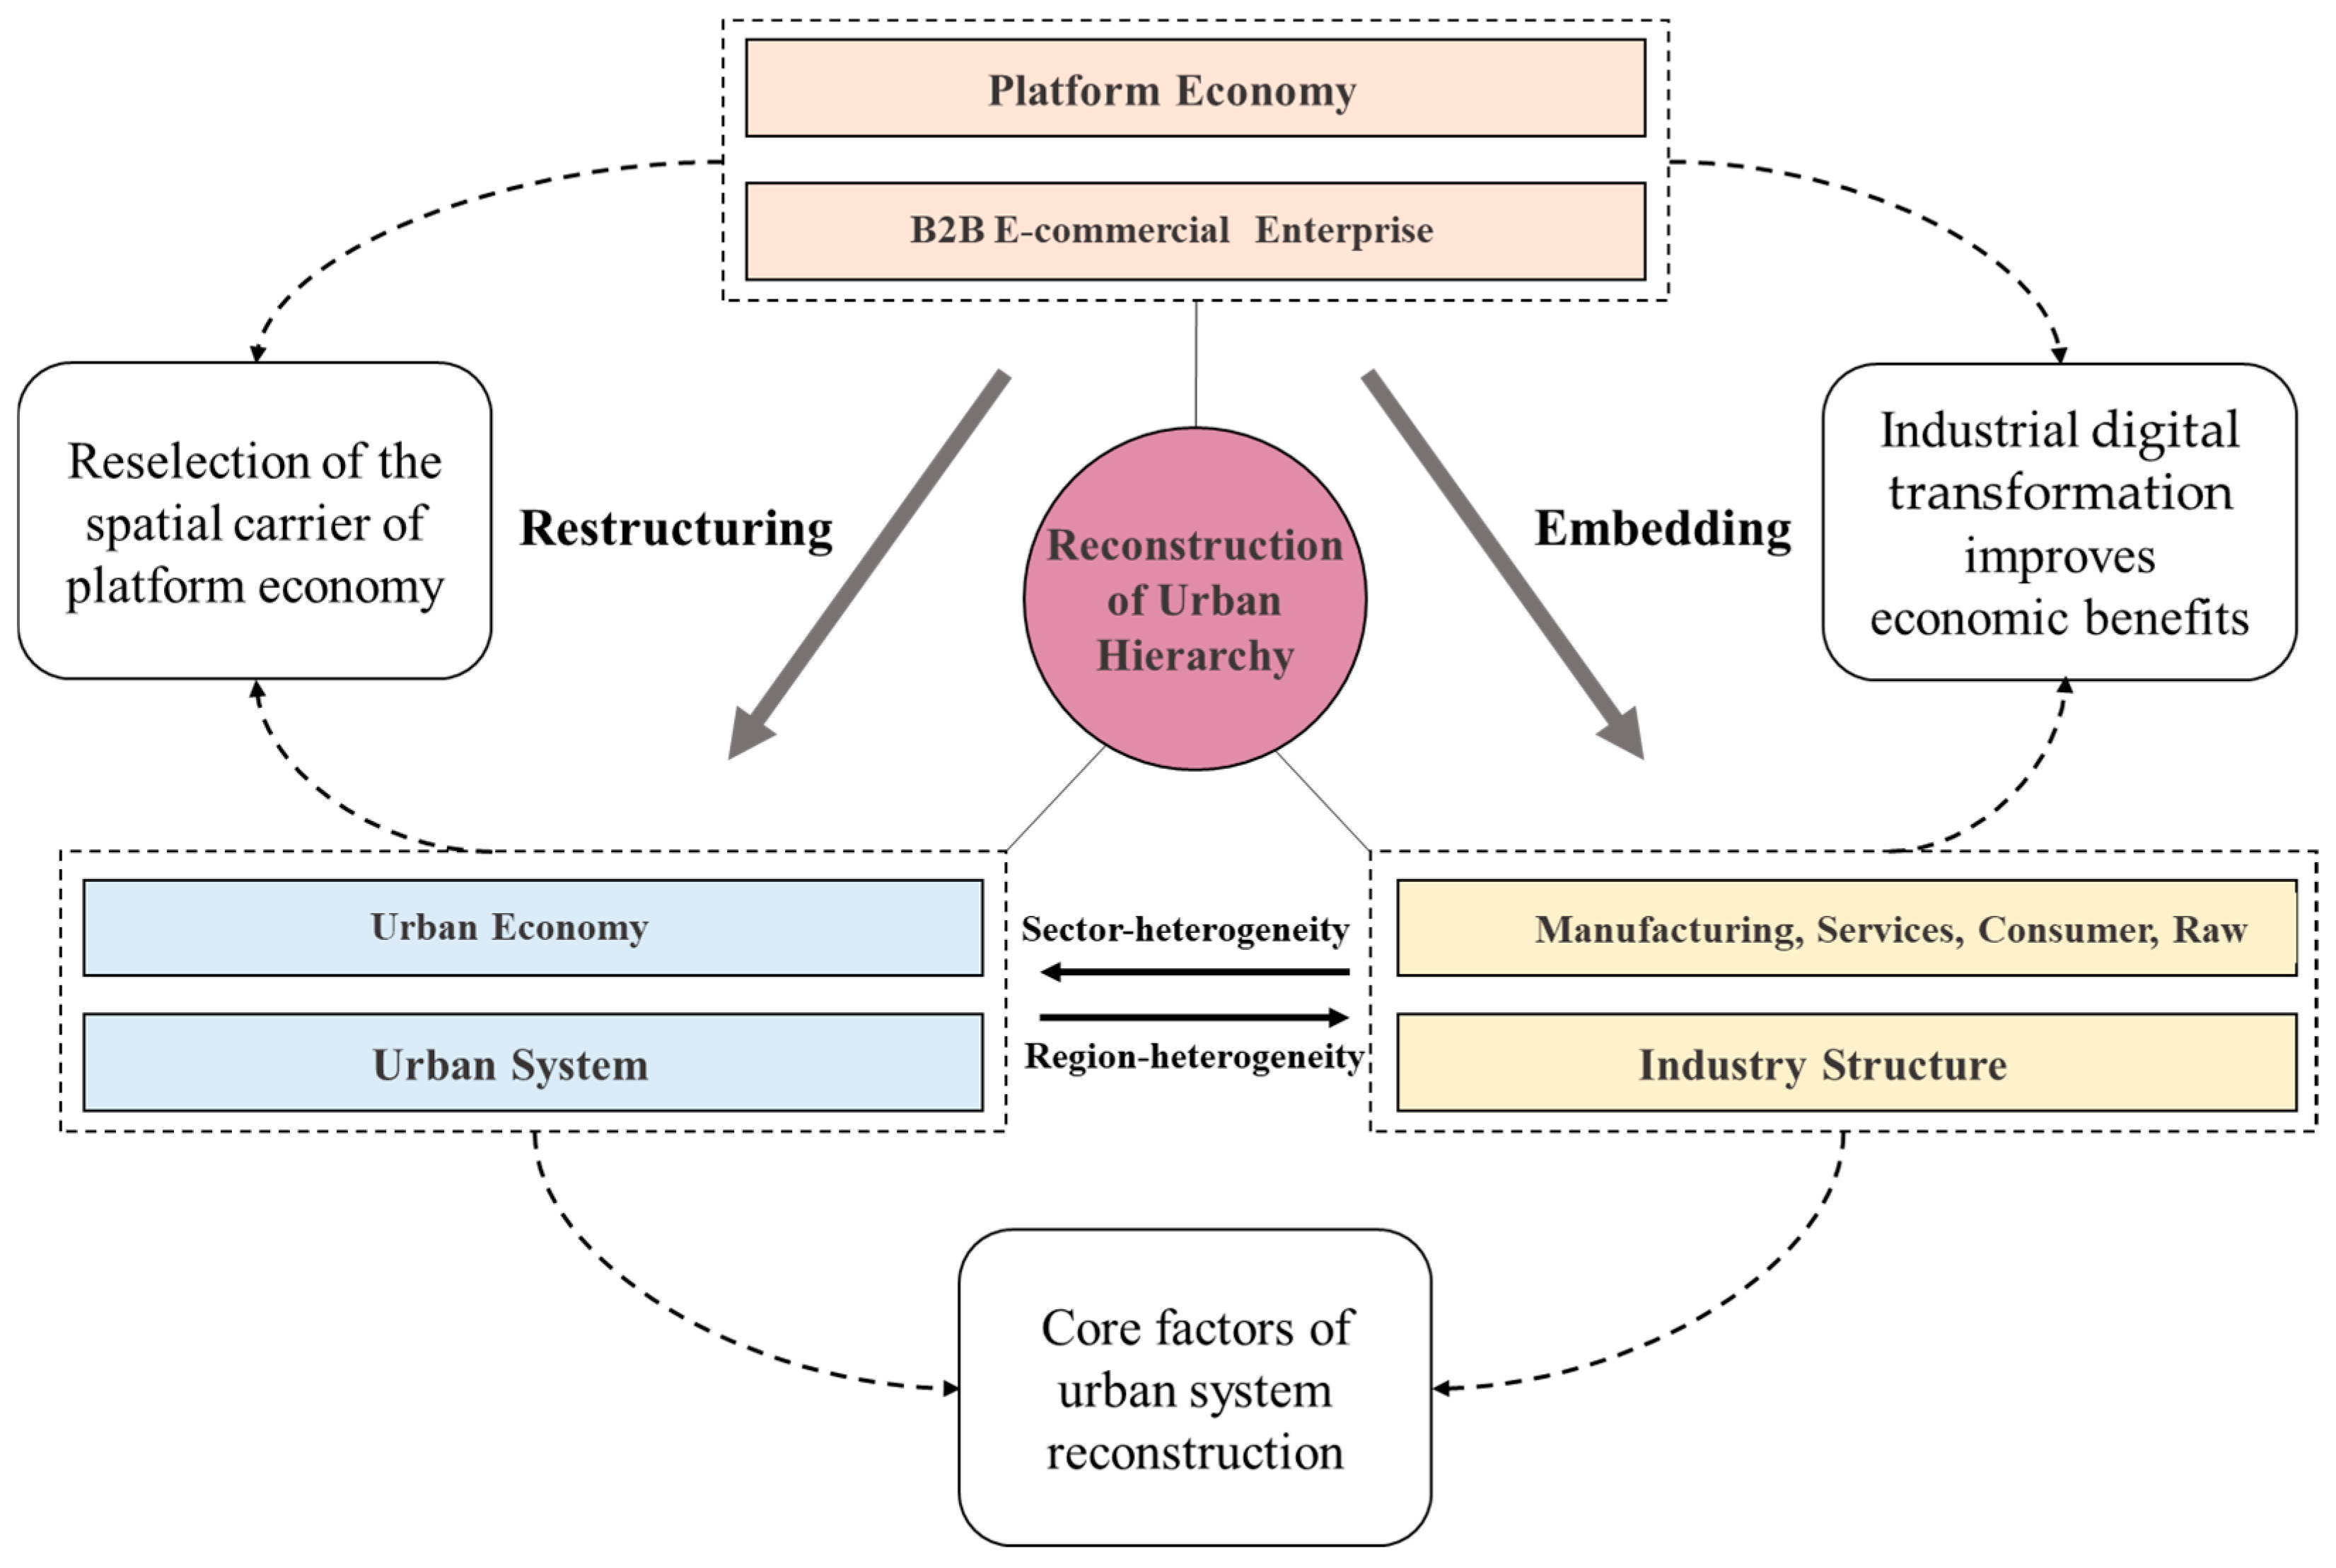
3.1. Research Framework
3.2. Data Collection
3.3. Methodology
3.3.1. Rank–Size and Urban Scaling Law
3.3.2. Global Moran’s I
3.3.3. Ordinary Least Squares (OLS) Regression
3.3.4. Random Forest Regression and Non-Linear Mechanism Identification
- Partial Dependence Plots (PDP): to visualize the average marginal effect of a variable on the predicted outcome, holding other variables constant.
- Individual Conditional Expectation (ICE) plots: to assess heterogeneity in response curves across different cities.
- Segmented regression and LOWESS (Locally Weighted Scatterplot Smoothing): to identify non-linear patterns and critical thresholds in variables such as GDP, tertiary sector output, and employment in the information sector.
4. Results
4.1. Spatial Patterns and Distribution Analysis
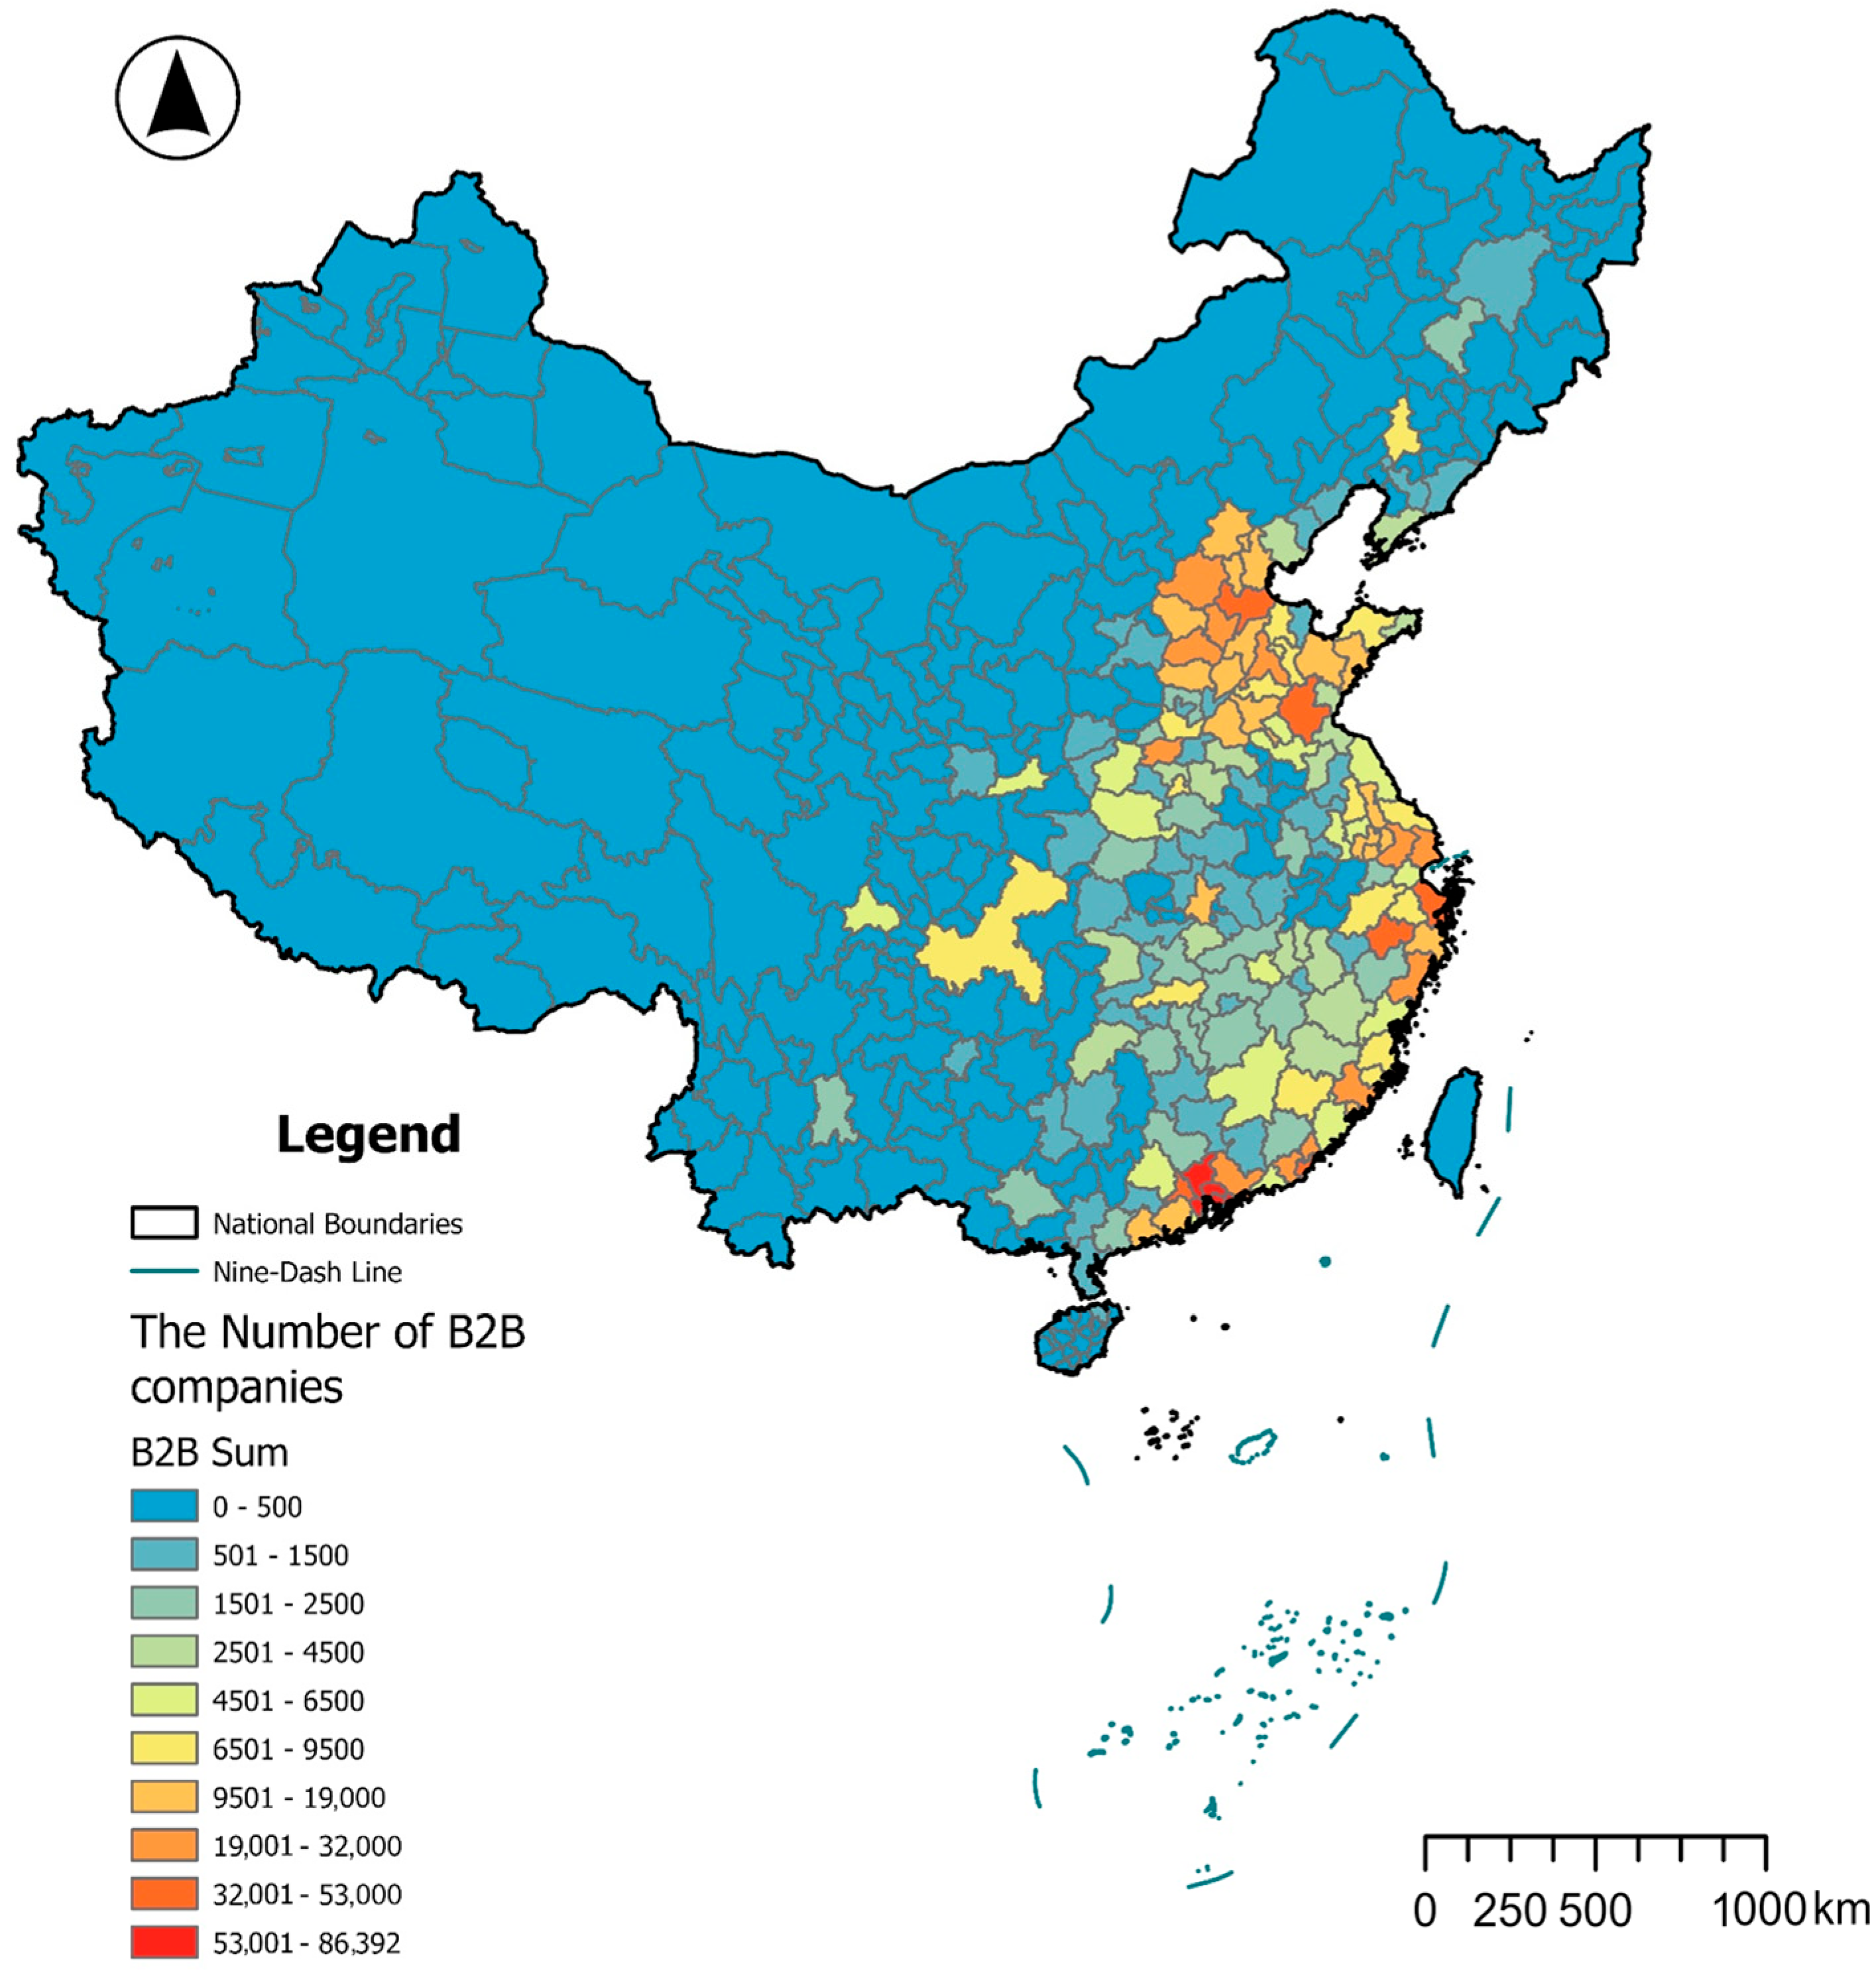
4.1.1. Overall Spatial Distribution of B2B Enterprises
4.1.2. Sectoral Distribution Patterns of B2B Enterprises
4.1.3. Regional Spatial Characteristics of the B2B E-Commerce Sector
4.1.4. Spatial Autocorrelation and Interpolation Analysis
4.2. Empirical Analysis
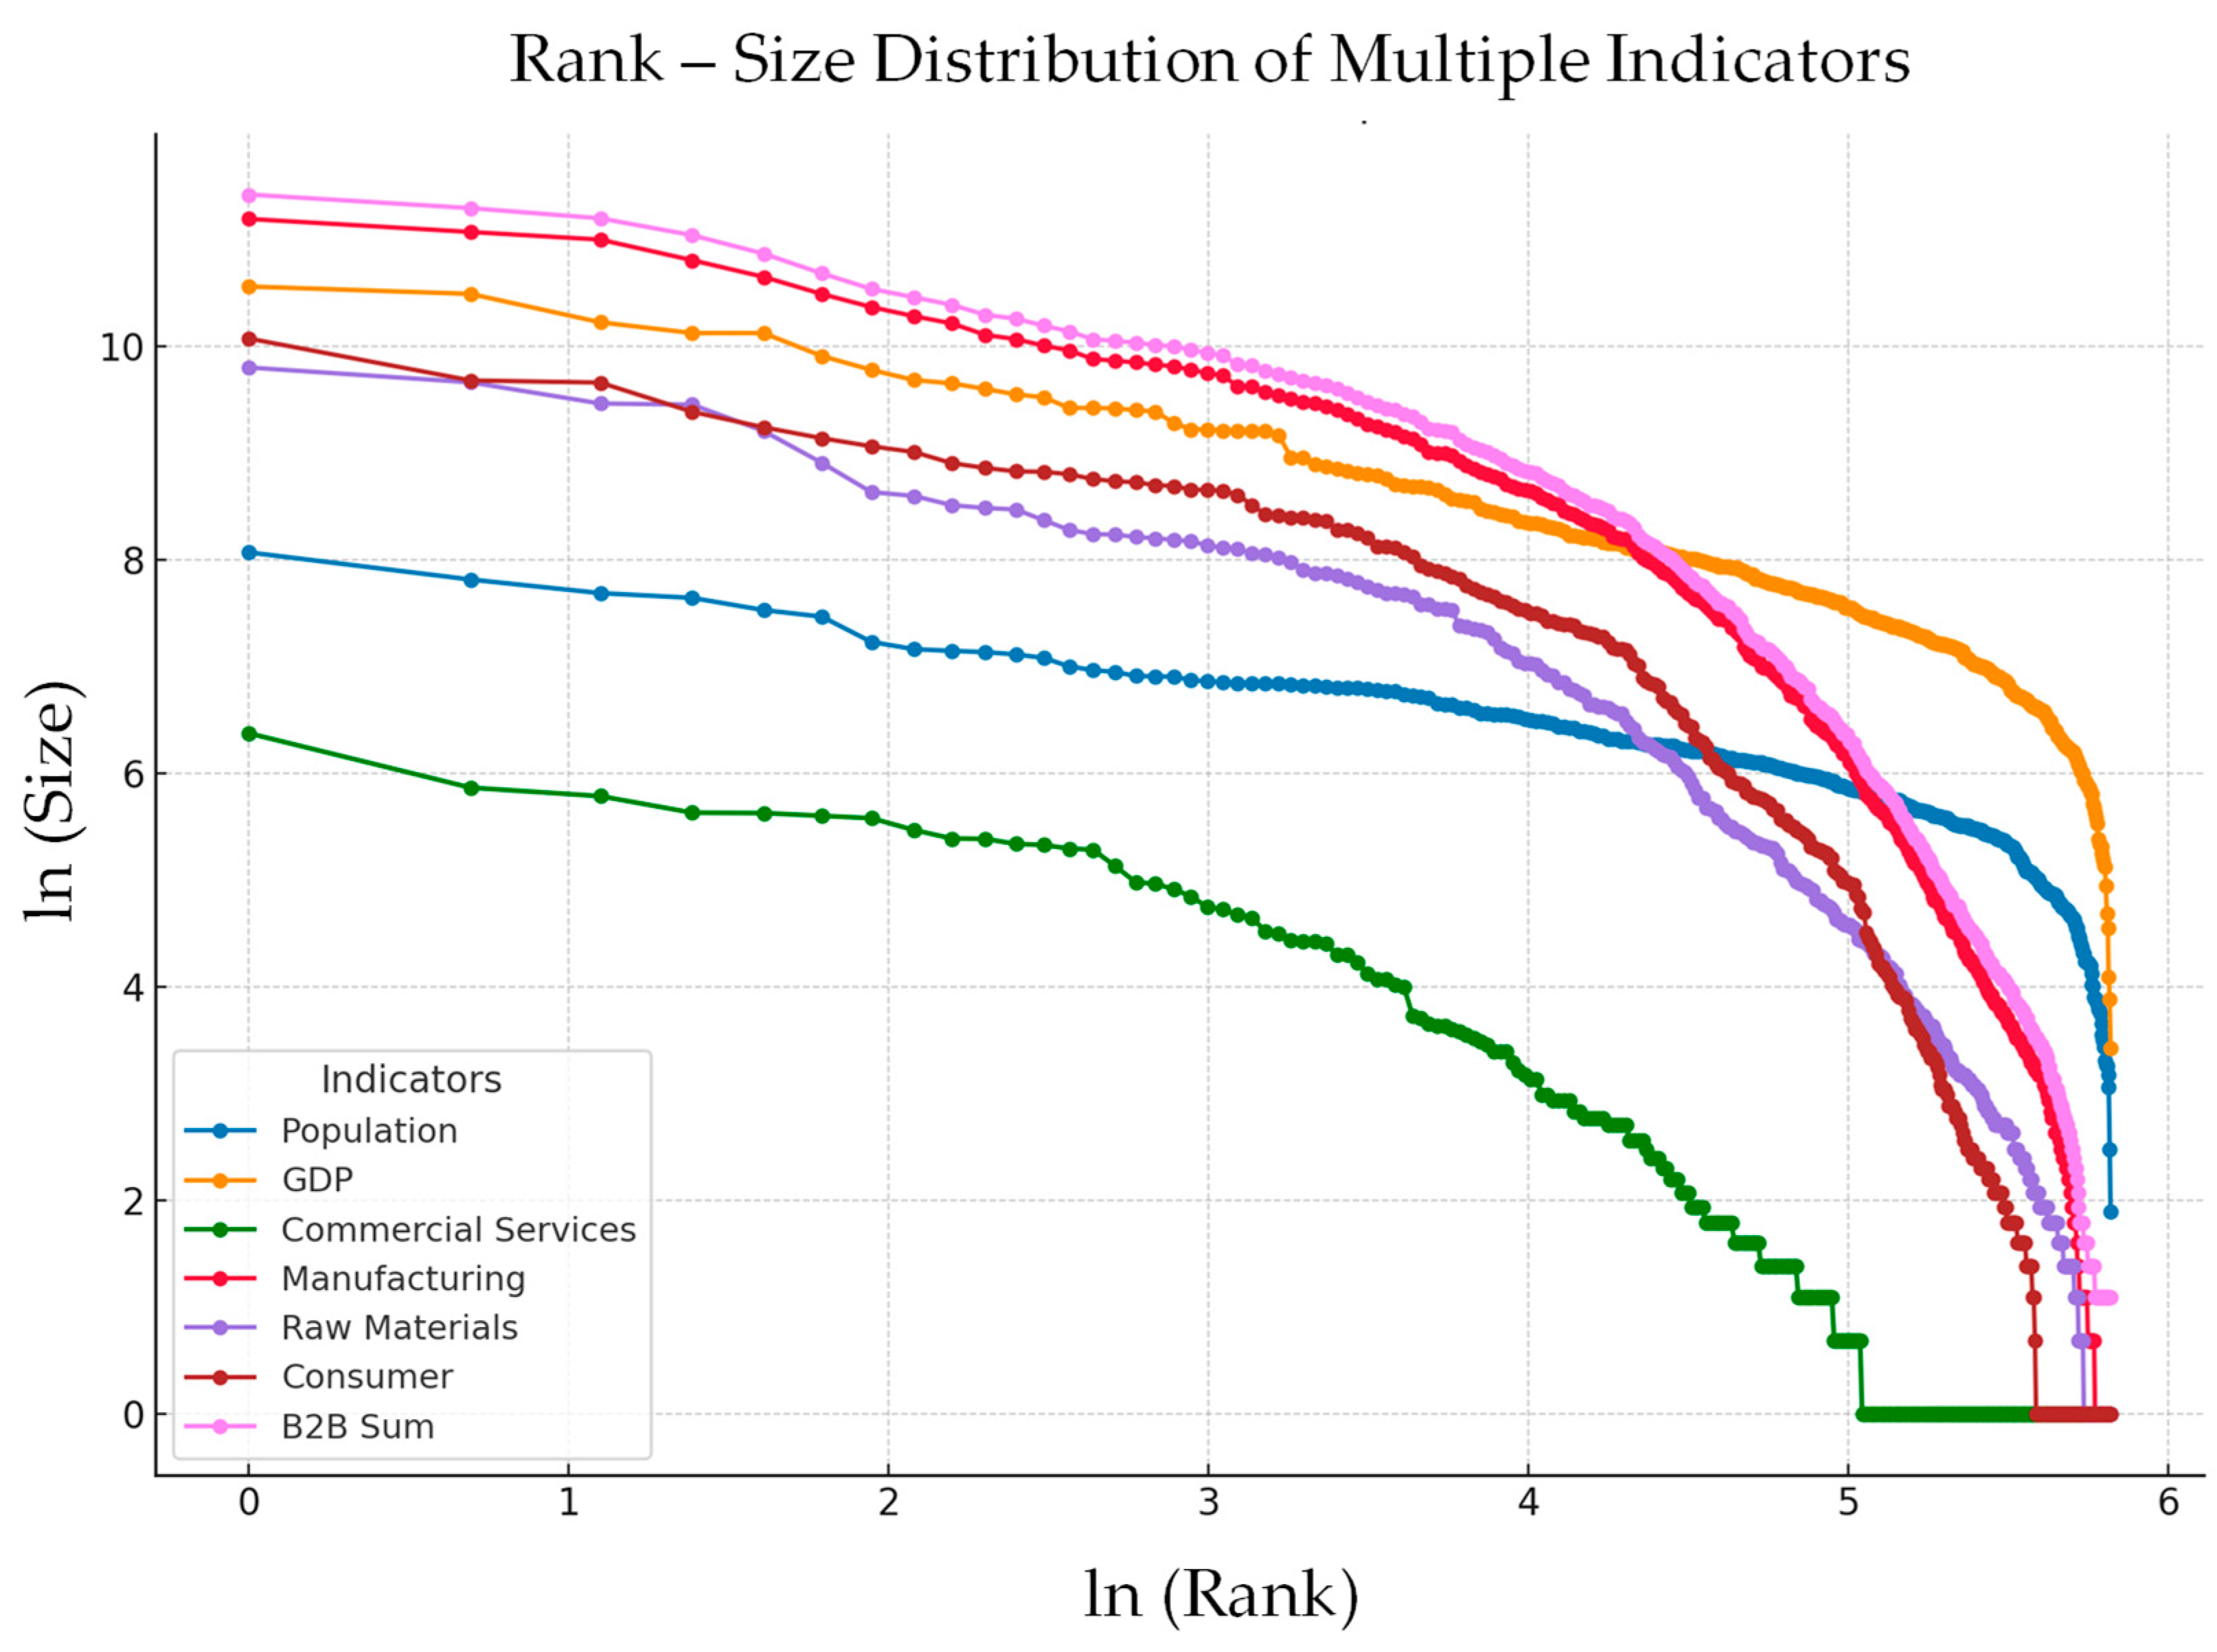
4.2.1. Analysis of Urban Hierarchical Structure
- (1)
- Rank–Size Distribution
- (2)
- Urban Scaling Law
4.2.2. Mechanism Identification of B2B Platform Development
- (1)
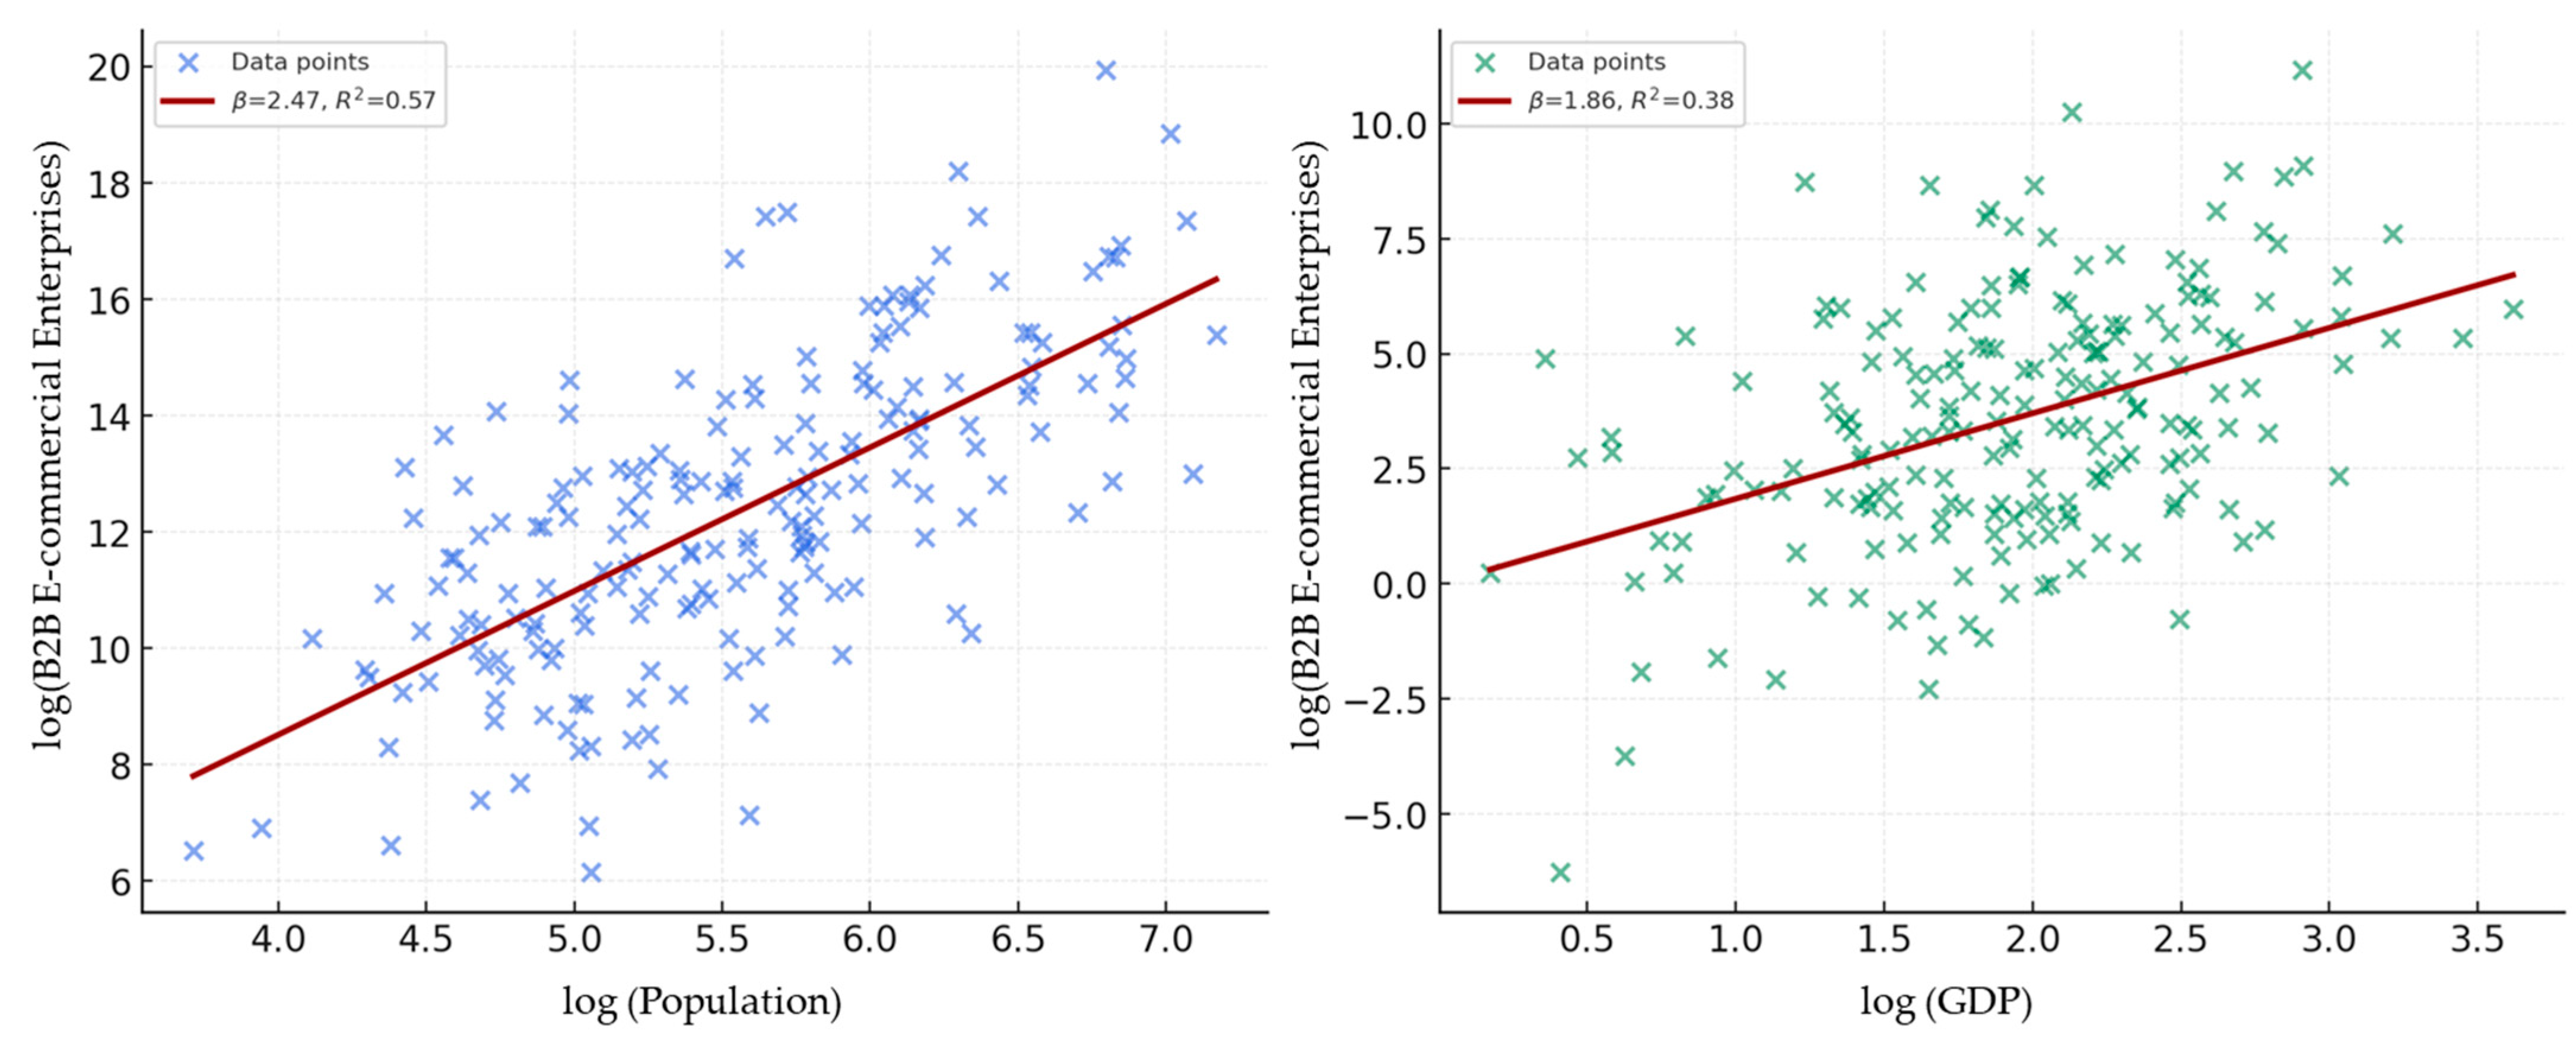
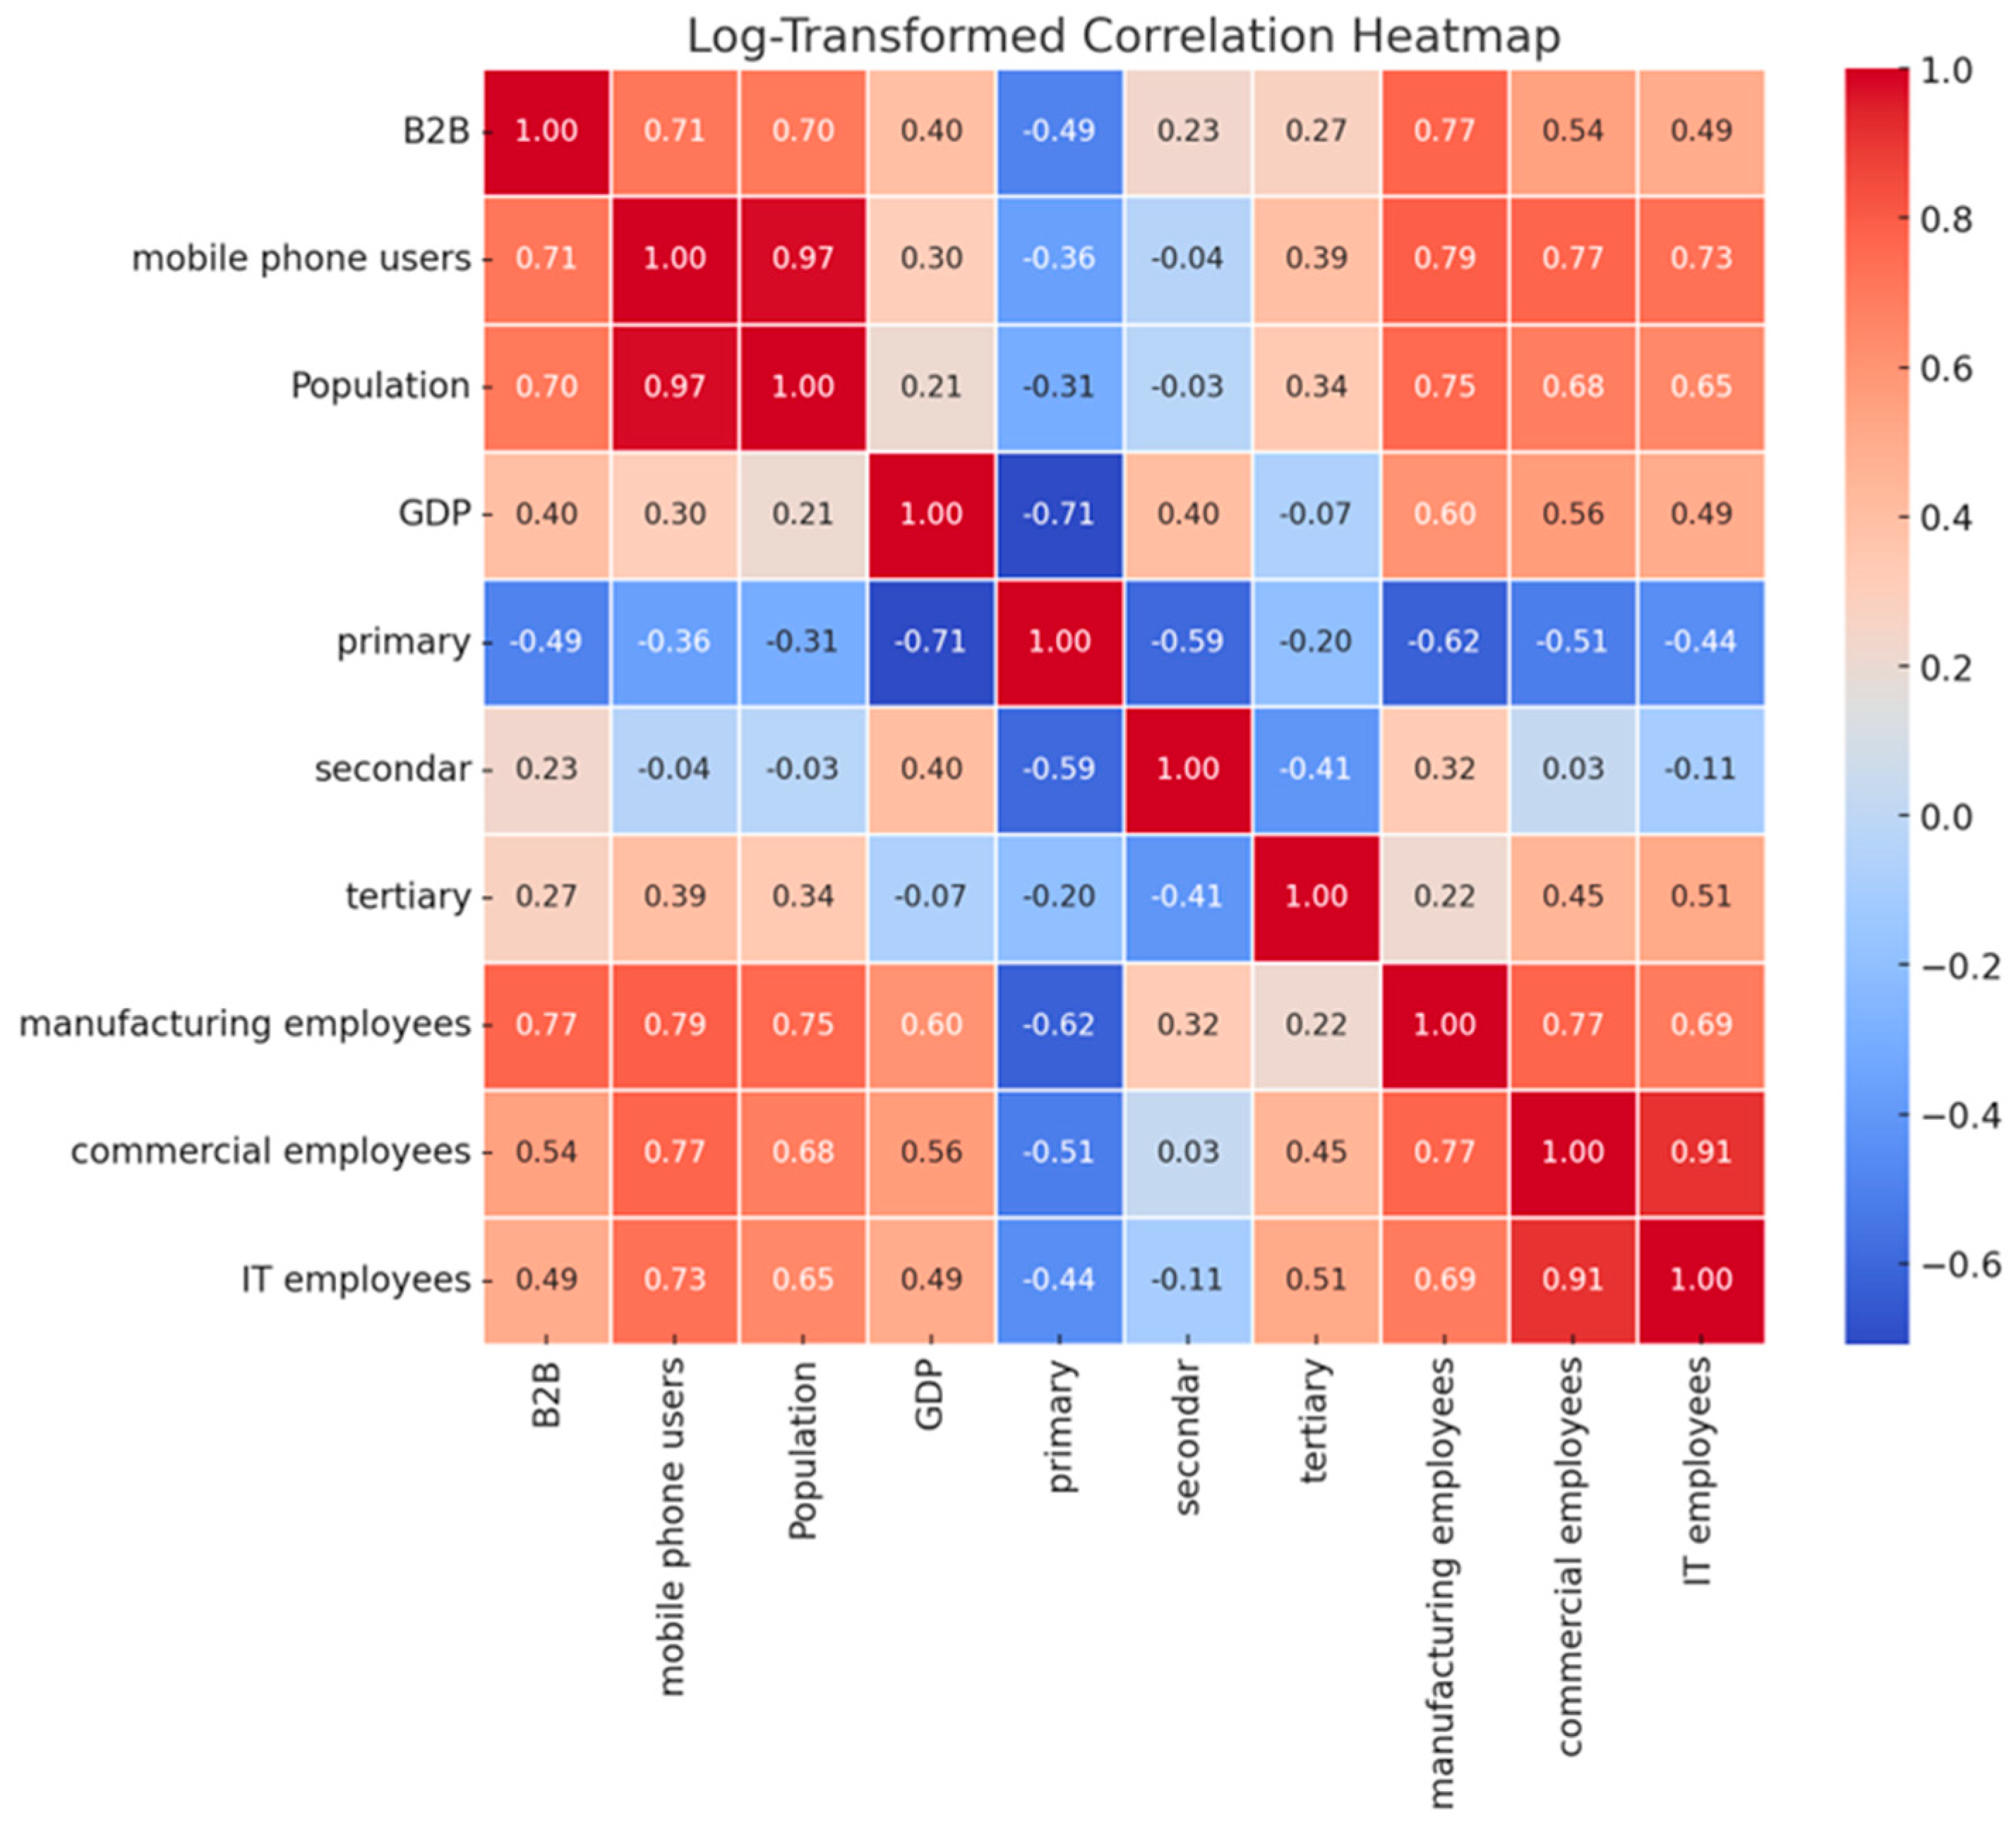
- OLS Regression Analysis
- Population size exerts uniformly positive effects across all B2B categories (p < 0.001).
- Industrial composition shows differential impacts—primary sector development negatively correlates with commercial services platforms, while secondary and tertiary sector growth significantly accelerates industrial, raw materials, and consumer goods platforms.
- (2)
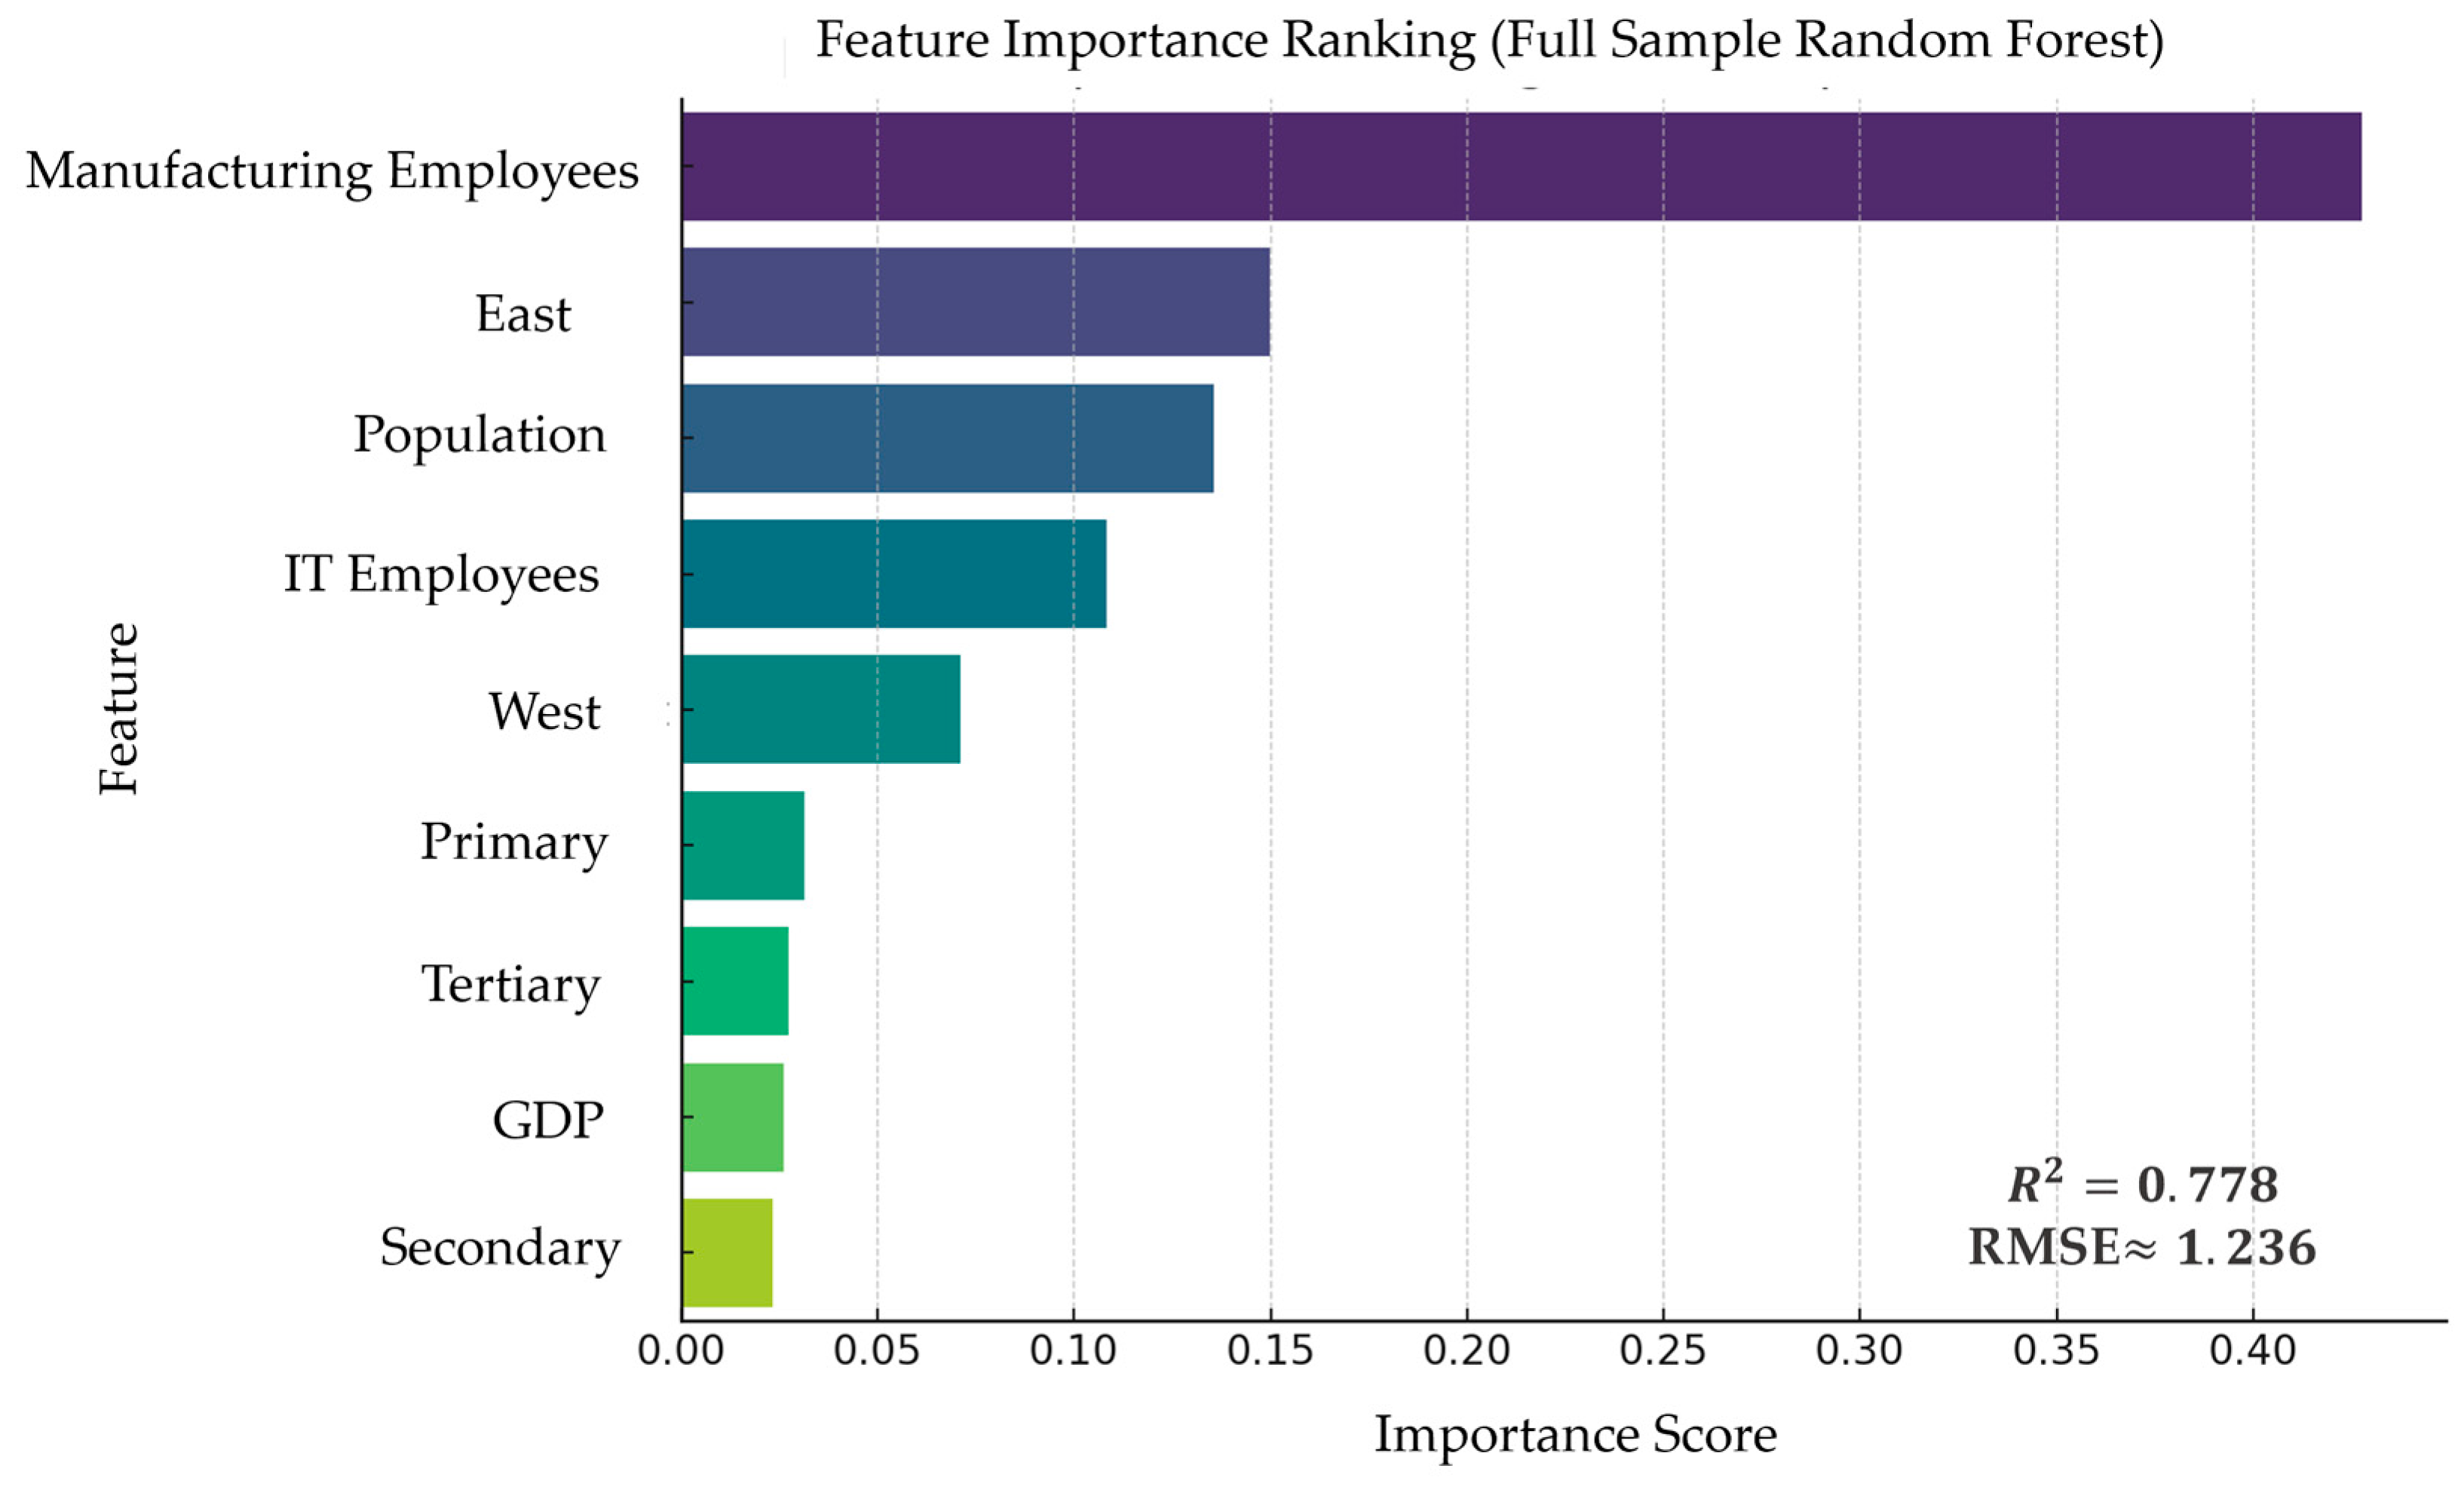
- Variable Importance Ranking from Random Forest
- (3)
- Marginal Effects and Non-linear Mechanism Identification
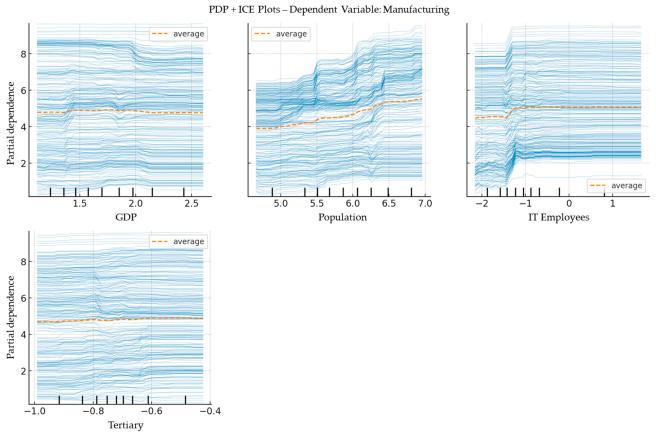
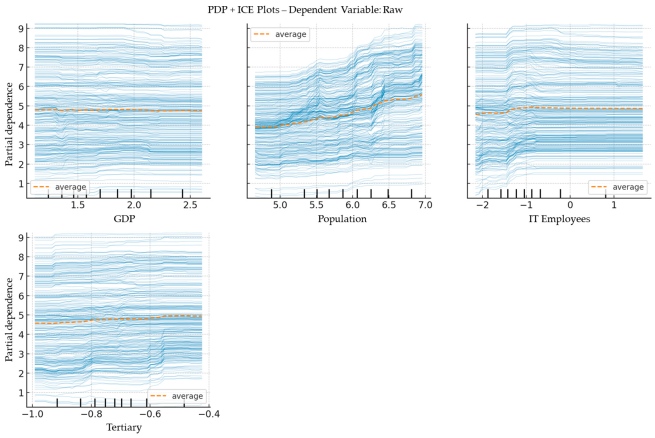
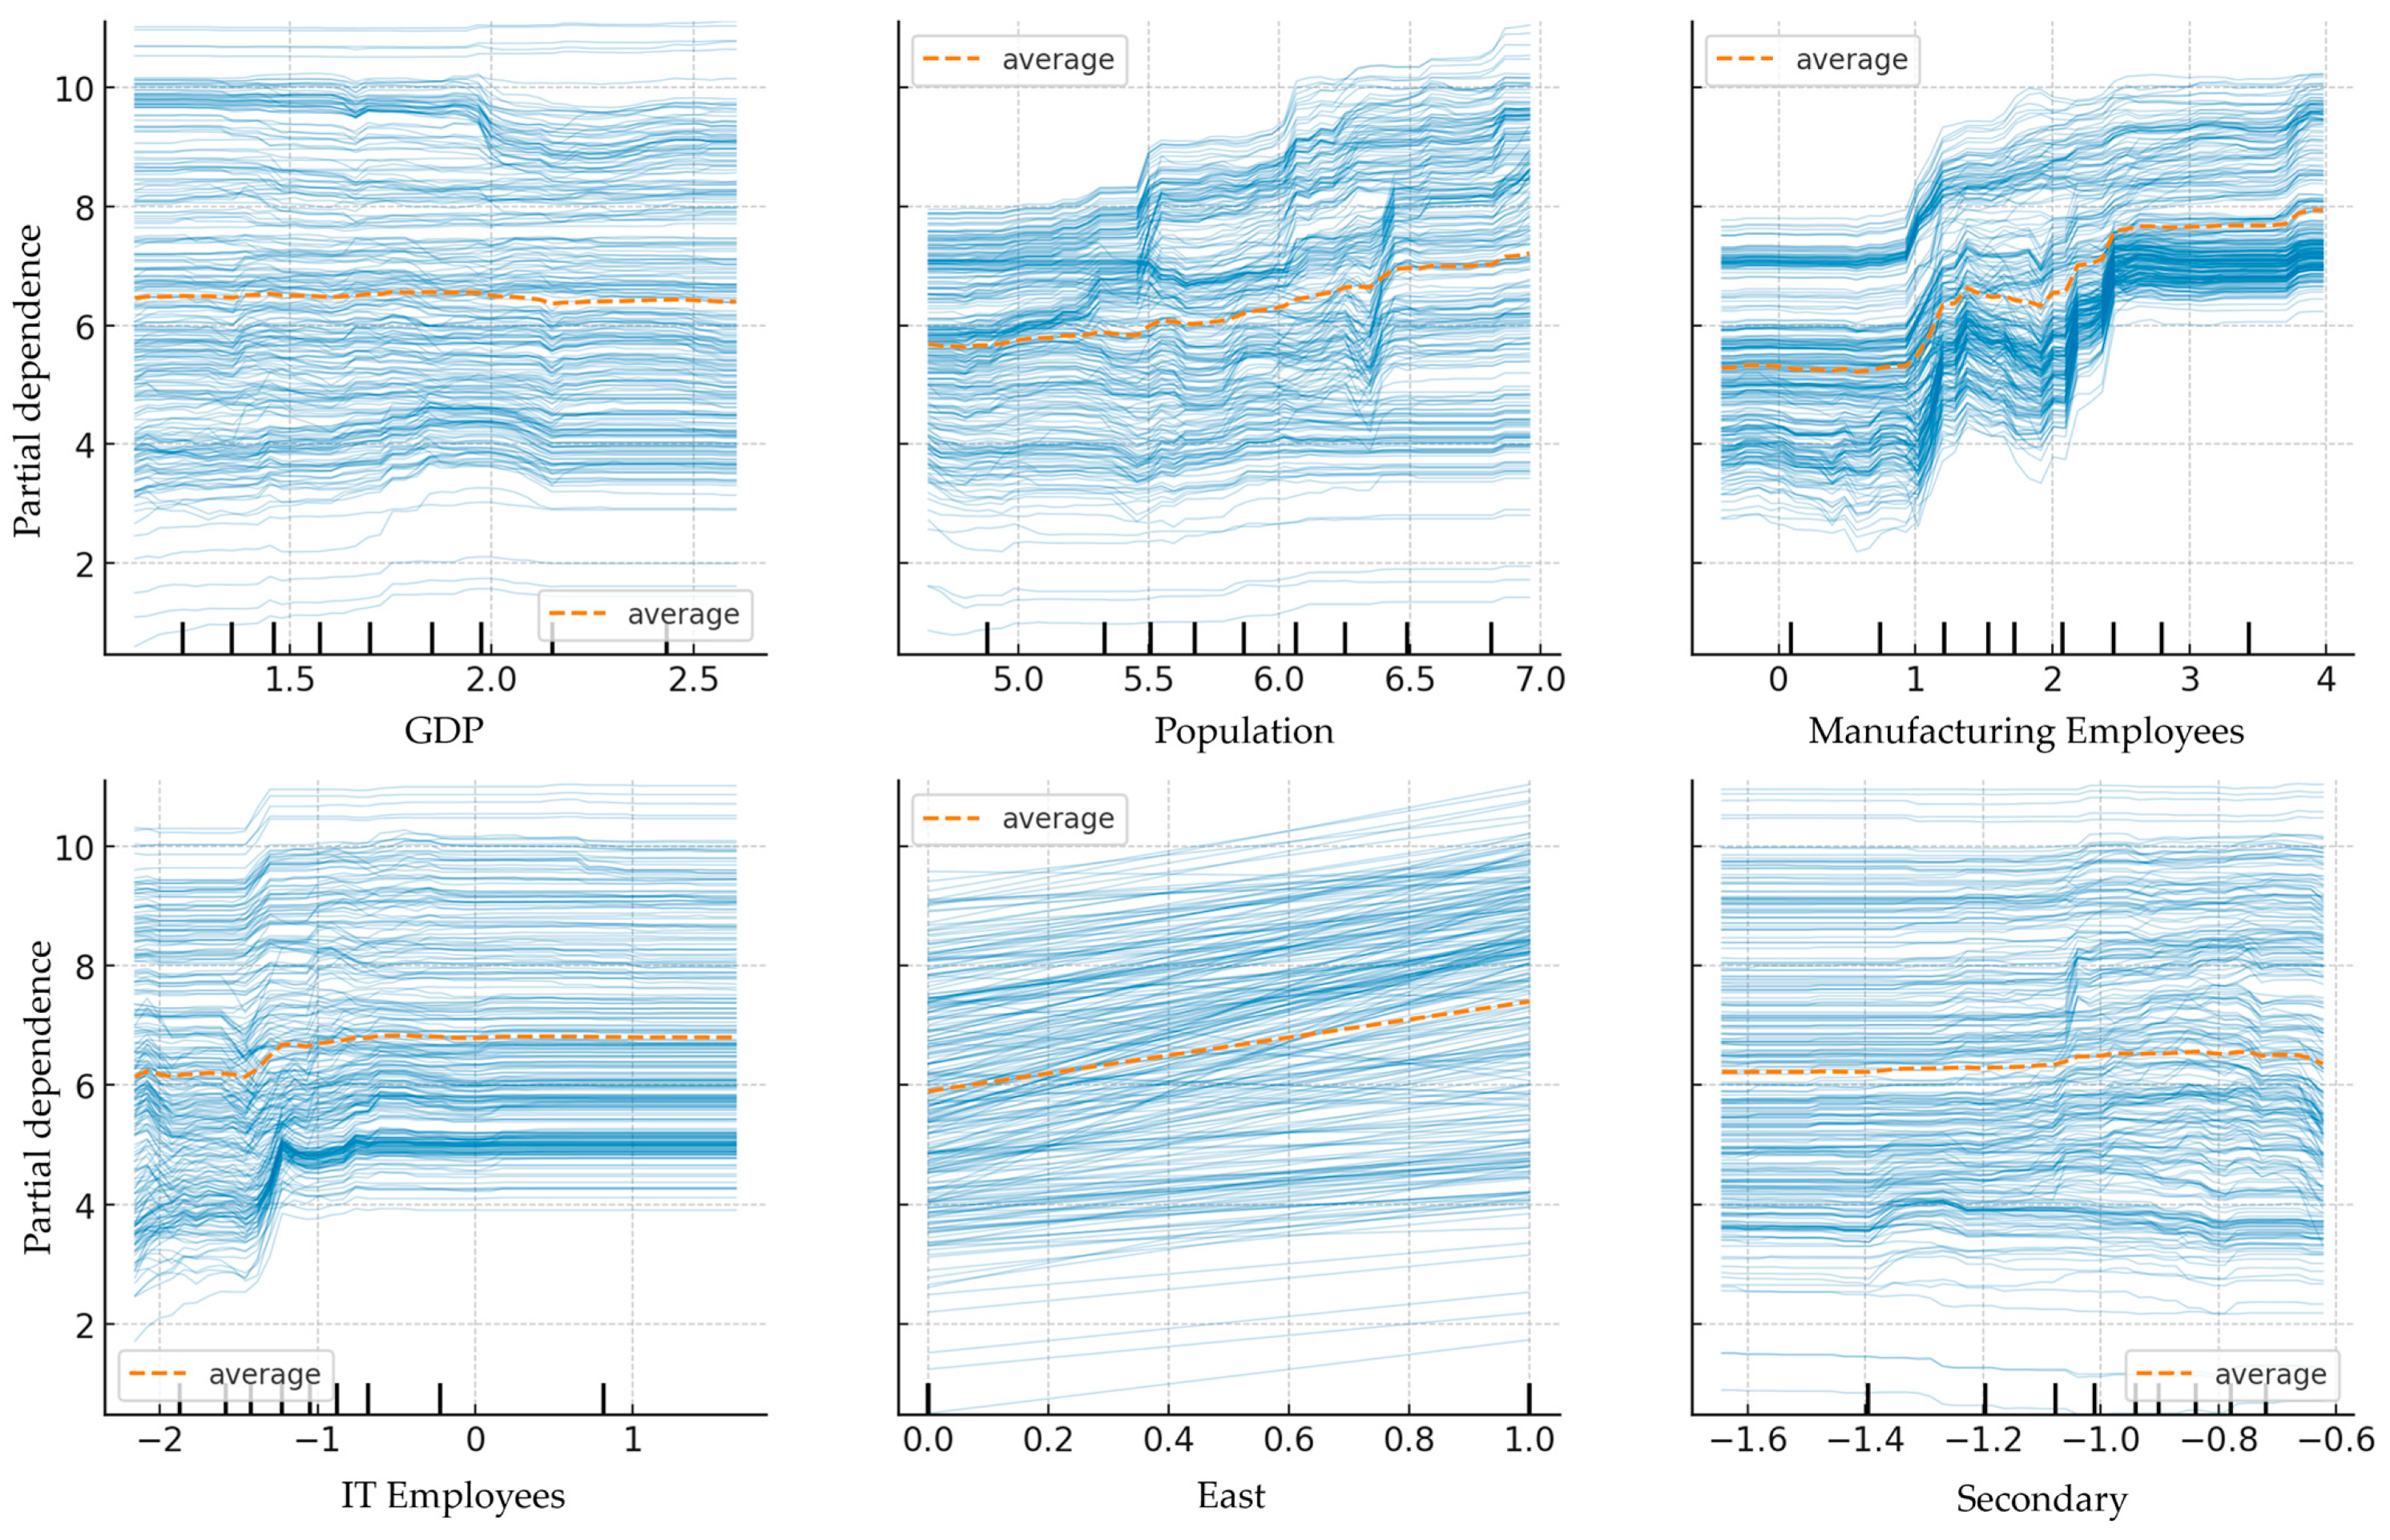
- The development of the B2B e-commerce platform economy is more dependent on structural and industrial foundations rather than linear expansion driven by aggregate indicators. The Partial Dependence Plot (PDP) results indicate that the marginal effect of GDP remains relatively stable overall, without exhibiting a significant acceleration trend. Individual Conditional Expectation (ICE) curves reveal pronounced urban heterogeneity: high-GDP cities, such as top-tier metropolitan areas, show declining responses, while most mid- and low-GDP cities display increasing trajectories.
- Population serves as a fundamental variable for the development of B2B platforms, with a stable positive effect but limited marginal contribution. The PDP curve demonstrates a consistent upward effect of population on the number of B2B firms, particularly when log (Population) exceeds 6.0 (approximately corresponding to a resident population over four million). The ICE curves exhibit strong alignment, suggesting a similar response logic across most cities. Overall, population acts as a foundational support in terms of both consumption and labor supply, providing a “floor effect” in the spatial expansion of B2B platforms, rather than serving as a driver of explosive growth.
- The number of manufacturing employees exhibits a clear “threshold effect” and serves as a dominant support factor for the platform economy. The PDP curve rises sharply between log values of 1.5 to 3.0, indicating that the growth of B2B platforms relies on reaching a critical mass in manufacturing employment, which then activates synergistic effects. This non-linear relationship suggests that the platform economy is not a “detachment from the real economy,” but rather one that effectively embeds itself only upon a substantial industrial foundation. ICE curves generally trend upwards with minimal variation across cities, indicating that manufacturing labor provides a strong, broadly applicable, and stable incentive for platform development.
- IT employment demonstrates a robust positive marginal effect, with the partial dependence plot (PDP) revealing a particularly pronounced slope in the mid-to-high value range. Individual conditional expectation (ICE) curves maintain a steady upward trajectory across observations, underscoring the growing criticality of digital workforce capabilities for platform ecosystem development. These patterns capture an ongoing transition in economic organization—from traditional manufacturing-centric models toward information-driven platform coordination mechanisms.
- Regional analysis through the eastern region dummy variable (east) uncovers substantial structural advantages. The PDP illustrates systematically elevated B2B concentrations in eastern cities, while ICE curve clustering demonstrates consistent group-level benefits. These findings empirically validate three key advantages of eastern regions: (1) superior institutional environments, (2) more developed digital and physical infrastructure, and (3) more mature industrial ecosystems that collectively foster platform economy growth. The results align with existing literature on regional innovation systems while providing new quantitative evidence of their impact on digital platform diffusion [21,22,51].
- The share of the secondary sector has a moderate negative effect on B2B platform development and shows signs of marginal decline. The secondary industry variable demonstrates a weak positive correlation with the number of B2B firms, with a flattening slope in the higher range. ICE curves are more dispersed, reflecting inter-city differences in dependency on the industrial sector. While the secondary industry still functions as an “industrial anchor” for the platform economy, its driving force diminishes with structural upgrading, gradually giving way to digital factors and enhanced industrial–informational integration.
- The GDP variable exhibits a marginal shift at a log value of approximately 1.70, showing a rapid growth trend in the early stages. However, the growth rate of B2B platform firms gradually slows down, and in the extremely high GDP range (log > 2.5), the marginal effect weakens and even turns negative. This indicates that the development of the platform economy is not solely driven by aggregate economic volume but rather relies on the combined support of industrial structure, demographic scale, and other complementary factors.
- Population maintains a smooth linear growth trend. LOWESS and segmented regression results are consistent, indicating that population primarily provides market size and user base support, but with stable marginal returns and no clear non-linear jump.
- Manufacturing employment exhibits a “structural transition” effect. In cities with a weak manufacturing base, the number of B2B firms increases rapidly as employment rises. However, once the log-transformed value reaches approximately 1.72, the growth rate slows, indicating a saturation point. This suggests that while labor-intensive industries facilitate the initial expansion of platform economies, they may impede spatial coordination during the upgrade phase, as the reliance on traditional manufacturing becomes less conducive to sustaining platform-based growth.
- IT employment exhibits a highly non-linear positive effect, characterized by a “technological take-off point” at a log value around −1.05. Before this point, the increase in IT employment leads to a rapid rise in B2B firm numbers, indicating that even a small enhancement in IT capacity significantly boosts platform economy growth in cities with weaker digital foundations. However, once this threshold is crossed, the growth rate becomes more stable and linear, suggesting that in cities where IT employment has already reached a substantial level, further increases do not proportionally enhance B2B development. This confirms the central role of IT talent in the initial stage of platform expansion but also indicates that after achieving a certain digital maturity, B2B growth becomes less dependent on continued IT workforce expansion.
- Secondary sector share exerts a positive effect at lower levels but shows a turning point at −0.94, after which marginal returns become negative. The LOWESS curve also declines, indicating a possible “industrial mismatch” problem. When industrial structure misaligns with platform logic, it may hinder further development.
- (4)
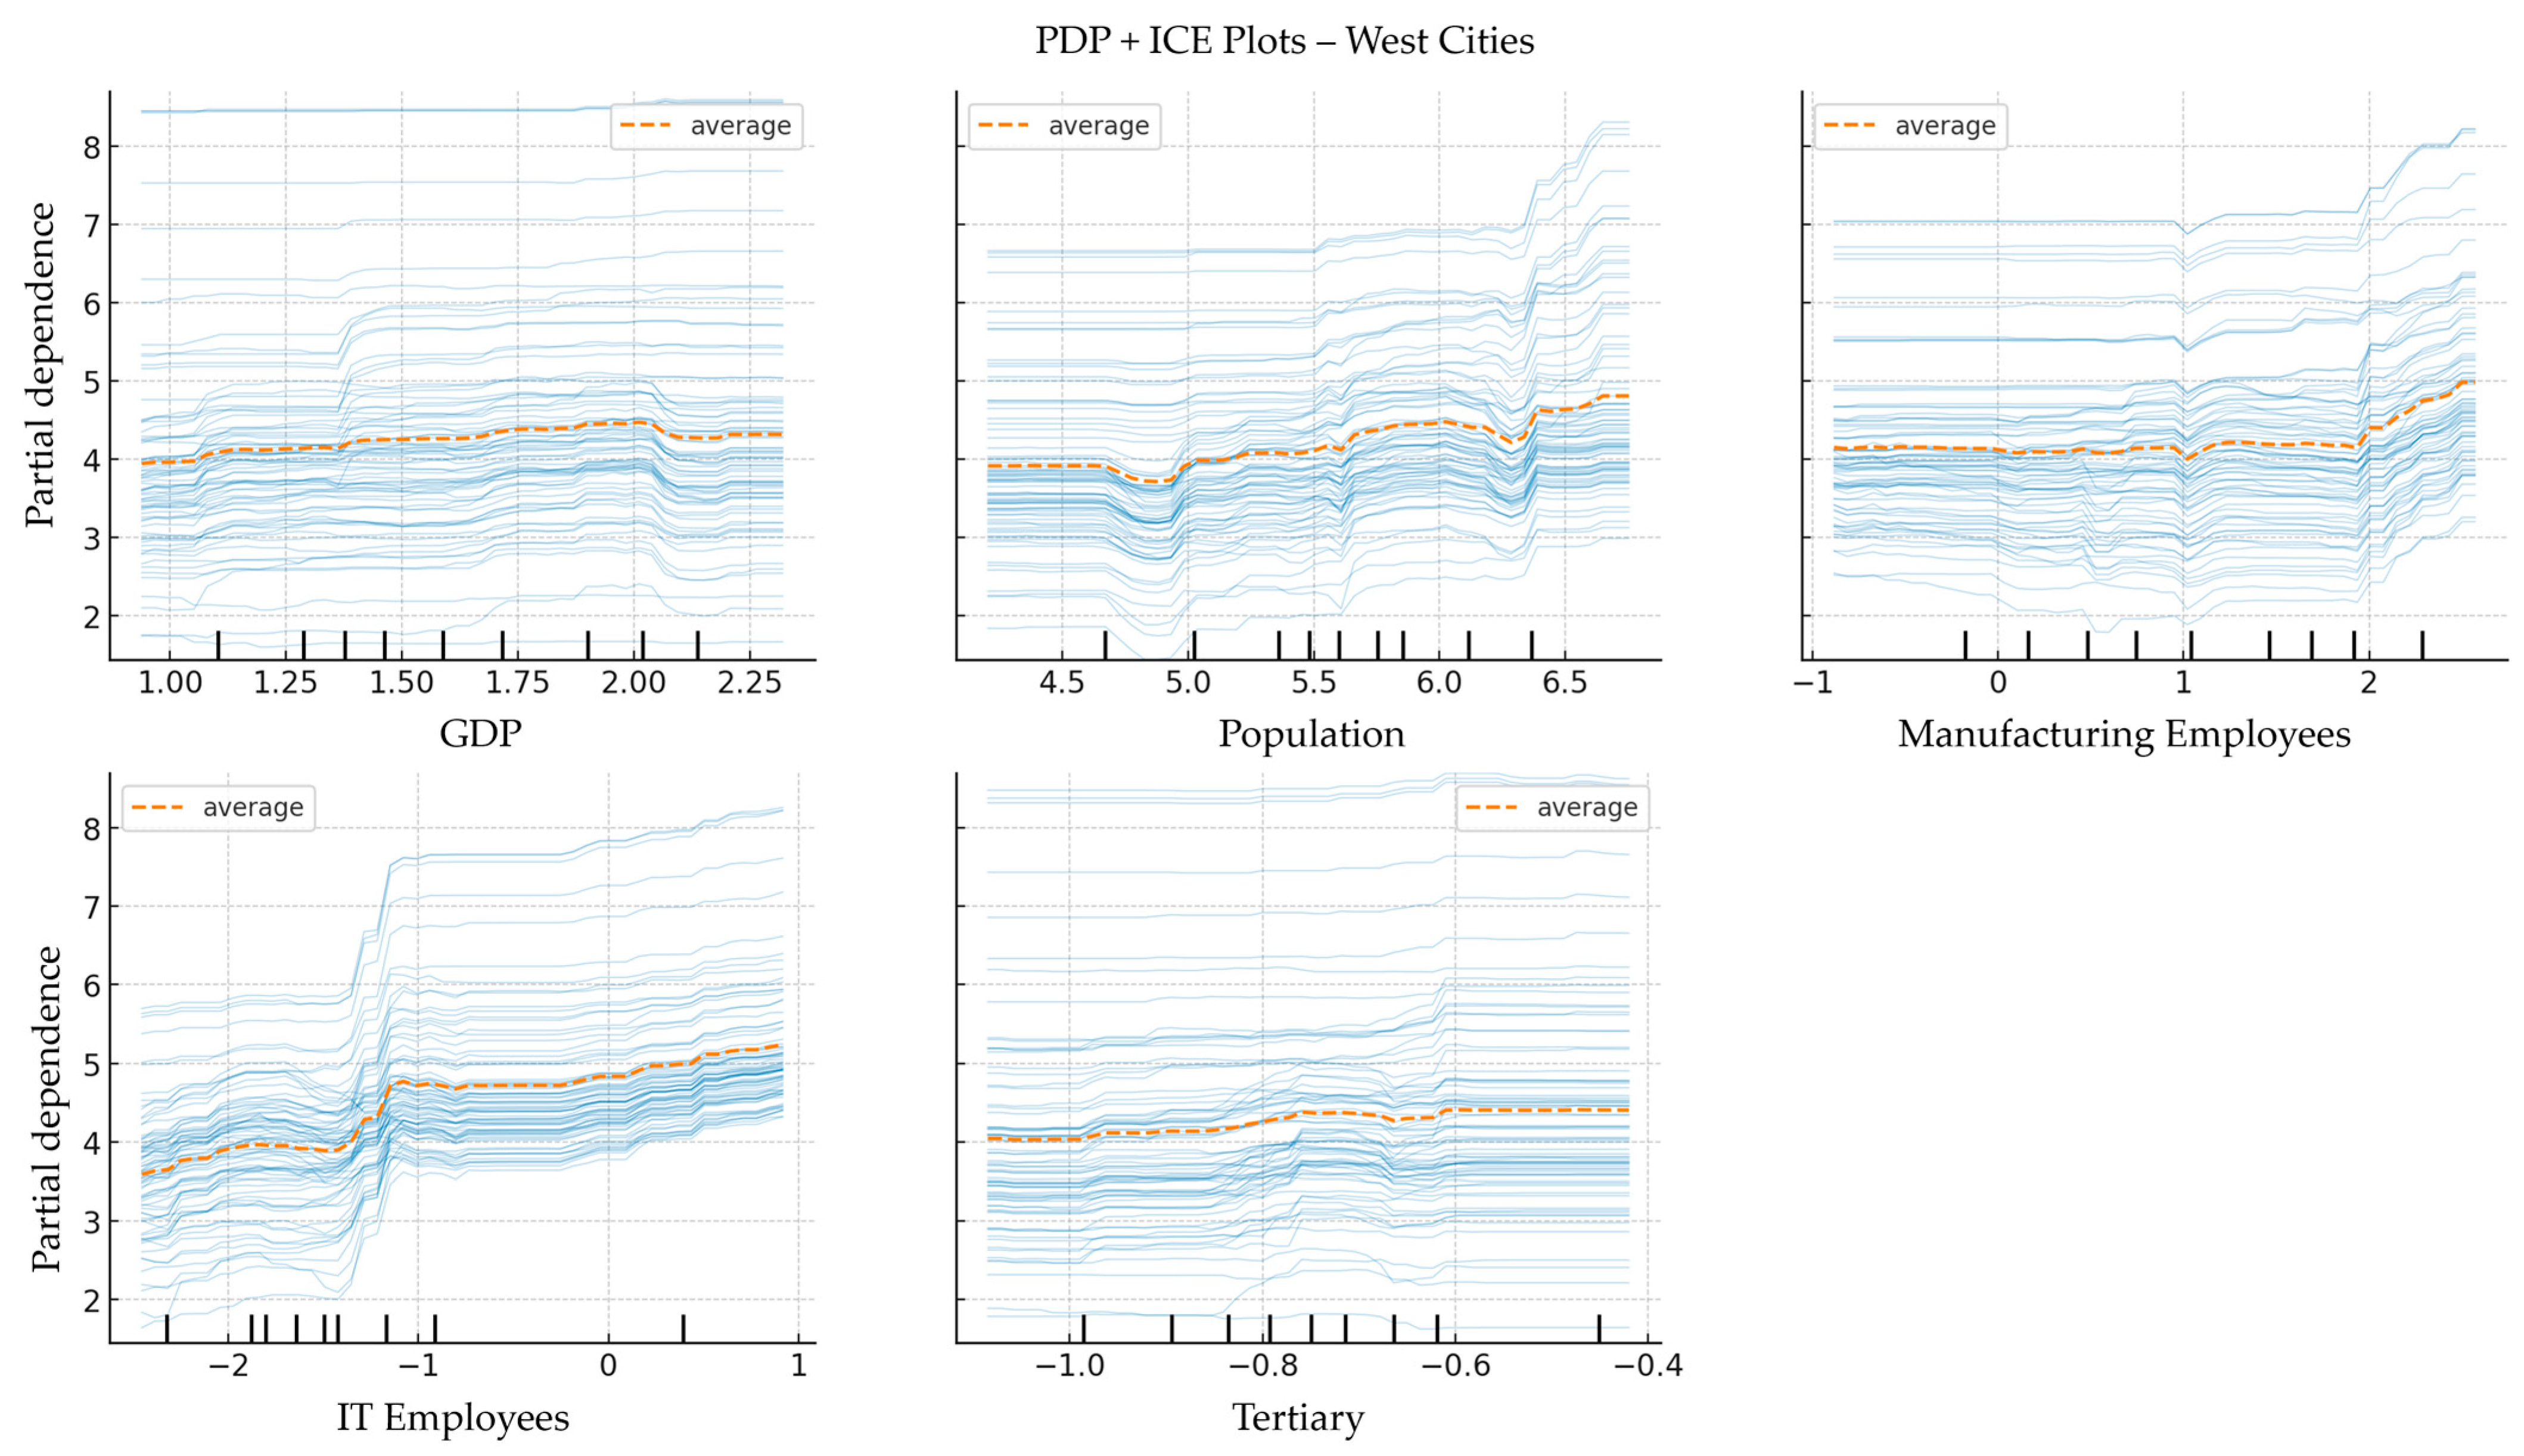
- Heterogeneity Analysis
- The marginal effect of GDP exhibits a declining trend in eastern cities, with the PDP curve showing a slight downward slope and ICE curves reflecting a saturation in platform firm growth in the mid-to-high GDP range. This suggests that in economically advanced eastern cities, platform development may have moved beyond the foundational stage into a phase of structural integration, where GDP alone is no longer a decisive driver of platform expansion. In contrast, GDP still plays a positive role in western cities, where the PDP curve shows a gradual upward trend and ICE curves are more concentrated, indicating that the platform economy is still in a stage of potential being gradually unlocked through economic growth.
- With respect to population, eastern cities display a clear “leap response” structure. The PDP curve rises steeply in the range of log (Population) ≈ 5.5 to 6.0, and ICE curves are sharply and consistently upward, indicating that B2B platform development is dependent on reaching a critical urban population threshold, producing a non-linear amplification effect through population density. In western cities, however, the slope of the population PDP is relatively mild, and ICE curves are more dispersed, suggesting that population has not yet emerged as a defining factor in triggering platform expansion.
- The marginal effect of IT employment is relatively stable in eastern cities but increasing in western regions. In the east, the PDP curve is nearly flat, and ICE curves remain at high levels with limited upward movement, indicating that digital talent has already been embedded in the organizational logic of platforms and provides consistent but stable support. In contrast, the western PDP curve has a visibly positive slope, and ICE curves show broader dispersion and steeper ascents, implying that digital elements are still in a rapid accumulation and transformation phase, now becoming a key emerging driver of platform growth.
- The spatial divergence of manufacturing employment is even more pronounced. In western cities, the PDP curve rises steadily, and ICE curves trend consistently upward, indicating that manufacturing remains the primary foundation for B2B platform development, with the platform economy deeply embedded in traditional industrial structures. In eastern cities, however, the PDP curve is flatter, and ICE curves are closely clustered but lack an upward trend, suggesting that platform growth is increasingly decoupled from industrial dependence. However, when the number of people employed in the manufacturing industry reached a higher level (about four, logarithmic scale), the number of B2B e-commerce companies still increased significantly.
- For manufacturing-oriented B2B platform firms, GDP exhibits a relatively flat response, and ICE curves show no major fluctuation, indicating that aggregate economic size plays a limited role in this type of platform development. In contrast, population shows significantly stronger marginal effects, with the PDP curve rising sharply above log(Population) = 5.5, and ICE curves trending consistently upward. This suggests that manufacturing platforms remain embedded within traditional industrial foundations and spatial market logic, primarily driven by transitions in population scale.
- The growth logic of service-oriented B2B platforms exhibits stronger structural responsiveness. PDP and ICE curves indicate heightened marginal sensitivity to population, with “jump-like” increases in platform numbers in high-population cities, forming a clear population threshold effect. The share of the tertiary sector also begins to rise beyond log values of −0.8, showing that industrial upgrading is emerging as a supportive force for service platform expansion. Meanwhile, GDP and IT employment show weaker marginal effects, suggesting that service-oriented platforms are still transitioning from a “population–consumption” model toward a “structure–digital” model.
- Consumer-oriented B2B platforms demonstrate a multi-driver growth mechanism. PDP and ICE curves show consistent positive relationships with GDP, population size, IT workforce levels, and tertiary sector development, though the strength of these relationships varies considerably between cities. These patterns suggest consumer platforms now develop through integrated structural drivers rather than isolated factors. These platforms embody a “population–industry–digital” fusion model, aligning most closely with the ideal trajectory for high-quality platform economy development.
- The growth mechanism of raw material-oriented platforms displays stronger path dependency. Their responses to GDP, IT employment, and the tertiary sector are all relatively flat, with the PDP curve remaining nearly level and ICE curves showing low-level clustering. This reflects that digital transformation in this segment remains in its early stage.
5. Discussion
6. Conclusions
Author Contributions
Funding
Data Availability Statement
Conflicts of Interest
Abbreviations
| B2B | Business-to-Business |
| OLS | Ordinary Least Squares |
| PDP | Partial Dependence Plots |
| ICE | Individual Conditional Expectation |
| LOWESS | Locally Weighted Scatterplot Smoothing |
| GDP | Gross Domestic Product |
| IT | Information Technology |
Appendix A

References
- Srnicek, N. Platform Capitalism; John Wiley & Sons: Hoboken, NJ, USA, 2017. [Google Scholar]
- Ash, J.; Kitchin, R.; Leszczynski, A. Digital turn, digital geographies? Prog. Hum. Geogr. 2018, 42, 25–43. [Google Scholar] [CrossRef]
- Barns, S. Platform Urbanism: Negotiating Platform Ecosystems in Connected Cities; Springer Nature: Berlin/Heidelberg, Germany, 2019. [Google Scholar]
- Stehlin, J.; Hodson, M.; McMeekin, A. Platform mobilities and the production of urban space: Toward a typology of platformization trajectories. Environ. Plan. A Econ. Space 2020, 52, 1250–1268. [Google Scholar] [CrossRef]
- Wang, L.; Zhou, H.; Xu, C. Industrial intelligence, geographical spatial industrial agglomeration, and digital spatial virtual agglomeration. J. Northeast. Norm. Univ. 2024, 1–12. [Google Scholar] [CrossRef]
- Yang, Z.; Luo, Z.; Geng, L. Traditional or innovative space? A study on the spatial characteristics of industries in the Yangtze River Delta based on B2B e-commerce. Shanghai Urban Plan. 2018, 97–104. [Google Scholar]
- Zhou, W.; Wang, M. The structure of China’s urban system based on the "Internet+" economy. Urban Dev. Stud. 2018, 25, 9–15. [Google Scholar]
- Nie, L. Characteristics and trends of China’s e-commerce development. China Bus. Econ. 2014, 28, 97–101. [Google Scholar] [CrossRef]
- Christaller, W. Die zentralen Orte in Süddeutschland: Eine ökonomisch-geographische Untersuchung über die Gesetzmässigkeit der Verbreitung und Entwicklung der Siedlungen mit städtischen Funktionen; Wissenschaftliche Buchgesellschaft: Darmstadt, Germany, 1980. [Google Scholar]
- Friedmann, J. Where we stand: A decade of world city research. In World Cities in a World-System; Cambridge University Press: Cambridge, UK, 1995; pp. 21–47. [Google Scholar]
- Gu, C.; Pang, H. Spatial linkages and hierarchy division of China’s urban system based on the gravity model. Geogr. Res. 2008, 27, 1–12. [Google Scholar]
- Guo, W.; Bai, M. Hierarchical classification of China’s urban air transportation functions and empirical study of aviation link characteristics. Hum. Geogr. 1999, 14, 27–31. [Google Scholar]
- Yan, L.; Wang, D.; Zhang, S. Theoretical foundation and analytical framework of urban center system research. Prog. Geogr. 2020, 39, 11. [Google Scholar]
- Zhang, Y.; Zhao, M.; Cheng, Y. Urban system development research and planning insights for the new era: Perspectives based on “network correlation” and “regional proximity”. Urban Plan. 2021, 45, 9–20. [Google Scholar]
- Zhou, Y.; Hu, Z. Spatial network structure of China’s urban system from the perspective of air transportation. Geogr. Res. 2002, 21, 276–286. [Google Scholar]
- Camagni, R.P. From city hierarchy to city network: Reflections about an emerging paradigm. In Structure and Change in the Space Economy: Festschrift in Honor of Martin J. Beckmann; Springer: Berlin/Heidelberg, Germany, 1993; pp. 66–87. [Google Scholar]
- Green, F. Urban hinterlands in England and Wales: An analysis of bus services. Geogr. J. 1950, 116, 64–81. [Google Scholar] [CrossRef]
- Rimmer, P.J. Flow of goods, people and information among cities of Northeast Asia. J. Korean Reg. Sci. Assoc. 1999, 15, 39–73. [Google Scholar]
- Taaffe, E.J. Air transportation and United States urban distribution. Geogr. Rev. 1956, 46, 219–238. [Google Scholar] [CrossRef]
- Ding, Z.; Ma, F.; Zhang, G. Spatial differentiation and influencing factors of China’s urban network attention based on Douyin fan volume. Geogr. Res. 2022, 41, 2548–2567. [Google Scholar]
- Fang, P.; Luo, Z.; Mao, M. Spatial effects of urban network marketing in the mobile internet era: An empirical study based on Douyin data. Urban Dev. Res. 2023, 30, 106–114. [Google Scholar]
- Wang, B.; Zhen, F. Urban hierarchy and its mechanisms under the internet: Evidence from China. Econ. Geogr. 2016, 36. [Google Scholar]
- Zhen, F.; Wang, B.; Chen, Y. Spatial network characteristics of China’s urban network from a social media perspective: A case study of Sina Weibo. Acta Geogr. Sin. 2012, 67, 1031–1043. [Google Scholar]
- Gu, C.; Hu, X. Current characteristics of China’s urban system. Econ. Geogr. 1998, 18, 21–26. [Google Scholar]
- Lu, M.; Xiang, K.; Chen, Z. Urbanization and urban system adjustment in China: A literature review. World Econ. 2011, 3–25. [Google Scholar]
- Tan, M.; Lü, C. Urban size distribution in China based on built-up area. Acta Geogr. Sin. 2003, 58, 285–293. [Google Scholar]
- Yu, T.; Gu, C.; Li, Z. Evolution of China’s urban system since 1995. Geogr. Res. 2008, 27. [Google Scholar]
- Bailang, Y.; Congxiao, W.; Wenkang, G.; Zuoqi, C.; Kaifang, S.; Bin, W.; Yuchen, H.; Qiaoxuan, L.; Jianping, W. Nighttime light remote sensing and urban studies: Data, methods, applications, and prospects. Natl. Remote Sens. Bull. 2021, 25, 342–364. [Google Scholar]
- Zipf, G.K. Human Behavior and the Principle of Least Effort: An Introduction to Human Ecology; Martino Fine Books: Eastford, CT, USA, 2016. [Google Scholar]
- Leng, B.R.; Yang, Y.C.; Tan, Y.Y. Research on Urban Network: From Hierarchy to Network. Int. Urban Plan. 2014, 1–7. [Google Scholar]
- Li, C. Hierarchical Analysis of the World Urban System from the Perspective of Global Value Chains. Urban Rural. Plan. 2021, 48–57. [Google Scholar]
- Wang, M.F. Emerging Network Cities: The Impact of the Internet on the Global Urban System. Urban Plan. 2004, 28, 26–32. [Google Scholar]
- Yan, L.X. Theoretical Analysis of Structural Impacts of Flow Space. J. Urban Plan. 2021, 8. [Google Scholar]
- Batten, D.F. Network cities: Creative urban agglomerations for the 21st century. Urban Stud. 1995, 32, 313–327. [Google Scholar] [CrossRef]
- Castells, M. The Rise of the Network Society; John Wiley & Sons: Hoboken, NJ, USA, 2011. [Google Scholar]
- Hang, R.; Zhenke, Z.; Das, P.; Yaoyu, Z. Evolution Characteristics of Urban System and Spatial Connections of Cities in Kenya Based on Population Scale. Econ. Geogr. 2022, 42, 56–65. [Google Scholar]
- Moss, M.L.; Townsend, A.M. The Internet backbone and the American metropolis. Inf. Soc. 2000, 16, 35–47. [Google Scholar]
- Sassen, S. The Global City: New York, London, Tokyo; Princeton University Press: Princeton, NJ, USA, 2013. [Google Scholar]
- Taylor, P.; Derudder, B. World City Network: A Global Urban Analysis; Routledge: London, UK, 2015. [Google Scholar]
- Townsend, A.M. Network cities and the global structure of the Internet. Am. Behav. Sci. 2001, 44, 1697–1716. [Google Scholar] [CrossRef]
- Wang, Y.; Sun, B.; Wu, S.; Li, W.; Zhang, T. Can the internet reshape the national city size distribution? Cross-country evidence. Pap. Reg. Sci. 2021, 100, 1254–1273. [Google Scholar] [CrossRef]
- Zook, M.A. Old hierarchies or new networks of centrality? The global geography of the Internet content market. Am. Behav. Sci. 2001, 44, 1679–1696. [Google Scholar] [CrossRef]
- Wang, Y.; Wei, Y.D.; Sun, B. New economy and national city size distribution. Habitat Int. 2022, 127, 102632. [Google Scholar] [CrossRef]
- Rybski, D.; Arcaute, E.; Batty, M. Urban Scaling Laws. Environ. Plan. B Urban Anal. City Sci. 2019, 46, 1605–1610. [Google Scholar] [CrossRef]
- Pumain, D. Scaling laws and urban systems1. In Urban Scaling; Routledge: London, UK, 2024; pp. 28–35. [Google Scholar]
- Bettencourt, L.M.; Lobo, J. Urban scaling in Europe. J. R. Soc. Interface 2016, 13, 20160005. [Google Scholar] [CrossRef]
- Cao, Q.; Shen, L.Z.; Zhen, F. Spatial Evolution of Chinese Internet Enterprises and Urban Network Characteristics. Hum. Geogr. 2018, 33, 97–105. [Google Scholar]
- Sun, Z.W.; He, J.L.; Jin, F.J. Accessibility and Hierarchical System of the World Internet Urban Network. Econ. Geogr. 2010, 30, 1449–1455. [Google Scholar]
- Wang, M.F.; Ning, Y.M. The Rise of Internet and Information Network Cities in China. Acta Geogr. Sin. 2004, 446–454. [Google Scholar]
- Zhen, F.; Wang, B.; Chen, Y.X. Characteristics of China’s Urban Network Based on the Social Network Space. Acta Geogr. Sin. 2012, 67. [Google Scholar]
- Du, X.J.; Zhen, F.; Chang, E.Y. Spatial Pattern and Formation Mechanism of China’s Urban System Based on E-commerce Potential. Econ. Geogr. 2016, 36. [Google Scholar]
- Fang, C.L. New Patterns and Trends of Urban Agglomeration Formation and Development in China. Geogr. Sci. 2011, 9. [Google Scholar]
- Huang, J.C.; Liu, Q.Q.; Chen, M. Identification of the Development Pattern of Chinese Urban Agglomerations Based on GIS. J. Urban Plan. 2014, 37–44. [Google Scholar]
- Fang, C.L.; Song, J.T.; Zhang, Q.; Li, M. Composition and Spatial Differentiation of China’s Urban Agglomeration System. Acta Geogr. Sin. 2005, 5. [Google Scholar]
- Wooldridge, J.M. Introductory Econometrics: A Modern Approach, 6th ed.; Cengage Learning: Boston, MA, USA, 2016. [Google Scholar]
- Kenney, M.; Zysman, J. The platform economy: Restructuring the space of capitalist accumulation. Camb. J. Reg. Econ. Soc. 2020, 13, 55–76. [Google Scholar] [CrossRef]
- Vallas, S.; Schor, J.B. What do platforms do? Understanding the gig economy. Annu. Rev. Sociol. 2020, 46, 273–294. [Google Scholar] [CrossRef]
- Anttiroiko, A.-V. City-as-a-platform: The rise of participatory innovation platforms in Finnish cities. Sustainability 2016, 8, 922. [Google Scholar] [CrossRef]
- Ding, J.H.; Wu, J.M.; Li, B.J. Spatiotemporal Patterns and Change Characteristics of Tmall Platform Store Entries. Econ. Geogr. 2017, 37, 136–144. [Google Scholar] [CrossRef]
- Sun, X.D.; Pan, Y.; Li, J.P. Restructuring of China’s Urban Development Pattern from the Perspective of Virtual Agglomeration: Logical Mechanisms and Implementation Pathways. Reg. Econ. Rev. 2024, 139–146. [Google Scholar] [CrossRef]
- Rao, Y.L.; Luo, Z.D. Digital Transformation and Deep Diffusion: An Evolutionary Study of Industrial Space in the Yangtze River Delta Based on B2B E-commerce Enterprises. J. Urban Plan. 2021, 8. [Google Scholar]
- Zhen, F.; Cao, Y.; Qin, X.; Wang, B. Delineation of an urban agglomeration boundary based on Sina Weibo microblog ‘check-in’data: A case study of the Yangtze River Delta. Cities 2017, 60, 180–191. [Google Scholar] [CrossRef]
- Xiang, B.; Chen, R.; Xu, G. Uncovering Network Heterogeneity of China’s Three Major Urban Agglomerations from Hybrid Space Perspective-Based on TikTok Check-In Records. Land 2022, 12, 134. [Google Scholar] [CrossRef]
- Fujita, M.; Krugman, P.; Mori, T. On the evolution of hierarchical urban systems. Eur. Econ. Rev. 1999, 43, 209–251. [Google Scholar] [CrossRef]
- Huang, D.; Tan, X.; Liu, T.; Chu, E.; Kong, F. Effects of hierarchical city centers on the intensity and direction of urban land expansion: A case study of Beijing. Land 2020, 9, 312. [Google Scholar] [CrossRef]
- Allcott, H.; Gentzkow, M.; Song, L. Digital addiction. Am. Econ. Rev. 2022, 112, 2424–2463. [Google Scholar] [CrossRef]
- Jensen, R. The digital provide: Information (technology), market performance, and welfare in the South Indian fisheries sector. Q. J. Econ. 2007, 122, 879–924. [Google Scholar] [CrossRef]
- Mitchelson, R.L.; Wheeler, J.O. The flow of information in a global economy: The role of the American urban system in 1990. Ann. Assoc. Am. Geogr. 1994, 84, 87–107. [Google Scholar] [CrossRef]
- Gorman, S.P. Where are the Web factories: The urban bias of e–business location. Tijdschr. Voor Econ. En Soc. Geogr. 2002, 93, 522–536. [Google Scholar] [CrossRef]
- Liu, T.; Hu, M.; Elahi, E.; Liu, X. Does digital finance affect the quality of economic growth? Analysis based on Chinese city data. Front. Environ. Sci. 2022, 10, 951420. [Google Scholar] [CrossRef]
- Huang, J.; Jin, H.; Ding, X.; Zhang, A. A study on the spatial correlation effects of digital economy development in China from a non-linear perspective. Systems 2023, 11, 63. [Google Scholar] [CrossRef]
- Liu, J.; Puah, C.-H.; Arip, M.A.; Jong, M.-C. Impacts of digital financial inclusion on urban–rural income disparity: A comparative research of the eastern and western regions in China. Economies 2023, 11, 282. [Google Scholar] [CrossRef]
- Park, S.O. The impact of business-to-business electronic commerce on the dynamics of metropolitan spaces. Urban Geogr. 2004, 25, 289–314. [Google Scholar] [CrossRef]
- Hwang, J.-S. Digital divide in internet use within the urban hierarchy: The case of South Korea. Urban Geogr. 2004, 25, 372–389. [Google Scholar] [CrossRef]
- Liu, W.; Dicken, P.; Yeung, H.W. New information and communication technologies and local clustering of firms: A case study of the Xingwang Industrial Park in Beijing. Urban Geogr. 2004, 25, 390–407. [Google Scholar] [CrossRef]
- Sohn, J.; Hewings, G.J.; Kim, T.J. Intra-metropolitan agglomeration, information technology and polycentric urban development. Contrib. Econ. Anal. 2004, 266, 213–247. [Google Scholar]
- Ioannides, Y.M.; Overman, H.G.; Rossi-Hansberg, E.; Schmidheiny, K. The effect of information and communication technologies on urban structure. Econ. Policy 2008, 23, 202–242. [Google Scholar] [CrossRef]


| First-Level Sector | Second-Level Sectors |
|---|---|
| Raw Materials | Textiles and leather, packaging, agriculture, home and building materials, pharmaceuticals, metallurgy, rubber and plastics, fine chemicals, steel, chemical raw materials |
| Consumer Goods | Women’s wear, men’s wear, underwear, children’s clothing, bags, shoes, maternity and baby, home goods, food and beverages, digital and computers, toys, accessories, general merchandise, beauty, gifts and crafts, car accessories, sports and outdoors, pets and gardening, office supplies, paper and printing, home textiles, home appliances, cleaning and care products |
| Manufacturing Goods | Machinery, electrical equipment, industrial devices, security, electronics, hardware, instruments, lighting |
| Commercial Services | Advertising, education and training, logistics, design, import/export services |
| City Cluster | The Number of Cities | The Number of B2B Companies |
|---|---|---|
| Pearl River Delta | 9 | 348,780 |
| Yangtze River Delta | 26 | 278,821 |
| Beijing-Tianjin-Hebei | 13 | 131,060 |
| Central Plains | 29 | 83,439 |
| Shandong Peninsula | 8 | 51,844 |
| Chengdu-Chongqing | 16 | 14,094 |
| Sum | 101 | 908,038 |
| Equation | |||||||
|---|---|---|---|---|---|---|---|
| Population | GDP | B2B Sum | Business Services | Manufacturing | Raw Materials | Consumer | |
| Weight | Unweighted | ||||||
| Intercept () | 9.4977 ± 0.7914 | 10.215 ± 0.1279 | 17.688 ± 0.3452 | 9.3621 ± 0.1568 | 17.8900 ± 0.6523 | 15.3390 ± 0.1356 | 17.24 ± 0.2450 |
| Slope () | −0.7914 ± 0.0275 | −1.0543 ± 0.0259 | −2.4545 ± 0.0356 | −1.6805 ± 0.0195 | −2.5592 ± 0.02688 | −2.2992 ± 0.0275 | −2.7208 ± 0.01488 |
| Residual sum of squares | 55.492 | 71.15324 | 62.855 | 23.954 | 71.690 | 55.244 | 68.103 |
| Pearson’s r | 0.908 ** | −0.908 ** | −0.895 ** | −0.961 ** | −0.879 ** | −0.908 ** | −0.885 ** |
| (COD) | 0.7112 | 0.82772 | 0.8004 | 0.9240 | 0.7724 | 0.8246 | 0.7838 |
| Constant | Pop | GDP | Manf | Comp | Raw | Serv | IT-e | Manf-e | |
|---|---|---|---|---|---|---|---|---|---|
| 1.023 *** | −0.014 | 0.016 | 0.155 *** | 0.589 *** | 0.260 *** | 0.008 | −0.02 | 0.035 | |
| T | 11.695 | 0.779 | 0.695 | 7.92 | 29.001 | 23.69 | 1.079 | −1.68 | 0.158 |
| 0.897 | |||||||||
| B2B | Manufacturing | Service | Raw | Consumer | |
|---|---|---|---|---|---|
| ln Population | (1.419) | (1.497) | (0.704) | (1.458) | (1.343) |
| 0.000 *** | 0.000 *** | 0.001 *** | 0.000 *** | 0.000 *** | |
| ln GDP | (0.465) | (0.445) | (−0.397) | (0.511) | (0.382) |
| 0.066 * | 0.116 | 0.160 | 0.034 ** | 0.153 | |
| ln primary | (−0.080) | (−0.020) | (−0.418) | (−0.128) | (−0.114) |
| 0.512 | 0.883 | 0.003 ** | 0.274 | 0.378 | |
| ln secondary | (0.686) | (0.830) | (−0.097) | (0.550) | (0.663) |
| 0.013 ** | 0.007 ** | 0.751 | 0.036 ** | 0.023 ** | |
| ln tertiary | (1.189) | (1.202) | (0.531) | (1.601) | (0.982) |
| 0.003 ** | 0.007 ** | 0.233 | 0.000 *** | 0.020 ** | |
| ln manufacturing | (0.400) | (0.445) | (0.283) | (0.347) | (0.406) |
| 0.001 *** | 0.001 *** | 0.034 * | 0.002 ** | 0.001 *** | |
| ln IT employees | (−0.289) | (−0.257) | (0.019) | (−0.300) | (−0.275) |
| 0.029 ** | 0.082 * | 0.899 | 0.017 ** | 0.048 ** | |
| ln east | (1.168) | (1.348) | (0.922) | (1.111) | (1.183) |
| 0.000 *** | 0.000 *** | 0.000 *** | 0.000 *** | 0.000 *** | |
| ln west | (−1.536) | (−1.782) | (−0.196) | (−1.139) | (−1.589) |
| 0.000 *** | 0.000 *** | 0.272 | 0.000 *** | 0.000 *** | |
| const | (−2.237) | (−4.046) | (−3.443) | (−4.215) | (−2.452) |
| 0.092 * | 0.007 * | 0.021 ** | 0.001 *** | 0.080 * | |
| N | 289 | 289 | 289 | 289 | 289 |
| R2 | 0.811 | 0.808 | 0.562 | 0.807 | 0.791 |
| Adj. R2 | 0.805 | 0.802 | 0.547 | 0.801 | 0.784 |
| F | 0.000 | 0.000 | 0.000 | 0.000 | 0.000 |
Disclaimer/Publisher’s Note: The statements, opinions and data contained in all publications are solely those of the individual author(s) and contributor(s) and not of MDPI and/or the editor(s). MDPI and/or the editor(s) disclaim responsibility for any injury to people or property resulting from any ideas, methods, instructions or products referred to in the content. |
© 2025 by the authors. Licensee MDPI, Basel, Switzerland. This article is an open access article distributed under the terms and conditions of the Creative Commons Attribution (CC BY) license (https://creativecommons.org/licenses/by/4.0/).
Share and Cite
Fang, P.; Cao, X.; Huang, Y.; Chen, Y. How Does the Platform Economy Affect Urban System: Evidence from Business-to-Business (B2B) E-Commerce Enterprises in China. Buildings 2025, 15, 1687. https://doi.org/10.3390/buildings15101687
Fang P, Cao X, Huang Y, Chen Y. How Does the Platform Economy Affect Urban System: Evidence from Business-to-Business (B2B) E-Commerce Enterprises in China. Buildings. 2025; 15(10):1687. https://doi.org/10.3390/buildings15101687
Chicago/Turabian StyleFang, Pengfei, Xiaojin Cao, Yuhao Huang, and Yile Chen. 2025. "How Does the Platform Economy Affect Urban System: Evidence from Business-to-Business (B2B) E-Commerce Enterprises in China" Buildings 15, no. 10: 1687. https://doi.org/10.3390/buildings15101687
APA StyleFang, P., Cao, X., Huang, Y., & Chen, Y. (2025). How Does the Platform Economy Affect Urban System: Evidence from Business-to-Business (B2B) E-Commerce Enterprises in China. Buildings, 15(10), 1687. https://doi.org/10.3390/buildings15101687