Article

Comprehensive and Dedicated Metrics for Evaluating AI-Generated Residential Floor Plans

1
Shenzhen International Graduate School, Tsinghua University, Shenzhen 518071, China
2
School of Computer Science, Faculty of Engineering, The University of Sydney, Sydney, NSW 2006, Australia
*
Author to whom correspondence should be addressed.
These authors contributed equally to this paper.
Buildings 2025, 15(10), 1674; https://doi.org/10.3390/buildings15101674
Submission received: 31 March 2025 / Revised: 4 May 2025 / Accepted: 13 May 2025 / Published: 15 May 2025

Abstract

In response to the growing importance of AI-driven residential design and the lack of dedicated evaluation metrics, we propose the Residential Floor Plan Assessment (RFP-A), a comprehensive framework tailored to architectural evaluation. RFP-A consists of multiple metrics that assess key aspects of floor plans, including room count compliance, spatial connectivity, room locations, and geometric features. It incorporates both rule-based comparisons and graph-based analysis to ensure design requirements are met. A comparison of RFP-A and existing metrics was conducted both qualitatively and quantitatively, and it was revealed that RFP-A provides more robust, interpretable, and computationally efficient assessments of the accuracy and diversity of generated plans. We evaluated the performance of six existing floor plan generation models using RFP-A, showing that, surprisingly, only HouseDiffusion and FloorplanDiffusion achieved accuracies above 90%, while other models scored below or around 60%. We further conducted a quantitative comparison of diversity, revealing that FloorplanDiffusion, HouseDiffusion, and HouseGAN each demonstrated strengths in different aspects—graph structure, spatial location, and room geometry, respectively—while no model achieved consistently high diversity across all dimensions. In addition, existing metrics can not reflect the quality of generated designs well, and the diversity of the generated designs depends on both the model input and structure. Our study not only enhances the assessment of generated floor plans but also aids architects in utilizing numerous generated designs effectively.

1. Introduction

Residential buildings represent the bulk of projects in the architectural, engineering, and construction (AEC) industries and are closely related to people’s quality of life. With the rapid development of artificial intelligence technologies [1,2,3,4,5], the automatic generation of residential building design using AI has attracted increasing attention [6,7,8,9]. Automatic generation can significantly improve the efficiency of architectural design, refining the repetitive and time-consuming design process of drafting, evaluating, and modifying, and thus alleviating the designer’s workload [10,11,12]. Moreover, automatic generation can efficiently provide architects with a wide range of design options within a short timeframe. This enables them to explore and select optimal solutions, even under tight project schedules, thereby increasing the likelihood of achieving high-quality and creative design outcomes. This would be hardly possible through manual design [13]. In addition, automatic generation also benefits the consistency and standardization of design.
To fully realize the aforementioned advantages and further improve model performance, appropriate evaluation metrics for generated residential designs are crucial but have been largely overlooked in existing studies. Most existing studies used general metrics borrowed from computer vision, such as the Fréchet Inception Distance (FID), Peak Signal-to-Noise Ratio (PSNR), Structural Similarity Index (SSIM), Intersection over Union (IoU), and Graph Edit Distance (GED) (details in Section 2.2). While these metrics have proven effective in domains such as image generation and graph analysis, they are not specifically tailored to the context of architectural design. Consequently, they fail to adequately capture the essential characteristics and address the specific requirements of residential design generation. Partly due to the insufficiency of quantitative metrics, many existing studies also conducted user studies or expert reviews to evaluate the generated design. While this can provide useful insights into the generated designs, its results contain subjectiveness and could change with different groups of experts. Also, it is difficult to evaluate a large number of designs due to the hefty workload of evaluating designs manually.
Considering the characteristics and requirements of residential building design, and based on our literature review and analysis, we argue that successful evaluation metrics should cover the following fundamental aspects: compliance with design requirements [14], comprehensiveness of evaluation [15], diversity of generated designs [16], interpretability [17], and computational efficiency [18].
(1)
Compliance with the design requirements: Residential design must be in line with the specific requirements of the owner or targeted users. For example, if a two-bed residence is required but the generative model yields a three-bed design, then the design should be identified by the evaluation metrics, suggesting that the designers discard it. This is particularly important as residential projects involve a sequence of design processes [19,20], such as conceptual design, schematic design, design development, and construction documents [21], so modification costs in later stages due to incompliance with design requirements in earlier stages are hefty [22,23]. Therefore, the metrics must be able to filter out the incompliant generated designs.
(2)
Comprehensive evaluation: Residential design involves a series of features, such as the room number of each room type (e.g., bedroom, balcony), spatial connectivity and proximity of rooms (often shown as a graph, or “bubble diagram”), location and orientation of rooms (e.g., south-facing are often preferred for the north hemisphere), and geometries of rooms (e.g., the area and aspect ratio) [24,25]. Successful evaluation metrics should reflect all the major features.
(3)
Diversity of generated designs: Being able to generate a large variety of designs within requirements is an important aspect of generative models, as this allows architects to compare different possibilities and achieve a more desirable and confident solution from them for further development in later design stages [26]. Therefore, the evaluation metrics should measure the diversity of the designs generated by the model.
(4)
Interpretability: Due to the numerosity of generated designs, it is important for the evaluation metrics to label the designs in a definable, interpretable, and traceable way, to assist the manual screening of architects. For example, they can filter the designs based on specific room sizes, or they can compare designs with different types of spatial connectivity.
(5)
Computational efficiency: Due to the number of generated designs, the evaluation metrics should have high computational efficiency to avoid lengthy calculations.
To address the research gap of insufficiency in evaluation metrics for generated residential designs, we proposed a group of systematic and comprehensive evaluation metrics called Residential Floor Plan Assessment (RFP-A) that can meet the five essential requirements above. We then conducted extensive comparisons with existing metrics, showing the superiority of RFP-A. We also evaluated the performance of existing generative models for residential floor plans using RFP-A to demonstrate its effectiveness.
To the best of our knowledge, this is the first study to establish evaluation metrics specifically tailored for generated residential designs. Our contributions include the following:
(1)
We developed novel RFP-A evaluation metrics, which can assess the accuracy and diversity of residential floor plans generated by AI models in a comprehensive and interpretable manner, with improved computational efficiency mainly due to the revisions on GED. This not only leads to more reliable assessments of generative models but also can help architects make full use of a large number of generated designs and select the optimal solutions from them.
(2)
We conducted an in-depth analysis and comparison of RFP-A and existing evaluation metrics, both qualitatively and quantitatively, identifying the issues of using existing metrics for residential design and showing the superiority of RFP-A.
(3)
We evaluated the performance of six existing generative models for residential designs using RFP-A. This not only provides useful insights into the development of using generative AI in architectural design but also sets up a paradigm of performance evaluation for similar generative models for future studies.

2. Related Works

2.1. Existing Evaluation Metrics for AI-Generated Residential Floor Plans

First, we summarized the existing evaluation measures that have been used in the studies reported in Section 2.2 (Table 1), including FID, GED, IoU, PSNR, SSIM, and user studies, with FID and user studies being the most commonly used. The definition and key characteristics of the quantitative metrics are explained in the following:
FID captures the differences in feature distributions between the generated and the real images, thereby evaluating the quality of the generated results [27]. It works for pairs of images, and lower values indicate higher generative qualities. Its definition does not have clear linkages to residential floor plans and can only reflect the fidelity of the generated design from an image point of view. Therefore, it can partly evaluate the accuracy of the generation but cannot indicate the diversity. Its results are not interpretable from an architectural perspective.
GED measures the similarity between the generated and the real graphs by quantifying the minimum edit operations (e.g., adding or deleting a node or an edge) required to transform one graph into the other [28,29]. It works for pairs of images, and lower values indicate higher generative qualities (i.e., higher similarity). Regarding residential floor plans, GED can reflect the spatial connectivity and room proximity, so the results are partly interpretable [30,31]. But it can not take room locations and room geometries into account. Its computational cost is relatively high.
IoU evaluates the differences between the generated and the real shapes using the ratio of the overlapping area over the total covered area. It works for pairs of shapes, and higher values indicate higher accuracies. It can reflect the geometric features of rooms in residential plans, so the results are partly interpretable. But it can not evaluate other key features such as room numbers, spatial connectivity, and room locations.
PSNR indicates the fidelity of the generated image by calculating its mean square error (MSE) with the real image. It works for pairs of images, and higher values indicate higher generative qualities. Similarly to FID, it is a pixel-based method and does not have clear linkages to residential floor plans, so the results can only reflect the fidelity of the generated design from an image point of view. Therefore, it can partly evaluate the accuracy of the generation but cannot indicate the diversity. Its results are not interpretable from an architectural perspective.
SSIM also reflects the fidelity of the generated image by considering key features of the human visual system, such as changes in luminance, contrast, and structure of pixels. It works for pairs of images, and higher values indicate higher generative qualities. Similarly to FID and PSNR, SSIM can partly reflect the fidelity of the generated design from an image point of view but cannot evaluate the diversity of the designs or provide interpretable results.
Table 1. Evaluation metrics used in existing studies on residential floor plan generation.
FIDGEDIoUPSNRSSIMUser Study
Graph2Plan [32]
HouseDiffusion [33]
HouseGAN++ [34]
HouseGAN [35]
Tell2Design [36]
Building-GAN [37]
FloorplanDiffusion [38]
Wang et al. [39]
WU et al. [40]
Therefore, theoretical analysis suggests that none of the existing metrics are effective in evaluating generated residential floor plans [23,26]. This is further supported by the widespread use of time-consuming user studies in existing research, indicating the inadequacy of objective metrics. In particular, general metrics such as FID, PSNR, and SSIM perform poorly in capturing the structural and spatial characteristics unique to residential floor plans, while domain-related metrics like GED and IoU are limited in distinguishing between different types of room connections (e.g., doors vs. walls) and are sensitive to changes in room location. More detailed results about the insufficiency of existing metrics are presented in Section 4.
In addition, there is a sparse number of studies trying to improve the evaluation of generated residential floor plans [21,41,42,43]. Engelenburg et al. [43] identified the weak correlation between IoU and GED through experiments and proposed a new metric, SSIG (Structural Similarity by IoU and GED), aiming to achieve a comprehensive evaluation of residential floor plans through a weighted average of IoU and GED [44,45]. However, averaging the two metrics reduces the interpretability. It cannot assess the diversity of the generated result or some key features of residential design, such as room numbers and room locations. Park et al. [21] evaluated residential floor plans from three perspectives: room size [40], privacy level [46], and room connectivity [47]. They found significant differences between the designs of the current generative models and those of the human experts through statistical tests [48,49,50]. This study provided useful insights into the performance of the current models, but its method can not tell whether the generated designs are compliant with the specific design requirements, or assess the diversity of the generated results [51].

2.2. Generation Models for Residential Floor Plans

At present, the use of AI in architectural design has attracted increasing attention, and the number of models in this field is also expanding, covering design generation [52,53], performance analysis [54,55,56,57,58], and human–space interaction [59,60,61,62]. Here, we classify and introduce the automatic residential generation models based on their forms of input.
First, many models require a graph showing the spatial connectivity and room proximity as input. Among them, HouseGAN (relational generative adversarial networks for graph-constrained house layout generation) [35] generates residential floor plans by inputting a graph. HouseGAN is based on the GAN network structure [63], and its evaluation metrics include FID [27] and GED [64]. HouseGAN++ (generative adversarial layout refinement network towards intelligent computational agent for professional architects) [34] is an improved version of HouseGAN. The input graph of HouseGAN++ is more concise, but the evaluation metrics are still FID and GED. HouseDiffusion (vector floorplan generation via a diffusion model with discrete and continuous denoising) [33] uses the diffusion model structure to generate residential floor plans. The input is also in the form of a graph. HouseDiffusion is currently the best-performing baseline for graph-based residential models, and its evaluation metrics are still FID and GED. In addition, Graph2Plan (learning floorplan generation from layout graphs) [32] uses the input form of graph plus boundary [65]. Graph2plan generates residential floor plans through deep learning and rule-based methods. Its evaluation metrics include IoU [66] and user study. The model of Wang et al. [39] requires the input of a graph together with other factors such as the surrounding environment. It can generate residential floor plans by comprehensively considering the inputs. It uses IoU and the Euclidean distance [67] as the evaluation metrics. Building-GAN (graph-conditioned architectural volumetric design generation) [37] uses graph input for a different task in residential building design. The model generates a three-dimensional building form of a multi-story residential building with graph input. Its evaluation metrics include FID, connectivity accuracy, and the score of the user study.
Second, some residential generative models take images as input. For example, the model of WU et al. [40] generates residential floor plans based on an image showing the designated boundary of the plan. It also provides the current mainstream RPLAN (floor plans from real residential buildings) dataset. This model’s evaluation was performed through a user study, but no quantitative metrics were used. The FloorplanDiffusion (multi-conditional automatic generation using diffusion models) [38] model uses images showing the boundary and the instances of each type of room as inputs. The model can generate valid designs with incomplete and inaccurate input, showing good flexibility and robustness. The model evaluation uses FID, PSNR [68], SSIM [69], and a user study.
In addition, generative models can also take cross-modal inputs such as natural language descriptions [70,71]. Tell2Design (a dataset for language-guided floor plan generation) [36] builds a natural language database for residential generation as the model’s training data. The natural language description as the model input can contain information like the number, type, location, size, and boundary of the rooms. The model’s evaluation includes IoU and a user study.
In summary, while numerous models have been proposed for automatic residential floor plan generation, their evaluations largely rely on general-purpose metrics such as FID, PSNR, and SSIM, or domain-related metrics like IoU and GED. However, these metrics have limited effectiveness in capturing key aspects of residential design. General metrics often fail to reflect structural and functional requirements, while domain metrics are either too sensitive to irrelevant variations (e.g., location shifts) or unable to distinguish critical architectural elements (e.g., doors vs. walls). Furthermore, user studies, though informative, lack scalability and objectivity. These limitations underscore the need for dedicated, architecture-aware evaluation frameworks for residential generation models. A detailed performance comparison and critical analysis of existing models and metrics can be found in Section 5.

3. Design of RFP-A Metrics

In this section, we developed the novel RFP-A evaluation metrics for assessing the accuracy and diversity of generated residential floor plans in a comprehensive and interpretable manner with improved computational efficiency. Section 3.1 presents an analysis of the essential aspects of residential design that need to be addressed by evaluation metrics. Section 3.2 outlines the overall structure of the proposed evaluation framework. Section 3.3 details the algorithms of two evaluation metrics that are refined from existing methods. Section 3.4 provides a demonstration of how the evaluation metrics can be applied in practice.

3.1. Key Information of Residential Floor Plan Designs

Based on a detailed review of the processes and requirements of residential design, four kinds of key information that need to be covered by the evaluation metrics were identified as follows:
Room numbers: The room number of each room type directly reflects the basic functional requirements of the residential plan [72]. Different family structures have different requirements for the number of rooms, such as a single person, a couple, a family of three with a single child, or multiple generations living together [51]. Reasonable room numbers can better accommodate the living requirements of the family and future family expansion [73]. Therefore, the number of rooms is one of the essential and fundamental requirements.
Room connectivity and proximity: The connectivity and proximity of rooms significantly impact the daily functioning and efficiency of a household [72]. For instance, placing the kitchen adjacent to the dining room and positioning the main bedroom near the bathroom enhances the convenience of everyday life. Furthermore, the level of privacy in residential spaces is a crucial design consideration, often influenced by the spatial relationship between rooms. For example, situating the children’s room near the main bedroom ensures parental supervision, while maintaining an independent guest room guarantees adequate privacy for both guests and hosts [47,51]. The room connectivity and proximity are often expressed as a graph, or a “bubble diagram”.
Room locations and orientations: This requirement mainly arises from the considerations of natural lighting, ventilation, noise, and other environmental factors. First, the location of rooms determines the amount and duration of natural light exposure, directly impacting the brightness and comfort levels of the rooms [74]. Second, a good room layout can enhance natural ventilation, improving indoor air quality [75]. Additionally, well-situated rooms can offer better views of natural scenery while minimizing exposure to noise sources, thus enhancing the overall quietness and comfort of the living environment [76].
Room geometries: This feature contains information such as size and shape. First, this requirement should match the specific functions of each room [77]. For instance, the master bedroom typically accommodates more occupants and requires more furniture, so it should be larger than the other bedrooms to ensure adequate space and comfort. Room size and shape are also important factors affecting living comfort [78]. Reasonable room shape design can improve the flexibility of residential space use and facilitate furniture placement and functional adjustment [79].

3.2. Overall Structure of RFP-A Evaluation Metrics

Based on the key features analyzed in Section 3.1, RFP-A was designed using a serial evaluation paradigm and a trapezoidal evaluation structure to ensure that the evaluation process progresses systematically from overall considerations to specific elements, and from more foundational aspects to detailed design components. The evaluation is carried out in the order of room numbers, room connectivity and proximity (graph structure), room locations and orientations, and room geometries, as shown in Figure 1. Each step of the evaluation is based on the previous step to ensure comprehensiveness, interpretability, and consistency. For each step, the accuracy or compliance with the design requirements of the generated designs is first assessed if design requirements related to that step are changed. Diversity is then evaluated using the number of categories that the compliant generated designs can be divided into. For example, diversity can be assessed by categorizing the generated residential floor plans based on their graph structure, such as the number of different room connectivity patterns. Similarly, the number of categories can also be calculated based on variations in room numbers and locations. It should be noted that our evaluation metrics can also be used in other ways according to the situation or requirements of certain design projects, e.g., selecting only a part of the four metrics, changing the sequence of the four metrics, or employing a parallel instead of a serial evaluation paradigm.
First, the graph structure of the residential floor plan is obtained through preprocessing, as shown in Figure 1a. In the graph structure, each node represents a room, and different colours stand for different room types. The red line indicates that two rooms are connected by a door, providing physical access, and the white line indicates that two rooms are connected by a wall, without physical access. We perform an incremental evaluation of the residential plans using a trapezoidal approach with four steps:
Step 1: We determine the quantities of each room type by extracting node information. Floor plans with identical quantities of each room type were categorized into one group.
Step 2: Within each group formed in Step 1, we further categorize the floor plans with the same graph structure into one group. In this step, we design the RFP-GED algorithm to optimize the edit distance calculation between graphs to achieve fast evaluation (details in Section 3.3.1).
Step 3: Within each group formed in Step 2, we categorize the floor plans with the same room locations into one group. Given the emphasis in residential design on cardinal directions such as due south and north, we rotated the original Cartesian coordinate system by 45 degrees, centring it on the living room (Figure 2). This adjustment allows for a suitable division into four quadrants for residential floor plans, facilitating the accurate identification of south, north, east, and west orientations within the building. If each room of a certain floor plan is located in the same quadrant as the corresponding room of other floor plans, these plans are categorized into one group.
Step 4: Within each group divided in Step 3, we further quantify the geometric features of the rooms, such as size and shape, using the RFP-IoU, which we designed based on IoU (details in Section 3.3.2). This allows the evaluation of the differences in the geometric characteristics of residential spaces.
In summary, our RFP-A evaluation metrics encompass the following key elements as listed in Section 1: (1) being able to evaluate the compliance to design requirements by assessing the designs with related requirements (if any) in each step; (2) providing comprehensive evaluations including room numbers, graph structure, room locations and room geometries; (3) being able to evaluate diversity using the number of categories in each step; (4) high interpretability as each step has clear architectural meanings; and (5) improved computational efficiency by revising the computationally expensive GED into RFP-GED (details in Section 3.3.1). These are further demonstrated in Section 4.

3.3. Detailed Algorithms of RFP-GED and RFP-IoU

3.3.1. RFP-GED

The Graph Edit Distance (GED) algorithm has been widely used in various applications [29,80]. However, several improvements can be made to further enhance its performance and suitability for evaluating generated residential floor plans. The original GED has the following problems: (1) the computational cost is high and cannot achieve the purpose of rapid evaluation; (2) the modification costs of door connections (red lines) and wall connections (white lines) are treated the same, which fails to reflect the importance of physical access between rooms in residential contexts.
To address these challenges, we propose RFP-GED, which compares and removes similar edges in the graph based on node attributes, terminating early when no further similar edges are found. Then, we calculate the modification cost of dissimilar edges, and finally, we classify the floor plans with graphs that have modification costs of 0 into one category. Specifically, a graph modification cost matrix for each room was first constructed based on the rule that the modification cost of red lines (door connections) is two and that of white lines (wall connections) is one. If there is no connection of any kind between two rooms, the corresponding value is set to −1. Since this algorithm is intended for use within AI models, we follow a commonly used padding strategy in such models by filling the remaining parts of the matrix with −1 [81]. A sample matrix of a living room is shown in Figure 3. In thiswpm example, the vertical axis represents the types of rooms connected to the living room, and the horizontal axis denotes the indices of those room types. For instance, if the living room is connected to two bedrooms, the corresponding row will be [2, 2, −1, −1, −1]. Then, we calculate the matrix difference in each room type between the two graphs, representing the modification cost of the dissimilar edges. Once the calculation for a room node is completed, the modification cost of that node’s edges to all other rooms will be set to 0, indicating the deletion of similar edges. Finally, the modification costs of all rooms are sequentially summed to obtain the edit distance of the graph.
To reduce the computational cost, we also made the following improvements based on the original GED: First, we defined the calculation order of room nodes when calculating the room matrix difference, significantly narrowing down the search range. The order is living room, bedroom, bathroom, kitchen, and balcony. This is determined by counting the average number of edges of each room type in the RPLAN dataset [40], and the results are shown in Table 2. The results indicate that, on average, each residential floor plan in the RPLAN dataset contains 5.25 edges connected to the living room, followed by 2.81, 2.63, 2.11, and 1.70 edges connected to the bedroom, bathroom, kitchen, and balcony, respectively. Taking the living room in Figure 3 as an example, it has five edges connected to other rooms. Second, we implemented an early stopping strategy. When calculating the matrix difference in the above order, the edges relevant to a certain node will be deleted after the calculation of this node is completed. When there are no similar edges in the graph, the calculation will be stopped early to reduce computational cost. Thirdly, we constructed a graph modification cost matrix for each room to calculate the edit distance of residential graphs. The original GED requires a global search of nodes and edges when calculating the edit distance, which is computationally expensive.
We verified the efficiency of our algorithm. A comparison of the computation efficiency of RFP-GED and GED on a single image was conducted, revealing the high efficiency of RFP-GED. Then, we compared the computational cost of categorizing a large number of floor plans, showing the faster evaluation speed of our refined RFP-GED. Finally, we conducted an ablation experiment on the search order of RFP-GED, confirming its effectiveness in reducing computational costs. These results are shown in Section 4.4, which substantiates the superior performance and efficiency of our proposed metric.
To suit different situations, we further designed two versions of RFP-GED to balance the computational accuracy and cost. (1) Refined version ( R F P G E D α ): Since the node attributes of the same type of rooms in residence should be consistent, to avoid calculation errors caused by inconsistent node attributes of the same kind of rooms, we calculate the same type of rooms through permutations and combinations, and finally take the minimum value as the edit distance between the two graphs. (2) Rough version ( R F P G E D β ): We do not consider the graph node attributes by omitting the permutations and combinations and directly subtracting the two graph modification cost matrices. This will reduce the calculation cost, though it may result in some loss of accuracy and minor calculation errors. In Section 4.4, we also conducted an ablation experiment on the above design to verify its effectiveness and level of inaccuracies.

3.3.2. RFP-IoU

After the first three steps of the evaluation, the residential floor plans within the same group were consistent in the number of rooms, graph structure, and room locations. Thus, the remaining task is to evaluate the difference in the geometric features of the floor plans. Extensive experiments have validated that IoU can well evaluate the geometric features of images. However, it presents the following problems when used for residential designs (illustrated in Figure 4a): (1) the original IoU is too sensitive to the image location, while in the residential field, the absolute location of the plan within the canvas is less important than the relative locations between the rooms; (2) the original IoU using bounding boxes can only roughly evaluate the difference in room size and cannot accurately evaluate the difference in shape features. To accurately quantify the difference in residential geometric features and overcome the problems of the original IoU, we designed RFP-IoU to solve the above problems. Its calculation process is shown in Figure 4b.
Let us assume the two residential floor plans, I 1 and I 2 , as illustrated in Figure 4b. First, we separate the rooms into room sets C 1 = { c 1,1 , c 1,2 , , c 1 , m } , and C 2 = { c 2,1 , c 2,2 , , c 2 , m } . Then, C 1 and C 2 are aligned to maximize the overlapping area to eliminate the influence of location sensitivity. After alignment, c i , j is represented as c i , j . Next, the IoU values between each pair of rooms of the same type are calculated in sequence:
γ j = I o U ( c 1 , j , c 2 , j ) = c 1 , j c 2 , j c 1 , j c 2 , j
where · represents the area of the set. Taking the living room in Figure 4b as an example, γ 1 = 5587 / 8101 , where 5587 and 8101 denote the total number of pixels in the union and intersection of the two living rooms, respectively. Since this formula represents a ratio, it is not affected by image resolution. Finally, the I o U ( c 1 , j , c 2 , j ) of each room is averaged to obtain the final geometric feature RFP-IoU value:
R F P I o U = 1 m j = 1 m I o U ( c 1 , j , c 2 , j )

3.4. Demonstration of Using RFP-A

In this subsection, we demonstrate how to use RFP-A to evaluate generated residential floor plans. While RFP-A is scalable and can evaluate a large number of plans, here we only select ten plans from the RPlan dataset to allow visual inspections (Figure 5b). The evaluation results are shown in Figure 5a. RFP-A first screens based on the number of rooms in the first step and divides the ten plans into three categories: [1,3,1,1,0], [1,2,1,1,1], and [1,2,1,1,2] (in the order of living room, bedroom, bathroom, kitchen, and balcony). Since the requirement is to generate two bedrooms, one living room, one kitchen, one bathroom, and one balcony, we first filter out the generated results that do not meet the requirements, namely [1,3,1,1,0] and [1,2,1,1,2]. Then, we calculate the accuracy of the residential floor plans generated by the model that meet the requirements, which is 8/10, or 80% accuracy. In the second step, we classify the residential graphs through RFP-GED based on the result of the first step, specifically, grouping residential floor plans with the same graph structure into one category. As a result, the eight plans are divided into two categories, meaning the diversity at the level of graph structure is two. The third step further classifies the residential plans with the same graph based on the room location features. Consequently, two pairs of residential plans with the same room locations are found and further grouped into one category each, while the remaining four plans all have different room locations, resulting in six categories in total, i.e., a diversity of six at the level of room location. In Step 4, we quantify the geometric features of the plans through RFP-IoU. Even though after the first three steps, plans categorized within the same group generally have high similarity, RFP-IoU can quantify the diversity of small changes in the geometric features of the room, such as size and shape. Because RFP-A classifies and organizes the dataset hierarchically, with each step having clear dependencies and architectural meanings, it has strong interpretability. RFP-A can not only filter out residential designs that do not meet the requirements but also provide interpretable classifications for a large number of generated plans, assisting the manual screening and selection by architects.

4. Performance of RFP-A and Existing Metrics

4.1. Performance When Comparing Generated and Ground-Truth Plans

Here, we examine the ability of the evaluation metrics to accurately assess the differences between a generated plan and a ground-truth plan, involving five common situations: (a) different room numbers, which the metrics should show high sensitivity, (b) different graph structure, which the metrics should show high sensitivity, (c) changes in the overall location within the canvas, which the metrics should be insensitive to, (d) different room geometric features, which the metrics should be able to quantify, and (e) different levels of pixel noise, which the metrics should be robust to. FID evaluates the quality of the generated plans by comparing feature distribution differences—lower values indicate better performance. RFP-GED and GED assess the similarity of the graph structures between two residential floor plans—lower values are better. RFP-IoU and IoU quantify geometric discrepancies between corresponding rooms—higher values are preferred. PSNR and SSIM evaluate the visual fidelity between the generated and ground-truth floor plans—higher values indicate better fidelity. The results are presented in Figure 6.
(a)
Different room numbers. Since the number of rooms significantly impacts the residential layout, the evaluation metrics should exhibit high sensitivity to room numbers. Figure 6a shows that when adjusting the number of rooms in residential floor plans under different conditions, none of the metrics can indicate a significant difference between the paired plans. While changes in the number of rooms affect the room graph structure, it only leads to rather slight fluctuations in GED and RFP-GED. This demonstrates that the existing evaluation metrics cannot adequately reflect the impact of variations in the number of rooms, and the first step of RFP-A, which specifically investigates the number of each room type, is essential.
(b)
Different graph structures. When the room connectivity is changed, the evaluation metrics should be able to capture the modified graph features even though the geometric features remain largely unchanged. Figure 6b shows that the original GED has the same modification cost of door connections (red line) and wall connections (white line), so the editing cost of the two pairs of plans is 0, even though the circulation of the floor plans and the physical accessibility between rooms have been significantly changed. In contrast, RFP-GED can capture the fine-grained modification, resulting in an editing cost of 2.0. Therefore, RFP-GED is more effective in identifying different graph structures in residential floor plans. Other metrics can not capture the difference in graph structures.
(c)
Different overall locations. In residential plan generation, the relative positions of the rooms are crucial, while the absolute position of the entire residence within the canvas is less important. Therefore, the evaluation metrics should remain largely unchanged when the entire plan is simply moved. Figure 6c shows that IoU, FID, and PSNR performed poorly, exhibiting high sensitivity to overall position movement. In contrast, RFP-IoU, GED, RFP-GED, and SSIM performed well, showing low sensitivity. However, the values of SSIM are very similar for all cases shown in Figure 6, indicating that it is not effective in evaluating residential floor plans, even with the insensitivity to overall locations. GED and RFP-GED are used to evaluate the features of graph structures, and RFP-IoU is used to assess the features of room geometries.
(d)
Different room geometries. The evaluation metrics should be able to accurately quantify the geometrical differences in each room. Figure 6d shows that FID, PSNR, and SSIM can only capture changes in the overall image and cannot accurately reflect the shape differences in each room. Additionally, these three metrics cannot relate to shape differences well due to their poor explainability. While IoU and RFP-IoU can quantify the geometric feature differences in each room, IoU is rather sensitive to the change in room locations. The RFP-IoU we designed addresses this problem and can accurately quantify the geometric differences between each pair of rooms, disregarding the change in room locations.
(e)
Different pixel noise. In residential design, the primary concern is the layout, graph structure, and geometric features of the floor plan, not pixel-level details, which can be easily remedied either manually or through algorithms. Therefore, the evaluation metrics should be robust to pixel noise because it does not significantly affect the core information of the generated residential design. Figure 6e shows that FID and PSNR exhibit inevitable fluctuations with the presence of pixel noise, indicating poor robustness. Other metrics are rather stable, meeting the robustness requirements.
The above results demonstrate that the existing metrics FID, PSNR, and SSIM perform poorly in comparing generated and ground-truth residential floor plans. The existing metrics, GED and IoU, can assess graph features and room geometries, but their effectiveness is lower than our refined RFP-GED and RFP-IoU, respectively, in capturing the difference between door connections and wall connections, and they are resistant to location changes.

4.2. Performance Under Common Design Modifications

Here, we examine the ability of the evaluation metrics to accurately assess the subtle differences caused by common design modifications, involving six cases (Figure 7). Figure 7a shows that when deleting a wall and combining two rooms into one, only the room number component of our RFP-A can distinguish that the number of rooms has changed and express the change in an interpretable way through the numbers of [living room, bedroom, bathroom, kitchen, balcony]. Although some other metrics also show numerical changes, they fail to indicate the change in the number of rooms in an interpretable way. Figure 7b shows that when fine-tuning the residential plan by changing the balcony location, RFP-GED of our RFP-A and GED can capture this change, but GED does not distinguish door connections and wall connections, so its result is not as accurate as RFP-GED. Figure 7c shows that we again move the balcony location but without changing the residential graph structure. The results show that only the room location component of our RFP-A captures the change in the balcony location, indicating that the balcony moves from the third quadrant to the fourth quadrant, demonstrating good interpretability. In Figure 7d, we move the balcony from the bedroom to the living room. The results are similar to Figure 7b, which shows that the RFP-GED of our RFP-A and GED can capture the change, but RFP-GED is more accurate due to the inherent limitation of GED. In Figure 7e, we fine-tune the size of one bedroom. The RFP-IoU of our RFP-A and IoU can accurately capture the size change. In Figure 7f, we fine-tune the size of the bedrooms and bathroom and the shape of the living room to verify the ability of the metrics to evaluate geometric features. The results show that while the original IoU using bounding boxes has a good ability to capture room size changes (bedroom and bathroom), it is less sensitive in capturing room shape changes (living room). On the other hand, our RFP-IoU can capture both the size features and shape features well.
In summary, the four components of our RFP-A have shown good capabilities in distinguishing differences in residential floor plans caused by common design modifications in an interpretable way.

4.3. Correlation Analysis

The qualitative analysis in Section 2.2, Section 4.1 and Section 4.2 indicates that existing evaluation metrics adopted from AI image generation perform poorly for evaluating generated residential floor plans, and our proposed RFP-A is more suitable in terms of interpretability and independence of each metric. Here, we aim to further demonstrate this quantitatively using correlation analysis. Specifically, the following assumptions summarized from Section 2.2, Section 4.1 and Section 4.2 are verified:
(1)
FID is a global metric for evaluating image features, but it shows difficulties in capturing the relevant features of residential floor plans. Therefore, FID is expected to have weak or no correlation with other evaluation metrics.
(2)
GED and RFP-GED should show a high correlation, but they are expected to show a high degree of irrelevance with other remaining metrics (IoU, RFP-IoU, PSNR, and SSIM) due to the different features they focus on in residential design.
(3)
IoU and the other remaining metrics (PSNR, SSIM) focus on different features: IoU evaluates geometric features, while the other two evaluate image quality features. Considering that geometric features may slightly impact image quality features, IoU and the other two metrics could show a weak correlation.
(4)
PSNR and SSIM both focus on image quality features, but their focus differs: PSNR focuses on fine-grained features, while SSIM focuses on coarse-grained features. Thus, PSNR and SSIM should show a certain degree of correlation.
(5)
Since we aim for RFP-A to evaluate residential floor plans from multiple angles through different kinds of features, RFP-IoU and RFP-GED should have a high degree of independence. They should show little correlation with other metrics except for IoU and GED, respectively.
We sampled one million pairs of designs from the RPLAN dataset and calculated the values of the evaluation metrics. We first visualized the density distribution between each pair of metrics (Figure 8), then quantified the correlations between the metrics using the Pearson coefficient [82] (Table 3), and finally analyzed the results to verify the assumptions. For the Pearson coefficient r ( r [ 1,1 ] ), r = 1 represents a complete negative correlation, while r = 1 represents a complete positive correlation. r 0.8 indicates strong correlations, 0.8 r 0.5 indicates moderate correlations, 0.5 r 0.3 indicates weak correlations, and 0.3 r indicates no significant correlation [83]. For simplicity, in this study, we treat r 0.3 as correlated, and r 0.3 as uncorrelated.
The following can be seen from the results:
(1)
There is no correlation between FID and other evaluation metrics, likely due to the unexplainable characteristics of FID. This is consistent with our assumption.
(2)
The results of GED are consistent with our assumption; that is, GED is highly correlated with RFP-GED, but is uncorrelated with the remaining four evaluation metrics (IoU, RFP-IoU, PSNR, and SSIM), indicating that GED and RFP-GED evaluate graph structure features, independent from other metrics.
(3)
IoU shows no correlation with PSNR and a weak correlation with SSIM, which shows that the geometric changes in residential plans will have a minor impact on coarse-grained image features.
(4)
PSNR and SSIM show a very strong correlation, indicating that there is no significant distinction between the fine-grained and coarse-grained image quality features in residential floor plans.
(5)
RFP-GED shows a correlation only with GED, showing that RFP-GED maintains independence in evaluating graph structure features. RFP-IoU shows a correlation only with IoU, indicating that RFP-IoU also has independence in evaluating geometric features. RFP-IoU and RFP-GED show no correlation, indicating that the two evaluate different aspects of residential floor plans.
The fact that the results of correlation analysis with massive data are largely in line with our assumption shows the validity of our theoretical analysis in Section 2.2 and case analysis in Section 4.1 and Section 4.2. Moreover, it is shown that RFP-IoU and RFP-GED evaluate different features independently, suggesting that using RFP-IoU and RFP-GED together can assess residential floor plans from different perspectives and improve comprehensiveness.

4.4. Computational Efficiency

Our RFP-A consists of four evaluation components, and among them the GED-based evaluation of graph structure (RFP-GED) is by far the most computationally expensive and time-consuming [28]. Considering the wood barrel effect, we took measures to shorten the calculation time when designing RFP-GED (details in Section 3.3.1), and here we verified its computational efficiency experimentally in comparison with the original GED. First, we compared the computational efficiency on a single image, then we compared the computational cost of categorizing a large number of floor plans, and finally, we conducted an ablation experiment on the search order of RFP-GED.

4.4.1. Single Image Efficiency

We compare the calculation efficiency of a single plan between the RFP-GED and the original GED. To ensure the generalizability, we compared two scenarios. One uses graphs that contain both door connections (red lines) and wall connections (white lines), and the other one uses graphs that include door connections (red lines) only. The former contains more complete information about the spatial connectivity and proximity, but the latter was used in several important existing AI models for residential design generation, such as HouseGAN and HouseGAN++. Figure 9 shows the definition of the two scenarios, Table 4 shows the results of the evaluation efficiency for single-image floor plans.
RFP-GED is significantly faster than GED in both scenarios, particularly the more complete red-and-while line scenario. This verifies our method’s fast evaluation characteristics and generalizability, indicating its feasibility of evaluating a large number of floor plans as it dramatically reduces the time cost.

4.4.2. Multi-Image Categorization Efficiency

To verify the difference in evaluation efficiency between our category-based RFP-GED method and the original GED, which calculates the edit distances, we compared the calculation time of our RFP-GED (refined version and rough version) and GED on 100 and 1000 floor plans, respectively. The results are shown in Table 5.
The original GED needs to calculate the edit distance between two plans, so the computational complexity is 𝒪 ( L 2 ) . Our RFP-GED focuses on the classification of the plans based on their relationships, so the computational complexity is 𝒪 ( L l o g L ) . Table 5 shows that our R F P G E D α can be about two orders of magnitude faster than the original GED in terms of evaluating a large number of floor plans (1000). One order of magnitude of this difference is due to the higher evaluation efficiency of single images in RFP-GED compared to GED. The second order of magnitude is attributed to the fact that our RFP-GED is based on classification, which results in a lower computational complexity when processing a large number of floor plans. If we do not consider the premise that the same types of room nodes need to be permuted and combined, the rough version R F P G E D β can be three orders of magnitude faster than GED, but this will cause some errors. By comparing with R F P G E D α , it is found that the accuracy of R F P G E D β is 84.4%.

4.4.3. Ablation Experiment on the Search Order of RFP-GED

The search order of our RFP-GED is living room, bedroom, bathroom, kitchen, and balcony, based on the average number of edges of each room type (detailed in Section 3.3.1). Here, we conducted an ablation experiment to verify the effectiveness of this search order. Specifically, we tested the computational efficiency in both the prescribed order and the reversed order. We conducted experiments in both the red-and-white line scenario and the red-line scenario to ensure generalizability. Using the calculation of 100 floor plans as an example, the experimental results are shown in Table 6. It can be seen that since the reversed order starts from the room type with the smallest number of edges, it requires more calculation steps, which is why the reversed order is more time-consuming than our prescribed order. These results verify the effectiveness of our prescribed search order in improving computational efficiency.

5. Evaluation of Existing Models for Residential Plan Generation

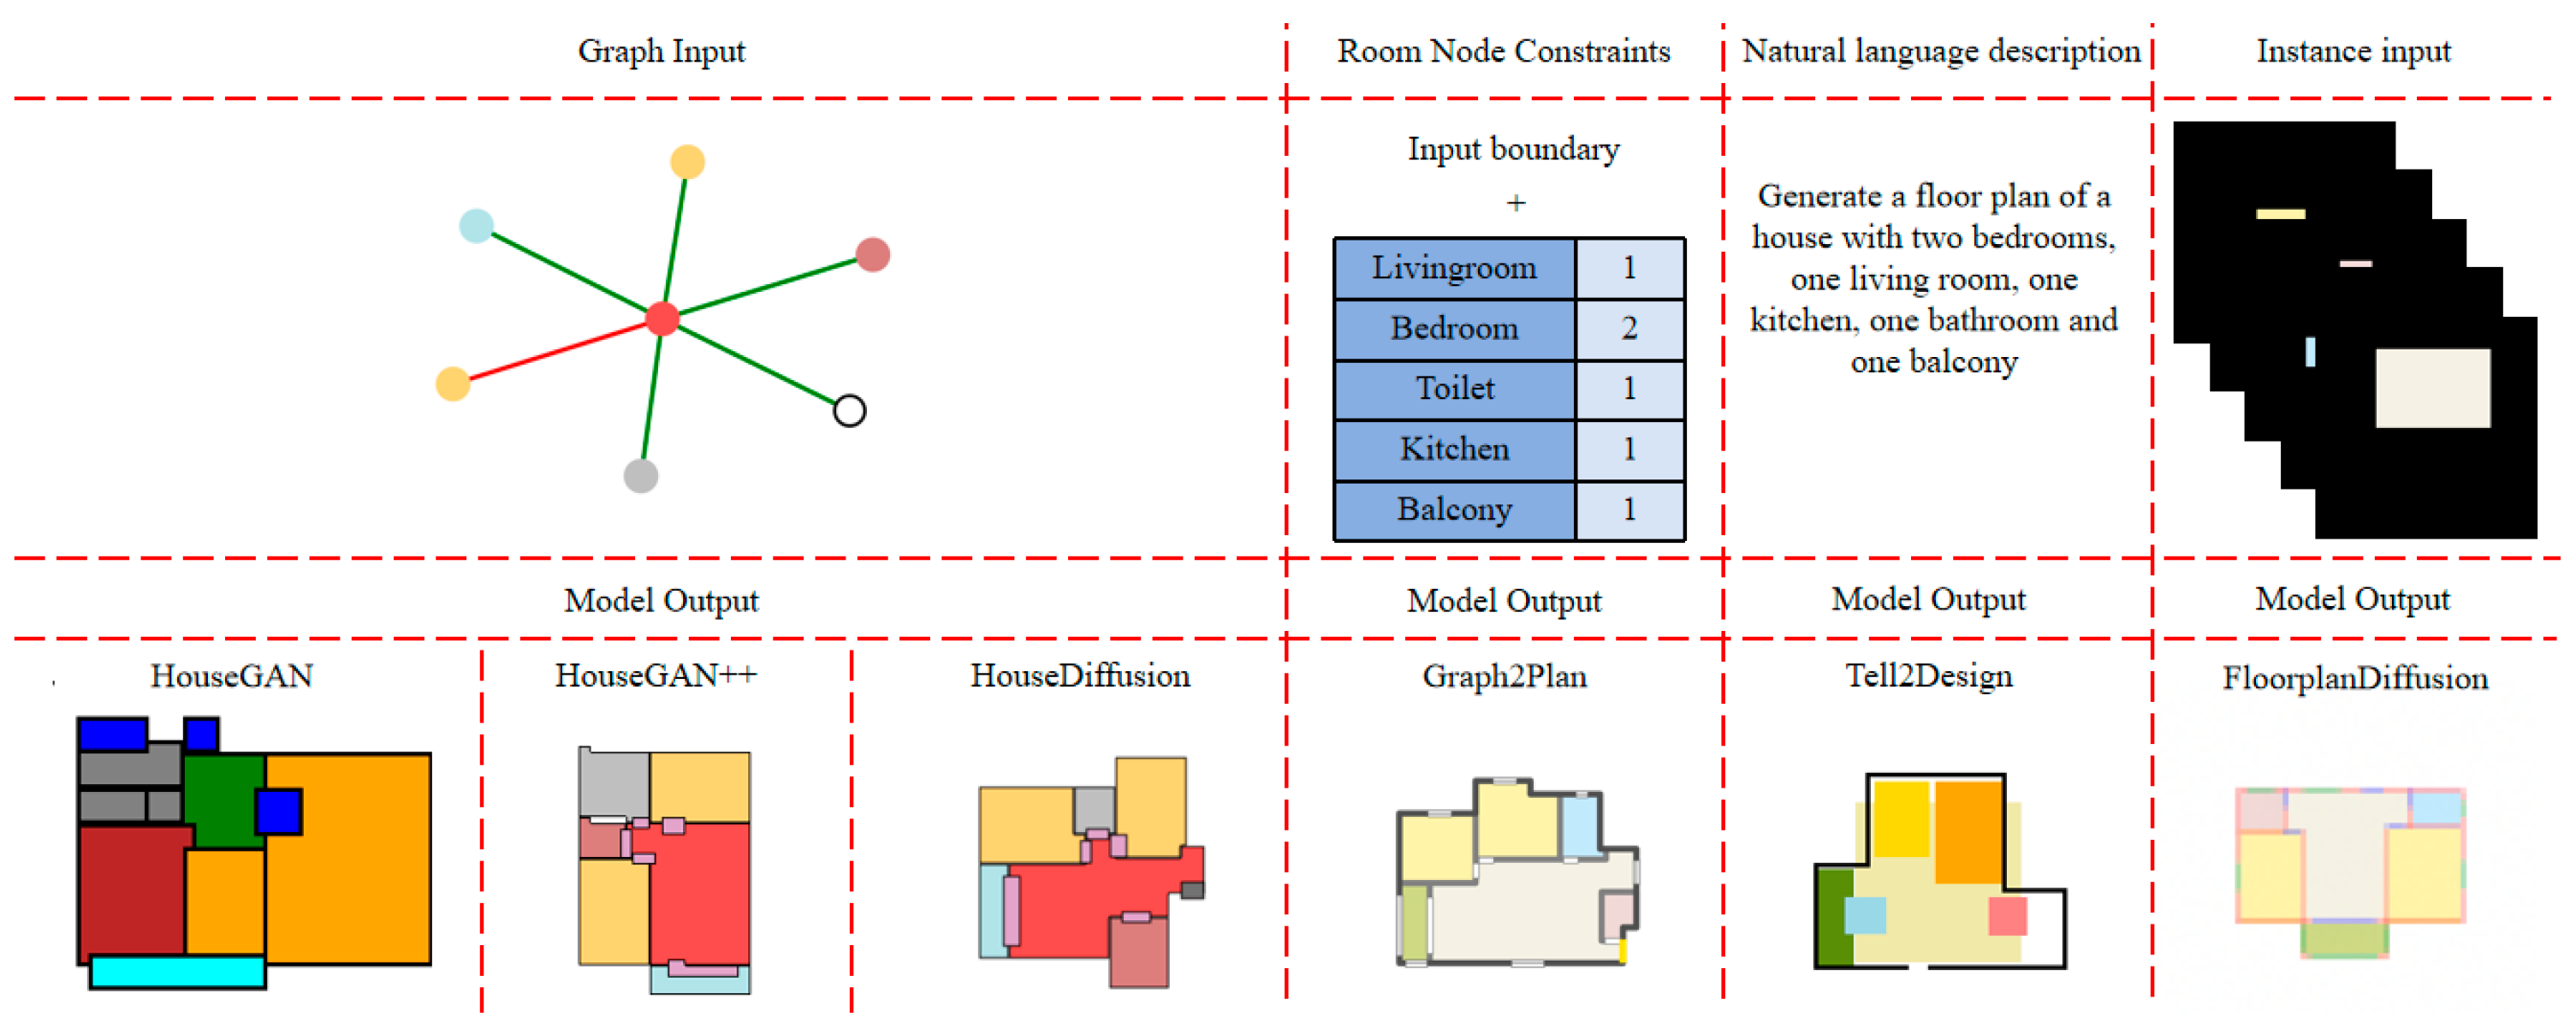
In this section, we use RFP-A and existing evaluation metrics to evaluate the current models in automatic residential generation. We tested six existing models for residential design generation, which can be divided into the following categories based on their input conditions. (1) Graph input: HouseGAN [35], HouseGAN++ [34], and HouseDiffusion [33]; (2) Room constraints: Graph2Plan [32]; (3) Natural language descriptions: Tell2Design [36]; and (4) Instance input: FloorplanDiffusion [38]. We visualized the input and output forms of the models in Figure 10. To ensure the generalizability and fairness of the model comparison, we tested three generation scenarios: (1) “Generating floor plans containing one bedroom, one living room, one kitchen, one bathroom, one balcony”; (2) “Generating floor plans containing two bedrooms, one living room, one kitchen, one bathroom, one balcony”; (3) “Generating floor plans containing three bedrooms, one living room, one kitchen, one bathroom, one balcony”. We let each of the above models generate 1000 floor plans, and then we use RFP-A and existing evaluation metrics to conduct evaluations.
The evaluation results are shown in Table 7. First, we evaluated the accuracy of the generation, i.e., the percentage of the generated plans that meet the design requirements. For simplicity and fairness for models with different forms of input, we only evaluated the accuracy regarding room numbers here. Then, we evaluated the diversity of the generated plans that meet the design requirements using the number of categories in each step. Additionally, we calculated the values of existing evaluation metrics.

5.1. Accuracy

Since we defined the numbers of each room type as the design requirement, the accuracy here is calculated as the number of generated plans with the correct room numbers over the total number of generated plans. Surprisingly, only HouseDiffusion and FloorplanDiffusion have reasonable accuracies, higher than 90% for all three scenarios, while the accuracies of the other four models are rather low, below or around 60% for any of the three scenarios.
Among the three models based on graph inputs, the superiority of HouseDiffusion in accuracy is likely because it is based on diffusion structure, which is more advanced and stable than the older GAN structure. The difference is particularly obvious for the most complicated three-bedroom scenario, where the accuracy of HouseGAN and HouseGAN++ drops below 10%, and that of HouseDiffusion still remains above 90%.
FloorplanDiffusion, the other highly accurate model, is also based on diffusion, further indicating the good capability of the diffusion structure in generating floor plans. Moreover, the input of FloorplanDiffusion is more flexible and intuitive, providing an alternative form of input that is effective in initiating floor plan generation in addition to the more commonly used graph.
Graph2Plan is partly rule-based, resulting in relatively low accuracy, while Tell2Design, the first model to generate floor plans based on natural language input, also has rather low accuracy, potentially because it is cross-modal. A more sophisticated model structure than its current Seq2Seq structure might help in improving the accuracy.

5.2. Diversity

The subsection focuses on the diversity of the correctly generated floor plans, i.e., the categories of floor plans that have the prescribed room numbers of each room type. As for each scenario, the number of each room type was prescribed; there is only one correct category in Number, so the diversity of the models in Number is not distinguishable. However, to show the diversity of all generated results more comprehensively, the diversity of Number is denoted as A(T), which indicates that a total of T categories was generated, but only A categories met the requirements, while the remaining (T-A) categories were incorrectly generated. This shows that a large number of incorrect categories were generated by HouseGAN, HouseGAN++, Graph2Plan, and Tell2Design, suggesting poor compliance of the generation to design requirements, while for HouseDiffusion and FloorplanDiffusion, a much smaller number of incorrect categories were generated, showing much better compliance. These are in line with the results shown in Section 5.1.
For the diversity in Graph, a similar denotation of A(T) is used for the three models using graphs as input. HouseGAN can only generate one correct category because it does not generate doors between rooms, so it only has one type of room connectivity, while all other models generate doors and have two types of room connectivity: door connection and wall connection. FloorplanDiffusion has the best overall diversity in Graph, being the best in the one-bedroom and three-bedroom scenarios and the third best in the two-bedroom scenario, largely because of its flexible input that implies but does not limit the connectivity between rooms. It can also be noted that for the three models using graphs as input, a significant proportion of the generated categories was incorrect, even for the latest HouseDiffusion, suggesting that many of the generated results do not comply with the input graph, and the controllability of the models still needs improvement.
For the diversity in Location, HouseDiffusion achieves the highest values in all three scenarios, exhibiting the best diversity in Location, while for the other two models based on graph input, their diversity in Location drops significantly from the simple one-bedroom scenario to the more complicated three-bedroom scenario. This further suggests the strong capability of the diffusion model in generating rich results, especially in complicated scenarios. FloorplanDiffusion, which has the best overall diversity in Graph, performs mediocrely in diversity in Location, likely because its input includes strong indications of the room locations.
For the diversity in Geometry, the performance of the models fluctuates significantly in different scenarios, showing the sensitivity of geometric diversity to specific generation tasks. Overall, HouseGAN has the best diversity in Geometry, being the best in the one-bedroom and three-bedroom scenarios and the third best in the two-bedroom scenario. The following is Tell2Design, which is ranked second, first, and third in the three scenarios, respectively. FloorplanDiffusion has the least geometric diversity, being the last one in all three scenarios, likely because its input also includes strong indications of room geometries. On the contrary, however, this also suggests good controllability in room geometries as well as in room locations.
Overall, the diversity of the generated floor plans is affected by both the model input and the model structure. FloorplanDiffusion, HouseDiffusion, and HouseGAN have the best diversity in Graph, Location, and Geometry, respectively, while no model exhibits superior diversity across all aspects. This indicates the necessity of developing a more holistic, multi-modal model that can have good diversity in different aspects.

5.3. Existing Evaluation Metrics

FID is supposed to reflect the accuracy of the generated floor plans. However, the results show that it does not correspond well with the actual generation accuracy. For example, Tell2Design performs rather well in FID, being the second, first, and third for the three scenarios, respectively. However, its actual accuracy in terms of room numbers is relatively poor among the models. In addition, HouseGAN has the best FID value for the 3-bedroom scenario, but its accuracy in terms of room numbers is only 7%, the lowest among the six models.
GED evaluates the accuracy of the graphs of the generated floor plans. HouseDiffusion has the best values across all three scenarios, in line with the accuracies calculated using our methods, indicating good abilities of GED in evaluating generated floor plans. However, another accurate model, FloorplanDiffusion, has rather poor GED values, potentially because it does not take graphs as input. This indicates that GED alone can not make comprehensive evaluations of generated floor plans.
IoU evaluates the accuracy of the geometric features of generated floor plans. The values are rather low across all models and scenarios, likely due to their high sensitivity to the overall position of the floor plans (details in Section 4.1). Tell2Design performs rather well in IoU, being the best or the second-best for the three scenarios, but its actual accuracy in terms of room numbers is relatively poor. FloorplanDiffusion also has good IoU values, being the best for the one-bedroom and two-bedroom scenarios. However, this is potentially because its input includes clues of the locations of each room and thus also the overall position within the canvas.
PSNR evaluates the accuracy of fine-grained features in the generated floor plans, but similar to FID, it does not correspond well with the actual generation accuracy. Graph2Plan, which exhibits poor accuracy in terms of room numbers, especially in the one-bedroom scenario and the more complicated three-bedroom scenario, achieves the best PSNR for the above two scenarios. In the two-bedroom scenario, although PSNR and accuracy are both highest for FloorplanDiffusion, we find that the trends for other models still do not align well. This suggests that PSNR, as a metric for evaluating image quality, is not suitable for assessing residential floor plans.
SSIM reflects the accuracy of coarse-grained features in the generated floor plans. Its values are rather similar and close to one for all models and all scenarios, indicating that it is not capable of making meaningful evaluations on generated floor plans.

6. Conclusions and Future Prospects

Conclusions: To address the lack of tailored evaluation tools for AI-generated residential floor plans, we propose Residential Floor Plan Assessment (RFP-A), a systematic and comprehensive framework specifically designed for this purpose.
We then conducted extensive comparisons with existing metrics involving case studies, correlation analysis, and computational efficiency assessments, showing that RFP-A has the following advantages:
(1)
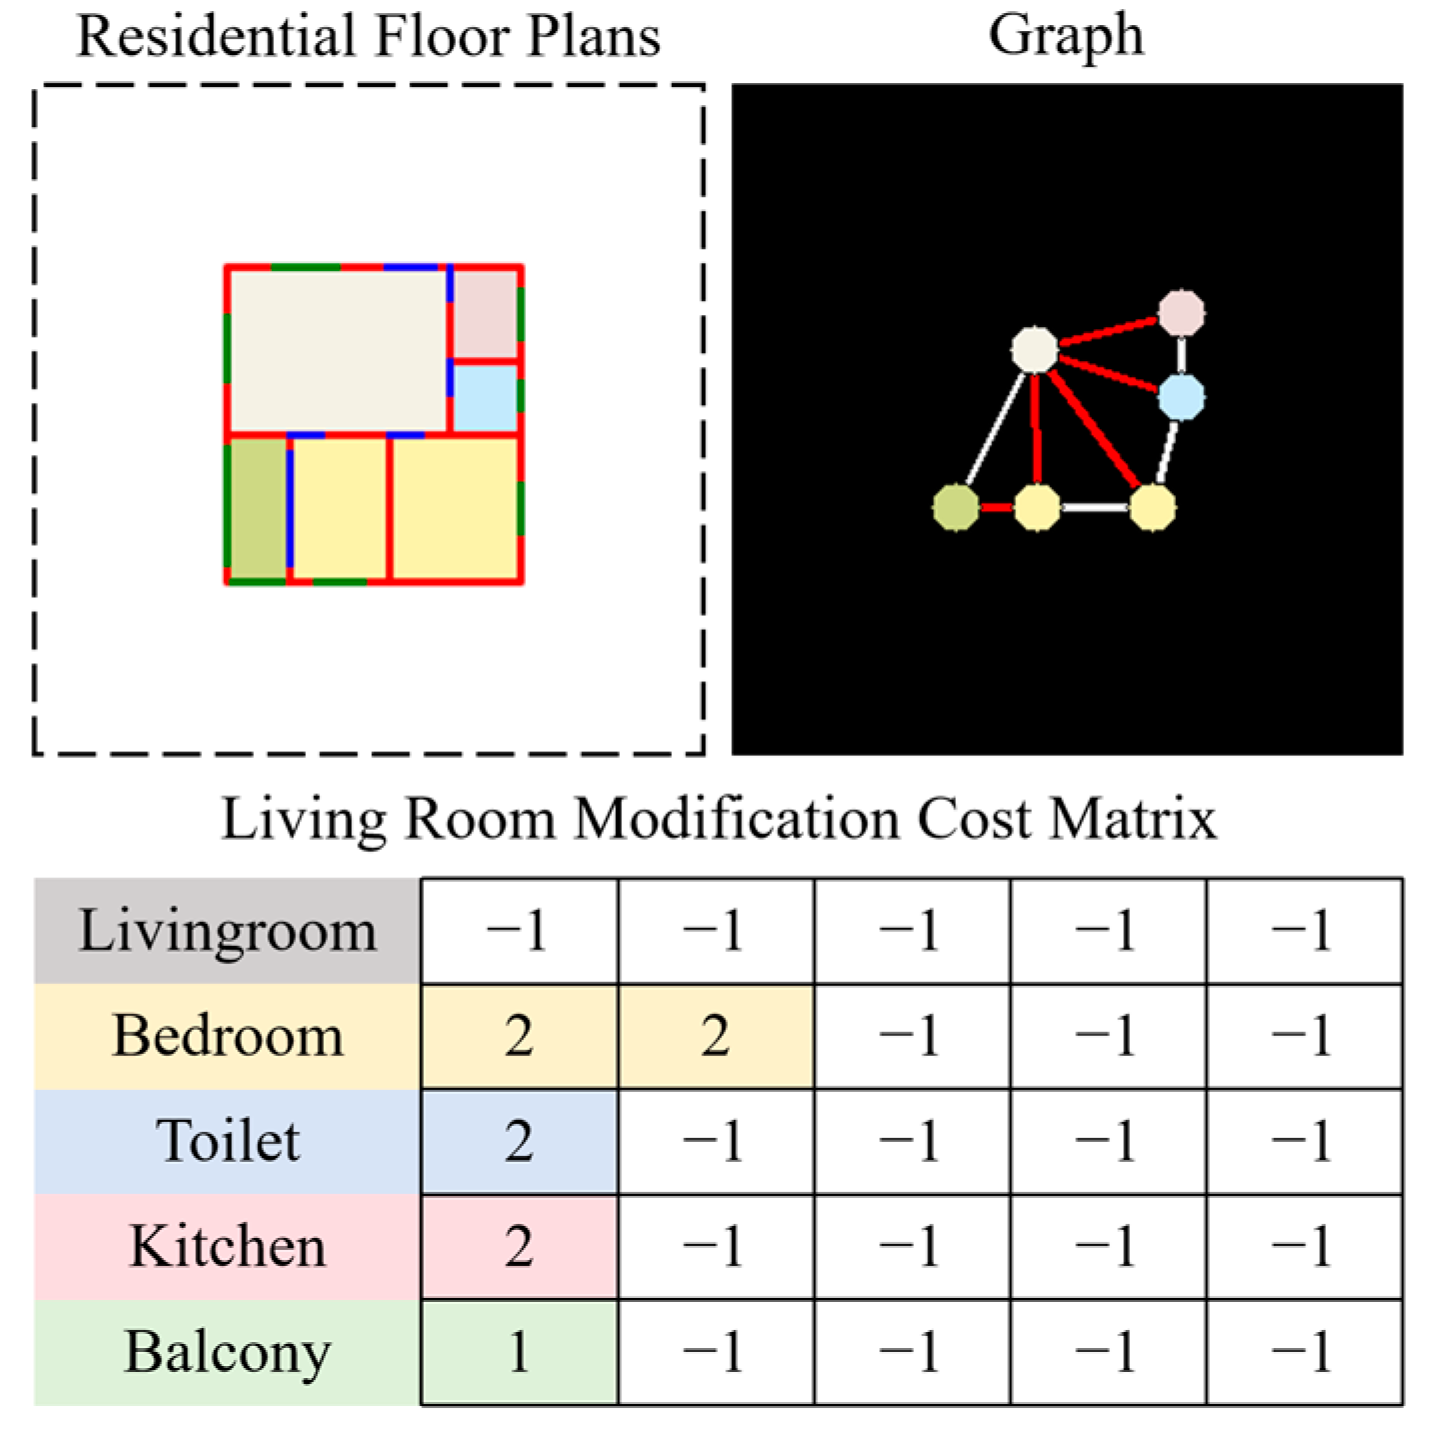
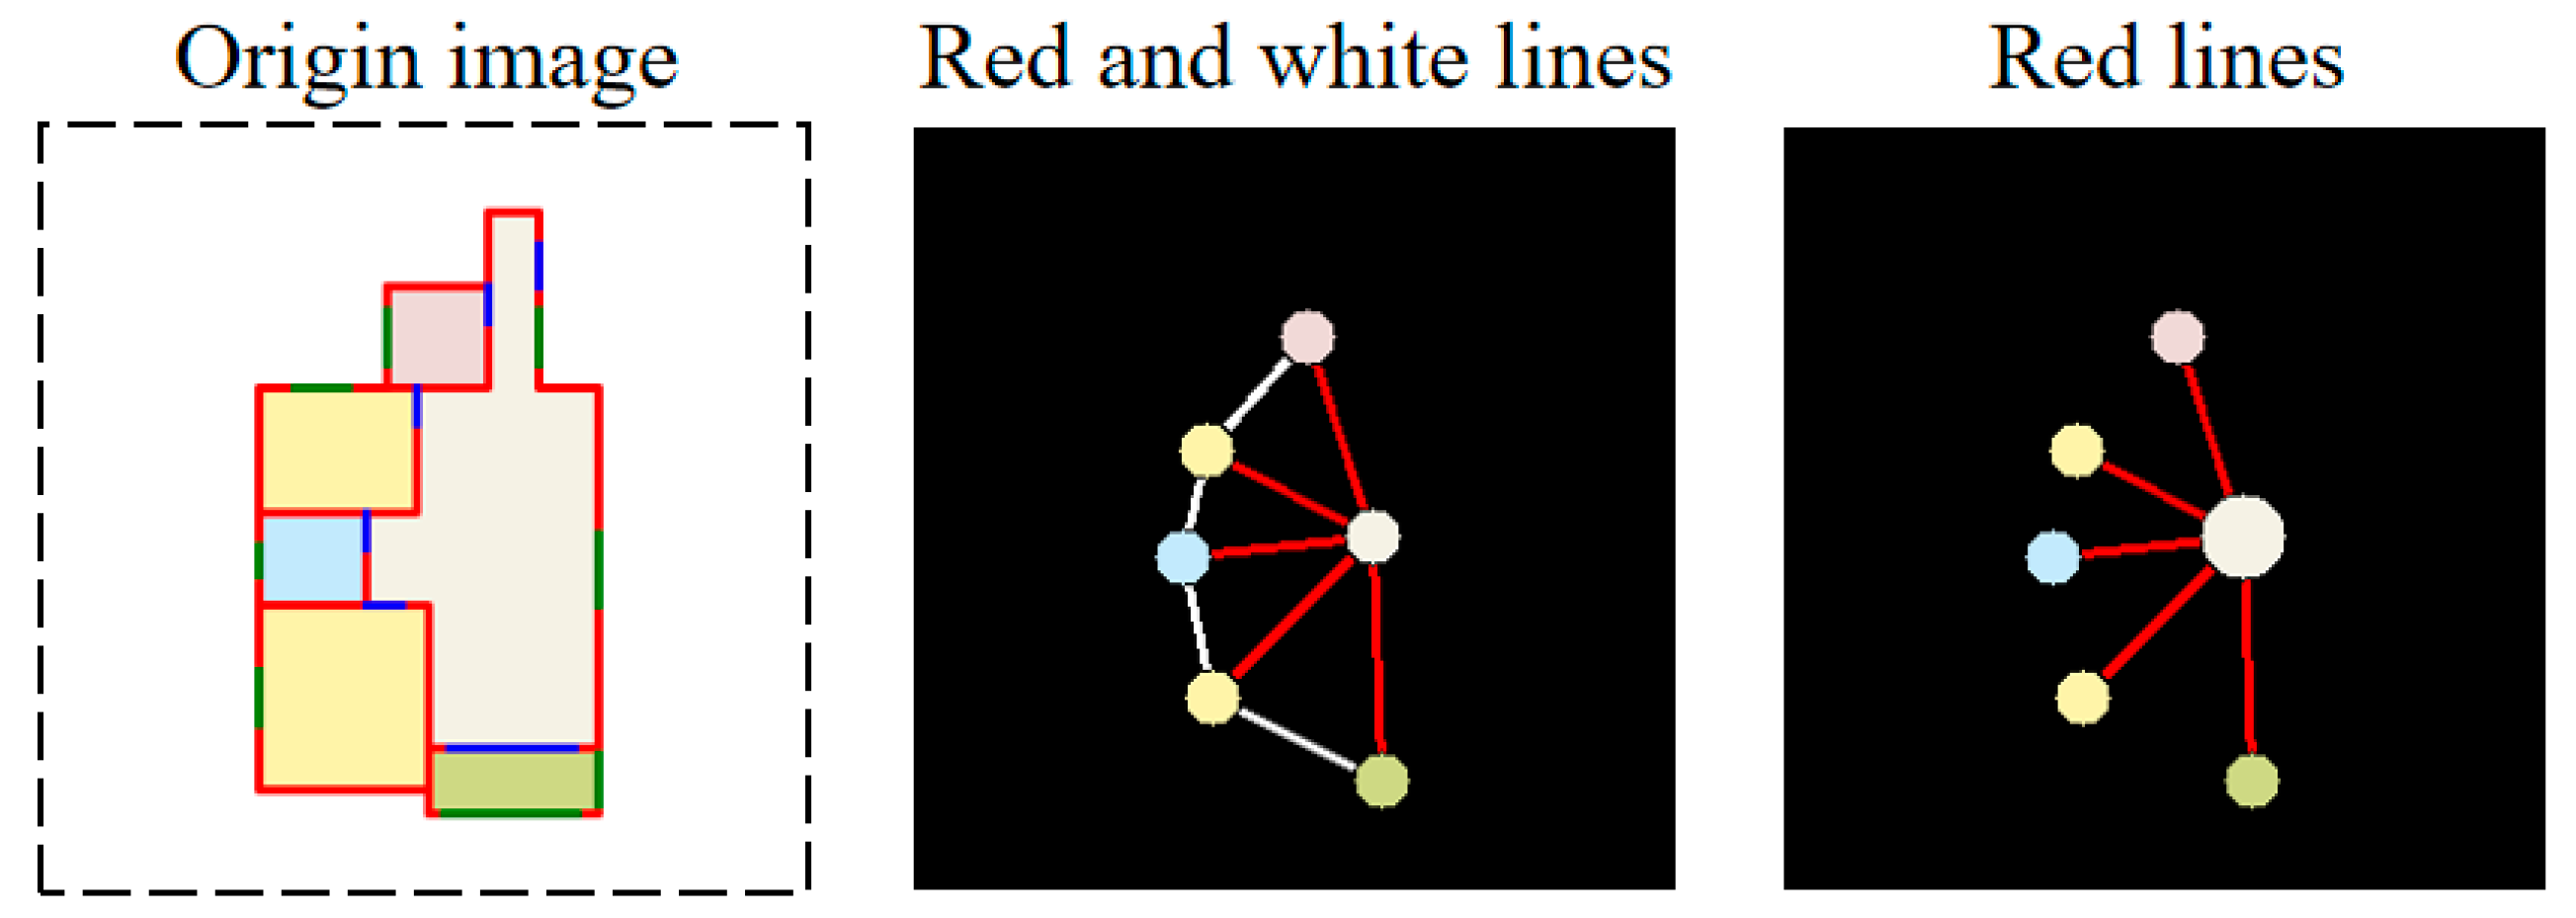
RFP-A includes four key evaluation steps: (1) room number compliance, (2) connectivity based on a refined GED, (3) room locations via a rotated coordinate system, and (4) geometric features using a revised IoU. This structure enables a comprehensive and structured evaluation.
(2)
It can assess both the accuracy and diversity of generated floor plans, while most existing metrics can only evaluate the accuracy.
(3)
Its stepwise and trapezoidal structure also ensures interpretability, which is lacking in existing metrics. This makes it easier for users to filter the designs they want from a vast number of generated options.
(4)
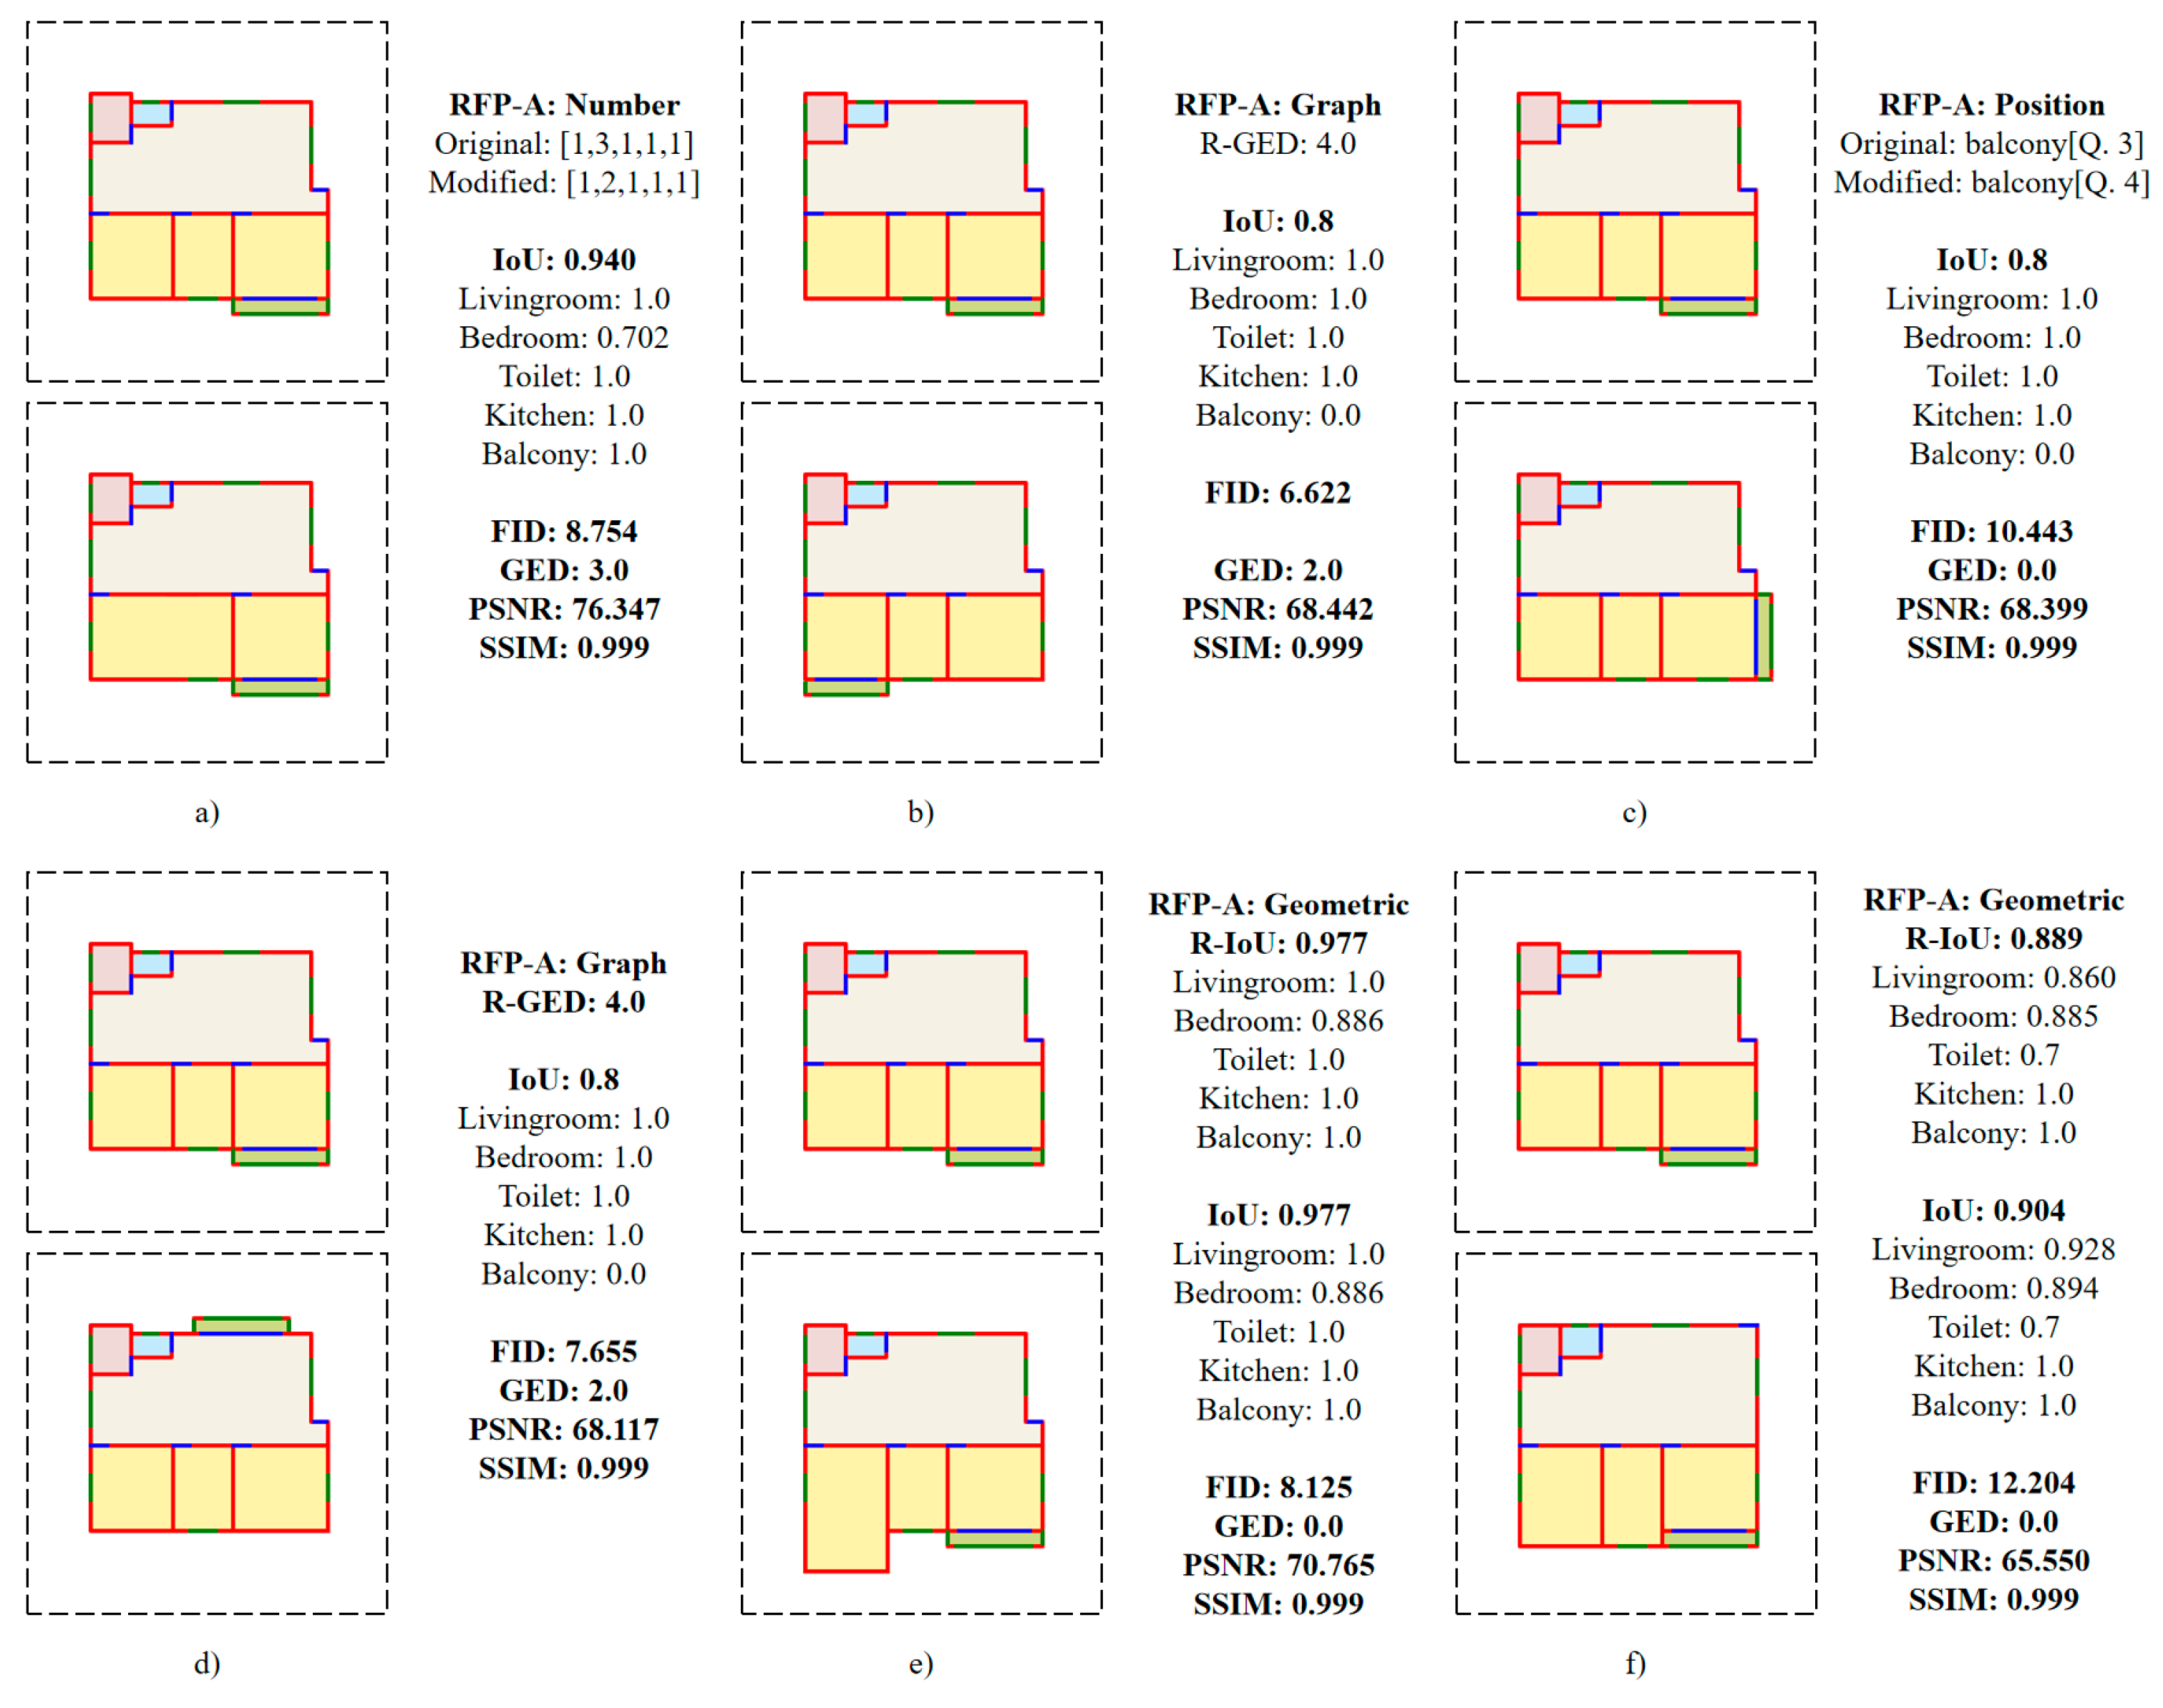
It is rather sensitive to key changes in residential floor plans, such as changes in room numbers and room connectivity. Meanwhile, it is insensitive to less important information, including changes in the overall location within the canvas and different levels of pixel noise, providing more detailed and robust evaluations than existing metrics.
(5)
It has improved computational efficiency mainly thanks to the revision of GED.
Finally, we evaluated the performance of six existing generative models for residential floor plans using RFP-A and found the following:
(1)
Among the six evaluated models, only HouseDiffusion and FloorplanDiffusion achieved over 90% accuracy in room number compliance, highlighting the advantage of diffusion-based structures.
(2)
Existing evaluation metrics do not correspond well with the actual generation accuracy, further addressing the necessity and importance of establishing RFP-A.
(3)
The diversity of the generated plans is affected by both the model input and the model structure. No model exhibits superior diversity across all aspects, indicating the necessity of developing a more holistic, multi-modal model.
This study contributes a robust evaluation framework that supports more reliable and comprehensive assessment of AI-generated residential plans, facilitating future improvements in generative model performance. It also assists architects in managing and filtering large volumes of generated designs through structured, interpretable classification.
Limitations: This study serves as a pilot investigation into the evaluation of generated floor plans, and there are still areas of improvement to be addressed in future studies, such as the following:
(1)
The current RFP-A only includes the most essential four aspects of design requirements in residential floor plans, while we aim to expand the scope of requirements in future studies, such as the level of privacy between rooms and energy efficiency of the residence.
(2)
We only include rule-based methods in designing the current RFP-A, which is effective only for well-definable design considerations. Future work will explore the integration of expert knowledge and large language models to evaluate subjective design qualities such as esthetics and spatial experience. This presents new challenges in quantifying implicit design intentions and balancing them with functional and physical requirements.
(3)
In the current evaluation of existing models for residential plan generation, we only assessed the accuracy in terms of room numbers. In future studies, we will test more generation scenarios involving additional design requirements so that we can reveal the accuracy of the generated plans in terms of graph, location, and geometry.
(4)
Our current method primarily focuses on evaluating the diversity and accuracy of AI-generated models and, as such, does not yet account for complex physical factors present in real-world residential designs, such as natural ventilation or lighting. Future research will integrate these physical performance aspects to provide a more complete assessment of the generated floor plans.

Author Contributions

Conceptualization, P.Z. and S.L.; methodology, P.Z., J.Y. and S.L.; software, P.Z. and J.Y.; validation, Y.G., J.L. and Z.J.; formal analysis, P.Z., J.Y. and S.L.; investigation, P.Z. and J.Y.; resources, S.L.; data curation, S.L.; writing—original draft preparation, P.Z. and J.Y.; writing—review and editing, P.Z., J.Y. and S.L.; visualization, P.Z.; supervision, S.L.; project administration, S.L.; funding acquisition, S.L. All authors have read and agreed to the published version of the manuscript.

Funding

This paper is supported by the Guangdong Basic and Applied Basic Research Foundation (2024A1515012595), Department of Education of Guangdong Province (2023ZDZX4078); and Shenzhen Science and Technology Innovation Committee (WDZC20231129201240001).

Data Availability Statement

The raw data supporting the conclusions of this article will be made available by the authors on request.

Conflicts of Interest

The authors declare no conflict of interest.

References

  1. Zeng, P.; Hu, G.; Zhou, X.; Li, S.; Liu, P.; Liu, S. Muformer: A long sequence time-series forecasting model based on modified multi-head attention. Knowl. Based Syst. 2022, 254, 109584. [Google Scholar] [CrossRef]
  2. Yin, J.; He, Y.; Zhang, M.; Zeng, P.; Wang, T.; Lu, S.; Wang, X. Promptlnet: Region-adaptive aesthetic enhancement via prompt guidance in low-light enhancement net. arXiv 2025, arXiv:2503.08276. [Google Scholar] [CrossRef]
  3. Zhang, M.; Shen, Y.; Yin, J.; Lu, S.; Wang, X. ADAGENT: Anomaly Detection Agent with Multimodal Large Models in Adverse Environments. IEEE Access 2024, 12, 172061–172074. [Google Scholar] [CrossRef]
  4. Zeng, P.; Hu, G.; Zhou, X.; Li, S.; Liu, P. FECAM: Frequency enhanced channel attention mechanism for time series forecasting. Adv. Eng. Inform. 2023, 58, 102158. [Google Scholar] [CrossRef]
  5. Zeng, P.; Gao, W.; Li, J.; Yin, J.; Chen, J.; Lu, S. Seformer: A long sequence time-series forecasting model based on binary position encoding and information transfer regularization. Appl. Intell. 2023, 53, 15747–15771. [Google Scholar] [CrossRef]
  6. Zeng, P.; Gao, W.; Li, J.; Yin, J.; Chen, J.; Lu, S. Automated residential layout generation and editing using natural language and images. Autom. Constr. 2025, 174, 106133. [Google Scholar] [CrossRef]
  7. Yin, J.; Gao, W.; Li, J.; Xu, P.; Wu, C.; Lin, B.; Lu, S. ArchiDiff: Interactive design of 3D architectural forms generated from a single image. Comput. Ind. 2025, 168, 104275. [Google Scholar] [CrossRef]
  8. Zeng, P.; Jiang, M.; Wang, Z.; Li, J.; Yin, J.; Lu, S. CARD: Cross-modal Agent Framework for Generative and Editable Residential Design. In Proceedings of the Name of the NeurIPS 2024 Workshop on Open-World Agents, Vancouver, BC, Canada, 14 December 2024; Available online: https://openreview.net/forum?id=cYQPfdMJHQ (accessed on 12 May 2025).
  9. Luo, Z.; Huang, W. Floorplangan: Vector residential floorplan adversarial generation. Autom. Constr. 2022, 142, 104470. [Google Scholar] [CrossRef]
  10. Gao, W.; Lu, S.; Zhang, X.; He, Q.; Huang, W.; Lin, B. Impact of 3d modeling behavior patterns on the creativity of sustainable building design through process mining. Autom. Constr. 2023, 150, 104804. [Google Scholar] [CrossRef]
  11. Zhang, M.; Yin, J.; Zeng, P.; Shen, Y.; Lu, S.; Wang, X. TSCnet: A text-driven semantic-level controllable framework for customized low-light image enhancement. Neurocomputing 2025, 625, 129509. [Google Scholar] [CrossRef]
  12. Zhang, M.; Shen, Y.; Li, Z.; Pan, G.; Lu, S. A retinex structure-based low-light enhancement model guided by spatial consistency. In Proceedings of the 2024 IEEE International Conference on Robotics and Automation (ICRA), Yokohama, Japan, 13–17 May 2024; pp. 2154–2161. [Google Scholar]
  13. Gao, W.; Wu, C.; Huang, W.; Lin, B.; Su, X. A data structure for studying 3d modeling design behavior based on event logs. Autom. Constr. 2021, 132, 103967. [Google Scholar] [CrossRef]
  14. Cavka, H.B.; Staub-French, S.; Poirier, E.A. Developing owner information requirements for BIM-enabled project delivery and asset management. Autom. Constr. 2017, 83, 169–183. [Google Scholar] [CrossRef]
  15. Song, M.; Cai, J.; Xue, Y. From Technological Sustainability to Social Sustainability: An Analysis of Hotspots and Trends in Residential Design Evaluation. Sustainability 2023, 15, 10088. [Google Scholar] [CrossRef]
  16. Regenwetter, L.; Srivastava, A.; Gutfreund, D.; Ahmed, F. Beyond statistical similarity: Rethinking metrics for deep generative models in engineering design. Comput. Aided Des. 2023, 165, 103609. [Google Scholar] [CrossRef]
  17. Vidal, A.C. Deep Neural Network Models with Explainable Components for Urban Space Perception. Master’s Thesis, Pontificia Universidad Catolica de Chile, Santiago, Chile, 2021. [Google Scholar]
  18. Newberry, B. Efficiency Animals: Efficiency as an Engineering Value. In Engineering Identities, Epistemologies and Values: Engineering Education and Practice in Context; Springer: Cham, Switzerland, 2015; Volume 2, pp. 199–214. [Google Scholar]
  19. Khan, S.; Saquib, M.; Hussain, A. Quality issues related to the design and construction stage of a project in the Indian construction industry. Front. Eng. Built Environ. 2021, 1, 188–202. [Google Scholar] [CrossRef]
  20. Dandan, T.H.; Sweis, G.; Sukkari, L.S.; Sweis, R.J. Factors affecting the accuracy of cost estimate during various design stages. Journal of Engineering. Des. Technol. 2020, 18, 787–819. [Google Scholar] [CrossRef]
  21. Park, K.; Ergan, S.; Feng, C. Quality assessment of residential layout designs generated by relational Generative Adversarial Networks (GANs). Autom. Constr. 2024, 158, 105243. [Google Scholar] [CrossRef]
  22. Dehghan, R.; Ruwanpura, J. The mechanism of design activity overlapping in construction projects and the time-cost tradeoff function. Procedia Eng. 2011, 14, 1959–1965. [Google Scholar] [CrossRef]
  23. Lafhaj, Z.; Rebai, S.; AlBalkhy, W.; Hamdi, O.; Mossman, A.; Da Costa, A.A. Complexity in Construction Projects: A Literature Review. Buildings 2024, 14, 680. [Google Scholar] [CrossRef]
  24. Khoury, K.B. Effective communication processes for building design, construction, and management. Buildings 2019, 9, 112. [Google Scholar] [CrossRef]
  25. Carta, S. Self-organizing floor plans. Harv. Data Sci. Rev. 2021, 3, 1–35. [Google Scholar] [CrossRef]
  26. Lu, X.; Liao, W.; Huang, Y.; Zheng, Z.; Lin, Y. Automated Structural Design of Shear Wall Residential Buildings Using GAN-Based Machine Learning Algorithm. Research Square 2020. [Google Scholar] [CrossRef]
  27. Heusel, M.; Ramsauer, H.; Unterthiner, T.; Nessler, B.; Hochreiter, S. Gans trained by a two time-scale update rule converge to a local nash equilibrium. Adv. Neural Inf. Process. Syst. 2017, 30, 6629–6640. [Google Scholar] [CrossRef]
  28. Blumenthal, D.B.; Gamper, J. On the exact computation of the graph edit distance. Pattern Recognit. Lett. 2020, 134, 46–57. [Google Scholar] [CrossRef]
  29. Gao, X.; Xiao, B.; Tao, D.; Li, X. A survey of graph edit distance. Pattern Anal. Appl. 2010, 13, 113–129. [Google Scholar] [CrossRef]
  30. Tjoa, E.; Guan, C. A survey on explainable artificial intelligence (xai): Toward medical xai. IEEE Trans. Neural Netw. Learn. Syst. 2020, 32, 4793–4813. [Google Scholar] [CrossRef]
  31. Carvalho, D.V.; Pereira, E.M.; Cardoso, J.S. Machine learning interpretability: A survey on methods and metrics. Electronics 2019, 8, 832. [Google Scholar] [CrossRef]
  32. Hu, R.; Huang, Z.; Tang, Y.; Van Kaick, O.; Zhang, H.; Huang, H. Graph2plan: Learning floorplan generation from layout graphs. ACM Trans. Graph. 2020, 39, 118. [Google Scholar] [CrossRef]
  33. Shabani, M.A.; Hosseini, S.; Furukawa, Y. Housediffusion: Vector floorplan generation via a diffusion model with discrete and continuous denoising. In Proceedings of the IEEE/CVF Conference on Computer Vision and Pattern Recognition, Seattle, WA, USA, 16–22 June 2024; pp. 5466–5475. [Google Scholar] [CrossRef]
  34. Nauata, N.; Hosseini, S.; Chang, K.-H.; Chu, H.; Cheng, C.-Y.; Furukawa, Y. House-gan++: Generative adversarial layout refinement network towards intelligent computational agent for professional architects. In Proceedings of the IEEE/CVF Conference on Computer Vision and Pattern Recognition, Nashville, TN, USA, 20–25 June 2021; pp. 13632–13641. [Google Scholar] [CrossRef]
  35. Nauata, N.; Chang, K.-H.; Cheng, C.-Y.; Mori, G.; Furukawa, Y. House-gan: Relational generative adversarial networks for graph-constrained house layout generation. In Computer Vision–ECCV 2020, Proceedings of the16th European Conference, Glasgow, UK, 23–28 August 2020; Proceedings, Part I 16; Springer International Publishing: Cham, Switzerland, 2020; pp. 162–177. [Google Scholar] [CrossRef]
  36. Leng, S.; Zhou, Y.; Dupty, M.H.; Lee, W.S.; Joyce, S.; Lu, W. Tell2Design: A Dataset for Language-Guided Floor Plan Generation. In Proceedings of the 61st Annual Meeting of the Association for Computational Linguistics, Toronto, ON, Canada, 9–14 July 2023; Volume 1, pp. 14680–14697. [Google Scholar] [CrossRef]
  37. Chang, K.H.; Cheng, C.Y.; Luo, J.; Murata, S.; Nourbakhsh, M.; Tsuji, Y. Building-gan: Graph-conditioned architectural volumetric design generation. In Proceedings of the IEEE/CVF International Conference on Computer Vision, Montreal, QC, Canada, 10–17 October 2021; pp. 11956–11965. [Google Scholar] [CrossRef]
  38. Zeng, P.; Gao, W.; Yin, J.; Xu, P.; Lu, S. Residential floor plans: Multi-conditional automatic generation using diffusion models. Autom. Constr. 2024, 162, 105374. [Google Scholar] [CrossRef]
  39. Wang, L.; Liu, J.; Zeng, Y.; Cheng, G.; Hu, H.; Hu, J.; Huang, X. Automated building layout generation using deep learning and graph algorithms. Autom. Constr. 2023, 154, 105036. [Google Scholar] [CrossRef]
  40. Wu, W.; Fu, X.-M.; Tang, R.; Wang, Y.; Qi, Y.-H.; Liu, L. Data-driven interior plan generation for residential buildings. ACM Trans. Graph. 2019, 38, 1–12. [Google Scholar] [CrossRef]
  41. Kujala, S.; Roto, V.; Väänänen-Vainio-Mattila, K.; Karapanos, E.; Sinnelä, A. UX Curve: A method for evaluating long-term user experience. Interact. Comput. 2011, 23, 473–483. [Google Scholar] [CrossRef]
  42. Kim, S.; Ryu, H.; Kim, J. Automated and qualitative structural evaluation of floor plans for remodeling of apartment housing. J. Comput. Des. Eng. 2021, 8, 376–391. [Google Scholar] [CrossRef]
  43. van Engelenburg, C.C.; Khademi, S.; van Gemert, J.C. SSIG: A Visually-Guided Graph Edit Distance for Floor Plan Similarity. In Proceedings of the IEEE/CVF International Conference on Computer Vision, Paris, France, 2–6 October 2023; pp. 1573–1582. [Google Scholar] [CrossRef]
  44. Davis, L.; Papageorgiou, S. Complementary strengths? Evaluation of a hybrid human-machine scoring approach for a test of oral academic English. Assess. Educ. Princ. Policy Pract. 2021, 28, 437–455. [Google Scholar] [CrossRef]
  45. Ravenscroft, J.; Liakata, M.; Clare, A.; Duma, D. Measuring scientific impact beyond academia: An assessment of existing impact metrics and proposed improvements. PLoS ONE 2017, 12, e0173152. [Google Scholar] [CrossRef]
  46. Lu, M.; Song, D.; Shi, D.; Liu, J.; Wang, L. Effect of high-rise residential building layout on the spatial vertical wind environment in Harbin, China. Buildings 2022, 12, 705. [Google Scholar] [CrossRef]
  47. Bafna, S.; Maitra, K.K.; Lim, Y.; Shah, M.; Chen, Y.A. Association between home layout connectivity and cognitive ability in community dwelling older adults: Implication for occupational therapy. J. Des. Resil. Archit. Plan. 2021, 2, 18–33. [Google Scholar] [CrossRef]
  48. Nachar, N. The Mann-Whitney U: A test for assessing whether two independent samples come from the same distribution. Tutor. Quant. Methods Psychol. 2008, 4, 13–20. [Google Scholar] [CrossRef]
  49. Nick, T.G. Descriptive statistics. In Topics in Biostatistics; Springer: Cham, Switzerland, 2007; pp. 33–52. [Google Scholar] [CrossRef]
  50. McHugh, M.L. The chi-square test of independence. Biochem. Medica 2013, 23, 143–149. [Google Scholar] [CrossRef]
  51. Sun, P.; Yan, F.; He, Q.; Liu, H. The Development of an Experimental Framework to Explore the Generative Design Preference of a Machine Learning-Assisted Residential Site Plan Layout. Land 2023, 12, 1776. [Google Scholar] [CrossRef]
  52. Lu, S.; Luo, Y.; Gao, W.; Lin, B. Supporting early-stage design decisions with building performance optimisation: Findings from a design experiment. J. Build. Eng. 2024, 82, 108298. [Google Scholar] [CrossRef]
  53. Lu, S.; Xu, W.; Chen, Y.; Yan, X. An experimental study on the acoustic absorption of sand panels. Appl. Acoust. 2017, 116, 238–248. [Google Scholar] [CrossRef]
  54. Ma, X.; Zeng, T.; Zhang, M.; Zeng, P.; Lin, B.; Lu, S. Street microclimate prediction based on Transformer model and street view image in high-density urban areas. Build. Environ. 2025, 269, 112490. [Google Scholar] [CrossRef]
  55. Zeng, T.; Ma, X.; Luo, Y.; Yin, J.; Ji, Y.; Lu, S. Improving outdoor thermal environmental quality through kinetic canopy empowered by machine learning and control algorithms. In Building Simulation; Tsinghua University Press: Beijing, China, 2025; pp. 1–22. [Google Scholar] [CrossRef]
  56. Huang, Y.; Zeng, T.; Jia, M.; Yang, J.; Xu, W.; Lu, S. Fusing Transformer and diffusion for high-resolution prediction of daylight illuminance and glare based on sparse ceiling-mounted input. Build. Environ. 2025, 267, 112163. [Google Scholar] [CrossRef]
  57. Luo, Y.; Ma, X.; Li, J.; Wang, C.; de Dear, R.; Lu, S. Outdoor space design and its effect on mental work performance in a subtropical climate. Build. Environ. 2025, 270, 112470. [Google Scholar] [CrossRef]
  58. Lu, S.; Yan, X.; Li, J.; Xu, W. The Influence of Shape Design on the Acoustic Performance of Concert Halls from the Viewpoint of Acoustic Potential of Shapes. ACTA Acust. United Acust. 2016, 102, 1027–1044. [Google Scholar] [CrossRef]
  59. Yu, T.; Li, J.; Jin, Y.; Wu, W.; Ma, X.; Xu, W.; Lu, S. Machine learning prediction on spatial and environmental perception and work efficiency using electroencephalography including cross-subject scenarios. J. Build. Eng. 2025, 99, 111644. [Google Scholar] [CrossRef]
  60. Li, J.; Lu, S.; Wang, Q. Graphical visualisation assist analysis of indoor environmental performance: Impact of atrium spaces on public buildings in cold climates. Indoor Built Environ. 2018, 27, 331–347. [Google Scholar] [CrossRef]
  61. Li, J.; Lu, S.; Wang, Q.; Tian, S.; Jin, Y. Study of passive adjustment performance of tubular space in subway station building complexes. Appl. Sci. 2019, 9, 834. [Google Scholar] [CrossRef]
  62. Li, J.; Song, Y.; Lv, S.; Wang, Q. Impact evaluation of the indoor environmental performance of animate spaces in buildings. Build. Environ. 2015, 94, 353–370. [Google Scholar] [CrossRef]
  63. Goodfellow, I.; Pouget-Abadie, J.; Mirza, M.; Xu, B.; Warde-Farley, D.; Ozair, S.; Courville, A.; Bengio, Y. Generative adversarial networks. Commun. ACM 2020, 63, 139–144. [Google Scholar] [CrossRef]
  64. Sanfeliu, A.; Fu, K.S. A distance measure between attributed relational graphs for pattern recognition. IEEE Trans. Syst. Man Cybern. 1983, 3, 353–362. [Google Scholar] [CrossRef]
  65. Wang, S.; Zeng, W.; Chen, X.; Ye, Y.; Qiao, Y.; Fu, C.W. ActFloor-GAN: Activity-guided adversarial networks for human-centric floorplan design. IEEE Trans. Vis. Comput. Graph. 2021, 29, 1610–1624. [Google Scholar] [CrossRef]
  66. Long, J.; Shelhamer, E.; Darrell, T. Fully convolutional networks for semantic segmentation. In Proceedings of the IEEE Conference on Computer Vision and Pattern Recognition, Boston, MA, USA, 7–12 June 2015; pp. 3431–3440. [Google Scholar] [CrossRef]
  67. Liberti, L.; Lavor, C.; Maculan, N.; Mucherino, A. Euclidean distance geometry and applications. SIAM Rev. 2014, 56, 3–69. [Google Scholar] [CrossRef]
  68. Wang, Z.; Bovik, A.C. A universal image quality index. IEEE Signal Process. Lett. 2002, 9, 81–84. [Google Scholar] [CrossRef]
  69. Wang, Z.; Bovik, A.C.; Sheikh, H.R.; Simoncelli, E.P. Image quality assessment: From error visibility to structural similarity. IEEE Trans. Image Process. 2004, 13, 600–612. [Google Scholar] [CrossRef] [PubMed]
  70. Yu, T.; Dai, W.; Liu, Z.; Fung, P. Vision Guided Generative Pre-trained Language Models for Multimodal Abstractive Summarization. In Proceedings of the 2021 Conference on Empirical Methods in Natural Language Processing, Punta Cana, Dominican Republic, 7–11 November 2021; pp. 3995–4007. [Google Scholar] [CrossRef]
  71. Long, X.; Zeng, J.; Meng, F.; Ma, Z.; Zhang, K.; Zhou, B.; Zhou, J. Generative Multi-Modal Knowledge Retrieval with Large Language Models. arXiv 2024, arXiv:2401.08206. [Google Scholar] [CrossRef]
  72. Xu, Y.; Juan, Y.-K. Design strategies for multi-unit residential buildings during the post-pandemic era in China. Front. Public Health 2021, 9, 761614. [Google Scholar] [CrossRef]
  73. Sadeghlou, S.; Emami, A. Residential preferences and satisfaction: A qualitative study using means-end chain theory. J. Hous. Built Environ. 2023, 38, 1711–1734. [Google Scholar] [CrossRef]
  74. Esfahankalateh, A.T.; Farrokhzad, M.; Saberi, O.; Ghaffarianhoseini, A. Achieving wind comfort through window design in residential buildings in cold climates, a case study in Tabriz city. Int. J. Low-Carbon Technol. 2021, 16, 502–517. [Google Scholar] [CrossRef]
  75. Tang, S.K. A review on natural ventilation-enabling façade noise control devices for congested high-rise cities. Appl. Sci. 2017, 7, 175. [Google Scholar] [CrossRef]
  76. Woolner, P.; Hall, E. Noise in schools: A holistic approach to the issue. Int. J. Environ. Res. Public Health 2010, 7, 3255–3269. [Google Scholar] [CrossRef]
  77. Haddad, R. Research and methodology for interior designers. Procedia-Soc. Behav. Sci. 2014, 122, 283–291. [Google Scholar] [CrossRef]
  78. Kistelegdi, I.; Horváth, K.R.; Storcz, T.; Ercsey, Z. Building geometry as a variable in energy, comfort, and environmental design optimization—A review from the perspective of architects. Buildings 2022, 12, 69. [Google Scholar] [CrossRef]
  79. Scuderi, G. Designing flexibility and adaptability: The answer to integrated residential building retrofit. Designs 2019, 3, 3. [Google Scholar] [CrossRef]
  80. Ranjan, R.; Grover, S.; Medya, S.; Chakaravarthy, V.; Sabharwal, Y.; Ranu, S. Greed: A neural framework for learning graph distance functions. Adv. Neural Inf. Process. Syst. 2022, 35, 22518–22530. [Google Scholar] [CrossRef]
  81. Moitra, A. Algorithmic Aspects of Machine Learning; Cambridge University Press: Cambridge, UK, 2018. [Google Scholar]
  82. Pearson, K., VII. Mathematical contributions to the theory of evolution.—III. Regression, heredity, and panmixia. Philos. Trans. R. Soc. London. Ser. A Contain. Pap. A Math. Phys. Character 1896, 187, 253–318. [Google Scholar] [CrossRef]
  83. Akoglu, H. User’s guide to correlation coefficients. Turk. J. Emerg. Med. 2018, 18, 91–93. [Google Scholar] [CrossRef]
Figure 1. RFP-A evaluation metrics structure diagram. (a) shows the graph structure obtained through the preprocessing of the residential floor plan. (b) shows the evaluation metrics structure, including Stage 1: classifying based on room numbers; Stage 2: classifying based on graph structure, with the black-background image on the left representing the graph; Stage 3: classifying based on room locations and orientations; and Stage 4: classifying based on room geometric features.
Buildings 15 01674 g001
Figure 2. Diagram of the 4-quadrant division of room locations based on a rotated coordinate system.
Buildings 15 01674 g002
Figure 3. Diagram of the modification cost matrix of a floor plan based on the residential floor plan (taking the living room as an example). The upper left corner is the residential floor plan, the upper right corner is the corresponding graph structure, and the lower part is the modification cost matrix diagram of the living room. This matrix indicates no direct connection to the living room itself, while showing connections through doors (red lines) to two bedrooms, one bathroom, and a kitchen, and connections through walls (white lines) to a balcony. In this matrix, door connections (red lines) are assigned a score of 2, wall connections (white lines) a score of 1, and −1 indicates no connection. In the modification cost matrix, the vertical axis represents different room types, while the horizontal axis corresponds to different indices of rooms of the same type.
Buildings 15 01674 g003
Figure 4. Diagram of RFP-IoU calculation. (a) shows the different calculation methods of the original IoU and RFP-IoU. (b) shows the RFP-IoU calculation process, which first decomposes each room of the residence, and then calculates the geometric feature differences between each room separately and finally averages the differences.
Buildings 15 01674 g004
Figure 5. Demonstration of using RFP-A to evaluate generated residential plans. (a) shows RFP-A can screen and classify the generated residential plans, while (b) shows the ten residential plans used in this demonstration.
Buildings 15 01674 g005
Figure 6. Performance of evaluation metrics when comparing generated and ground-truth plans. (a) different room numbers; (b) different graph features; (c) different overall locations; (d) different room shapes; (e) different levels of pixel noise. For each example, the first row shows the ground-truth plan, and the second row shows the generated plan.
Buildings 15 01674 g006
Figure 7. Fine-grained validation of RFP-A. (a) Delete a wall of the bedroom to merge two rooms into one; (bd) fine-tune the location of the balcony; (e) fine-tune the size of the bedroom; (f) fine-tune the size or shape of the rooms.
Buildings 15 01674 g007
Figure 8. Two-dimensional density visualization between evaluation metrics.
Buildings 15 01674 g008
Figure 9. Red-and-white line scenario and red line scenario.
Buildings 15 01674 g009
Figure 10. Input and output of the models. HouseGAN, HouseGAN++, and HouseDiffusion have graphs as input, Graph2Plan has room quantity constraint as input, Tell2Design has natural language description as input, and FloorplanDiffusion has instance as input. HouseGAN and Tell2Design do not have room connection information in the model output, while HouseGAN++, HouseDiffusion, Graph2Plan, and FloorplanDiffusion have room connection information.
Buildings 15 01674 g010
Table 2. The average number of edges of each room type based on the RPLAN dataset.
Room TypeLiving RoomBedroomBathroomKitchenBalcony
Number5.252.812.632.111.70
Table 3. Pearson correlation coefficient values between evaluation metrics.
Evaluation MetricsFIDGEDIoUPSNRSSIMRFP-GEDRFP-IoU
FID1.0−0.011−0.1340.0970.031−0.125−0.090
GED\1.0−0.157−0.274−0.2540.732−0.174
IoU\\1.00.2000.3210.0400.477
PSNR\\\1.00.966−0.2050.057
SSIM\\\\1.0−0.1600.074
RFP-GED\\\\\1.0−0.161
RFP-IoU\\\\\\1.0
Table 4. Comparison of single image evaluation efficiency between RFP-GED and GED.
Red-and-White Line ScenarioRed Line Scenario
MethodTime (ms)MethodTime (ms)
RFP-GED0.589RFP-GED0.486
GED4.026GED1.068
Table 5. Comparison of multi-image categorization efficiency of RFP-GED and GED.
100 Floor Plans1000 Floor Plans
MethodTime (s)MethodTime (s)
GED21.989GED2017.717
R F P G E D α 0.395 R F P G E D α 22.965
R F P G E D β 0.054 R F P G E D β 2.227
R F P G E D α : RFP-GED (refined version); R F P G E D β : RFP-GED (rough version).
Table 6. RFP-GED search order ablation experiment.
Red-White Line ScenarioRed Line Scenario
OrderTime (s)OrderTime (s)
Prescribed0.278Prescribed0.189
Reversed0.388Reversed0.231
Table 7. Evaluation results of RFP-A and existing evaluation metrics on mainstream residential generation models in three types of requirements. ↑ indicates that a higher value of the metric is better, while ↓ indicates that a lower value is better. T(A) indicates that the total of the A categories was generated, but only the T categories met the requirements. Bold text indicates the best values while underlined text indicates the second-best.
MethodAccuracy of Room Number↑DiversityFID↑GED↓IoU↑PSNR↑SSIM↑
NumberGraph↑Location↑Geometry↓
One bedroom, one living room, one kitchen, one bathroom, one balcony
HouseGAN56.7%1(58)1(26)3640.25337.621.90.12155.20.97
HouseGAN++57.6%1(50)83(205)3010.38137.96.10.11760.90.99
HouseDiffusion96.1%1(5)47(139)4650.28137.83.10.12962.00.99
Graph2Plan33.2%1(42)811990.45236.44.00.14163.70.99
Tell2Design36.4%1(33)792600.25524.212.20.27163.50.99
Floorplan Diffusion91.8%1(14)983310.47524.99.60.34460.20.99
Two bedrooms, one living room, one kitchen, one bathroom, one balcony
HouseGAN45.8%1(39)1(81)1770.57229.96.80.10054.40.97
HouseGAN++46.4%1(66)85(169)2240.44534.06.80.14261.70.99
HouseDiffusion95.4%1(5)73(142)4170.66330.23.10.13861.50.99
Graph2Plan63.8%1(27)2142600.61933.25.30.19863.90.99
Tell2Design49.8%1(39)1883440.28724.011.90.27563.50.99
Floorplan Diffusion98.2%1(12)1852430.79418.010.50.37964.70.99
Three bedrooms, one living room, one kitchen, one bathroom, one balcony
HouseGAN7%1(75)1(4)320.26923.922.90.12754.10.97
HouseGAN++8.1%1(77)58(61)270.56534.912.30.19161.00.99
HouseDiffusion91.0%1(5)107(210)4240.34133.64.40.15661.90.99
Graph2Plan34.9%1(45)1601560.60233.34.90.22264.30.99
Tell2Design16.7%1(42)611000.40624.212.10.27561.40.99
Floorplan Diffusion97.4%1(9)1642040.62825.915.70.22057.70.99
Disclaimer/Publisher’s Note: The statements, opinions and data contained in all publications are solely those of the individual author(s) and contributor(s) and not of MDPI and/or the editor(s). MDPI and/or the editor(s) disclaim responsibility for any injury to people or property resulting from any ideas, methods, instructions or products referred to in the content.

