1. Introduction
Environmental comfort in indoor spaces has been regulated from the four traditional physical domains of Indoor Environmental Quality (IEQ): thermal, air quality, lighting, and acoustics. The thermal parameter, in particular, is one of the core parameters for building design and is the most studied within the IEQ parameters in the built environment [
1,
2,
3]. This is partly because, according to surveys, occupants usually indicate that the thermal sensation is the most influential factor for their performance and behaviors [
4]. These considerations have promoted regulations and standards that provide environments considered “neutral" or statistically acceptable for “average” people [
5]. However, this approach tends to ignore the diversity of individual needs between users and within the same individual over time, which generates important limitations in people’s comfort and well-being [
6,
7].
Conventional thermal comfort models, such as the PMV/PPD and the Adaptive Comfort models, are based on population averages, but have a low power of prediction at an individual level [
8,
9,
10], which is why new options for flexibility and customization of the environment have emerged with the use of Personal Comfort Systems (PCS). These systems are equipment that heats and/or cools occupants without affecting the surrounding environment, from commonly used devices to innovative technologies, usually controlled by people [
11]. They have an individual approach that significantly improves people’s environmental comfort [
8,
12], with benefits related to health and productivity and possible energy savings for the building [
13].
As these systems are integrated into real environments, the need arises to develop models capable of learning and predicting their use based on multiple environmental and behavioral variables. In this respect, machine learning, particularly the Automatic Machine Learning (AutoML) approach, has proven to be a powerful tool for automating the development of complex predictive models. Here, platforms such as H2O AutoML allow multiple algorithms, such as Gradient Boosting Machines (GBM), Deep Neural Networks (DNNs), and Random Forests, to be trained, compared, and assembled automatically without requiring expert intervention at each stage of the process [
14,
15]. In addition, integrating interpretative techniques improves the model’s transparency and facilitates understanding each variable’s contribution to the final result [
16].
However, using AutoML is not without its challenges. Its high computational cost can represent a barrier in scenarios with limited resources, and its final performance is still highly dependent on the quality of the input data [
17,
18]. Similarly, its generalization ability can be affected in contexts with unstructured or noisy data, as is usually true in real-life environments [
19]. Various studies have explored the use of regression algorithms, neural networks, and clustering techniques to model the relationship between environmental conditions, individual preferences, and comfort devices [
8,
20,
21,
22]. In particular, the combination of the Internet of Things (IoT) and machine learning has made it possible to implement adaptive systems capable of responding in real time to changes in the environment or to the needs of occupants, with benefits in terms of both comfort and energy efficiency [
23]. In this context, this study aims to evaluate the use of models generated by H2O AutoML to predict the use of PCS in office buildings, considering a set of environmental, spatial, subjective perception, and personal characteristics variables. Through an empirical approach, the goal is to contribute to developing new personalized comfort models, evaluating their performance in real occupancy conditions, and using low-cost devices integrated into everyday office contexts [
24,
25]. This research aims to provide evidence on the feasibility of implementing personal comfort systems that respond dynamically to individual requirements, promoting healthier, adaptive, and energy-efficient work environments [
26] and becoming an alternative to conventional comfort models. It is hypothesized that it is possible to design predictive models using AutoML techniques trained with data collected in real occupancy conditions to accurately anticipate portable personal comfort systems use, even when facing dynamic variations in environmental conditions and individual preferences. If confirmed, this hypothesis would support the potential of machine learning as an effective tool in developing a new occupant-centered environmental control paradigm, promoting the design of more adaptive, comfortable, and energy-efficient work environments.
2. Materials and Methods
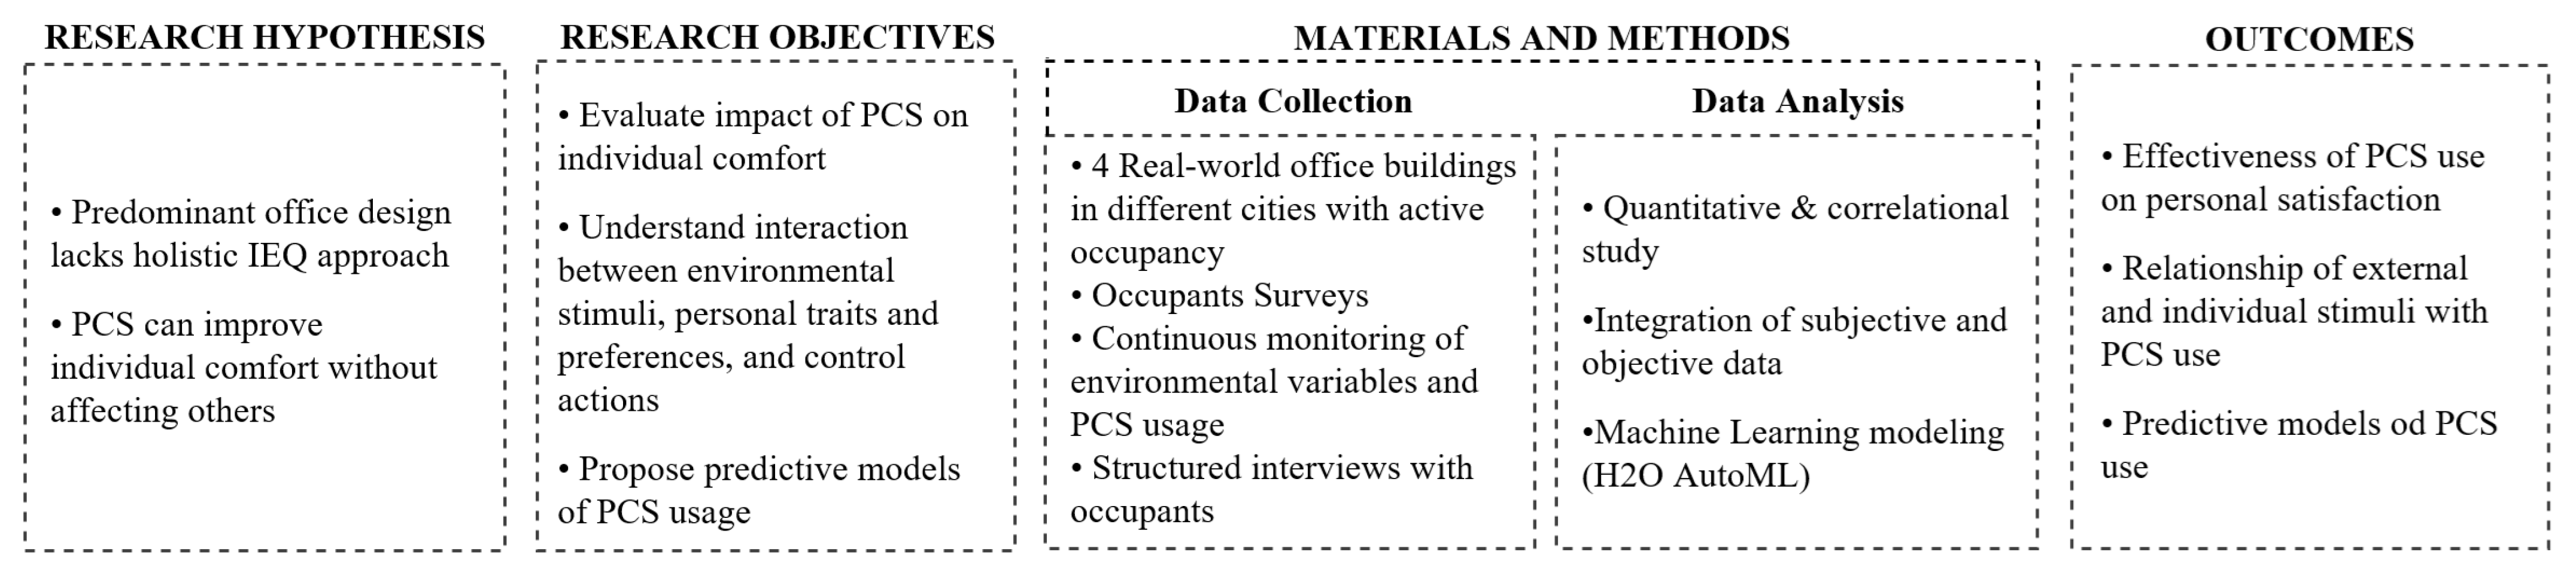
This study is grounded in the hypothesis that the predominant design of office spaces characterized by shared environments with centralized HVAC systems lacks a holistic approach to IEQ. As a result, such configurations are often insufficient to meet the diverse comfort needs of occupants. To address this limitation, the integration of PCS is proposed as a means to enhance individual comfort perceptions without negatively affecting others in the same environment. In addition, the study seeks to explore the synergistic and/or antagonistic interactions among physical-environmental stimuli, personal characteristics, and subjective perceptions that influence individual behaviors and actions.
Figure 1 illustrates the overall research framework, encompassing all phases from hypothesis formulation to data collection and analysis. However, the present article focuses specifically on the development and evaluation of predictive models for PCS usage. Additional findings related to environmental monitoring, user perception, and behavioral analysis are discussed in previous publications [
12,
27].
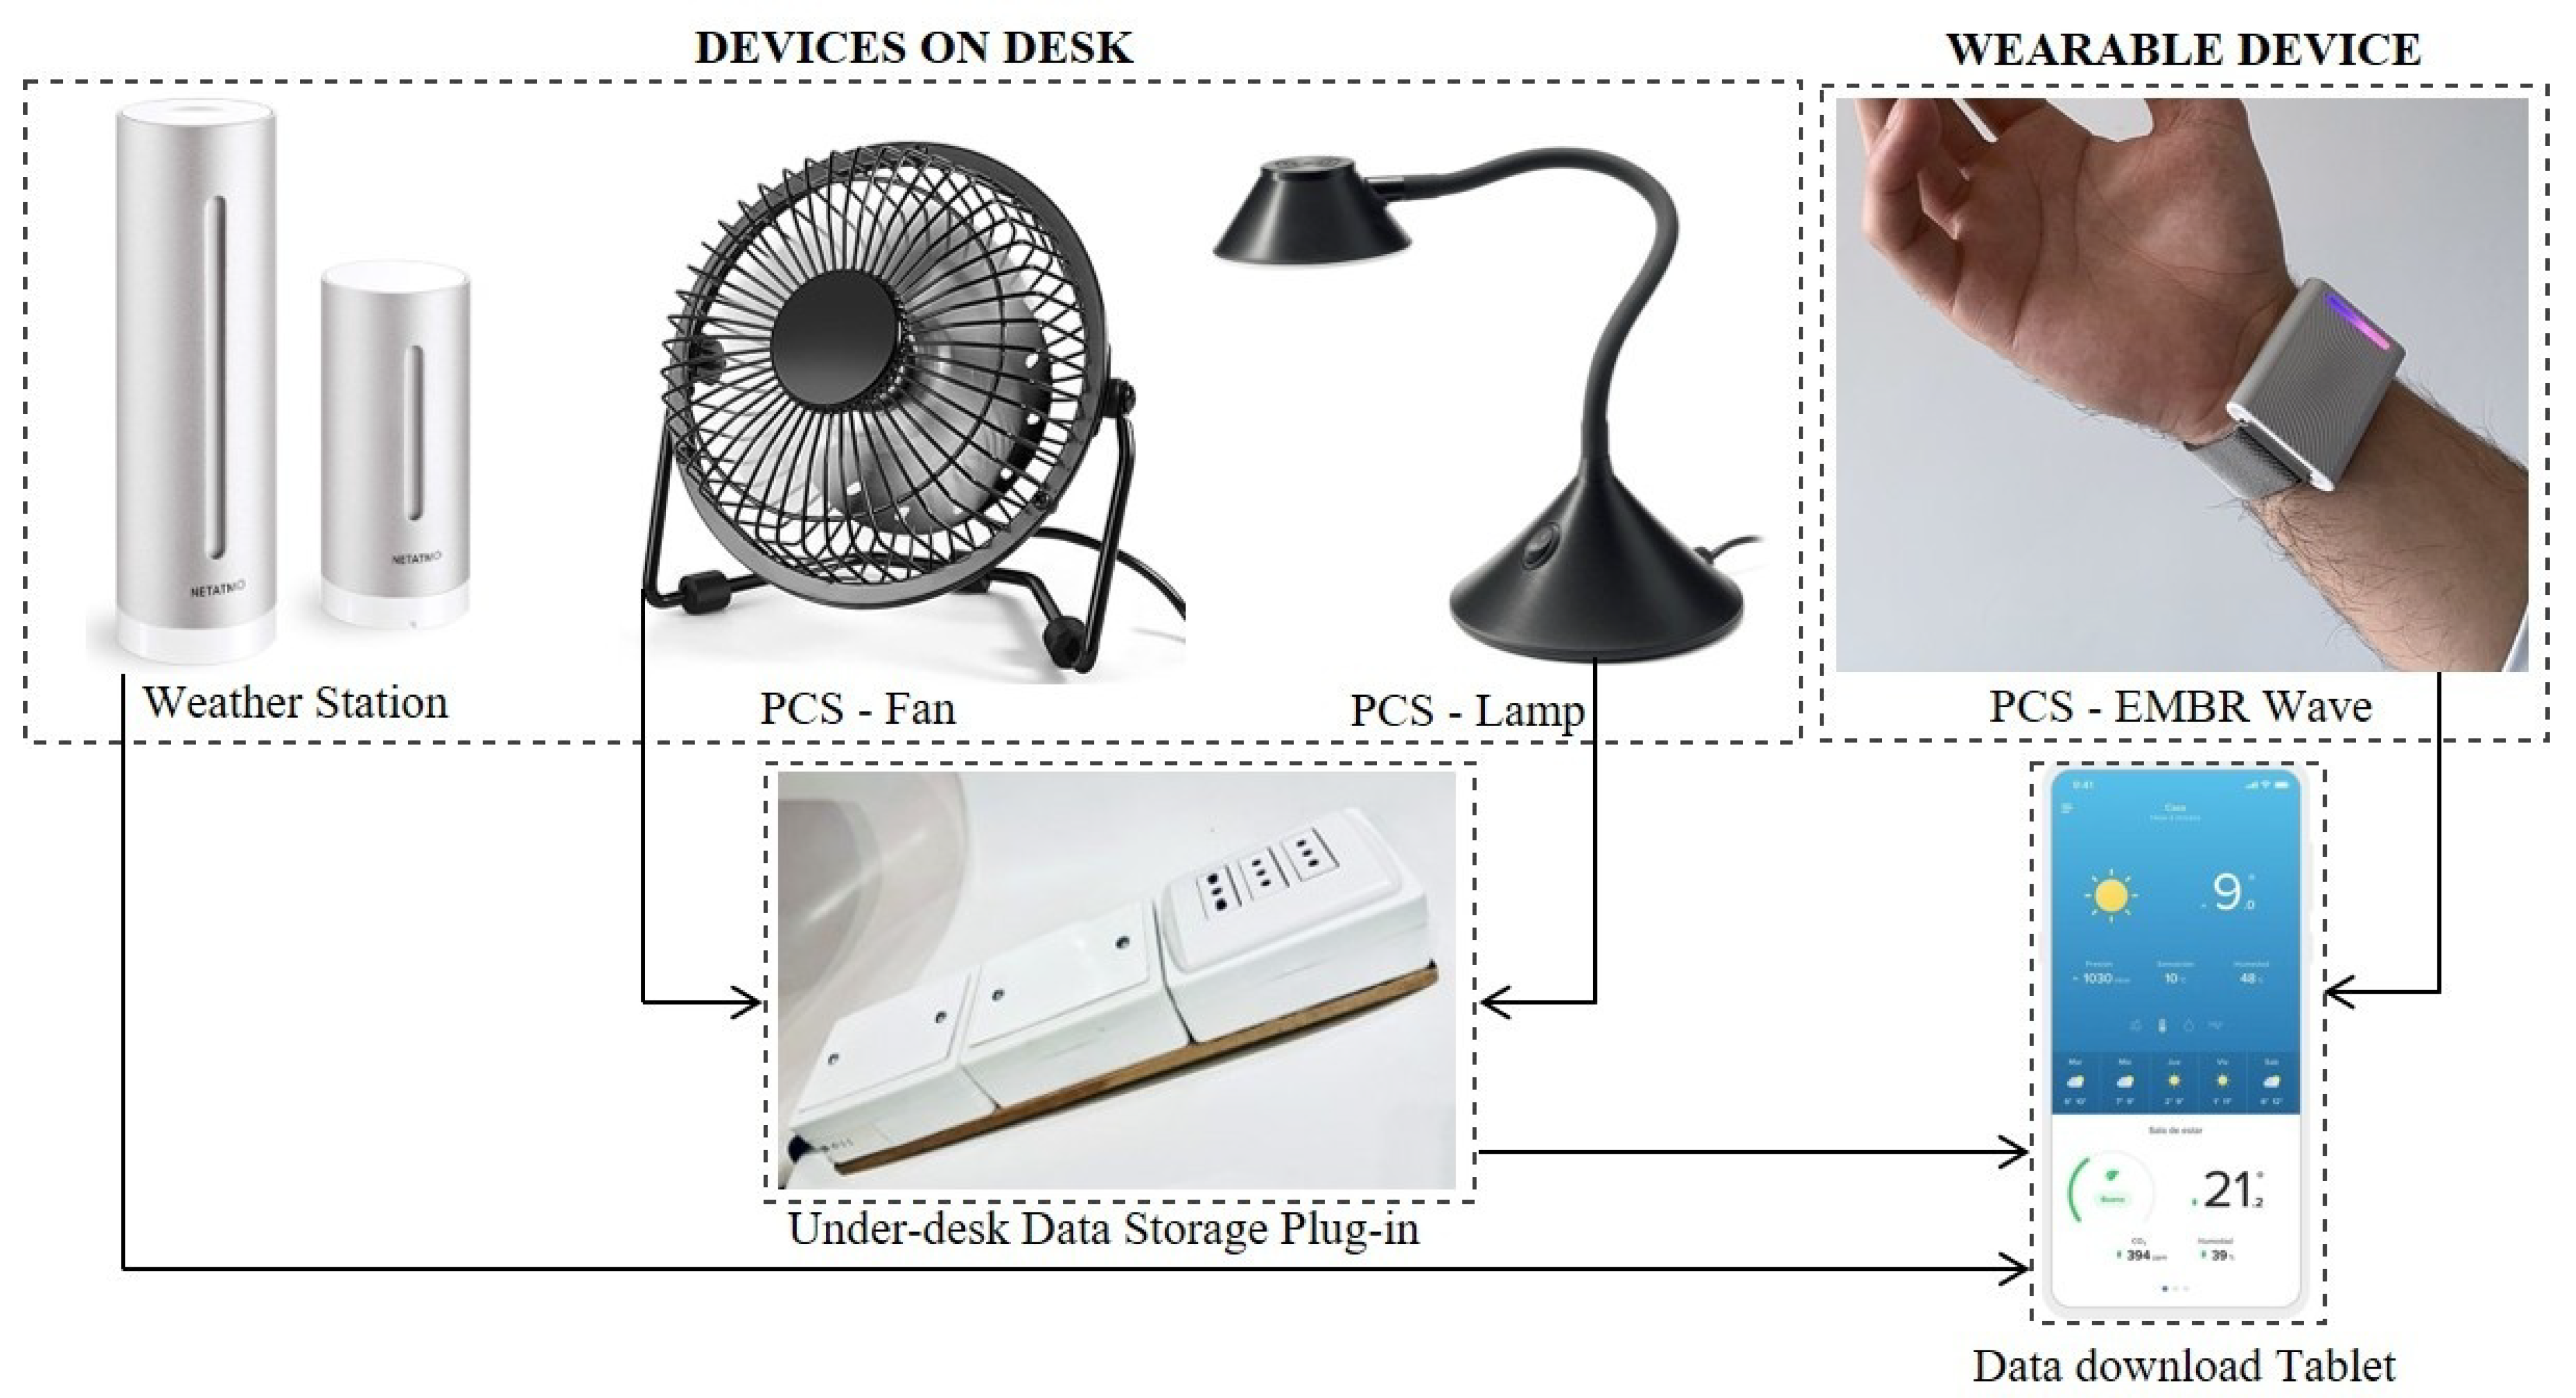
The field study was conducted in real office environments with active occupancy and involved the synchronous evaluation of three PCS: a desk fan, adjustable lighting lamps, and a wearable thermal regulation device, the Embr Wave wristband [
28]. Environmental monitoring was carried out using Netatmo smart weather stations installed at selected workstations. These were configured to record temperature, relative humidity (RH), and CO
2 concentration every five minutes, with a measurement uncertainty of ±0.3 °C and ±0.3%RH. In parallel, custom-developed smart plugs were used to automatically log PCS energy consumption and usage patterns (
Figure 2).
The research adopted a quantitative and correlational methodology, integrating continuous monitoring of environmental conditions and PCS operation with the administration of surveys and structured interviews. A validated questionnaire was used to collect data on occupants’ subjective perceptions of thermal comfort, indoor air quality, lighting, perceived control, and health, along with other relevant parameters.
Data collection was conducted in four office buildings located in different cities in Chile, during both summer and winter seasons, allowing the inclusion of varied climatic conditions in the analysis. Based on results obtained which indicated that PCS significantly improved immediate user satisfaction even under suboptimal environmental conditions, machine learning models were developed to predict PCS usage. These models, trained with field-collected data using AutoML techniques [
29,
30], enabled the identification of the key variables that influence the effective use of PCS devices.
2.1. Generation of Synthetic Data
A controlled data augmentation strategy was implemented to expand the available dataset for modeling, combining instance replication with the incorporation of random values generated from validated statistical distributions. This procedure began with a detailed statistical analysis of the original dataset, estimating key metrics, such as the mean, median, standard deviation, and the empirical probability distribution of each variable [
31]. Based on these distributions, new values were generated using random sampling methods [
32], aiming to preserve the statistical structure of the original database. This approach has been widely supported in the literature as an effective strategy in contexts with limited data availability [
33,
34]. Given that our original dataset included only 72 records, below the minimum of 200 observations recommended for stable AutoML performance according to LeDell and Poirier [
14], this synthetic data generation process was essential to ensure robust model training using H2O AutoML.
To make the augmented data more representative of real-world conditions, randomly missing values were introduced into selected variables. These were imputed using several strategies, including linear regression, random imputation, and the k-nearest neighbors (KNN) algorithm, which have shown good performance in similar data environments [
35,
36].
To verify that no significant differences existed between the real and simulated data, statistical hypothesis tests were conducted. Specifically, Student’s
t-tests were applied to compare the means of the original and synthetic datasets for the three target variables (wristband, fan, and lamp), using a significance level of
. The results (all
p-values > 0.88) indicated no statistically significant differences, thereby confirming the representativeness and integrity of the expanded dataset [
37].
2.2. H2O Automated Machine Learning
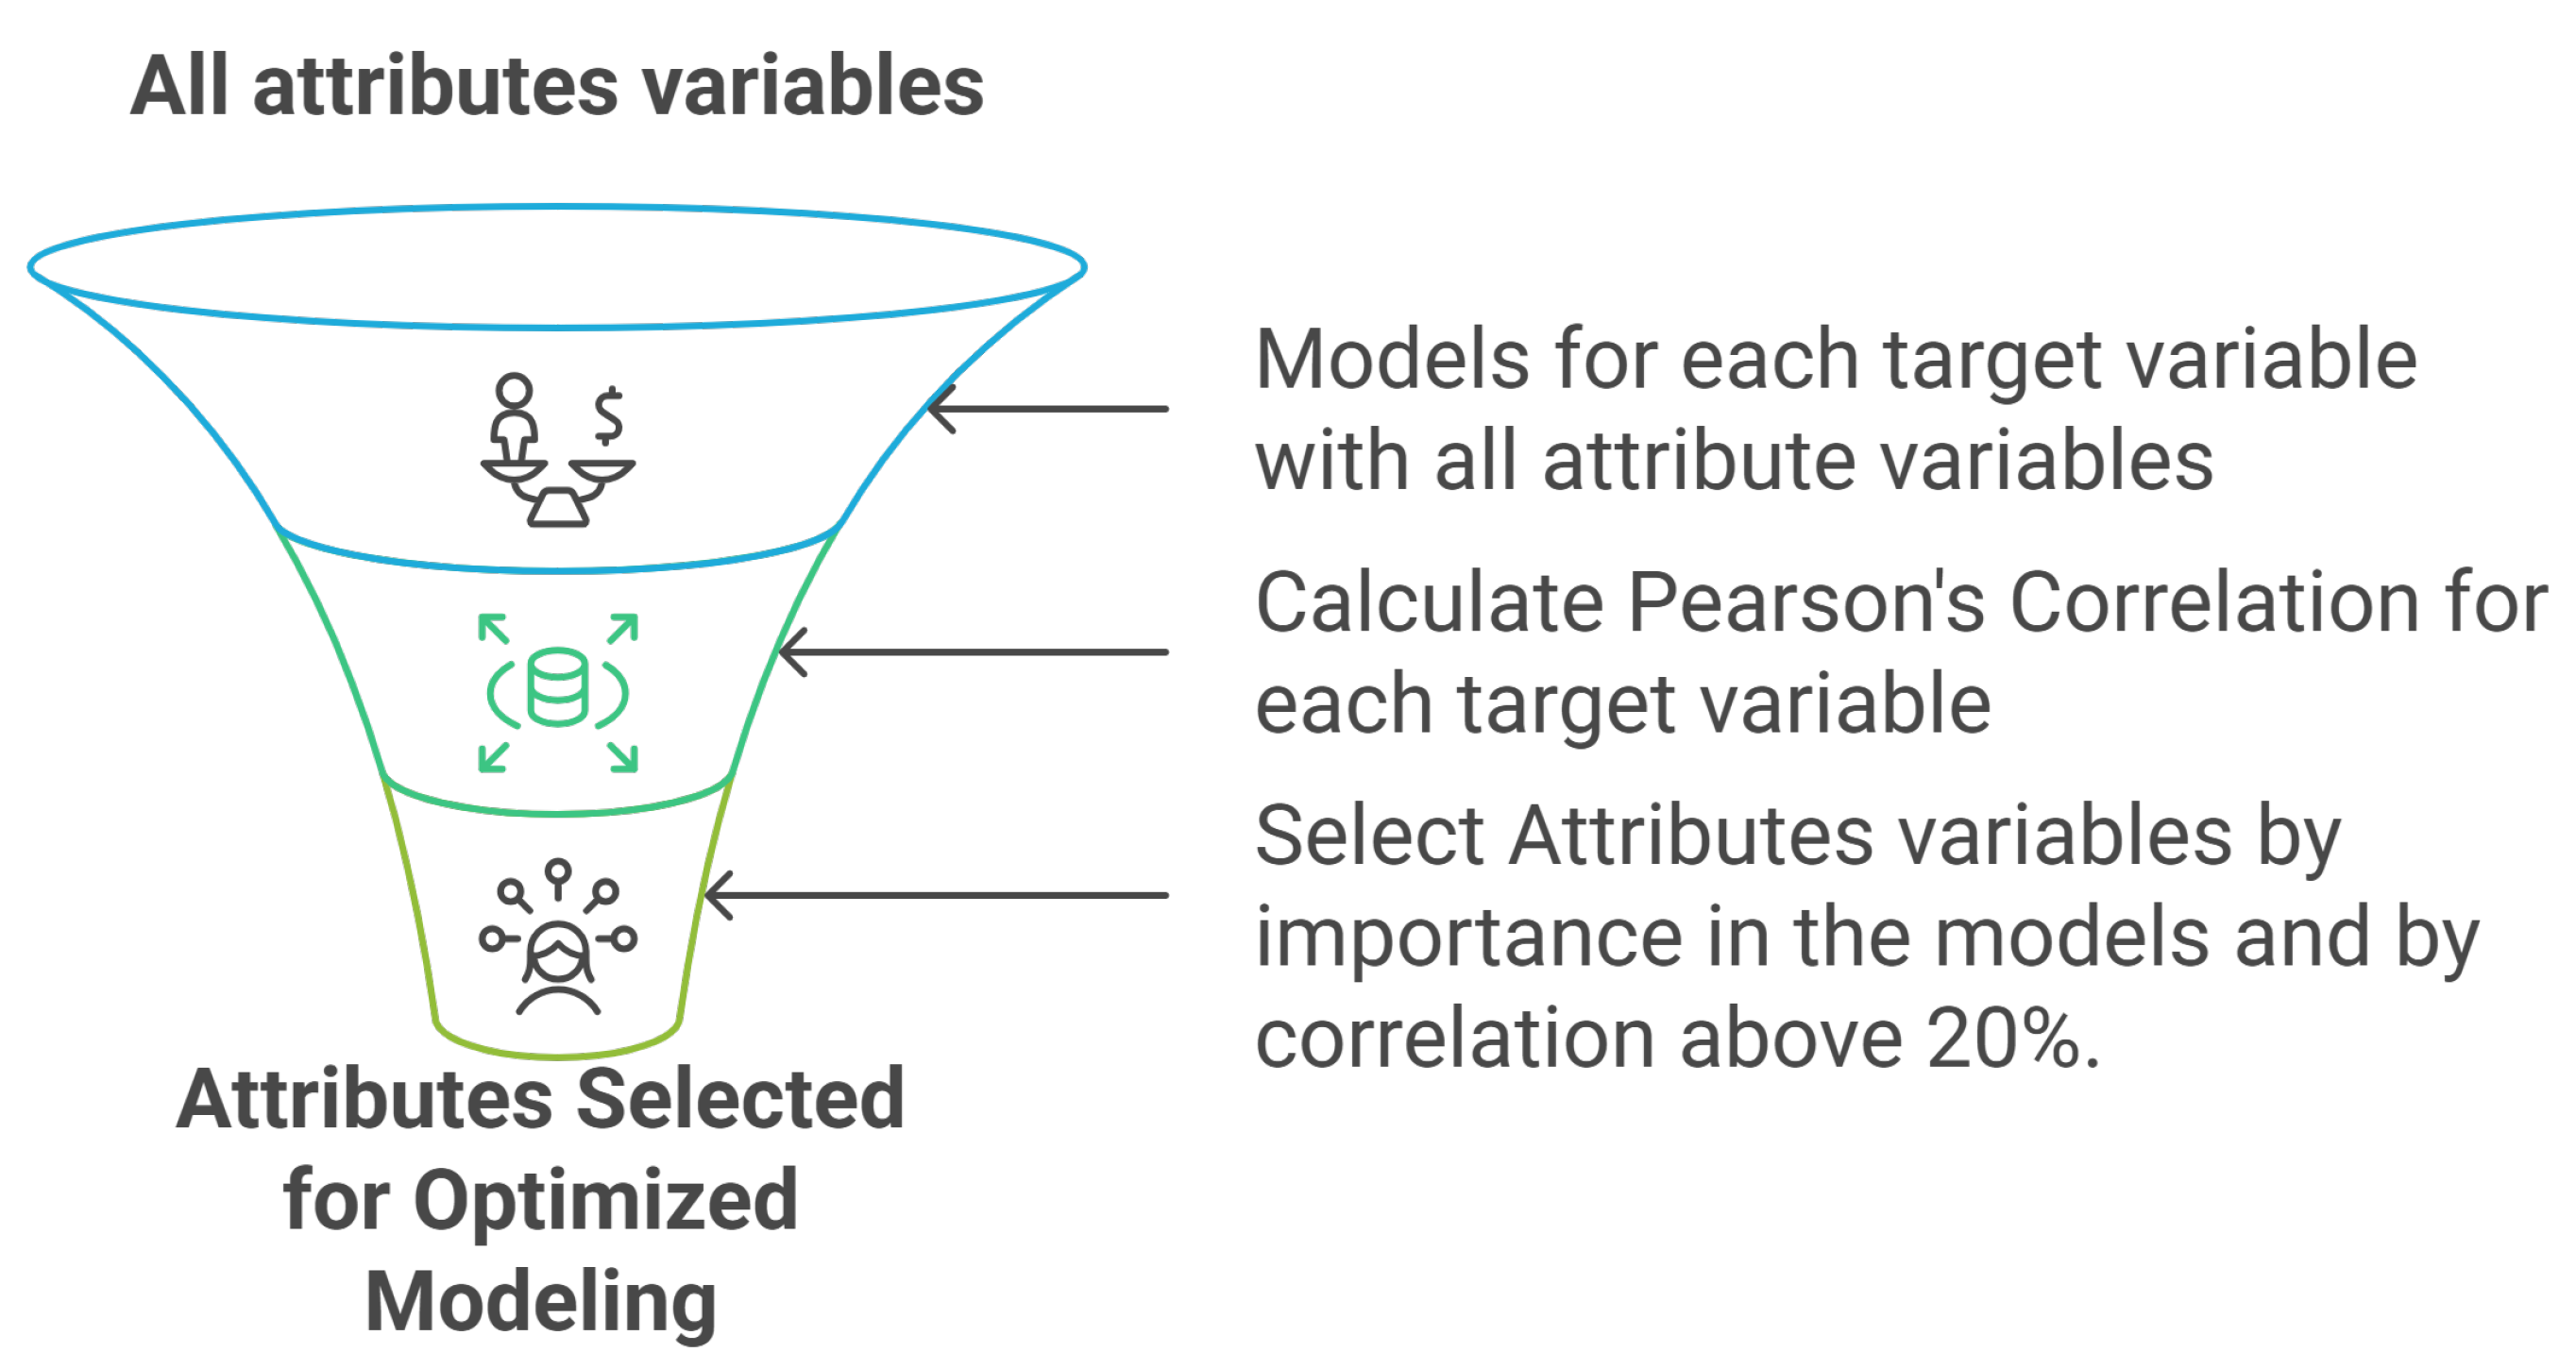
Predictive modeling measures the percentage of use of PCS devices (wristband, fan, and lamp). This is performed through supervised regression techniques using the AutoML module of the H2O.ai (version 3.46.0.6) platform [
38]. This tool fully automates the training and evaluation of multiple machine-learning algorithms, optimizing their performance according to predefined statistical metrics. In the first stage, models were trained using all available variables as predictive attributes. Subsequently, a variable selection strategy was applied based on two complementary criteria: (i) the relative importance of the variables, extracted directly from the generated models [
39], and (ii) the Pearson correlation coefficient
r between each predictor variable and the target variable, considering only those with absolute coefficients above 0.2 (|r| > 0.2), following the recommendations for exploratory analysis [
40]. This process is illustrated in
Figure 3.
Operation of the H2O AutoML Module
The AutoML module automatically executes a sequence of key tasks on the dataset:
Internal pre-processing, including cross-validation, detection of categorical variables, and standardization if necessary.
Parallel training of multiple base algorithms, such as Random Forest, Gradient Boosting Machine (GBM), XGBoost, Deep Learning, and Generalized Linear Models (GLM) [
41].
Automatic search for hyperparameters using optimization methods such as grid search or random search.
Generation of Stacked Ensembles, which combines the models with the best individual performance to generate a more robust prediction [
42].
2.3. General Methodological Flow
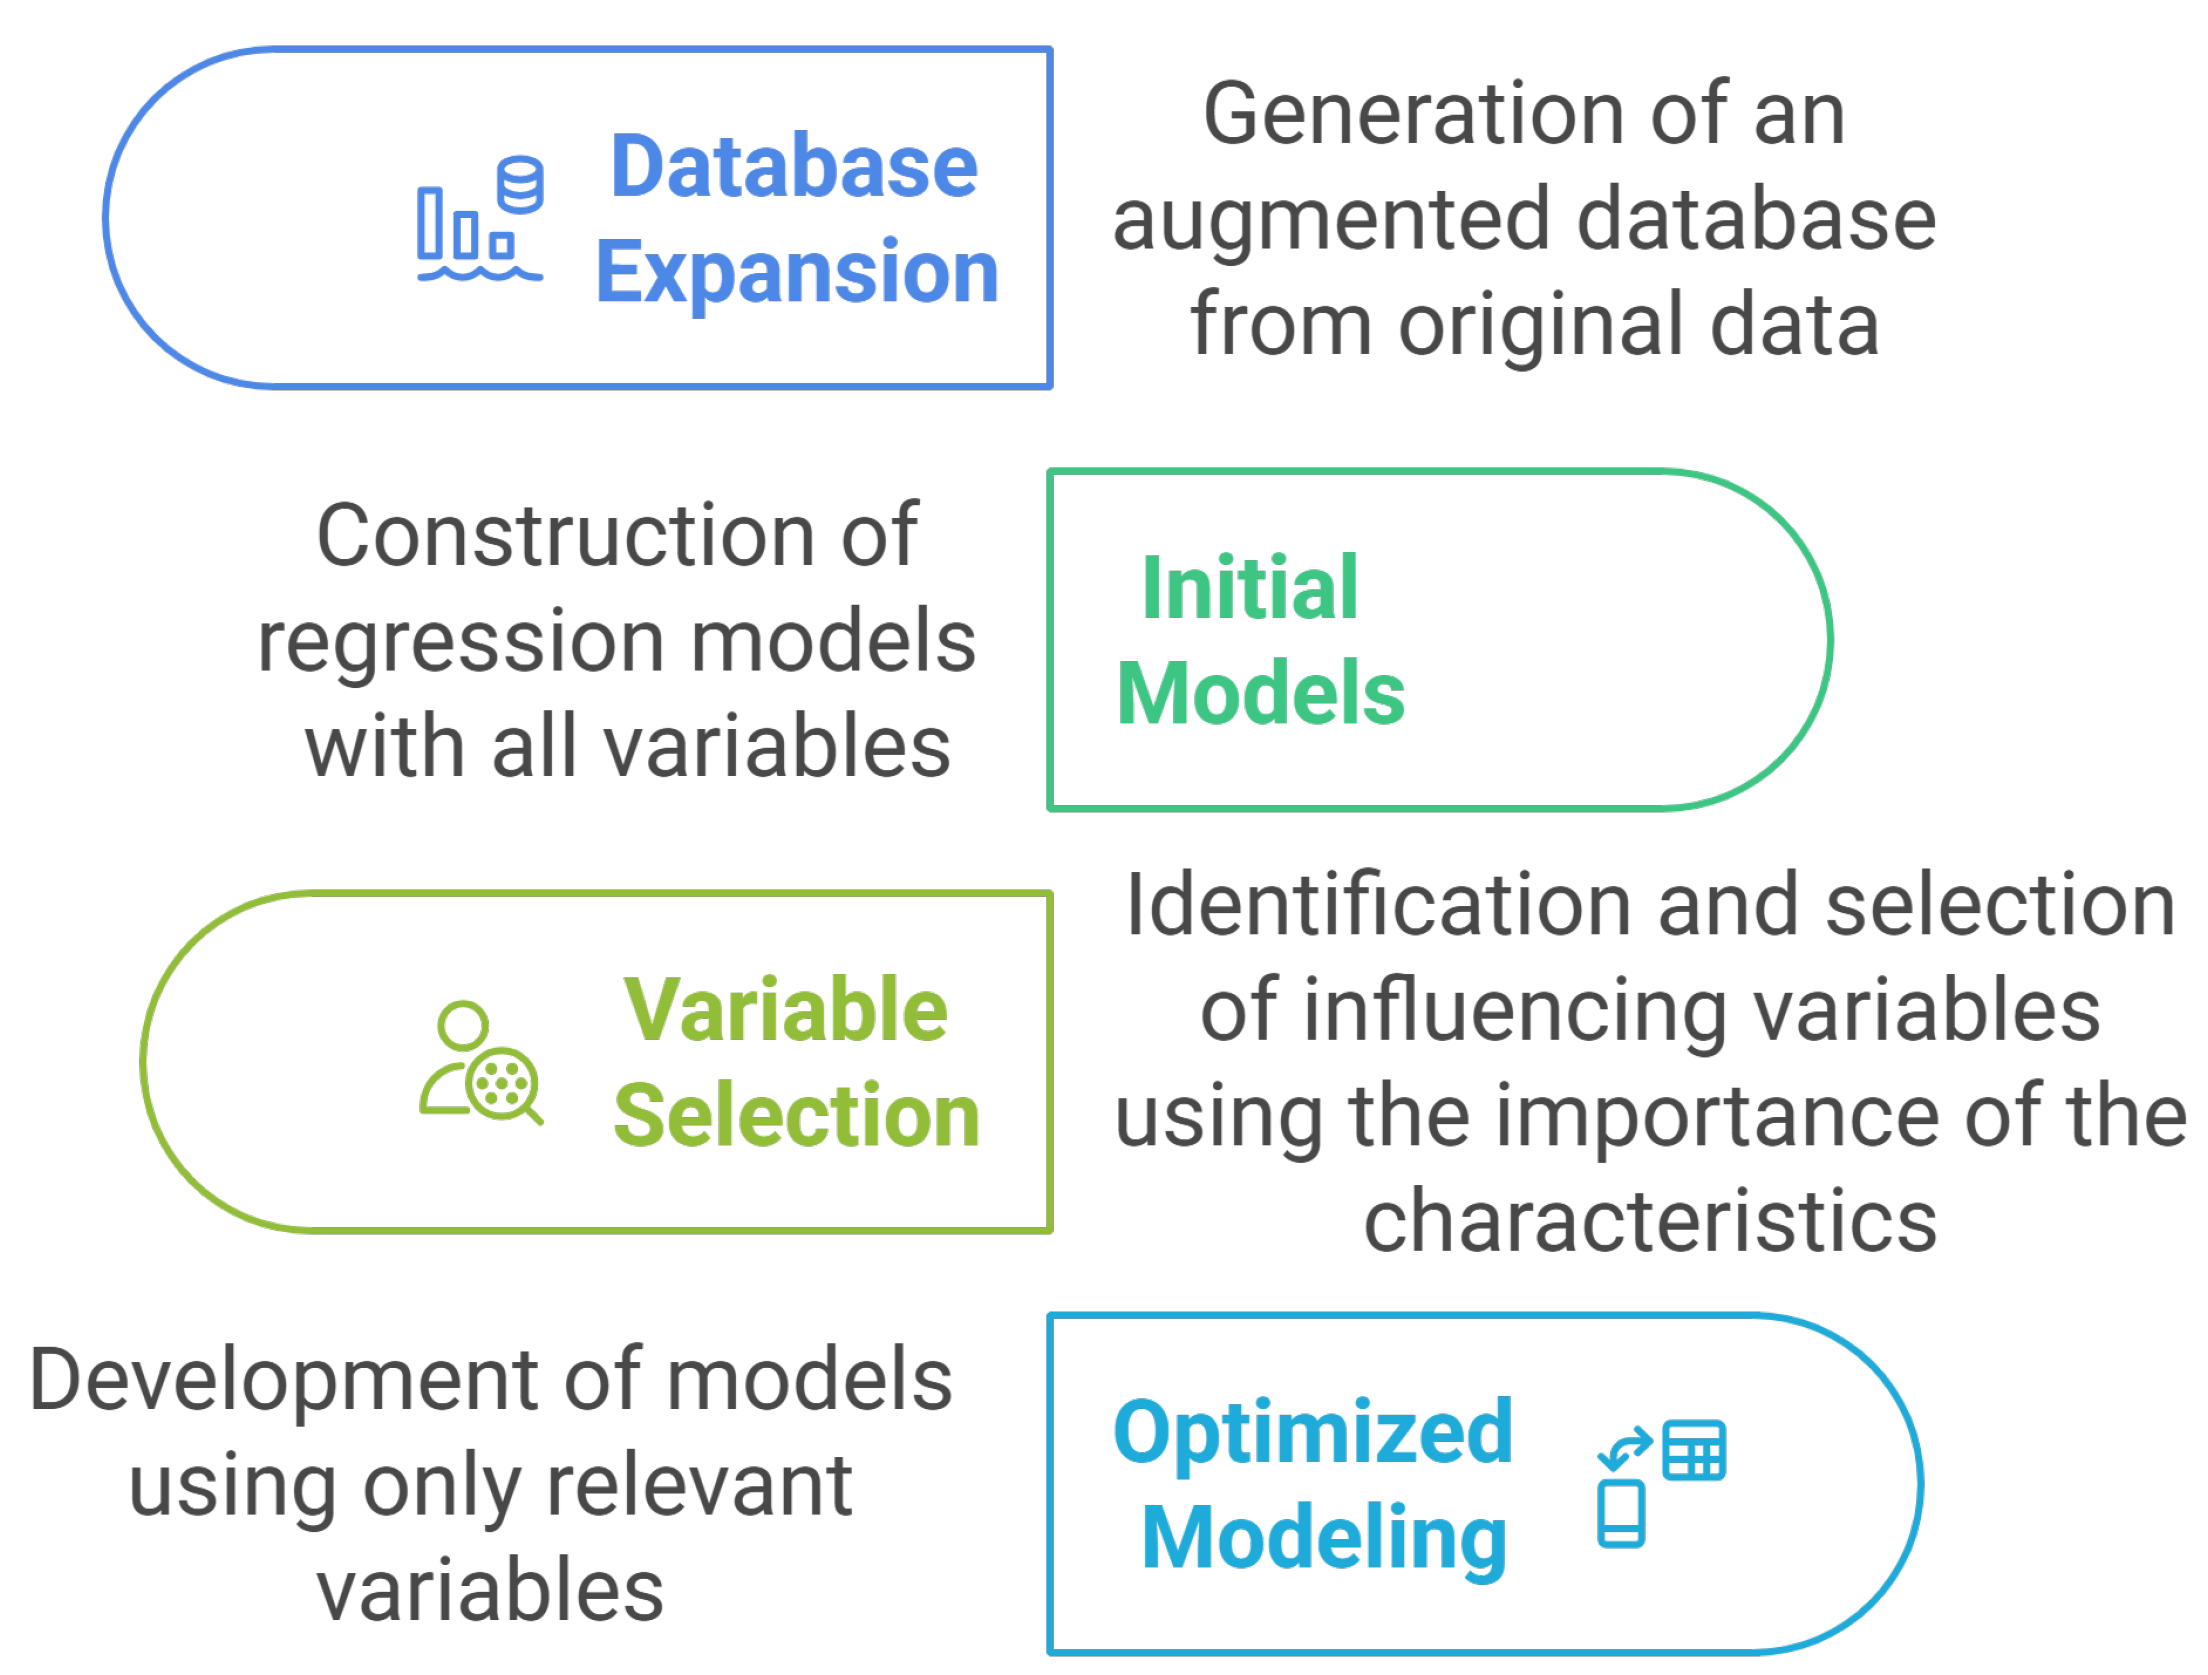
Figure 4 visually summarizes the methodology used to develop predictive models for the use of personal comfort systems in offices. The process began by expanding the database and generating new synthetic records that retained the statistical properties of the original data, which were validated by Student’s
t-tests and distribution analysis. Regression models were built for each target variable in the initial modeling stage using all the available variables. Subsequently, relevant variables were identified, considering their importance in the generated models and their correlation with the target variables. Optimized modeling was conducted for each PCS with this selection, using only the most influential attributes to build more efficient and accurate models.
For each target variable, the one that obtained the best performance in the validation set was selected as the final model, evaluated using metrics such as the mean absolute error (MAE), the root mean square error (RMSE), and the coefficient of determination (R2). This strategy allowed the identification of the most effective algorithm in each case and capturing complex non-linear relationships between variables without the need to develop specific manual code for each model.
3. Results
3.1. Evaluation of Database Expansion
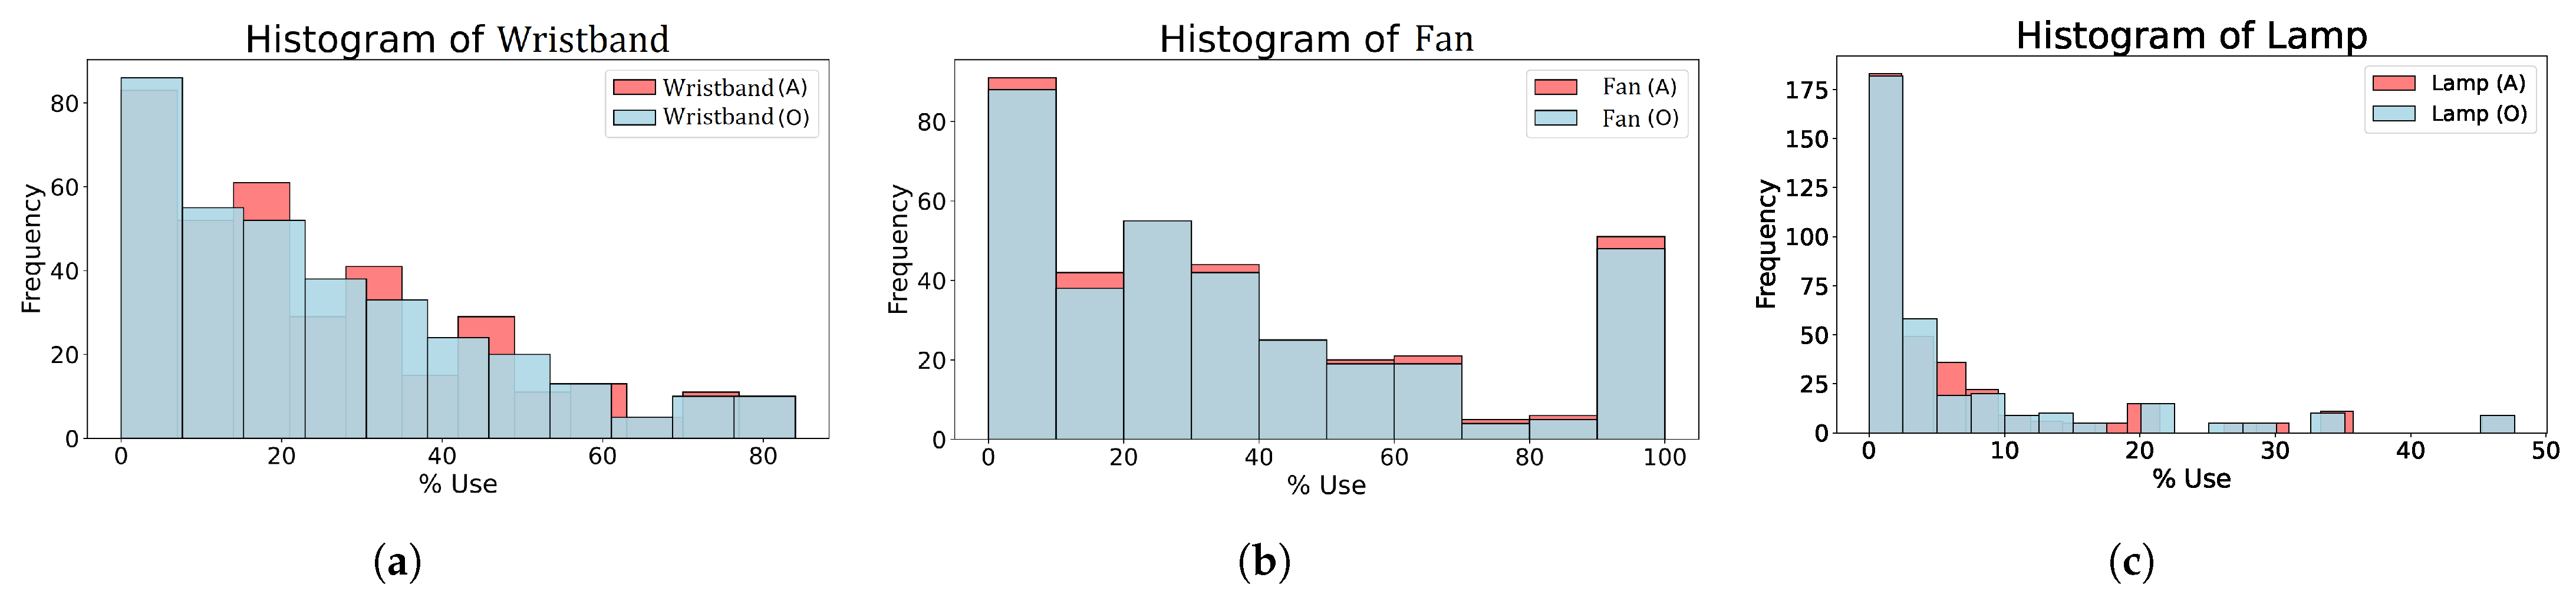
The comparison between the original (O) and the augmented database (A) for the target variables wristband, fan, and lamp shows that the data expansion maintains the general statistical characteristics of the original distribution. The sample size increased from 72 to 360 records for each variable, representing a five-fold expansion in the available data. The augmented database’s mean values and standard deviations are similar to the original ones, suggesting that the data distribution has not changed significantly after the expansion. In addition, the minimum and maximum values remain unchanged, indicating that no extreme values outside the original range were introduced. The percentiles (25%, 50% and 75%) show slight variations, confirming that the data structure has been preserved. To evaluate whether the differences observed between the original and augmented data are statistically significant, a Student’s
t-test was applied for independent samples. The values of
p, which represent the probability that the observed differences are random, were 0.998 for the wristband, 0.986 for the fan, and 0.88 for the lamp, indicating no significant differences between datasets (
). This supports the validity of the data augmentation procedure, ensuring that no substantial biases were introduced into the distribution of the target variables.
Table 1 presents a statistical summary of the target variables, differentiating between the original and augmented data.
Figure 5 compares the distributions of the original and the augmented database to visualize the similarity between the two databases. The data expansion respected the structure of the original distributions, reinforcing some frequencies without introducing significant biases.
The histograms show that the data expansion has respected the original distribution of each target variable, ensuring that the artificially generated data do not introduce significant biases. The structure of the distributions is maintained, although with a reinforcement in specific frequencies to improve the representativeness of the data.
3.2. Performance Assessment of the Initial Models
The initial predictive models were trained using all the attributes available in the augmented database (N = 360). The results obtained after this initial modeling process are summarized in
Table 2, where the leading performance indicators for each target variable are presented. In all cases, it is observed that the models achieved a satisfactory fit in the training phase, with coefficients of determination (R
2) above 0.95, indicating a high explanatory capacity with the complete set of attributes. In particular, the best performance was achieved through assembly strategies for the wristband and fan variables. For the lamp, the most efficient model was the Gradient Boosting Machine. Although a slight decrease in performance is observed in the test data, especially for the lamp variable, the mean absolute error (MAE) and root mean square error (RMSE) metrics remain within acceptable ranges. These results not only evidence the validity of the augmented data used in the training but also support the relevance of the approach adopted for the selection of variables using automated analysis.
3.3. Selected Variables and Optimization of the Model
A variables selection process was conducted to improve the models’ efficiency and accuracy based on their importance in the model and their correlation with the target variable. As a result, key attributes were identified into five categories: environmental, spatial, personal characteristics, perception of control, and satisfaction with comfort (
Table 3). It was observed that the satisfaction and comfort stated by occupants in the surveys have a significant value in the design of the PCS use predictive model.
Table A1 in
Appendix A shows a description of the selected variables.
3.4. Metrics of Optimized Models
Table 4 presents the performance of the predictive models optimized for each target variable, using only the variables selected after the attribute reduction process.
In all cases, the model that achieved the best performance was an assembly strategy, which confirms this technique’s effectiveness in capturing complex relationships between variables. For the wristband use prediction, the optimized model obtained an MAE of 4.10 and an R
2 of 0.86 in the test set, showing a robust fit comparable to the complete model (MAE de 4.29 y R
2 de 0.87). In the case of the fan, the simplified model outperformed the model with all variables, reaching an R
2 of 0.84 vs. 0.73 and reducing the MAE from 9.69 to 8.11. For the lamp, although the performance of the optimized model was slightly lower (R
2 of 0.52 vs. 0.51), the overall behavior remained stable. These results show that simplified models maintain a sound predictive capacity, although the metrics do not improve significantly or even decrease slightly in some cases. In addition, by reducing the complexity of the set of attributes, the model’s interpretability is increased, favoring its applicability in real contexts. This simplification brings greater significance to the model by focusing on relevant variables, contributing to designing more efficient, understandable, and adaptable solutions in work environments. Based on the complete set of available attributes, a variables selection strategy was applied that combined the analysis of relative importance in the models generated by AutoML and the statistical correlation with the target variables. This approach made it possible to identify the most influential factors in predicting the use of each device.
Table 5 presents the hierarchy of importance of the predictor variables for each target variable (wristband, fan, and lamp) according to the ranking automatically generated by the H2O AutoML module. This analysis provides empirical evidence on which attributes have the most significant weight in the prediction, which is key for developing optimized and explainable models.
In the wristband case, the most influential attributes that stand out are the BMI, the average CO2 level, and the cold temperature satisfaction variable (ColdTempSat), suggesting that both personal characteristics and environmental parameters significantly influence the use of this device. For the fan, BMI again appears as the most relevant predictor, followed by variables associated with thermal perception and environmental quality, such as WarmTempSat and the average outdoor temperature. In the case of the lamp, the most important attributes are mainly related to environmental and personal conditions, highlighting the average CO2, age, and BMI. Transversally, variables such as FurnComSat, PrivSat, and Ventil also appear in the ranking of importance, evidencing the subjective perception of comfort in predicting the use of personal comfort systems. These results allow the identification of differential patterns in the factors that condition the use of each type of device and reinforce the need to consider both objective and subjective variables in modeling user behavior.
3.5. Predictive Model Results for the Wristband
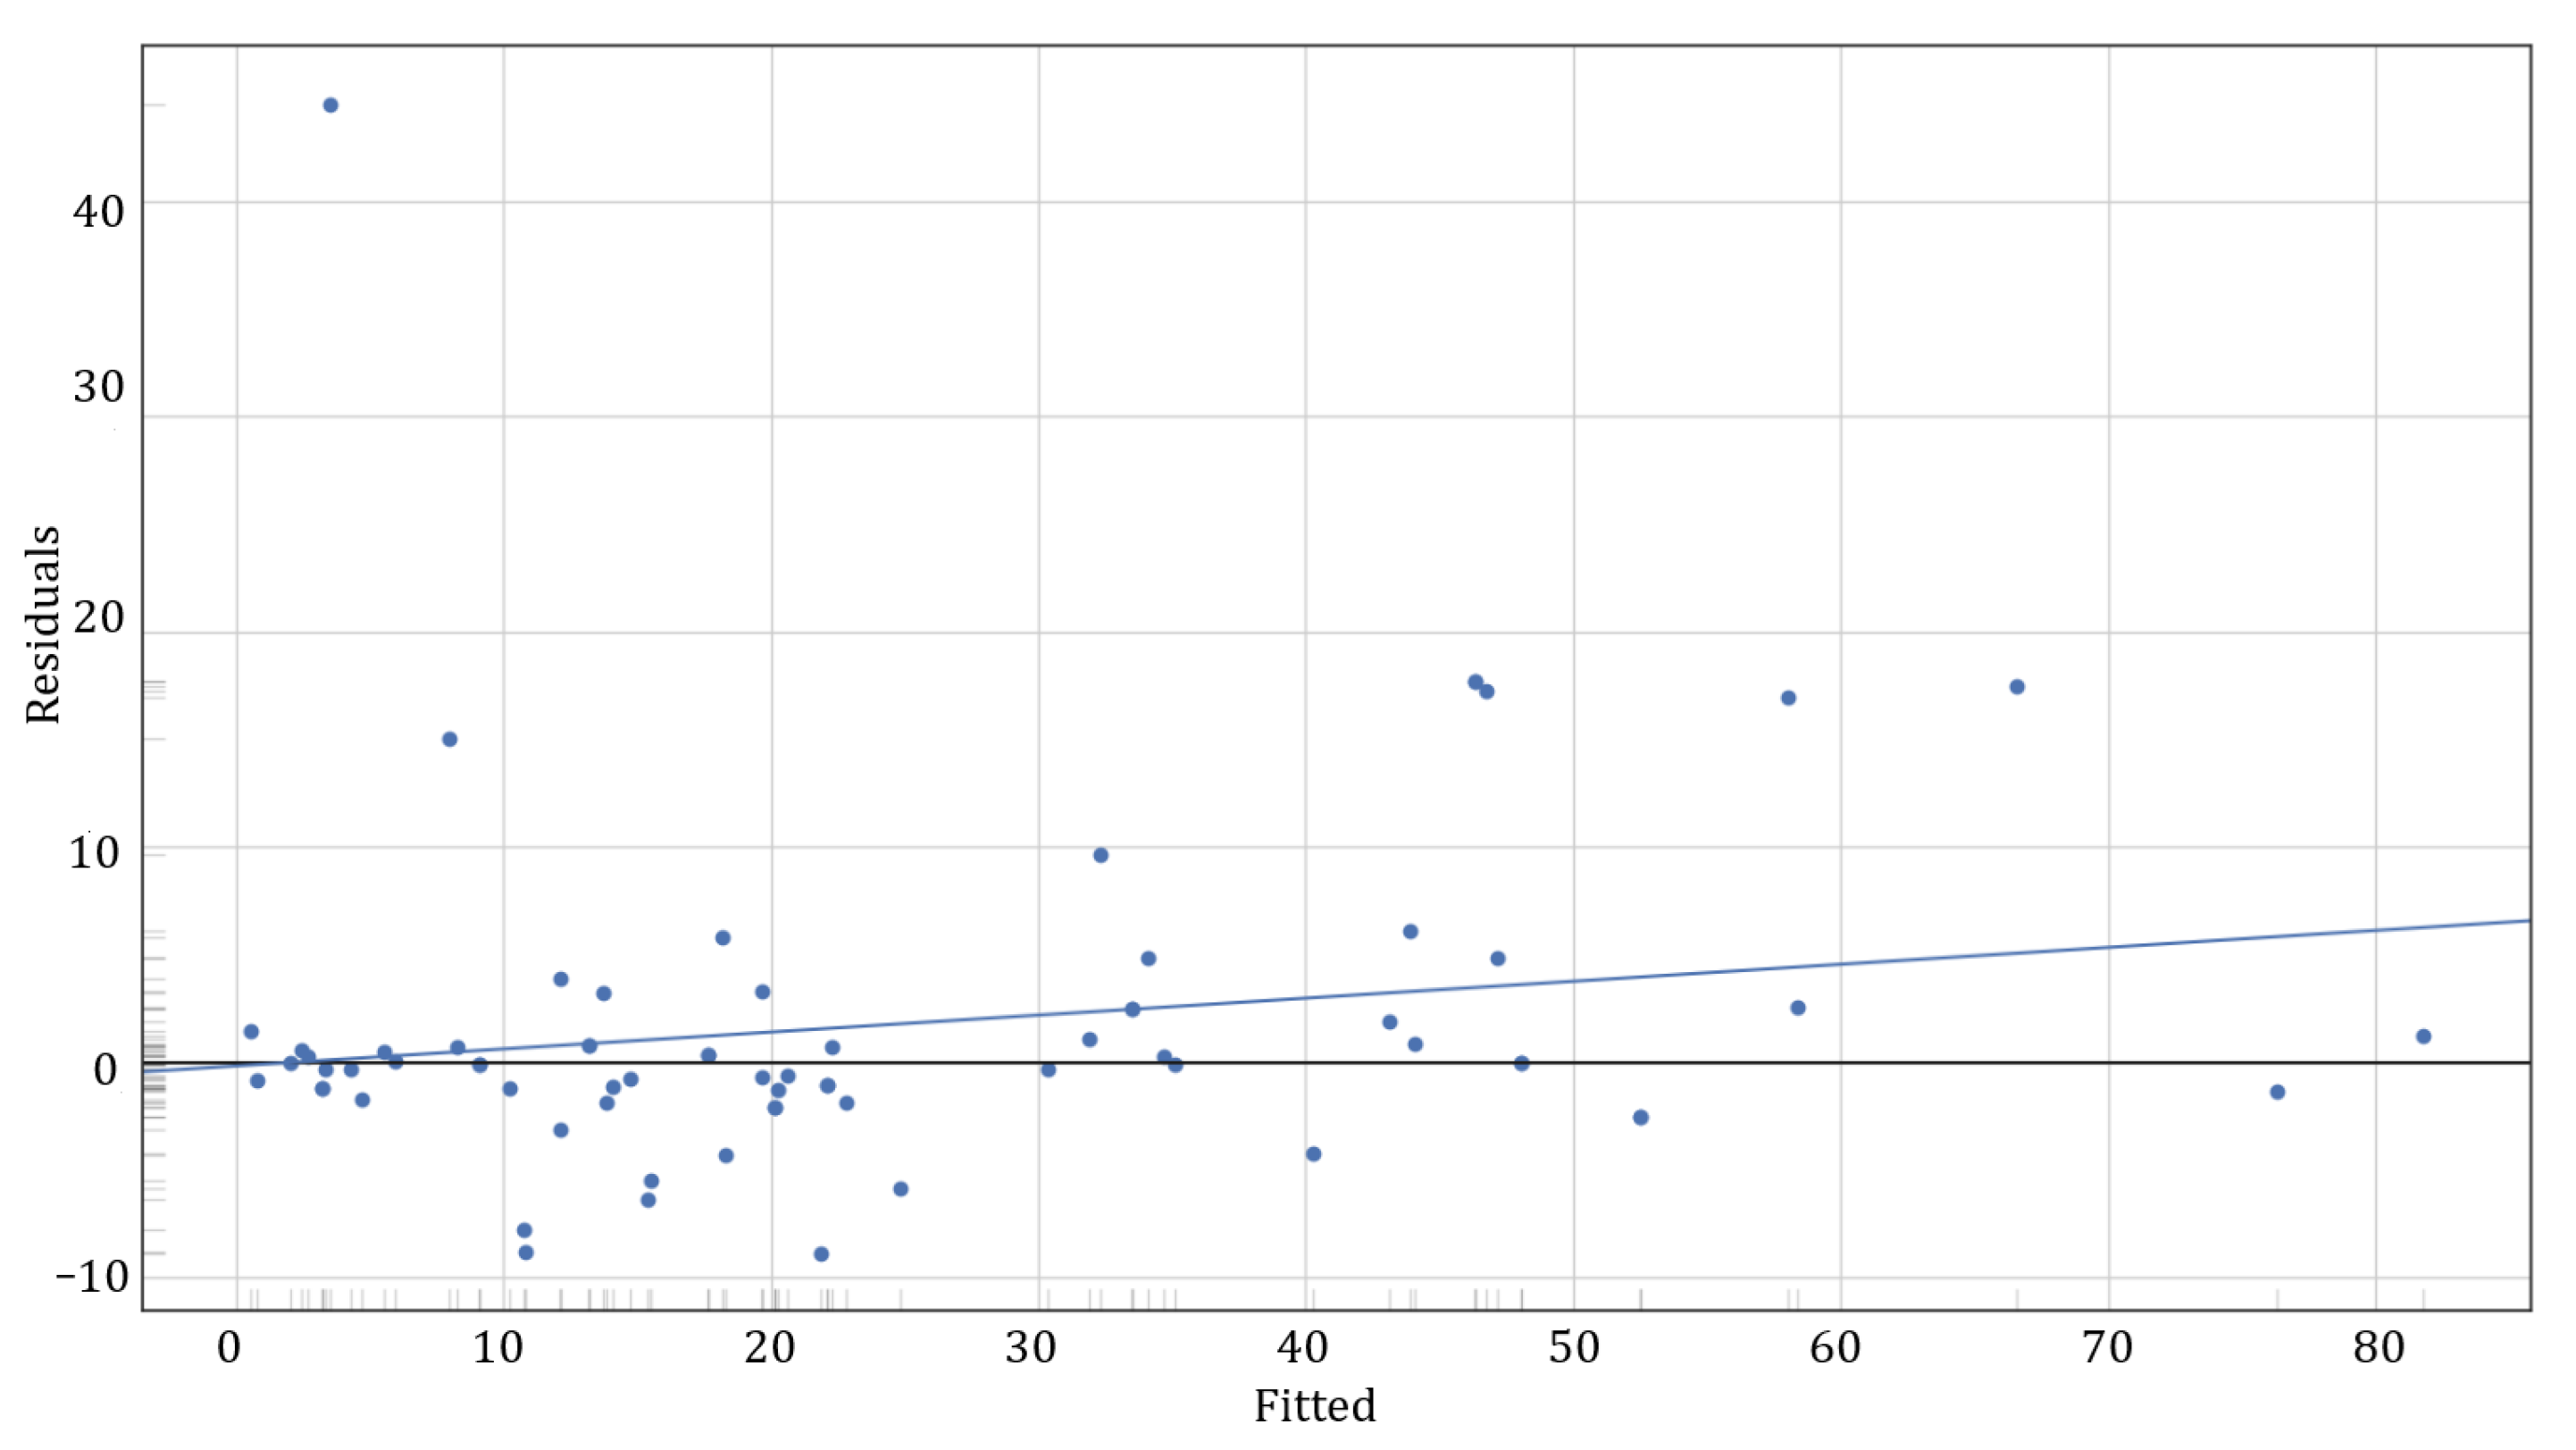
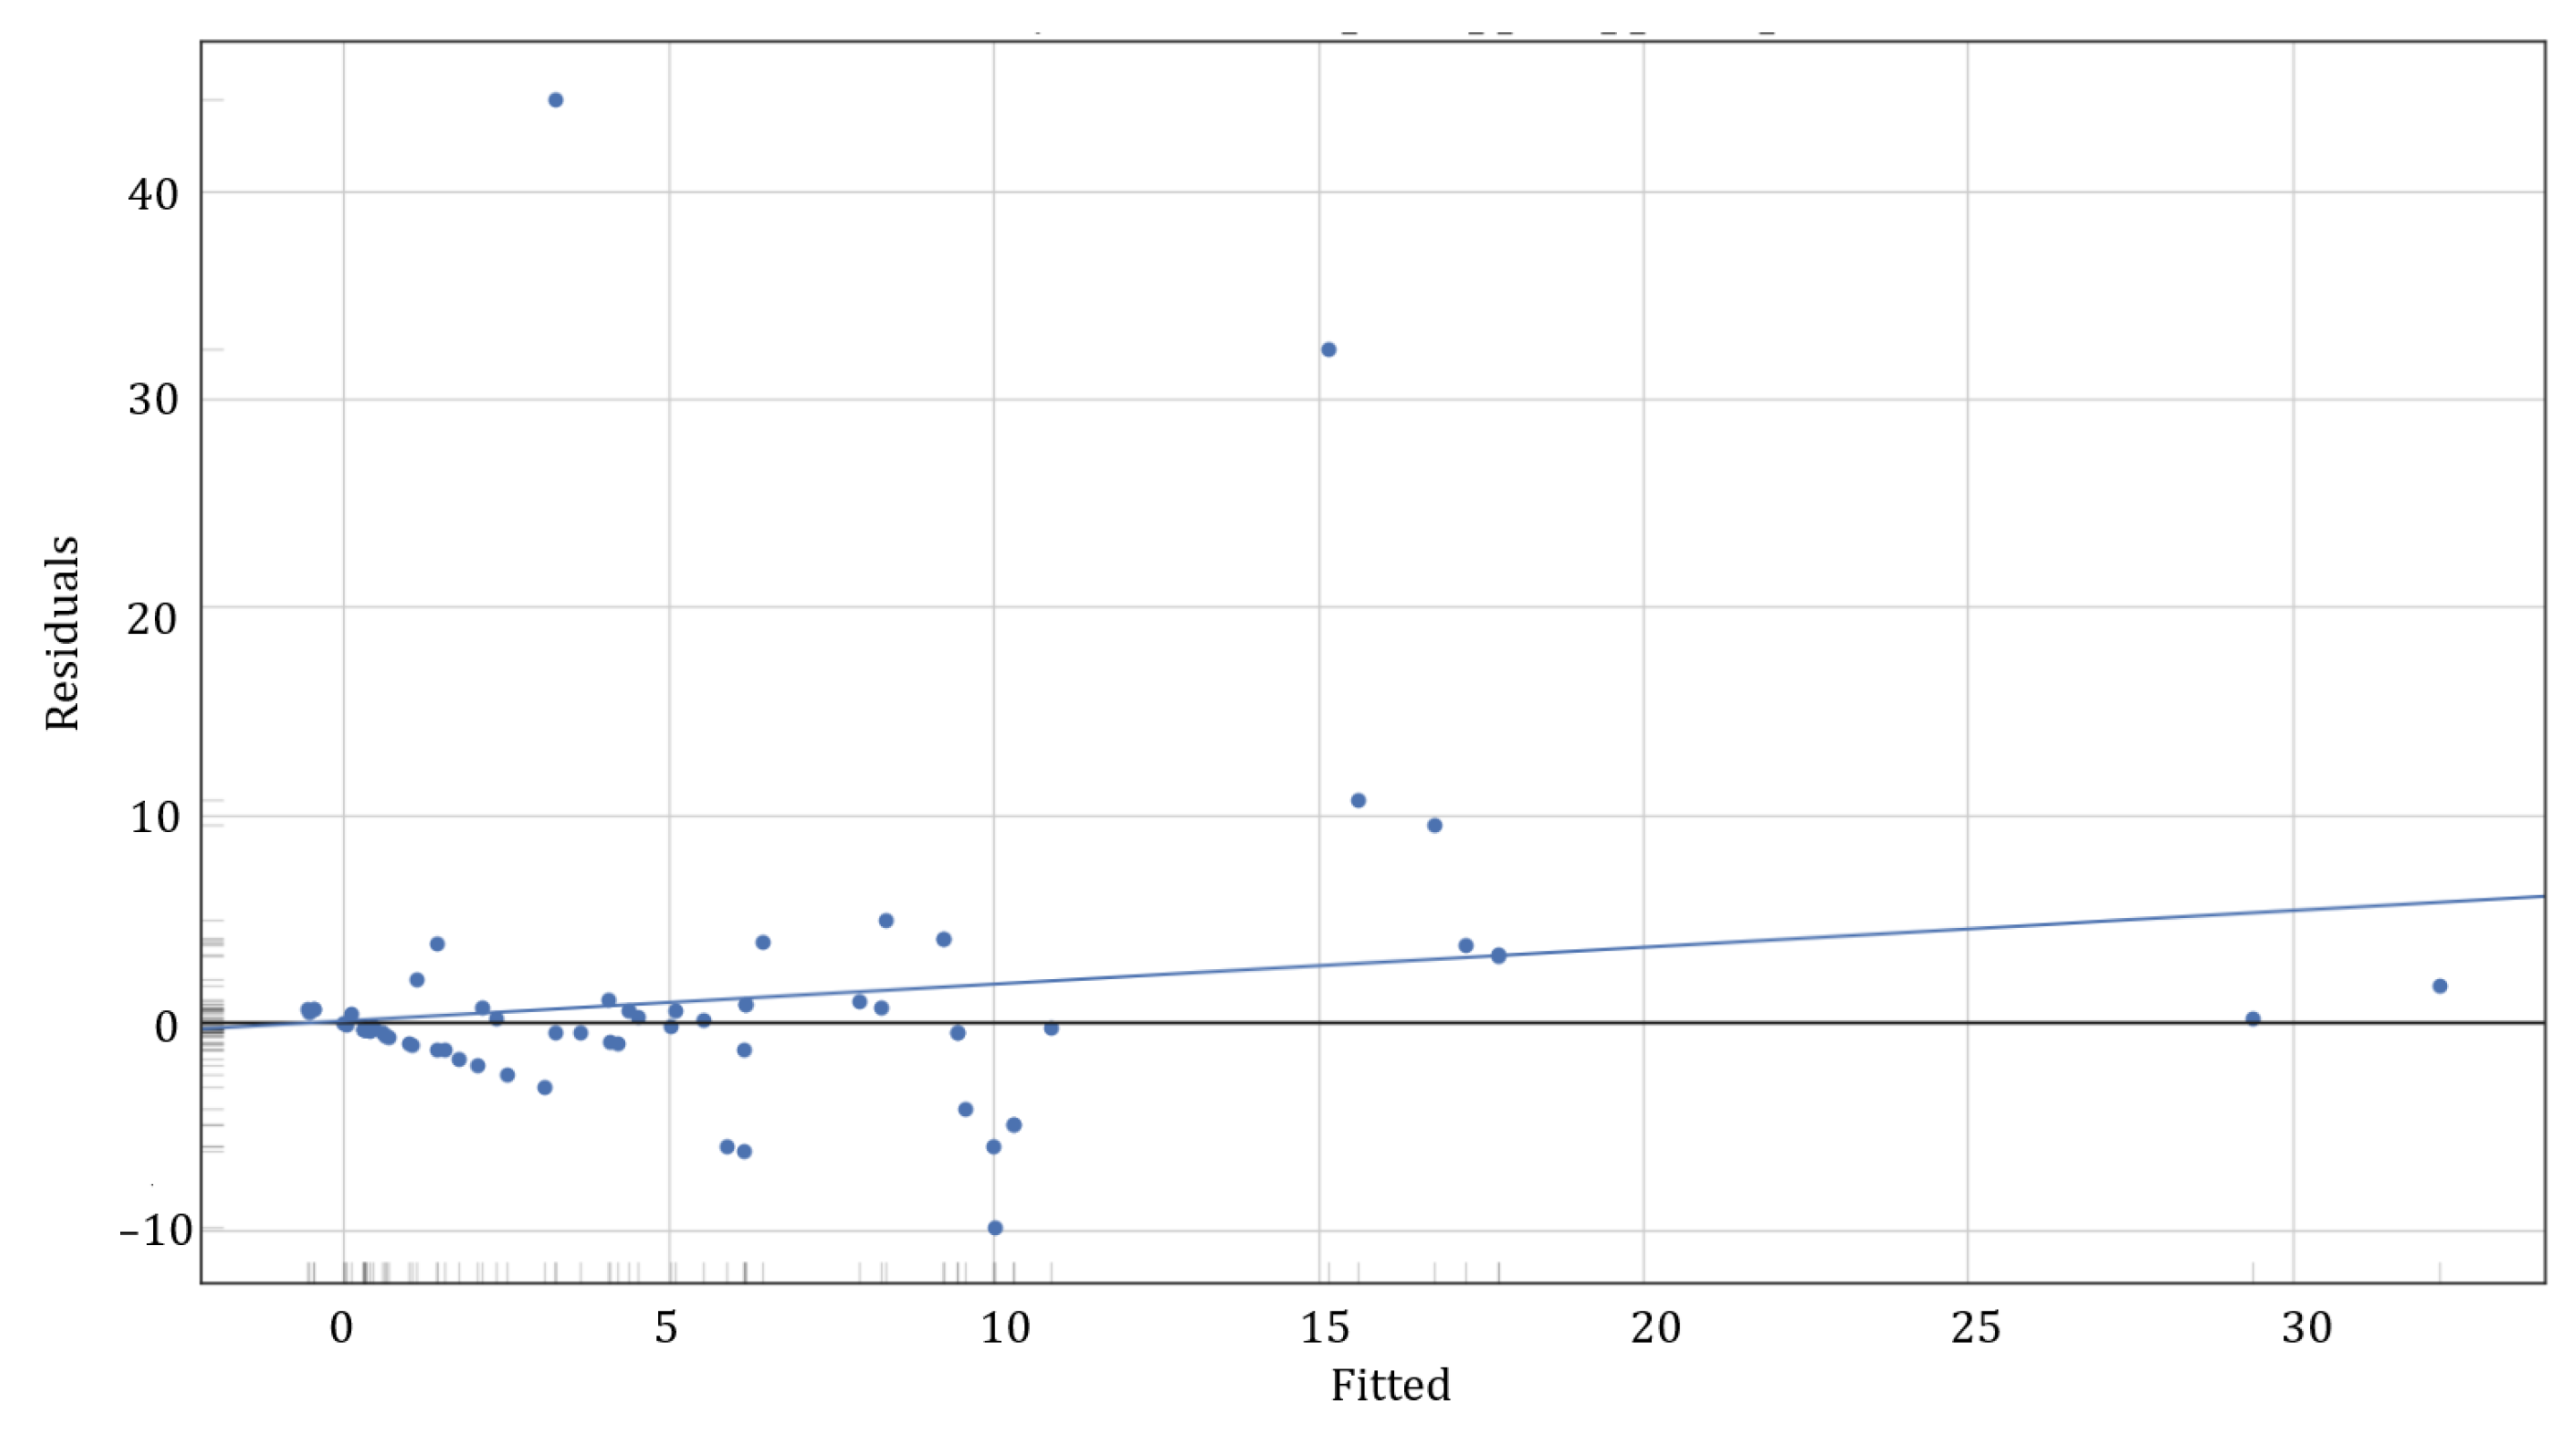
The residual graph of
Figure 6, shows evidence that the residuals are moderately randomly distributed around zero throughout the range of fitted values. However, some outliers are observed, especially for higher predictions. This indicates a slight tendency towards underestimation at the upper extremes, but without obvious structural patterns that compromise the model’s validity. The slight inclination of the trend line suggests that, although the model is generally accurate, it could benefit from additional adjustment in extreme cases.
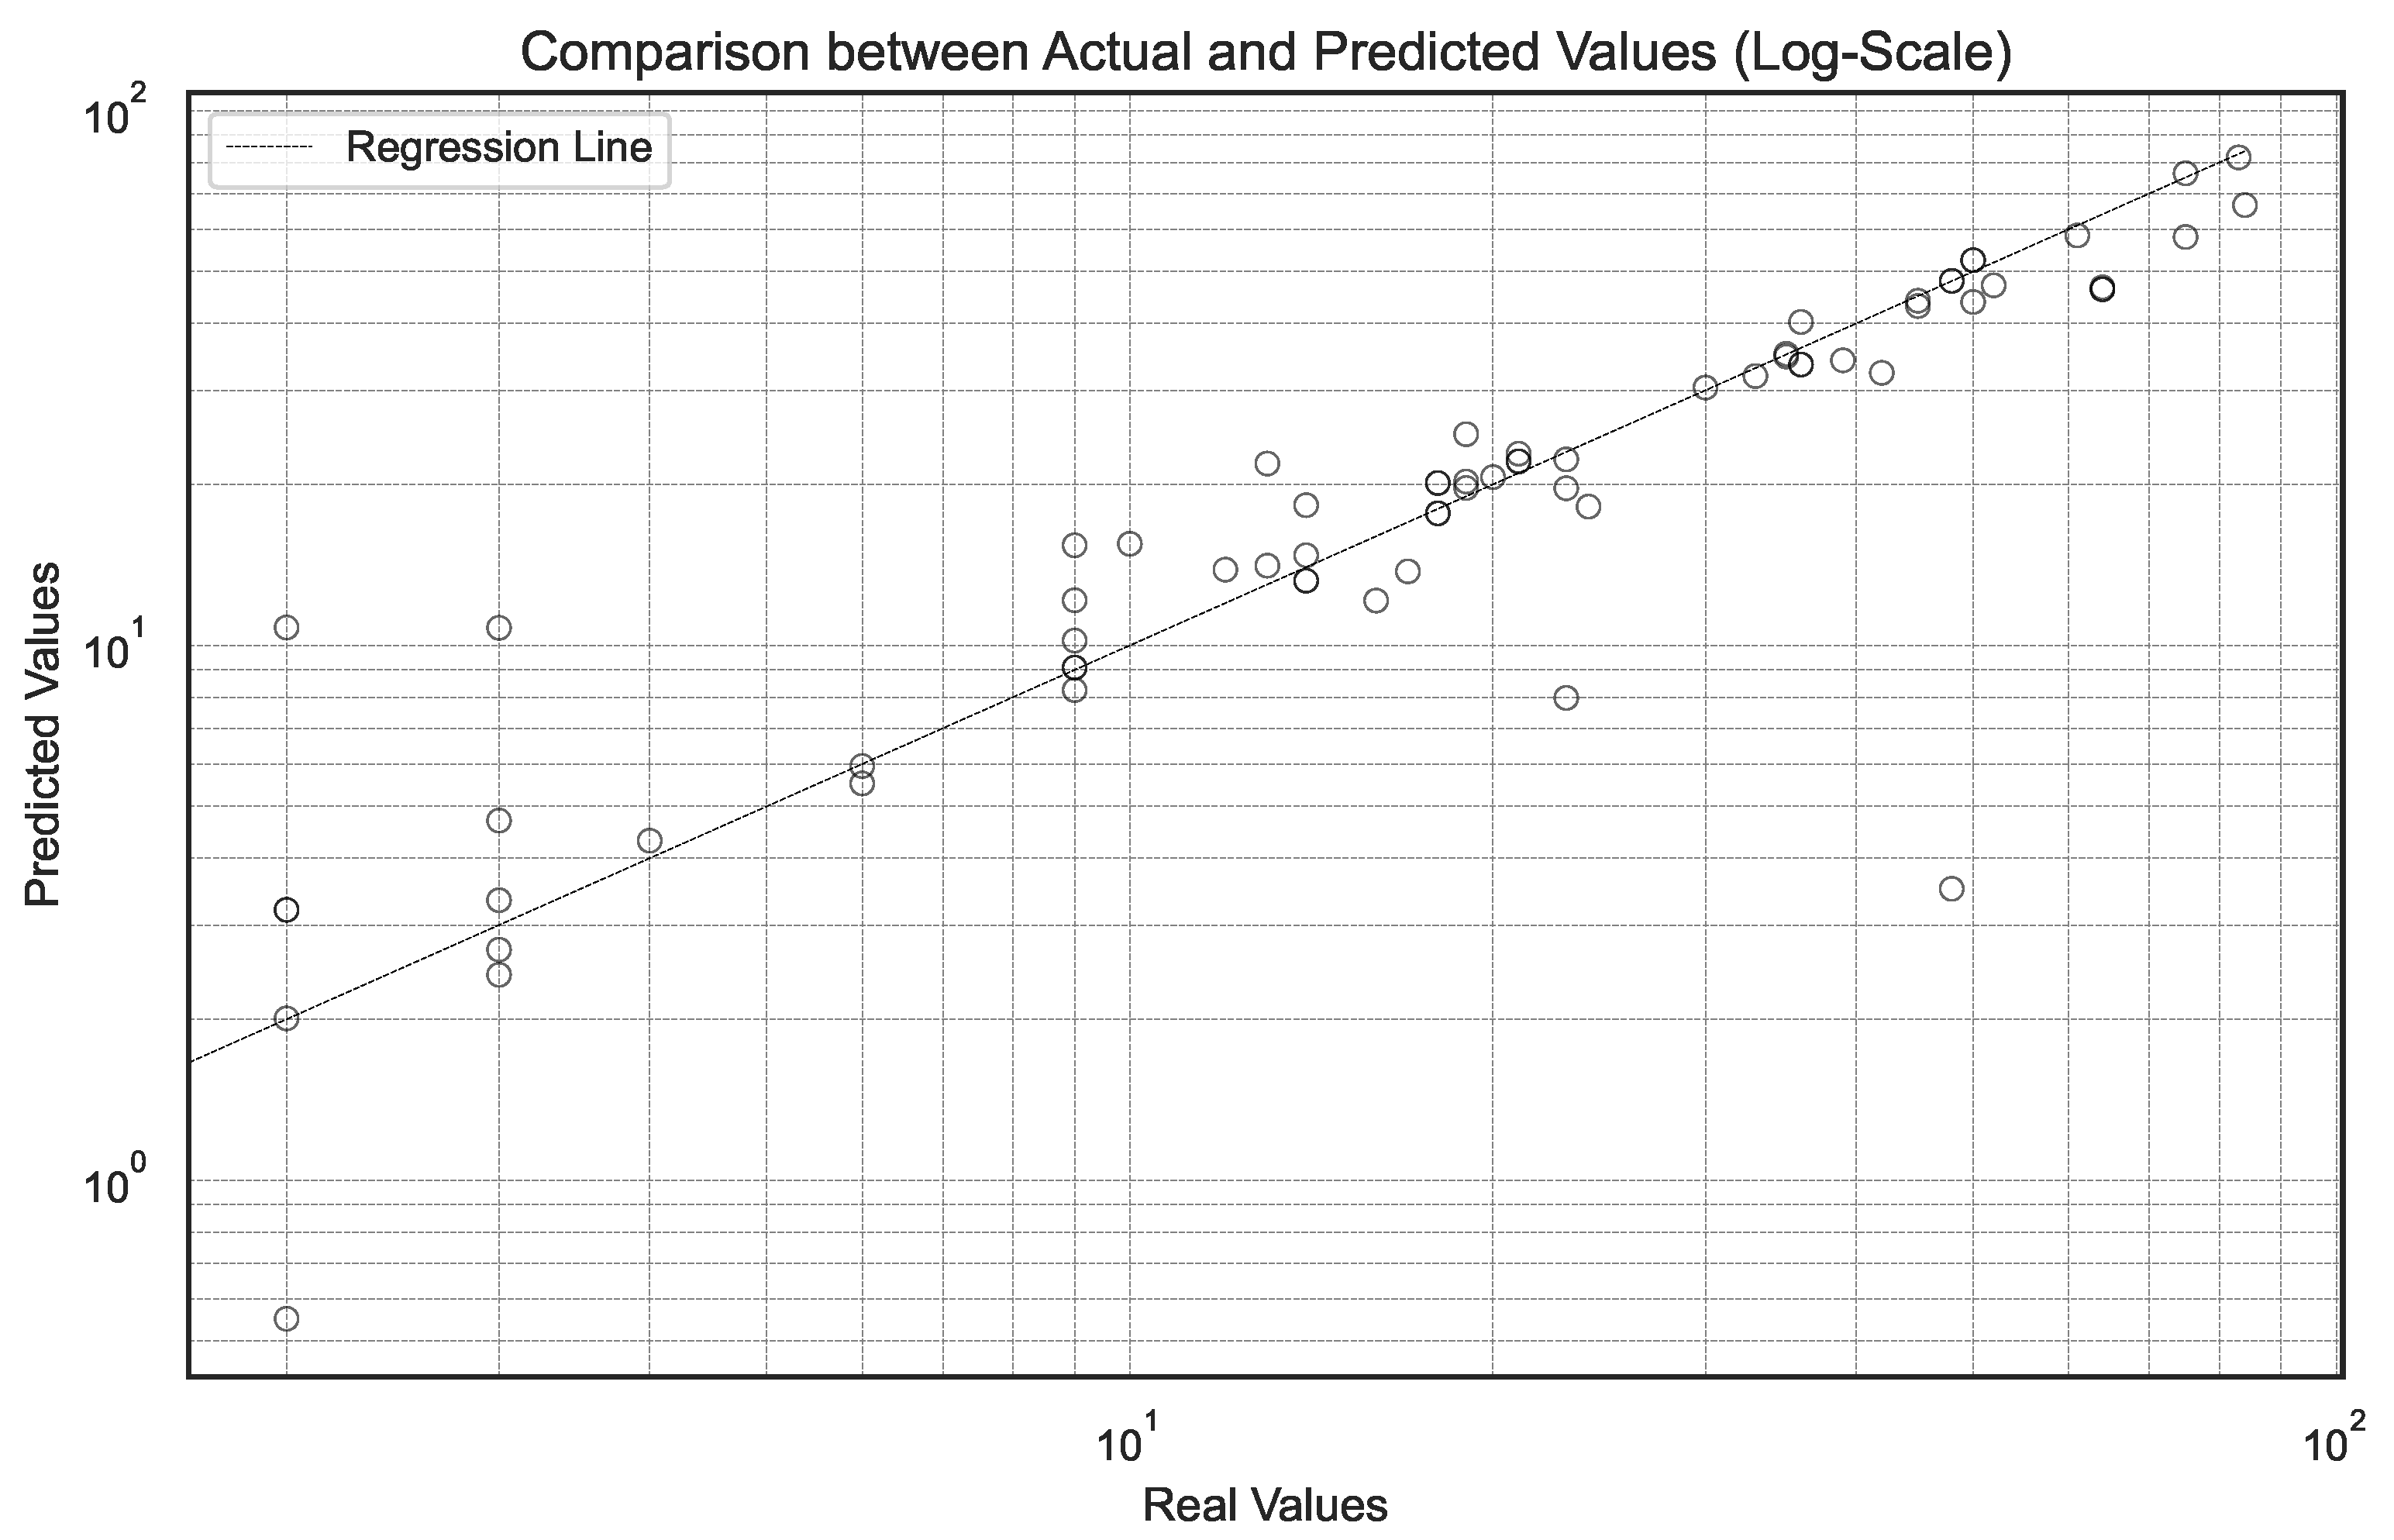
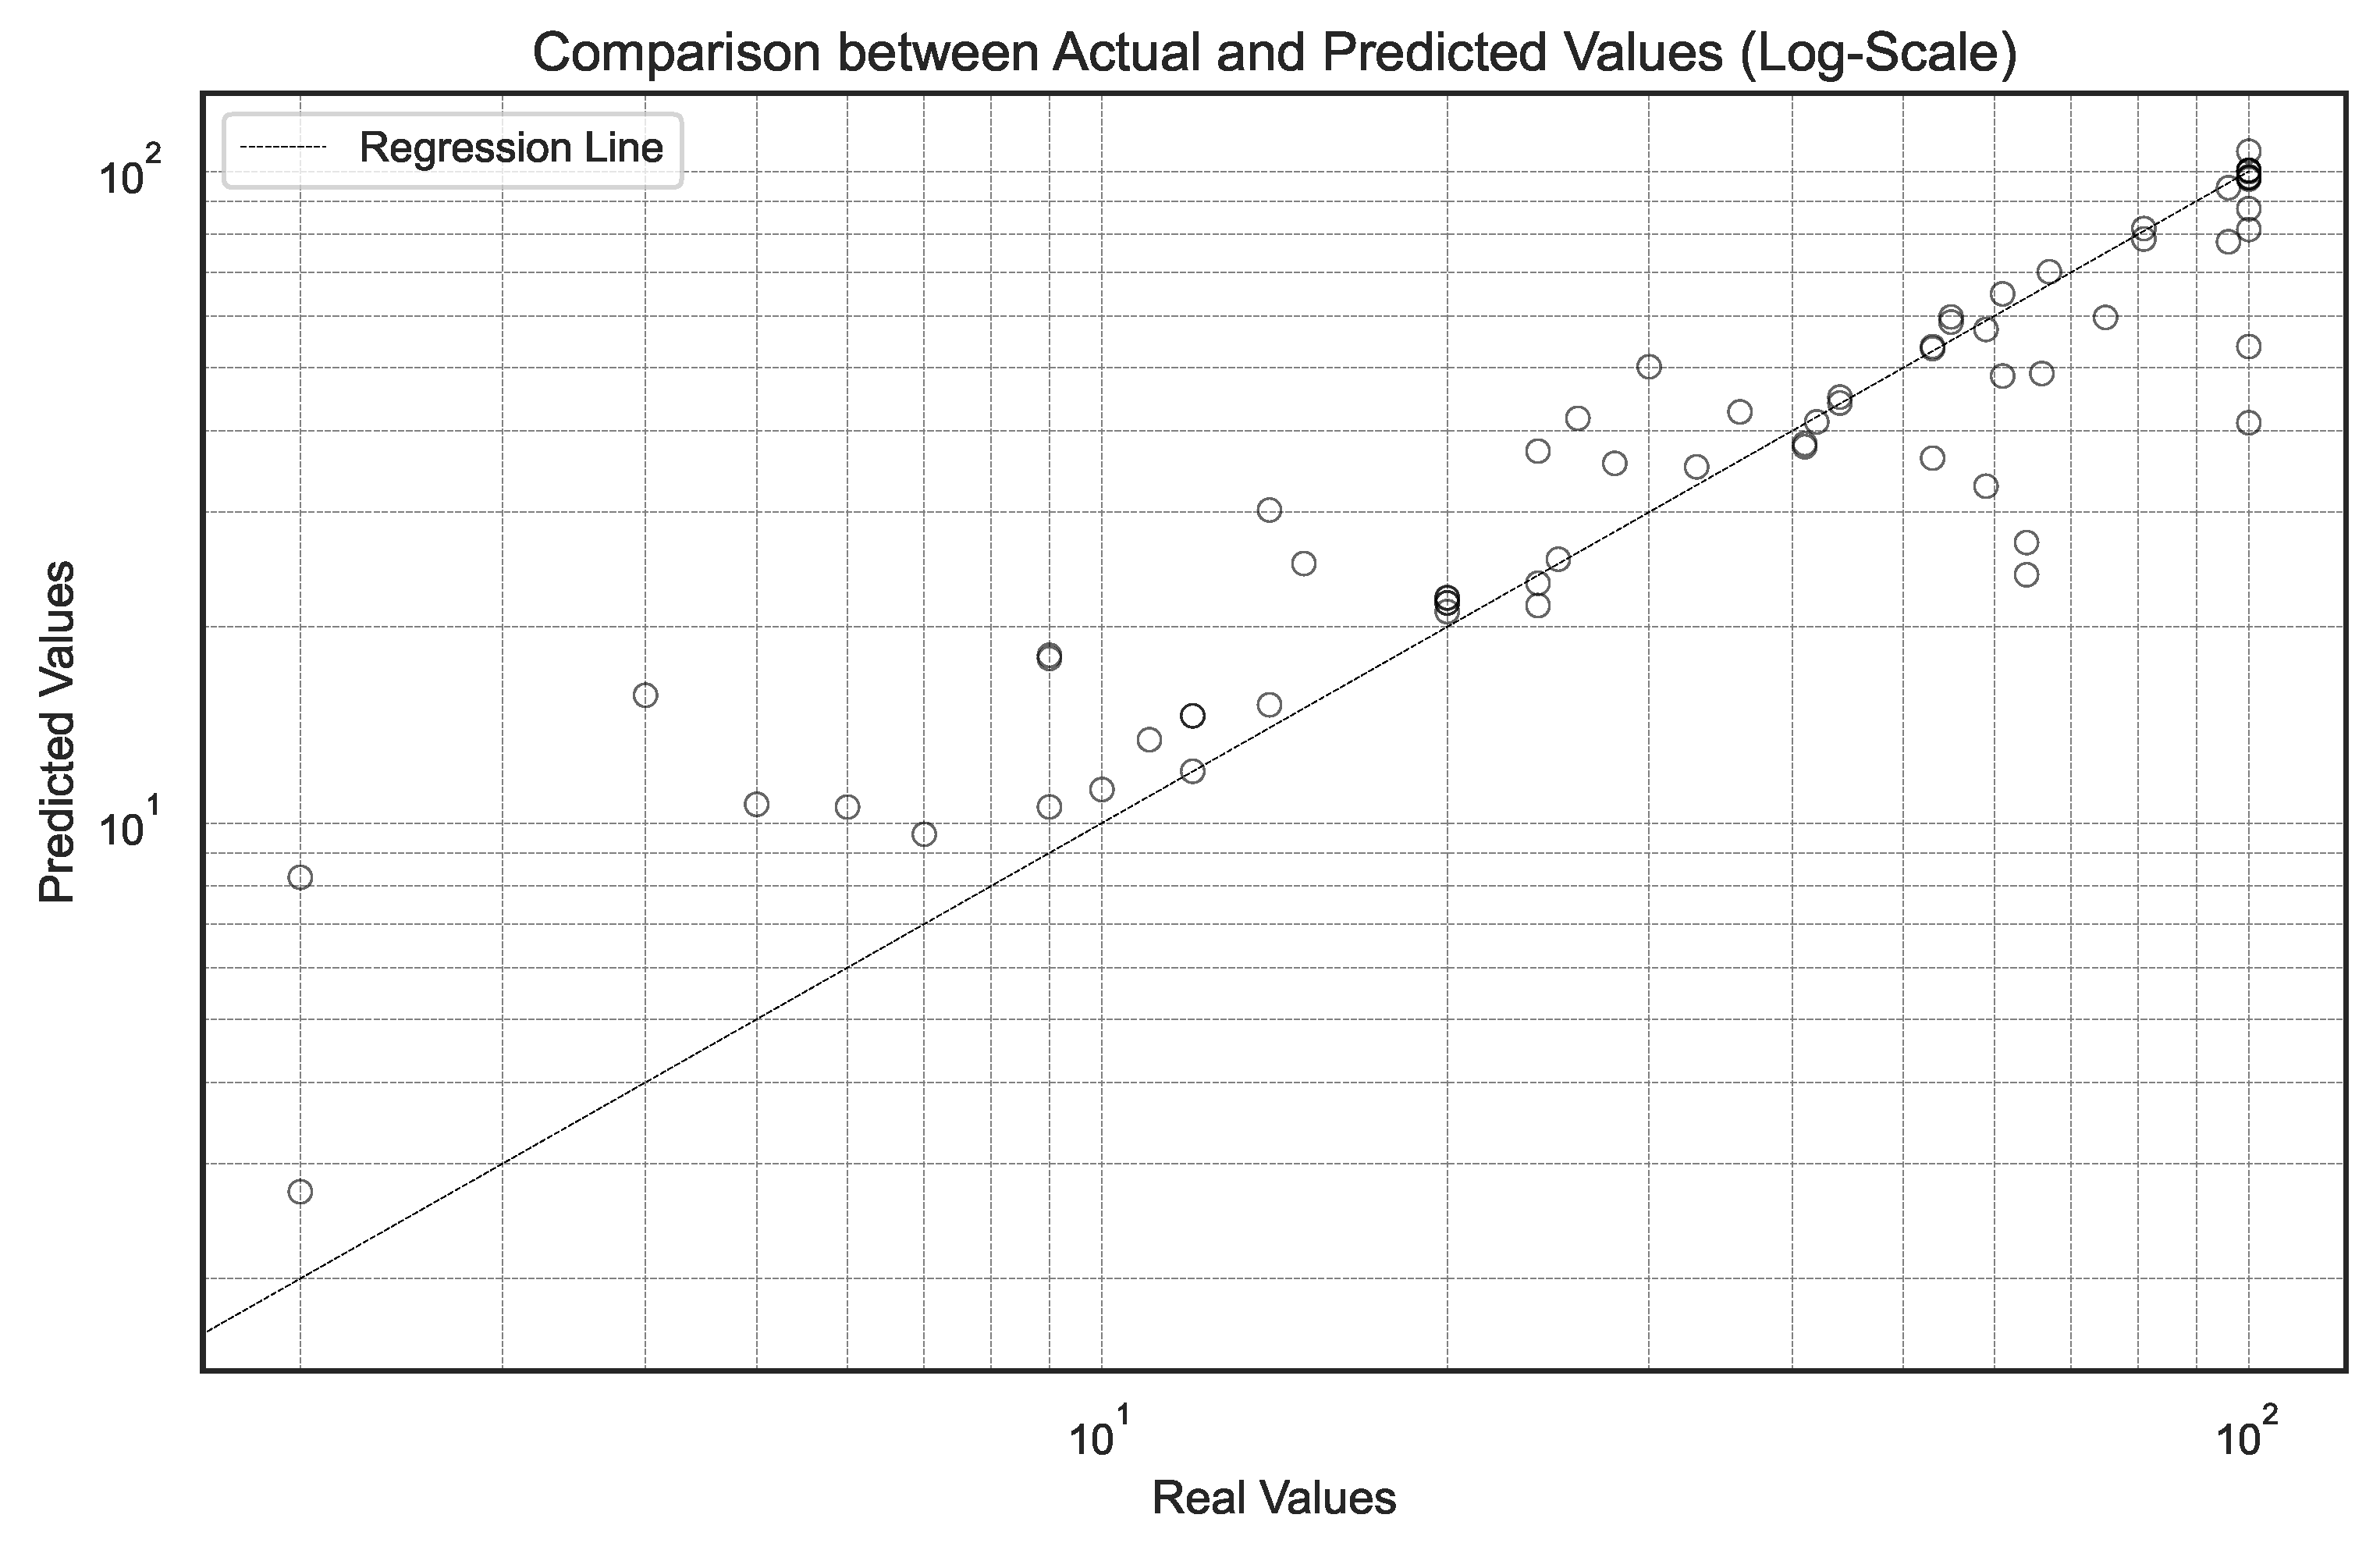
Figure 7 compares real and predicted values of the use of the wristband in a logarithmic scale. A remarkable match is observed between both axes, especially between the real values between 10 and 60, where most predictions align closely to the diagonal, evidencing that the model accurately represents the most frequent usage patterns. At the extremes, the dispersion increases slightly: at low values (less than 10), there is a slight tendency towards overestimation, while above 60, some underestimated cases are identified. Even with these variations, the distribution of points maintains a coherent trajectory, reflecting a clear proportional relationship between predictions and observed data. This confirms that the model adequately captures the dynamics of device usage, particularly in the moderate usage range, which concentrates most of the analyzed records.
Based on the graphical analysis and the results obtained for the wristband target variable, it can be concluded that the predictive model, based on an assembly strategy, effectively captured the relationship between the selected attributes and the device usage behavior. As shown in
Table 4, the model achieved an MAE of 4.10, an RMSE of 7.88, and a coefficient of determination of R
2 = 0.86 in the test set, reflecting a good predictive ability with an acceptable margin of error. Ultimately, the importance analysis of variables (
Table 5) supports the personal characteristics, such as the BMI, along with environmental conditions, such as the average CO
2, and perceptions of comfort, such as ColdTempSat (satisfaction with cold temperature), as the most influential factors in the prediction. The relevance of these variables suggests that physiological attributes, environmental conditions, and subjective thermal perception are key determinants to explain the use of this personal comfort system. Together, these results validate the usefulness of the combined variables selection approach, data augmentation, and automated modeling with H2O AutoML.
3.6. Predictive Model Results for Fan
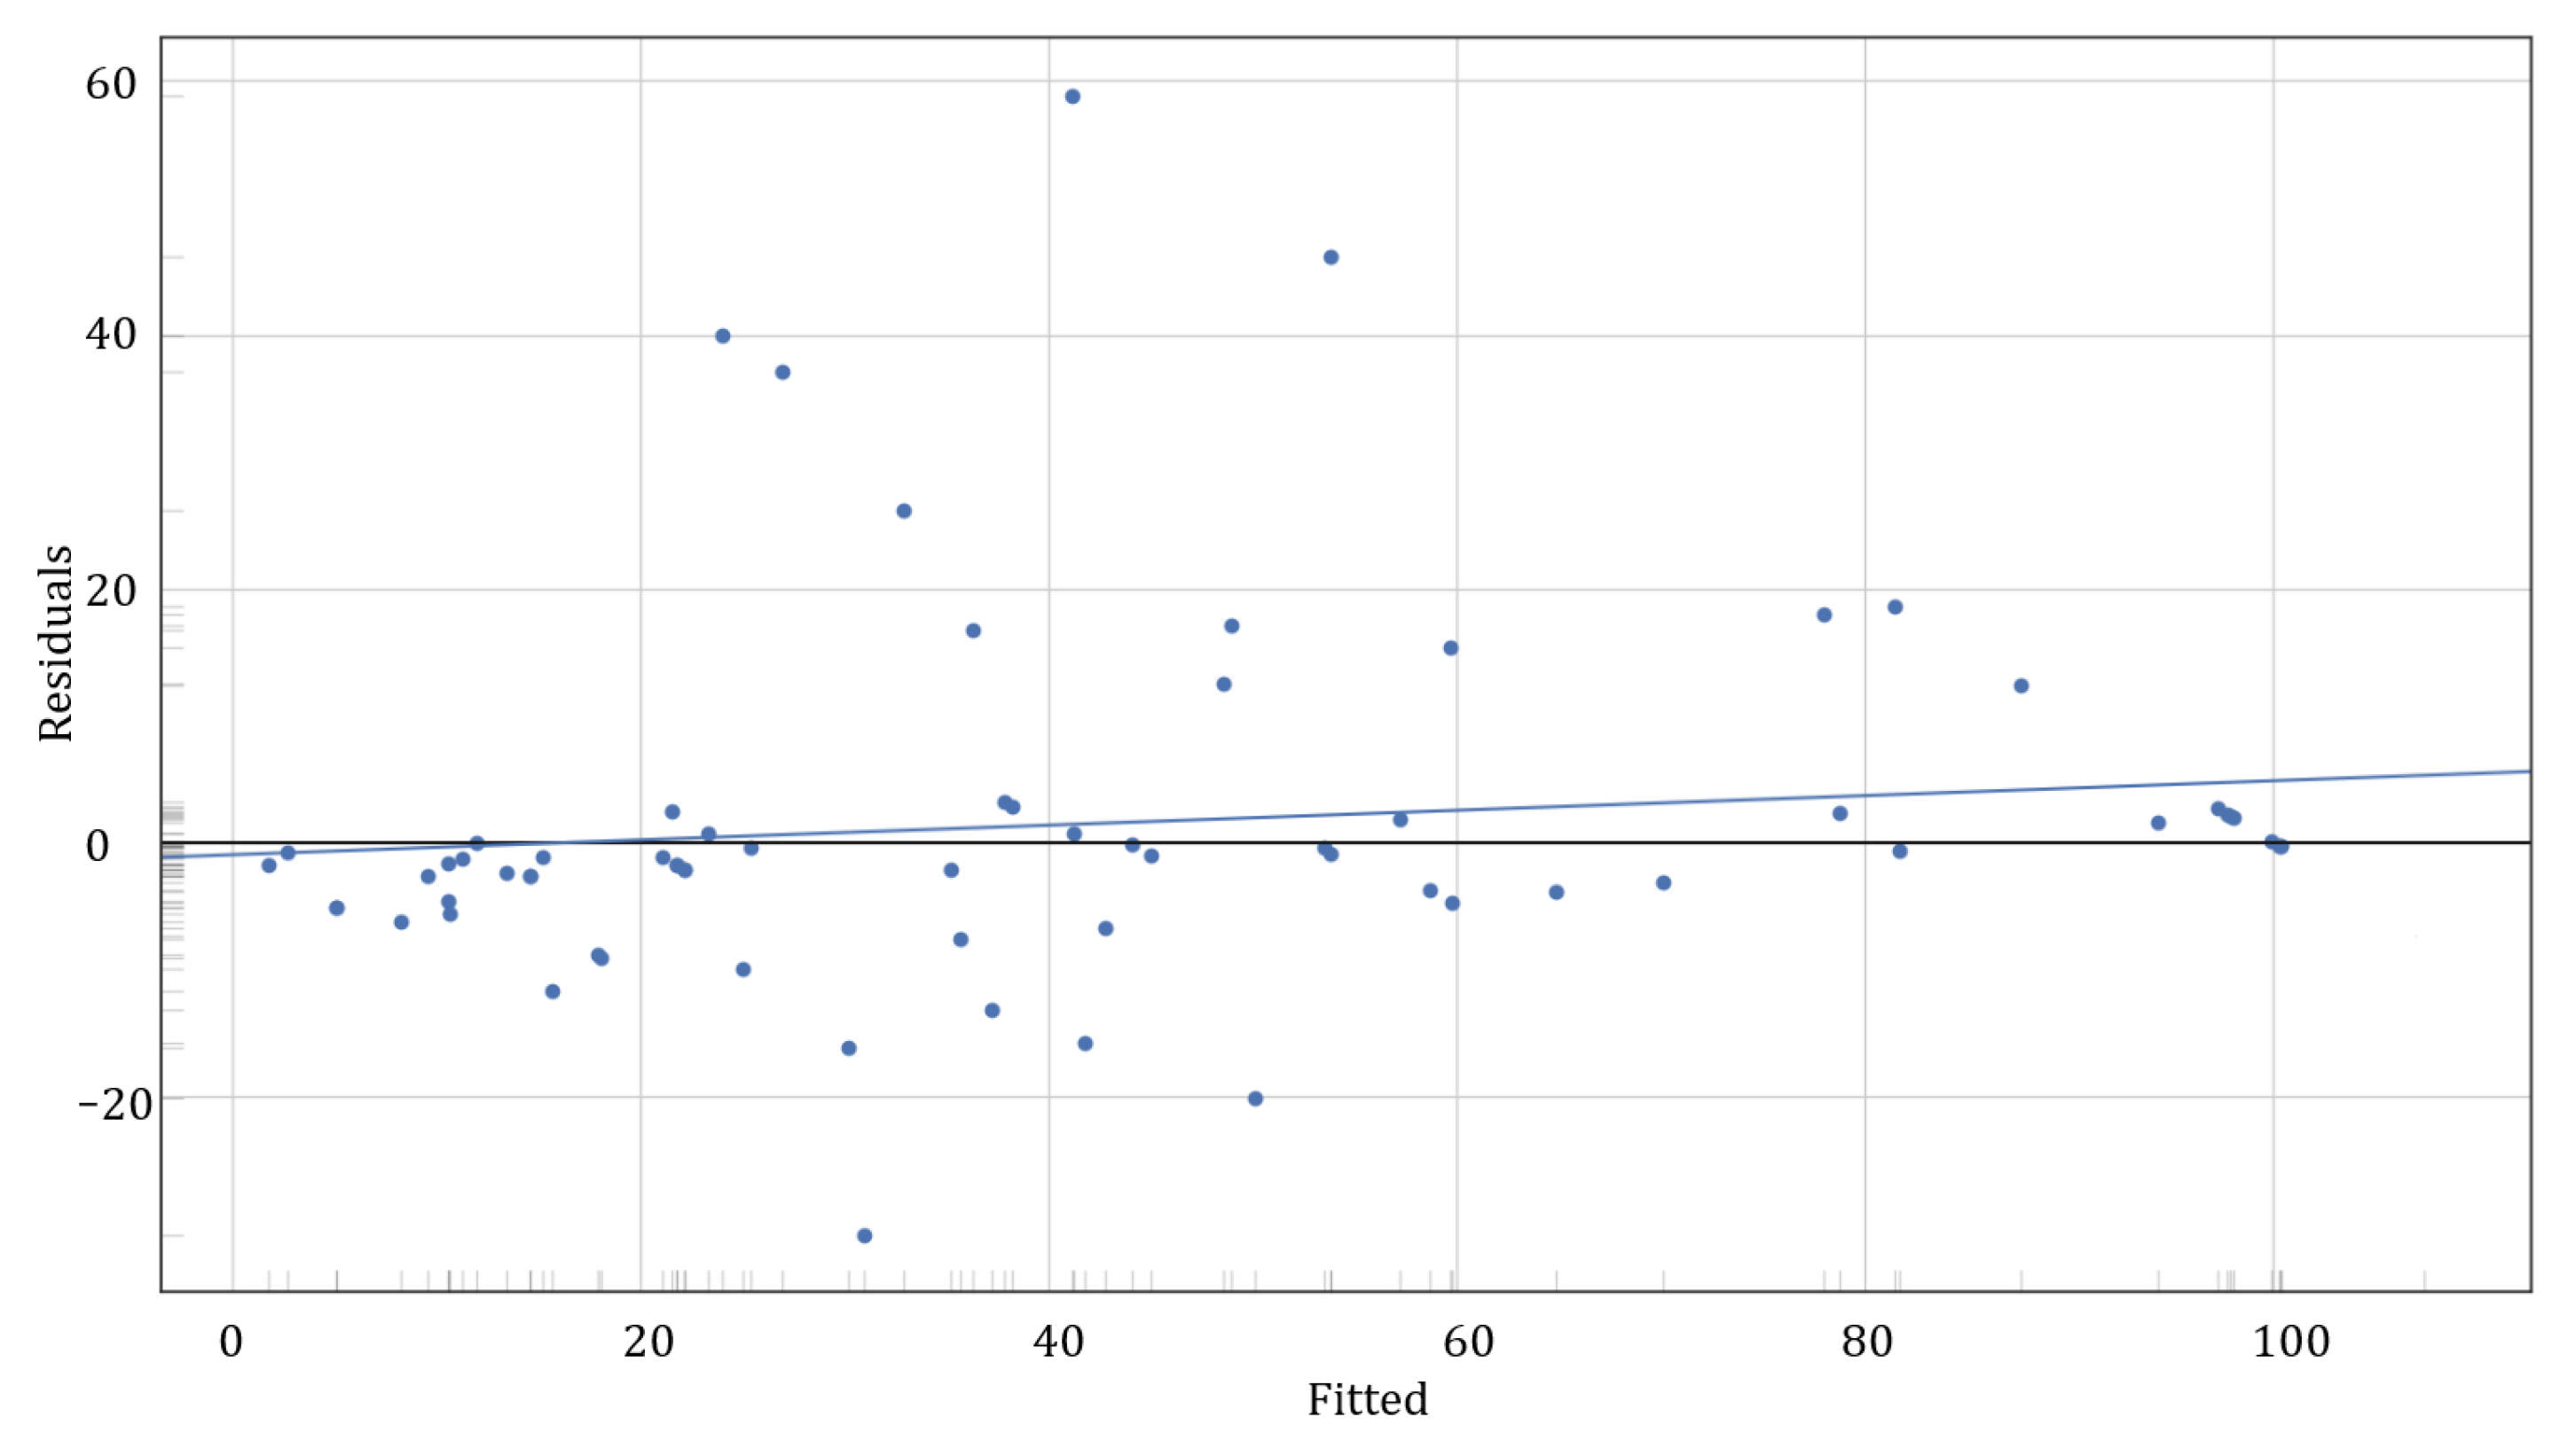
The residual graph of
Figure 8 shows a moderately dispersed distribution of the residuals concerning the fit values, with more significant variability as the predicted values increase. Some outliers indicate notable deviations in the predictions, especially in the middle and high ranges. However, the general trend of the residuals remains close to the zero axis, which suggests that the model does not have marked systematic biases, although it could benefit from improvements at the extremes of the prediction range.
Figure 9 shows the comparison between the actual values and those estimated by the model for the case of the fan, using a logarithmic scale in both axes. The analysis reveals that the model offers higher accuracy in the medium–high range, approximately between 10 and 60 percentage of use, where most points are grouped near the regression line, reflecting a stable match between the observed and the predicted. On the other hand, for values below 10, cases with higher predictions than the actual observations are identified, indicating a tendency towards overestimation in that range. Conversely, at the upper end, above 60, some points are located below the fit line, which suggests certain underestimations. Although limited, these deviations could be related to lower data representativeness at the extremes or external variables not included in the model, such as natural air circulation, specific hours of use, or seasonal particularities. Despite these particular discrepancies, the overall relationship between the predicted and actual values remains consistent, reflecting an adequate ability of the model to capture the main dynamics of device use in real conditions.
Based on the graphical analysis and the results obtained for the fan target variable, it can be concluded that the predictive model, also based on an assembly strategy, achieved a robust performance. According to
Table 4, the model obtained an MAE of 8.11, an RMSE of 14.02, and a coefficient of determination of R
2 = 0.84 in the test set. These metrics indicate a good predictive ability, considering the complexity of the modeled phenomenon. Regarding the importance of the variables (
Table 5), the BMI is highlighted again as the most relevant predictor, along with variables linked to thermal perception, WarmTempSat, and environmental conditions, such as the AvOutTemp. The presence of perception variables and personal characteristics reinforces the idea that the use of the fan is closely related to the perceived individual thermal comfort and not only to objective environmental conditions. These findings confirm the usefulness of the combined approach of data augmentation, automated attribute selection, and ensemble models within AutoML for understanding the use of personal comfort systems.
3.7. Predictive Model Results for the Lamp
The residual graph of
Figure 10 shows a greater dispersion of the residuals compared to the other target variables, with several outliers, particularly in the intermediate ranges. Although most of the residuals are clustered near the zero axis, the inclination of the trend line and the amplitude of some errors suggest some instability of the model to predict certain cases accurately. This dispersion may be related to the highly asymmetric distribution of the data and the presence of many values close to zero, which makes it difficult to generalize the model in more diverse scenarios.
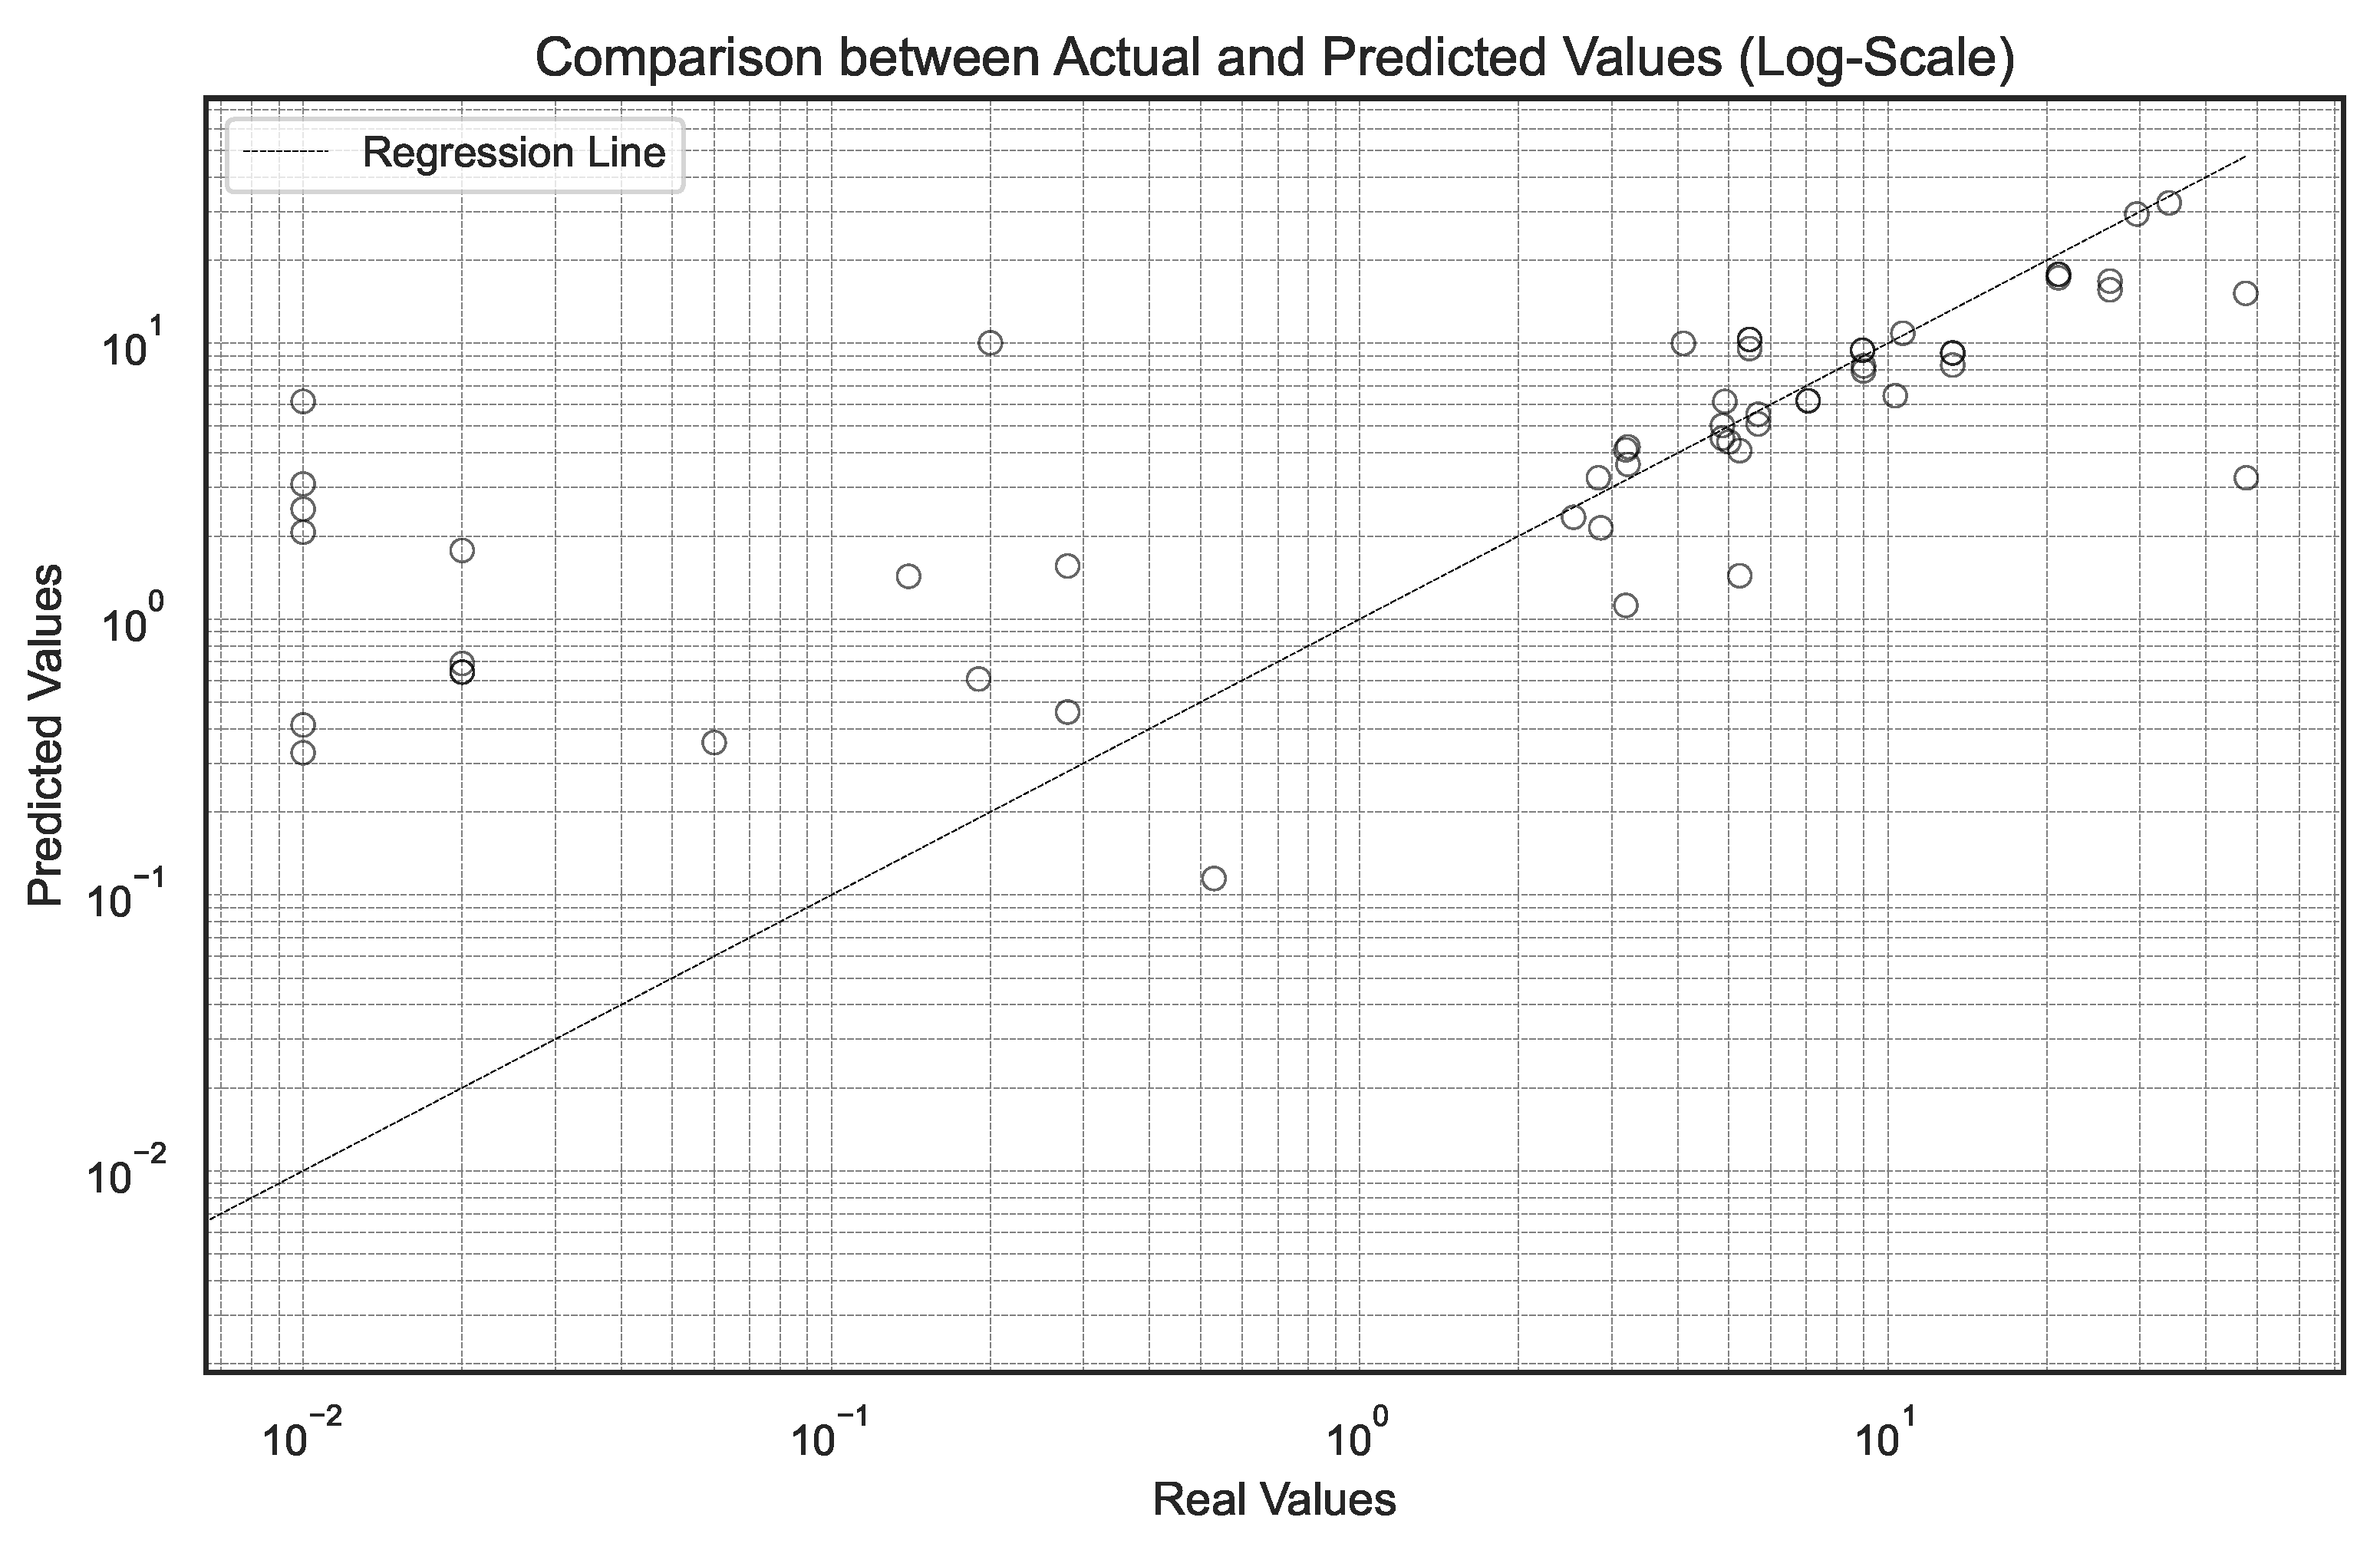
Figure 11 represents the relationship between the actual values and those estimated by the model for the use of the lamp, using a logarithmic scale in both axes. It is seen that a large part of the data is concentrated at low real values, below 1, which reflects the low frequency of use of the device in the analyzed context. The model exhibits a remarkable dispersion in this range, with predictions ranging from values close to zero to overestimations greater than one unit. On the contrary, in the range between 1 and 20, where the values are grouped with greater representativeness, the alignment with the regression line is clearer, indicating a more coherent proportional relationship between what was observed and what was predicted. However, towards the upper end of the horizontal axis, where the highest actual values are presented, a tendency of the model to slightly underestimate the use is observed, with points below the fitted line. This behavior suggests that the model’s accuracy decreases at the extremes of the distribution, which could be attributed to the small number of records in those ranges and the absence of relevant contextual variables in the training process. Even so, the model manages to capture the general structure of the usage pattern, especially in the middle ranges where the density of observations is higher.
As for the performance metrics,
Table 4 shows that the model for the lamp obtained an MAE of 2.93, an RMSE of 7.18, and an R
2 = 0.52 in the test set, representing the lowest performance among the three target variables. This lower predictive capacity can be attributed, in part, to the low frequency of actual use of the device and the low informational variability between the records, which limits the model’s ability to learn robust patterns. Regarding the importance of the variables (
Table 5), it is observed that the most influential attributes were the average CO
2, age, and BMI, followed by thermal perceptions, such as ColdTempSat and the perceived temperature level (Temp). The lower presence of direct or active control environmental variables could partly explain the model’s greater difficulty in capturing accurate usage behaviors. These results highlight the need to include a more balanced set of attributes or explore alternative modeling approaches that explicitly address the skewed nature of the distribution using personal lighting systems. Overall, the results show the effectiveness of the methodological approach adopted to predict the use of personal comfort systems in office environments. The models generated through AutoML, using selected variables in an automated and validated way, achieved a robust performance in the three target variables, with remarkable precision in the cases of the wristband and fan, where coefficients of determination (R
2) of 0.86 and 0.84 were reached, respectively. Although the model associated with the lamp showed a more limited performance (R
2 = 0.52), this is related to the high concentration of low values in the distribution and a reduced wealth of information in the associated variables. Graphical analysis of residuals and comparison between actual and predicted values support these findings, confirming the overall validity of the approach and the areas where there are opportunities for improvement. Likewise, the importance analysis of variables consistently highlights the role of personal (such as BMI and age), environmental (such as CO
2 and outdoor temperature), and subjective perceptions of comfort factors, reaffirming the need to consider multiple objective and subjective dimensions when modeling adaptive behaviors in indoor spaces. These findings lay a solid foundation for developing more intelligent, efficient, and user-centered space climate control management strategies complemented by new environmental comfort models.
5. Conclusions
This study explored the feasibility of predicting the use of Personal Comfort Systems (PCS) in office environments using models developed with H2O AutoML, using environmental, spatial, physiological, and perceptual data collected in real occupancy conditions. The results obtained validate the potential of automated machine learning strategies to capture complex interactions between user characteristics and the physical and environmental conditions of the indoor environment, allowing accurate and interpretable predictions about the use of PCS devices. This translates into the improvement of people’s comfort and well-being, promoting, at the same time, an efficient and optimized energy use in terms of air conditioning. Among the devices evaluated, the predictive models associated with the thermal wristband and the desk fan achieved the best performance, with R2 values of 0.86 and 0.84, respectively, which confirms their high explanatory capacity. In contrast, the model for the lamp showed a lower generalization capacity (R2 = 0.52), possibly due to the concentration of use values in low ranges and a lower wealth of explanatory attributes. Despite these differences, the assembly-based modeling strategy proved effective in all three cases, especially when combined with previous variable selection processes. The constant presence of personal variables (such as BMI and age), environmental conditions (for example, the level of CO2 and the outdoor temperature), and subjective satisfaction indicators (such as perceived comfort with furniture or thermal satisfaction) highlights the multifactorial character of individual comfort. These findings support the hypothesis that comfort cannot be explained solely through physical measurements and must incorporate perceptual and behavioral dimensions. Ultimately, this work provides a preliminary but solid basis for developing flexible user-centered control systems. By allowing the use of PCS to be anticipated, the generated models can inform more responsive and energy-efficient building management strategies, particularly in contexts with high climatic variability or limited infrastructure. Future efforts should focus on incorporating temporal dynamics with real-time control systems, expanding data sources, and validating the transferability of models to promote scalable and equitable solutions to improve indoor environmental quality.


 ,
, 