Article

Evaluating Accessibility and Equity of Multi-Level Urban Public Sports Facilities at the Residential Neighborhood Scale

by
Wenchao Wang
1,
Yujun Cai
1,*,
Xiangrui Xiong
2 and
Genyu Xu
3
1
School of Physical Education, Shanghai University of Sport, Shanghai 200438, China
2
Research Institute of Architecture, Southeast University, Nanjing 210096, China
3
School of Architecture and Planning, Yunnan University, Kunming 650500, China
*
Author to whom correspondence should be addressed.
Buildings 2025, 15(10), 1640; https://doi.org/10.3390/buildings15101640
Submission received: 11 April 2025 / Revised: 9 May 2025 / Accepted: 12 May 2025 / Published: 13 May 2025
(This article belongs to the Section Architectural Design, Urban Science, and Real Estate)

Abstract

:
Accurately assessing the accessibility and equity of urban public sports facilities is essential for improving public service provision and enhancing residents’ well-being. However, most existing studies rely on administrative units such as subdistricts and communities, often overlooking the multi-level structure of such facilities and failing to reflect their distribution within the spatial scope of residents’ daily activities. To address this gap, this study adopted the residential neighborhood as the basic unit of analysis and developed an integrated methodological framework combining the average nearest neighbor index, kernel density estimation, a Gaussian-based two-step floating catchment area method, the Gini coefficient, and location quotient analysis. When applied to Shanghai, the framework revealed distinct spatial patterns across facility levels, exhibiting scale-dependent characteristics. Community-level and residential-level sports facilities were found to be relatively accessible, whereas city-level and subdistrict-level sports facilities showed limited accessibility, particularly in peripheral suburbs. All facility levels exhibited varying degrees of spatial inequality, highlighting persistent issues of spatial justice. These findings provide empirical evidence to inform the spatial optimization of public sports facilities and to promote more equitable access to urban public services.

1. Introduction

As global urbanization intensifies and health demands grow, the optimal configuration of urban public sports facilities has emerged as a central issue in urban governance research [1,2,3]. In China, over 60% of the population resides in urban areas, a figure projected to rise to 70% by 2030 [4,5]. Urbanization has been linked to declining physical activity levels [6,7,8], as it reshapes daily routines and increases reliance on motorized transport. Reduced walkability and limited access to public sports facilities further discourage active lifestyles [9,10]. These trends contribute to rising obesity rates and a growing prevalence of chronic diseases such as diabetes, cardiovascular conditions, and hypertension in urban populations [11,12,13,14]. In this context, enhancing urban public sports facilities is widely recognized as an effective strategy for addressing health challenges [9,15,16,17,18,19].
The Chinese government has proactively addressed this issue through initiatives such as the National Fitness Plan (2021–2025), which aims to expand access to public fitness spaces and strengthen the national fitness service infrastructure [20]. According to Lefebvre’s theory of the production of space, public sports facilities can be understood not merely as physical infrastructures but as socially produced spaces shaped by political, economic, and cultural forces [21]. Consequently, despite policy efforts, public sports facilities still face significant challenges, including spatial distribution imbalances, low utilization rates, and substantial regional disparities [22,23]. These issues are particularly pronounced in megacities such as Shanghai, where the population density is high and land resources are constrained [24]. While local plans, such as Shanghai’s 14th Five-Year Plan for Public Sports Facilities, set clear targets for per capita provision (e.g., 2.6 m2 by 2025) [25], they pay relatively limited attention to issues of accessibility and equity at the neighborhood scale. Therefore, precisely assessing the spatial accessibility and equity of urban public sports facilities has both theoretical value and practical significance for optimizing urban public services and promoting spatial equity.
Research on the accessibility and spatial equity of urban public sports facilities has traditionally relied on administrative units, such as subdistricts or communities, as the primary spatial scale of analysis [23,26]. Although this approach simplifies data collection and aligns with existing policy frameworks, it often neglects the nuances of residents’ actual activity spaces [27]. As a result, such methods may not fully capture the distribution and service capacity of sports facilities across different tiers within the geographic range of residents’ daily lives. Moreover, urban public sports facilities are not spatially or functionally homogeneous. Rather, they exhibit clear hierarchical differentiation, ranging from large-scale stadiums serving the entire metropolitan population to small-scale fitness installations integrated within neighborhoods or residential compounds [28]. These facilities differ markedly in terms of spatial configuration, service coverage, and usage frequency. Ignoring this tiered nature may lead to the misallocation of resources, diminished service efficiency, and exacerbation of spatial inequities [29,30,31].
To address these limitations, this study adopts the residential neighborhood as the fundamental unit of analysis and proposes a comprehensive methodological framework to evaluate the spatial accessibility and equity of multi-tiered public sports facilities. The framework integrates several spatial analytical techniques, including the average nearest neighbor index, kernel density estimation, a Gaussian-based two-step floating catchment area method, the Gini coefficient, and location quotient analysis. This integrated approach enables a more precise and context-sensitive assessment of how sports facilities are distributed and accessed across the city.
Using Shanghai as a case study, this research explores the spatial distribution characteristics of multi-level public sports facilities, examines accessibility levels across different facility hierarchies and their spatial variations, evaluates equity in resource allocation, and develops evidence-based recommendations for optimizing facility placement. These findings will reveal how residential-based analysis can guide more equitable facility distribution in rapidly developing urban areas, offering a scientific basis for urban planners and decision-makers to enhance public service provision, promote social equity, and improve urban residents’ well-being and physical activity opportunities.

2. Literature Review

In recent years, global scholars have deepened their research on urban public sports facilities and developed a relatively comprehensive theoretical framework [32,33]. Early studies primarily focused on the spatial distribution characteristics of sports facilities [34], employing kernel density analysis and nearest neighbor indices to analyze spatial patterns [23]. As research evolved, scholars introduced the concept of accessibility, evaluating the convenience of facility use for residents in different areas by measuring distance, travel time, or cost [35,36,37]. Methods for measuring accessibility generally fall into two categories: the first involves collecting residents’ subjective perceptions through surveys and interviews to reflect actual user experiences [38]; the second entails objectively quantifying service areas and spatial coverage using GIS-based analysis techniques [39,40]. Unlike studies limited to spatial distribution, accessibility research offers a more precise understanding of how well sports facilities meet people’s actual needs. It serves as a vital link between the availability of facilities and the demands of a residential neighborhood.
Equity has recently emerged as a significant research focus. A key trend is the shift from spatial equity to social equity considerations [32]. Studies on equity include service recipients in their analytical approaches, analyzing the correlation between the distribution of sports facilities and population demographics, with a focus on the social justice aspect of how these facilities are allocated [41,42,43]. When assessing equity in public sports facilities, researchers commonly use Gini coefficients and concentration indices to present the consistency between facility and population distributions from a global perspective [32,44], or use location quotients and coverage indices to precisely characterize the degree of spatial population matching [45,46], thereby identifying potential inequities in resource allocation. Equity analysis addresses limitations in accessibility research by incorporating population coverage metrics for sports facilities, becoming a key dimension for assessing the social effects of facility distribution. This approach helps to address the gaps in accessibility research [31]. Nonetheless, equity analysis is best viewed as a complement rather than a replacement for distribution and accessibility studies, as it continues to emphasize the spatial relationship between facilities and proximate populations [47].
In the analysis of accessibility and equity in urban public services, the selection of the analytical unit is critical for the validity and contextual relevance of research findings [48,49]. Traditional studies often rely on administrative boundaries, such as subdistricts, communities, or census tracts, as the fundamental spatial units [27,28,29,50]. While these units facilitate data aggregation and management, such boundary-based approaches tend to obscure intra-unit spatial heterogeneity and may misrepresent actual patterns of accessibility, particularly when the spatial scale exceeds the scope of individuals’ daily activity spaces [30]. It is well established that analytical outcomes are highly sensitive to the size and configuration of spatial units, a challenge commonly referred to as the Modifiable Areal Unit Problem (MAUP) [51,52]. Larger spatial units are particularly prone to masking localized disparities, which can lead to distorted or misleading conclusions. To address these challenges, recent studies have increasingly adopted residential neighborhoods as the basic unit of analysis, offering a more accurate assessment of spatial accessibility and equity [30,31]. However, the broader application of this approach has been constrained by the limited availability of high-resolution and publicly accessible spatial data.
Despite the continuous progress in the research on public sports facilities, there are still two key limitations in the existing literature. First, the prevailing tendency to treat these facilities as a single, uniform category overlooks their inherent multi-level structure. Failing to distinguish between city, subdistrict, community, and residential-level facilities, each with distinct service scopes and target users, hinders effective spatial planning. Our research specifically tackles this gap by analyzing accessibility and equity across these distinct facility levels. Second, despite recent efforts to move beyond administrative boundaries, analyses grounded in residential neighborhoods, which better capture the nuances of daily life and activity spaces, are scarce. Relying on larger administrative units often masks significant local disparities due to the modifiable areal unit problem. Therefore, this study utilizes fine-grained, residential-level spatial data to provide a more accurate and locally relevant assessment of facility access and equity, overcoming the limitations of previous coarser-scale analyses.

3. Data and Methods

3.1. Study Area and Data
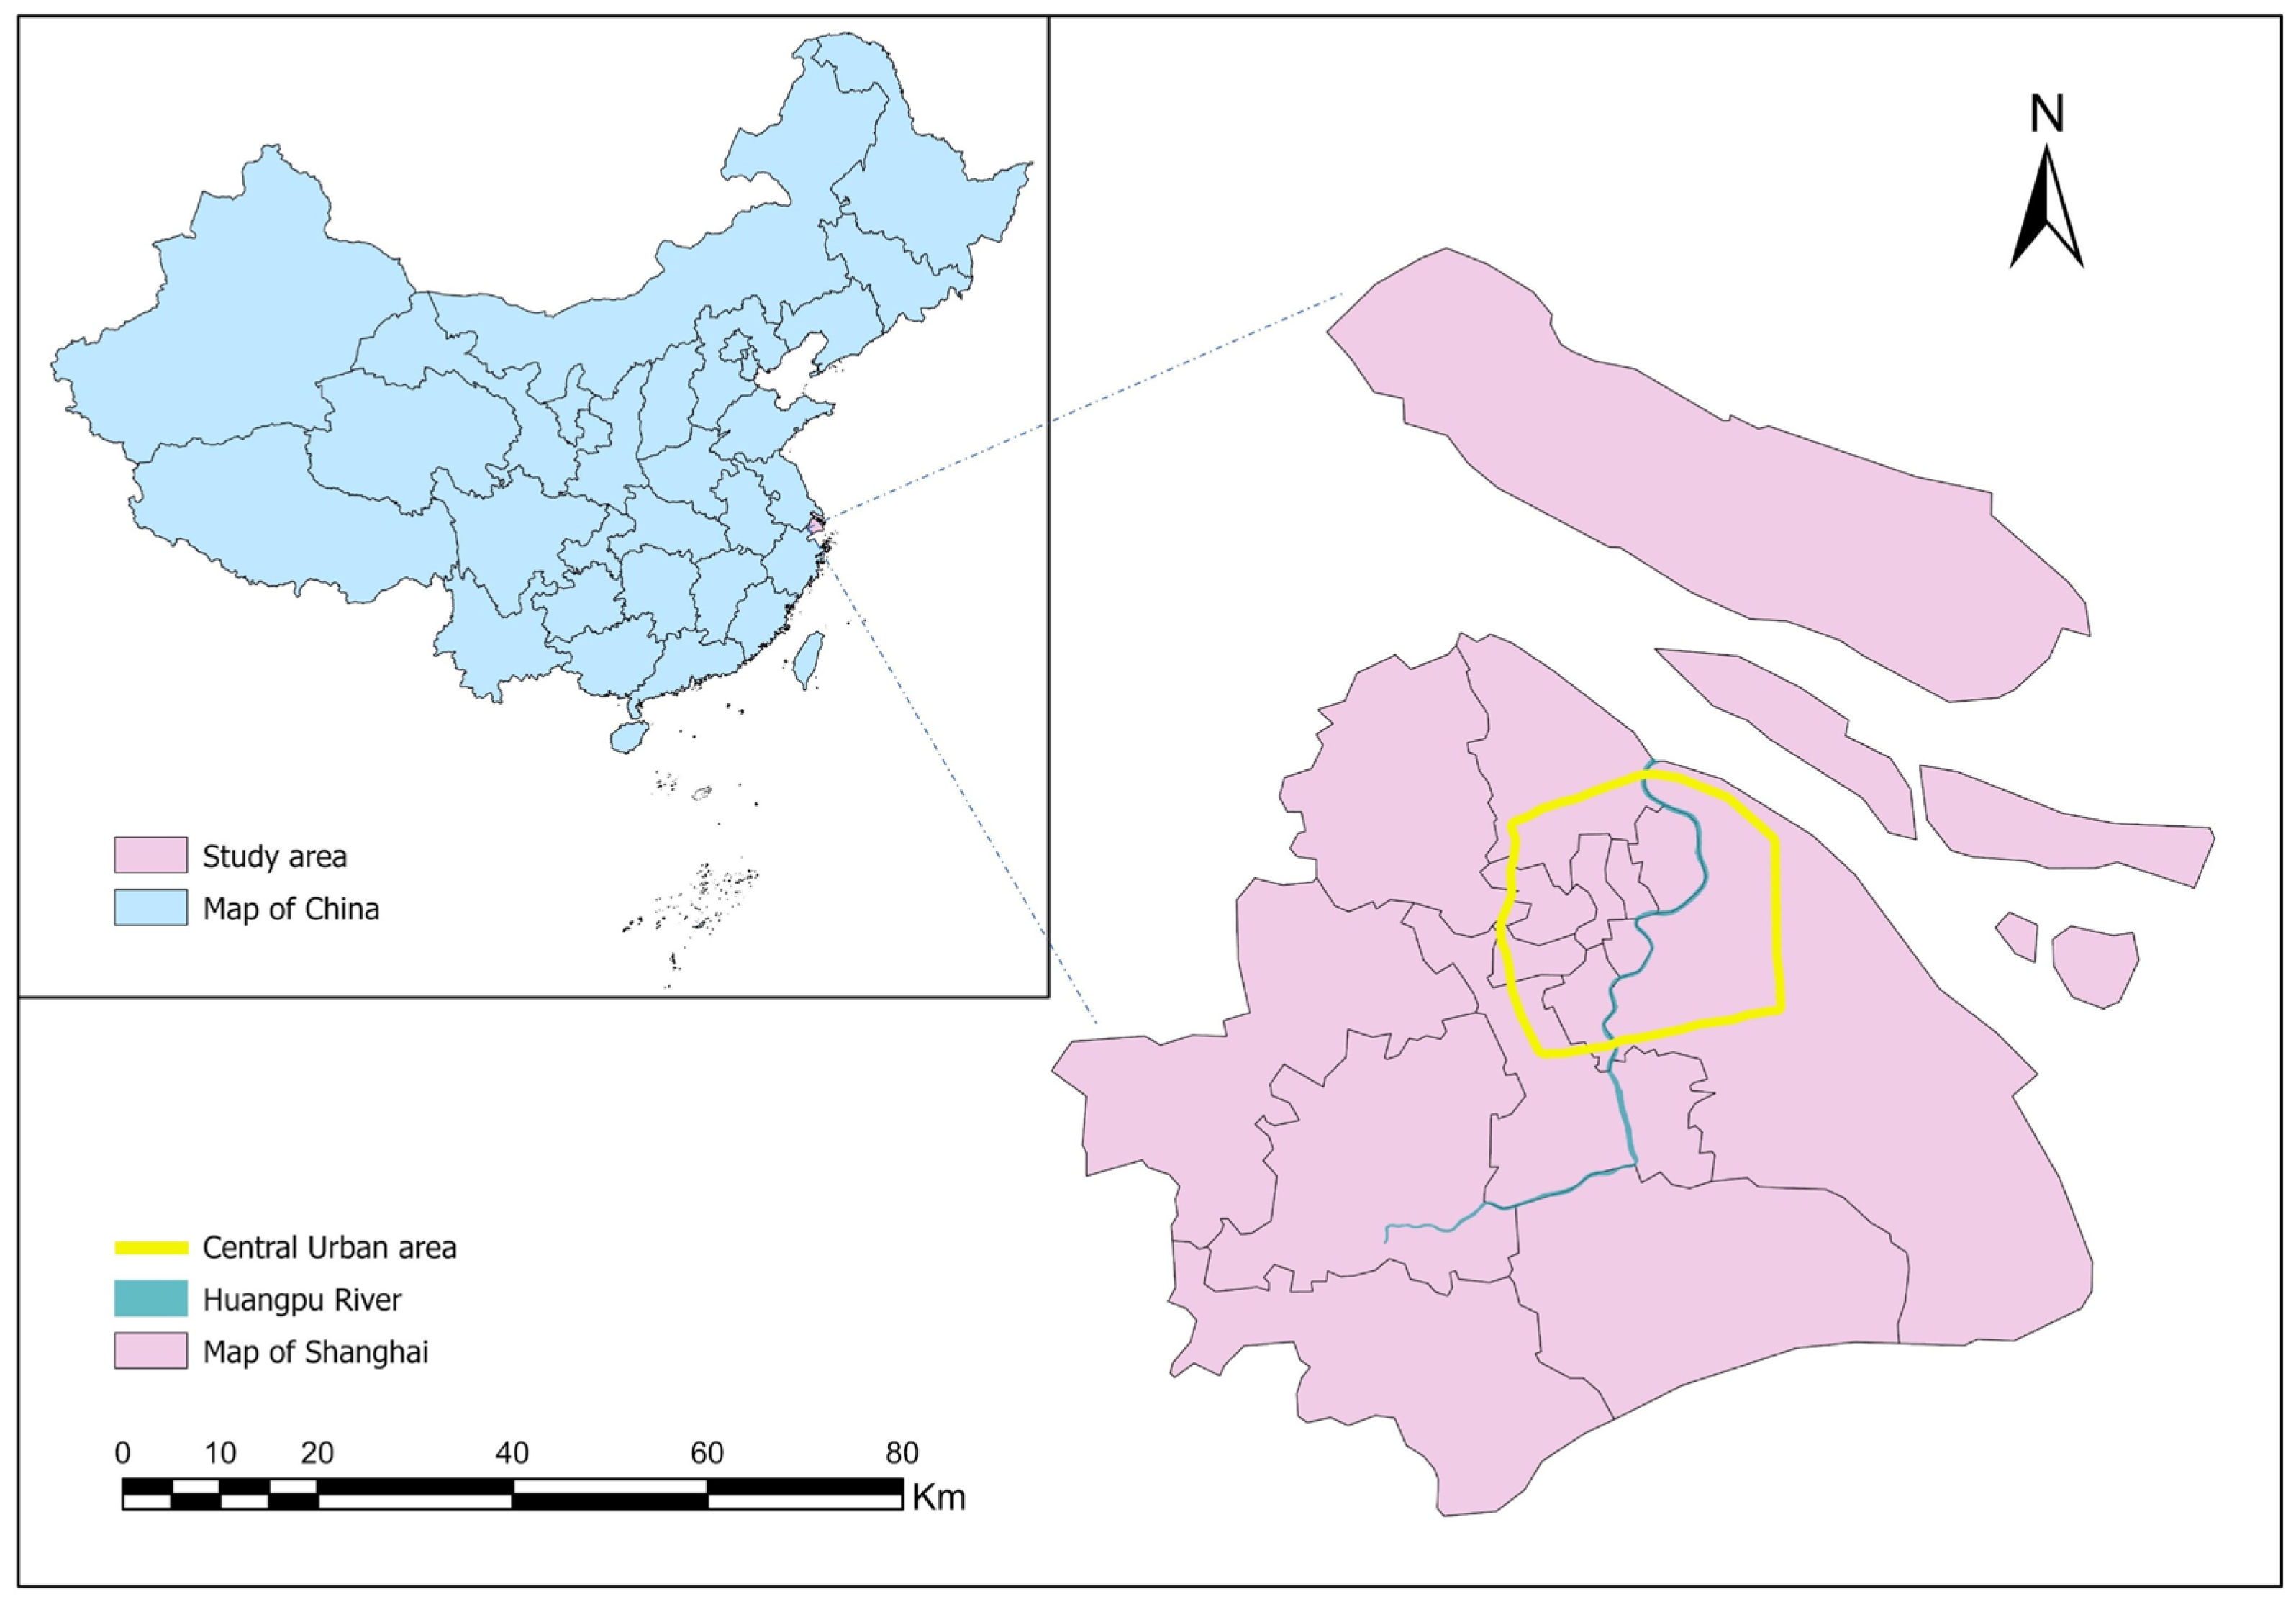
3.1.1. Study Area

Shanghai, located on the southern bank of the Yangtze River estuary in eastern coastal China, serves as a strategic hub for both the Belt and Road initiative and Yangtze River Economic Belt development strategies (Figure 1). As one of China’s leading economic centers, the city consists of 16 districts covering approximately 6341 km2, with an urbanization rate of 89.3%. As of late 2023, Shanghai had a population of approximately 24.7 million and hosted 59,702 sports facilities occupying a total area of 64.72 million m2 [53,54].
Shanghai is an ideal case study because of its high population density, diverse demographics, and complex urban layout. As it aims to become a “globally renowned sports city”, the city has built and upgraded many facilities, from large stadiums to community spaces, creating a rich scenario for accessibility research. Its detailed data on planning, demographics, and sports infrastructure allow for precise spatial analysis, while its urban governance leadership offers lessons for other developing cities.

3.1.2. Data Sources

Data on sports facilities, residential areas, and road networks for this study were collected during April–May 2024. We gathered information from government open data platforms, third-party mapping services, and commercial information platforms. After collection, two researchers with relevant expertise verified and cleaned the dataset. The process involved removing outliers, validating and correcting geospatial coordinates, and identifying and merging duplicate records. We also standardized field formats and naming conventions.
(1) Sports facilities data.
For this study, data on public sports facilities were obtained from the Shanghai Public Sports Facilities Digital Management Service Platform (https://www.shggty.com.cn/facilityMap.html), accessed on 20 May 2024. This official platform provides detailed information regarding the name, address, type, service coverage, and geographic coordinates of sports venues across Shanghai. Data were collected on 20 May 2024. Following a detailed process of data cleaning and validation, we excluded records with unusually large or small facility areas, incorrect or implausible geographic coordinates, and any repeated entries. As a result, 23,174 records were deemed valid and used for the analysis.
Due to the absence of a specific local standard for the allocation of public sports facilities in Shanghai, this study refers to two key planning documents to establish a classification framework. The first is the Urban Public Service Facilities Planning Standard (GB 50442), a national guideline issued by the Ministry of Housing and Urban–Rural Development of China and applied nationwide [55]. The second is the Shanghai Spatial Planning Standard for the 15-Minute Community Life Circle (Draft for Public Consultation) [56]. Based on these sources, sports facilities are classified into four levels: city-level, subdistrict-level, community-level, and residential-level.
City-level sports facilities, such as sports centers, stadiums, gymnasiums, and natatoriums, serve the entire city with a radius of about 5000 m. Examples include the Shanghai Stadium and Hongkou Football Stadium. Subdistrict-level sports facilities, located within streets or districts, serve areas with a 2500 m radius. These include citizen fitness centers, stadiums, and swimming pools, such as the Jiangwan Sports Stadium. Community-level sports facilities, with a 1000 m radius, include public sports courts, fitness rooms, and senior exercise centers. The Baicheng Road Basketball Court in Yangpu District is an example. Residential-level sports facilities, with a 500 m radius, offer fitness spots and exercise areas within residential neighborhoods. Detailed information for each level is presented in Table 1.
(2) Residential neighborhoods and population data.
We obtained baseline data on residential neighborhoods from Lianjia Shanghai through automated data extraction techniques on 15 April 2024 (available at https://sh.lianjia.com/). To ensure data validity, we conducted a comprehensive cleaning and validation process, including the removal of duplicate entries, correction of abnormal or missing geographic coordinates, and spatial verification against official administrative boundaries. After this process, a total of 22,440 valid residential neighborhood records were retained, representing 906,805 households. To accurately assess the population distribution, we integrated this dataset with statistics from the Seventh National Population Census (2020), enabling the calculation of household size multipliers for each administrative district. Finally, we compared the calculation results with a third-party database (WorldPop dataset) to verify their validity [57].
The population was estimated in two steps: first, we calculated district-specific household-to-population ratios and then applied these ratios to household counts from Lianjia Shanghai to generate population estimates for each residential community. For instance, Huangpu District has a total population of 662,030 with 209,104 households, resulting in an average household size of 3.2 persons. Therefore, based on the information of 560 households in Haizhou Liyuan residential community, we can estimate that the population of this community is 1,792 people.
(3) Road network data.
Road network data were obtained from AutoNavi Maps (available at: https://www.amap.com/) on 21 April 2024. We processed the data through cleaning procedures and centerline extraction. Following this, we converted coordinates from the GCJ-02 to the GCS-WGS-1984 coordinate system. This conversion generated a standardized road network dataset for Shanghai, which served as the foundation for our spatial accessibility analysis. The high-resolution network data represent the urban transportation infrastructure, enabling a precise assessment of service coverage and accessibility patterns throughout the metropolitan area.

3.2. Methods

3.2.1. Methodological Framework

In the planning and configuration of public facilities, three core dimensions—spatial distribution, accessibility, and equity—form the backbone of a well-distributed, accessible, and equitable urban service system [23,28,33]. Spatial distribution provides the structural foundation, determining where resources are physically located and how they are arranged across the urban fabric. Accessibility functions as the essential bridge between supply and demand, influencing how different populations interact with and benefit from these resources. Eventually, equity is the main goal, serving as a foundation for ensuring spatial justice across different spaces. This concept insists that beyond achieving efficiency in resource allocation, urban planners must also address the needs and rights of diverse population groups across different residential neighborhoods [58,59].
This study employed a fine-scale analytical approach using the residential neighborhood as the fundamental spatial unit. This represented a finer spatial resolution compared to previous studies, which typically focused on the city, district, or subdistrict levels. The shift to the residential scale enabled a more precise evaluation of the spatial distribution, accessibility, and equity of public sports facilities. The analysis integrated multiple spatial and demographic datasets, including geolocated public sports facility data, the Seventh National Population Census, delineated residential community boundaries, and the urban road network. Spatial and statistical analyses were conducted using ArcGIS Pro 3.0, which facilitated the integration of several geospatial techniques into a comprehensive evaluation framework.
Specifically, kernel density estimation and the average nearest neighbor index were applied to identify spatial distribution patterns, assess the degree of spatial clustering, and evaluate distributional balance across the study area. The Gaussian-based two-step floating catchment area method was employed to assess spatial accessibility to public sports facilities at the residential community level, incorporating both facility supply capacity and population demand characteristics. To assess spatial equity, the Gini coefficient and location quotient (LQ) were employed to measure disparities in relative accessibility among residential areas and to identify underserved communities. The methodological structure is illustrated in Figure 2.

3.2.2. Kernel Density Estimation

Kernel density estimation (KDE) is a widely used spatial analysis technique that reflects the distribution of point-based geographic data in a defined area. It estimates the probability density function by placing smooth kernel functions around each observation point, thereby illustrating the continuous nature of the spatial patterns. KDE has been shown to be particularly effective in identifying spatial distribution characteristics and clustering patterns in geospatial datasets [60,61]. In this study, the KDE was applied to assess the spatial patterns of public sports facilities using the following formula:
f ( x , y ) = 1 n h 2 i = 1 n k x x i h
where f x , y   is the kernel density estimate at the target location ( x , y )   and characterizes the spatial clustering intensity of geographic elements within the study area; n denotes the total observation sample size, specifically the number of spatial point locations for all public sports facilities in the research region; h is the bandwidth, also known as the smoothing parameter, which controls the influence range of the kernel function; and k x x i h is the kernel function defining the influence weight of observation points on the target location.
In our kernel density analysis, the Gaussian kernel function was employed due to its smooth characteristics, which are particularly suitable for analyzing continuous spatial distributions. When determining bandwidth values, researchers typically choose between two methods: statistical estimation using Silverman’s Rule-of-Thumb or settings based on the service influence range of facilities [62]. We opted for the latter approach to ensure our density distribution results accurately reflect the actual service capabilities and spatial accessibility of sports facilities across different levels. Drawing from the Urban Public Service Facilities Planning Standard (GB 50442) [55], we established specific bandwidth parameters: 5 km for city-level facilities, 2.5 km for subdistrict-level facilities, 1 km for community-level facilities, and 0.5 km for residential community-level facilities. This methodological choice enhances both the credibility and practical significance of our analysis within urban planning contexts. To classify the resulting density values, we implemented the Jenks Natural Breaks method, dividing them into five levels. This classification technique minimizes within-class variance while maximizing between-class differences, thereby reducing the influence of subjective judgment on our results.

3.2.3. The Average Nearest Neighbor Index

The average nearest neighbor (ANN) method was employed to determine whether the spatial distribution pattern of public sports facilities exhibited dispersed, clustered, or random characteristics. This method quantifies distribution characteristics by comparing the observed average distance between each point and its nearest neighbor with the expected average distance under a random distribution [33], as shown in the following formula:
A N N = D ¯ O D ¯ E
D ¯ O = i = 1 n d i n
D ¯ E = 0.5 n / A
D ¯ O indicates the observed average distance, which is determined as the mean distance between all points and their nearest neighbors. D ¯ E represents the theoretically expected distance, which is obtained from point density calculations based on random distribution assumptions. When the ANN value exceeds 1, the spatial points show dispersed patterns, with higher values signifying greater levels of dispersion. An ANN value of 1 indicates random distribution. In contrast, when the ANN falls below 1, the points exhibit clustering patterns, with lower values indicating stronger clustering tendencies.

3.2.4. Gaussian-Based Two-Step Floating Catchment Area Method

The Gaussian-based Two-Step Floating Catchment Area (2SFCA) method is a widely used spatial analytical approach for quantifying geographic accessibility, particularly in the evaluation of public service facility access [63,64,65]. This method evolved from the traditional two-step floating catchment area model, with its primary innovation being the incorporation of a Gaussian distance decay function to more accurately simulate the reduction in accessibility with increasing distance. In the calculation of catchment areas for both supply and demand points, network-based distances, derived from the actual road network of Shanghai, were adopted in place of Euclidean distances, thereby offering a more accurate reflection of real-world accessibility patterns [66,67,68].
(1) Calculation of sports facilities service capacity.
Sports facilities were designated as the supply points. A search area ( j ) was defined around each facility based on its service radius ( d 0 ). Within this area, we identified and aggregated the populations of all residential neighborhoods. A Gaussian function was applied to assign distance-based weights to the population, thereby accounting for the effect of distance decay. The weighted population was then summed to derive the supply-to-demand ratio ( R j ), as follows:
R j = S j k d k j d 0 G d i j P k
G d i j = e 1 2 × d i j d 0 2 e 1 2 1 e 1 2 , d i j < d 0
where R j represents the supply–demand ratio of sports facilities; j denotes the sports facility; k refers to residential communities; d k j is the distance between residential neighborhood k and sports facility j ; d0 indicates the service radius of the sports facility; P k represents the population of residential neighborhood k within the service radius; Sj is the area of sports facility j ; G d i j   functions as the Gaussian distance decay function.
(2) Calculation of accessibility for residential neighborhoods.
A i = j d i j d 0 G d i j R j
For each residential neighborhood i , sports facilities j within the service radius are identified, and their supply–demand ratios R j are weighted using the Gaussian decay function and aggregated. This calculation ultimately yields the accessibility value A i for the residential neighborhood.

3.2.5. Gini Coefficient and Lorenz Curve

The Gini coefficient and Lorenz curve serve as quantitative measures for evaluating spatial equity in the distribution of public sports facilities [33,69]. In this study, they were used to assess the overall equity of facility accessibility across residential neighborhoods in Shanghai. The Gini coefficient was calculated using the following formula:
G E u = 1 k = 1 n P k P k 1 C k + C k 1
C k = i = 1 k A i r i i = 1 n A i r i
In this equation, G E u is the sports facilities equity index for geographic unit u (residential neighborhood); n is the total number of residential neighborhoods; k is the k -th residential neighborhood, when neighborhoods are ranked from lowest to highest in sports facilities accessibility; A i is the sports facility accessibility score for neighborhood i ; r i is the population of neighborhood i ; C k is the cumulative proportion of the product of sports facility accessibility and population of neighborhoods 1 through k ; P k is the cumulative proportion of the population of neighborhoods 1 through k .
Based on the mathematical interpretation of the Gini coefficient, a G E   ≤ 0.2 indicates a highly equitable spatial distribution of sports facilities; 0.2 < G E ≤ 0.3 indicates a relatively equitable distribution; 0.3 < G E ≤ 0.4 reflects a moderate balanced distribution; 0.4 < G E ≤ 0.5 indicates relatively high inequality in spatial distribution; while G E > 0.5 reveals severe inequality in spatial distribution, indicating severe inequity in accessibility.

3.2.6. Location Quotient Method

The location quotient (LQ) method was used to evaluate the spatial equity of public sports facility allocation [45,70]. This technique compares the distribution of accessibility within each residential neighborhood to the overall regional distribution. The LQ was calculated as follows:
Q i = A i / P i A / P
where Q i represents the location quotient of residential neighborhood i ; A i denotes the accessibility of the residential neighborhood i ; A is the sum of the accessibility values across the entire region; P i refers to the population of a residential neighborhood i ; and P signifies the total population of all residential communities in the region. Through this quantitative assessment, variations in sports facilities distribution relative to population density can be precisely identified, providing critical insights into urban planning decisions. In instances where LQ > 1, the accessibility of a region is greater than the mean. Conversely, when LQ < 1, the accessibility of the region is lower than the mean.

4. Results

4.1. Spatial Distribution of Public Sports Facilities in Shanghai

Table 2 presents the nearest neighbor index (NNI) for different categories of public sports facilities in Shanghai, while Figure 3 illustrates their spatial distribution based on kernel density estimation. The analysis revealed a distinct hierarchical structure and scale-dependent pattern in the spatial allocation of urban sports facilities throughout the city. The distribution was characterized by localized clustering and broader spatial disparities, indicating strong facility agglomeration at the local level and a substantial spatial imbalance across the metropolitan area.
City-level sports facilities exhibited a distinct core agglomeration pattern, with major sports facilities concentrated in central urban areas, forming high-density clusters around key districts. The nearest neighbor index (NNI = 0.72, p < 0.01) indicated a highly clustered spatial distribution. In addition, kernel density analysis further revealed that hotspots were heavily concentrated in central urban districts, such as Jing’an, Huangpu, and Xuhui. In contrast, the peripheral areas demonstrated a paucity of facility distribution, exhibiting clear spatial differentiation. This distribution pattern was indicative of the core status of central districts in terms of resource allocation, population density, and economic activity. This also highlighted the relative inadequacy of public sports facilities in peripheral areas.
Subdistrict-level sports facilities followed a polycentric diffusion pattern, spreading across multiple urban centers rather than focusing on a single core, reflecting a shift toward a more balanced, multi-nodal urban structure. The nearest neighbor index (NNI = 1.22, p < 0.01) suggested a relatively random distribution, indicative of increasing spatial dispersion. While clusters still formed around key urban nodes, the number of hotspots identified by kernel density analysis increased significantly, with a more dispersed spatial configuration. Peripheral areas, such as Chongming and Jinshan, remained underserved, whereas traditional core districts, including Putuo, Xuhui, and Changning, maintained relatively high facility densities. These findings point to growing functional differentiation and spatial heterogeneity, reflecting disparities in resource allocation, commercial development, and public service provision. Compared to the city level, subdistrict-level analysis offers a more nuanced understanding of intra-urban complexity and spatial dynamics.
Community-level sports facilities showed an axial penetration pattern—facilities tend to align along major roads and transit corridors, extending accessibility into deeper parts of the city. The nearest neighbor index (NNI = 0.50, p < 0.01) indicated a clustered distribution. Kernel density analysis showed hotspots distributed in strips along major transportation corridors, commercial streets, or public service facilities, gradually penetrating the surrounding communities. At the community level, the distribution of facilities was predominantly influenced by micro-scale characteristics of the local environment. Specifically, factors such as the design of road networks, the location of shopping areas, and the presence of public amenities shaped how resources were allocated. These elements played a key role in determining the location of facilities. The axial penetration pattern emphasized the importance of transportation network connectivity and spatial accessibility in facility distribution. It also showed the ongoing movement of urban resources as they spread from central areas to local communities. This distributional characteristic further emphasized the hierarchical and pervasive nature of urban spatial resource allocation.
Residential-level sports facilities displayed a network-like coverage pattern, with smaller sports facilities evenly scattered across residential neighborhoods, forming a fine-grained service mesh. The nearest neighbor index (NNI = 0.59, p < 0.001) indicated a pronounced clustering. Kernel density analysis revealed hotspots distributed across nearly the entire city, resulting in a relatively uniform spatial distribution. Despite this broad coverage, localized high-density clusters were still evident in specific areas. These clusters were likely driven by factors such as residential population density, infrastructure capacity, and socioeconomic conditions. This spatial pattern suggests that public sports facilities have been increasingly integrated into residents’ everyday environments, reflecting a trend toward refined and balanced resource allocation in the context of urban development.

4.2. Spatial Accessibility of Public Sports Facilities in Shanghai

As shown in Figure 4, the analysis of spatial accessibility to public sports facilities in Shanghai revealed key patterns. The quantile method was applied to classify accessibility into four levels: inaccessible, low, medium, and high.
City-level sports facilities are primarily designed to serve large-scale events, and 72.76% of residential neighborhoods are not within their service coverage. These neighborhoods are located outside the central urban districts, including northern Chongming District, southeastern Fengxian District, western Jinshan District, and southern Qingpu District. High-accessibility areas are mainly concentrated in traditional central urban districts, as well as in key suburban centers such as Jiading New Town, Qingpu Central Business District, and the Jinshan Coastal Ecological Vitality Belt, which form secondary high-accessibility clusters. These areas leverage well-developed transportation networks and a higher density of facilities to create continuous high-accessibility corridors along major transport routes, enabling residents to conveniently reach the facilities with minimal travel time.
Subdistrict-level sports facilities are intended for general sporting events and community-level fitness activities. Inaccessible areas account for approximately 50.58% of the total residential neighborhoods, mainly located in outer suburban districts such as Chongming and Jinshan, as well as in the peripheral zones of certain inner suburbs, including southwestern Minhang and eastern Pudong New District. Medium and high-accessibility areas show marked spatial variation. The highest concentrations are found in central districts such as Putuo, Yangpu, Huangpu, and Xuhui, followed by inner suburbs like Pudong New District and Minhang, while outer suburbs exhibit the lowest levels of accessibility. Emerging centers, such as Pujiang Town in Minhang and Zhangjiang Science City in Pudong, have developed into secondary high-accessibility zones, characterized by higher facility density and improved transport connectivity.
Community-level sports facilities are a critical component of the 15-min living circle, influencing residents’ participation in daily sports activities. Across the city, community-level sports facilities show high accessibility, with inaccessible residential neighborhoods comprising only 10.4%. These inaccessible areas are concentrated primarily in older residential neighborhoods within the Inner Ring Road and large residential communities in suburban areas. In contrast, medium and high-accessibility areas display significant spatial clustering, especially in areas such as Xinbang Town in Songjiang District and Huacao Town in Minhang District.
Residential-level sports facilities primarily serve residents within housing complexes. These facilities exhibit high spatial accessibility with a balanced distribution across different neighborhoods. Most residential sports facilities are generally accessible, with only 6.36% of residential neighborhoods considered difficult to access. These less accessible areas are primarily found in remote suburban neighborhoods and older residential zones within central urban districts, highlighting persistent facility shortages in specific locations. In contrast, medium and high-accessibility zones predominantly exist in recently developed communities throughout inner suburbs. These areas feature higher concentrations of sports facilities and benefit from more comprehensive community planning approaches.

4.3. Spatial Equity of Public Sports Facilities in Shanghai

Figure 5 and Figure 6 show the Gini coefficients and location quotient (LQ) analyses of public sports facilities across multiple levels in Shanghai. The results highlight the overall inequities in the allocation of multi-level sports facilities.
City-level sports facilities have a Gini coefficient of 0.73, reflecting significant spatial inequality in the distribution of public sports facilities. The LQ analysis identifies well-served areas (LQ > 1) as being predominantly located in the city’s core districts, particularly west of the Huangpu River. Notable clusters include Xujiahui and the area surrounding the Hongkou Football Stadium. These locations exhibit much higher facility densities and service levels than the citywide average, suggesting a planning focus on the urban core area. In contrast, underserved areas (LQ < 1) are distributed across peripheral districts and emerging new towns, including Lingang and Fengxian.
Subdistrict-level sports facilities exhibited a high degree of spatial disparity, with a Gini coefficient of 0.84. The LQ analysis shows that well-served areas (LQ > 1) are primarily located along major arterial roads and metro corridors, with secondary clusters emerging in selected sub-centers. These areas are characterized by high population density, mixed-use development, well-established built environments, and accessible transportation networks. These conditions collectively support the clustering of subdistrict-level facilities. In contrast, underserved areas (LQ < 1) are mainly located in the western peripheries of the city, such as Qingpu and Jinshan, as well as parts of eastern Pudong.
The Gini coefficient for community-level facilities, such as fitness parks, was 0.71. While this indicates notable inequality, the value is slightly lower than those observed at the city and subdistrict levels, suggesting a slightly more balanced distribution. The LQ analysis shows that well-served areas (LQ > 1) are more widely distributed beyond the urban core, particularly in newly developed residential communities. In contrast, underserved areas (LQ < 1) are concentrated in central districts, where limited land availability and the complexity of retrofitting existing urban environments pose challenges to facility provision. These challenges reveal last-mile gaps in achieving equitable access during incremental urban regeneration.
The Gini coefficient for residential-level sports facilities was 0.59. Although regional variation is relatively limited, this value still reflects a notable deviation from equitable distribution. The LQ analysis reveals that well-served areas (LQ > 1) are primarily located in central urban renewal blocks and in newly developed residential areas in suburban districts. This spatial pattern suggests that policy directives and facility standards are associated with an increased provision of sports facilities in new developments. In contrast, underserved areas (LQ < 1) are mainly concentrated in older neighborhoods, which often face challenges such as high population density and limited space.

5. Discussion

5.1. Influencing Factors of the Spatial Distribution Pattern of Shanghai Public Sports Facilities

Functional zoning and land-use are key determinants of the spatial distribution of public sports facilities in urban settings [71,72]. Urban location theory suggests that the placement of sports facilities, which are integral components of public service infrastructure, is influenced by factors such as land value, transportation accessibility, and functional complementarity [73,74,75]. These facilities are often situated in close proximity to complementary land uses, such as transportation hubs, parks, or commercial centers, with the aim of maximizing shared use and enhancing service efficiency [76]. As a global metropolis, Shanghai demonstrates hierarchical and scale-dependent characteristics in its public sports facility network, resulting in a spatial pattern characterized by localized clustering with overall spatial imbalance. This configuration reflects both the constraints posed by limited land availability and the outcomes of planning-led optimization and resource integration.
Moreover, population distribution and evolving social demands strongly influence the local allocation of public sports facilities. Based on the “Community Life Circle” concept, facility placement should consider both population density and residents’ daily activity radii to ensure service equity and efficiency [77,78,79]. Currently, sports facilities at the community and residential levels in Shanghai show axial penetration pattern and network-like coverage pattern spatial distributions, indicating positive responses to population mobility and activity needs. However, location quotient analysis revealed a structural lag in facility provision within older neighborhoods and suburban fringe areas. This aligns with David Harvey’s perspective on the reproduction of urban spatial inequality, illustrating how capital and resources are selectively allocated during urban restructuring [80].
Finally, market forces and government policies significantly influence how public sports facilities are distributed across Shanghai. Drawing from Lefebvre’s conceptualization of space production [21], urban spaces serve as physical manifestations of underlying social dynamics, including socioeconomic hierarchies and political interests. High land costs restrict public sports facilities in valuable central areas, often displaced by commercial development. Meanwhile, operational budget constraints frequently lead to lower-quality facilities in low-income communities, creating access inequality based on service standards, even when proximity is similar. Recognizing these market-driven imbalances, Shanghai’s government has strategically increased investment in underserved neighborhoods through targeted programs like the Three-Year Action Plan for Public Fitness Facilities [81,82]. For example, in Yangpu District, where land resources are particularly scarce, an old factory located at 721 Kunming Road was repurposed into Shanghai’s first “Rucker Park” basketball gym. This tension between economic factors and equity concerns creates an evolving regulatory environment that continues to reshape the distribution of sports facilities throughout the metropolitan area.

5.2. Challenges in the Spatial Distribution of Urban Public Sports Facilities in Shanghai

From a spatial distribution perspective, Shanghai’s multi-level public sports facilities show clear hierarchical and scale-dependent patterns, marked by localized clustering and broader spatial imbalance. These findings align with those reported by Yang Jian et al. [83]. The concentration of facilities in core areas can generate economies of scale and agglomeration effects, but it also exacerbates supply deficiencies in metropolitan peripheries, emphasizing the structural contradictions in urban public resource allocation [84]. While our results support Friedmann’s core–periphery model [85], they also reveal a divergence from the spatial organization proposed in network city and fractal urban theories [86,87], which emphasize self-similar spatial structures across multiple scales. This idea is also represented in the concept of the “15-min city”, which focuses on making sure that residents can reach key services within just a short walk or bike ride, no matter where they live in the urban environment [88,89].
Regarding accessibility, the spatial distribution of public service facilities should be based on population distribution, with a service network featuring balanced coverage and a clear hierarchy [79]. However, Shanghai’s sports facility layout follows historically formed center–periphery structures, partly failing to respond effectively to urban spatial restructuring and decentralization trends. Inaccessible areas for facilities at the city and subdistrict levels reached significant proportions of 72.76% and 50.58%, respectively. These underserved regions are primarily concentrated in remote suburban districts such as Chongming, Minhang, and Jinshan. This disparity is particularly acute in suburban new towns and functional clusters. While service radii of street-level and community-level facilities partially meet local neighborhood needs, the last-mile problem remains critical. This suggests inconsistencies between transportation accessibility and service facility locations during urban development [90].
From an equity standpoint, the way public sports facilities are spread out shows a clear imbalance, as reflected in both the Gini index and the location quotient. This uneven allocation reflects deeper power and wealth disparities between central and peripheral urban areas—prime locations continue to attract resources, while disadvantaged regions are marginalized, leading to a “Matthew effect” [91]. A notable example is Xujiahui Street in Xuhui District, Shanghai, where large facilities such as the Shanghai Stadium, Shanghai Gymnasium, and Shanghai Swimming Pool are concentrated. This concentration has intensified the development gap with the surrounding communities. While new neighborhoods show trends toward more balanced community-level facilities, older areas still face resource imbalances. Overcoming the inertia of resource concentration and building a more inclusive public service system remains a critical challenge in the existing spatial structure [92,93].

5.3. Suggestions for Optimizing the Spatial Configuration of Public Sports Facilities in Shanghai

First, a hierarchical and balanced public sports facilities network must be established. Planning should follow the principles of spatial hierarchy and functional differentiation. In light of the limited accessibility of city-level facilities in suburban zones, we recommend the strategic placement or upgrading of large-scale venues in outer districts such as Jiading, Songjiang, and Fengxian. This could involve developing multifunctional sports hubs or satellite centers that serve both local and regional needs. Existing landmark venues (e.g., Xujiahui Sports Park, Hongkou Football Stadium) should be enhanced with better transport connectivity and community outreach programs to extend their service radius. At the subdistrict and community levels, vacant land and underused public spaces—particularly in high-density but underserved areas—can be repurposed into small-scale, high-frequency sports facilities, such as outdoor gyms, walking loops, or basketball courts.
Second, adaptive planning approaches should be informed by population dynamics and mobility patterns. Drawing on time–geography theory, facility layouts can be optimized using the big data analysis of residents’ travel behavior, fitness preferences, and temporal activity trends [94]. In high-density commercial areas, shared fitness spaces and smart exercise equipment can improve efficiency and maximize use. Smart exercise equipment refers to digitally connected fitness devices with sensor and data analytics capabilities [95]. A practical example is the intelligent racing bike. These bikes combine testing, training, and competition functions, and users can train individually, compete with friends, or join online multiplayer races [96]. In aging communities, priority should be given to developing inclusive recreational spaces such as age-friendly parks and rehabilitation facilities [97,98,99]. Supply strategies accommodating exercise demands across various time periods and demographic groups while maximizing facility utilization rates may include deployable sports facilities and quick-assembly fitness stations [100,101].
Third, to address spatial inequity, we recommend implementing a differentiated compensation mechanism for resource allocation. Equity in redistribution does not necessarily mean absolute equality, but should prioritize meeting the basic needs of the most vulnerable [102]. This involves prioritizing investment in underserved neighborhoods, such as older urban cores or newly developed suburban districts with low accessibility scores [103,104]. Rather than focusing solely on new construction, attention should also be given to context-sensitive spatial regeneration. For example, in peripheral industrial zones such as Baoshan District and Songjiang District, abandoned warehouses can be repurposed into sports centers for youths, or for niche activities such as skateboarding [105]. In older residential neighborhoods, school sports facilities can be opened to the public through reservation platforms and shared-use agreements, thus expanding access without adding land pressure. These localized and flexible strategies can facilitate the development of a 15-min urban service network, enhancing equitable access to services across different areas and thereby meeting residents’ needs for leisure, recreation, and physical fitness [106].

5.4. Strengths, Limitations, and Prospects

This study offers three strengths over prior research. First, unlike previous studies that focused on one or two sports facility types, it includes all four levels—city, subdistrict, community, and residential—providing a more accurate picture of sports facility distribution in Shanghai. Second, regarding accessibility analysis, most earlier works used communities or zones as analytical units and buffer-based methods to measure Euclidean distances, lacking spatial precision. In contrast, our study employs residential compounds as the basic unit and applies a Gaussian-based two-step floating catchment area (2SFCA) method. It is important to note that we calculate the distances between supply and demand points using a real road network analysis, which better reflects actual accessibility than straight-line measurements. Third, we integrated 2024 data on sports facilities, residential neighborhoods, road networks, and updated census records and mapped population figures to residential neighborhoods. This enabled a more accurate relationship between the supply of facilities and the demand of the population, providing a sound basis for data-driven urban planning.
While this granular focus on residential neighborhoods enhances analytical precision, it also presents notable limitations. Individual behaviors and mobility patterns are highly complex, and many residents may engage in physical activities or access sports facilities outside their immediate neighborhood due to factors such as work, school commitments, or personal preferences. Moreover, administrative boundaries do not always align with residents’ perceived or functional living spaces, potentially leading to spatial mismatches between the analysis and reality. For example, some residents might prefer to use more distant but better-equipped facilities, a behavioral pattern that is difficult to capture in neighborhood-based analyses.
Our datasets have inherent limitations worth noting. Sports facility data may miss informal exercise spaces that residents regularly use. The Lianjia dataset has biases toward active housing markets. It underrepresents older communities and those with lower turnover rates. We addressed these through validation and calibration, but some demand-side inaccuracies likely remain. Our road network analysis improves upon straight-line measurements but does not account for public transport routes, traffic variations, or pedestrian-only paths.
To address these limitations, future research could take several directions. First, to improve data accuracy and reduce potential bias, integrating multiple data sources, such as combining real estate data with official statistics or mobile signaling data, could enhance completeness and reliability. Incorporating dynamic data, like GPS trajectories, mobility records, or travel surveys, would also help capture actual usage patterns and better reflect how residents move and access sports facilities. Finally, combining spatial analysis with qualitative methods, such as interviews or perception surveys, could provide deeper insights into how people perceive accessibility and what factors influence their choices. A more holistic approach would offer a stronger foundation for evidence-based urban planning and policy-making.

6. Conclusions

This study proposes a comprehensive analytical framework for evaluating the accessibility and spatial equity of urban public sports facilities from a multi-level perspective, using residential neighborhoods as the basic unit of analysis. This framework integrates spatial statistical methods—including the average nearest neighbor index, kernel density estimation, a Gaussian-based two-step floating catchment area (2SFCA) method, the Gini coefficient, and location quotient analysis—to provide a comprehensive understanding of the distribution and accessibility of sports facilities in Shanghai. The results emphasize some noticeable spatial disparities across levels of facility provision. Community-level and residential-level sports facilities exhibit relatively high accessibility. In contrast, city-level and subdistrict-level facilities show limited accessibility, particularly in peripheral suburban areas. All facility levels exhibit degrees of spatial inequality, underscoring persistent challenges in ensuring just access to public sports services.
These findings underscore the need for a multi-level and fine-grained approach to the planning and assessment of sports facility distribution. The proposed framework enhances the understanding of existing spatial patterns and provides empirical support for the optimization of facility allocation and the promotion of equitable access. Future planning efforts, the research suggests, should prioritize underserved areas by establishing hierarchically structured, integrated networks of public sports facilities while fostering coordination across service tiers. Importantly, adaptive planning methodologies should respond to demographic shifts and mobility patterns. The implementation of a public resource redistribution system based on differentiated compensation mechanisms is further recommended, ultimately ensuring that urban sports infrastructure remains both inclusive and equitably accessible to diverse populations.

Author Contributions

Conceptualization, W.W.; methodology, W.W.; software, W.W.; validation, W.W., X.X., G.X, and Y.C.; data curation, X.X., G.X; writing—original draft preparation, W.W.; writing—review and editing, G.X. and Y.C.; visualization, W.W.; supervision, Y.C.; project administration, Y.C.; funding acquisition, Y.C. All authors have read and agreed to the published version of the manuscript.

Funding

This research was supported by the National Key Research and Development Program of China (2024YFC2707903).

Data Availability Statement

Access to the raw data for this study is provided in the Data and Methods Section of this paper. Further questions can be directed to the corresponding author.

Conflicts of Interest

The authors declare no conflicts of interest.

References

  1. Sallis, J.F.; Cerin, E.; Conway, T.L.; Adams, M.A.; Frank, L.D.; Pratt, M.; Salvo, D.; Schipperijn, J.; Smith, G.; Cain, K.L.; et al. Physical Activity in Relation to Urban Environments in 14 Cities Worldwide: A Cross-Sectional Study. Lancet 2016, 387, 2207–2217. [Google Scholar] [CrossRef] [PubMed]
  2. Frehlich, L.; Christie, C.D.; Ronksley, P.E.; Turin, T.C.; Doyle-Baker, P.; McCormack, G.R. The Neighbourhood Built Environment and Health-Related Fitness: A Narrative Systematic Review. Int. J. Behav. Nutr. Phys. Act. 2022, 19, 124. [Google Scholar] [CrossRef] [PubMed]
  3. Zhang, S.; Zhang, X.; Liu, Y. A Study of the Influence of Sports Venues on the Intra-City Population Layout Based on Multi-Source Data—Taking Xi’an City and Zhengzhou City as Examples. PLoS ONE 2023, 18, e0285600. [Google Scholar] [CrossRef]
  4. China Expects Urbanisation Rate to Near 70% in Next Five Years. Reuters. 2024. Available online: https://www.reuters.com/world/asia-pacific/china-expects-urbanisation-rate-near-70-next-five-years-2024-07-31/ (accessed on 3 May 2025).
  5. Hong, T.; Yu, N.; Mao, Z.; Zhang, S. Government-Driven Urbanisation and Its Impact on Regional Economic Growth in China. Cities 2021, 117, 103299. [Google Scholar] [CrossRef]
  6. Monda, K.L.; Gordon-Larsen, P.; Stevens, J.; Popkin, B.M. China’s Transition: The Effect of Rapid Urbanization on Adult Occupational Physical Activity. Soc. Sci. Med. 2007, 64, 858–870. [Google Scholar] [CrossRef]
  7. Althoff, T.; Sosič, R.; Hicks, J.L.; King, A.C.; Delp, S.L.; Leskovec, J. Large-Scale Physical Activity Data Reveal Worldwide Activity Inequality. Nature 2017, 547, 336–339. [Google Scholar] [CrossRef]
  8. Wang, R. The Linkage between the Perception of Neighbourhood and Physical Activity in Guangzhou, China: Using Street View Imagery with Deep Learning Techniques. Int. J. Health Geogr. 2019, 18, 18. [Google Scholar] [CrossRef]
  9. Sallis, J.F.; Cerin, E.; Kerr, J.; Adams, M.A.; Sugiyama, T.; Christiansen, L.B.; Schipperijn, J.; Davey, R.; Salvo, D.; Frank, L.D.; et al. Built Environment, Physical Activity, and Obesity: Findings from the International Physical Activity and Environment Network (IPEN) Adult Study. Annu. Rev. Public Health 2020, 41, 119–139. [Google Scholar] [CrossRef]
  10. Tcymbal, A.; Demetriou, Y.; Kelso, A.; Wolbring, L.; Wunsch, K.; Wäsche, H.; Woll, A.; Reimers, A.K. Effects of the Built Environment on Physical Activity: A Systematic Review of Longitudinal Studies Taking Sex/Gender into Account. Environ. Health Prev. Med. 2020, 25, 75. [Google Scholar] [CrossRef]
  11. Devarajan, R.; Prabhakaran, D.; Goenka, S. Built Environment for Physical Activity-an Urban Barometer, Surveillance, and Monitoring. Obes. Rev. Off. J. Int. Assoc. Study Obes. 2020, 21, e12938. [Google Scholar] [CrossRef]
  12. Assah, F.K.; Ekelund, U.; Brage, S.; Mbanya, J.C.; Wareham, N.J. Urbanization, Physical Activity, and Metabolic Health in Sub-Saharan Africa. Diabetes Care 2011, 34, 491–496. [Google Scholar] [CrossRef] [PubMed]
  13. Hales, C.M.; Fryar, C.D.; Carroll, M.D.; Freedman, D.S.; Aoki, Y.; Ogden, C.L. Differences in Obesity Prevalence by Demographic Characteristics and Urbanization Level among Adults in the United States, 2013–2016. JAMA 2018, 319, 2419–2429. [Google Scholar] [CrossRef] [PubMed]
  14. Wang, R.; Feng, Z.; Liu, Y.; Qiu, Y. Is Lifestyle a Bridge between Urbanization and Overweight in China? Cities 2020, 99, 102616. [Google Scholar] [CrossRef]
  15. Sallis, J.F.; Floyd, M.F.; Rodríguez, D.A.; Saelens, B.E. Role of Built Environments in Physical Activity, Obesity, and Cardiovascular Disease. Circulation 2012, 125, 729–737. [Google Scholar] [CrossRef]
  16. An, R.; Shen, J.; Yang, Q.; Yang, Y. Impact of Built Environment on Physical Activity and Obesity among Children and Adolescents in China: A Narrative Systematic Review. J. Sport. Health Sci. 2019, 8, 153–169. [Google Scholar] [CrossRef]
  17. Limstrand, T. Environmental Characteristics Relevant to Young People’s Use of Sports Facilities: A Review. Scand. J. Med. Sci. Sports 2008, 18, 275–287. [Google Scholar] [CrossRef]
  18. Diez Roux, A.V.; Evenson, K.R.; McGinn, A.P.; Brown, D.G.; Moore, L.; Brines, S.; Jacobs, D.R. Availability of Recreational Resources and Physical Activity in Adults. Am. J. Public Health 2007, 97, 493–499. [Google Scholar] [CrossRef]
  19. Yancey, A.K.; Fielding, J.E.; Flores, G.R.; Sallis, J.F.; McCarthy, W.J.; Breslow, L. Creating a Robust Public Health Infrastructure for Physical Activity Promotion. Am. J. Prev. Med. 2007, 32, 68–78. [Google Scholar] [CrossRef]
  20. Hu, Y. Empirical Analysis of Spatial Heterogeneity in the Development of China’s National Fitness Plan. PLoS ONE 2024, 19, e0305397. [Google Scholar] [CrossRef]
  21. Lefebvre, H. The Production of Space; Wiley-Blackwell: Hoboken, NJ, USA, 1992; ISBN 978-0-631-18177-4. [Google Scholar]
  22. Zhang, Y.; Yi Ming, Y.; Shi, B. Spatial Distribution Characteristics and Causes of Public Sports Venues in China. Sci. Rep. 2023, 13, 15056. [Google Scholar] [CrossRef]
  23. Xiao, W.; Wang, W. Study on the Accessibility of Community Sports Facilities in Fuzhou, China. Sustainability 2022, 14, 14331. [Google Scholar] [CrossRef]
  24. Ouyang, W.; Wang, B.; Tian, L.; Niu, X. Spatial Deprivation of Urban Public Services in Migrant Enclaves under the Context of a Rapidly Urbanizing China: An Evaluation Based on Suburban Shanghai. Cities 2017, 60, 436–445. [Google Scholar] [CrossRef]
  25. Notice of the Shanghai Municipal Sports Bureau on the Issuance of the “14th Five-Year Plan for the Development of Public Sports Facilities in Shanghai. Available online: https://www.shanghai.gov.cn/gwk/search/content/7f03522f9a1346d89398536ccda2ca4e (accessed on 23 May 2024).
  26. Jakar, G.S.; Razin, E.; Rosentraub, M.S.; Rosen, G. Sport Facility Development: Municipal Capital and Shutting out the Private Sector. Eur. Plan. Stud. 2018, 26, 1222–1241. [Google Scholar] [CrossRef]
  27. Liu, Y.; Wang, H.; Sun, C.; Wu, H. Equity Measurement of Public Sports Space in Central Urban Areas Based on Residential Scale Data. Int. J. Environ. Res. Public Health 2022, 19, 3104. [Google Scholar] [CrossRef]
  28. Yang, Y.; Tang, S. Assessment of Service Quality in Urban Sports Facilities: A Comprehensive Evaluation Framework Applied to Shanghai, China. Buildings 2025, 15, 193. [Google Scholar] [CrossRef]
  29. Chen, Y.; Lin, N.; Wu, Y.; Ding, L.; Pang, J.; Lv, T. Spatial Equity in the Layout of Urban Public Sports Facilities in Hangzhou. PLoS ONE 2021, 16, e0256174. [Google Scholar] [CrossRef]
  30. Omer, I. Evaluating Accessibility Using House-Level Data: A Spatial Equity Perspective. Comput. Environ. Urban Syst. 2006, 30, 254–274. [Google Scholar] [CrossRef]
  31. Taleai, M.; Sliuzas, R.; Flacke, J. An Integrated Framework to Evaluate the Equity of Urban Public Facilities Using Spatial Multi-Criteria Analysis. Cities 2014, 40, 56–69. [Google Scholar] [CrossRef]
  32. Dadashpoor, H.; Rostami, F.; Alizadeh, B. Is Inequality in the Distribution of Urban Facilities Inequitable? Exploring a Method for Identifying Spatial Inequity in an Iranian City. Cities 2016, 52, 159–172. [Google Scholar] [CrossRef]
  33. Xing, L.; Chen, Q.; Liu, Y.; He, H. Evaluating the Accessibility and Equity of Urban Health Resources Based on Multi-Source Big Data in High-Density City. Sustain. Cities Soc. 2024, 100, 105049. [Google Scholar] [CrossRef]
  34. Cheng, T.; Liu, C.; Yang, H.; Wang, N.; Liu, Y. From Service Capacity to Spatial Equity: Exploring a Multi-Stage Decision-Making Approach for Optimizing Elderly-Care Facility Distribution in the City Centre of Tianjin, China. Sustain. Cities Soc. 2022, 85, 104076. [Google Scholar] [CrossRef]
  35. Halonen, J.I.; Stenholm, S.; Kivimäki, M.; Pentti, J.; Subramanian, S.V.; Kawachi, I.; Vahtera, J. Is Change in Availability of Sports Facilities Associated with Change in Physical Activity? A Prospective Cohort Study. Prev. Med. 2015, 73, 10–14. [Google Scholar] [CrossRef] [PubMed]
  36. Lee, G.; Hong, I. Measuring Spatial Accessibility in the Context of Spatial Disparity between Demand and Supply of Urban Park Service. Landsc. Urban Plan. 2013, 119, 85–90. [Google Scholar] [CrossRef]
  37. Xiao, Y.; Wang, D.; Fang, J. Exploring the Disparities in Park Access through Mobile Phone Data: Evidence from Shanghai, China. Landsc. Urban Plan. 2019, 181, 80–91. [Google Scholar] [CrossRef]
  38. Scott, M.M.; Evenson, K.R.; Cohen, D.A.; Cox, C.E. Comparing Perceived and Objectively Measured Access to Recreational Facilities as Predictors of Physical Activity in Adolescent Girls. J. Urban Health 2007, 84, 346–359. [Google Scholar] [CrossRef]
  39. Li, Z.; Fan, Z.; Song, Y.; Chai, Y. Assessing equity in park accessibility using a travel behavior-based G2SFCA method in Nanjing, China. J. Transp. Geogr. 2021, 96, 103179. [Google Scholar] [CrossRef]
  40. Karusisi, N.; Thomas, F.; Méline, J.; Chaix, B. Spatial Accessibility to Specific Sport Facilities and Corresponding Sport Practice: The RECORD Study. Int. J. Behav. Nutr. Phys. Act. 2013, 10, 48. [Google Scholar] [CrossRef]
  41. Moore, L.V.; Diez Roux, A.V.; Evenson, K.R.; McGinn, A.P.; Brines, S.J. Availability of Recreational Resources in Minority and Low Socioeconomic Status Areas. Am. J. Prev. Med. 2008, 34, 16–22. [Google Scholar] [CrossRef]
  42. Panter, J.; Jones, A.; Hillsdon, M. Equity of access to physical activity facilities in an English city. Prev. Med. 2008, 46, 303–307. [Google Scholar] [CrossRef]
  43. Chen, C. Discussion on the Optimization Method of Public Service Facility Layout from the Perspective of Spatial Equity: A Study Based on the Central City of Shanghai. Land 2023, 12, 1780. [Google Scholar] [CrossRef]
  44. Tsou, K.-W.; Hung, Y.-T.; Chang, Y.-L. An accessibility-based integrated measure of relative spatial equity in urban public facilities. Cities 2005, 22, 424–435. [Google Scholar] [CrossRef]
  45. Powers, S.L.; Pitas, N.A.; Rice, W.L. Applying Location Quotient Methodology to Urban Park Settings with Mobile Location Data: Implications for Equity and Park Planning. Urban For. Urban Green. 2024, 98, 128418. [Google Scholar] [CrossRef] [PubMed]
  46. Sheahan, K.L.; Orgill-Meyer, J.; Speizer, I.S.; Curtis, S.; Paul, J.; Weinberger, M.; Bennett, A.V. Development of Integration Indexes to Determine the Extent of Family Planning and Child Immunization Services Integration in Health Facilities in Urban Areas of Nigeria. Reprod. Health 2021, 18, 47. [Google Scholar] [CrossRef]
  47. Chang, H.-S.; Liao, C.-H. Exploring an Integrated Method for Measuring the Relative Spatial Equity in Public Facilities in the Context of Urban Parks. Cities 2011, 28, 361–371. [Google Scholar] [CrossRef]
  48. Tan, P.Y.; Samsudin, R. Effects of Spatial Scale on Assessment of Spatial Equity of Urban Park Provision. Landsc. Urban Plan. 2017, 158, 139–154. [Google Scholar] [CrossRef]
  49. Turner, M.G.; O’Neill, R.V.; Gardner, R.H.; Milne, B.T. Effects of Changing Spatial Scale on the Analysis of Landscape Pattern. Landsc. Ecol. 1989, 3, 153–162. [Google Scholar] [CrossRef]
  50. Zhang, Z.; Wang, M.; Xu, Z.; Ye, Y.; Chen, S.; Pan, Y.; Chen, J. The Influence of Community Sports Parks on Residents’ Subjective Well-Being: A Case Study of Zhuhai City, China. Habitat. Int. 2021, 117, 102439. [Google Scholar] [CrossRef]
  51. Houston, D. Implications of the Modifiable Areal Unit Problem for Assessing Built Environment Correlates of Moderate and Vigorous Physical Activity. Appl. Geogr. 2014, 50, 40–47. [Google Scholar] [CrossRef]
  52. Javanmard, R.; Lee, J.; Kim, J.; Liu, L.; Diab, E. The Impacts of the Modifiable Areal Unit Problem (MAUP) on Social Equity Analysis of Public Transit Reliability. J. Transp. Geogr. 2023, 106, 103500. [Google Scholar] [CrossRef]
  53. 2023 Shanghai Sports Facilities Statistical Survey Main Data Bulletin. Available online: https://tyj.sh.gov.cn/ggtz/20240429/a13e38632ef147a6933388176cb65712.html (accessed on 29 March 2025).
  54. Main Data of the Seventh National Population Census. Available online: https://www.stats.gov.cn/english/PressRelease/202105/t20210510_1817185.html (accessed on 29 March 2025).
  55. GB 50442; Urban Public Service Facilities Planning Standard. Ministry of Housing and Urban–Rural Development of China: Beijing, China, 2018.
  56. Shanghai Urban Planning Compilation and Review Center. Spatial Planning Standard for 15-Minute Community Life Circle (Draft for Public Consultation); Shanghai Urban Planning Compilation and Review Center: Shanghai, China, 2024. [Google Scholar]
  57. Bondarenko, M.; Kerr, D.; Sorichetta, A.; Tatem, A. Census/Projection-Disaggregated Gridded Population Datasets, Adjusted to Match the Corresponding UNPD 2020 Estimates, for 183 Countries in 2020 Using Built-Settlement Growth Model (BSGM) Outputs; University of Southampton: Southampton, UK, 2020. [Google Scholar]
  58. Jian, I.Y.; Chan, E.H.W.; Xu, Y.; Owusu, E.K. Inclusive Public Open Space for All: Spatial Justice with Health Considerations. Habitat. Int. 2021, 118, 102457. [Google Scholar] [CrossRef]
  59. Jian, I.Y.; Luo, J.; Chan, E.H.W. Spatial justice in public open space planning: Accessibility and inclusivity. Habitat. Int. 2020, 97, 102122. [Google Scholar] [CrossRef]
  60. Wang, X.; Tang, P.; He, Y.; Woolley, H.; Hu, X.; Yang, L.; Luo, J. The Correlation between Children’s Outdoor Activities and Community Space Characteristics: A Case Study Utilizing SOPARC and KDE Methods in Chengdu, China. Cities 2024, 150, 105002. [Google Scholar] [CrossRef]
  61. Zhang, J.; Li, J. Study on the Spatial Arrangement of Urban Parkland under the Perspective of Equity—Taking Harbin Main City as an Example. Land 2024, 13, 248. [Google Scholar] [CrossRef]
  62. Silverman, B.W. Using Kernel Density Estimates to Investigate Multimodality. J. R. Stat. Soc. B (Methodol.) 1981, 43, 97–99. [Google Scholar] [CrossRef]
  63. Luo, W.; Qi, Y. An Enhanced Two-Step Floating Catchment Area (E2SFCA) Method for Measuring Spatial Accessibility to Primary Care Physicians. Health Place 2009, 15, 1100–1107. [Google Scholar] [CrossRef]
  64. Shao, Y.; Luo, W. Supply-Demand Adjusted Two-Steps Floating Catchment Area (SDA-2SFCA) Model for Measuring Spatial Access to Health Care. Soc. Sci. Med. 2022, 296, 114727. [Google Scholar] [CrossRef]
  65. Blumenberg, E.; Yao, Z.; Wander, M. Variation in Child Care Access across Neighborhood Types: A Two-Step Floating Catchment Area (2SFCA) Approach. Appl. Geogr. 2023, 158, 103054. [Google Scholar] [CrossRef]
  66. Tao, Z.; Cheng, Y.; Liu, J. Hierarchical Two-Step Floating Catchment Area (2SFCA) Method: Measuring the Spatial Accessibility to Hierarchical Healthcare Facilities in Shenzhen, China. Int. J. Equity Health 2020, 19, 164. [Google Scholar] [CrossRef]
  67. Xing, L.; Liu, Y.; Wang, B.; Wang, Y.; Liu, H. An Environmental Justice Study on Spatial Access to Parks for Youth by Using an Improved 2SFCA Method in Wuhan, China. Cities 2020, 96, 102405. [Google Scholar] [CrossRef]
  68. Chen, X.; Jia, P. A Comparative Analysis of Accessibility Measures by the Two-Step Floating Catchment Area (2SFCA) Method. Int. J. Geogr. Inf. Sci. 2019, 33, 1739–1758. [Google Scholar] [CrossRef]
  69. Raza, A.; Zhong, M.; Akuh, R.; Safdar, M. Public Transport Equity with the Concept of Time-Dependent Accessibility Using Geostatistics Methods, Lorenz Curves, and Gini Coefficients. Case Stud. Transp. Policy 2023, 11, 100956. [Google Scholar] [CrossRef]
  70. Panagiotopoulos, G.; Kaliampakos, D. Location Quotient-Based Travel Costs for Determining Accessibility Changes. J. Transp. Geogr. 2021, 91, 102951. [Google Scholar] [CrossRef]
  71. Culley, P.; Pascoe, J. (Eds.) Stadium and Arena Design, 2nd ed.; ICE Publishing: London, UK, 2015; ISBN 978-0-7277-5790-6. [Google Scholar]
  72. Wimmer, M. Stadium Buildings: Construction and Design Manual; DOM Publishers: Berlin, Germany, 2016; ISBN 978-3-86922-415-2. [Google Scholar]
  73. Bigman, D.; ReVelle, C. An Operational Approach to Welfare Considerations in Applied Public-Facility-Location Models. Environ. Plan. A 1979, 11, 83–95. [Google Scholar] [CrossRef]
  74. Loumeau, G. Locating Public Facilities: Theory and Micro Evidence from Paris. J. Urban Econ. 2023, 135, 103544. [Google Scholar] [CrossRef]
  75. White, A.N. Accessibility and Public Facility Location. Econ. Geogr. 1979, 55, 18–35. [Google Scholar] [CrossRef]
  76. Ren, M.; Lin, Y.; Jin, M.; Duan, Z.; Gong, Y.; Liu, Y. Examining the Effect of Land-Use Function Complementarity on Intra-Urban Spatial Interactions Using Metro Smart Card Records. Transportation 2020, 47, 1607–1629. [Google Scholar] [CrossRef]
  77. Liu, T.; Chai, Y. Daily life circle reconstruction: A scheme for sustainable development in urban China. Habitat. Int. 2015, 50, 250–260. [Google Scholar] [CrossRef]
  78. Hu, H.; Shao, H.; Li, Y.; Guan, M.; Tong, J. GIS-Based Analysis of Elderly Care Facility Distribution and Supply–Demand Coordination in the Yangtze River Delta. Land 2025, 14, 723. [Google Scholar] [CrossRef]
  79. Song, L.; Kong, X.; Cheng, P. Supply-demand matching assessment of the public service facilities in 15-minute community life circle based on residents’ behaviors. Cities 2024, 144, 104637. [Google Scholar] [CrossRef]
  80. Harvey, D. (Ed.) Spaces of Neoliberalization: Towards a Theory of Uneven Geographical Development; [Eighth] Hettner-Lecture [Department of Geography, University of Heidelberg, from 28 June to 2 July] 2004; Hettner-lectures; Steiner: Stuttgart, Germany, 2005; ISBN 978-3-515-08746-9. [Google Scholar]
  81. Xu, X.; Huang, C.; Shah, W.U.H. Financial Resources Utilization Efficiency in Sports Infrastructure Development, Determinant of Total Factor Productivity Growth and Regional Production Technology Heterogeneity in China. Heliyon 2024, 10, e26546. [Google Scholar] [CrossRef]
  82. China Issued a Three-Year Upgrade Plan to Promote the Construction of National Fitness Venues and Facilities (Part 1). Available online: https://en.planning.org.cn/nua/view?id=998 (accessed on 28 March 2025).
  83. Yang, J.; Guo, Z. Quantitative Evaluation of Public Sports Spatial Service in the Central Urban District of Megalopolis: A Case Study of Shanghai. J. Tianjin Univ. Sport 2017, 32, 277–283. [Google Scholar]
  84. Jing, Y.; Liu, Y.; Cai, E.; Liu, Y.; Zhang, Y. Quantifying the Spatiality of Urban Leisure Venues in Wuhan, Central China—GIS-Based Spatial Pattern Metrics. Sustain. Cities Soc. 2018, 40, 638–647. [Google Scholar] [CrossRef]
  85. Friedmann, J. Regional Development Policy: A Case Study of Venezuela; MIT Press: Cambridge, MA, USA, 1966; ISBN 978-0-262-06013-4. [Google Scholar]
  86. Badiei, N.; Almodaresi, S.A.; Saraei, M. hosein A Systematic Review of Fractal Theory and Its Application in Geography and Urban Planning. Int. J. Appl. Arts Stud. (IJAPAS) 2021, 6, 59–77. [Google Scholar]
  87. Ma, X.; Li, G. Progress and Application Practice in Western City Network Studies. Urban. Plan. Int. 2012, 27, 65–70. [Google Scholar]
  88. Khavarian-Garmsir, A.R.; Sharifi, A.; Hajian Hossein Abadi, M.; Moradi, Z. From Garden City to 15-Minute City: A Historical Perspective and Critical Assessment. Land 2023, 12, 512. [Google Scholar] [CrossRef]
  89. Khavarian-Garmsir, A.R.; Sharifi, A.; Sadeghi, A. The 15-Minute City: Urban Planning and Design Efforts toward Creating Sustainable Neighborhoods. Cities 2023, 132, 104101. [Google Scholar] [CrossRef]
  90. Comi, A.; Savchenko, L. Last-mile delivering: Analysis of environment-friendly transport. Sustain. Cities Soc. 2021, 74, 103213. [Google Scholar] [CrossRef]
  91. Wade, R.H. On the Causes of Increasing World Poverty and Inequality, or Why the Matthew Effect Prevails. New Political Econ. 2004, 9, 163–188. [Google Scholar] [CrossRef]
  92. Liu, G.; Wei, L.; Gu, J.; Zhou, T.; Liu, Y. Benefit distribution in urban renewal from the perspectives of efficiency and fairness: A game theoretical model and the government’s role in China. Cities 2020, 96, 102422. [Google Scholar] [CrossRef]
  93. Zhang, H.; Cong, C.; Chakraborty, A. Exploring the Institutional Dilemma and Governance Transformation in China’s Urban Regeneration: Based on the Case of Shanghai Old Town. Cities 2022, 131, 103915. [Google Scholar] [CrossRef]
  94. Neutens, T.; Schwanen, T.; Witlox, F. The Prism of Everyday Life: Towards a New Research Agenda for Time Geography. Transp. Rev. 2011, 31, 25–47. [Google Scholar] [CrossRef]
  95. Kedarnath Navandar, R.; Hamid Hasan, S.; Jadhav, N.; Udham Singh, K.; Monisha, R.; Venkatram, N. Modernizing Sports an Intelligent Strategy for Entertainment through Internet of Things in Sports. Entertain. Comput. 2025, 52, 100804. [Google Scholar] [CrossRef]
  96. New! Have You Tried the Free Smart Gym at Binhai Bay yet? Available online: https://bhwxq.dg.gov.cn/gkmlpt/content/4/4188/mpost_4188613.html#752 (accessed on 1 May 2025).
  97. Kaczynski, A.T.; Besenyi, G.M.; Stanis, S.A.W.; Koohsari, M.J.; Oestman, K.B.; Bergstrom, R.; Potwarka, L.R.; Reis, R.S. Are Park Proximity and Park Features Related to Park Use and Park-Based Physical Activity among Adults? Variations by Multiple Socio-Demographic Characteristics. Int. J. Behav. Nutr. Phys. Act. 2014, 11, 146. [Google Scholar] [CrossRef] [PubMed]
  98. Feng, J. The Influence of Built Environment on Travel Behavior of the Elderly in Urban China. Transp. Res. Part. D Transp. Environ. 2017, 52, 619–633. [Google Scholar] [CrossRef]
  99. Chen, Y.; Yuan, Y. The Neighborhood Effect of Exposure to Blue Space on Elderly Individuals’ Mental Health: A Case Study in Guangzhou, China. Health Place 2020, 63, 102348. [Google Scholar] [CrossRef]
  100. Rainham, D.; McDowell, I.; Krewski, D.; Sawada, M. Conceptualizing the Healthscape: Contributions of Time Geography, Location Technologies and Spatial Ecology to Place and Health Research. Social. Sci. Med. 2010, 70, 668–676. [Google Scholar] [CrossRef]
  101. Siu, K.W.M.; Wong, K.S.L. Flexible Design Principles: Street Furniture Design for Transforming Environments, Diverse Users, Changing Needs and Dynamic Interactions. Facilities 2015, 33, 588–621. [Google Scholar] [CrossRef]
  102. Rawls, J. An Egalitarian Theory of Justice. Available online: https://usdglobal.wordpress.com/wp-content/uploads/2015/05/02-an-egalitarian-theory-of-justice-by-rawls.pdf (accessed on 10 May 2025).
  103. Smith, A. The Development of “Sports-City” Zones and Their Potential Value as Tourism Resources for Urban Areas. Eur. Plan. Stud. 2010, 18, 385–410. [Google Scholar] [CrossRef]
  104. Zmyslony, P.; Wędrowicz, K.A. Cities in the Experience Economy: The Rise and the Future of Urban Leisure Formats. J. Tour. Futures 2019, 5, 185–192. [Google Scholar] [CrossRef]
  105. Wergeland, E.S.; Hognestad, H.K. Reusing Stadiums for a Greener Future: The Circular Design Potential of Football Architecture. Front. Sports Act. Living 2021, 3, 692632. [Google Scholar] [CrossRef]
  106. Wang, L.; Dai, Y.; Han, L.; Xu, Z. Optimizing Urban Resource Efficiency: A Scenario Analysis of Shared Sports Facilities in Fostering Sustainable Communities in Nanjing, China. J. Clean. Prod. 2024, 468, 143082. [Google Scholar] [CrossRef]
Figure 1. Geographical location of the study area.
Buildings 15 01640 g001
Figure 2. Research methodology framework for public sports facilities analysis.
Buildings 15 01640 g002
Figure 3. Kernel density estimation of public sports facilities in Shanghai.
Buildings 15 01640 g003
Figure 4. Spatial accessibility analysis of public sports facilities in Shanghai.
Buildings 15 01640 g004
Figure 5. Lorenz curve and Gini coefficient of public sports facilities in Shanghai.
Buildings 15 01640 g005
Figure 6. Spatial equity analysis of public sports facilities in Shanghai.
Buildings 15 01640 g006
Table 1. Hierarchical classification of sports facilities in Shanghai.
CategoryFacilitiesQuantityService Radius (m)
City-levelSports centers, stadiums, gymnasiums, and natatoriums595000
Subdistrict-levelCitizen fitness centers, stadiums, gymnasiums, and swimming pools862500
Community-levelPublic sports courts, citizen fitness rooms, fitness stations, and senior exercise centers51641000
Residential-levelFitness spots and exercise areas17,865500
Table 2. Average nearest neighbor analysis results of public sports facilities in Shanghai.
Observed Mean Distance (m) Expected Mean Distance (m) Nearest Neighbor IndexZ-Scorep-Value
City-level3286.954592.210.72−4.180.00
Subdistrict-level5026.864109.421.223.960.00
Community-level383.44766.680.50−68.720.00
Residential-level240.52407.680.59−104.850.00
Disclaimer/Publisher’s Note: The statements, opinions and data contained in all publications are solely those of the individual author(s) and contributor(s) and not of MDPI and/or the editor(s). MDPI and/or the editor(s) disclaim responsibility for any injury to people or property resulting from any ideas, methods, instructions or products referred to in the content.

