1. Introduction
According to official documents such as the “Research Report on Carbon Emissions in the Urban and Rural Construction Sector of China” and the “China Building Industry Development Report,” the energy consumption of the construction industry accounts for approximately 30% of the total national energy consumption, while carbon emissions account for 40–50% of the total national emissions. Among these, the operational energy consumption of buildings, including heating, cooling, and lighting, constitutes a significant portion. Therefore, improving energy efficiency is a major challenge faced by the construction industry. In particular, in regions with a hot summer and cold winter climate, the energy demand for buildings is more severe due to constraints on summer cooling and other factors.
Decisions made during the building design phase play a key role in energy consumption. In regions with hot summers and cold winters, office buildings often use large glass curtain walls, which present a contradiction between natural lighting and energy consumption. An unreasonable window-to-wall ratio leads to excessive heat radiation while ensuring natural lighting. The cooling load during summer surges, accounting for over 50% of the annual energy consumption, while there is significant heat loss in winter, reducing thermal comfort. Meanwhile, inadequate shading design can cause excessive glare near windows, affecting work efficiency and visual comfort, or result in insufficient lighting, with large spaces relying on artificial lighting. Therefore, how to reduce building energy consumption while ensuring comfort has become an urgent research topic.
By exploring the relationships between directional variables and energy consumption, visual comfort, and thermal comfort, this study aims to identify which variable changes significantly affect the performance optimization results in each direction. This provides reliable data for the subsequent development of an accurate multi-objective optimization model. Statistical methods are employed to identify key variables that have a significant impact on performance goals, further obtaining the Pareto optimal solution set using the multi-objective genetic algorithm, determining the best shading design for each direction and providing flexible decision support for office building designs in various climate conditions to meet high energy efficiency and low carbon emission requirements while also ensuring user comfort.
Building performance optimization involves multiple objective parameters, including energy consumption [
1,
2], thermal comfort [
1,
3], visual comfort [
4,
5], and life cycle cost (LCC) [
6]. Among these, the optimization of energy consumption, visual comfort, and thermal comfort plays a key role. Optimization methods span multiple stages: design optimization, material selection and construction, and the application of intelligent technologies. Specific design strategies are explored in the following areas: building envelope design [
7], renewable energy utilization [
8,
9], intelligent HVAC systems [
10,
11], intelligent lighting systems [
12], energy management systems (EMS) [
13,
14,
15,
16], high-efficiency insulation and reflection technologies [
17], geothermal and water-source heat pump systems [
18,
19], automated blinds and shading devices [
20,
21], and adjustable exterior walls [
22,
23]. Current research mainly focuses on optimizing building shape and layout: window-to-wall ratio [
24], window width [
25], glass type [
24], panel angles [
24,
26], shading strategies [
27,
28], building orientation [
27], and building aspect ratio [
29].
Single-objective optimization has been widely applied in building performance tasks such as energy consumption and daylighting analysis, as it simplifies the decision-making process and yields a relatively ideal solution. Several major algorithms are commonly used for such analyses. Simulated Annealing (SA)–based energy optimization in buildings leverages its global search capability to avoid local optima [
30], making it suitable for complex problems involving both energy consumption and comfort performance [
31]. However, SA suffers from high computational costs and slow convergence in high-dimensional or large-scale problems. Ant Colony Optimization (ACO), which mimics the foraging behavior of ants, attempts to balance global exploration and local exploitation in building performance optimization. Nonetheless, ACO is limited by its tendency to fall into local optima and its high computational complexity [
32]. Particle Swarm Optimization (PSO) has been applied to building energy optimization [
29] and structural design tasks, owing to its strong global search ability. However, in high-dimensional and multi-variable coupled optimization scenarios, PSO is prone to local optima, exhibits strong sensitivity to parameter settings, and lacks effective mechanisms for handling discrete variables. Premature convergence and weak scalability further constrain its applicability in complex architectural contexts. As compared to competitors such as genetic algorithms (GAs), PSO demonstrates significant shortcomings in computational efficiency, solution robustness, and compatibility with mixed-variable problems, often requiring hybrid strategies or intensive parameter tuning to overcome its limitations.
In actual building design, single-objective optimization often fails to meet multiple demands, leading to performance conflicts, such as increased energy consumption, while improving daylighting performance [
33]. In contrast, multi-objective optimization can simultaneously optimize thermal comfort, visual comfort, and energy consumption. The NSGA-II (Non-dominated Sorting Genetic Algorithm II) is an evolutionary algorithm used for multi-objective optimization, based on genetic algorithms (GAs), that incorporates non-dominated sorting and crowding distance concepts [
34], guiding the distribution mechanism to maintain the diversity of optimization results and ensure the algorithm finds a Pareto optimal solution set while maintaining a uniform distribution of results.
This study explores the relationships between directional variables and energy consumption, visual comfort, and thermal comfort using a multi-objective method, with the scientific originality outlined as follows.
Considering the differences in solar conditions for different building orientations, a methodology for optimizing parameters for different orientations is proposed. Through experimental testing and data analysis of key variables such as window-to-wall ratio, shading facility types, and sizes for each direction, this study clarifies their relationship with building energy consumption, thermal comfort, and visual comfort performance, providing optimization recommendations for façades based on local conditions.
This study uses Design Explorer for analysis, showcasing the performance of multiple optimization schemes and their trade-offs, effectively identifying the trade-offs and balance between optimization objectives and determining the best design strategies for single or multiple optimization objectives.
For buildings in regions with a hot summer and cold winter climate, vertical shading is most commonly used for east–west orientations. However, by combining shading device spacing, rotation angle, and depth, it was found that horizontal shading is more effective in achieving a balance in building performance.
This research methodology has broad applicability and replicability. It provides a generic research framework for shading device design decision-making in office building projects of various scales, layouts, and climate zones, promoting the application of multi-objective optimization methods for building performance.
2. Materials and Methods
2.1. Technical Approach
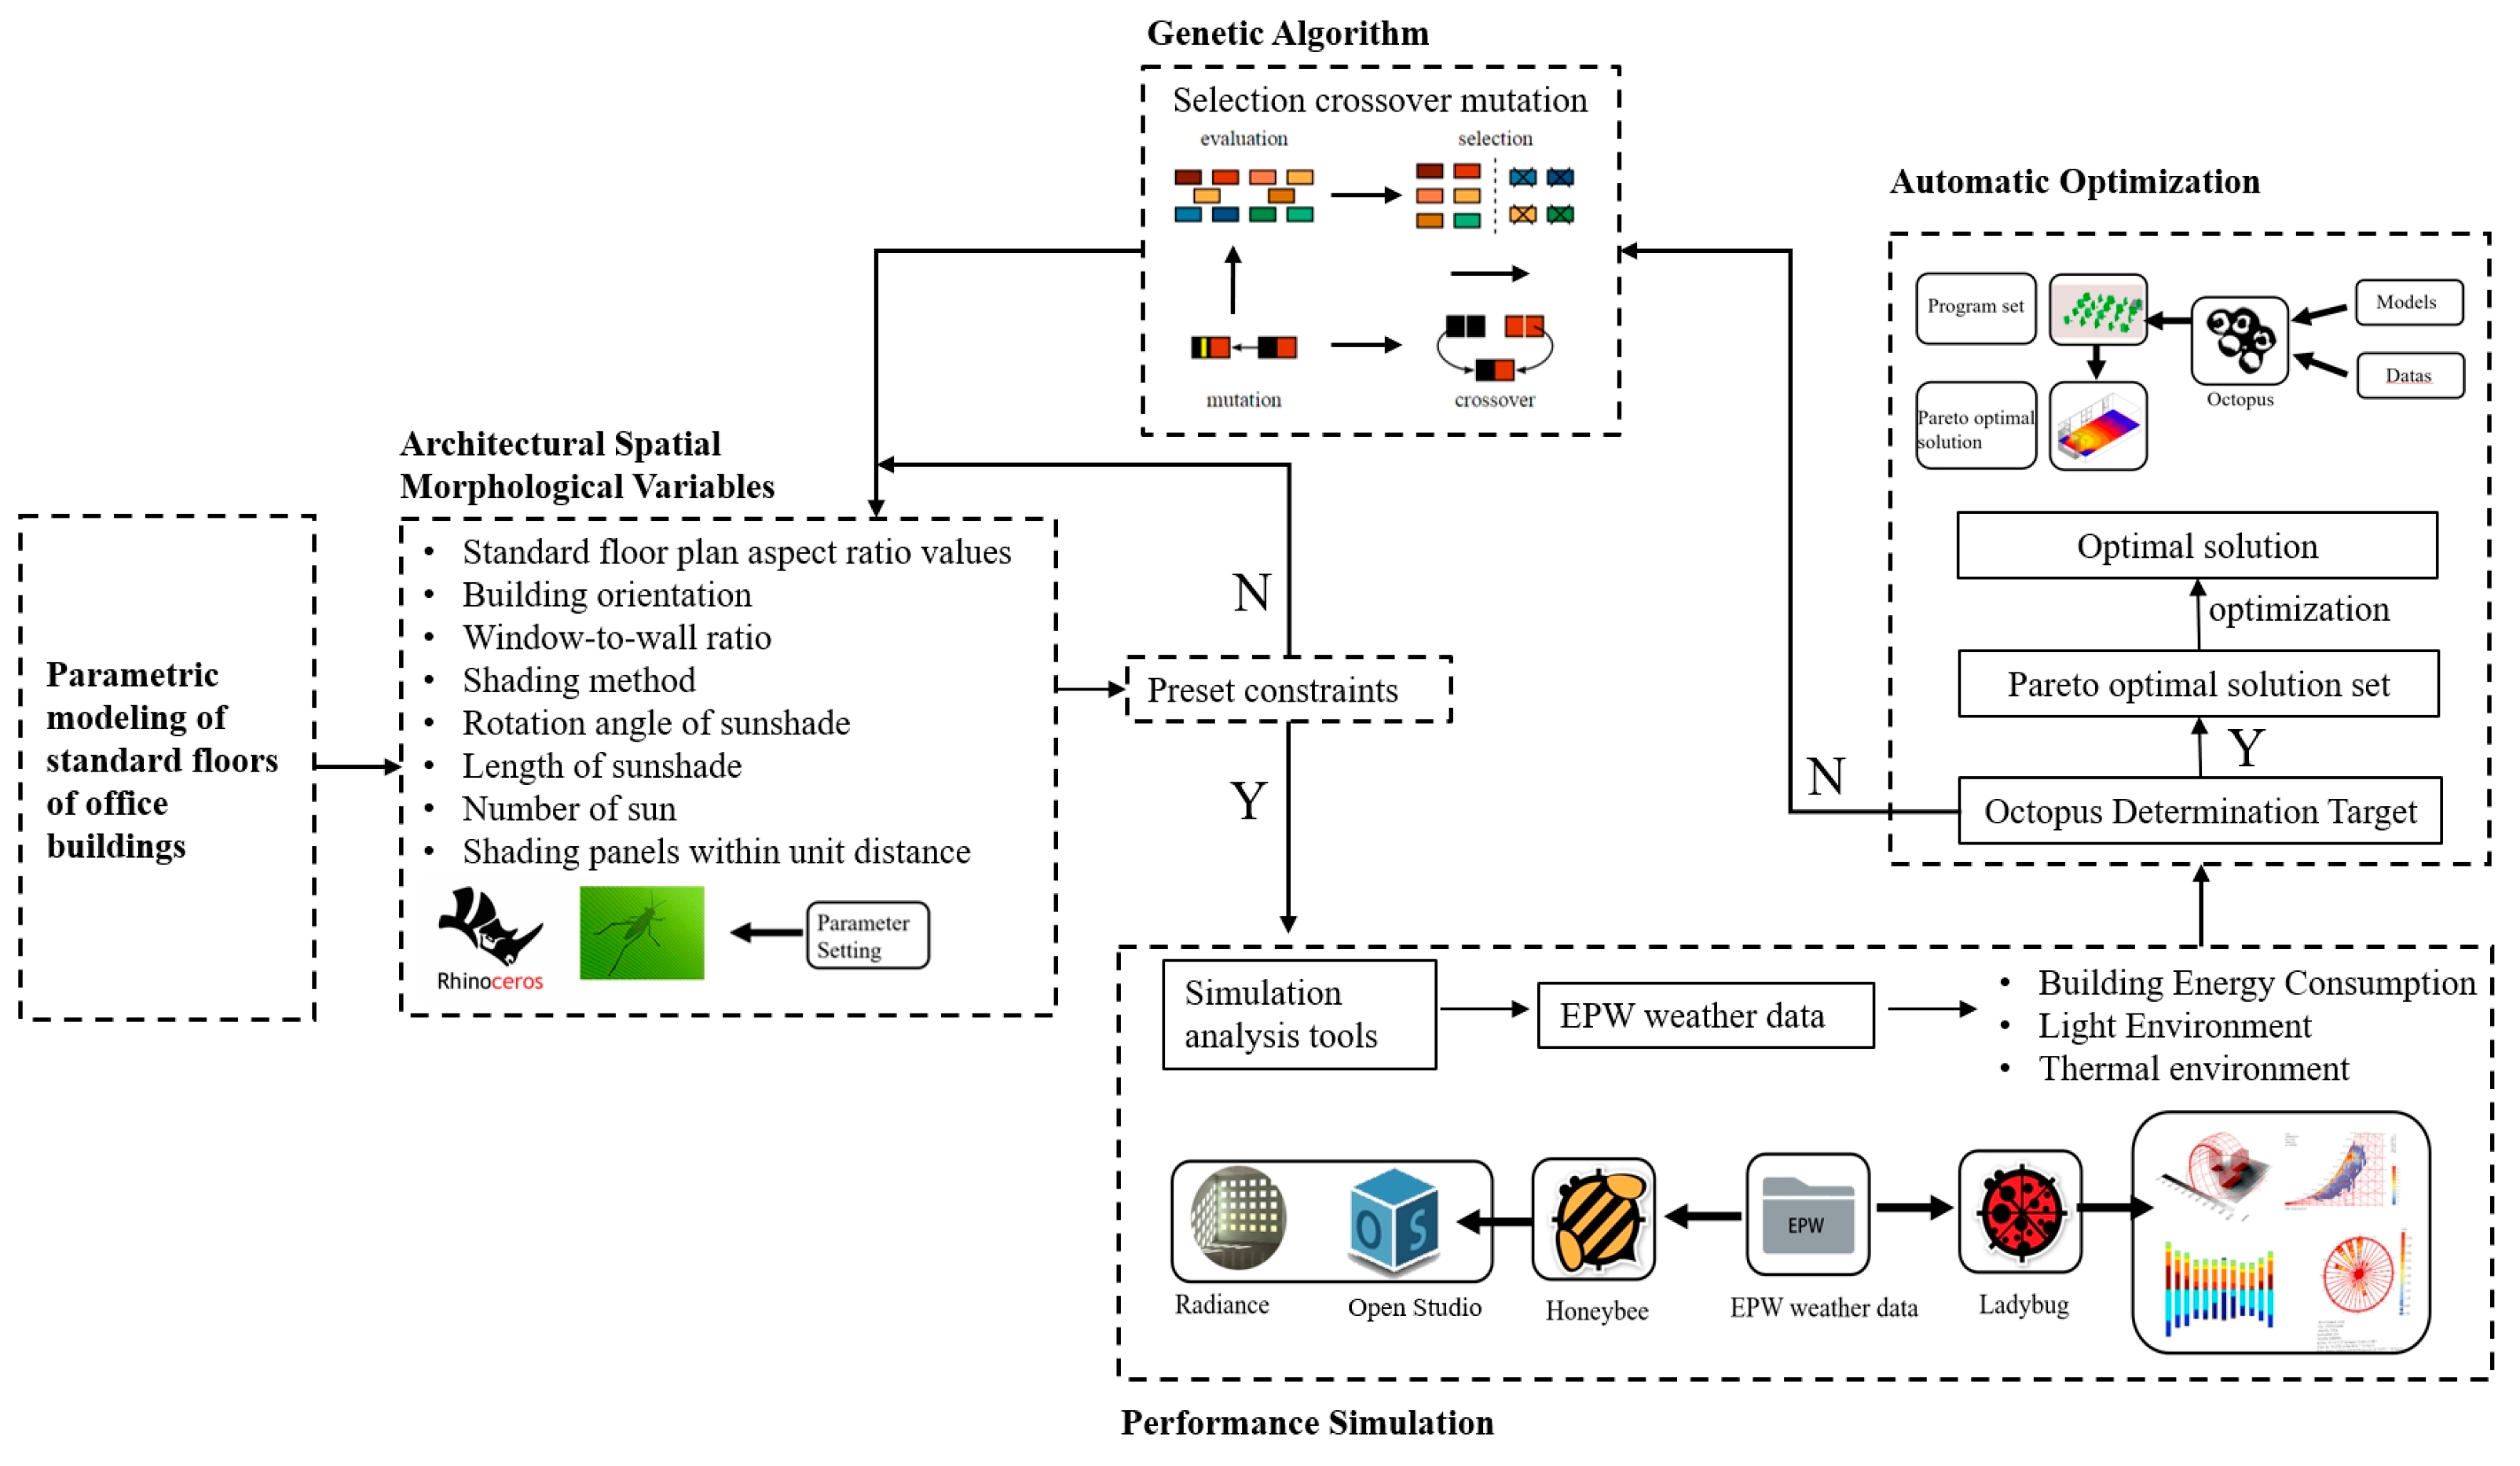
In building performance optimization, a standard floor model of the office building is established using Rhino’s Grasshopper platform, setting related building variables, including floor plan aspect ratio, building orientation, window-to-wall ratio, shading strategy, shading device orientation, shading device depth, and shading device spacing (as shown in
Figure 1). Constraints and judgments are set according to existing building codes, and once conditions are met, performance simulations are performed. Based on the Ladybug plugin, the climate and lighting conditions for the study area are analyzed, and energy consumption and thermal comfort are evaluated using the Honeybee plugin. After these steps, the building performance results are output, and the Pareto front solution set is determined using Octopus 0.4. If the results do not meet the requirements, adjustments are made to the variables through selection, crossover, and mutation in the genetic algorithm, starting a new round of calculations until multiple Pareto front solution sets are generated, from which the optimal solution is selected. The basic concept and mathematical framework for obtaining Pareto-optimal solutions based on genetic algorithms can be described as follows:
The multi-objective optimization process based on a genetic algorithm aims to minimize several performance indicators simultaneously, such as energy consumption, thermal comfort, and visual comfort. The general formulation is expressed as follows:
where x represents the vector of decision variables, and fi(x) denotes the i-th objective function. In multi-objective optimization, a solution x* is defined as a Pareto optimal solution if no other solution xxx exists such that the following holds true:
This condition implies that solution x* is non-dominated, meaning no other solution outperforms it in all objectives and at least one objective is better. In other words, in a multi-objective context, it is impossible to improve one objective without deteriorating at least one of the others. This principle forms the basis of the Pareto front, which provides a set of trade-off solutions for decision-makers.
2.2. Sample Selection
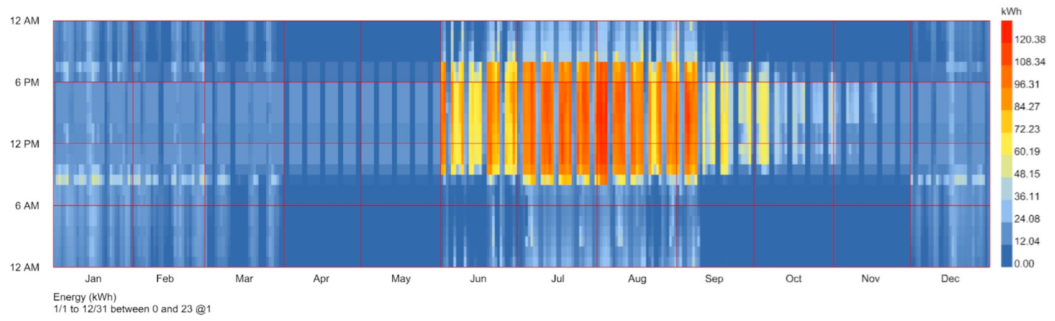
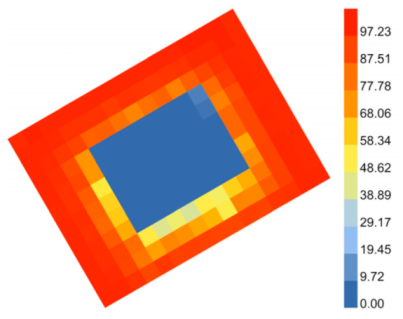
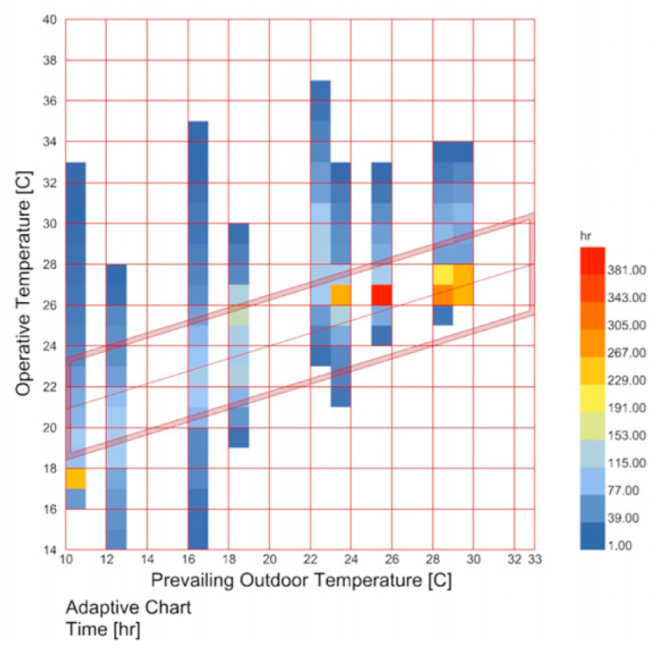
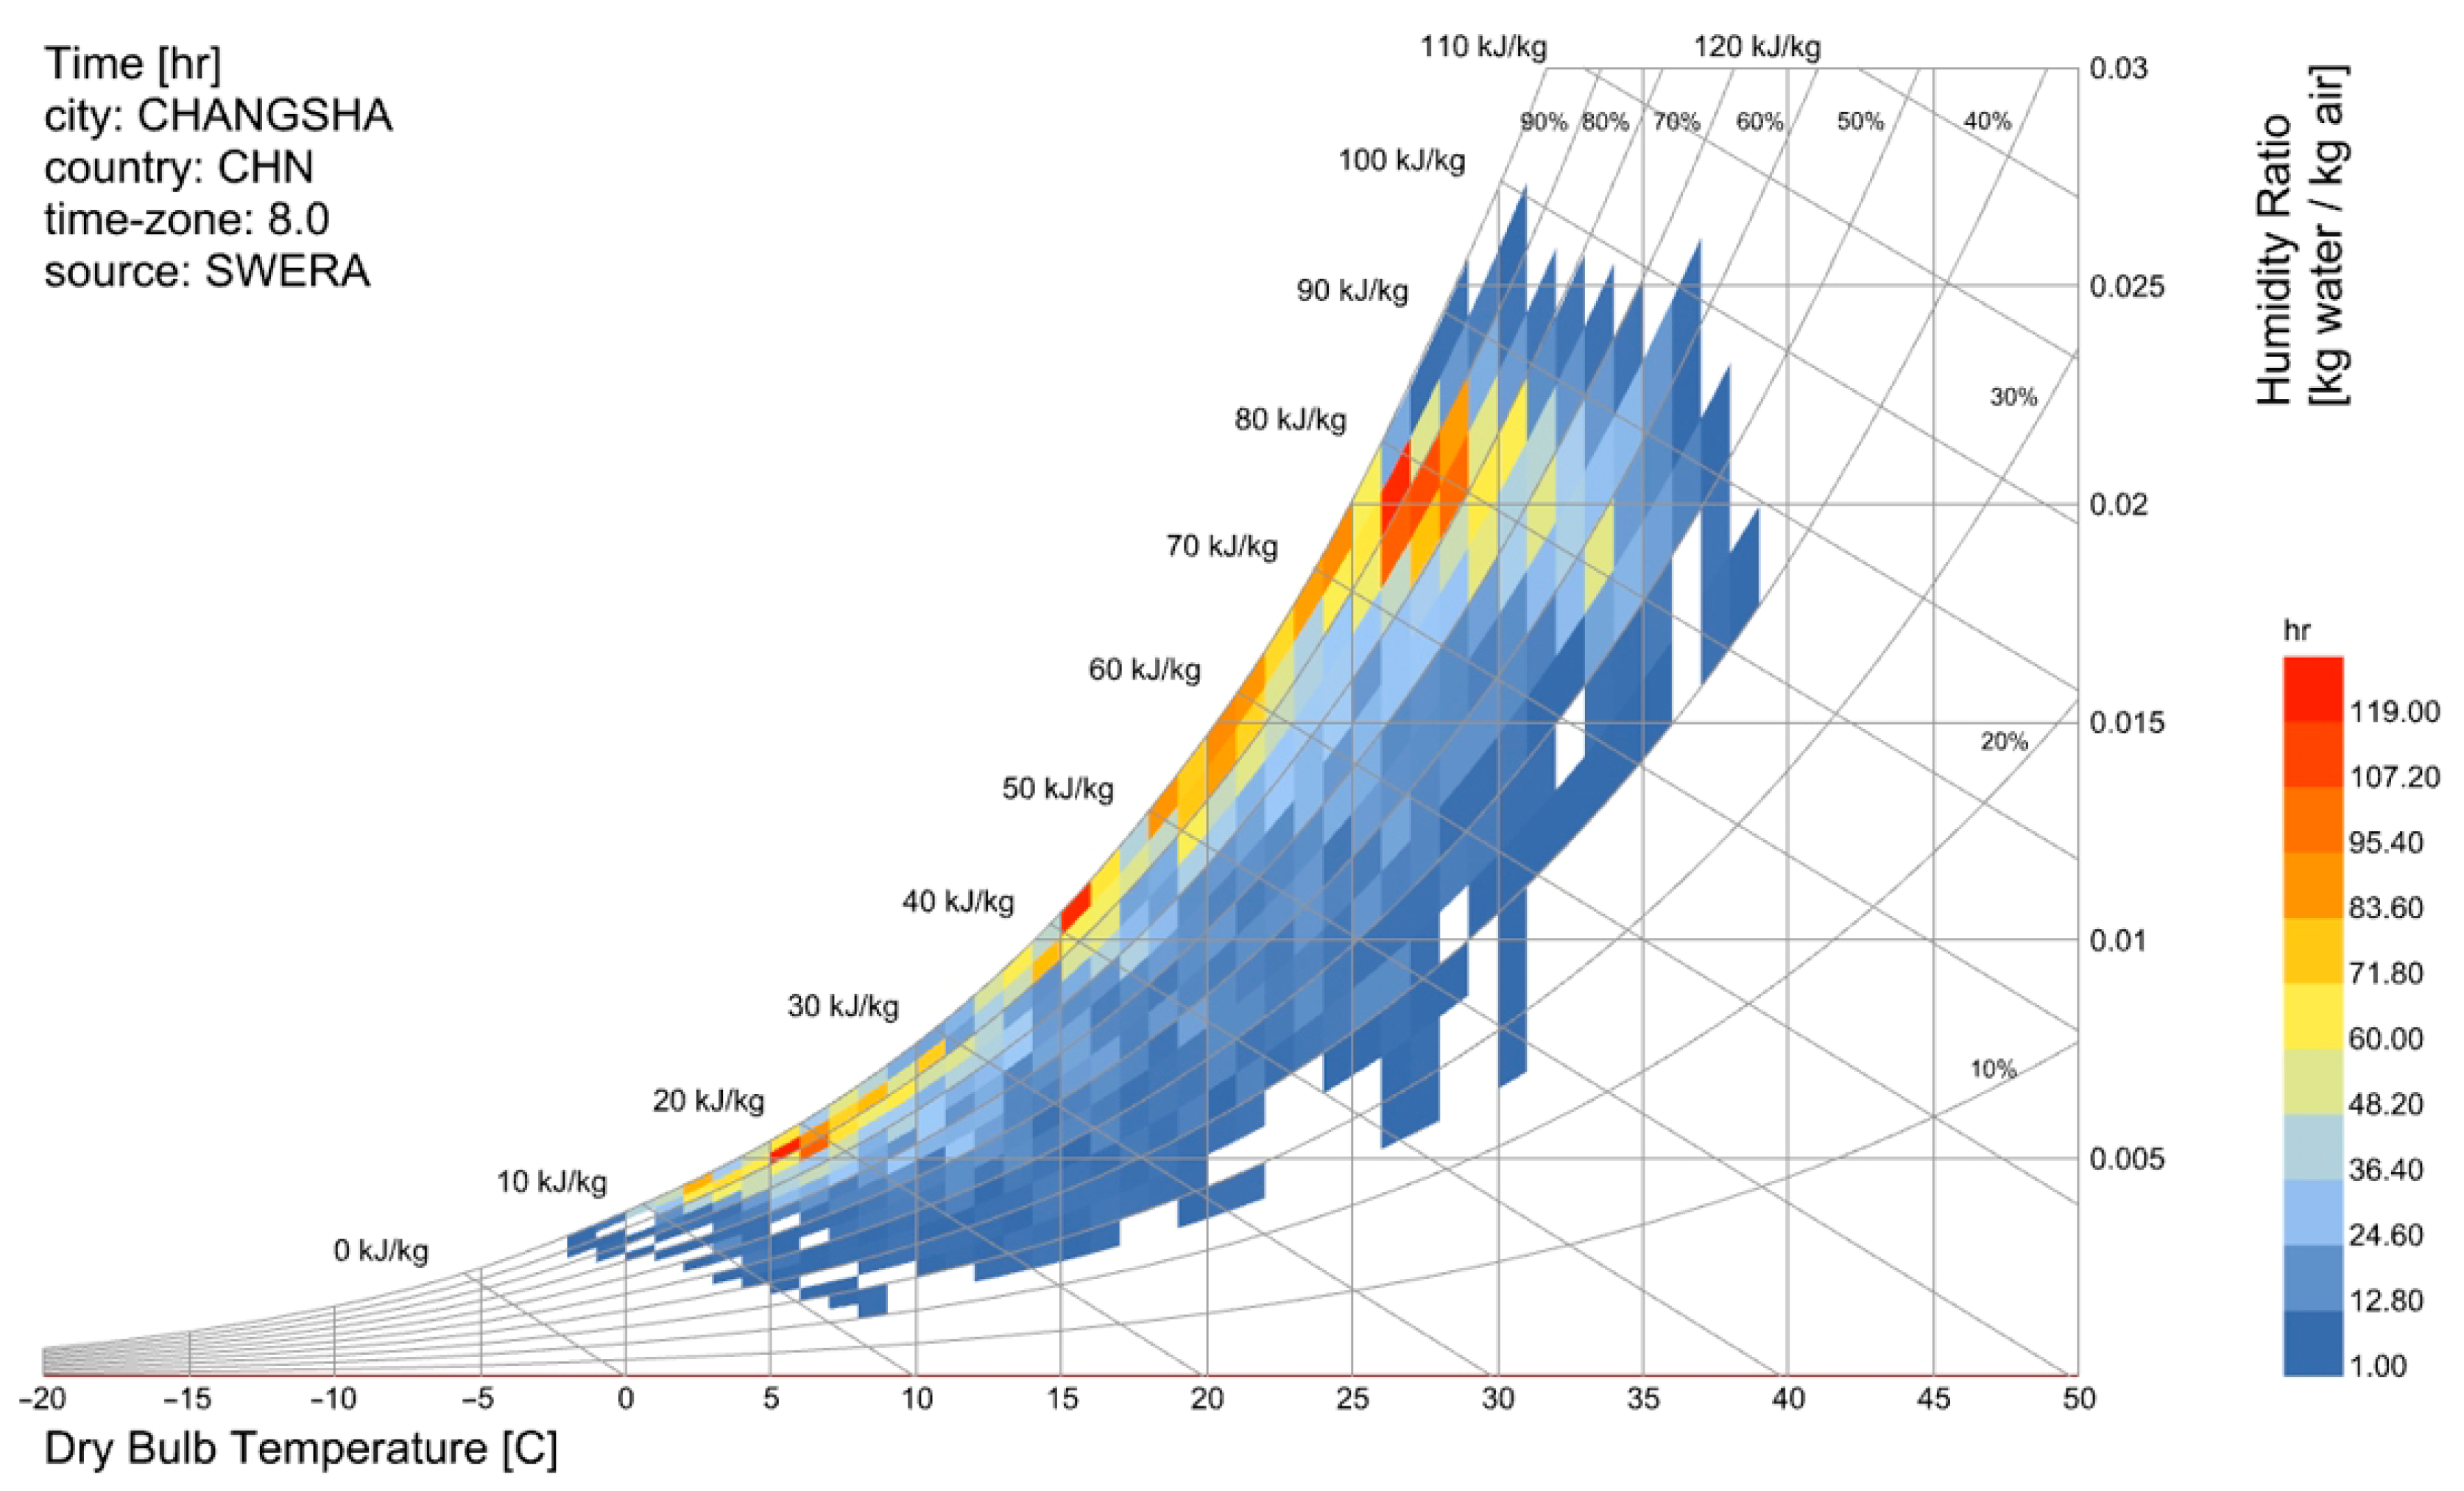
Changsha, located in Hunan Province, China, has a subtropical monsoon climate characterized by hot and humid summers and cold and damp winters [
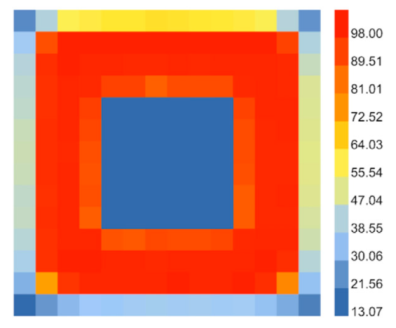
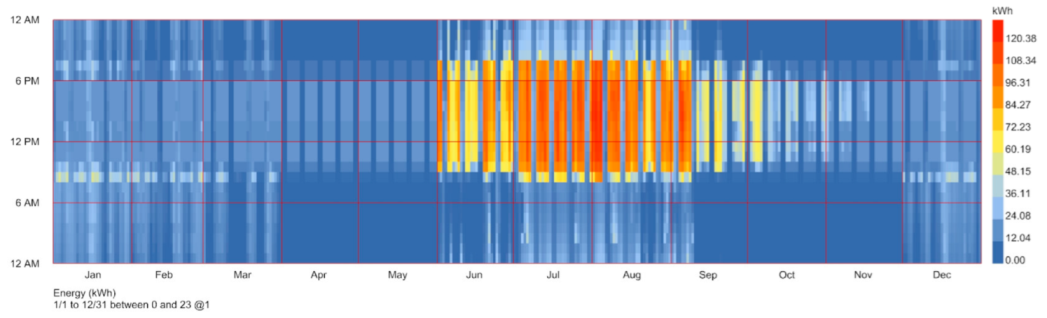
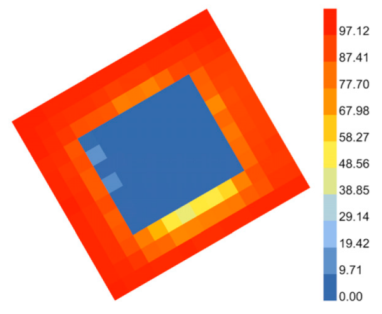
35]. From June to September, the average temperature ranges from 30 °C to 35 °C, and due to the combined effects of high temperatures and humidity (as shown in
Figure 2 and
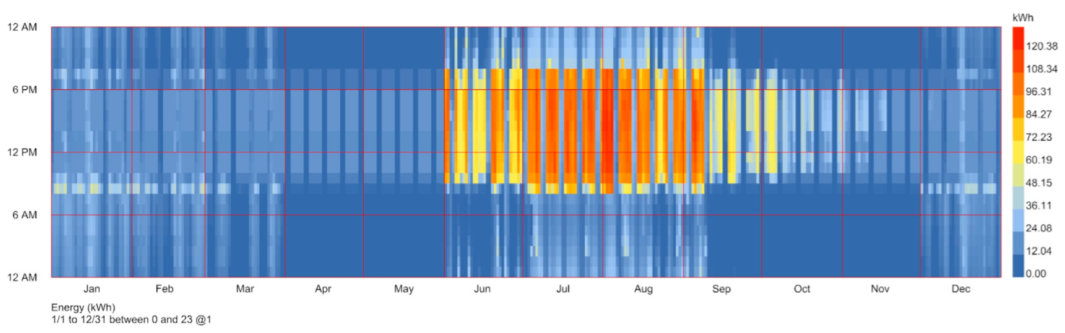
Figure 3), the building cooling load accounts for more than 50% of annual energy consumption. From December to February, the temperature ranges from 0 °C to 8 °C (as shown in
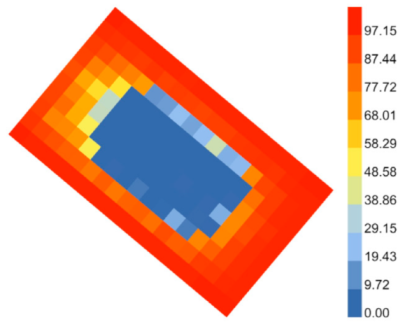
Figure 4), and heating demand increases due to the large humidity. Changsha has a low rate of residential heating, mainly relying on air conditioning for heating, leading to high energy consumption during winter. The solar altitude angle in Changsha is relatively high in summer, ranging from 78° to 80°, and lower in winter, ranging from 30° to 35°. In summer, UDI (Useful Daylight Illuminance) ranges from 50% to 70%, requiring glare control, while in winter, UDI decreases to 20% to 40%, with some areas experiencing insufficient light.
The typical hourly weather file for Changsha was jointly developed by Dr. Jiang Yi from the Department of Building Science and Technology at Tsinghua University and the China Meteorological Administration [
36]. The source data include annual design data, typical meteorological year (TMY) data, and extreme year conditions, such as maximum enthalpy, highest and lowest temperatures, and solar radiation.
Based on on-site surveys and data screening of office buildings in Changsha, high-rise office buildings with a total height between 80 and 100 m were selected as the research objects. The results show that buildings with a standard floor area ranging from 1500 to 2000 m2 account for the highest proportion, approximately 40%; buildings with a floor height between 4.2 and 5.0 m account for 30%, making it one of the primary design ranges. A typical high-rise office building in Changsha, Hunan Province, was selected as a representative case. The building has a total height of approximately 90 m, a standard floor area of 1800 m2, and a floor height of 5.0 m. It complies with relevant codes such as the Code for Fire Protection Design of Buildings and the Design Standards for Office Buildings, demonstrating strong representativeness. The building faces due south, with a floor plan measuring 41.6 m by 40.4 m. The core tube is centrally located, occupying 25% of the standard floor area. In terms of shading strategy, the east, south, west, and north façades are equipped with vertical shading devices. The shading device spacing is 1.5 m, and the shading device length is 0.3 m. The window-to-wall ratio (WWR) for all four orientations is 0.6.
2.3. Optimization Objectives
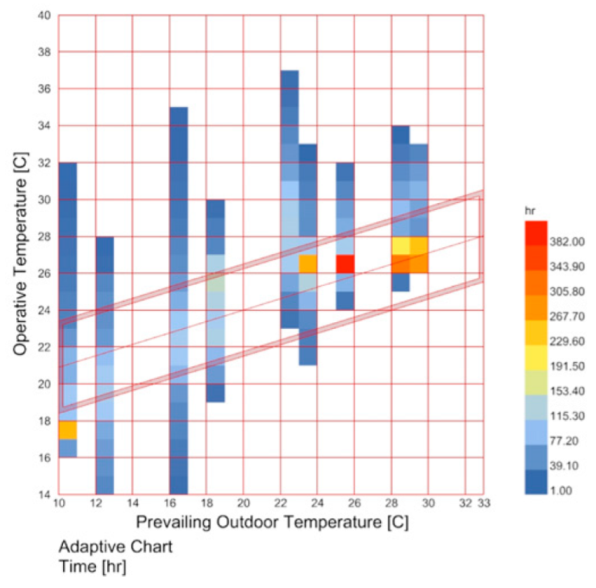
The optimization objectives focus on three aspects: energy consumption, visual comfort, and thermal comfort. In terms of thermal comfort, the adaptive thermal comfort model proposed in ASHRAE55-2017 improves the shortcomings of PMV by considering how the indoor comfort temperature range is affected by recent outdoor climate conditions. This model incorporates the average outdoor temperature from the recent period as a parameter, dynamically adjusting the indoor comfort temperature range based on seasonal changes, which better aligns with human physiological and psychological adaptation to external environments [
37]. For example, the hotter the recent outdoor period, the higher the comfortable indoor temperature, while the cooler the outdoor temperature, the lower the comfortable indoor temperature.
Tcomf: indoor thermal comfort temperature.
Tout(mean): the average outdoor temperature, which is the average of the daily average outdoor temperatures over the 7–30 days prior to the measurement date.
To meet a 90% thermal comfort acceptability rate, the comfort temperature range is defined as the indoor comfort temperature ±2.5 °C. For example, when the indoor comfort temperature is 25 °C, the corresponding acceptable comfort range is 22.5 °C to 27.5 °C. In this study, thermal comfort is quantified as the percentage of time over the course of a year during which the indoor operative temperature falls within the adaptive comfort temperature range defined by ASHRAE Standard 55.
In office building design, daylighting design is crucial, as excessive natural illuminance can cause glare, leading to eye fatigue, distraction, and decreased work efficiency. Insufficient daylighting increases the use of artificial lighting, raising building lighting energy consumption. The dynamic daylighting evaluation index UDI, proposed by Nabil A. and Mardalievic J. in 2005, is based on the illuminance value on the workplane and reflects the predicted annual natural daylighting hours at a test point [
38]. According to the “Building Lighting Design Standard” [
39] (GB50033-2013), the ideal range of effective daylight illuminance in office buildings is between 300 lx and 1000 lx, ensuring the best combination of visual comfort and work efficiency [
40]. The Honeybee plugin’s analysis component calculates the annual visual comfort. The energy consumption in office buildings mainly focuses on summer cooling, winter heating, and lighting electricity. Only these aspects are considered in the experiment.
In the multi-objective optimization process of building performance conducted in this study, three key performance indicators—energy consumption, thermal comfort, and visual comfort—were comprehensively considered. The weighting values for each indicator were determined based on existing green building evaluation systems and relevant research findings. LEED v4 offers two assessment pathways specifically tailored to the full lifecycle of office buildings: Building Design and Construction (BD + C: New Construction) and Operations and Maintenance (O + M: Existing Buildings). These pathways cover both the green design process of new office buildings and the operational performance evaluation of existing buildings, making them highly adaptable and widely applied. According to the LEED v4 rating system, the Energy and Atmosphere category carries significant weight, with a maximum of 33 points—accounting for over 30% of the total score—highlighting the central importance of energy control in sustainable building design [
41]. In contrast, thermal comfort and visual comfort are included under the Indoor Environmental Quality category, which has comparatively lower weight. In addition to LEED, the weighting scheme also draws on ASHRAE Standard 55—Thermal Environmental Conditions for Human Occupancy [
37]—and optimization practices recommended by IBPSA (International Building Performance Simulation Association) [
42]. Overall, assigning weights of 40% for energy consumption, 35% for thermal comfort, and 25% for visual comfort provides a balanced optimization approach between energy efficiency and occupant well-being, offering strong practical guidance for building performance improvement.
2.4. Variable Parameters Description
The constant parameters for the experiment include a floor height of 5 m, an area of 1800 square meters, and a core area that occupies 25% of the standard floor area. The variable parameters mainly consist of seven categories (as shown in
Figure 5).
In Rhino/Grasshopper, parameter components are used to drive the geometric configuration of the model and generate shading devices. The Ladybug and Honeybee plugins are employed to read the following geometric variables and output corresponding performance indicators, including energy consumption, thermal comfort (based on ASHRAE 55), and visual comfort (measured by UDI). The simulation results are then imported into Octopus (based on NSGA-II) for multi-objective optimization. Through iterative evolution and parameter refinement, a set of Pareto-optimal solutions is ultimately obtained. Seven key design variables are defined as follows:
Floor plan aspect ratio: under the condition of constant floor area, various plan configurations are generated by adjusting the ratio between the north–south length and the east–west length. The possible values are: 0.5, 0.58, 0.67, 0.75, 0.83, and 1. Building orientation angle: The initial building orientation is set to true south. Clockwise rotation is defined as negative, while counterclockwise rotation is positive. The range of values includes: −50°, −40°, −30°, −20°, −10°, 0°, 10°, 20°, 30°, 40°, and 50°. Window-to-wall ratio (WWR): Defined as the ratio of window area to total wall area for each building façade. The values for the east, south, west, and north orientations are: 0.2, 0.4, 0.6, and 0.8. Shading strategy: two types of shading strategies are considered for each façade, horizontal shading and vertical shading. Shading device orientation: For vertical shading devices, positive values represent clockwise rotation and negative values represent counterclockwise rotation. For horizontal shading devices, upward tilt is defined as negative, and downward tilt as positive. The angle values range from −50° to +50°. Shading device length: The horizontal or vertical extension length of the shading device measured from the building façade. The values are: 0.2 m, 0.4 m, 0.6 m, 0.8 m, and 1 m. Shading device spacing: The vertical spacing between adjacent shading devices on the same façade. The values are: 0.6 m, 0.9 m, 1.2 m, 1.5 m, 1.8 m, and 2.1 m.
2.5. Simulation Tools Selection
In multi-objective optimization, several mainstream platforms are commonly employed. MATLAB (R2024a) combined with the Optimization Toolbox offers powerful algorithms and flexible customization capabilities, making it suitable for optimization problems in engineering, physics, and mathematics. However, it lacks a graphical interface and often demands significant computational resources [
43]. EnergyPlus (v24.1.0) and DesignBuilder (v7.0.2.006) focus specifically on building energy performance optimization, providing accurate energy simulations and built-in optimization tools. Nevertheless, these tools are primarily energy-centered and offer limited flexibility [
44]. OptiStruct (2023) is mainly used for structural optimization and is well-suited for multidisciplinary engineering design optimization [
45]. In contrast, Rhino in conjunction with Grasshopper and Octopus has become one of the most widely adopted platforms for multi-objective optimization in architectural design and environmental performance analysis. Its key strength lies in its robust visual modeling capabilities, which allow users to intuitively carry out both design and optimization tasks. With built-in support for genetic algorithms, this platform is capable of addressing complex building performance challenges. Therefore, Rhino + Grasshopper + Octopus is considered an ideal solution for building performance optimization, particularly when handling complex design scenarios requiring high flexibility and efficiency in multi-objective decision-making.
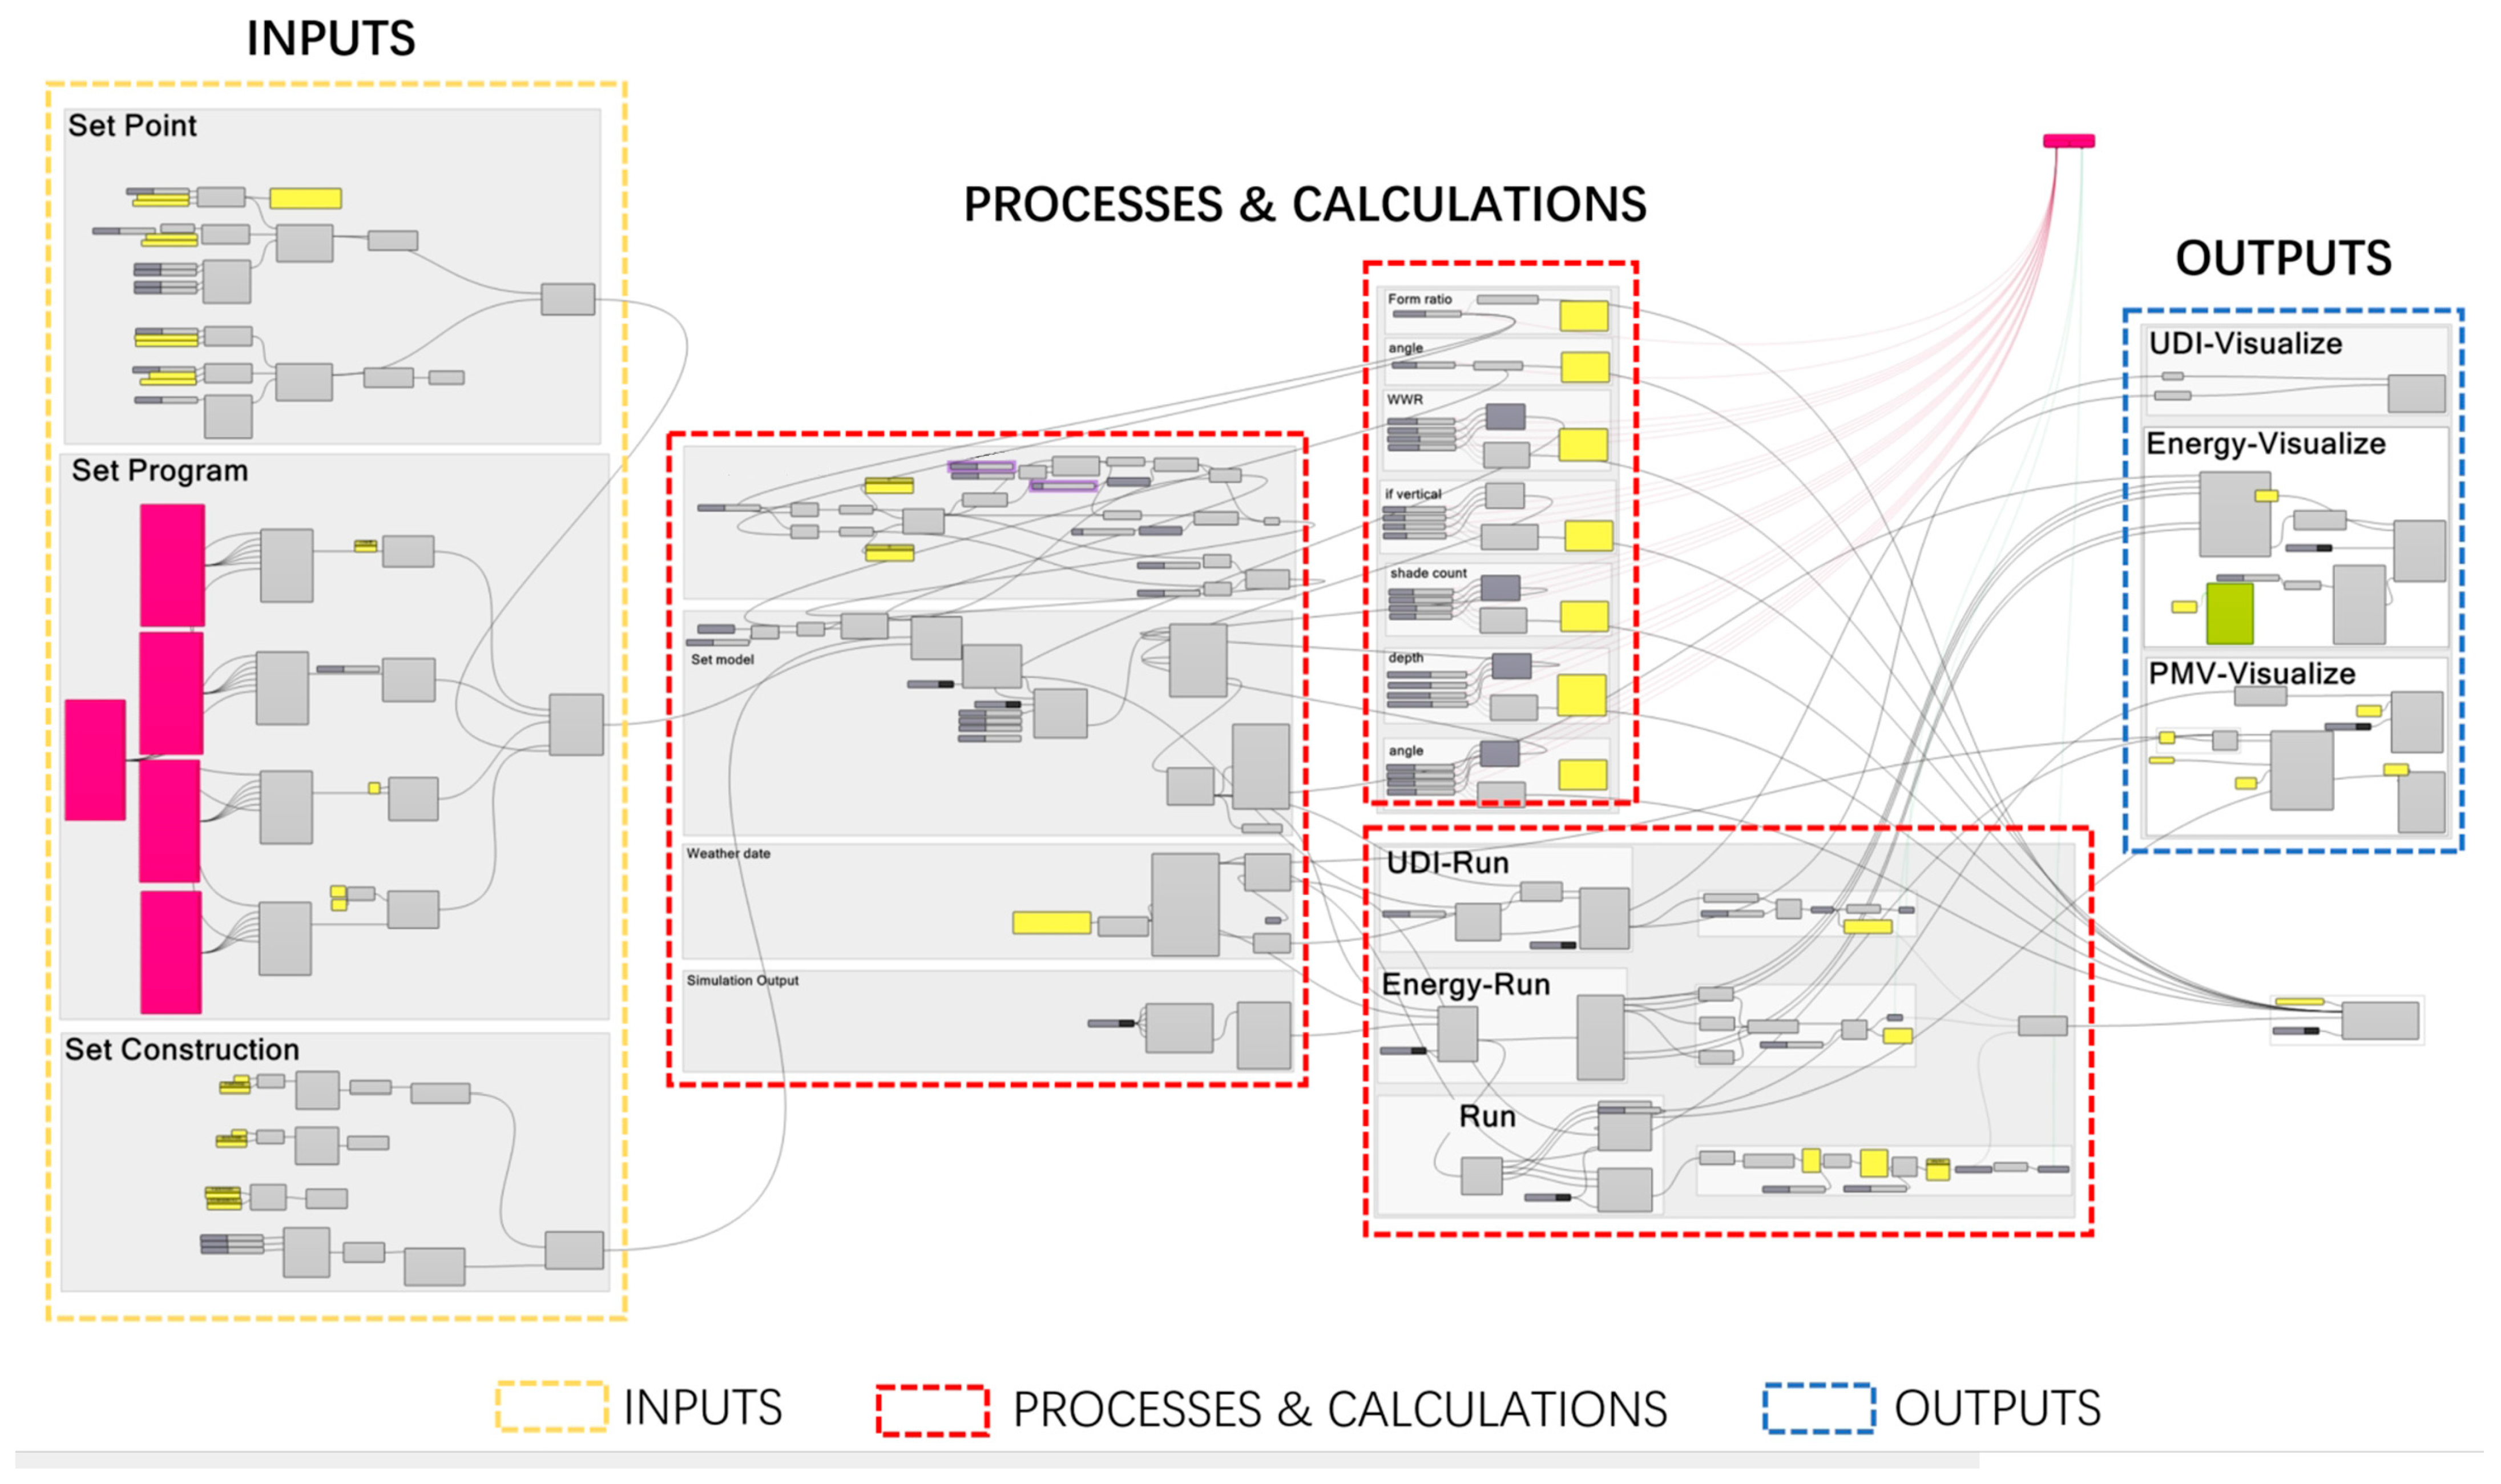
The Rhino-based Grasshopper platform is structured into three main components: input, computation, and output (as shown in
Figure 6). On the input side, a series of parametric components are used to define climate conditions, building performance parameters (including material composition, thermal transmittance, and solar heat gain coefficients), as well as occupant-related variables (such as energy usage patterns, operational schedules, and occupancy frequency). In the computation phase, plugins such as Ladybug, Radiance, and Honeybee facilitate the processing of environmental datasets, including daylighting and natural ventilation. These tools are integrated with EnergyPlus to enable real-time climate-driven simulations of building energy performance, delivering detailed outputs such as total energy consumption and HVAC system efficiency, thereby enhancing the accuracy of the optimization process. Ladybug is used to evaluate the thermal comfort acceptability percentage of the building, while Radiance is employed for daylighting analysis, providing precise assessments of indoor illumination under varying solar conditions [
46]. Finally, in the output phase, Octopus is utilized to maximize visual and thermal comfort metrics while minimizing building energy consumption through multi-objective optimization.
In the performance optimization of office buildings and similar architectural types, the design objective is to maximize visual comfort and thermal comfort while minimizing energy consumption. When employing the Octopus algorithm for multi-objective optimization, it is important to note that the algorithm inherently seeks the minimum of objective functions. Therefore, to achieve the maximization of visual and thermal comfort, the corresponding objective function values must be multiplied by −1. This transformation ensures that minimizing the negated values effectively corresponds to maximizing the original comfort objectives.
3. Results
The optimal solution is found based on energy consumption, thermal comfort, and visual comfort by constructing the Pareto front to balance multiple objectives. In this case, no objective can be further optimized without sacrificing another. The analysis is carried out on the relationship between the variations of seven key independent variables—floor plan aspect ratio, building orientation angle, window-to-wall ratio for each direction, shading strategy, shading device orientation, shading device depth, and shading device spacing—and the target variables.
3.1. Sensitivity Analysis
After completing the simulation experiments, sensitivity analysis is conducted on the independent variables and objective variables (as shown in
Figure 7). After determining the outliers, 24 abnormal samples, accounting for 3.2% of the total, were removed from the dataset. This includes energy consumption values that were excessively high and comfort values that were excessively low. After removing these outliers, correlation and regression calculations were performed again, with no significant change in the trends. The correlation coefficient for the east–west shading method and energy consumption slightly decreased from +0.48 to +0.45, indicating that the overall analysis conclusion is robust and will not change due to extreme values.
Shading device depth exhibits a negative correlation with objective variables (as shown in
Figure 7). The shading depth for each direction has a positive correlation with visual comfort and thermal comfort, with a correlation coefficient of +0.20. The westward shading depth has a correlation of +0.31 with visual comfort and a negative correlation with energy consumption. Longer shading devices provide better visual and thermal comfort while reducing total energy consumption, as they more effectively block direct sunlight, reducing glare and cooling loads.
Shading device rotation angles show weak correlations with objective variables. The westward shading device angle has a positive correlation with visual comfort with a coefficient of +0.22, indicating that adjusting the downward angle of horizontal shading devices can improve indoor visual comfort. At the same time, the shading device angles for all directions show negative correlations with energy consumption, with coefficients ranging from +0.18 to +0.36, and positive correlations with thermal comfort, with coefficients ranging from +0.15 to +0.34. This indicates that increasing the downward tilt angle of shading devices helps reduce energy consumption and improve thermal comfort.
Shading device spacing exhibits a reverse relationship with shading device depth in terms of correlation with objective variables. Shading device spacing for all directions shows a negative correlation with visual comfort and thermal comfort and a positive correlation with energy consumption. The southward spacing has the highest correlation of +0.45 with energy consumption, suggesting that smaller spacings reduce sunlight penetration, improving comfort and reducing energy consumption.
The relationships between thermal comfort (%), visual comfort (%), and energy consumption (kWh) demonstrate significant non-linear characteristics (as shown in
Figure 8). The following conclusions can be drawn: There is a clear negative correlation between visual comfort, thermal comfort, and energy consumption. When thermal comfort reaches 40% to 50%, visual comfort gradually increases, while energy consumption decreases. At 50% to 52.5% thermal comfort, visual comfort peaks near 70%, and energy consumption reaches its minimum in the multi-objective optimal region. Beyond 55% thermal comfort, visual comfort starts to decline, primarily due to reduced window-to-wall ratios and more stringent shading measures blocking daylight. This reduces visual comfort while ensuring thermal comfort, with a slight increase in energy consumption as a result of shading reducing sunlight intake, raising winter heating and lighting electricity consumption.
3.2. Optimal Parameters for the Floor Plan Aspect Ratio
The floor plan aspect ratio can adjust the amount of sunlight received from various directions, preventing excessive sunlight intake. According to the “Building Daylighting Design Standard” (GB50033-2013), the time during which natural daylight satisfies the specified illuminance range (100 lx to 3000 lx) at the height of the work surface is defined over the course of a year.
As the aspect ratio (the ratio of the length from north to south to the length from east to west while keeping the area constant) increases, when the ratio is between 0.50 and 0.67, visual comfort shows a slight increase (as shown in
Figure 9). This is because the south-facing façade is the primary source of sunlight and can easily lead to excessive sunlight entering the building. As the width of the east–west direction decreases in the plan, sunlight intake gradually decreases, and glare is mitigated. When the ratio is between 0.75 and 1.00, visual comfort maintains above 55%, which is the highest value in this range. In terms of energy consumption and thermal comfort, both increase gradually with an increase in the aspect ratio, with significant changes between 50% and 67%. In summer, this reduces excessive heat entering the building, thus reducing cooling energy consumption and improving thermal comfort. When the ratio is between 0.75 and 1.00, the change trend weakens, and energy consumption remains around 145,000 kWh, while thermal comfort remains between 50% and 55%. The optimal range for the floor plan aspect ratio is from 0.67 to 1, as it provides a balance between energy consumption, visual comfort, and thermal comfort.
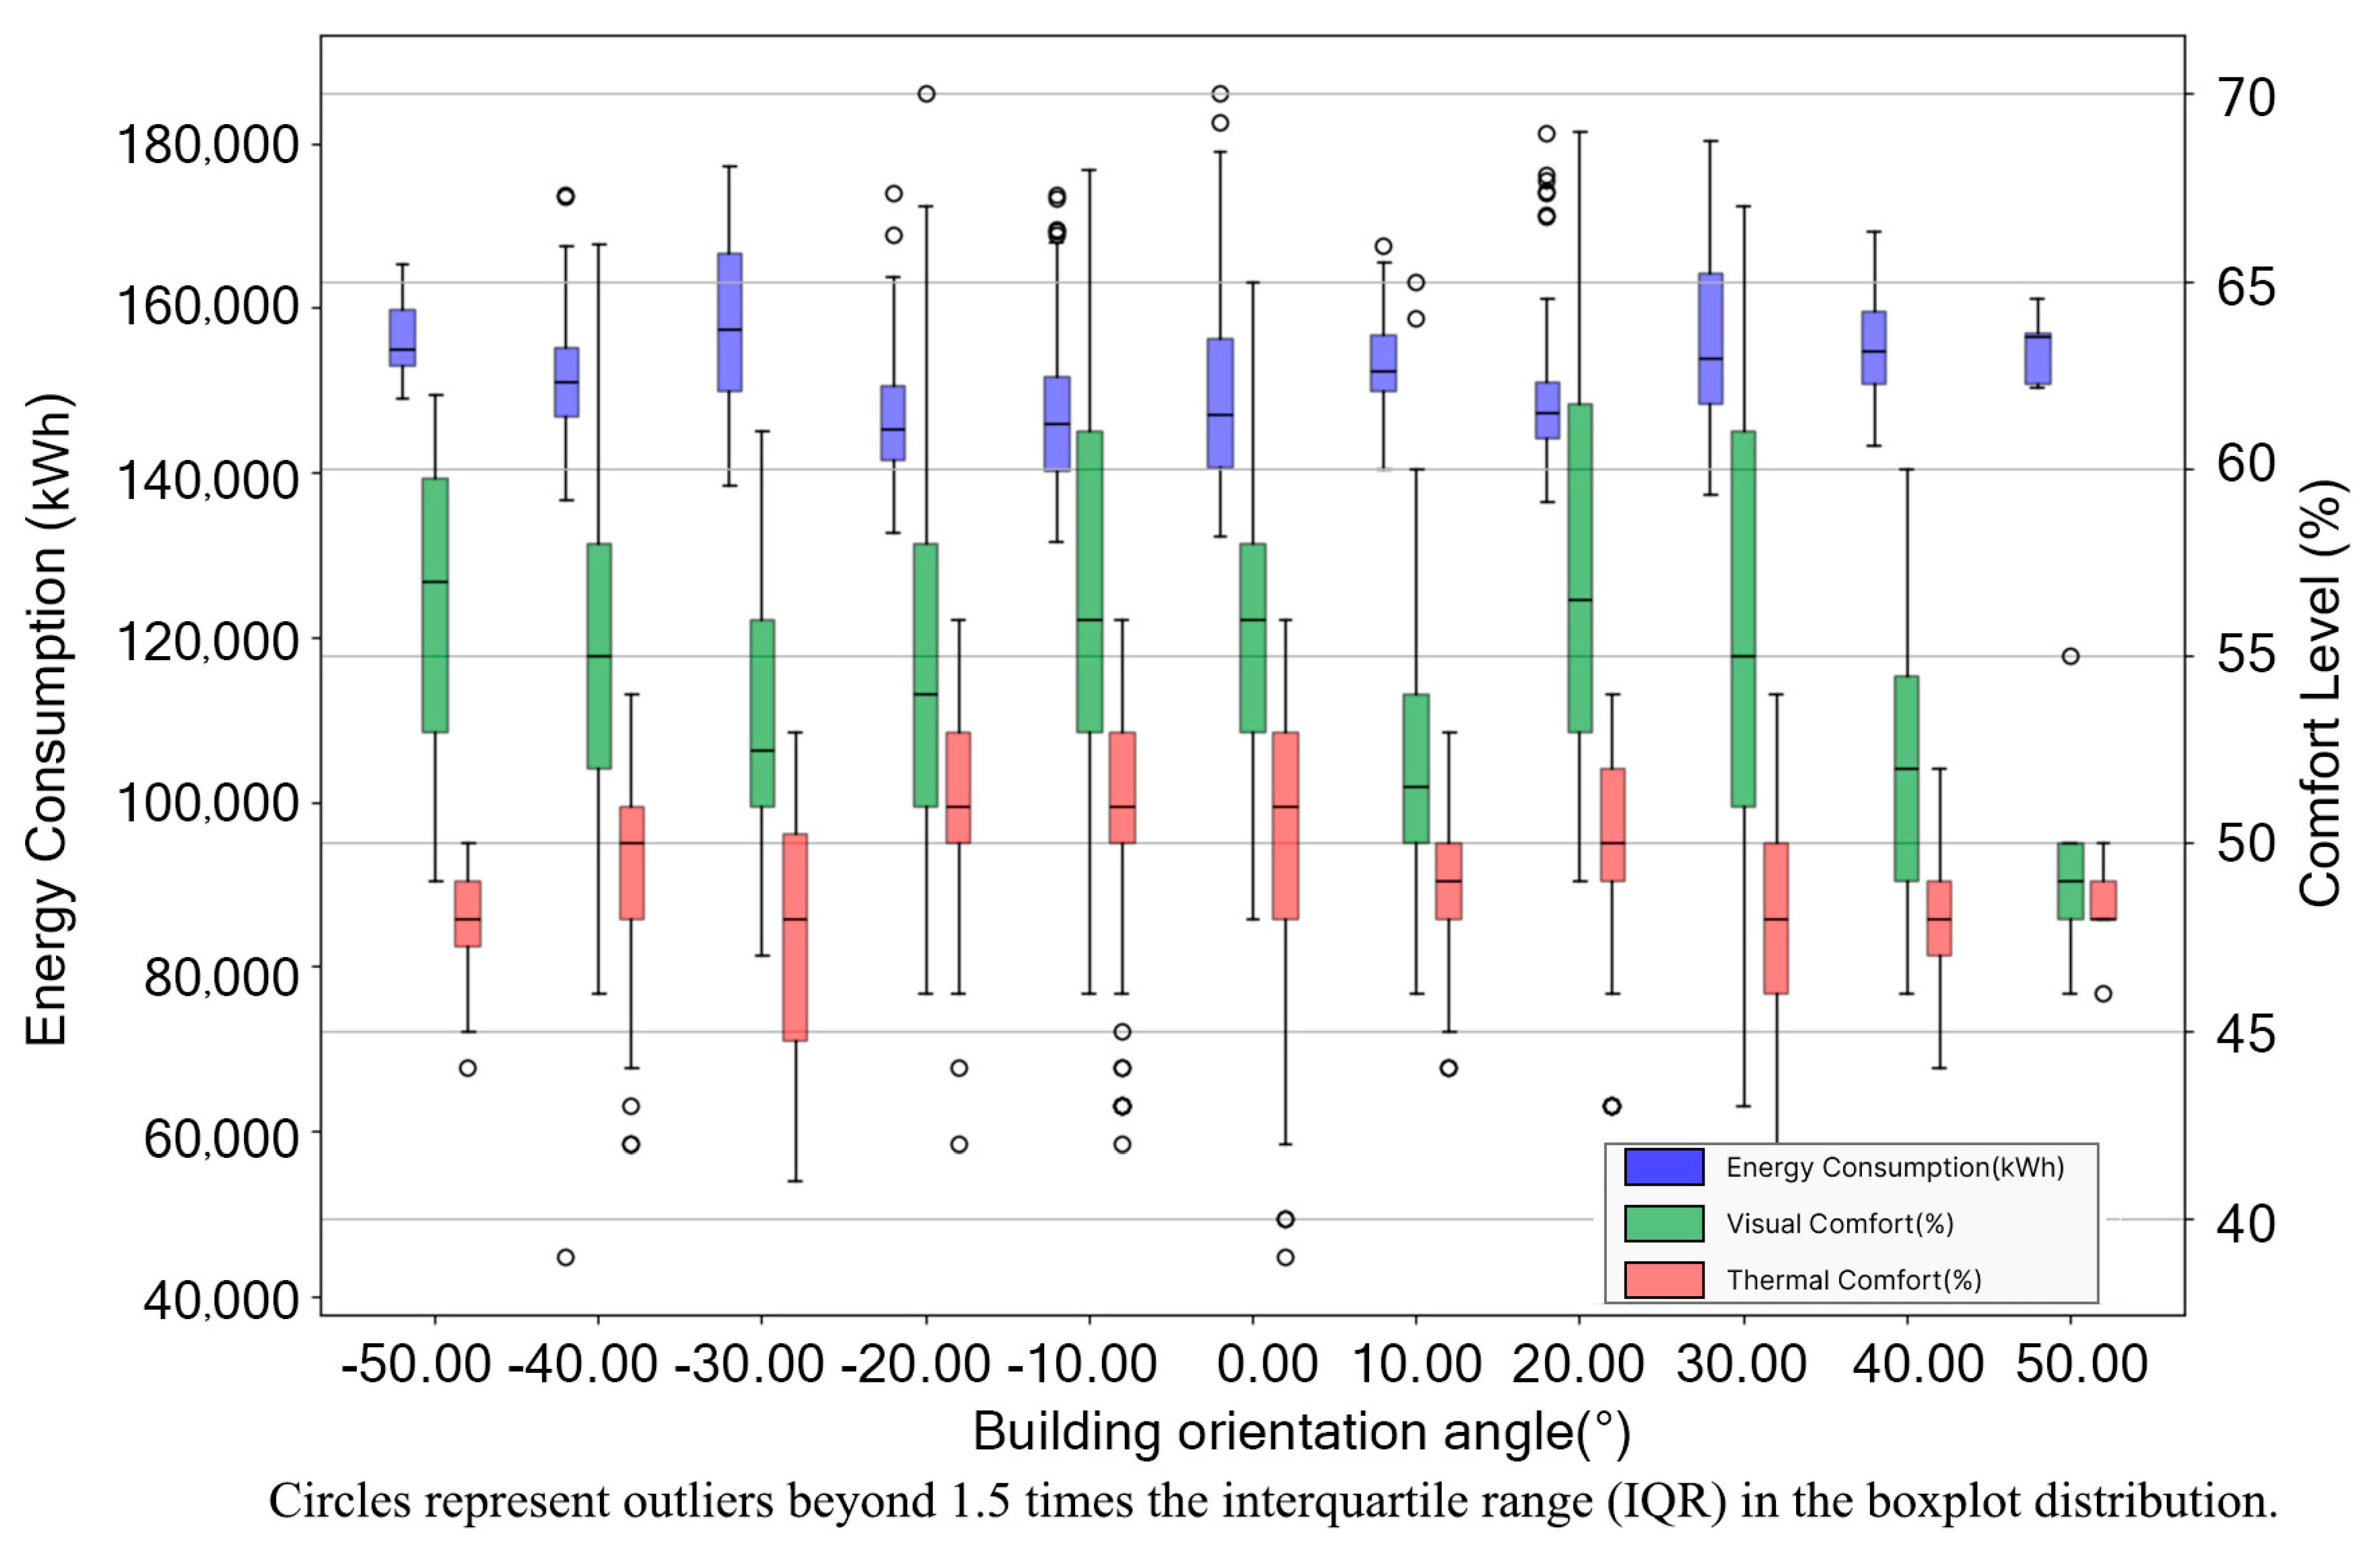
3.3. Optimal Parameters for the Building Orientation Angle
In regions with a hot summer and cold winter climate, a reasonable building orientation angle can adjust the amount of solar radiation received by the building’s exposed surfaces, thereby optimizing winter daylighting and summer shading. The initial building orientation is due south; clockwise rotation is negative, while counterclockwise rotation is positive.
In terms of thermal comfort, when the orientation angle increases clockwise to −10°, thermal comfort slightly improves and reaches its peak. As the angle increases to −20°, thermal comfort remains stable at around 52%. Further increases in rotation result in a decrease in thermal comfort below 50% (as shown in
Figure 10). When the orientation angle increases counterclockwise, the overall trend is a decline. The optimal orientation angle for buildings in regions with a hot summer and cold winter climate is between 0° and −20° clockwise.
The orientation angle also affects the direction of the building’s windows, which in turn affects the angle and distribution of sunlight. This influences the uniformity of indoor lighting, and consequently, visual comfort. As the orientation angle increases clockwise, visual comfort first decreases and then increases. Between 0° and −10°, visual comfort slightly improves as the orientation angle shifts away from due south, which effectively reduces direct sunlight from the south-facing windows and mitigates glare. When the orientation angle increases to −30°, visual comfort reaches its lowest point, and as the angle reaches 50°, visual comfort increases to 57%. When rotating counterclockwise, the overall trend shows a decrease followed by an increase and then a decline, with the extreme value occurring at 20° counterclockwise. For buildings in regions with a hot summer and cold winter climate, the optimal orientation angle is between 0° and −10° clockwise, or −50° clockwise, or 20° counterclockwise.
Regarding energy consumption, the building orientation angle influences the amount of solar radiation received, which subsequently affects the building’s cooling and heating needs. As the orientation angle increases clockwise from −10° to −20°, energy consumption slightly decreases and reaches its lowest value of around 144,000 kWh. At −30°, energy consumption reaches its highest value of around 155,000 kWh. When rotating counterclockwise, energy consumption generally increases. The decrease in sunlight intake leads to lower thermal comfort in winter, resulting in an increase in heating energy consumption. For buildings in regions with a hot summer and cold winter climate, the best orientation angle is between 0° and −20° clockwise.
Based on the above analysis, if energy consumption is the priority, the optimal building orientation angle is between 0° and −20° clockwise. If visual comfort is prioritized, the optimal building orientation angle is between 0° and −10° clockwise or 20° counterclockwise. If thermal comfort is the focus, the optimal building orientation angle is between 0° and −20° clockwise. Considering all three objectives, the best value range is between 0° and −20° clockwise.
3.4. Optimal Window-to-Wall Ratio for the Four Directions
In this study, the marginal contributions of shading variables on four building orientations to annual energy consumption, visual comfort, and thermal comfort performance were analyzed using the XGBoost model and SHAP (SHapley Additive exPlanations) method. The horizontal axis represents the SHAP values, which share the same units as the predicted targets and quantify the positive or negative impact of each input variable on the model output. The vertical axis lists the shading-related input variables for the four orientations, while the color gradient from blue to red indicates the actual value of each variable across all samples. Based on the SHAP-based interpretability mechanism and parametric simulation results, this study provides a direction-specific analysis for the east, south, west, and north façades and identifies the optimal window-to-wall ratio (WWR) ranges for each orientation.
3.4.1. The East-Facing Window-to-Wall Ratio
The east-facing façade receives strong low-angle direct sunlight in the morning, significantly affecting both visual and thermal conditions. SHAP analysis reveals that when the window-to-wall ratio (WWR) exceeds 0.6, the SHAP value for energy consumption rises sharply, with maximum values exceeding +8000 kWh, indicating an increase in cooling load due to early solar exposure. In contrast, when the WWR falls within the range of 0.2–0.4, SHAP values trend negative (down to approximately −7000 kWh), suggesting a more favorable balance between solar shading and daylight access (as shown in
Figure 11).
For thermal comfort, SHAP values increase as the WWR rises from 0.2 to 0.4, peaking at 0.4 (approximately +0.02 to +0.03), and then, decline with further increases in WWR. Visual comfort reaches a local optimum at a WWR of around 0.6, indicating that ample morning daylight improves illumination uniformity. Considering all three performance metrics, the optimal WWR for the east façade is recommended to be approximately 0.4, which balances energy efficiency, thermal comfort, and visual quality (as shown in
Figure 12).
3.4.2. The West-Facing Window-to-Wall Ratio
The west-facing façade is exposed to intense solar radiation during summer afternoons, making it one of the primary sources of thermal load in buildings. SHAP analysis shows that as the window-to-wall ratio (WWR) increases from 0.2 to 0.8, the SHAP value for energy consumption rises continuously, reaching a peak in the range of 0.6–0.8 (+10,000 to +12,000 kWh), indicating a substantial increase in cooling demand. Meanwhile, SHAP values for thermal comfort decline steadily, reaching their lowest point (−0.06) when the WWR is between 0.6 and 0.8, which reflects a pronounced overheating risk.
In terms of visual comfort, SHAP values are slightly positive within the 0.2–0.4 WWR range but turn negative (below −0.02) when the WWR exceeds 0.6, suggesting issues with glare and overexposure. These patterns are consistent with simulation results, which show that the best performance across all three objectives—energy use, thermal comfort, and visual comfort—is achieved when the WWR is between 0.2 and 0.4. Therefore, a low window-to-wall ratio is recommended for the west façade to mitigate thermal discomfort and control cooling loads effectively.
3.4.3. The South-Facing Window-to-Wall Ratio
The south-facing façade receives the most solar exposure throughout the year, significantly influencing all three performance indicators. SHAP analysis indicates that when the window-to-wall ratio (WWR) exceeds 0.6, the SHAP values for energy consumption cluster between +8000 and +12,000 kWh, suggesting that excessive glazing increases summer cooling loads and overall annual energy use. In the high WWR range (0.6–0.8), thermal comfort SHAP values are distinctly negative (as low as −0.05), while visual comfort SHAP values are positively concentrated (+0.02 to +0.06), indicating that although large windows enhance daylighting, they also lead to overheating. Simulation results further confirm that if the primary objective is to optimize thermal comfort and energy efficiency, the optimal WWR for the south façade should be limited to the 0.2–0.4 range.
3.4.4. The North-Facing Window-to-Wall Ratio
The north-facing façade receives little to no direct sunlight throughout the year, with daylighting primarily reliant on diffuse sky radiation. SHAP analysis shows that when the window-to-wall ratio (WWR) is within the 0.2–0.4 range, thermal comfort SHAP values are positive (up to approximately +0.03), indicating improved heat retention and reduced winter heat loss. However, as the WWR increases to 0.6–0.8, SHAP values for energy consumption rise steadily, reaching nearly +10,000 kWh, suggesting increased heat loss during colder months due to excessive glazing.
For visual comfort, SHAP values are most concentrated in the 0.4–0.6 range, indicating that a moderate window ratio provides a balanced daylighting environment. Simulation results corroborate these findings, showing that a WWR between 0.4 and 0.6 offers the best trade-off between stable indoor thermal conditions and adequate visual comfort. Therefore, a WWR of 0.4–0.6 is recommended as the optimal range for north-facing façades.
In conclusion, for the four directions, the best window-to-wall ratios are as follows: 0.4 for the east-facing façade, between 0.2 and 0.4 for the west-facing façade, between 0.2 and 0.4 for the south-facing façade, and between 0.4 and 0.6 for the north-facing façade. In this range, visual comfort, thermal comfort, and energy consumption are balanced.
3.5. The Best Shading Strategy for the Four Directions
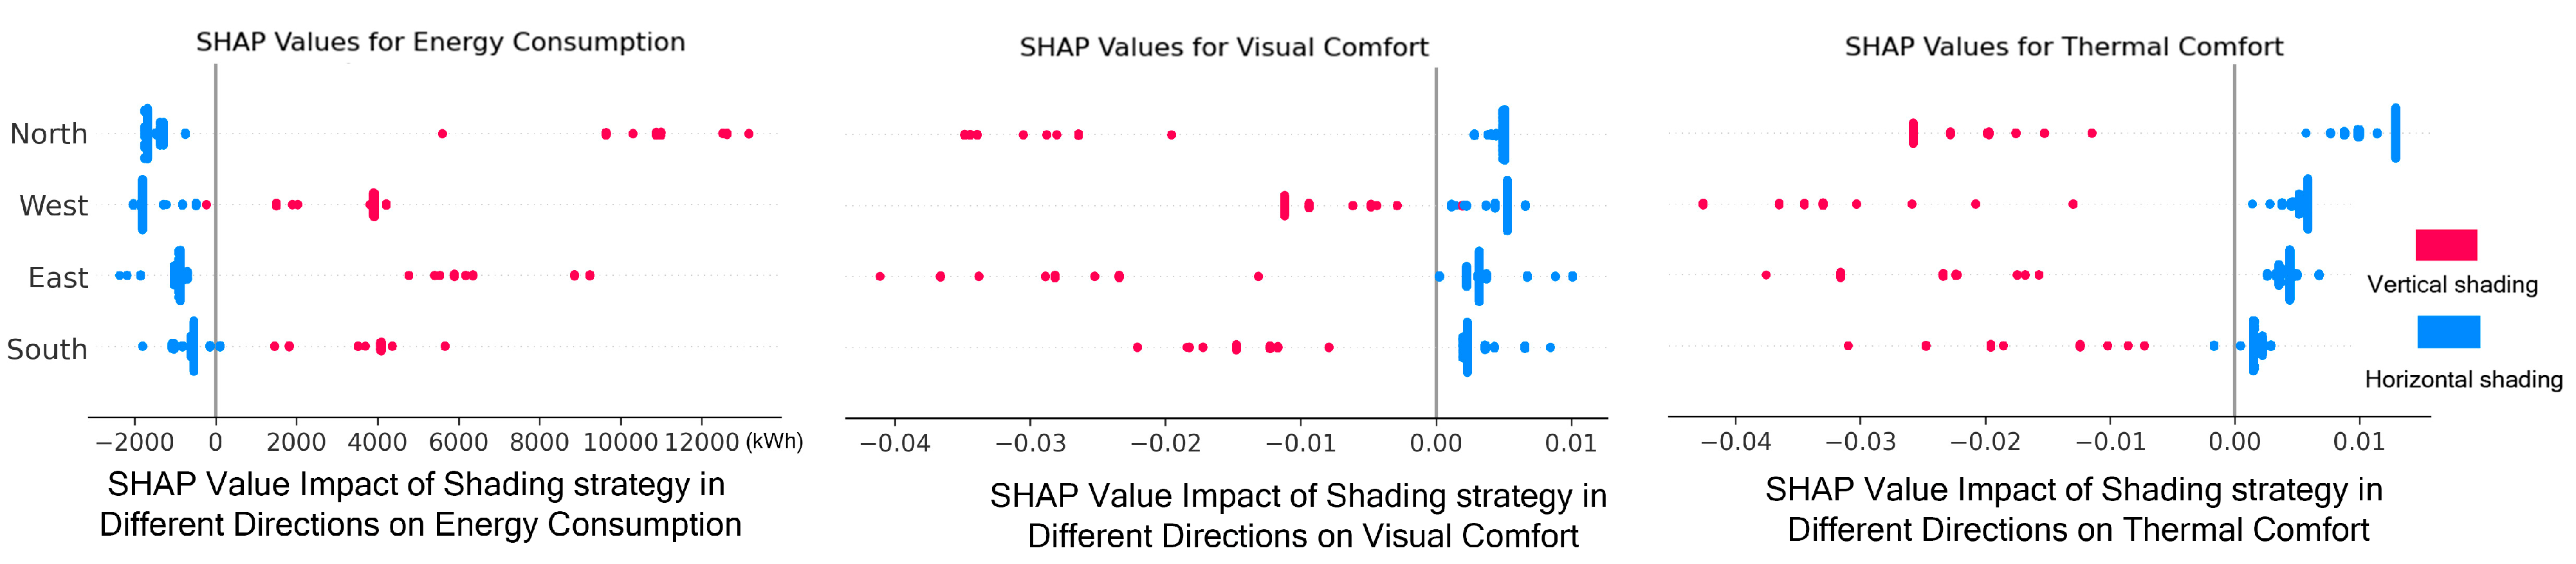
Through dual validation using SHAP analysis and parametric simulation data, this study clearly reveals the differentiated multi-objective performance responses—namely energy consumption, thermal comfort, and visual comfort—associated with shading strategies across different building orientations. These findings highlight the necessity of orientation-specific optimization in façade shading design.
3.5.1. The Best Shading Strategy for the East and West Façades
The east and west façades are exposed to low-angle direct sunlight during critical periods in summer: the east in the morning (7:00–9:00) and the west in the afternoon (15:00–18:00). These time windows are key contributors to rapid indoor temperature rise and overall heat gain. SHAP analysis shows that the east façade is the most sensitive to energy consumption, with SHAP values ranging from −2000 to +13,000 kWh (as shown in
Figure 13). Vertical shading samples are predominantly located in the positive SHAP region, indicating a significant increase in energy use, while horizontal shading consistently demonstrates strong energy-saving potential.
The west façade ranks second in sensitivity, with energy SHAP values ranging from −1500 to +6000 kWh. It is also significantly affected in terms of thermal and visual comfort, particularly the latter: SHAP values for visual comfort range from −0.045 to +0.012, indicating that shading strategy strongly influences the daylight quality in west-facing rooms (as shown in
Figure 14). To further validate the SHAP-based findings, four shading configurations—horizontal and vertical for both east and west orientations—were simulated and compared for performance (as shown in
Table 1).
The results show that the configuration with horizontal shading on both east and west façades delivers the best overall performance: the average annual energy consumption is 148,075 kWh, representing a 10% reduction compared to the full vertical shading scenario. Thermal comfort improves by 13%, and visual comfort increases by 9%. This configuration also demonstrates the highest performance ceiling, with thermal comfort reaching up to 56% and visual comfort up to 70%. In contrast, the fully vertical shading scenario performs the worst, with energy consumption peaking at 165,987 kWh and the lowest thermal and visual comfort values among all groups: 44.9% and 51.5%, respectively. The other two mixed configurations exhibit modest trade-offs between thermal and visual comfort, further confirming the distinct multi-objective performance impacts of shading strategy selection.
From a shading mechanism perspective, although vertical shading is effective at blocking low-angle sunlight in the early morning and late afternoon, it provides limited coverage for upper window areas during midday when solar angles are high. This leads to substantial heat gains around noon, increasing overall cooling loads. Additionally, vertical shading often obstructs external views and results in uneven interior lighting, negatively affecting visual comfort. In contrast, horizontal shading offers both energy efficiency and visual quality benefits: it blocks high-angle radiation while reflecting part of the sunlight upward, producing a soft and balanced daylighting environment. This makes it particularly suitable for office buildings. In conclusion, horizontal shading is recommended for east and west façades to achieve dual objectives of energy savings and comfort enhancement.
3.5.2. The Best Shading Strategy for the South-Facing Façade
The south-facing façade receives the most sunlight throughout the year. During summer, the solar altitude reaches 70–80°, making horizontal shading ideal for blocking high-angle direct sunlight, reducing solar heat gain, mitigating indoor temperature fluctuations, and lowering cooling loads. In winter, when the solar altitude drops to 30–40°, sunlight can pass beneath horizontal shading devices and enter the interior directly, providing passive solar heating that supports thermal comfort and effective natural lighting. SHAP analysis further confirms that the south orientation has relatively limited influence on energy consumption and comfort, with most sample points falling within a SHAP value range of ±2000 kWh, indicating marginal contributions.
As a result, the primary design strategy for the south façade should focus on controlling shading panel length to avoid excessive obstruction of natural light, which could otherwise increase lighting energy demand. The use of light-colored, high-reflectance materials is also recommended to enhance daylight uniformity and improve visual comfort.
3.5.3. The Best Shading Strategy for the North-Facing Façade
The north-facing façade receives no direct sunlight throughout the year and primarily relies on diffuse sky radiation. The core objective of shading design on the north façade is to maximize daylight access during the winter. SHAP analysis indicates that north-facing shading has a measurable impact on energy consumption, thermal comfort, and visual comfort, particularly thermal comfort, with SHAP values ranging from −0.04 to +0.01. This suggests that shading strategies on the north side are relatively sensitive to the regulation of indoor thermal conditions during colder months. Simulation results show that horizontal shading performs better than vertical shading in balancing thermal and daylighting conditions on the north façade. Therefore, it is recommended either not to use shading devices or to employ only shallow horizontal overhangs. Additionally, incorporating Low-E glazing can help reduce winter heat loss. If weather protection or façade uniformity is required, high-reflectance shading materials may be used to further enhance indoor lighting quality.
In conclusion, horizontal shading is recommended for east, west, and south-facing façades, while no shading device is required for the north-facing façade. For aesthetic reasons or rainwater protection, a shallow eave can be installed above the north-facing windows. The choice of shading type fundamentally determines the effectiveness of the optimization scheme. Effective shading devices can easily achieve the optimal combination of other variables. Otherwise, adjustments to angles or spacing alone cannot overcome this limitation. For example, when vertical shading is used for the east façade, the shading devices need to be unrealistically long, tightly spaced, and sharply tilted.
3.6. The Best Shading Device Depth for the Four Directions
The depth of the shading device should be determined based on the solar altitude angle. The ideal design is to maximize shading during the hottest part of summer and allow as much sunlight as possible to enter the lower portion of the wall and floor in winter for passive heating, thus balancing comfort and energy consumption throughout the year.
3.6.1. East and West Best Shading Device Depth
According to the above results, for the east-facing wall with horizontal shading, as the depth of the shading device increases, thermal comfort and visual comfort gradually improve. The highest values are reached when the shading device depth is 0.8 m, with visual comfort around 55% and thermal comfort around 52% (as shown in
Figure 15). When the depth exceeds 0.8 m, both values slightly decrease, as deeper shading devices block more sunlight and view. Energy consumption gradually decreases with increasing shading depth, reaching its minimum value of around 145,000 kWh at a shading device depth of 0.8 m. Therefore, the best shading device depth for the east-facing façade that satisfies visual comfort, energy consumption, and thermal comfort goals is 0.8 m.
SHAP analysis further supports the above findings. For the east façade, the SHAP values for shading panel length (ranging from 0.2 to 1.0 m) with respect to energy consumption fall between −5000 and +10,000 kWh. When the panel length is between 0.2 and 0.6 m, SHAP values remain relatively low, indicating strong energy-saving potential. However, beyond 0.8 m, SHAP values rise rapidly, suggesting that excessively long panels increase both lighting and cooling loads. In terms of visual comfort, SHAP values are positive (+0.02 to +0.04) when the panel length is less than 0.6 m, indicating adequate daylighting. When the panel length exceeds 0.8 m, SHAP values become negative (−0.02 to −0.04), reflecting over-shading. For thermal comfort, SHAP values are positive (+0.01 to +0.02) within the 0.6–0.8 m range, confirming that shading panels of this length effectively reduce overheating (as shown in
Figure 16). Accordingly, an east-facing shading depth of approximately 0.8 m is recommended to balance all three performance metrics.
On the west façade, the impact of shading depth on performance metrics exhibits a nonlinear pattern. Simulation results show that visual comfort peaks at a panel depth of 0.8 m, while thermal comfort exhibits local maxima at both 0.2 m and 0.8 m. Energy consumption follows a “rise–fall–rise” trend, with minimum values at 0.2 m and 0.8 m, suggesting a multi-peak optimal structure. SHAP values for energy consumption in the west orientation reflect a similar pattern: lengths below 0.6 m yield SHAP values of approximately −6000 kWh, indicating strong energy-saving potential, whereas lengths exceeding 0.9 m result in SHAP values up to +12,000 kWh, signaling a sharp increase in energy use. Visual comfort behaves similarly to that of the east façade: shorter panels (0.2–0.6 m) produce positive SHAP values, while panels longer than 0.8 m result in negative values. Thermal comfort shows positive SHAP values in the 0.6–0.8 m range, indicating that this interval effectively alleviates afternoon overheating. Thus, a shading panel depth of approximately 0.8 m is also recommended for the west façade to ensure both comfort and energy efficiency.
3.6.2. South Best Shading Device Depth
The south-facing façade receives the longest duration of sunlight throughout the year, with solar altitude angles ranging from 70–80° in summer to 30–40° in winter. Simulation results show that energy consumption gradually decreases with increased shading panel depth, reaching its minimum within the 0.6–1.0 m range. Visual comfort initially declines and then improves as panel depth increases, with the lowest value occurring at 0.6 m and the highest at 1.0 m. Thermal comfort shows a gradual upward trend, peaking at a depth of 0.8 m.
SHAP analysis corroborates these trends. In terms of energy consumption, short shading panels (0.2–0.4 m) on the south façade produce negative SHAP values (as low as −8000 kWh), indicating enhanced winter solar gains. However, when shading depth exceeds 0.8 m, SHAP values rise sharply, reaching up to +15,000 kWh, suggesting an increase in summer cooling loads due to over-shading. Visual comfort SHAP values peak in the 0.6–0.8 m range (+0.04) but decline significantly beyond 0.8 m. For thermal comfort, SHAP values increase from −0.03 to +0.02 as shading depth grows.
Taken together, these findings suggest that the optimal shading depth for the south façade lies between 0.8 m and 1.0 m, effectively balancing winter solar access, summer heat reduction, and overall indoor visual quality.
3.6.3. North Best Shading Device Depth
Since the north-facing façade receives negligible direct sunlight, there is no need for shading devices. However, for consistency in the building’s façade or to address rain protection concerns, a shallow eave may be added.
In terms of shading device depth, the best depth for east and west façades is 0.8 m, while for south-facing façades, it is between 0.8 m and 1.0 m. For the north façade, where direct solar radiation is negligible, horizontal shading is generally unnecessary.
3.7. Best Shading Device Orientation for the Four Directions
Based on the application of horizontal shading on all orientations, further optimization of shading panel tilt angles can enhance adaptability to seasonal solar conditions. According to the definition, shading panels tilted upward from the horizontal are assigned negative angles (e.g., −50°), while downward tilts are assigned positive angles (e.g., +50°). Simulation results and SHAP analysis jointly reveal that the variation in solar altitude across orientations provides a clear basis for determining optimal tilt angles, ensuring a dynamic balance between thermal comfort and energy efficiency throughout the year.
3.7.1. East and West Best Shading Device Orientation
The east façade receives low-angle direct sunlight in the early morning, while the west façade is exposed in the late afternoon, both contributing to significant glare and thermal load. Shading tilt angles must therefore align with solar trajectories to maximize solar reduction in summer while allowing solar gain in winter.
As the shading angle rotates from −50° to +50°, the thermal and visual comfort metrics follow a distinct “M-shaped” pattern—rising, falling, rising again, and then declining—while energy consumption exhibits an opposite “W-shaped” trend (as shown in
Figure 17). On the east façade, performance is poorest at −50°, where shading is ineffective. As the angle increases toward −10°, thermal and visual comfort reach peak values, and energy consumption drops to a local minimum. In the range from −10° to +50°, another local optimum appears at around +30°, where all three performance metrics are maximized. A similar pattern occurs on the west façade, with thermal and visual comfort peaking at a downward tilt of +30°, where energy demand also reaches its lowest point.
SHAP analysis further quantifies the marginal impact of shading angle adjustments. In terms of energy consumption, east-facing shading angles between +30° and +50° produce negative SHAP values (as low as −8000 kWh), indicating strong energy-saving potential. The west façade shows a similar trend, with optimal savings occurring at a +40° tilt (−6000 kWh). For visual comfort, SHAP values cluster in the +0.02 to +0.04 range under upward-tilted angles (+30° to +50°), suggesting enhanced daylight distribution and reduced glare. In contrast, negative tilt angles (−30° to −50°) yield negative SHAP values, highlighting over-shading issues (as shown in
Figure 18). Thermal comfort SHAP values also peak in the +30° to +50° range on the west façade (+0.02 to +0.03), confirming that moderate upward tilts effectively block low-angle sunlight and improve thermal conditions.
3.7.2. South-Facing Best Shading Device Orientation
The solar incidence angle on the south façade varies significantly across seasons: at the summer solstice, the sun strikes nearly vertically with a solar altitude of approximately 85°, whereas at the winter solstice, the angle drops to around 39°. When the shading panel is tilted upward to −50°, it loses most of its shading effectiveness at noon, resulting in indoor overheating and increased energy consumption. As the tilt angle increases from −50° to −10°, the horizontal shading panel begins to function effectively, blocking solar radiation. During this range, visual comfort improves and energy consumption decreases progressively. When the shading panel is tilted downward by 10°, all three performance metrics—energy consumption, thermal comfort, and visual comfort—reach optimal values. At solar altitudes exceeding 60°, the horizontal panel effectively blocks direct sunlight, while in winter, low-angle sunlight can enter beneath the panel, providing passive solar heating.
Further increasing the shading angle beyond +10° results in minimal energy savings but leads to a noticeable decline in both thermal and visual comfort. SHAP analysis supports this trend: at a shading angle of −50° (blue region), energy consumption SHAP values peak at +18,000 kWh, indicating excessive downward tilt increases heating demand by blocking beneficial winter solar gain. Conversely, at shading angles between +30° and +50°, SHAP values become negative (as low as −6000 kWh), revealing strong energy-saving potential. Regarding visual comfort, both extremely low and high angles result in decreased SHAP values, highlighting the need to balance shading and daylight access. For thermal comfort, SHAP values are lowest below −30°, while performance is optimal near +10°, indicating this range best mitigates overheating while preserving comfort.
3.7.3. North-Facing Best Shading Device Orientation
Since the north-facing façade receives no direct sunlight for most of the year, no shading is needed. To ensure sufficient natural light, a shading device with an upward tilt of 0° to 10° can be used to capture diffuse sunlight and reflect it into the interior, thereby improving visual comfort without affecting thermal comfort.
The recommended shading device orientation angles are as follows: for the east and west façades, rotate the shading devices downwards by 30° to effectively block morning or evening sunlight, reduce energy consumption, and improve thermal and visual comfort. For the south-facing façade, a horizontal shading device should be tilted downward by 10°. For the north-facing façade, no shading device is required. If a shading device is used for aesthetic purposes, it can be tilted upwards by 0° to 10° to capture and reflect sky sunlight into the interior, enhancing visual comfort.
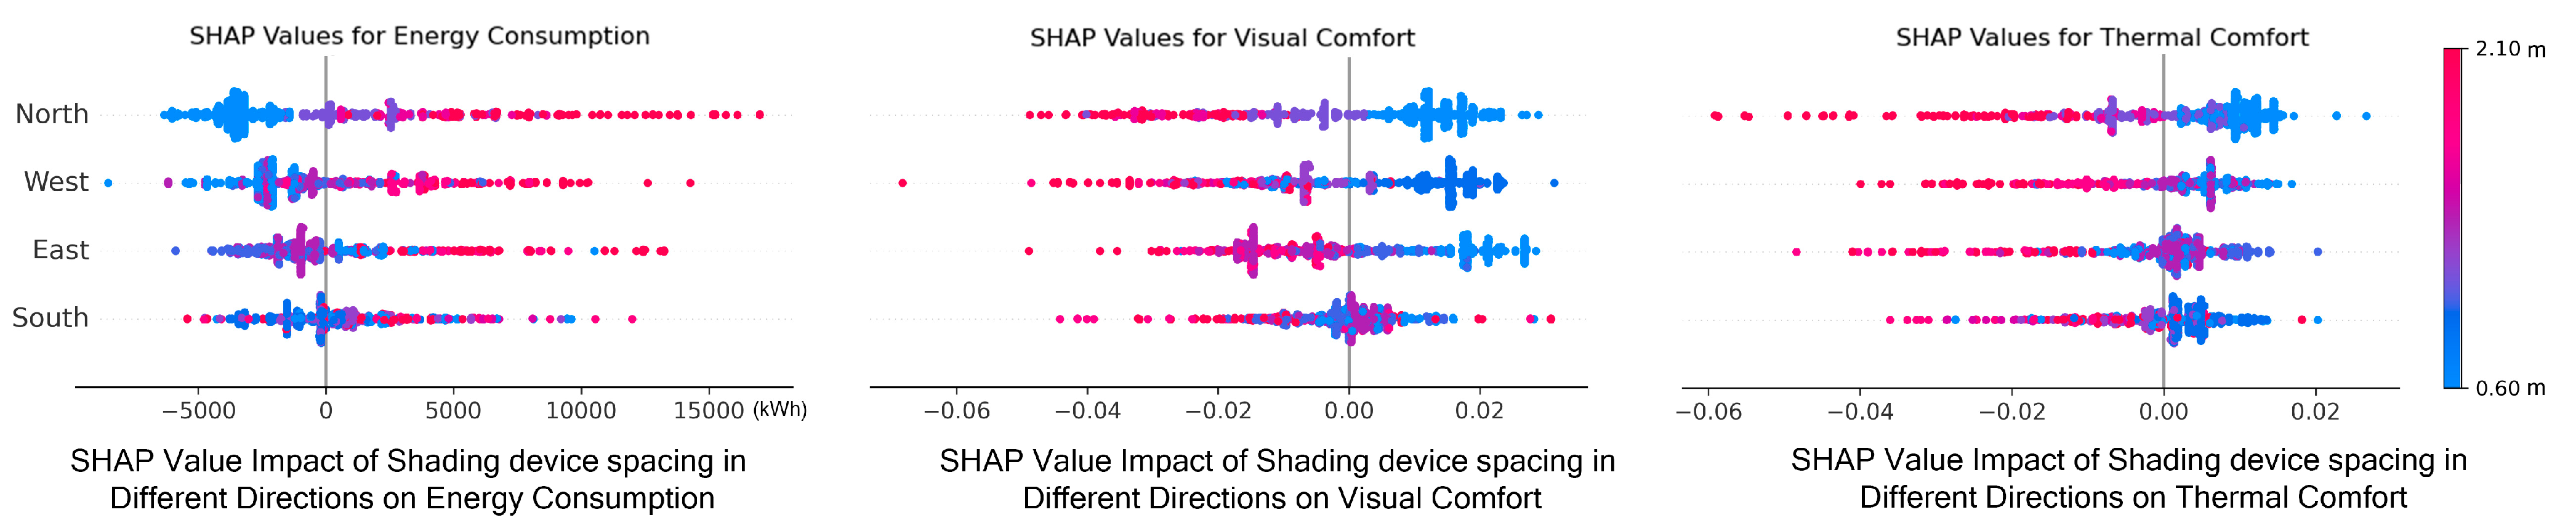
3.8. Best Shading Device Spacing for the Four Directions
The spacing between shading devices determines the amount of direct sunlight and radiative heat entering the interior, impacting whether sufficient sunlight is available on the working plane throughout the year.
3.8.1. East and West Best Shading Device Spacing
On east- and west-facing façades, shading panel spacing exhibits high sensitivity to all three performance metrics. SHAP analysis indicates that when spacing is below 1.2 m, the SHAP values for energy consumption remain low. However, as spacing exceeds 1.5 m, energy-related SHAP values rise sharply, reaching up to +12,000 kWh, suggesting that excessive spacing weakens the shading effect and increases cooling loads. For thermal comfort, optimal SHAP values are observed within the 0.6–1.2 m range, while values drop significantly beyond 1.8 m, indicating intensified overheating during summer. Visual comfort peaks at minimal spacing (around 0.6 m), where SHAP values approach +0.025. In contrast, when spacing exceeds 1.5 m, SHAP values turn negative (below −0.03), highlighting issues such as glare and uneven daylight distribution.
Simulation results confirm these findings: for east-facing façades, optimal spacing lies between 0.6 and 1.2 m; for west-facing façades, the optimal range is 0.9–1.2 m (as shown in
Figure 19).
3.8.2. South-Facing Best Shading Device Spacing
Due to prolonged solar exposure throughout the year, the impact of shading panel spacing on energy consumption and comfort in the south-facing façade tends to follow a synchronized trend. According to SHAP analysis, smaller spacing values (0.6–1.0 m) yield high positive SHAP values for energy consumption (+8000 to +12,000 kWh), indicating that overly dense shading limits winter solar gain and increases heating demand (as shown in
Figure 20). As spacing increases toward 2.1 m, SHAP values drop to around −3000 kWh, reflecting improved energy performance. For visual comfort, spacing in the 1.5–1.8 m range results in positive SHAP values (~+0.02), suggesting enhanced daylight distribution. However, thermal comfort begins to decline in this range. Simulation results demonstrate that at 0.6 m spacing, thermal and visual comfort reach peak levels, and energy consumption is minimized, making it the optimal configuration for south-facing façades.
3.8.3. North-Facing Best Shading Device Spacing
The north-facing façade is rarely exposed to direct sunlight, so maximizing the use of diffuse sunlight is more important than shading. Therefore, no shading device is needed. For aesthetic consistency, if shading devices are installed, very wide spacings can be used purely for decorative purposes to avoid darkening the interior.
In summary, the spacing of shading panels should be parametrically optimized based on orientation-specific characteristics: a spacing of 0.9–1.2 m is recommended for east and west façades, 0.6 m for the south façade, and an open configuration with spacing ≥1.8 m for the north façade. This study, through the combined use of the SHAP interpretation method and simulation-based experiments, provides a quantitative and data-driven foundation for multi-objective optimization of shading panel spacing across different building orientations.
4. Discussion
Simulation results indicate that compared to the experimental reference group, the optimized group adjusts the exposure by changing the standard floor aspect ratio and building orientation angle while significantly reducing the window-to-wall ratio in all directions, especially for the south-facing façade. Unlike the traditional vertical shading used in office buildings, horizontal shading is applied to all four façades. Adjustments to shading devices mainly focus on the orientation angles for the south and west façades, increasing shading device depth and reducing shading device spacing (as shown in
Table 2). The optimal solutions obtained consist of four groups (as shown in
Figure 21). For instance, in Optimization Group 1, total energy consumption decreases by approximately 25.73%, thermal comfort improves by 56.26%, and visual comfort decreases by 19.31% (as shown in
Table 3). Despite the decrease in visual comfort, significant improvements in thermal comfort and notable reduction in energy consumption lead to enhanced building performance.
For visual comfort, the most influential factors are the shading device depth on the west-facing façade and the spacing of the shading devices on the east–south façades. For energy consumption, the window-to-wall ratio on the west and south façades and the shading strategy on the east and west façades are critical. When vertical shading is used on the east façade, energy consumption increases by 5800 kWh annually, while on the west façade, energy consumption increases by 4800 kWh. Each increase of 0.2 m in shading depth on the east-facing façade reduces energy consumption by 1033.4 kWh, and reducing the spacing between shading devices on the south façade by 0.2 m saves nearly 1200 kWh. These findings highlight that the shading measures on the east and west façades and the shading device spacing on the south façade are key factors affecting total energy consumption. Regarding thermal comfort, vertical shading on the east and west façades reduces thermal comfort by 2% and 1.5%, respectively. Increasing the shading depth on the east-facing façade significantly improves indoor thermal comfort, with each 0.2 m increase in depth improving thermal comfort by 0.4%. Similarly, reducing the shading device spacing on the south façade also significantly improves overall thermal comfort, with each 0.2 m reduction in spacing increasing thermal comfort by 1.27%.
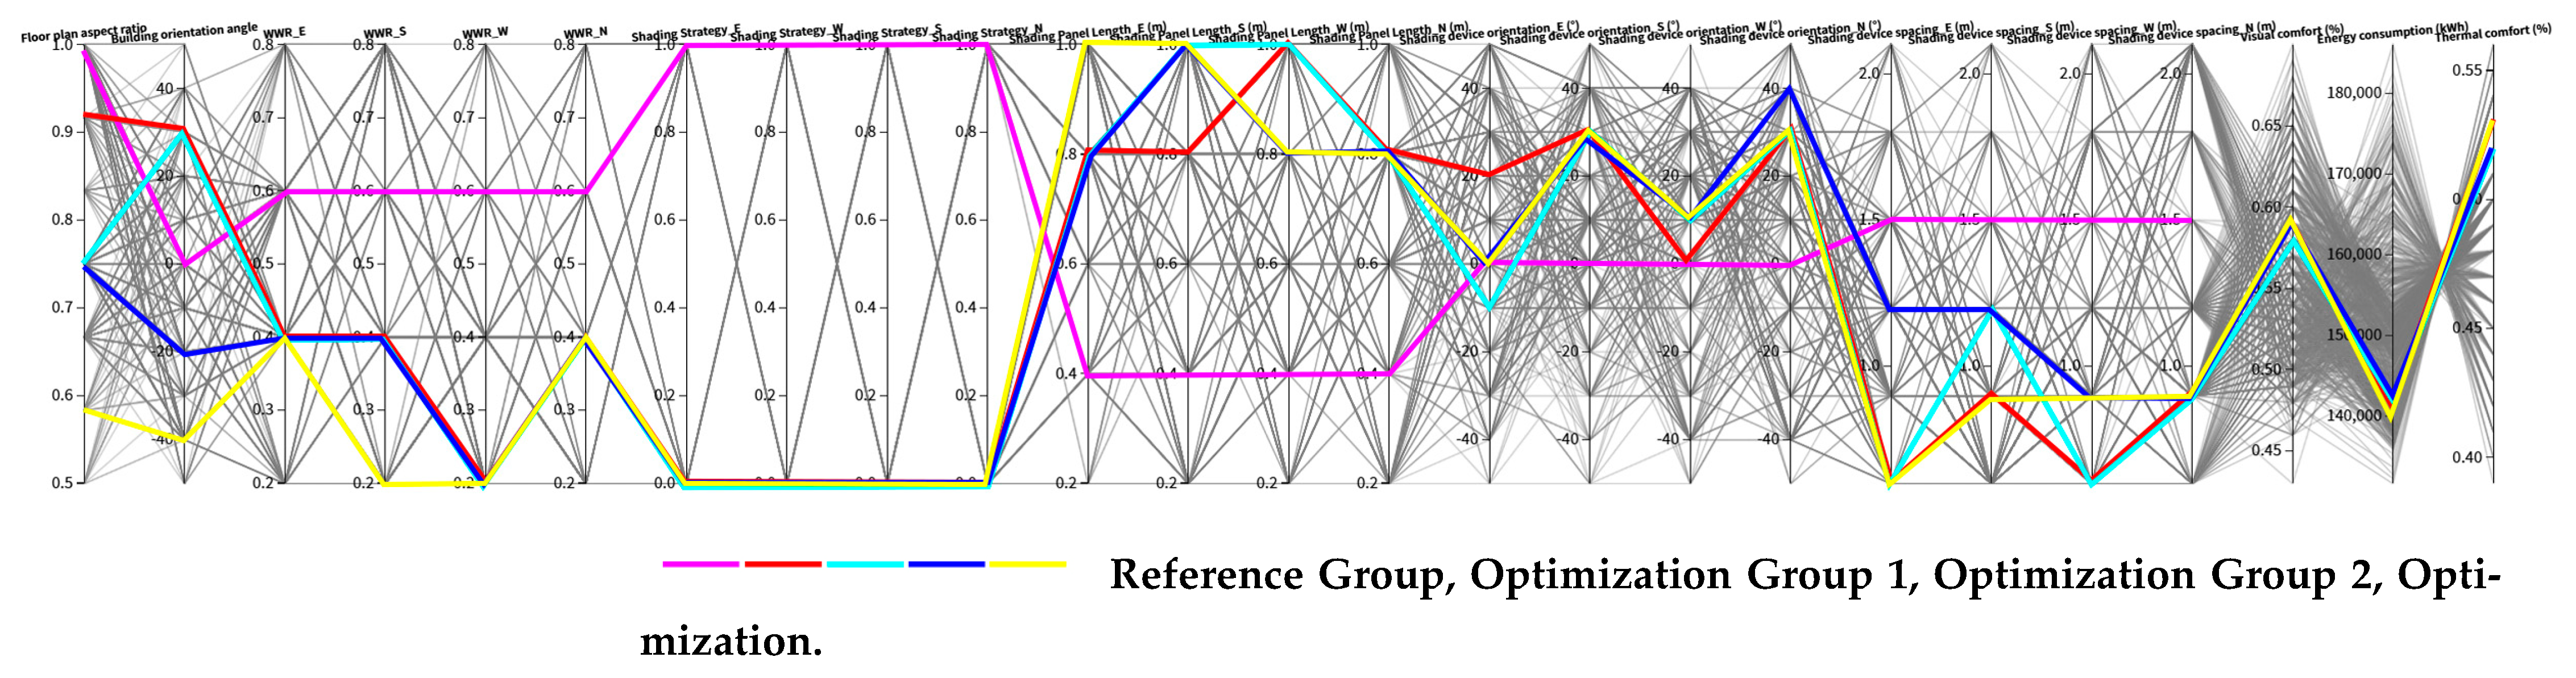
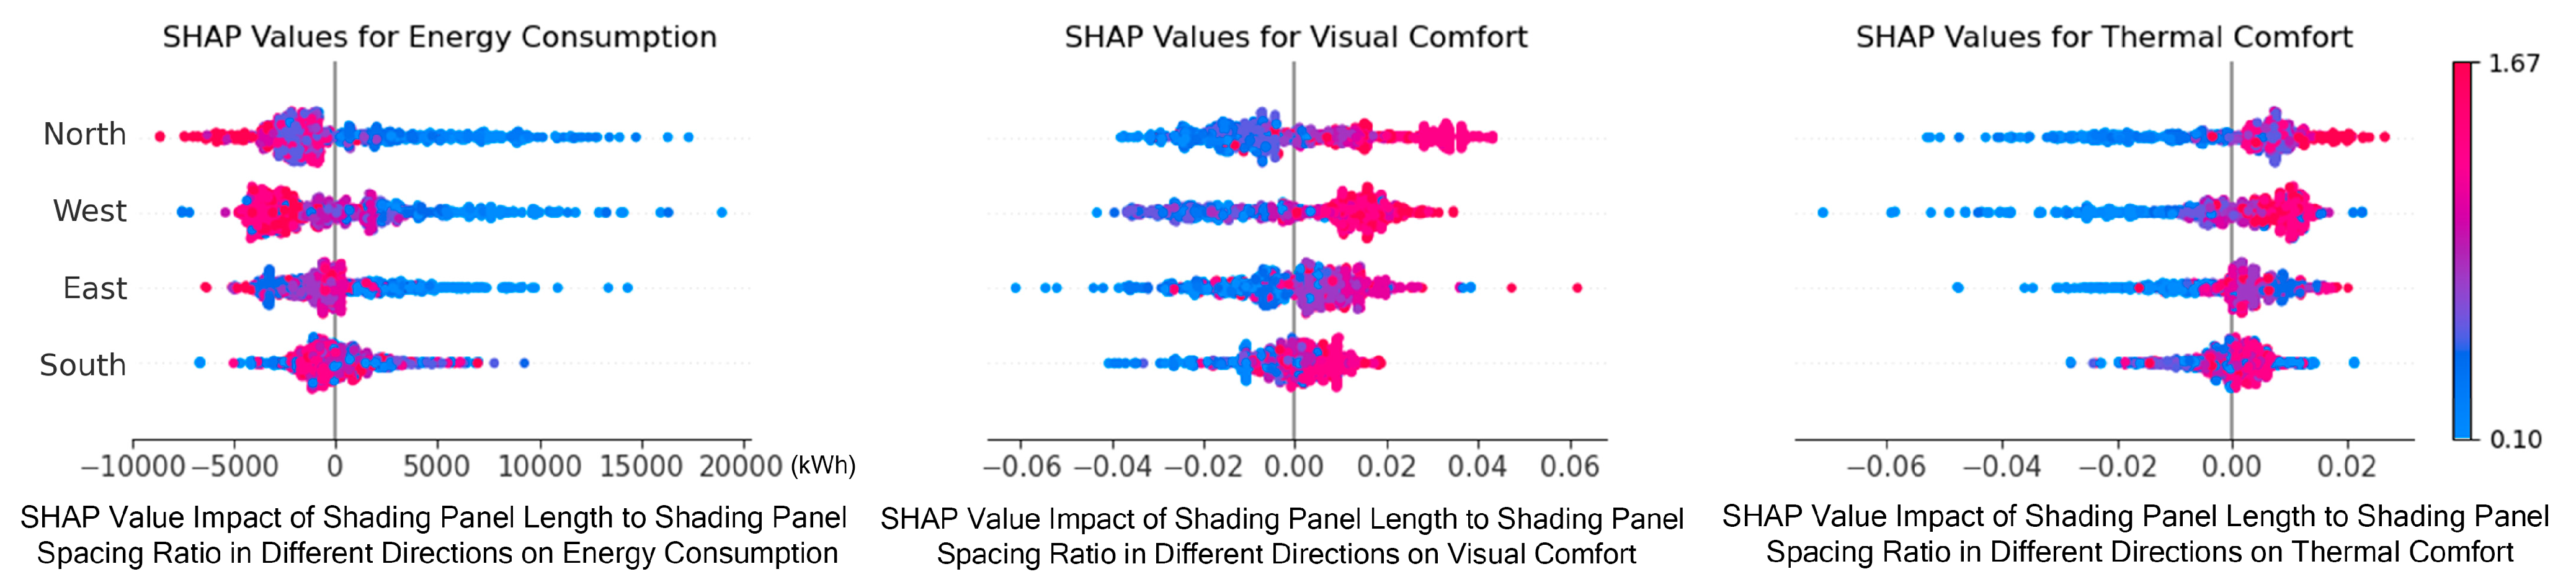
In multi-objective building performance optimization, selecting an appropriate shading strategy allows other design variables to fall within more reasonable and moderate ranges, thereby facilitating the achievement of overall optimal performance (as shown in
Figure 22). Otherwise, the remaining parameters may need to adopt extreme values—such as excessively long shading panels with large rotation angles—to compensate. The ratio of shading panel length to spacing demonstrates a significant and orientation-sensitive nonlinear impact on building performance across different façade directions. SHAP analysis reveals that when this ratio is around 0.6, it generally produces a synergistic optimization effect on annual energy consumption, visual comfort, and thermal comfort. Within this range, SHAP values for energy consumption on the south-, east-, and west-facing façades are significantly negative (as low as −6000 kWh), visual comfort is improved (SHAP values up to +0.05), and thermal comfort remains stable or slightly enhanced.
However, when the ratio exceeds 1.2, overly dense shading obstructs wintertime solar gains and daylight access, leading to a rapid increase in energy use (with SHAP values exceeding +15,000 kWh), a sharp decline in visual comfort (as low as −0.06), and a notable deterioration in thermal comfort (falling to approximately −0.04). Conversely, excessively low ratios (<0.2) may enhance daylight and thermal experience in some orientations but fail to provide adequate shading against intense solar radiation. Overall, a shading ratio around 0.6 offers the best trade-off among energy efficiency, daylight quality, and thermal comfort, making it an optimal parametric control range for façade design across orientations.
Moreover, there exists an inverse relationship between the optimal shading panel rotation angle and its length or spacing. When panels are shorter or spaced farther apart, a larger tilt angle is required to provide sufficient shading. In contrast, longer or more closely spaced panels can achieve effective shading with a smaller tilt angle. Designers can take advantage of this trade-off depending on aesthetic preferences or structural constraints. Importantly, it is generally unnecessary to combine large tilt angles with long, densely spaced shading panels, as this would result in excessive shading and diminished visual comfort. Pareto analysis further confirms that once any one variable (length, spacing, or angle) reaches a sufficient threshold, further increases in the others lead to diminishing returns.
5. Conclusions
This study, based on parametric and multi-objective optimization methods, explores energy consumption, visual comfort, and thermal comfort to generate an optimal solution set, avoiding the one-sided results caused by single-objective optimization and achieving comprehensive improvement of building performance. By optimizing shading device spacing, orientation angle, depth, and window-to-wall ratios for different façades (north, east, south, and west), and adjusting the floor plan aspect ratio and building orientation angle, this study forms a scientific multi-objective optimization technology system.
Best Parameters for Floor Plan Aspect Ratio: When the ratio of north–south length to east–west length is between 0.5 and 0.67, visual comfort and thermal comfort gradually increase while energy consumption decreases. From 0.67 to 1, this range is globally optimal, and visual comfort reaches its peak when the ratio is between 0.75 and 1.00.
Best Parameters for Building Orientation Angle: If energy consumption is prioritized, the optimal building orientation angle is between 0° and −20° clockwise. For visual comfort, the optimal range is 0° to −10° clockwise and 20° counterclockwise. For thermal comfort, the optimal range is 0° to −20° clockwise. When considering all three objectives, the best value range is from 0° to −20° clockwise.
For all four directions, when visual comfort, thermal comfort, and energy consumption are all considered, the best window-to-wall ratios are 0.4 for east, between 0.2 and 0.4 for west, between 0.2 and 0.4 for south, and between 0.4 and 0.6 for north.
The best shading device type, after considering energy and comfort indicators, is horizontal shading. Vertical shading does not provide the highest performance when solely focusing on shading efficiency.
In terms of shading device depth, the best depth for east and west façades is 0.8 m, while for south-facing façades, it is between 0.8 m and 1.0 m.
Best Shading Device Orientation Angle: For east–west façades, tilt the shading devices downward by 30° to effectively block morning or evening sunlight, reduce energy consumption, and improve thermal and visual comfort. For south-facing façades, tilt the horizontal shading devices downward by 10°.
Shading device spacing for east and west façades should be between 0.9 m and 1.2 m, while for south-facing façades, 0.6 m provides the optimal balance.
In conclusion, combining genetic algorithm-based optimization and multi-objective quantitative evaluation can generate optimal solution sets suitable for different regions, offering high adaptability. In cold regions, focus on optimizing building orientation angle, south-facing window-to-wall ratio, and shading strategies to improve winter daylighting and thermal comfort. In regions with a hot summer and cold winter climate, the focus should be on optimizing window-to-wall ratios, shading strategies, and shading device depth to significantly reduce thermal load and improve comfort. In regions with a hot summer and cold winter climate, attention should be given to adjusting south-facing window-to-wall ratios, shading strategies, and shading device depth to balance energy consumption and comfort. This method provides scientific decision-making support and demonstrates broad applicability for the future design of office buildings, residential buildings, and other architectural typologies.
This study is limited to an idealized simulation of a single building and does not consider the impact of indoor occupant behavior and equipment control on the results. Future research should address this aspect. Additionally, incorporating economic costs as a goal will increase the generalizability and practicality of the findings. Future work will integrate design-phase optimization with operational-phase control, incorporating passive and active strategies in the model to ensure that the building possesses good intelligent control potential, such as integrating shading design with intelligent shading control, making the optimization results more comprehensive.


