Risk Assessment of Prefabricated Construction in Iraq Using Fuzzy Synthetic Evaluation


Abstract
1. Introduction
1.1. Literature Review
1.2. Research Gaps
1.3. Study Objectives
- Conduct a comprehensive identification and classification of risks associated with prefabricated construction in developing countries, with a focus on Iraq as a case study.
- Assess and classify the significance of these risks using an integrated and objective systematic approach based on fuzzy logic.
- Develop a risk assessment framework adapted to the unique characteristics and challenges of modular construction in resource-constrained environments.
- Support decision-makers and practitioners in designing appropriate risk mitigation and control strategies tailored to the prefabricated construction sector.
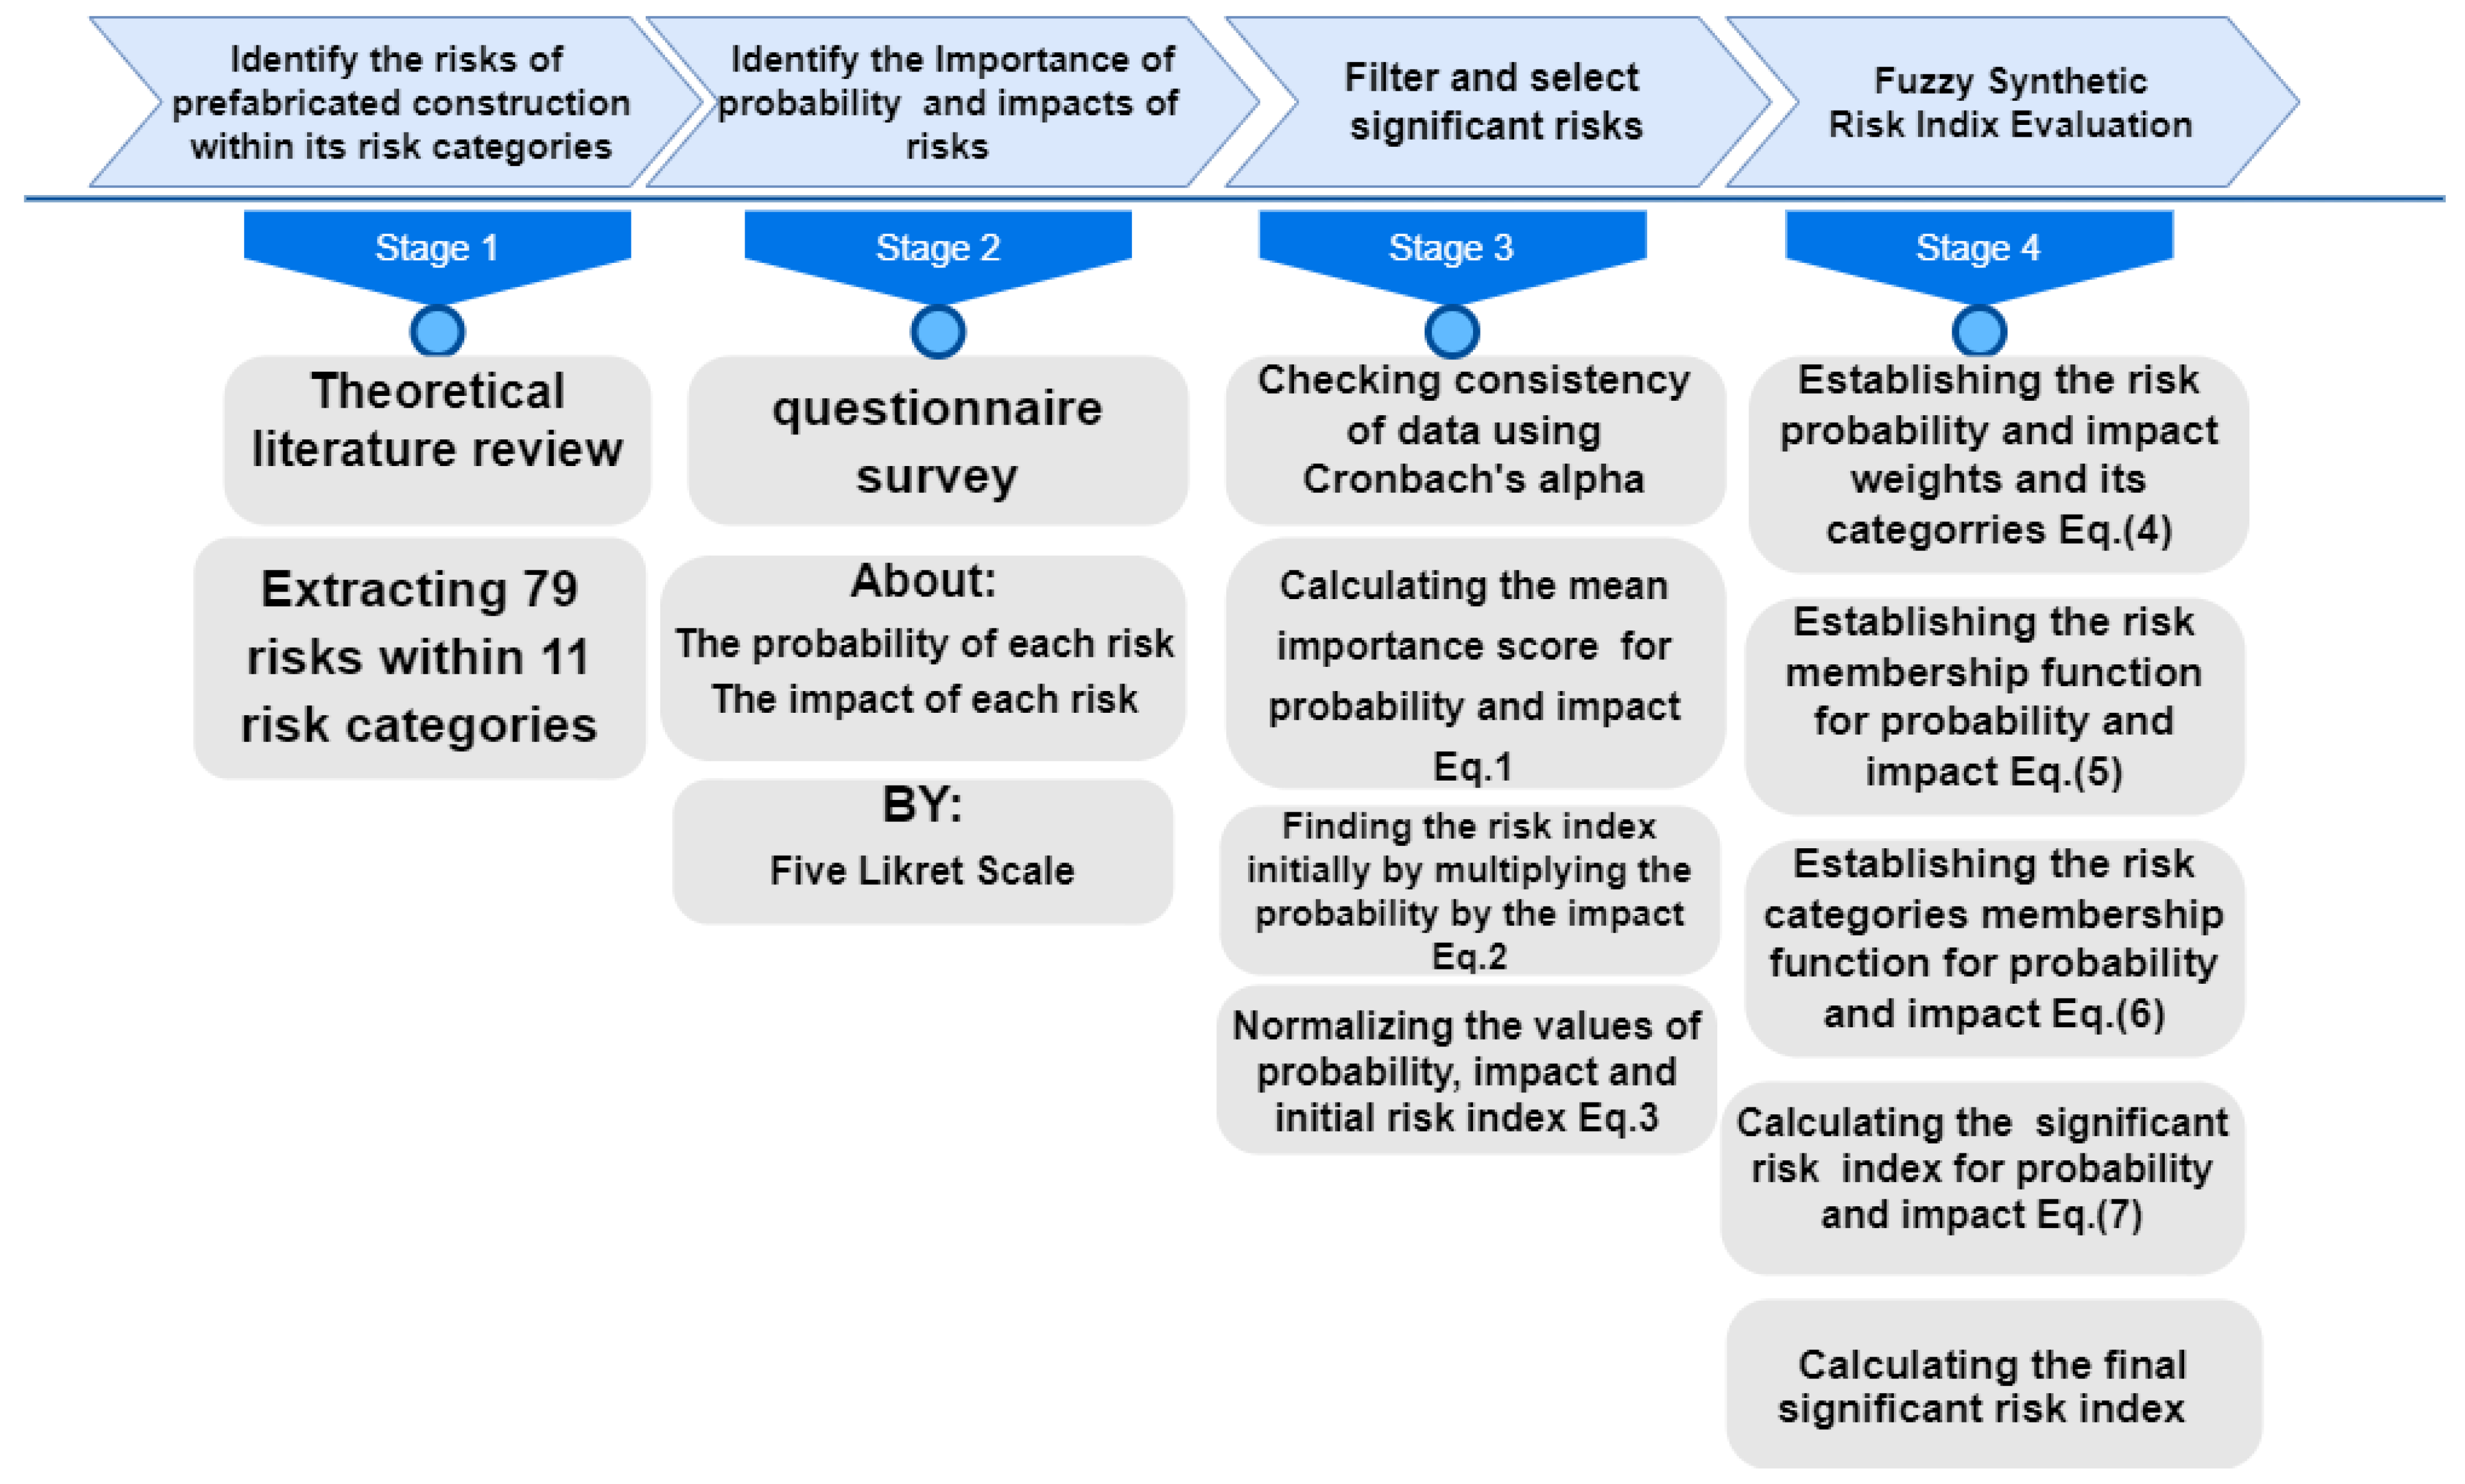
2. Materials and Methods
2.1. Comprehensive Review of Theoretical Literature
2.2. Exploratory Survey
Questionnaire Development
- Personal information of respondents: Table 1 shows the personal information of respondents. The questionnaire was distributed in most Iraqi governorates and across various engineering disciplines related to prefabricated building. Due to time constraints, 36 responses were accepted. The sample represents the northern, central, and south regions of Iraq, so the sample can be considered representative of all regions of Iraq based on the similar limited use of prefabricated buildings due to risks.
- Place of work: Most of the respondents (41.9%) are from the Salah al-Din Governorate, followed by 35.5% from the Nineveh Governorate, 9.7% from Kirkuk, and 3.2% from Dohuk. This means that most of the respondents are from the governorates of northern Iraq, where 6.5% are from Baghdad (central Iraq) and 3.2% are from Diwani (south).
- Academic qualification: In total, 54.8% of respondents hold a bachelor’s degree, 22.6% hold a master’s degree, 19.4% hold a doctorate, and the lowest percentage holds a higher diploma (3.2%).
- The roles of respondents in the prefabricated construction process: Supervising engineers, 29%, and site engineers, 25.8%, represent the highest percentages of respondents, followed by 12.9% for design engineers, 9.7% for both academics and contractors, respectively, and 6.5%, the lowest percentage, for both project managers and consultants.
- Specialization: Most of the respondents, 83.9%, are civil, followed by 9.7% architectural, and 6.5% mechanical.
- Years of experience: Most of the respondents, 41.9%, have 11 or more years of experience, 38.7% have 6–10 years, and 19.4% of the respondents have 1–5, the fewest years of experience.
- Work sector: Most of the respondents, 80.6%, work in the government sector in infrastructure projects and service and on educational buildings, and 19.4% work in private sector projects.
- 2.
- Evaluation of the probability score and impact score of each risk: The questionnaire included an assessment of all prefabricated building risk categories extracted from the theoretical review and grouped them into 11 risk categories.
2.3. Questionnaire Analysis
- Assess the internal consistency of the data by obtaining Cronbach’s alpha coefficient using SPSS version 26.
2.4. Calculate the Risk Assessment Index Initially
2.5. Perform Normalization
2.6. Perform the Fuzzy Synthetic Evaluation
- 2.
- 3.
- Establishing the membership function for the risk categories: the membership function for the categories is established using Equation (6):
- 4.
- Creating the importance index for risk categories:
2.7. Find the Final Risk Index
3. Results and Discussion
3.1. The Results of the Theoretical Review
3.2. Results of Data Consistency
3.3. Results of Mean Importance Scores for Probability, Impact, and Risk Index
- Capital investment risks: The mean probability score of all investment risks is medium except for the risk of economic conditions, which has a high mean probability score. The mean impact score of all risks is medium, and the mean risk index score of all investment risks is low except for the risk of economic conditions, which is medium.
- Political risks: The mean probability score for political risks is generally medium except for P4 (poor government support and regulations), which has a high score. Similarly, the mean impact score is medium overall, except for P4 (poor government support and regulations) and P5 (unsupportive planning and building regulations), which have high impact scores. Therefore, the mean risk index is medium, except for P1 (changing government policies), P2 (changing political support due to change in the political environment), and P3 (labor strike), which have low risk index scores.
- Material and equipment risk: The mean probability score and mean impact score of material and equipment risk are generally medium. However, specific risks such as M6 (crane failure), M9 (technological inefficiency), and M11 (improper use of equipment) show deviations from this trend. Consequently, the mean risk index is low for most of these risks, except for M6, M7 (part obsolescence as a result of long-term operation of equipment), M8 (materials/components, defective structure and crane, and defective equipment), M9, and M10 (improper use of equipment), which have medium risk index scores.
- Safety Risk: The mean probability score for safety risks is generally medium, except for S8 (no occupational training and safety for workers), S13 (no regular security checks and fixes), and S14 (safety measures not applied), which have high mean probability scores. The mean impact score for safety risks is also medium overall, except for S4 (no hazard indicator for the equipment), S6 (no security check at the time of admission), S11 (not wearing personal protective equipment), S12 (defective personal protective equipment), S13, and S14, which are rated with high impact scores. Consequently, the mean risk index for most safety risks is medium, except for S1 (poor fall prevention), S3 (safety device for crane when not in operation), S5 (overloading lifting), and S7 (low security awareness), which have low risk index scores.
- Risks of spatial mismanagement: The mean probability score and mean impact score of spatial mismanagement risks are generally medium, except for the high mean impact of T5 (crowded work areas). Therefore, the mean risk index is low, except for T5.
- Workplace and environment risks: The mean probability score and mean impact score of workplace and environment risks are medium. Therefore, the mean risk index is low except for E2 (lighting and bad ventilation), which has a medium index score.
- Design Risks: The mean probability score and mean impact score of design risks are generally medium, except for D3 (the inability to make changes in the design), which has a high mean probability score. Therefore, the mean risk index is medium, except for D1 (lack of appropriate codes and design standards for prefabricated construction), D2 (complicated design of prefabricated buildings), which have low risk index scores.
- Supply chain risks: The mean probability score and mean impact score of supply chain risks are medium, so the mean risk index is low, except for U2 (complex supply chain), U4 (delays in delivering modular components to the site), and U5 (supply chain information gap and inconsistency), which have low risk index scores.
- Administrative risks: The mean probability score of administrative risks is medium except for R7 (deficiency of professional managers on site), which has a high mean probability score. The mean impact score of administrative risks is also medium, except for R2 (poor cooperation and communication between project participants), R3 (stakeholder fragmentation and management complexity), R4 (lack of best management practices), and R7, which have high impact scores. Therefore, the mean risk index for all administrative risks is medium.
- Poor scheduling risks: The mean probability score and mean impact score of poor scheduling risks are medium, so the initial mean risk index is low.
- Experience risk: The mean probability score for experience risk is medium, except for K2 (contractors’ lack of experience in prefabricated construction), which has a high mean probability score. The mean impact score for experience risk is high, except for K1 (insufficient skills and experience in prefabricated construction), which has a medium impact score. Therefore, the mean risk index for experience risk is medium.
- Summary of mean scores for probability, impact, and risk index:
3.4. Result of Risk Filtering
3.5. Results of Fuzzy Synthetic Evaluation
3.5.1. Membership Function Calculation
3.5.2. Membership Function (Evaluation Matrix) for Risks Categories
3.5.3. Importance Index for Risk Categories
- Importance index of the probability score and impact score Iimp.:
- 2.
- Risk Importance Index: Table 11 shows the risk importance index according to the categories, based on the multiplication of the importance probability score index and the importance impact score index. The importance probability score index and importance impact score are medium for all risks, and the importance index is medium for all risks except for material and equipment risks, administrative risks, and workplace and environment risks. It is clear that the highest risk probability score index is for political risks, followed by safety risks and experience risks, respectively. The highest impact score index is for experience risks, followed by political risks and capital investment risks. Therefore, the highest risk index is for experience risks, followed by political risks and capital risks. Material and equipment risks, administrative risks, and workplace and environment risks share the lowest ranking for each of the probability, impact, and risk index scores, respectively.
4. Discussion
4.1. Interpreting the Findings in the Iraqi Context
4.2. Practical Recommendations for Managing the Most Serious Risks
- Enhancing expertise and training: Establish specialized training initiatives targeting contractors, engineers, and construction workers to enhance competencies in prefabrication, collaborate with academic institutions and technical colleges to integrate prefabrication methodologies into engineering curricula, and promote knowledge-sharing platforms to facilitate the dissemination of best practices among industry professionals.
- Strengthening the governmental role: Develop a comprehensive and supportive policy framework that includes updated building codes, simplified approval processes, and dedicated public investment mechanisms to encourage prefabrication adoption.
- Financial facilitation: Establish public–private partnerships offering low-interest loans and tax incentives to reduce the financial burden of adopting prefabricated technologies.
- Safety regulation enforcement: Enforce stringent occupational safety protocols, conduct routine inspections, and provide incentives to firms that demonstrate high compliance with PPE usage and safety training.
- Improving supply chain management: Encourage local manufacturing of prefabricated components to reduce reliance on imported materials, integrate digital supply chain tracking systems to improve logistics and mitigate delivery disruptions, and establish strategic partnerships with logistics service providers to enhance transportation efficiency and reduce supply chain vulnerabilities.
- Promoting knowledge transfer: Create a centralized digital platform to disseminate best practices, case studies, and innovative applications of prefabricated construction from both local and international contexts.
4.3. Comparison with Previous Research in Similar Contexts
5. Conclusions
- The main risks to prefabricated construction in Iraq: The research identified a list of major risks hindering prefabricated construction in Iraq, most notably the lack of experienced contractors, weak government support systems, and financial risks associated with initial investment. This demonstrates the failure of developing countries to adopt advanced construction technologies.
- The importance of increasing expertise and training human resources: The skills and experience gap in prefabricated construction is the most significant factor hindering the use of this technology in Iraq.
- Strengthening government support and regulatory frameworks: The Iraqi government plays a crucial role in supporting the adoption of prefabricated construction by establishing clear and supportive regulatory policies. Incentives such as tax exemptions and low-interest loans can encourage investment in this sector. In addition, maintaining a stable political environment will further promote the sustainability and growth of this construction method.
- Enhancing occupational health and safety standards: Occupational safety regulations at prefabricated construction sites should be strengthened, particularly with regard to the mandatory use of protective equipment and strict adherence to preventive safety protocols. Improving safety practices will enhance both worker and investor confidence, while also minimizing accidents during the implementation phase.
- Improving financial risk management: To avoid concerns about initial investment expenditures, the government could prioritize the formulation of flexible and supportive financing arrangements for projects involving prefabricated construction, in the form of subsidized loan programs or grants that help companies overcome financial obstacles in the early implementation phase.
- Supply chain innovation: Although risks in materials and equipment are of minor importance in this research, it is also necessary to strengthen the supply chain for prefabricated components by promoting local production and digital tools to monitor materials and streamline delivery processes.
- Investing in modernizing production plants: Companies should invest in upgrading production plants and adopting automation and robotics technologies to enhance manufacturing accuracy and the quality of prefabricated components. Building Information Modeling (BIM) technology should also be used to enhance stakeholder coordination and project risk management. Based on these findings, it is essential to emphasize the need for Iraq to implement comprehensive approaches to facilitate and encourage prefabricated construction in infrastructure projects. Coordination between the private and public sectors, as well as the design of encouraging policies, will ensure this required technological change.
5.1. Limitations of the Study
- Limited data: Data were collected from a specific group of participants in the Iraqi construction sector, which may affect the generalizability of the results to all sectors or other regions in the country.
- Changing economic and political environment: Since the study relied on current data, the results may be subject to change over time due to political and economic shifts that may affect the sector. Future developments may lead to changes in risk assessment.
5.2. Suggestion for Future Research
- Studying economic and environmental impacts: Studying the impact of prefabricated construction technologies on energy consumption and carbon emissions could provide important insights that support the shift towards greater sustainability in the construction sector.
- Evaluating the impact of government policies: Studies should be conducted on the impact of various government policies on the adoption of prefabricated construction in Iraq. Examining the experiences of other countries can provide valuable lessons for adapting local policies to the Iraqi context.
- Analysis of consumer behavior and end-user preferences: Studying consumer and end-user attitudes toward prefabricated construction projects in Iraq and understanding how these preferences affect the success of these projects can help improve marketing and design strategies.
- Using information technology to improve supply chains: Research on how modern technologies such as artificial intelligence and the Internet of Things (IoT) can be used to improve supply chain operations in prefabricated construction projects can be developed. This technology can contribute to reducing costs and improving efficiency.
- Evaluating the effectiveness of vocational training programs in capacity building: In-depth study should be conducted on the effectiveness of vocational training programs for prefabricated construction in Iraq to determine whether these programs actually contribute to improving skills and reduce the risks associated with a lack of experience.
Author Contributions
Funding
Data Availability Statement
Conflicts of Interest
Abbreviations
| BIM | Building Information Modeling |
| FSE | Fuzzy synthetic evaluation |
References
- Jaber, A.Z. Assessment risk in construction projects in Iraq using COPRAS-SWARA combined method. J. Southwest. Jiaotong Univ. 2019, 54, 1–12. [Google Scholar] [CrossRef]
- Anaç, M.; Gumusburun Ayalp, G.; Erdayandi, K. Prefabricated Construction Risks: A Holistic Exploration through Advanced Bibliometric Tool and Content Analysis. Sustainability 2023, 15, 11916. [Google Scholar] [CrossRef]
- Song, Y.; Wang, J.; Liu, D.; Guo, F. Study of occupational safety risks in prefabricated building hoisting construction based on HFACS-PH and SEM. Int. J. Environ. Res. Public Health 2022, 19, 1550. [Google Scholar] [CrossRef] [PubMed]
- Liu, Y.; Cui, J. Identification of hazard sources in prefabricated building construction by entropy weight method. In Proceedings of the IOP Conference Series: Earth and Environmental Science, Lanzhou, China, 3–5 July 2020; IOP Publishing: Bristol, UK, 2020; Volume 560, p. 012073. [Google Scholar] [CrossRef]
- Wallbaum, H.; Ostermeyer, Y.; Salzer, C.; Escamilla, E.Z. Indicator-based sustainability assessment tool for affordable housing construction technologies. Ecol. Indic. 2012, 18, 353–364. [Google Scholar] [CrossRef]
- Li, X.J. Research on investment risk influence factors of prefabricated building projects. J. Civ. Eng. Manag. 2020, 26, 599–613. [Google Scholar] [CrossRef]
- Chang, Y.F.; Ishii, H. Fuzzy multiple criteria decision-making approach to assessing the project quality management in the project. Procedia Comput. Sci. 2013, 22, 928–936. [Google Scholar] [CrossRef]
- Zhao, W.H. Discussion on the construction safety risk management of prefabricated residential buildings. Constr. Saf. 2017, 5, 13–15. [Google Scholar]
- Du, J.; Jing, H.Q.; Daniel, C.L.; Sugumaran, V. Multi-agent simulation for managing design changes in prefabricated construction projects. Eng. Constr. Archit. Manag. 2020, 27, 270–295. [Google Scholar] [CrossRef]
- Utama, W.P.; Chan, A.P.; Zahoor, H.; Gao, R.; Jumas, D.Y. Making decision toward overseas construction projects. Eng. Constr. Archit. Manag. 2019, 26, 285–302. [Google Scholar] [CrossRef]
- Sun, H.; Sun, J.; Wu, Y.H.; Zhao, K.J. Introduction to large-scale intelligent PC component automatic production line. Concr. Cem. Prod. 2015, 1, 35–38. [Google Scholar]
- Luo, L.Z.; Mao, C.; Shen, L.Y.; Li, Z.D. Risk factors affecting practitioners’ attitudes toward the implementation of an industrialized building system. Eng. Constr. Archit. Manag. 2015, 22, 622–643. [Google Scholar] [CrossRef]
- Li, Z.; Zhang, S.; Meng, Q.; Hu, X. Barriers to the development of prefabricated buildings in china: A news coverage analysis. Eng. Constr. Archit. Manag. 2021, 28, 2884–2903. [Google Scholar] [CrossRef]
- Li, X.; Liao, F.; Wang, C.; Alashwal, A. Managing Safety Hazards in Metro Subway Projects under Complex Environmental Conditions. ASCE-ASME J. Risk Uncertain. Eng. Syst. Part A Civ. Eng. 2022, 8, 04021079. [Google Scholar] [CrossRef]
- Guan, L.; Abbasi, A.; Ryan, M.J. Analyzing green building project risk interdependencies using interpretive structural modeling. J. Clean. Prod. 2020, 256, 120372. [Google Scholar] [CrossRef]
- Huang, W.; Zhang, Y.; Yu, Y.; Xu, Y.; Xu, M.; Zhang, R.; De Dieu, G.J.; Yin, D.; Liu, Z. Historical data-driven risk assessment of railway dangerous goods transportation system: Comparisons between entropy weight method and scatter degree method. Reliab. Eng. Syst. Saf. 2021, 205, 107236. [Google Scholar] [CrossRef]
- Xing, X.; Zhong, B.; Luo, H.; Li, H.; Wu, H. Ontology for safety risk identification in metro construction. Comput. Ind. 2019, 109, 14–30. [Google Scholar] [CrossRef]
- Ji, Y.; Li, Y.; Liu, Y. Prefabricated building hoisting safety risk identification and control. In Proceedings of the IOP Conference Series: Earth and Environmental Science, Beijing, China, 20–22 September 2019; IOP Publishing: Bristol, UK, 2019; Volume 371, p. 032004. [Google Scholar] [CrossRef]
- Jeong, G.; Kim, H.; Lee, H.-S.; Park, M.; Hyun, H. Analysis of safety risk factors of modular construction to identify accident trends. J. Asian Archit. Build. Eng. 2022, 21, 1040–1052. [Google Scholar] [CrossRef]
- Li, X.; Wang, C.; Kassem, M.A.; Alhajlah, H.H.; Bimenyimana, S. Evaluation Method for Quality Risks of Safety in Prefabricated Building Construction Using SEM–SDM Approach. Int. J. Environ. Res. Public Health 2022, 19, 5180. [Google Scholar] [CrossRef]
- Wang, S.; Tang, J.; Zou, Y.; Zhou, Q. Research on production process optimization of precast concrete component factory based on value stream mapping. Eng. Constr. Archit. Manag. 2020, 27, 850–871. [Google Scholar] [CrossRef]
- Pan, W.; Gibb, A.G.F.; Dainty, A.R.J. Perspectives of UK house builders on the use of offsite modern methods of construction. Constr. Manag. Econ. 2007, 25, 183–194. [Google Scholar] [CrossRef]
- Pervez, H.; Ali, Y.; Pamucar, D.; Garai-Fodor, M.; Csiszárik-Kocsir, Á. Evaluation of critical risk factors in the implementation of modular construction. PLoS ONE 2022, 17, e0272448. [Google Scholar] [CrossRef] [PubMed]
- Lee, J.-H.; Kim, J.-S.; Lee, H.-J.; Lee, Y.-M.; Kim, H.-G. Small-scale Public Rental Housing Development Using Modular construction—Lessons Learned from Case Studies in Seoul, Korea. Sustainability 2019, 11, 1120. [Google Scholar] [CrossRef]
- O’Connor, J.T.; O’Brien, W.J.; Choi, J.O. Standardization Strategy for Modular Industrial Plants. J. Constr. Eng. Manag. 2015, 141, 04015026. [Google Scholar] [CrossRef]
- Smith, R. Prefab Architecture: A Guide to Modular Design and Construction, 1st ed.; John Wiley & Sons, Inc.: Hoboken, NJ, USA, 2011; pp. 217–251. [Google Scholar]
- Wuni, I.Y.; Shen, G.Q. Barriers to the adoption of modular integrated construction: Systematic review and meta-analysis, integrated conceptual framework, and strategies. J. Clean. Prod. 2020, 249, 119347. [Google Scholar] [CrossRef]
- Jaillon, L.; Poon, C.S. The evolution of prefabricated residential building systems in Hong Kong: A review of the public and the private sector. Autom. Constr. 2009, 18, 239–248. [Google Scholar] [CrossRef]
- Parry, M.L.; Canziani, O.; Palutikof, J.; Van der Linden, P.; Hanson, C. Climate Change 2007-Impacts, Adaptation and Vulnerability: Working Group II Contribution to the Fourth Assessment Report of the IPCC; Cambridge University Press: Cambridge, UK, 2007; Volume 4, 976p. [Google Scholar]
- Navaratnam, S.; Ngo, T.; Gunawardena, T.; Henderson, D. Performance Review of Prefabricated Building Systems and Future Research in Australia. Buildings 2019, 9, 38. [Google Scholar] [CrossRef]
- Li, H.X.; Al-Hussein, M.; Lei, Z.; Ajweh, Z. Risk identification and assessment of modular construction utilizing fuzzy analytic hierarchy process (AHP) and simulation. Can. J. Civ. Eng. 2013, 40, 1184–1195. [Google Scholar] [CrossRef]
- Kisi, K.; Mani, N.; Shrestha, K.J.; Shrestha, K.; Kayastha, R. Opportunities and Challenges for Modular Construction in Developing Nations: A Case Study in the Nepalese Construction Industry. In Proceedings of the 7th Canadian Society for Civil Engineers (CSCE) Annual Conference, Montreal, QC, Canada, 12–15 June 2019. [Google Scholar]
- Olawumi, T.O.; Chan, D.W.M.; Ojo, S.; Yam, M.C.H. Automating the modular construction process: A review of digital technologies and future directions with blockchain technology. J. Build. Eng. 2022, 46, 103720. [Google Scholar] [CrossRef]
- Dallasega, P.; Rauch, E.; Frosolini, M. A Lean Approach for Real-Time Planning and Monitoring in Engineer-to-Order Construction Projects. Buildings 2018, 8, 38. [Google Scholar] [CrossRef]
- Ferdous, W.; Bai, Y.; Ngo, T.D.; Manalo, A.; Mendis, P. New advancements, challenges and opportunities of multi-storey modular buildings–A state-of-the-art review. Eng. Struct. 2019, 183, 883–893. [Google Scholar] [CrossRef]
- Kamali, M.; Hewage, K.; Milani, A.S. Life cycle sustainability performance assessment framework for residential modular buildings: Aggregated sustainability indices. Build. Environ. 2018, 138, 21–41. [Google Scholar] [CrossRef]
- Abdul Nabi, M.; El-adaway, I.H. Understanding the Key Risks Affecting Cost and Schedule Performance of Modular Construction Projects. J. Manag. Eng. 2021, 37, 04021023. [Google Scholar] [CrossRef]
- Agapiou, A. Barriers to Offsite Construction Adoption: A Quantitative Study among Housing Associations in England. Buildings 2022, 12, 283. [Google Scholar] [CrossRef]
- Wuni, I.Y.; Shen, G.Q.; Antwi-Afari, M.F. Exploring the design risk factors for modular integrated construction projects. Constr. Innov. 2023, 23, 213–228. [Google Scholar] [CrossRef]
- Xin, Y.Y.; Yang, D.L.; Fang, Q.C. Application of improved GRA-TOPSIS model in risk assessment of prefabricated building construction. J. Saf. Environ. 2023, 23, 2212–2222. [Google Scholar]
- Wang, Q.K.; Zhu, K.; Guo, P.W. Safety risk assessment of prefabricated building construction based on IM-FCM. J. Saf. Environ. 2023, 23, 2202–2211. [Google Scholar]
- Li, H.R. Research on Control of Prefabricated Building Construction Safety Risk Based on Design Process. Master’s Thesis, Southeast University, Nanjing, China, 2018. [Google Scholar]
- Li, W.L.; Li, H.M.; Pei, X.W. Safety risk assessment of prefabricated building hoisting construction based on structure entropy weight-credibility measure theory. Eng. J. Wuhan Univ. 2020, 53, 410–417. [Google Scholar]
- Ali, N.F.; Mansor, M.A. Specify the priorities of indicators for measuring the performance success of construction projects. Tikrit J. Eng. Sci. 2022, 29, 36–45. [Google Scholar] [CrossRef]
- Nguyen, H.D.; Macchion, L. A comprehensive risk assessment model based on a fuzzy synthetic evaluation approach for green building projects: The case of Vietnam. Eng. Constr. Archit. Manag. 2023, 30, 2837–2861. [Google Scholar] [CrossRef]
- Kumar, M.H.; Ramu, P. Risk Assessment and Hazard Identification in Prefabricated Structures and its Industries. Int. J. Mod. Dev. Eng. Sci. 2023, 2, 16–18. Available online: https://www.ijmdes.com (accessed on 7 May 2025).
- Mansor, M.A.; Mohammed, S.R. Assessment of environmental and governance sustainability of Iraqi Middle provinces. In Proceedings of the 1st International Scientific Conference of Engineering Sciences-3rd Scientific Conference of Engineering Science (ISCES), Diyala, Iraq, 11 January 2018; IEEE: Piscataway, NJ, USA, 2018; pp. 299–304. [Google Scholar] [CrossRef]
- Mansor, M.A. Economic and social sustainability for Iraqi middle provinces. Adv. Sci. Technol. Eng. Syst. 2018, 3, 447–453. [Google Scholar] [CrossRef]
- Adegoriola, M.I.; Lai, J.H.; Yung, E.H.; Chan, E.H. Development of a significant index model for assessing heritage building maintenance management challenges. Eng. Constr. Archit. Manag. 2024, 31, 3398–3428. [Google Scholar] [CrossRef]
- Deng, B.; Zhou, D.; Zhao, J.; Yin, Y.; Li, X. Fuzzy synthetic evaluation of the critical success factors for the sustainability of public private partnership projects in China. Sustainability 2021, 13, 2551. [Google Scholar] [CrossRef]
- Hsu, T.H.; Yang, T.S. The application of fuzzy synthetic decision to the human resource management. Fu Jen Manag. Rev. 1997, 4, 85–100. [Google Scholar]
- Zhao, X.; Hwang, B.-G.G.; Gao, Y. A fuzzy synthetic evaluation approach for risk assessment: A case of Singapore’s green projects. J. Clean. Prod. 2016, 115, 203–213. [Google Scholar] [CrossRef]
- Mu, S.; Cheng, H.; Chohr, M.; Peng, W. Assessing risk management capability of contractors in subway projects in mainland China. Int. J. Proj. Manag. 2014, 32, 452–460. [Google Scholar] [CrossRef]
- Xu, Y.; Chan, A.P.C.; Yeung, J.F.Y. Developing a fuzzy risk allocation model for PPP projects in China. J. Constr. Eng. Manag. 2010, 136, 894–903. [Google Scholar] [CrossRef]
- Akter, M.; Jahan, M.; Kabir, R.; Karim, D.S.; Haque, A.; Rahman, M.; Salehin, M. Risk assessment based on fuzzy synthetic evaluation method. Sci Total Environ. 2019, 658, 818–829. [Google Scholar] [CrossRef] [PubMed]
- Zhong, J.; Negre, E. Fuzzy synthetic method for evaluating explanations in recommender systems. arXiv 2024. [Google Scholar] [CrossRef]
- Guo, R.; Wu, Z. Social sustainable supply chain performance assessment using hybrid fuzzy-AHP-DEMATEL-VIKOR: A case study in manufacturing enterprises. Environ. Dev. Sustain. 2022, 25, 12273–12301. [Google Scholar] [CrossRef]
- Ly, T.H.; Roh, S.; Jang, H. Selection of Functional Logistics Service Providers: AHP and DEMATEL Application. Korean Data Anal. Soc. 2021, 23, 1517–1534. [Google Scholar] [CrossRef]
- Osei-Kyei, R.; Chan, A.P.; Ameyaw, E.E. A fuzzy synthetic evaluation analysis of operational management critical success factors for public-private partnership infrastructure projects. Benchmarking An. Int. J. 2017, 24, 2092–2112. [Google Scholar] [CrossRef]
- Wuni, I.Y.; Shen, G.Q.; Mahmud, A.T. Critical risk factors in the application of modular integrated construction: A systematic review. Int. J. Constr. Manag. 2022, 22, 133–147. [Google Scholar] [CrossRef]
- Jiang, R.; Mao, C.; Hou, L.; Wu, C.; Tan, J. A SWOT analysis for promoting off-site construction under the backdrop of China’s new urbanisation. J. Clean. Prod. 2018, 173, 225–234. [Google Scholar] [CrossRef]
- Jiang, L.; Li, Z.; Li, L.; Gao, Y. Constraints on the Promotion of Prefabricated Construction in China. Sustainability 2018, 10, 2516. [Google Scholar] [CrossRef]
- Hwang, B.G.; Shan, M.; Looi, K.Y. Key constraints and mitigation strategies for prefabricated prefinished volumetric construction. J. Clean. Prod. 2018, 183, 183–193. [Google Scholar] [CrossRef]
- Kamali, M.; Hewage, K. Life cycle performance of modular buildings: A critical review. Renew. Sustain. Energy Rev. 2016, 62, 1171–1183. [Google Scholar] [CrossRef]
- Wuni, I.Y.; Shen, G.Q.; Hwang, B.G. Risks of modular integrated construction: A review and future research direcions. Front. Eng. Manag. 2020, 7, 63–80. [Google Scholar] [CrossRef]
- Zhang, X.; Skitmore, M.; Peng, Y. Exploring the challenges to industrialized residential building in China. Habitat. Int. 2014, 41, 176–184. [Google Scholar] [CrossRef]
- Jaillon, L.; Poon, C.S.; Chiang, Y.H. Quantifying the waste reduction potential of using prefabrication in building construction in Hong Kong. Waste Manag. 2009, 29, 309–320. [Google Scholar] [CrossRef] [PubMed]
- Sun, Y.; Wang, J.; Wu, J.; Shi, W.; Ji, D.; Wang, X.; Zhao, X. Constraints Hindering the Development of High-Rise Modular Buildings. Appl. Sci. 2020, 10, 7159. [Google Scholar] [CrossRef]
- Blismas, N.; Pasquire, C.; Gibb, A. Benefit evaluation for off-site production in construction. Constr. Manag. Econ. 2006, 24, 121–130. [Google Scholar] [CrossRef]
- Bortolini, R.; Formoso, C.T.; Viana, D.D. Site logistics planning and control for engineer-to-order prefabricated building systems using BIM 4D modeling. Autom Constr. 2019, 98, 248–264. [Google Scholar] [CrossRef]
- Li, C.Z.; Zhong, R.Y.; Xue, F.; Xu, G.; Chen, K.; Huang, G.G.; Shen, G.Q. Integrating RFID and BIM technologies for mitigating risks and im-proving schedule performance of prefabricated house construction. J. Clean. Prod. 2017, 165, 1048–1062. [Google Scholar] [CrossRef]
- Wu, P.; Xu, Y.; Jin, R.; Lu, Q.; Madgwick, D.; Hancock, C.M. Perceptions towards risks involved in off-site construction in the integrated design & construction project delivery. J. Clean. Prod. 2019, 213, 899–914. [Google Scholar] [CrossRef]
- Hassim, S.; Jaafar, M.S.; Sazalli, S.A. The contractor perception towers industrialised building system risk in construction projects in Malaysia. Am. J. Appl. Sci. 2009, 6, 937. [Google Scholar] [CrossRef]
- Kamali, M.; Hewage, K. Development of performance criteria for sustainability evaluation of modular versus conventional construction methods. J. Clean. Prod. 2017, 142, 3592–3606. [Google Scholar] [CrossRef]
- Blismas, N.G.; Pendlebury, M.; Gibb, A.; Pasquire, C. Constraints to the Use of Off-site Production on Construction Projects. Arch. Eng. Des. Manag. 2005, 1, 153–156. [Google Scholar] [CrossRef]
- Lee, J.S.; Kim, Y.S. Analysis of cost-increasing risk factors in modular construction in Korea using FMEA. KSCE J. Civ. Eng. 2017, 21, 1999–2010. [Google Scholar] [CrossRef]
- Wuni, I.Y.; Shen, G.Q. Risks Identification and Allocation in the Supply Chain of Modular Integrated Construction (MiC). In Proceedings of the Modular and Offsite Construction (MOC) Summit, Banff, AB, Canada, 21–24 May 2019; pp. 189–197. [Google Scholar] [CrossRef]
- Zhai, X.; Reed, R.; Mills, A. Factors impeding the offsite production of housing construction in China: An investigation of current practice. Constr. Manag. Econ. 2014, 32, 40–52. [Google Scholar] [CrossRef]
- Hsu, P.Y.; Angeloudis, P.; Aurisicchio, M. Optimal logistics planning for modular construction using two stage stochastic programming. Autom. Constr. 2018, 94, 47–61. Available online: https://api.semanticscholar.org/CorpusID:115370628 (accessed on 7 May 2025). [CrossRef]
- Li, C.Z.; Hong, J.; Xue, F.; Shen, G.Q.; Xu, X.; Luo, L. SWOT analysis and Internet of Things-enabled platform for prefabrication housing production in Hong Kong. Habitat. Int. 2016, 57, 74–87. [Google Scholar] [CrossRef]
- Li, C.Z.; Hong, J.; Xue, F.; Shen, G.Q.; Xu, X.; Mok, M.K. Schedule risks in prefabrication housing production in Hong Kong: A social network analysis. J. Clean. Prod. 2016, 134, 482–494. [Google Scholar] [CrossRef]
- Li, C.Z.; Xu, X.; Shen, G.Q.; Fan, C.; Li, X.; Hong, J. A model for simulating schedule risks in prefabrication housing production: A case study of six-day cycle assembly activities in Hong Kong. J. Clean. Prod. 2018, 185, 366–381. [Google Scholar] [CrossRef]
- Wang, Z.; Hu, H.; Gong, J. Simulation based multiple disturbances evaluation in the precast supply chain for improved disturbance prevention. J. Clean. Prod. 2018, 177, 232–244. [Google Scholar] [CrossRef]
- Durdyev, S.; Ismail, S. Offsite Manufacturing in the Construction Industry for Productivity Improvement. Eng. Manag. J. 2019, 31, 35–46. [Google Scholar] [CrossRef]
- Kamali, M.; Hewage, K.; Sadiq, R. Conventional versus modular construction methods: A comparative cradle-to-gate LCA for residential buildings. Energy Build. 2019, 204, 109479. [Google Scholar] [CrossRef]
- Blismas, N.; Wakefield, R. Drivers, constraints and the future of offsite manufacture in Australia. Arif M, editor. Constr. Innov. 2009, 9, 72–83. [Google Scholar] [CrossRef]
- Luo, L.; Shen, G.Q.; Xu, G.; Liu, Y.; Wang, Y. Stakeholder-Associated Supply Chain Risks and Their Interactions in a Prefabricated Building Project in Hong Kong. J. Manag. Eng. 2019, 35, 05018015. [Google Scholar] [CrossRef]
- Arif, M.; Egbu, C. Making a case for offsite construction in China. Eng. Constr. Arch. Manag. 2010, 17, 536–548. [Google Scholar] [CrossRef]
- Kamar, K.M.; Alshawi, M.; Hamid, Z. Barriers to industrialized building system (IBS): The case of Malaysia. In Proceedings of the BuHu 9th International Postgraduate Research Conference (IPGRC), Salford, UK, 29 January 2009; Volume 30. [Google Scholar]
- Han, Y.; Wang, L. Identifying barriers to off-site construction using grey DEMATEL approach: Case of China. J. Civ. Eng. Manag. 2018, 24, 364–377. [Google Scholar] [CrossRef]
- Lovell, H.; Smith, S.J. Agencement in housing markets: The case of the UK construction industry. Geoforum 2010, 41, 457–468. [Google Scholar] [CrossRef]
- Nurhafizah, A.; Fadzilawani, A.A.; Muniroh, H.; Siti, A.M. Reliability Analysis: Application of Cronbach’s Alpha in Research Instruments. Pioneer. Future Delving Into E-Learn. Landsc. 2024, 114–119. Available online: https://appspenang.uitm.edu.my/sigcs/ (accessed on 7 May 2025).
- Mansor, M.A. Multi-Criteria Decision Making for Prioritizing Project Manager Skills according to Construction Project Success Factors. Eng. Technol. Appl. Sci. Res. 2025, 15, 21861–21875. [Google Scholar] [CrossRef]
- Tavakol, M.; Dennick, R. Making sense of Cronbach’s alpha. Int. J. Med. Educ. 2011, 2, 53–55. [Google Scholar] [CrossRef]
- Nnaji, C.; Gambatese, J.; Karakhan AOsei-Kyei, R. Development and application of safety technology adoption decision-making tool. J. Constr. Eng. Manag. 2020, 146, 04020028. [Google Scholar] [CrossRef]
- Yevu, S.K.; Yu, A.T.W.; Darko, A.; Addy, M.N. Evaluation model for influences of driving forces for electronic procurement systems application in Ghanaian construction projects. J. Constr. Eng. Manag. 2021, 147, 04021076. [Google Scholar] [CrossRef]

| Work Place% | Academic Degree% | Respondent Role% | Specialization % | Years of Experience% | Work Sector % | ||||||
|---|---|---|---|---|---|---|---|---|---|---|---|
| Salah al-Din | 2 | Bachelor’s | 54.8 | Project Manager | 6.5 | Civil General | 83.9 | 11 or more | 41.9 | Governmental | 80.6 |
| Kirkuk | 9.7 | Master’s | 22.6 | Supervising Engineer | 29.0 | Architectural | 9.7 | 6–10 | 38.7 | Private | 19.4 |
| Baghdad | 6.5 | Higher Diploma | 3.2 | Site Engineer | 25.8 | Mechanical | 6.5 | 1–5 | 19.4 | ||
| Nineveh | 35.5 | Doctor | 19.4 | Contractor | 9.7 | ||||||
| Dohuk | 3.2 | Design Engineer | 12.9 | ||||||||
| Diwaniyah | 3.2 | Academic | 9.7 | ||||||||
| Consultant | 6.5 | ||||||||||
| Code | Capital Investment Risks I | References |
|---|---|---|
| I1 | Cost of construction and productivity | [31] |
| I2 | Increase in the prices of prefabricated components | [60] |
| I3 | The cost estimate is inaccurate | [60] |
| I4 | High initial investment (high cost of initial capital) | [60,61,62,63,64] |
| I5 | Limited capacity of prefabricated manufacturers/suppliers | [60] |
| I6 | Increase in the prices of prefabricated components | [50] |
| I7 | Increase in cost price | [65] |
| I8 | Volatile economic conditions | [12,66,67] |
| I9 | Difficulty in achieving a return on initial investment (longer break-even period) | [31] |
| I10 | Market demand for standard homes and general consumer habits | [60] |
| I11 | Failure of the ready production system | [12,22,68] |
| Code | Political risks P | References |
| P1 | Changing government policies | [31] |
| P2 | Changing political support due to change in the political environment | [31] |
| P3 | Labor strike | [31] |
| P4 | Poor government support and regulations | [33,34,60,69,70] |
| P5 | Unsupportive planning and building regulations | [60] |
| Code | Material and equipment risks M | References |
| M1 | Improper use of a crane | [19] |
| M2 | Quality and type of manufactured materials | [31] |
| M3 | The state of the factory production line for prefabricated materials | [31] |
| M4 | Construction equipment case | [31] |
| M5 | The condition of heavy equipment in terms of lifting and installation | [31] |
| M6 | Crane failure | [65] |
| M7 | Part obsolescence as a result of long-term operation of equipment to | [18] |
| M8 | Materials/components, defective structure and crane, and defective equipment | [19] |
| M9 | Technological inefficiency | [12,28] |
| M10 | Improper use of equipment | [19] |
| Code | Safety risk S | References |
| S1 | Poor fall prevention (no fall risk indicator) | [19] |
| S2 | Incomplete equipment safety device | [19] |
| S3 | Safety device for crane when not in operation | [19] |
| S4 | No hazard indicator for the equipment | [19] |
| S5 | Overloading lifting | [18] |
| S6 | No security check at the time of admission | [18] |
| S7 | Low security awareness | [18] |
| S8 | No occupational training and safety for workers | [18] |
| S9 | There is no safety device | [19] |
| S10 | No indication sign of risk | [19] |
| S11 | Not wearing personal protective equipment | [19] |
| S12 | Defective personal protective equipment | [19] |
| S13 | No regular security checks and fixes | [18] |
| S14 | Safety measures not applied | [18] |
| Code | The risks of spatial mismanagement T | References |
| T1 | Insufficient consideration of the moving line (insufficient moving space) | [68] |
| T2 | Insufficient consideration of the radius of the crane | [68] |
| T3 | Ignore the power line | [68] |
| T4 | Improper arrangement of the workplace | [68] |
| T5 | Crowded work areas (insufficient work space to install the unit) | [68] |
| T6 | Unstable or slippery floor | [68] |
| T7 | Unstable working areas/platforms (unstable support, unstable crane, unstable ladder, and unstable unit structure) | [68] |
| Code | Workplace and environment risks E | References |
| E1 | Unexpected weather and weather disturbances (temperature, wind speed, etc.) | [31,60,65] |
| E2 | Lighting and bad ventilation | [19] |
| E3 | Excessive noise | [19] |
| E4 | Exposure to fumes, noise, and toxic compounds in production units | [65] |
| E5 | The state of the land and the environment of the place | [31] |
| E6 | Ignore the influence of the environment on the job | [18] |
| Code | Design risks D | References |
| D1 | Lack of appropriate codes and design standards for prefabricated construction | [12,60,66,71] |
| D2 | Complicated design of prefabricated buildings | [60,63,72,73] |
| D3 | The inability to make changes in the design (stopping the design and wrong specifications) during the construction phase | [12,22,27,74,75] |
| D4 | Change orders due to defective design and change in project scope | [19,31,60,76] |
| Code | Supply Chain Risks SC | |
| SC1 | Stakeholder management risks and supply chain management limitations | [60] |
| SC2 | Complex supply chain | [60,77,78,79,80] |
| SC3 | Poor supply chain integration | [27,60,81,82] |
| SC4 | Delays in delivering modular components to the site | [5,60,71,81,83] |
| SC5 | Supply chain information gap and inconsistency | [60] |
| SC6 | Transport restrictions (size and weight) | [60,63,78,84,85] |
| SC7 | Damage to prefabricated components during transportation to construction sites and installation | [12,28,86] |
| SC8 | Supply chain disruptions | [65] |
| Code | Administrative risks R | References |
| R1 | Inadequate information coordination between project participants (poor coordination between multiple interfaces) | [64,65,87,88] |
| R2 | Poor cooperation and communication between project participants | [60] |
| R3 | Stakeholder fragmentation and management complexity | [65] |
| R4 | Lack of best management practices | [60] |
| R5 | Managers have not seriously fulfilled management responsibilities | [18] |
| R6 | There is no special lift plan | [18] |
| R7 | Deficiency of professional managers on site | [18] |
| R8 | Lack of quality control systems | [12,89] |
| Code | Poor scheduling risk C | References |
| C1 | Delays in delivery of modular components to the construction site | [60,65] |
| C2 | Ineffective or inappropriate scheduling | [60,79,83,87] |
| C3 | Workers’ unreasonable scheduling leads to worker stress | [18] |
| Code | Experience risks K | References |
| K1 | Insufficient skills and experience in prefabricated construction | [31,61,65,90,91] |
| K2 | Contractors’ lack of experience in prefabricated construction | [60] |
| K3 | Skilled labor requirements | [60] |
| Cronbach’s Alpha | N of Items |
|---|---|
| 0.905 | 79 |
| The Mean Importance Scores for the Probability and the Impact | The Mean Importance for Risk Index | ||
|---|---|---|---|
| The Range of Values | Level | The Range of Values | Level |
| 1–1.8 | Very Low (V.L) | 1–5 | Very Low (V.L) |
| 1.81–2.6 | Low (L) | 5.1–10 | Low (L) |
| 2.61–3.4 | Medium (M) | 10.1–15 | Medium (M) |
| 3.41–4.2 | High (H) | 15.1–20 | High (H) |
| 4.21–5 | Very High (V.H) | 20.1–25 | Very High (V.H) |
| Code | Probability | Level | Rank | Impact | Level | Rank | RI | Level | Rank |
|---|---|---|---|---|---|---|---|---|---|
| Capital Investment Risks I | |||||||||
| I1 | 2.94 | M | 8 | 2.68 | M | 11 | 7.86 | L | 11 |
| I2 | 2.94 | M | 9 | 2.97 | M | 8 | 8.71 | L | 9 |
| I3 | 3.00 | M | 7 | 3.20 | M | 3 | 9.60 | L | 6 |
| I4 | 3.26 | M | 2 | 2.97 | M | 10 | 9.66 | L | 5 |
| I5 | 3.03 | M | 6 | 3.10 | M | 6 | 9.39 | L | 7 |
| I6 | 3.06 | M | 4 | 3.26 | M | 2 | 9.98 | L | 2 |
| I7 | 3.45 | H | 1 | 3.39 | M | 1 | 11.69 | M | 1 |
| I8 | 3.19 | M | 3 | 3.10 | M | 7 | 9.89 | L | 3 |
| I9 | 2.68 | M | 11 | 2.97 | M | 9 | 7.95 | L | 10 |
| I10 | 2.81 | M | 10 | 3.16 | M | 5 | 8.87 | L | 8 |
| I11 | 3.06 | M | 5 | 3.19 | M | 4 | 9.79 | L | 4 |
| 3.04 | M | 3.09 | M | 9.40 | L | ||||
| Political risks P | |||||||||
| P1 | 2.97 | M | 4 | 3.06 | M | 5 | 9.09 | L | 5 |
| P2 | 3.10 | M | 3 | 3.23 | M | 4 | 9.99 | L | 3 |
| P3 | 2.94 | M | 5 | 3.32 | M | 3 | 9.75 | L | 4 |
| P4 | 3.55 | H | 1 | 3.55 | H | 1 | 12.59 | M | 1 |
| P5 | 3.16 | M | 2 | 3.45 | H | 2 | 10.91 | M | 2 |
| P | 3.14 | M | 3.32 | M | 10.47 | M | |||
| Material and equipment risks M | |||||||||
| M1 | 3.06 | M | 5 | 3.32 | M | 5 | 10.18 | M | 6 |
| M2 | 2.90 | M | 7 | 3.13 | M | 8 | 9.08 | L | 8 |
| M3 | 2.87 | M | 10 | 3.19 | M | 7 | 9.17 | L | 7 |
| M4 | 2.90 | M | 8 | 2.94 | M | 9 | 8.52 | L | 9 |
| M5 | 2.90 | M | 9 | 2.84 | M | 10 | 8.24 | L | 10 |
| M6 | 3.10 | M | 2 | 3.45 | H | 3 | 10.69 | M | 3 |
| M7 | 3.16 | M | 1 | 3.26 | M | 6 | 10.30 | M | 5 |
| M8 | 3.10 | M | 3 | 3.39 | M | 4 | 10.49 | M | 4 |
| M9 | 3.10 | M | 4 | 3.48 | H | 2 | 10.79 | M | 2 |
| M10 | 3.06 | M | 6 | 3.55 | H | 1 | 10.87 | M | 1 |
| M | 3.02 | M | 3.25 | M | 9.83 | L | |||
| Safety risks S | |||||||||
| S1 | 3.10 | M | 12 | 3.16 | M | 13 | 9.79 | L | 13 |
| S2 | 3.19 | M | 9 | 3.23 | M | 11 | 10.30 | M | 10 |
| S3 | 2.90 | M | 14 | 3.03 | M | 14 | 8.80 | L | 14 |
| S4 | 3.23 | M | 7 | 3.45 | H | 3 | 11.13 | M | 6 |
| S5 | 3.13 | M | 11 | 3.23 | M | 12 | 10.09 | L | 12 |
| S6 | 3.16 | M | 10 | 3.45 | H | 4 | 10.91 | M | 8 |
| S7 | 3.03 | M | 13 | 3.35 | M | 7 | 10.17 | L | 11 |
| S8 | 3.55 | H | 1 | 3.32 | M | 10 | 11.79 | M | 3 |
| S9 | 3.23 | M | 8 | 3.35 | M | 8 | 10.82 | M | 9 |
| S10 | 3.26 | M | 10 | 3.35 | M | 9 | 10.93 | M | 7 |
| S11 | 3.45 | M | 2 | 3.58 | H | 1 | 12.36 | M | 1 |
| S12 | 3.35 | M | 5 | 3.42 | H | 5 | 11.47 | M | 5 |
| S13 | 3.42 | H | 3 | 3.42 | H | 6 | 11.69 | M | 4 |
| S14 | 3.42 | H | 4 | 3.55 | H | 2 | 12.13 | M | 2 |
| S | 3.24 | M | 3.35 | M | 10.89 | M | |||
| The risks of spatial mismanagement T | |||||||||
| T1 | 3.00 | M | 5 | 3.00 | M | 7 | 9.00 | L | 6 |
| T2 | 2.77 | M | 7 | 3.16 | M | 5 | 8.77 | L | 7 |
| T3 | 2.87 | M | 6 | 3.16 | M | 6 | 9.08 | L | 5 |
| T4 | 3.13 | M | 2 | 3.19 | M | 4 | 9.99 | L | 3 |
| T5 | 3.26 | M | 1 | 3.52 | H | 1 | 11.46 | M | 1 |
| T6 | 3.06 | M | 4 | 3.23 | M | 3 | 9.89 | L | 4 |
| T7 | 3.10 | M | 3 | 3.26 | M | 2 | 10.09 | L | 2 |
| T | 3.03 | M | 3.22 | M | 9.75 | L | |||
| Workplace and environment risks E | |||||||||
| E1 | 3.10 | M | 3 | 3.10 | M | 2 | 9.59 | L | 2 |
| E2 | 3.16 | M | 2 | 3.23 | M | 1 | 10.20 | M | 1 |
| E3 | 3.10 | M | 4 | 3.03 | M | 3 | 9.39 | L | 4 |
| E4 | 2.97 | M | 6 | 2.97 | M | 4 | 8.81 | L | 5 |
| E5 | 3.03 | M | 5 | 2.90 | M | 6 | 8.80 | L | 6 |
| E6 | 3.19 | M | 1 | 2.97 | M | 5 | 9.48 | L | 3 |
| E | 3.09 | M | 3.03 | M | 9.38 | L | |||
| Design risks D | |||||||||
| D1 | 3.00 | M | 4 | 3.26 | M | 2 | 9.77 | L | 3 |
| D2 | 3.10 | M | 3 | 3.03 | M | 4 | 9.39 | L | 4 |
| D3 | 3.42 | H | 1 | 3.39 | M | 1 | 11.58 | M | 1 |
| D4 | 3.13 | M | 2 | 3.26 | M | 3 | 10.19 | M | 2 |
| D | 3.16 | M | 3.23 | M | 10.24 | M | |||
| Supply Chain Risks SC | |||||||||
| SC1 | 3.13 | M | 3 | 2.87 | M | 7 | 8.98 | L | 7 |
| SC2 | 3.19 | M | 1 | 3.29 | M | 3 | 10.51 | M | 3 |
| SC3 | 3.10 | M | 6 | 3.13 | M | 5 | 9.69 | L | 4 |
| SC4 | 3.13 | M | 4 | 3.39 | M | 1 | 10.60 | M | 2 |
| SC5 | 3.16 | M | 2 | 3.39 | M | 2 | 10.71 | M | 1 |
| SC6 | 3.06 | M | 7 | 2.87 | M | 8 | 8.80 | L | 8 |
| SC7 | 2.90 | M | 8 | 3.16 | M | 4 | 9.18 | L | 6 |
| SC8 | 3.13 | M | 5 | 3.00 | M | 6 | 9.39 | L | 5 |
| SC | 3.10 | M | 3.14 | M | 9.73 | L | |||
| Administrative risks R | |||||||||
| R1 | 3.23 | M | 6 | 3.26 | M | 7 | 10.51 | M | 7 |
| R2 | 3.39 | M | 2 | 3.45 | H | 3 | 11.69 | M | 2 |
| R3 | 3.29 | M | 4 | 3.52 | H | 2 | 11.57 | M | 3 |
| R4 | 3.35 | M | 3 | 3.42 | H | 4 | 11.47 | M | 4 |
| R5 | 3.19 | M | 7 | 3.35 | M | 5 | 10.71 | M | 6 |
| R6 | 3.13 | M | 8 | 3.26 | M | 8 | 10.19 | M | 8 |
| R7 | 3.48 | H | 1 | 3.55 | H | 1 | 12.36 | M | 1 |
| R8 | 3.29 | M | 5 | 3.32 | M | 6 | 10.93 | M | 5 |
| RK | 3.29 | M | 3.39 | M | 11.18 | M | |||
| Poor scheduling risks C | |||||||||
| C1 | 3.06 | M | 2 | 2.97 | M | 2 | 9.09 | L | 2 |
| C2 | 3.13 | M | 1 | 3.03 | M | 1 | 9.49 | L | 1 |
| C3 | 2.94 | M | 3 | 2.94 | M | 3 | 8.62 | L | 3 |
| C | 3.04 | M | 2.98 | M | 9.07 | L | |||
| Experience risks K | |||||||||
| K1 | 3.35 | M | 2 | 3.35 | M | 3 | 11.25 | M | 3 |
| K2 | 3.42 | H | 1 | 3.65 | H | 1 | 12.46 | M | 1 |
| K3 | 3.19 | M | 3 | 3.58 | H | 2 | 11.43 | M | 2 |
| 3.32 | M | 3.53 | H | 11.72 | M | ||||
| Risk Categories | Mean Probability Score | Mean Impact Score | Initial Mean Risk Index | |||
|---|---|---|---|---|---|---|
| Capital investment | M | L | L | |||
| Increase in cost price (I7) | H | Increase in cost price (I7) | M | Increase in cost price (I7) | M | |
| Political | M | M | M | |||
| Poor government support and regulations (P4) | H | Poor government support and regulations (P4) | H | Poor government support and regulations (P4) | M | |
| Unsupportive planning and building regulations (P5) | H | Unsupportive planning and building regulations (P5) | M | |||
| Material and equipment | M | M | L | |||
| Improper use of equipment (M10) | H | Improper use of equipment (M10) | M | |||
| Technological inefficiency (M9) | M | |||||
| Technological inefficiency (M9) | H | Crane failure (M6) | M | |||
| Part obsolescence as a result of long-term operation of equipment to (M7) | M | |||||
| Crane failure (M6) | H | Materials/components, defective structure and crane, and defective equipment (M8) | M | |||
| Safety | M | M | M | |||
| No occupational training and safety for workers (S8) | H | Not wearing personal protective equipment (S11) | H | Poor fall prevention (S1) | L | |
| Safety measures not applied (S14) | H | |||||
| Safety measures not applied (S14) | H | |||||
| No hazard indicator for the equipment (S4) | H | Safety device for crane when not in operation (S3) | L | |||
| No security check at the time of admission (6) | H | Overloading lifting (S5) | L | |||
| Defective personal protective equipment (S12) | H | Low security awareness (S7) | L | |||
| No regular security checks and fixes (S13) | H | |||||
| Spatial mismanagement | M | M | M | |||
| Crowded work areas (T5) | H | Crowded work areas (T5) | M | |||
| Workplace and environment | M | M | M | |||
| Lighting and bad ventilation (E2) | M | |||||
| Design | M | M | M | |||
| The inability to make changes in the design (D3) | H | Lack of appropriate codes and design standards for MiC prefabricated construction (D1) | L | |||
| The inability to make changes in the design (D2) | L | |||||
| Supply Chain | M | M | L | |||
| Supply chain information gap and | M | |||||
| inconsistency (SC5) | ||||||
| Delays in delivering modular components to the site (SC4) | M | |||||
| Complex supply chain (SC2) | M | |||||
| Administrative | M | M | M | |||
| Deficiency of professional managers on site (R7) | H | Deficiency of professional managers on site (R7) | H | |||
| Stakeholder fragmentation and management complexity (R3) | H | |||||
| Poor cooperation and communication between project participants (R2) | H | |||||
| Lack of best management practices (R4) | H | |||||
| Poor scheduling Experience | M | H | M | |||
| Contractors’ lack of experience in prefabricated construction (K2) | H | Insufficient skills and experience in prefabricated construction (K1) | M | |||
| Normalization N Based on Probability Score | Normalization N Based on Impact Score | Normalization N Based on Risk Index Score | |||||||||
|---|---|---|---|---|---|---|---|---|---|---|---|
| Code | Probability Score | Rank | N | Code | Impact Score | Rank | N | Code | RI | Rank | N |
| P4 | 3.55 | 1 | 1 | K2 | 3.65 | 1 | 1 | P4 | 12.59 | 1 | 1 |
| S8 | 3.55 | 2 | 1 | S11 | 3.58 | 2 | 0.93 | K2 | 12.46 | 2 | 0.97 |
| R7 | 3.48 | 3 | 0.92 | K3 | 3.58 | 3 | 0.93 | R7 | 12.36 | 3 | 0.95 |
| I7 | 3.45 | 4 | 0.89 | P4 | 3.55 | 4 | 0.9 | S11 | 12.36 | 4 | 0.95 |
| S11 | 3.45 | 5 | 0.89 | M10 | 3.55 | 5 | 0.9 | S14 | 12.13 | 5 | 0.9 |
| S13 | 3.42 | 6 | 0.85 | S14 | 3.55 | 6 | 0.9 | S8 | 11.79 | 6 | 0.83 |
| S14 | 3.42 | 7 | 0.85 | R7 | 3.55 | 7 | 0.9 | S13 | 11.69 | 7 | 0.81 |
| D3 | 3.42 | 8 | 0.85 | T5 | 3.52 | 8 | 0.86 | I7 | 11.69 | 8 | 0.81 |
| K2 | 3.42 | 9 | 0.85 | R3 | 3.52 | 9 | 0.86 | R2 | 11.69 | 9 | 0.81 |
| R2 | 3.39 | 10 | 0.81 | M9 | 3.48 | 10 | 0.83 | D3 | 11.58 | 10 | 0.79 |
| S12 | 3.35 | 11 | 0.78 | P5 | 3.45 | 11 | 0.8 | R3 | 11.57 | 11 | 0.78 |
| R4 | 3.35 | 12 | 0.78 | M6 | 3.45 | 12 | 0.8 | S12 | 11.47 | 12 | 0.76 |
| K1 | 3.35 | 13 | 0.78 | S4 | 3.45 | 13 | 0.8 | R4 | 11.47 | 13 | 0.76 |
| R3 | 3.29 | 14 | 0.7 | S6 | 3.45 | 14 | 0.8 | T5 | 11.46 | 14 | 0.76 |
| R8 | 3.29 | 15 | 0.7 | R2 | 3.45 | 15 | 0.8 | K3 | 11.43 | 15 | 0.76 |
| I4 | 3.26 | 16 | 0.66 | S12 | 3.42 | 16 | 0.76 | K1 | 11.25 | 16 | 0.72 |
| S10 | 3.26 | 17 | 0.66 | S13 | 3.42 | 17 | 0.76 | S4 | 11.13 | 17 | 0.69 |
| T5 | 3.26 | 18 | 0.66 | R4 | 3.42 | 18 | 0.76 | R8 | 10.93 | 18 | 0.65 |
| S4 | 3.23 | 19 | 0.63 | I7 | 3.39 | 19 | 0.73 | S10 | 10.93 | 19 | 0.65 |
| S9 | 3.23 | 20 | 0.63 | M8 | 3.39 | 20 | 0.73 | P5 | 10.91 | 20 | 0.65 |
| R1 | 3.23 | 21 | 0.63 | D3 | 3.39 | 22 | 0.73 | S6 | 10.91 | 21 | 0.65 |
| I8 | 3.19 | 22 | 0.59 | U4 | 3.39 | 23 | 0.73 | M10 | 10.87 | 22 | 0.64 |
| S2 | 3.19 | 23 | 0.59 | U5 | 3.39 | 24 | 0.73 | S9 | 10.82 | 23 | 0.63 |
| E6 | 3.19 | 24 | 0.59 | S7 | 3.35 | 25 | 0.7 | M9 | 10.79 | 24 | 0.62 |
| U2 | 3.19 | 25 | 0.59 | S9 | 3.35 | 26 | 0.7 | R5 | 10.71 | 25 | 0.6 |
| R5 | 3.19 | 26 | 0.59 | S10 | 3.35 | 27 | 0.7 | U5 | 10.71 | 27 | 0.6 |
| K3 | 3.19 | 27 | 0.59 | R5 | 3.35 | 28 | 0.7 | M6 | 10.69 | 28 | 0.6 |
| P5 | 3.16 | 28 | 0.55 | K1 | 3.35 | 29 | 0.7 | U4 | 10.6 | 29 | 0.58 |
| M7 | 3.16 | 29 | 0.55 | P3 | 3.32 | 30 | 0.66 | R1 | 10.51 | 30 | 0.56 |
| S6 | 3.16 | 30 | 0.55 | M1 | 3.32 | 31 | 0.66 | U2 | 10.51 | 31 | 0.56 |
| E2 | 3.16 | 31 | 0.55 | S8 | 3.32 | 32 | 0.66 | M8 | 10.49 | 32 | 0.56 |
| SC5 | 3.16 | 32 | 0.55 | R8 | 3.32 | 33 | 0.66 | S2 | 10.3 | 33 | 0.52 |
| S5 | 3.13 | 33 | 0.52 | U2 | 3.29 | 34 | 0.63 | M7 | 10.3 | 34 | 0.52 |
| T4 | 3.13 | 34 | 0.52 | I6 | 3.26 | 35 | 0.6 | E2 | 10.2 | 35 | 0.49 |
| D4 | 3.13 | 35 | 0.52 | M7 | 3.26 | 36 | 0.6 | D4 | 10.19 | 36 | 0.49 |
| SC1 | 3.13 | 36 | 0.52 | T7 | 3.26 | 37 | 0.6 | R6 | 10.19 | 37 | 0.49 |
| SC4 | 3.13 | 37 | 0.52 | D1 | 3.26 | 38 | 0.6 | M1 | 10.18 | 38 | 0.49 |
| SC8 | 3.13 | 38 | 0.52 | D4 | 3.26 | 39 | 0.6 | S7 | 10.17 | 39 | 0.49 |
| R6 | 3.13 | 39 | 0.52 | R1 | 3.26 | 40 | 0.6 | S5 | 10.09 | 40 | 0.47 |
| C2 | 3.13 | 40 | 0.52 | R6 | 3.26 | 41 | 0.6 | T7 | 10.09 | 41 | 0.47 |
| P2 | 3.1 | 42 | 0.48 | P2 | 3.23 | 42 | 0.56 | T4 | 9.99 | 42 | 0.45 |
| M6 | 3.1 | 43 | 0.48 | S2 | 3.23 | 43 | 0.56 | P2 | 9.99 | 43 | 0.45 |
| M8 | 3.1 | 44 | 0.48 | S5 | 3.23 | 44 | 0.56 | I6 | 9.98 | 44 | 0.45 |
| M9 | 3.1 | 45 | 0.48 | T6 | 3.23 | 45 | 0.56 | I8 | 9.89 | 45 | 0.43 |
| S1 | 3.1 | 46 | 0.48 | E2 | 3.23 | 46 | 0.56 | T6 | 9.89 | 46 | 0.43 |
| T7 | 3.1 | 47 | 0.48 | I3 | 3.2 | 47 | 0.54 | S1 | 9.79 | 47 | 0.41 |
| E1 | 3.1 | 48 | 0.48 | I11 | 3.19 | 48 | 0.53 | I11 | 9.79 | 48 | 0.41 |
| E3 | 3.1 | 49 | 0.48 | M3 | 3.19 | 49 | 0.53 | D1 | 9.77 | 49 | 0.4 |
| D2 | 3.1 | 50 | 0.48 | T4 | 3.19 | 50 | 0.53 | P3 | 9.75 | 50 | 0.4 |
| SC3 | 3.1 | 51 | 0.48 | I10 | 3.16 | 51 | 0.5 | U3 | 9.69 | 51 | 0.39 |
| I6 | 3.06 | 52 | 0.44 | S1 | 3.16 | 52 | 0.5 | I4 | 9.66 | 52 | 0.38 |
| I11 | 3.06 | 53 | 0.44 | T2 | 3.16 | 53 | 0.5 | I3 | 9.6 | 53 | 0.37 |
| M1 | 3.06 | 54 | 0.44 | T3 | 3.16 | 54 | 0.5 | E1 | 9.59 | 54 | 0.37 |
| M10 | 3.06 | 55 | 0.44 | U7 | 3.16 | 55 | 0.5 | C2 | 9.49 | 55 | 0.34 |
| Weights for the Probability Scores | Weights for the Impact Scores | |||||||||
|---|---|---|---|---|---|---|---|---|---|---|
| Risk and Risk Category | Mean for Risk | ∑Mean | Wi for Risk | Mean for Risk Category | Wi for Risk Category | Mean for Risk | ∑Mean | Wi for Risk | Mean for Risk Category | Wi for Risk Category |
| Political risks | ||||||||||
| Pf4 | 3.55 | 0.529 | 3.55 | 0.507 | ||||||
| Pf5 | 3.16 | 0.471 | 3.45 | 0.493 | ||||||
| 6.71 | 3.355 | 0.1035 | 7 | 3.5 | 0.1035 | |||||
| Experience Risks | ||||||||||
| Kf2 | 3.42 | 0.343 | 3.65 | 0.345 | ||||||
| Kf3 | 3.19 | 0.320 | 3.58 | 0.338 | ||||||
| Kf1 | 3.35 | 0.336 | 3.35 | 0.317 | ||||||
| 9.97 | 3.323 | 0.1025 | 10.58 | 3.527 | 0.1043 | |||||
| Administrative risks | ||||||||||
| Rf7 | 3.48 | 0.150 | 3.55 | 0.149 | ||||||
| Rf2 | 3.39 | 0.146 | 3.45 | 0.145 | ||||||
| Rf3 | 3.29 | 0.142 | 3.52 | 0.147 | ||||||
| Rf4 | 3.35 | 0.144 | 3.42 | 0.143 | ||||||
| Rf8 | 3.29 | 0.142 | 3.32 | 0.139 | ||||||
| Rf5 | 3.19 | 0.137 | 3.35 | 0.141 | ||||||
| Rf1 | 3.23 | 0.139 | 3.26 | 0.136 | ||||||
| 23.23 | 3.319 | 0.1024 | 23.87 | 3.41 | 0.1008 | |||||
| Safety risks | ||||||||||
| Sf11 | 3.45 | 0.104 | 3.58 | 0.105 | ||||||
| Sf14 | 3.42 | 0.103 | 3.55 | 0.104 | ||||||
| Sf8 | 3.55 | 0.107 | 3.32 | 0.097 | ||||||
| Sf13 | 3.42 | 0.103 | 3.42 | 0.100 | ||||||
| Sf12 | 3.35 | 0.101 | 3.42 | 0.100 | ||||||
| Sf4 | 3.23 | 0.097 | 3.45 | 0.101 | ||||||
| Sf10 | 3.26 | 0.098 | 3.35 | 0.098 | ||||||
| Sf6 | 3.16 | 0.095 | 3.45 | 0.101 | ||||||
| Sf9 | 3.23 | 0.097 | 3.35 | 0.098 | ||||||
| Sf2 | 3.19 | 0.096 | 3.23 | 0.095 | ||||||
| 33.26 | 3.326 | 0.1026 | 34.13 | 3.413 | 0.1009 | |||||
| Material and equipment risks | ||||||||||
| Mf10 | 3.06 | 0.164 | 3.55 | 0.173 | ||||||
| Mf9 | 3.10 | 0.166 | 3.48 | 0.170 | ||||||
| Mf6 | 3.10 | 0.166 | 3.45 | 0.168 | ||||||
| Mf8 | 3.10 | 0.166 | 3.39 | 0.165 | ||||||
| Mf7 | 3.16 | 0.169 | 3.26 | 0.159 | ||||||
| 15.52 | 3.104 | 0.0957 | 17.13 | 3.426 | 0.1013 | |||||
| Supply Chain Risks | ||||||||||
| SCf5 | 3.16 | 0.333 | 3.39 | 0.337 | ||||||
| SCf4 | 3.13 | 0.330 | 3.39 | 0.337 | ||||||
| SCf2 | 3.19 | 0.337 | 3.29 | 0.327 | ||||||
| 9.48 | 3.16 | 0.0974 | 10.06 | 3.353 | 0.0991 | |||||
| Capital investment risks | ||||||||||
| If7 | 3.45 | 0.529 | 3.39 | 0.509 | ||||||
| If6 | 3.06 | 0.470 | 3.26 | 0.490 | ||||||
| 6.52 | 3.26 | 6.65 | 3.325 | 3.325 | 0.0983 | |||||
| Design risks | ||||||||||
| Df3 | 3.42 | 0.522 | 3.39 | 0.509 | ||||||
| Df4 | 3.13 | 0.478 | 3.26 | 0.490 | ||||||
| 6.55 | 3.275 | 0.1010 | 6.65 | 3.325 | 0.0983 | |||||
| The risks of spatial mismanagement | ||||||||||
| Tf5 | 3.26 | 0.513 | 3.52 | 0.519 | ||||||
| Tf7 | 3.10 | 0.488 | 3.26 | 0.481 | ||||||
| 6.35 | 3.175 | 0.0979 | 6.77 | 3.385 | 0.1001 | |||||
| Workplace and environment risks | ||||||||||
| Ef2 | 3.16 | 0.505 | 3.23 | 0.510 | ||||||
| Ef1 | 3.10 | 0.495 | 3.10 | 0.490 | ||||||
| 6.26 | 3.13 | 0.0965 | 6.32 | 3.16 | 0.0934 | |||||
| 32.427 | 33.824 | |||||||||
| Membership Function of Risks | Membership Function of Risk Criteria | ||||||||||
|---|---|---|---|---|---|---|---|---|---|---|---|
| Code | Wi For Each Risk | 1 | 2 | 3 | 4 | 5 | |||||
| Political risks | |||||||||||
| Pf4 | 0.529 | 0.032 | 0.065 | 0.355 | 0.419 | 0.125 | 0.032 | 0.126 | 0.385 | 0.358 | 0.097 |
| Pf5 | 0.471 | 0.032 | 0.194 | 0.419 | 0.290 | 0.065 | |||||
| Experience Risks | |||||||||||
| Kf2 | 0.343 | 0.000 | 0.129 | 0.452 | 0.290 | 0.129 | 0.000 | 0.181 | 0.431 | 0.269 | 0.119 |
| Kf3 | 0.320 | 0.000 | 0.258 | 0.387 | 0.258 | 0.097 | |||||
| Kf1 | 0.336 | 0.000 | 0.161 | 0.452 | 0.258 | 0.129 | |||||
| Administrative risks: | |||||||||||
| Rf7 | 0.150 | 0.032 | 0.226 | 0.290 | 0.387 | 0.065 | 0.014 | 0.152 | 0.311 | 0.327 | 0.046 |
| Rf2 | 0.146 | 0.000 | 0.194 | 0.258 | 0.511 | 0.032 | |||||
| Rf3 | 0.142 | 0.000 | 0.129 | 0.484 | 0.355 | 0.032 | |||||
| Rf4 | 0.144 | 0.000 | 0.000 | 0.000 | 0.000 | 0.000 | |||||
| Rf8 | 0.142 | 0.000 | 0.161 | 0.355 | 0.387 | 0.065 | |||||
| Rf5 | 0.137 | 0.032 | 0.129 | 0.516 | 0.258 | 0.065 | |||||
| Rf1 | 0.139 | 0.032 | 0.226 | 0.290 | 0.387 | 0.065 | |||||
| Safety risks | |||||||||||
| Sf11 | 0.104 | 0.032 | 0.129 | 0.290 | 0.452 | 0.097 | 0.023 | 0.141 | 0.406 | 0.345 | 0.086 |
| Sf14 | 0.103 | 0.000 | 0.129 | 0.452 | 0.290 | 0.129 | |||||
| Sf 8 | 0.107 | 0.065 | 0.032 | 0.387 | 0.323 | 0.194 | |||||
| Sf13 | 0.103 | 0.032 | 0.129 | 0.323 | 0.419 | 0.097 | |||||
| Sf12 | 0.101 | 0.000 | 0.161 | 0.452 | 0.258 | 0.129 | |||||
| Sf 4 | 0.097 | 0.065 | 0.129 | 0.355 | 0.419 | 0.032 | |||||
| Sf10 | 0.098 | 0.000 | 0.097 | 0.581 | 0.290 | 0.032 | |||||
| Sf 6 | 0.095 | 0.000 | 0.226 | 0.419 | 0.323 | 0.032 | |||||
| Sf9 | 0.097 | 0.032 | 0.194 | 0.355 | 0.355 | 0.065 | |||||
| Sf2 | 0.096 | 0.000 | 0.194 | 0.452 | 0.323 | 0.032 | |||||
| Material and equipment risks | |||||||||||
| Mf10 | 0.164 | 0.000 | 0.161 | 0.613 | 0.226 | 0.000 | 0.027 | 0.107 | 0.354 | 0.273 | 0.070 |
| Mf9 | 0.166 | 0.097 | 0.161 | 0.323 | 0.387 | 0.032 | |||||
| Mf6 | 0.166 | 0.065 | 0.129 | 0.484 | 0.290 | 0.032 | |||||
| Mf8 | 0.166 | 0.000 | 0.032 | 0.161 | 0.484 | 0.323 | |||||
| Mf7 | 0.169 | 0.000 | 0.161 | 0.548 | 0.258 | 0.032 | |||||
| Supply Chain Risks | |||||||||||
| SCf5 | 0.333 | 0.000 | 0.194 | 0.516 | 0.226 | 0.065 | 0.022 | 0.140 | 0.548 | 0.237 | 0.054 |
| SCf4 | 0.330 | 0.000 | 0.161 | 0.581 | 0.226 | 0.032 | |||||
| SCf2 | 0.337 | 0.065 | 0.065 | 0.548 | 0.258 | 0.065 | |||||
| Capital investment risks | |||||||||||
| If7 | 0.529 | 0.000 | 0.226 | 0.516 | 0.226 | 0.032 | 0.000 | 0.165 | 0.486 | 0.286 | 0.063 |
| If6 | 0.470 | 0.000 | 0.097 | 0.452 | 0.355 | 0.097 | |||||
| Design risks | |||||||||||
| Df3 | 0.522 | 0.000 | 0.226 | 0.258 | 0.387 | 0.129 | 0.015 | 0.195 | 0.381 | 0.310 | 0.098 |
| Df4 | 0.478 | 0.032 | 0.161 | 0.516 | 0.226 | 0.065 | |||||
| The risks of spatial mismanagement | |||||||||||
| Tf5 | 0.513 | 0.000 | 0.161 | 0.516 | 0.226 | 0.097 | 0.016 | 0.193 | 0.469 | 0.242 | 0.081 |
| Tf7 | 0.488 | 0.032 | 0.226 | 0.419 | 0.258 | 0.065 | |||||
| Workplace and environment risks | |||||||||||
| Ef2 | 0.505 | 0.032 | 0.226 | 0.355 | 0.323 | 0.065 | 0.016 | 0.258 | 0.355 | 0.323 | 0.049 |
| Ef1 | 0.495 | 0.000 | 0.290 | 0.355 | 0.323 | 0.032 | |||||
| Probability Score Index | Impact Score Index | ||||||||||
|---|---|---|---|---|---|---|---|---|---|---|---|
| Membership Function of Risk Criteria | Iprob. | Membership Function of Risk Criteria | Iimp. | ||||||||
| 1 | 2 | 3 | 4 | 5 | 1 | 2 | 3 | 4 | 5 | ||
| Political risks | |||||||||||
| 0.032 | 0.126 | 0.385 | 0.358 | 0.097 | 3.355 | 0.000 | 0.178 | 0.306 | 0.355 | 0.162 | 3.503 |
| Experience Risks | |||||||||||
| 0.000 | 0.181 | 0.431 | 0.269 | 0.119 | 3.325 | 0.000 | 0.097 | 0.375 | 0.334 | 0.194 | 3.627 |
| Administrative risks: | |||||||||||
| 0.014 | 0.152 | 0.311 | 0.327 | 0.046 | 2.790 | 0.014 | 0.156 | 0.387 | 0.323 | 0.120 | 3.380 |
| Safety risks | |||||||||||
| 0.023 | 0.141 | 0.406 | 0.345 | 0.086 | 3.331 | 0.023 | 0.122 | 0.402 | 0.301 | 0.139 | 3.375 |
| Material and equipment risks | |||||||||||
| 0.027 | 0.107 | 0.354 | 0.273 | 0.070 | 2.743 | 0.011 | 0.091 | 0.360 | 0.275 | 0.097 | 2.858 |
| Supply Chain Risks | |||||||||||
| 0.022 | 0.140 | 0.548 | 0.237 | 0.054 | 3.165 | 0.021 | 0.148 | 0.430 | 0.302 | 0.097 | 3.302 |
| Capital investment risks | |||||||||||
| 0.000 | 0.165 | 0.486 | 0.286 | 0.063 | 3.246 | 0.000 | 0.178 | 0.305 | 0.355 | 0.162 | 3.500 |
| Design risks | |||||||||||
| 0.015 | 0.195 | 0.381 | 0.310 | 0.098 | 3.281 | 0.000 | 0.145 | 0.515 | 0.210 | 0.130 | 3.323 |
| The risks of spatial mismanagement | |||||||||||
| 0.016 | 0.193 | 0.469 | 0.242 | 0.081 | 3.183 | 0.015 | 0.159 | 0.388 | 0.293 | 0.144 | 3.394 |
| Workplace and environment risks | |||||||||||
| 0.016 | 0.258 | 0.355 | 0.323 | 0.049 | 3.131 | 0.016 | 0.179 | 0.531 | 0.178 | 0.098 | 3.166 |
| Code | Risk Categories | IRprob. | IRimp. | I | |||
|---|---|---|---|---|---|---|---|
| P | Political risks | 3.355 | 1 | 3.503 | 2 | 11.753 | 2 |
| K | Experience Risks | 3.325 | 3 | 3.627 | 1 | 12.057 | 1 |
| R | Administrative risks: | 2.790 | 9 | 3.380 | 5 | 9.429 | 9 |
| S | Safety risks | 3.331 | 2 | 3.375 | 6 | 11.242 | 4 |
| M | Material and equipment risks | 2.743 | 10 | 2.858 | 10 | 7.840 | 10 |
| SC | Supply Chain Risks | 3.165 | 7 | 3.302 | 8 | 10.451 | 7 |
| I | Capital investment risks | 3.246 | 5 | 3.500 | 3 | 11.362 | 3 |
| D | Design risks | 3.281 | 4 | 3.323 | 7 | 10.902 | 5 |
| T | The risks of spatial mismanagement | 3.183 | 6 | 3.394 | 4 | 10.803 | 6 |
| E | Workplace and environment risks | 3.131 | 8 | 3.166 | 9 | 9.913 | 8 |
Disclaimer/Publisher’s Note: The statements, opinions and data contained in all publications are solely those of the individual author(s) and contributor(s) and not of MDPI and/or the editor(s). MDPI and/or the editor(s) disclaim responsibility for any injury to people or property resulting from any ideas, methods, instructions or products referred to in the content. |
© 2025 by the authors. Licensee MDPI, Basel, Switzerland. This article is an open access article distributed under the terms and conditions of the Creative Commons Attribution (CC BY) license (https://creativecommons.org/licenses/by/4.0/).
Share and Cite
Mansor, M.A.; Flayyih, S.S. Risk Assessment of Prefabricated Construction in Iraq Using Fuzzy Synthetic Evaluation. Buildings 2025, 15, 1622. https://doi.org/10.3390/buildings15101622
Mansor MA, Flayyih SS. Risk Assessment of Prefabricated Construction in Iraq Using Fuzzy Synthetic Evaluation. Buildings. 2025; 15(10):1622. https://doi.org/10.3390/buildings15101622
Chicago/Turabian StyleMansor, Maysoon Abdullah, and Shaalan Shaher Flayyih. 2025. "Risk Assessment of Prefabricated Construction in Iraq Using Fuzzy Synthetic Evaluation" Buildings 15, no. 10: 1622. https://doi.org/10.3390/buildings15101622
APA StyleMansor, M. A., & Flayyih, S. S. (2025). Risk Assessment of Prefabricated Construction in Iraq Using Fuzzy Synthetic Evaluation. Buildings, 15(10), 1622. https://doi.org/10.3390/buildings15101622