


A New Single-Step Bolt Tightening Method for Multi-Bolt Flange Structures


Abstract
1. Introduction
2. The Influence of Tightening Sequence on Elastic Interaction
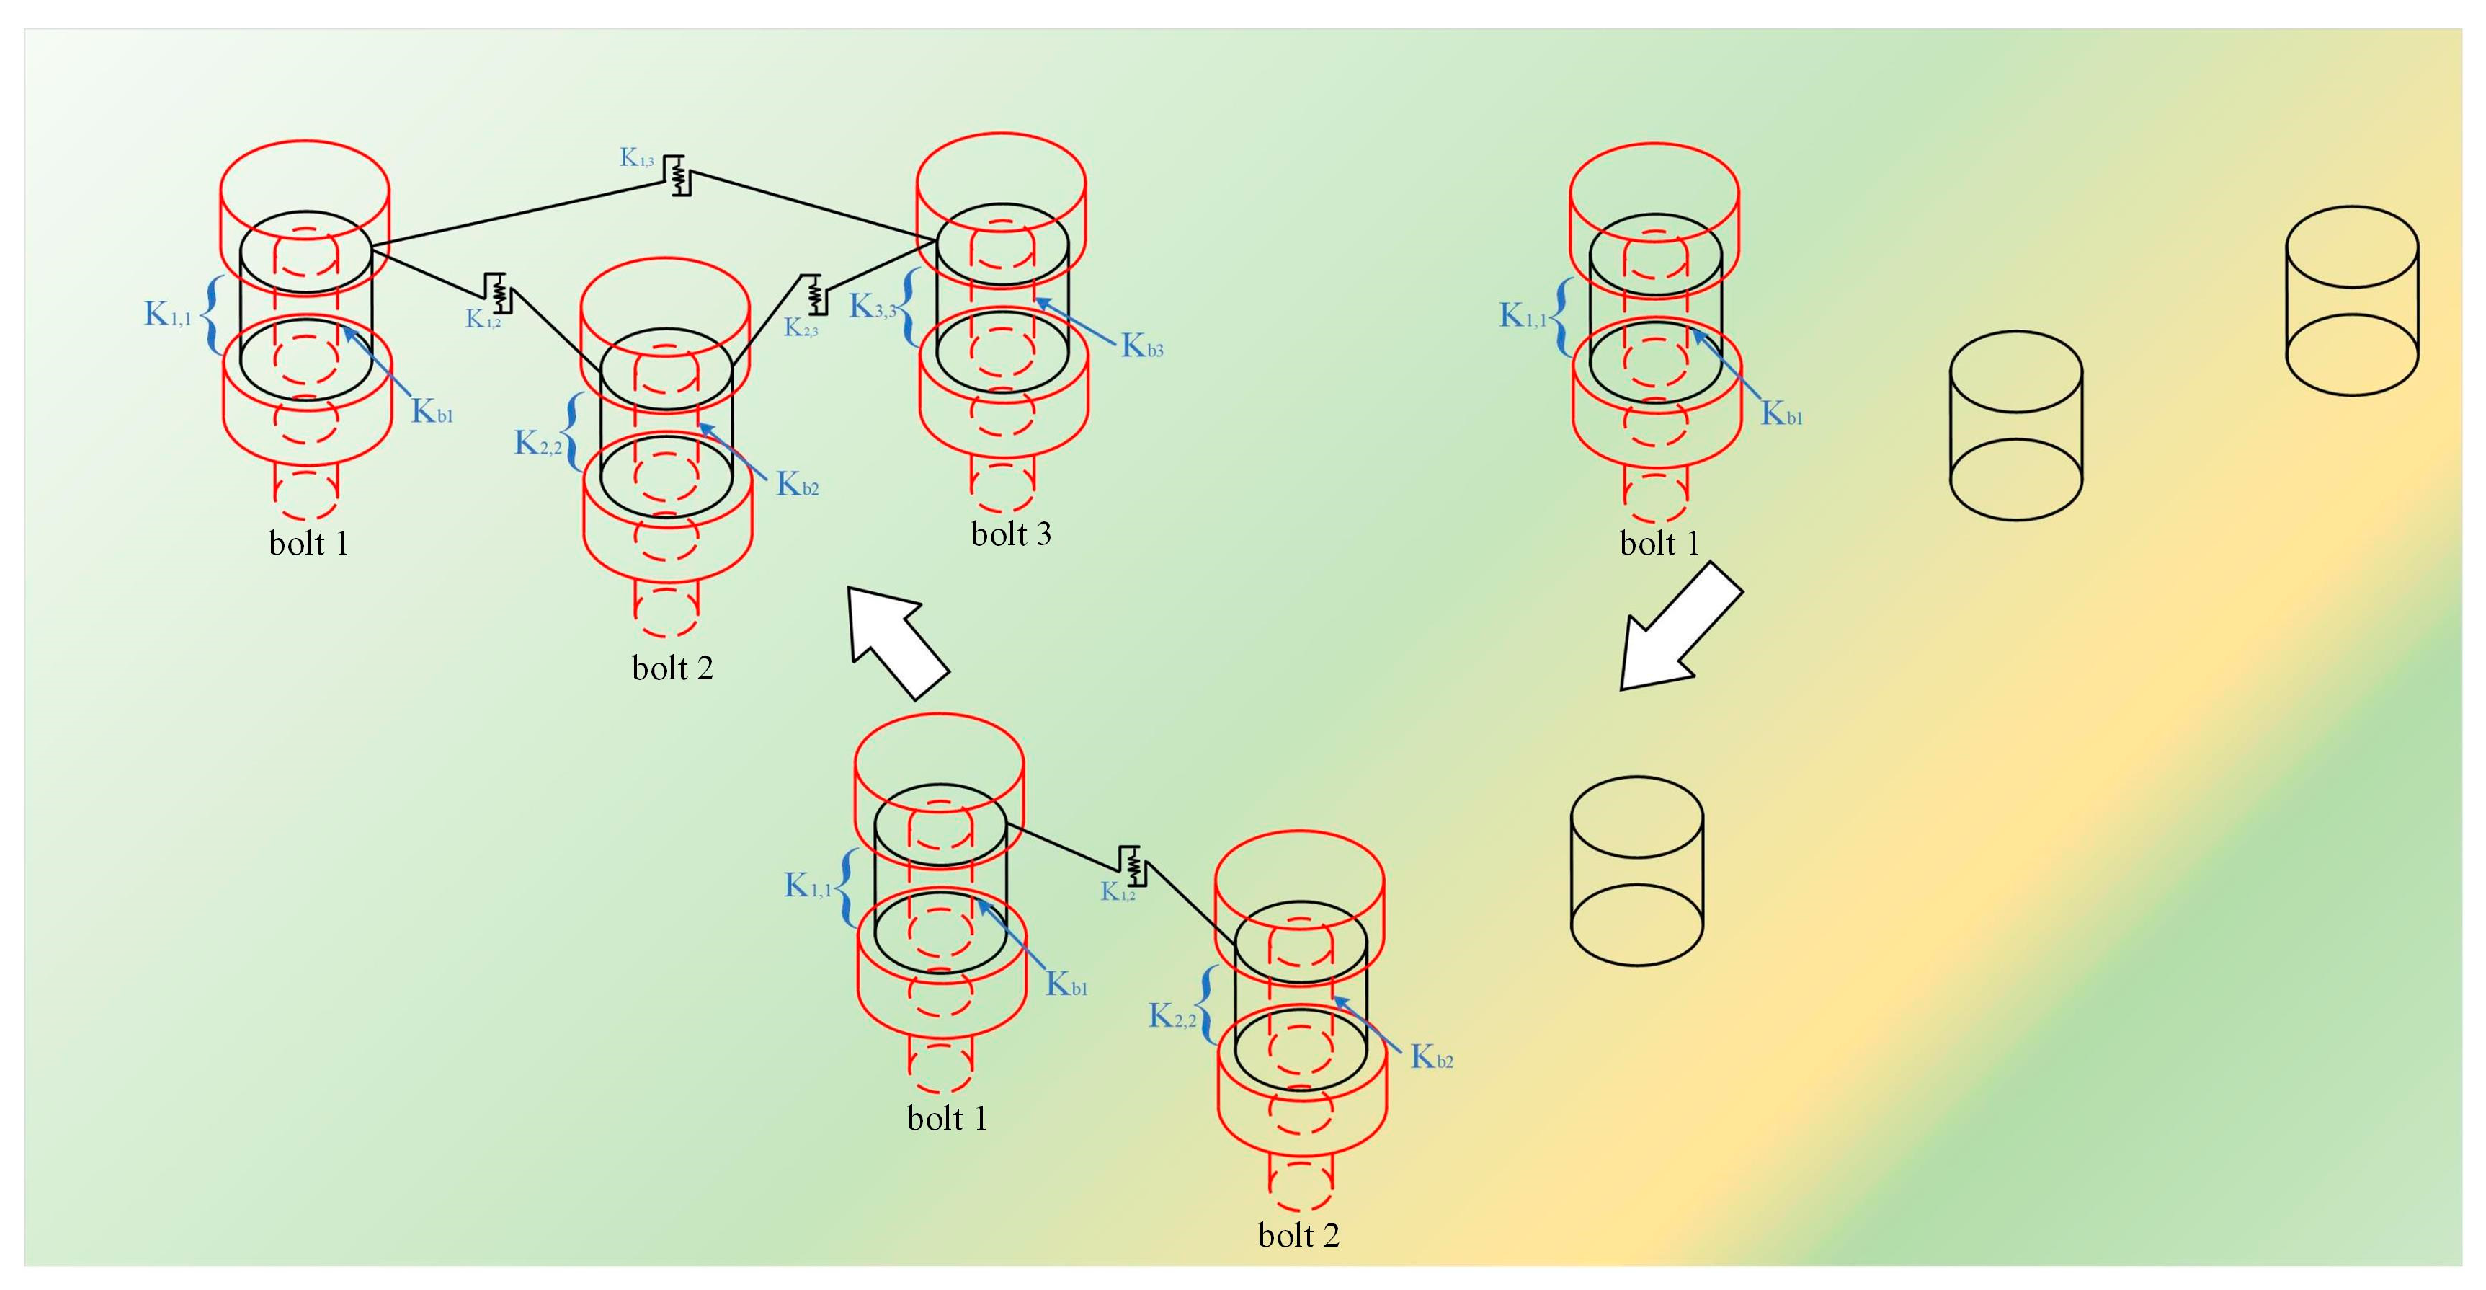
2.1. Validation of EICM Using the Spring-Node Model
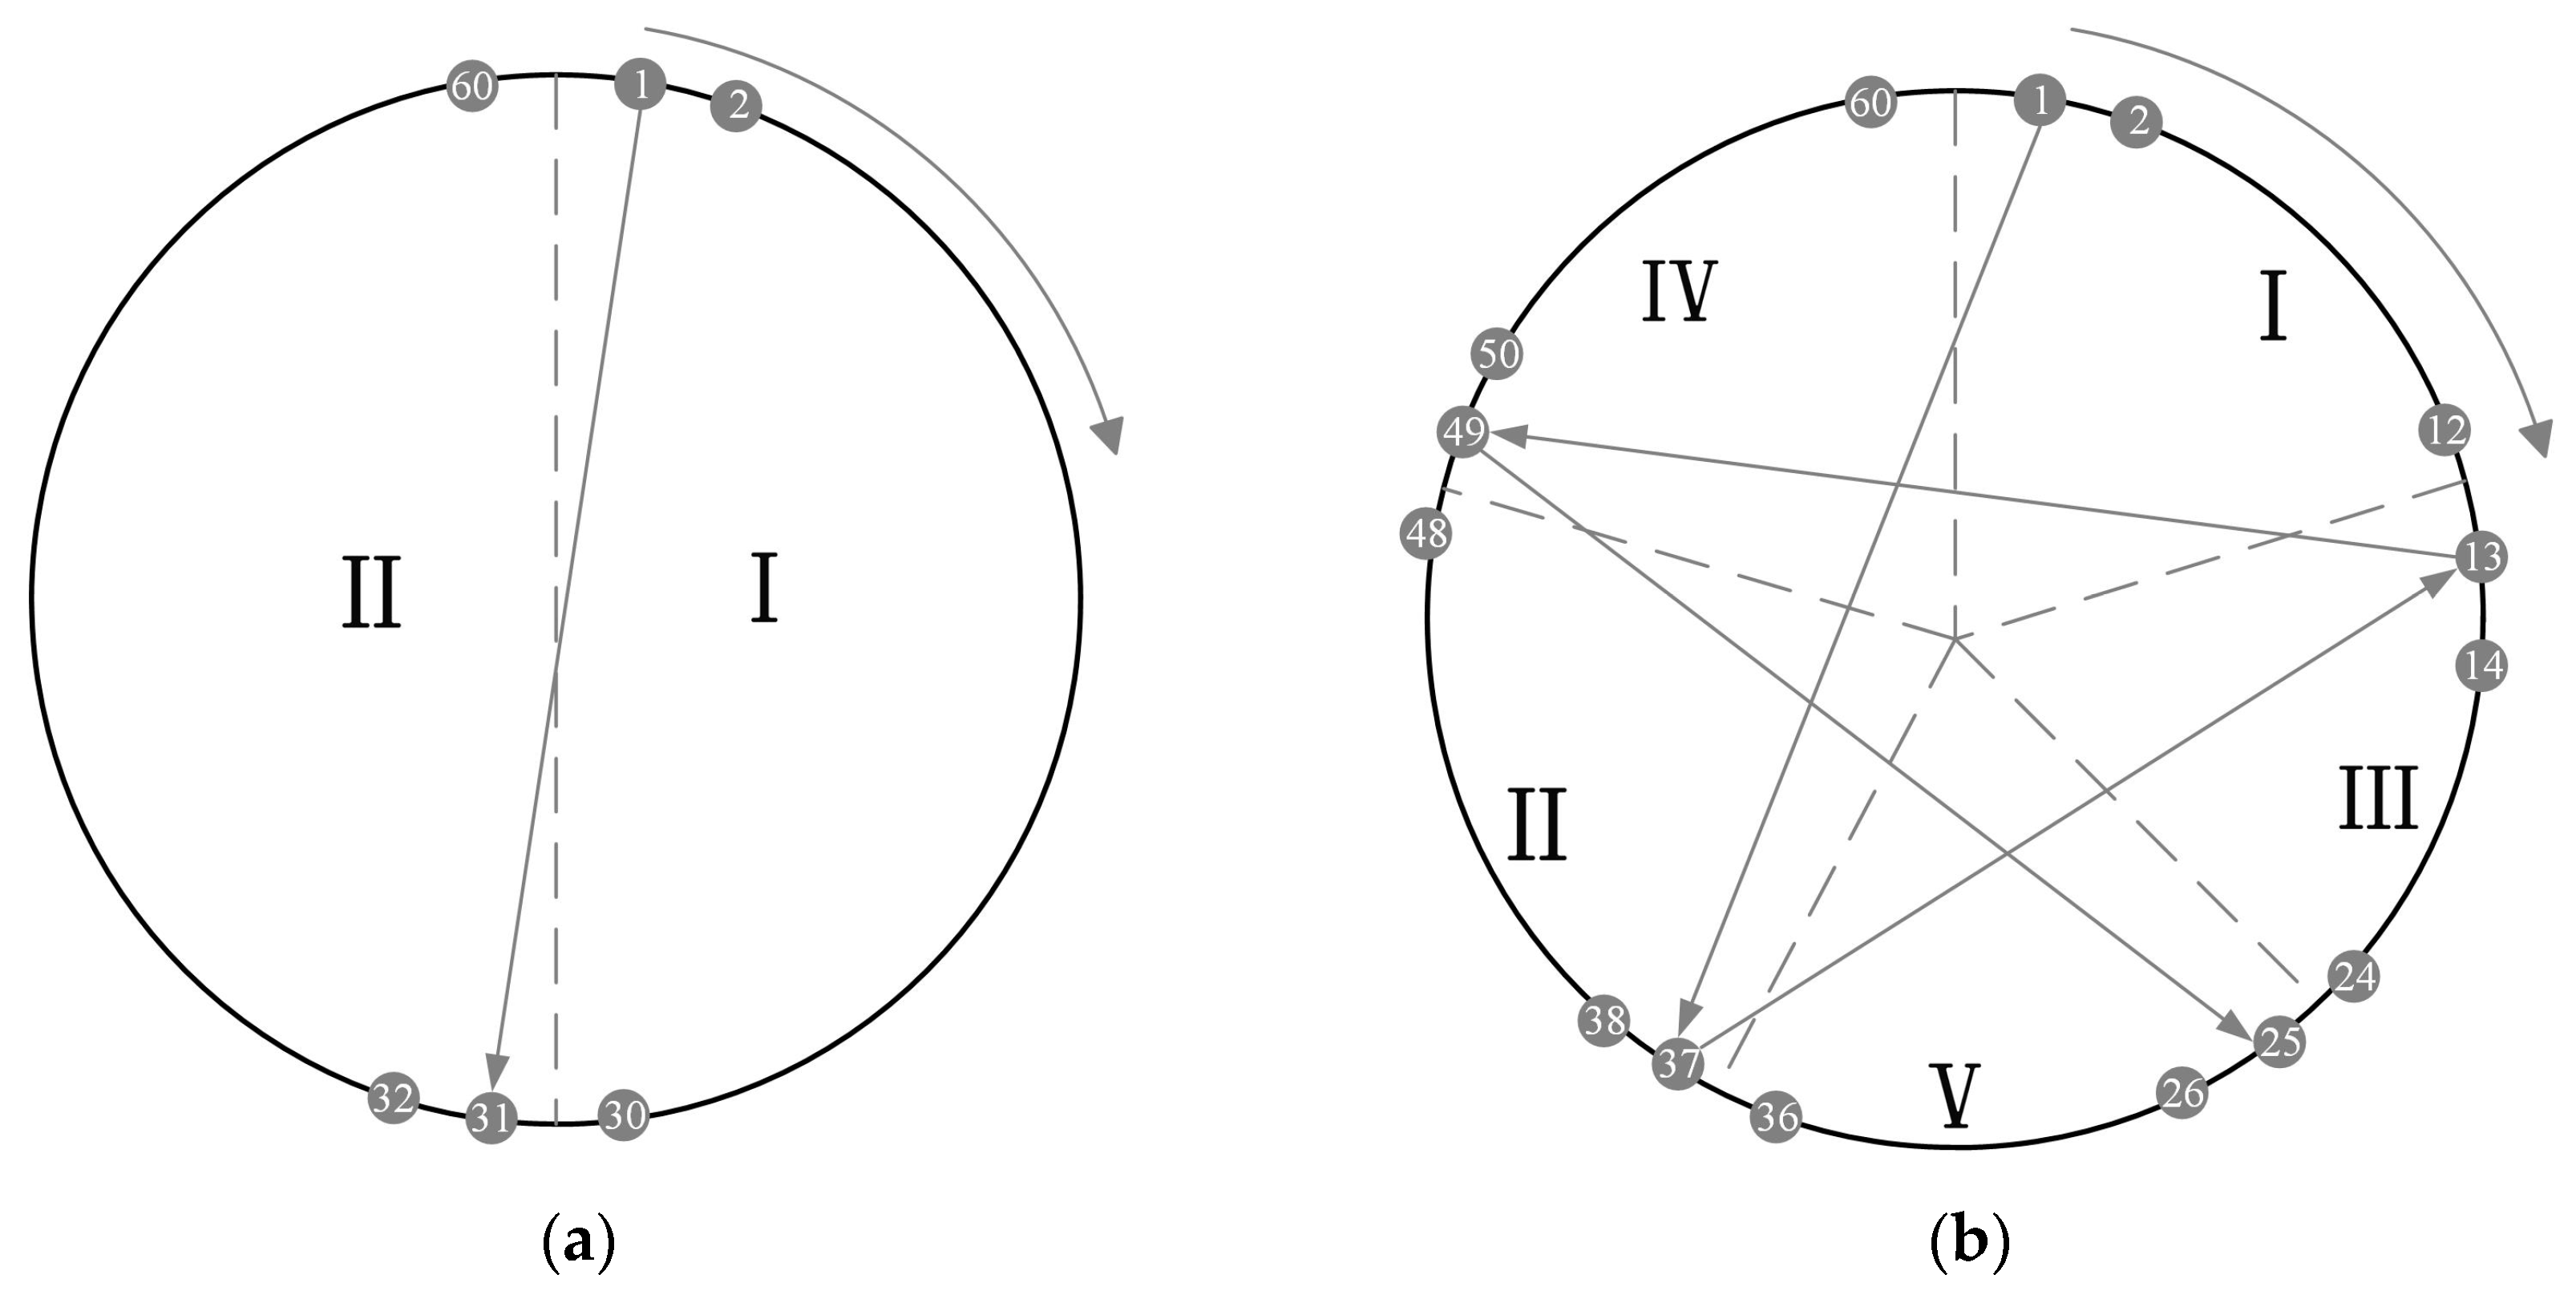
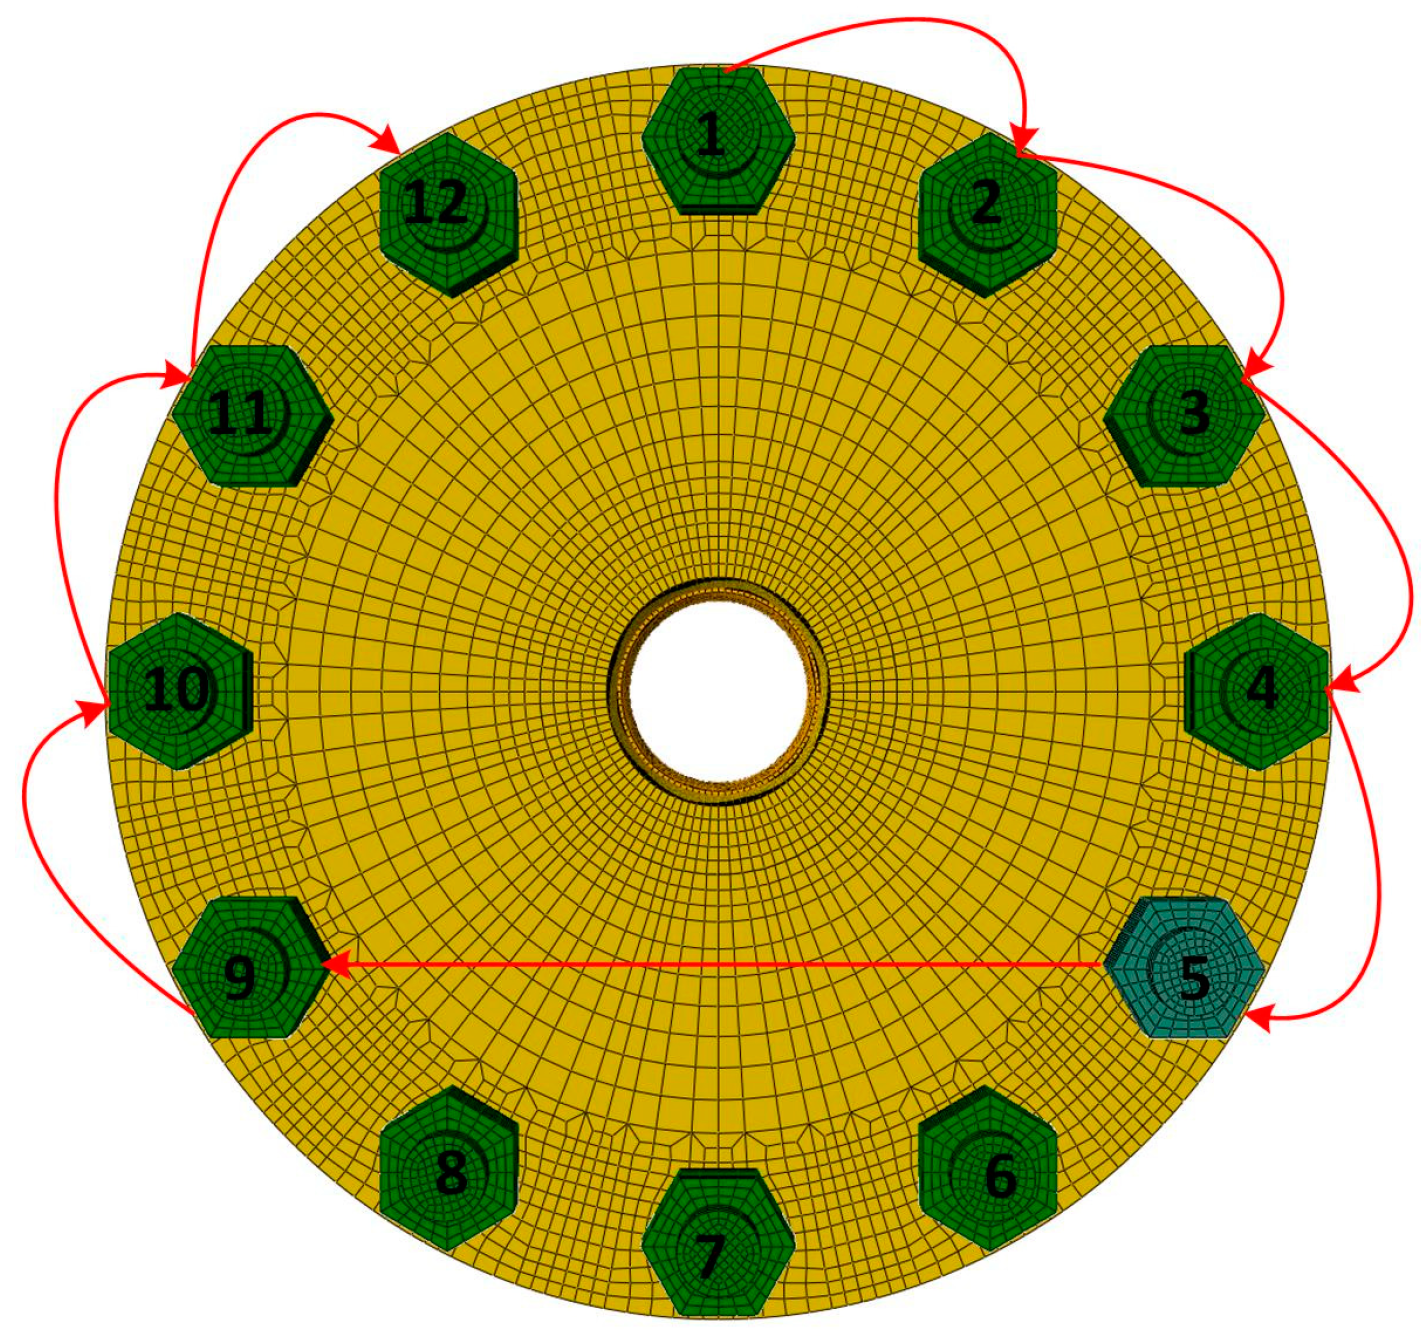
2.2. The Impact of Tightening Sequence on Load Distribution
3. New Methodology for Bolt Tightening Sequence Optimization
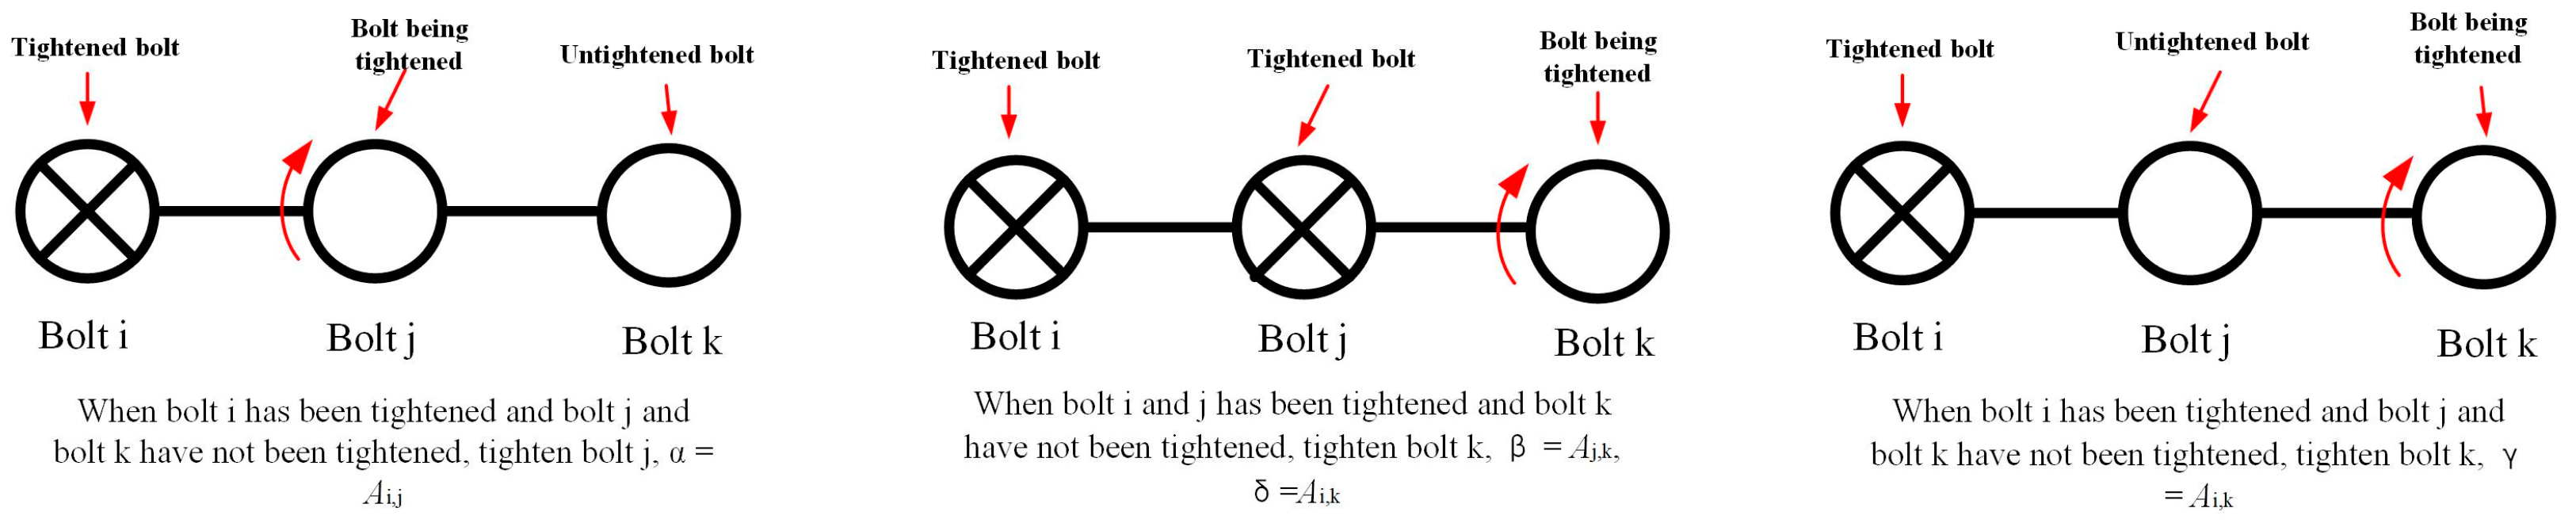
3.1. Tetraparametric Assembly Method
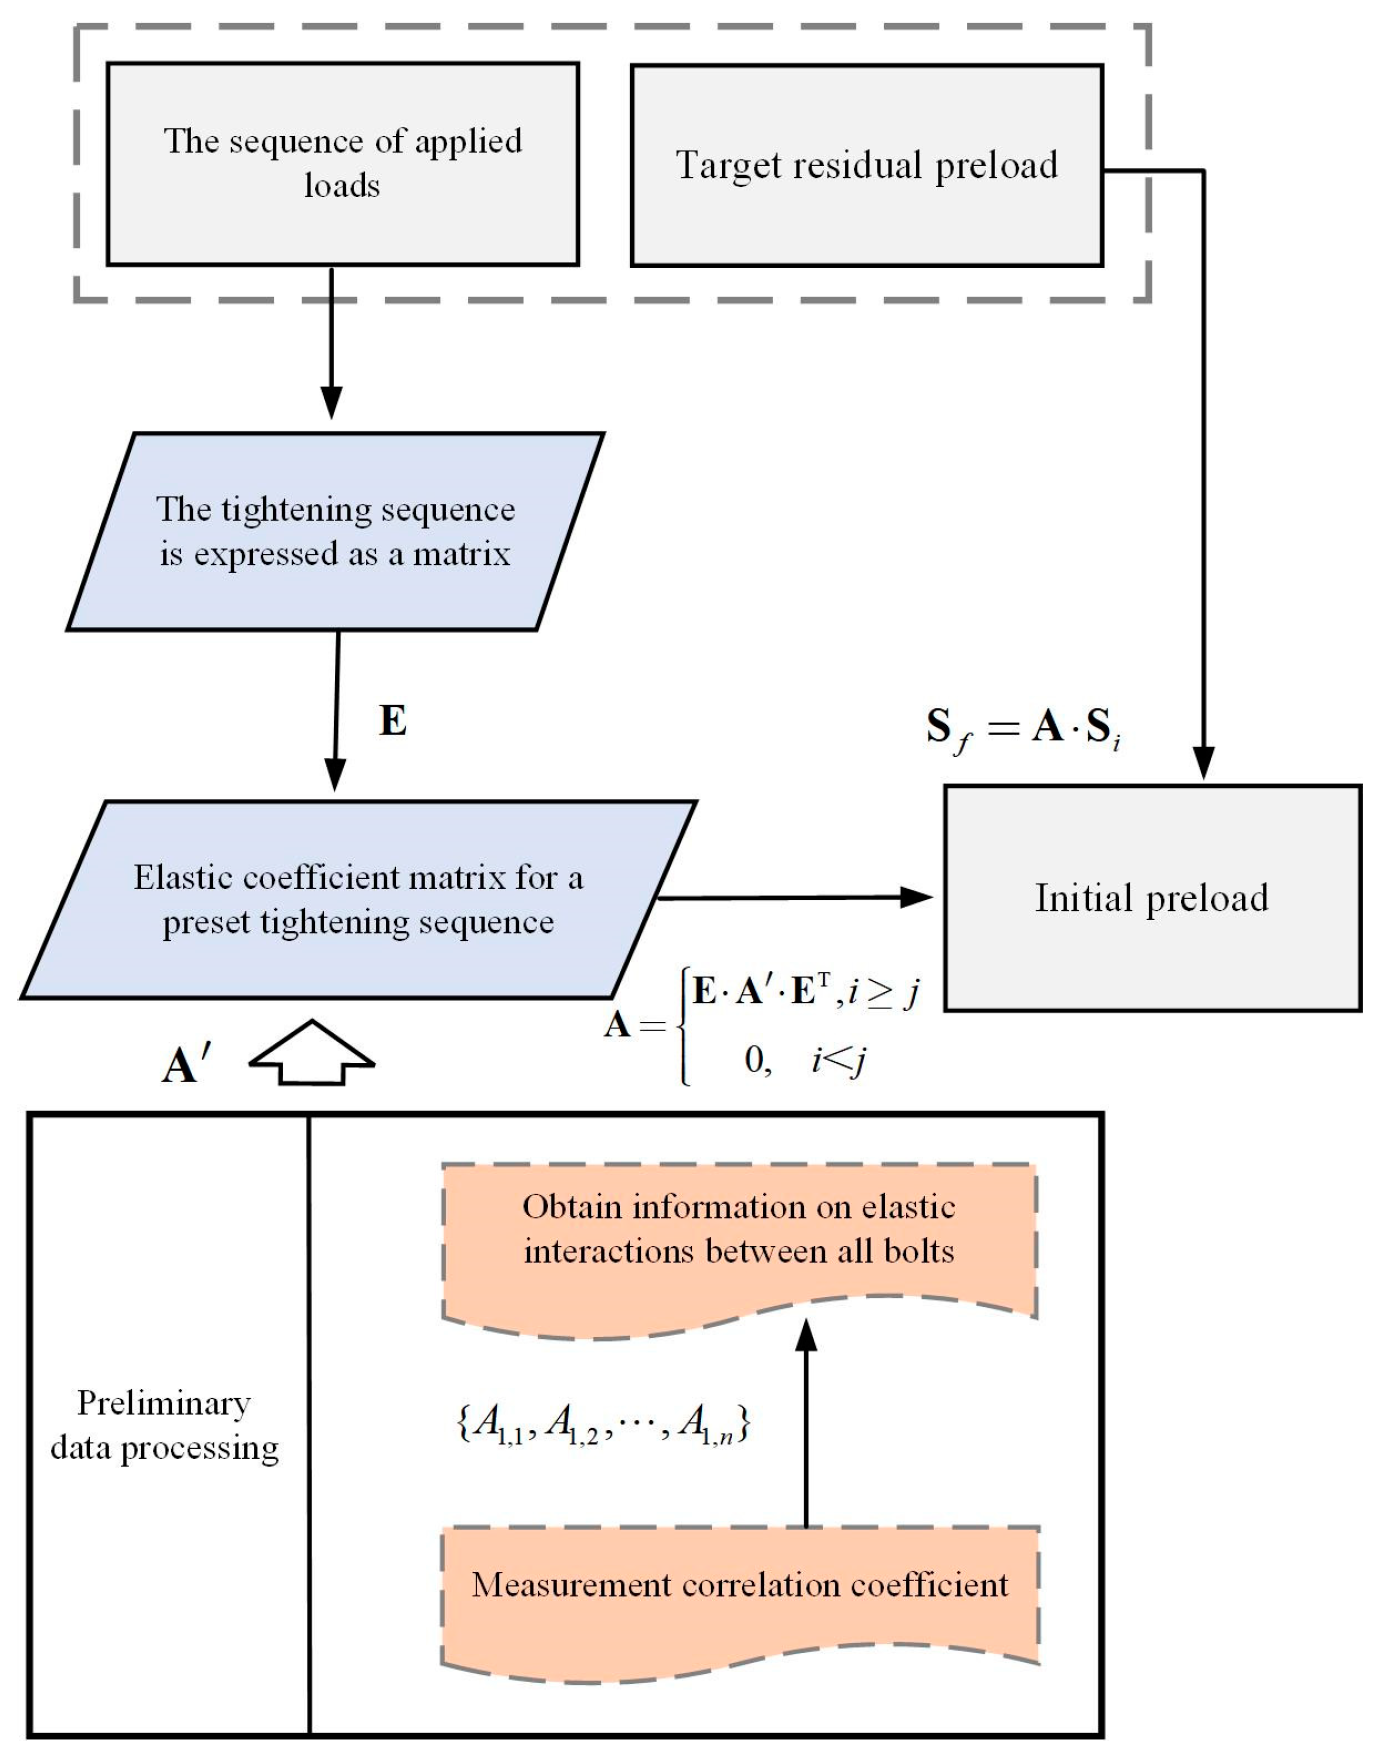
3.2. A Novel Single-Step Bolt Tightening Method for Multi-Bolt Flange Structures
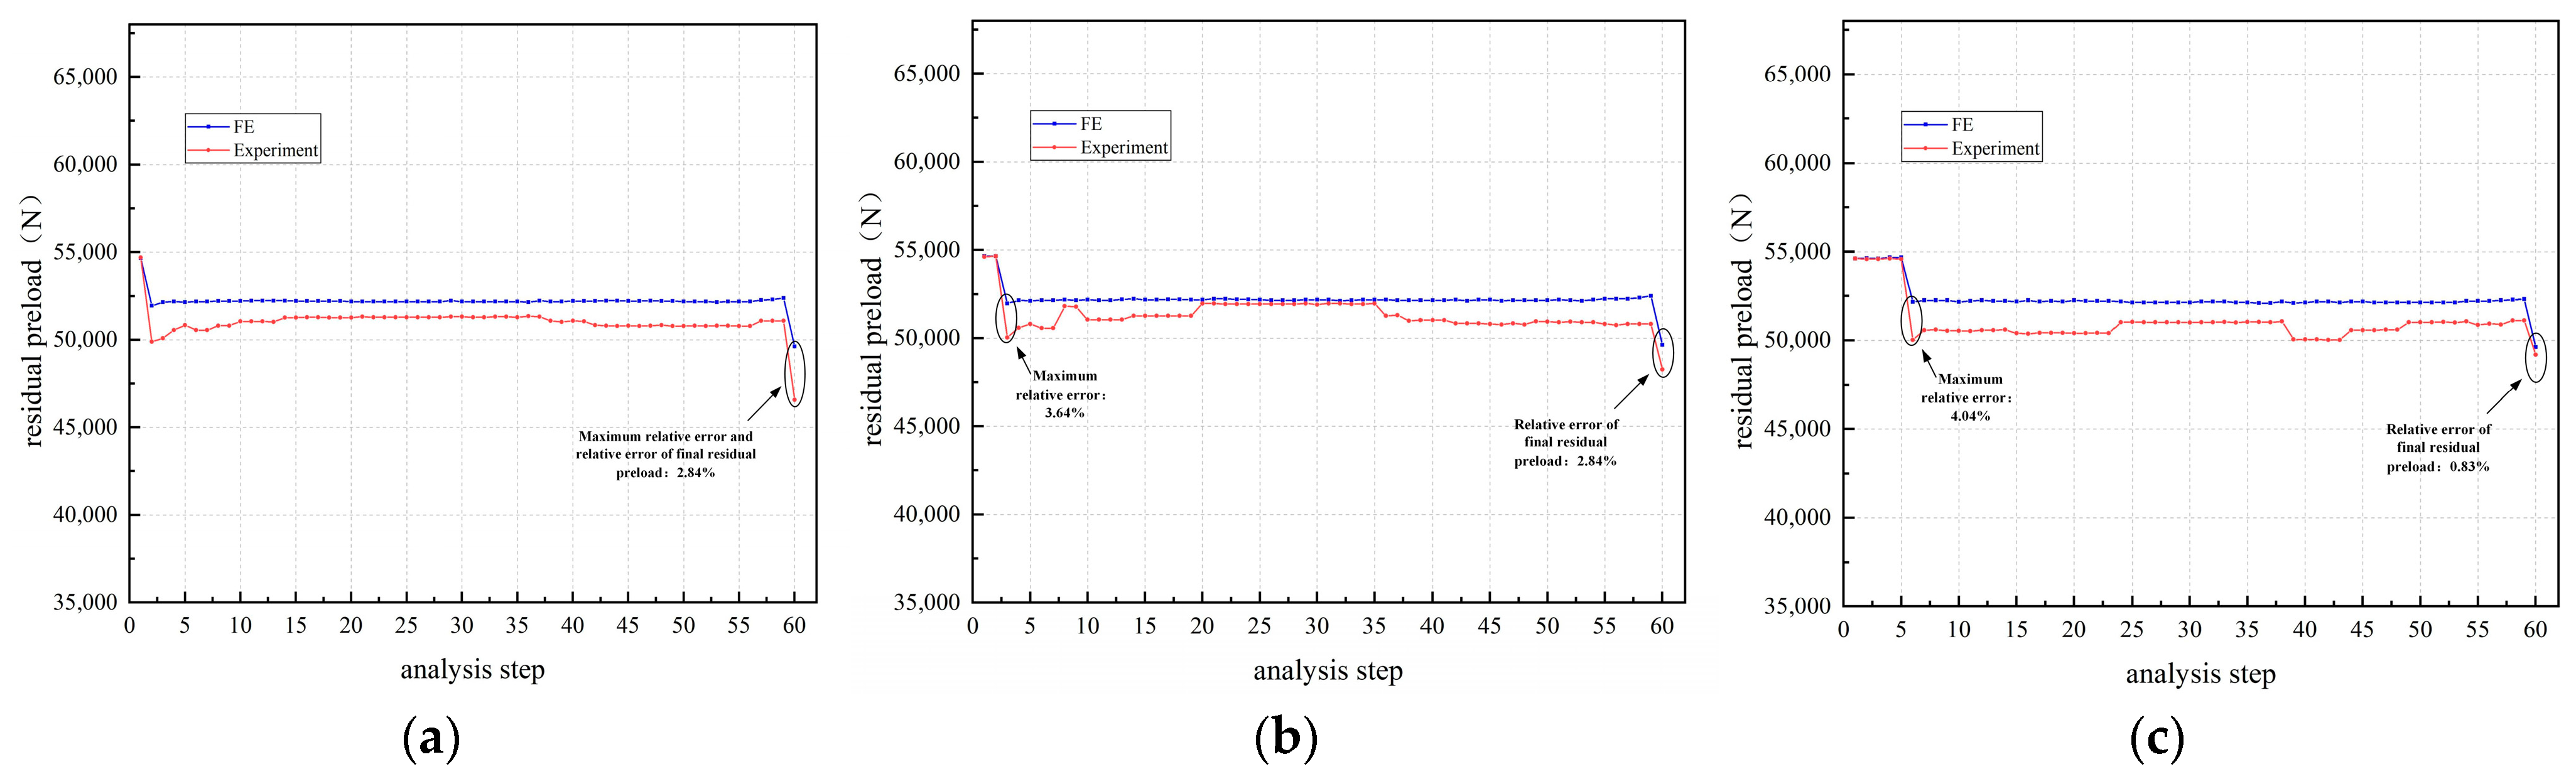
4. Experimental Validation
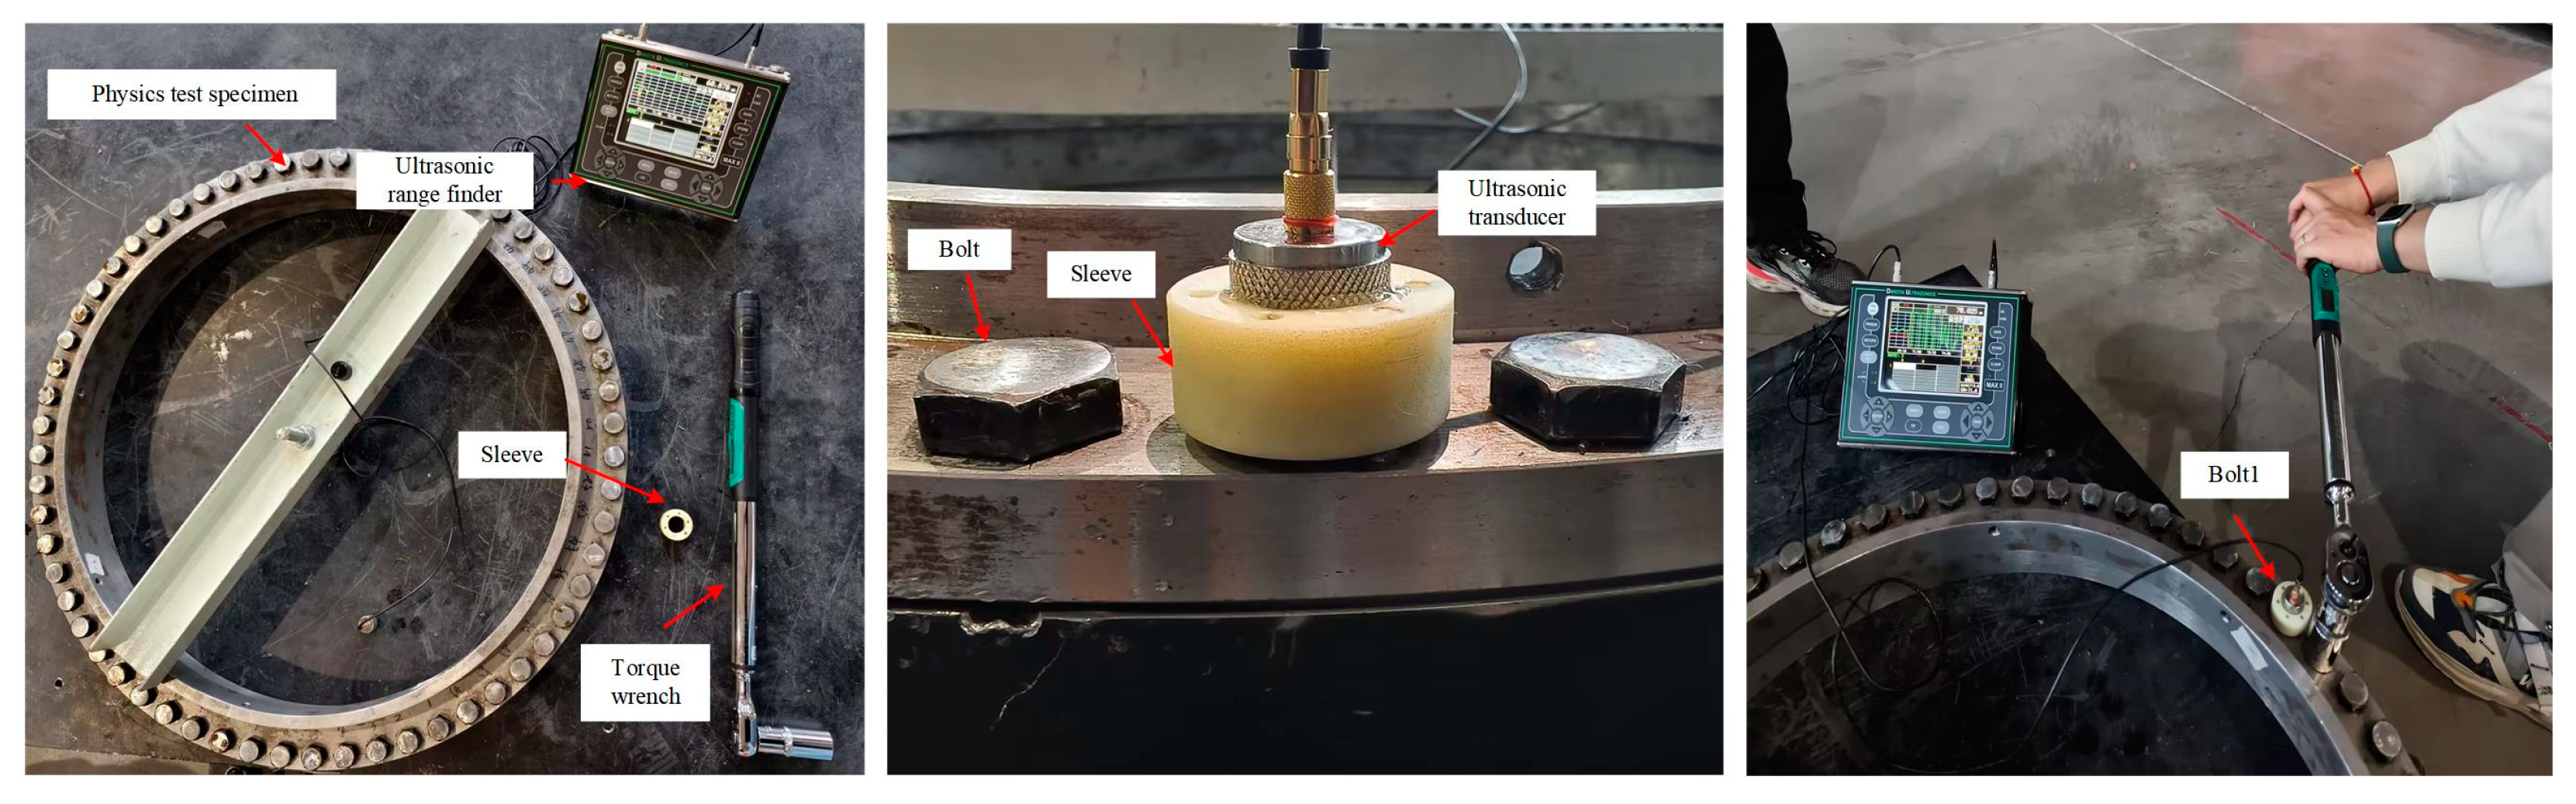
- Measure the initial length of each bolt.
- Tighten the 1st bolt and fix the probe on the 1st bolt, and then tighten the other bolts in sequence to obtain the change in preload force of the 1st bolt.
- After all the bolts are tightened, measure the change in the length of each bolt to obtain the residual preload force.
5. Numerical Examples
6. Conclusions
Author Contributions
Funding
Data Availability Statement
Conflicts of Interest
References
- Li, Z.; Zhao, Z.; Zhang, J.; Liu, C. A novel experimental method for bolt stress distribution during the assembly process. Structures 2024, 69, 107413. [Google Scholar] [CrossRef]
- Leray, D.; Vadean, A.; Daidie, A. Fast computation of preloaded bolted circular joint aiming at fatigue bolt sizing: Hypotheses and modeling. Eng. Comput. 2008, 25, 42–54. [Google Scholar] [CrossRef]
- Coria, I.; Martín, I.; Bouzid, A.H.; Heras, I.; Abasolo, M. Efficient assembly of bolted joints under external loads using numerical FEM. Int. J. Mech. Sci. 2018, 142, 575–582. [Google Scholar] [CrossRef]
- Li, H.; Wu, H.; Zhao, J.; Sun, H.; Sun, W.; Wang, Q.; Wang, X. Theoretical and experimental investigations of vibration and damping behaviors of carbon fiber-reinforced composite thin shells with partial bolt looseness constraints. Eur. J. Mech.-A/Solids 2023, 97, 104839. [Google Scholar] [CrossRef]
- Kumakura, S.; Saito, K. Tightening sequence for bolted flange joint assembly. In Proceedings of the ASME Pressure Vessels and Piping Conference, Cleveland, OH, USA, 20–24 July 2003; Volume 16982, pp. 9–16. [Google Scholar]
- Rakotondrainibe, L.; Allaire, G.; Orval, P. Topological sensitivity analysis with respect to a small idealized bolt. Eng. Comput. 2022, 39, 115–146. [Google Scholar] [CrossRef]
- Jiang, K.; Liang, Y.; Zhao, O. Machine-learning-based design of high strength steel bolted connections. Thin-Walled Struct. 2022, 179, 109575. [Google Scholar] [CrossRef]
- Mao, J.; Fang, K.; Jia, H.; Wang, Q.; Li, S.; Qian, W.; Xiong, F.; Peng, W. Mechanism and control of preload force loss of precast structural joint bolts under freeze–Thaw environments. Cold Reg. Sci. Technol. 2024, 221, 104176. [Google Scholar] [CrossRef]
- Zheng, M.; Li, Y.; Wang, C.; Bai, J.; Wang, L.; Liu, Z.; Wahab, M.A. Prediction of contact stress in bolted joints using the Polynomial Chaos-Kriging model. Eng. Fail. Anal. 2023, 154, 107646. [Google Scholar] [CrossRef]
- Coria, I.; Abasolo, M.; Aguirrebeitia, J.; Heras, I. Study of bolt load scatter due to tightening sequence. Int. J. Press. Vessel. Pip. 2020, 182, 104054. [Google Scholar] [CrossRef]
- Bausman, A.R.; Waterland, A.F.J. A Process to Consider Practical Applications of Alternative Assembly Procedures of ASME PCC-1. In Proceedings of the Pressure Vessels and Piping Conference, Bellevue, WA, USA, 18–22 July 2010; Volume 49217, pp. 13–20. [Google Scholar]
- Bibel, G.D.; Ezell, R.M. An improved flange bolt-up procedure using experimentally determined elastic interaction coefficients. J. Press. Vessel. Technol. 1992, 114, 405–410. [Google Scholar] [CrossRef]
- Bickford, J.H. Handbook of Bolts and Bolted Joints; Marcel Dekker: New York, NY, USA, 1998. [Google Scholar]
- Coria, I.; Martín, I.; Bouzid, H.; Heras, I.; Aguirrebeitia, J. Optimized bolt tightening sequences in bolted joints using superelement FE modeling technique. In Proceedings of the International Conference on Offshore Mechanics and Arctic Engineering, Madrid, Spain, 17–22 June 2018; American Society of Mechanical Engineers: New York, NY, USA, 2018. V001T01A007. [Google Scholar]
- Pan, W.; Li, X.; Sun, L.; Song, H.; Wang, M. General prediction model of residual pretightening force of bolt group with one-step and multi-step pretightening and analysis of influencing factors from the perspective of elastic interaction. Eng. Comput. 2023, 40, 921–956. [Google Scholar] [CrossRef]
- Coria, I.; Abasolo, M.; Olaskoaga, I.; Etxezarreta, A.; Aguirrebeitia, J. A new methodology for the optimization of bolt tightening sequences for ring type joints. Ocean. Eng. 2017, 129, 441–450. [Google Scholar] [CrossRef]
- Liu, S.; Chu, J.; Wang, Y. Research on Prediction Method of Bolt Tightening for Aviation Components Based on Neural Network. Appl. Sci. 2023, 13, 6771. [Google Scholar] [CrossRef]
- Wang, Y.; Liu, Y.; Wang, J.; Zhang, J.; Zhu, X.; Xu, Z. Research on process planning method of aerospace engine bolt tightening based on digital twin. Machines 2022, 10, 1048. [Google Scholar] [CrossRef]
- Wang, Y.-Q.; Wu, J.K.; Liu, H.-B.; Kuang, K.; Cui, X.-W.; Han, L.-S. Analysis of elastic interaction stiffness and its effect on bolt preloading. Int. J. Mech. Sci. 2017, 130, 307–314. [Google Scholar] [CrossRef]
- Jiang, K.; Liu, Z.; Yang, C.; Zhang, C.; Tian, Y.; Zhang, T. Effects of the joint surface considering asperity interaction on the bolted joint performance in the bolt tightening process. Tribol. Int. 2022, 167, 107408. [Google Scholar] [CrossRef]
- Li, Y.; Liu, Z.; Wang, Y.; Cai, L.; Xu, W. Research on preload of bolted joints tightening sequence-related relaxation considering elastic interaction between bolts. J. Constr. Steel Res. 2019, 160, 45–53. [Google Scholar] [CrossRef]
- Nassar, S.A.; Wu, Z.; Yang, X. Achieving uniform clamp load in gasketed bolted joints using a nonlinear finite element model. J. Press. Vessel. Technol. 2010, 132, 041205. [Google Scholar] [CrossRef]
- Krishna, M.M.; Shunmugam, M.S.; Prasad, N.S. A study on the sealing performance of bolted flange joints with gaskets using finite element analysis. Int. J. Press. Vessel. Pip. 2007, 84, 349–357. [Google Scholar] [CrossRef]
- Nassar, S.A.; Alkelani, A.A. Clamp load loss due to elastic interaction and gasket creep relaxation in bolted joints. J. Press. Vessel. Technol. 2006, 128, 394–401. [Google Scholar] [CrossRef]
- Abasolo, M.; Aguirrebeitia, J.; Avilés, R.; Fernández de Bustos, I. A tetraparametric metamodel for the analysis and design of bolting sequences for wind generator flanges. J. Press. Vessel. Technol. 2011, 133, 041202. [Google Scholar] [CrossRef]
- Pedersen, N.L.; Pedersen, P. Stiffness analysis and improvement of bolt-plate contact assemblies. Mech. Based Des. Struct. Mach. 2008, 36, 47–66. [Google Scholar] [CrossRef]
- Luo, W.; Feng, P.; Zhang, J.; Ren, Y.; Yu, D.; Wu, Z. Research on a radiation model for bolt-tightening force attenuation of wheel-type parts. IEEE Access 2019, 7, 157459–157470. [Google Scholar] [CrossRef]
- Zhu, L.; Hong, J.; Jiang, X. On controlling preload and estimating anti-loosening performance in threaded fasteners based on accurate contact modeling. Tribol. Int. 2016, 95, 181–191. [Google Scholar] [CrossRef]
- Yang, H.; Xia, H.; Zhu, L.; Li, X.; Du, C.; Liu, J.; Ao, X.; Li, D. Measurement and assembly methods for bolted flange joints using three-dimensional digital image correlation. Int. J. Press. Vessel. Pip. 2024, 208, 105136. [Google Scholar] [CrossRef]


| EICM | TAM | The Proposed Method | |
|---|---|---|---|
| the number of bolts | n | 5 | 9 |
| the number of parameters | n(n − 1)/2 | 4 | 8 |
| α | β | γ | δ |
|---|---|---|---|
| −0.0499 | −0.0503 | 0.0032 | 0.0039 |
| A1,2 | A1,3 | A1,4 | A1,5 | A1,57 | A1,58 | A1,59 | A1,60 |
|---|---|---|---|---|---|---|---|
| −0.0499 | 0.0039 | 0.0007 | 0.0001 | 0.0003 | 0.0012 | 0.0007 | −0.0499 |
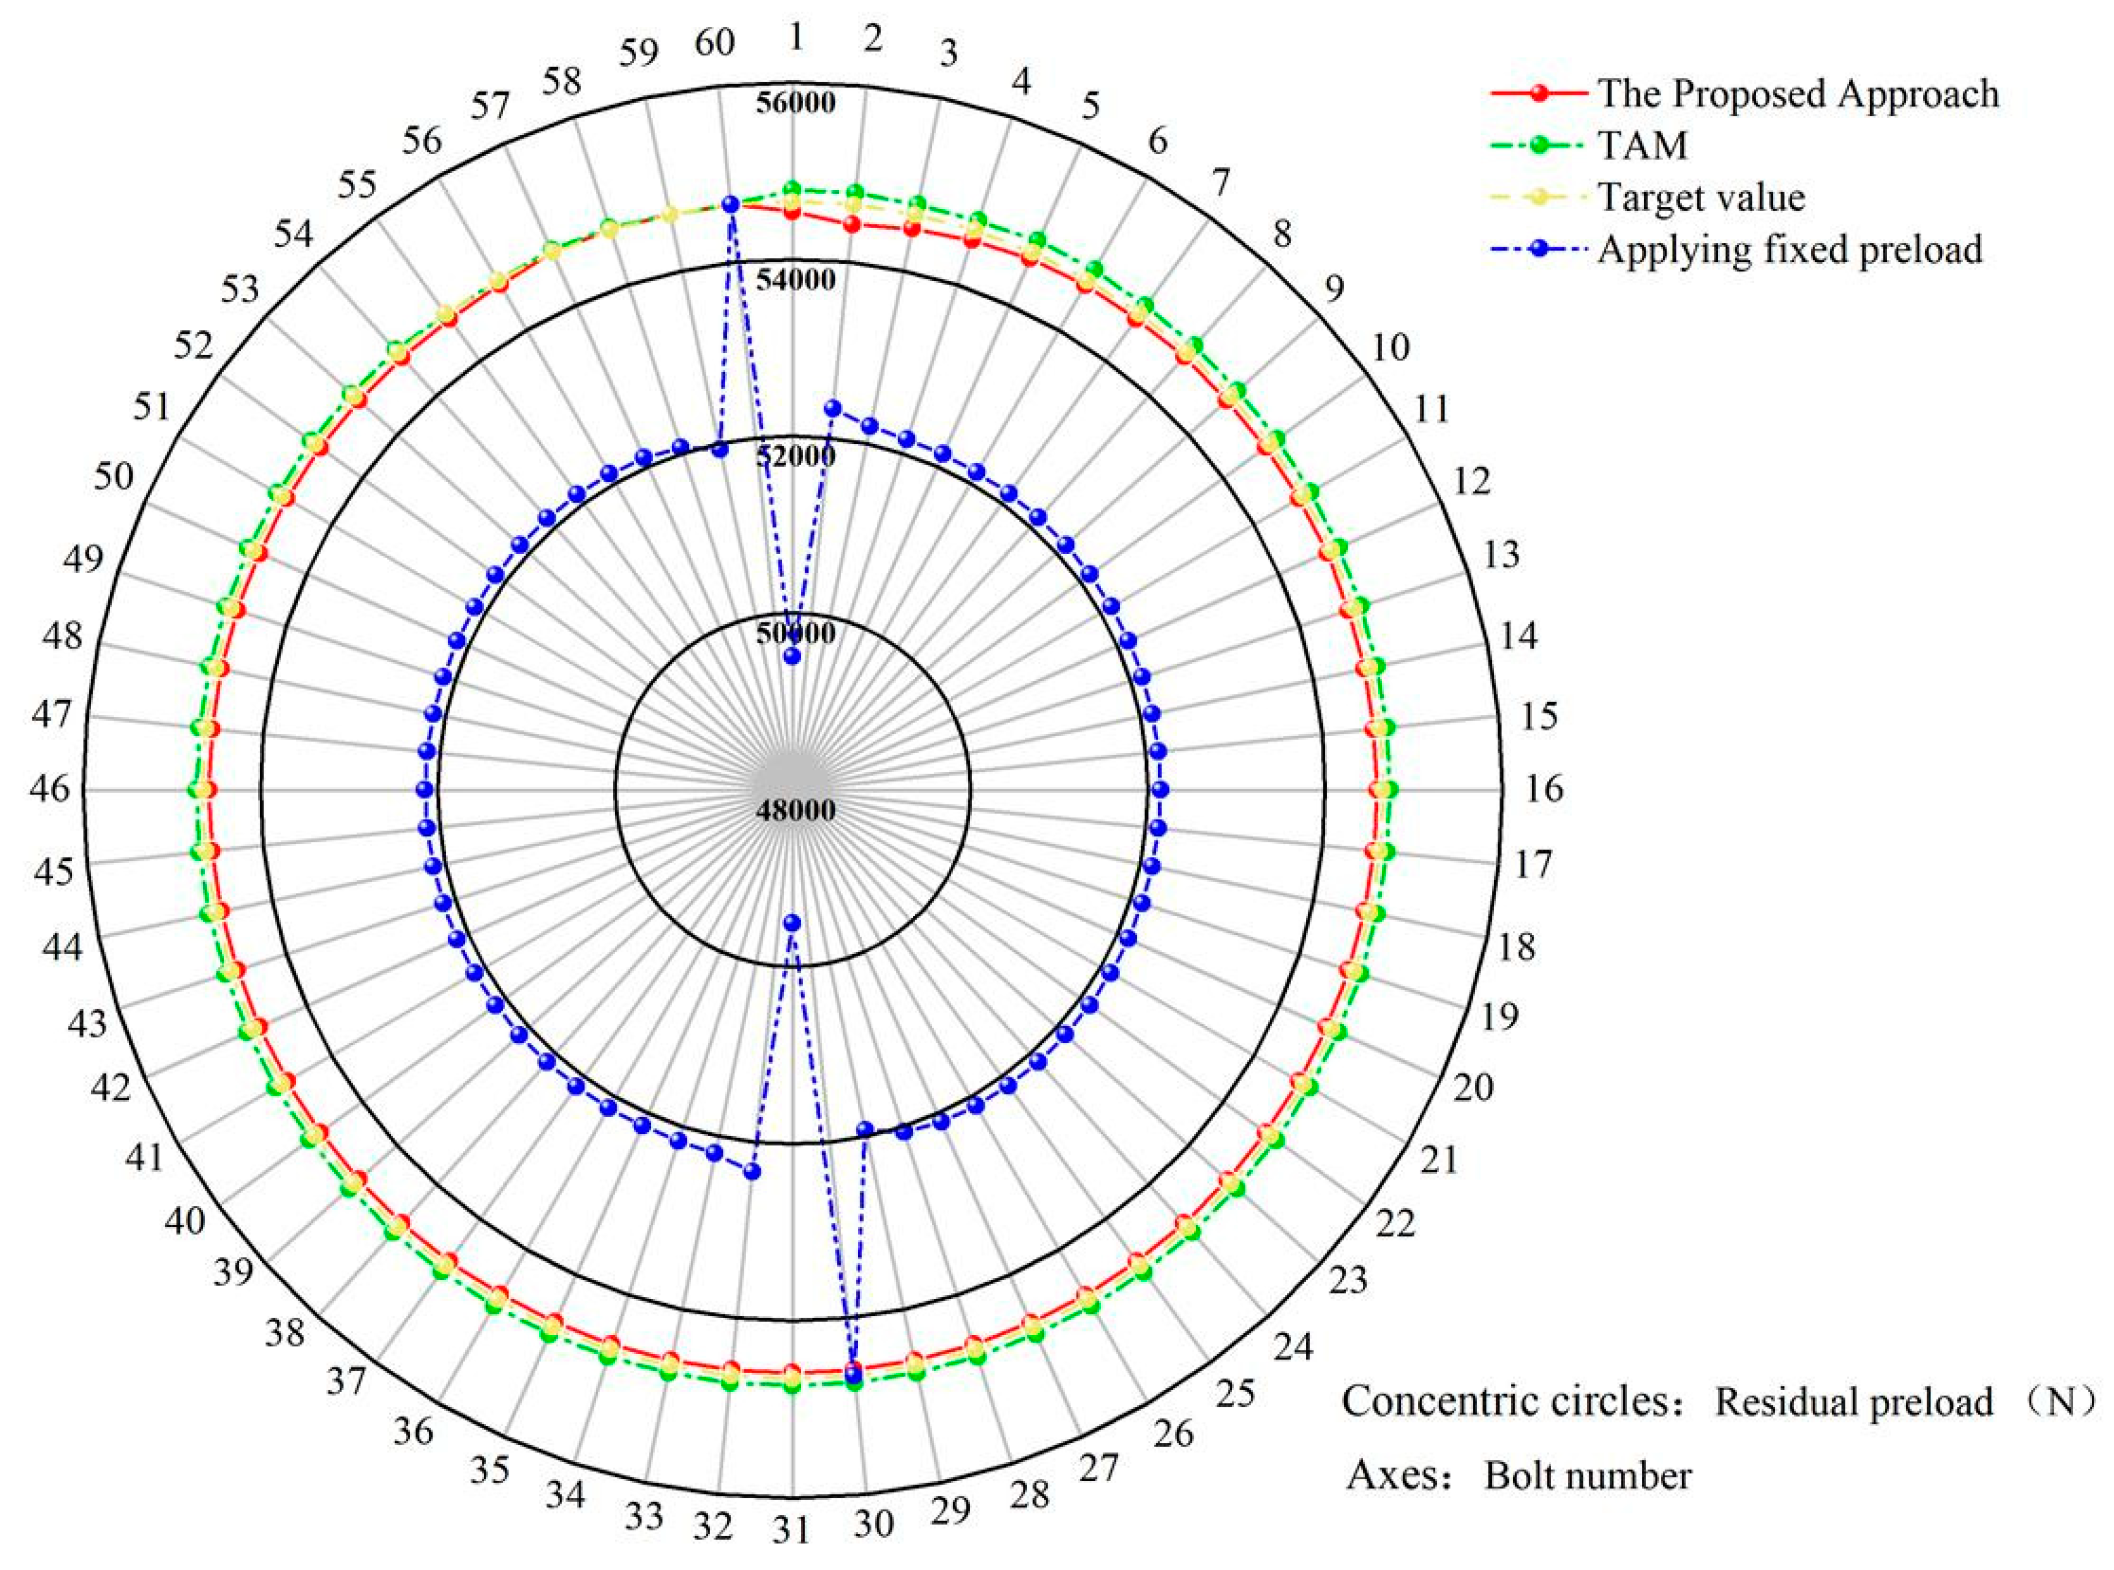
| Clockwise Sequential Tightening | Diagonal Pattern Tightening | Five-Points Star Pattern Tightening | |||||||
|---|---|---|---|---|---|---|---|---|---|
| MRE | SD | Average Residual Preload | MRE | SD | Average Residual Preload | MRE | SD | Average Residual Preload | |
| applying fixed preload | 4.53% | 466.07 | 52,174.6 | 4.60% | 672.14 | 52,179.3 | 4.62% | 1077.55 | 52,182.5 |
| TAM | 0.168% | 32.73 | 54,743.9 | 0.136% | 29.13 | 54,726.4 | 0.64% | 876.82 | 54,718.2 |
| the proposed method | 0.037% | 7.54 | 54,622.7 | 0.152% | 31.69 | 54,584.2 | 0.132% | 55.30 | 54,581.0 |
Disclaimer/Publisher’s Note: The statements, opinions and data contained in all publications are solely those of the individual author(s) and contributor(s) and not of MDPI and/or the editor(s). MDPI and/or the editor(s) disclaim responsibility for any injury to people or property resulting from any ideas, methods, instructions or products referred to in the content. |
© 2024 by the authors. Licensee MDPI, Basel, Switzerland. This article is an open access article distributed under the terms and conditions of the Creative Commons Attribution (CC BY) license (https://creativecommons.org/licenses/by/4.0/).
Share and Cite
Zhong, J.; Bao, J.; Wang, J.; Xu, Z.; Yang, M.; Shi, Y. A New Single-Step Bolt Tightening Method for Multi-Bolt Flange Structures. Buildings 2025, 15, 2. https://doi.org/10.3390/buildings15010002
Zhong J, Bao J, Wang J, Xu Z, Yang M, Shi Y. A New Single-Step Bolt Tightening Method for Multi-Bolt Flange Structures. Buildings. 2025; 15(1):2. https://doi.org/10.3390/buildings15010002
Chicago/Turabian StyleZhong, Jiacheng, Jianwen Bao, Junyi Wang, Zhigang Xu, Mingyi Yang, and Yanjie Shi. 2025. "A New Single-Step Bolt Tightening Method for Multi-Bolt Flange Structures" Buildings 15, no. 1: 2. https://doi.org/10.3390/buildings15010002
APA StyleZhong, J., Bao, J., Wang, J., Xu, Z., Yang, M., & Shi, Y. (2025). A New Single-Step Bolt Tightening Method for Multi-Bolt Flange Structures. Buildings, 15(1), 2. https://doi.org/10.3390/buildings15010002