Abstract
This study discusses the effectiveness of T-beams reinforced with steel fibers and 600 MPa longitudinal reinforcements on negative flexural responses based on experimental and finite element analysis (FEA) methods. Four T-beams reinforced with 400 MPa or 600 MPa reinforcements were manufactured and inversely loaded. Two of the beams were fabricated with 0.75% (by volume) steel fibers as per JGJ/T465-2019, while the rest were cast following the same design but without steel fibers for comparison. The failure modes, the cracking moment and width, and the stress of the longitudinal reinforcements and concrete were compared between the four tested T-beams. In particular, deflection–load curves indicated the improved flexural ability of the specimens with steel fibers and high-yield steel bars. Models of T-beams with longitudinal reinforcements measuring 6, 8, and 12 mm in diameter were simulated and compared with the results of validated models. The FEA results further demonstrate the better flexural performance of T-beams reinforced with steel fibers and longitudinal reinforcements. Both materials can increase the overall performance of inverted steel fiber-reinforced concrete T-beams, including cracking load, crack width, ultimate load, and deflection. However, the findings showed that different diameters of longitudinal reinforcements generated different levels of effectiveness.
1. Introduction
High-strength concrete is widely used in the civil engineering field, particularly in the construction of skyscrapers and bridges [1,2]. However, owing to its low energy absorption capacity and brittleness, its application in structures subjected to extreme loadings under flexure, shear, and torsion has been limited thus far [3,4,5]. To overcome this drawback, a promising solution for improving the mechanical performance of concrete is to employ steel fiber-reinforced concrete (SFRC). To ensure the required performance of SFRC, the steel fibers should be pulled out of the matrix instead of being pulled apart when SFRC fails. Therefore, the higher cracking moment, tensile strength, and toughening effect of SFRC mainly depend on the bonding strength between the steel fibers and the matrix [6]. The bonding performance mainly depends on the type, surface shape, length, diameter (or equivalent diameter), length-to-diameter ratio, and volume fraction of the steel fibers [7]. Experimental investigations have proven that a suitable amount of steel fiber added to the concrete matrix significantly improves the flexural and shear strengths and ductility of steel fiber-reinforced concrete (SFRC) flexural members [8,9]. Several codes for SFRC structures and guidelines have already been published in different countries, such as JG/T 472-2015 in China and ACI 318-14 in the United States [10,11]. As is widely accepted, for the same reinforced concrete structure, the higher the strength grade of steel bars and concrete materials, the smaller the volume of structural members. The reduction in cross-section has many advantages, such as reducing dead weight, saving materials, reducing project costs, and speeding up construction [12]. At present, the construction industry in most developed countries uses 500 MPa strength steel bars; however, a number of countries, such as Russia and the United States, have begun to use 600 MPa high-strength steel bars as load-bearing steel bars for concrete structures [13]. China has also formulated technical specifications for the application of 600 MPa hot-rolled ribbed high-strength steel bars [14], which provide application rules and principles on design, but do not introduce procedures and guidance to assist engineers.
Many experiments have been carried out and samples fabricated around the world, and the results indicated that SFRC has more beneficial properties than normal concrete [8,9,15,16]. In addition, the use of SFRC is progressively growing in civil engineering constructions [15,17], which will further boost the application of this material. In China, Mingke et al. cast a whole frame construction with SFRC and tested it under an artificial earthquake simulation. The experimental result demonstrated that the earthquake resistance capability was significantly improved [18]. These structures can also be subjected to cyclic loads under shear and flexure and are expected to resist millions of cycles during their service life [19]. Folino et al. analyzed the mechanical and failure behaviors of full-scale SFRC beams in their research. It was observed that the steel fibers in the experiment improved the overall structural performance of the beam after peak value. The experiments proved that the current industry’s prediction of the performance of SFRC beams does not have enough safety reserves for bending resistance and underestimates its impact on shear resistance [20]. Furthermore, Barcelo et al. carried out a test of SFRC T-beams with a wide flange. The researchers prepared 13 T-beams in the experiment, using single and double stirrups with a diameter of 10 mm, and concluded that adding appropriate amounts of steel fiber into such beams can improve the longitudinal shear capacity at the beam flange [21]. Saber et al. studied the flexural performance of bilayer SFRC beams. Their experiments showed that adding a certain amount of steel fiber to concrete can significantly improve post-peak performance, including the flexural strength, flexural stiffness, toughness, and fracture energy of concrete beams. Moreover, the researchers found that the improvements in the performance of bilayer SFRC beams were not as significant as those of one-layer beams with the same fiber content [22]. Muna et al. found that steel fibers have a significant impact on the flexural, tensile, and compressive strength of concrete beams according to investigations into the torsional performance of beams reinforced with different volumes of steel fiber. Furthermore, a volume content of 1.0% steel fibers can fully compensate for the decreased torsional strength in beams due to the absence of stirrups [23]. The advantages of this newly developed concrete have already been identified by many civil engineers and researchers [18,19,24].
The 600 MPa strength steel rebar, as a new construction steel, is already used for reinforcement in concrete elements and several kinds of buildings. The ultimate capacity and energy dissipation are improved and the sectional dimension is decreased in concrete elements reinforced with the material [13]. There are several economic and environmental benefits to the use of this new type of higher-grade steel rebar [25]. Therefore, many countries attach great importance to the research and development of basic building materials and have made significant achievements [26]. In Tan et al.’s research, it was found that the failure characteristics and bond stress distribution of the bonded anchorage of 600 MPa grade steel bars are similar to those of ordinary steel bars, and the anchoring performance is also good [25]. A flexural performance test of four concrete beams reinforced with 600 MPa steel bars and one reinforced with 400 MPa steel bars under concentrated load was carried out by Chen et al. The researchers mainly studied the flexural bearing capacity, failure mode, cracking, and deflection [13]. The test results were compared with the calculated value of the formulas in the concrete code [12]. It was noted that the failure mode of beams with 600 MPa steel bars was the same as that of common RC flexural members, and the formulas in the concrete code were shown to be suitable for calculating normal section flexural strength and maximum crack width in the serviceability limit state. However, the measured values of deflection in this state were higher than those calculated with the formulas in the concrete code. The authors suggested that it should be multiplied by an amplification coefficient to correct the calculated results. Based on analyzing the research results in recent years, it was found that the 600 MPa grade steel bar was reinforced in the concrete beam to significantly improve the flexural capacity of the beam, and the damage characteristics of the beam were better. Compared with the ordinary steel bar, the 600 MPa grade steel bar can significantly improve the bearing capacity, ductility, and energy consumption capacity of the beams [13,25,26].
In RC frame construction, the floors and beams are cast together, and most RC beams are calculated according to T-beams since parts of the floors are considered beam flanges [27]. For concrete beams with a large load and span, the calculated internal force value is considerably higher [28]. If the longitudinal reinforcements adopt 600 MPa high-strength reinforcement, and the tensile strength is fully utilized, the flexural capability of the members can be significantly increased. Nevertheless, shear or torsional strength cannot be significantly improved with high-strength bars alone. SFRC mainly increases shear and torsional capacity and the cracking moment of elements [6,7,8,23]. These materials can increase the overall performance of members, including the different aspects mentioned above, if jointly employed in concrete beams under complex loadings. These comprehensive effects will be beneficial for improving seismic performance, thus prolonging the service life of buildings or components in the future. This approach will provide more design considerations for engineers in the field of civil engineering, such as reducing the number of reinforcements required, lowering project costs, improving the economic benefits of the construction project, and reducing resources and energy consumption. This will bring further benefits related to the economy, ecology, and sustainability in the construction field. However, in the literature, research on the negative mechanical performance of SFRC beams reinforced with 600 MPa steel rebars is insufficient, especially regarding T-beams. Furthermore, the parts near the supports of continuous beams should bear negative moment, and the performance of T-beams could be improved with the addition of steel fibers since the flanges are in tensile zones. Therefore, investigating inverted SFRC T-beams reinforced with 600 MPa steel rebars is an urgent task. The study results will further accelerate the application of the two materials discussed. A summary of the experimental setup and the conclusions of the experiment and FEA are presented in this work.
2. Experimental Program
2.1. Specimen Parameters
As illustrated in Figure 1, four T-beams were constructed, measuring 1200 mm in length with a total height of 300 mm; the web width was 120 mm, and the flange width and depth were 300 mm and 80 mm, respectively. The steel cages included 2 Ø14 mm longitudinal reinforcements (2D600/C14), stirrups, and compressive steel bars. The stirrups were spaced at 100 mm, each with a diameter of 8 mm (C8@100). The compressive steel bars consisted of 4 Ø10 mm with a distance of 80 mm (4C10). In addition, the distributed reinforcements in the flange were Ø8 mm and spaced at 100 mm (C8@100) or 170 mm (in the constant moment region). C and D refer to HRB400 and HRB600E steel bars (GB 50010-2010 and T/CCIAT 0016-2020). The T-beams are identified as combinations of capital letters and numbers (NF4N, NF4S, NF6N, NF6S), respectively, where NF refers to negative failure, 4 and 6 refer to 400 MPa and 600 MPa longitudinal reinforcements, and N and S refer to without steel fibers and with steel fibers. Eight steel bar gauges were glued onto the surfaces of the compressive reinforcements in the mid-span with a distance of 170 mm.
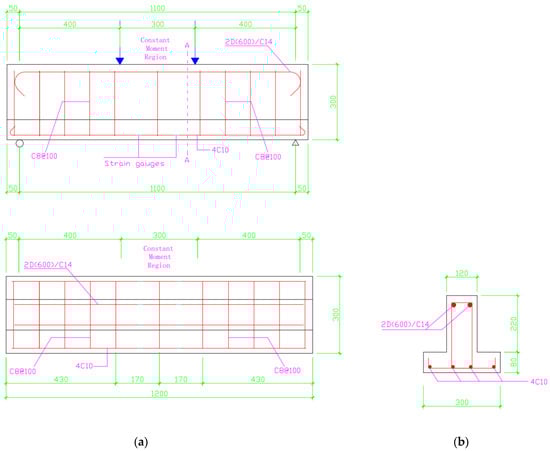
Figure 1.
Dimensions and reinforcements of tested beams for (a) inverted T-beam and (b) A-A ross-section.
According to the relevant Chinese specifications for high-strength steel bars, when the diameter of a steel bar is less than 28 mm, the diameter in the arc shall not be less than 6 times the diameter of the bar. When it is located at the side or corner of the member section, the anchor head shall be bent inwards to prevent the protective layer of concrete from expanding and cracking due to the expanding kinked force [14]. Therefore, the diameter in the arc was 80 mm according to the specification requirements, as illustrated in Figure 1. The concrete cover was 30 mm, which followed the “Standard for design of steel fiber reinforced concrete structures” and the “Code for design of concrete structures” of the Chinese code [6,12].
2.2. Experimental Setup
The tests were performed on a hydraulic pressure testing machine through the force control based on [29]. Four-point flexural loads were applied to the T-beams in the material laboratory of Xi’an Siyuan University, as illustrated in Figure 2. The T-beams were turned upside down when they were arranged on the bearings for testing the behaviors of negative moment. Therefore, the web was in the compression zone and the flange was in the tensile zone. The distance between the loading points in the mid-span of the beams was 300 mm.
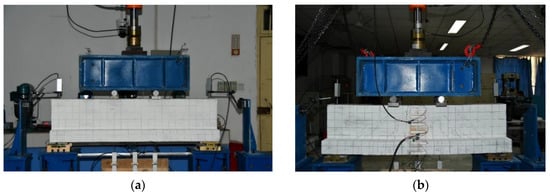
Figure 2.
Inverted T-beam bending test setup. (a) front view (b) back view.
One end of the loaded T-beam adopted the pinned support, and the other end adopted the roller support. The length of the pinned support was determined according to the width of the T-beam at the support. The support setting only provided the vertical reaction perpendicular to the span direction. The pinned support limited the displacement of the test sample in the span direction but did not limit the rotation of the test sample at the support. The roller support did not affect the deformation and displacement of the test sample in the span direction and the rotation at the bearing. There were two steel plates with dimensions of 200 × 60 × 30 mm3 on the top of the T-beam web. Two Ø40 mm steel bars were arranged between the spread beam and steel plates. The width of the steel backing plate was consistent with the width of the T-beam web, and the width–thickness ratio was not less than 1/6, according to the specifications. The diameter of the steel roller was determined according to the load per unit length of the supports. The area and thickness of the steel backing plate were determined by calculating the stiffness of the backing plate and the local bearing capacity of the concrete. The steel backing plate was fixed with smoothed dry sand on the surface of the T-beams to ensure that the specimen was supported stably and stressed uniformly during loading [29]. All setup and loading procedures including preload, logger, increment of load, and method of recording data were the same as those used in the normal flexural failure experiment.
2.3. Properties of Materials
The mixture proportions in this experiment are listed in Table 1 and were designed based on [10]. The cement was ordinary Portland cement 42.5 R, and the diameter range of the coarse aggregate was 15~25 mm. All specimens and samples were fabricated in the open air outside of the laboratory, as these conditions are similar to those in practical construction. Different amounts of antifreeze were added to mixtures since the curing temperature was lower than the cured standard. The properties of the hooked-end steel fiber are shown in Table 2, which are cited from the test certificate. Twelve concrete and SFRC cube samples and three rectangular beams were cast and cured at the specimens’ fabricated site and time. Table 3 presents the properties of the concrete, including its compressive and tensile strength and elastic modulus. The properties of the steel bars were tested before the experiment and compared with certificates. The yield and ultimate strength of the 600 and 400 MPa bars were 675, 473 MPa and 861, 572 MPa, respectively.

Table 1.
Mixture proportions.
Table 2.
Properties of hooked-end steel fiber.
Table 3.
Properties of concrete.
3. Experimental Results and Discussion
3.1. Cracking and Failure Modes
All of the cracking patterns and failure modes of the inverted T-beams are presented in Figure 3. It was found that all of the T-beams failed under flexure, as per the theoretical prediction, as the concrete in the web crushed or the fracture of longitudinal reinforcements occurred. At the initial stage of loading, the concrete and steel bars in the T-beams were in the elastic stage; no cracks were observed at any point on the T-beams, while slight deflection in the mid-span was recorded by the displacement meters. With the progression of loading, very short hairline cracks formed in the concrete at the flanges of the T-beams, with widths of approximately 0.1~0.2 mm. The exact values of the cracking load were 50.0, 51.5, 51.4, and 59.6 kN for the NF4N, NF4S, NF6N, and NF6S beams, respectively; the data are tabulated in Table 4.
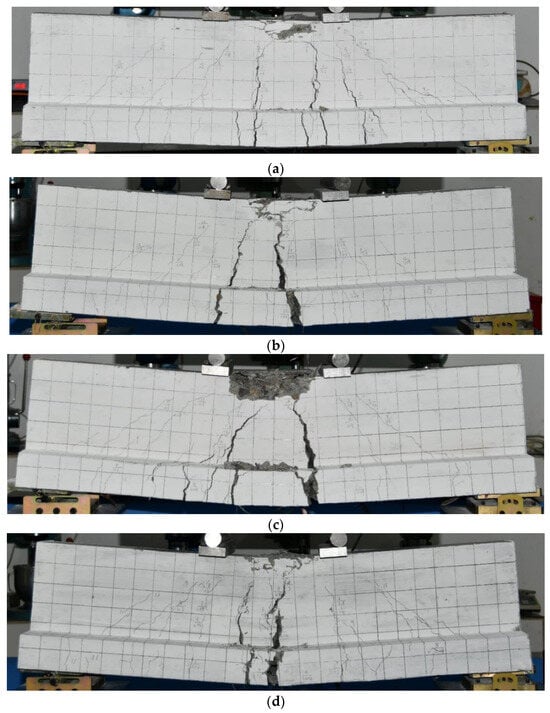
Figure 3.
Crack patterns of tested beams reinforced with 400 MPa or 600 MPa steel bars at failure. (a) NF4N, (b) NF4S, (c) NF6N, and (d) NF6S.
Table 4.
Experimental and FEA results.
Although the location and exact data of the cracking were random, the T-beams reinforced with steel fibers cracked slightly later and the cracks were thinner than for those without steel fibers. These findings were identical to those in previous studies that assessed rectangular beams [30]. In addition, almost all cracks were distributed between the bottom of the T-beams and the two loading points. Therefore, the cracks in the mid-span region were almost vertical and they were wider at the bottom. Diagonal cracks were distributed between the bearings and loading points, which formed later than the vertical cracks in the mid-span. As not with the vertical ones, these cracks did not widen with increasing load.
After the reinforcements yielded under the serviceability limit states, the concrete cracks on the surfaces of the T-beams reinforced with steel fibers were more numerous and shorter than those on the beams without steel fibers. Therefore, the crack spaces became smaller, as shown in Figure 3. This may be because the cracking moments and concrete tensile strength were improved by the addition of steel fibers into the T-beams.
With the increase in the strain of the longitudinal reinforcements in the T-beams, the deflection and width of the cracks increased more rapidly than in the first elastic stage. The cracks reached the concrete in the middle web and some horizontal cracks formed in the concrete’s compressive zones. The resistance loading kept increasing, while the velocity of the loading reduced more slowly than in the initial stage. Some small concrete blocks in the compressive zones of the T-beams without steel fibers began to spall (as seen in Figure 3c), which did not occur in those with steel fibers. With the increase in deflection, the SFRC in the compressive zone of the T-beams began to crush layer by layer, and the resistance loading was kept almost constant, which did not occur in those without steel fibers. Finally, all longitudinal reinforcements of the T-beams fractured abruptly with a clear and loud sound after the concrete was crushed to a certain level and the maximum width of the cracks reached more than 30 mm.
3.2. Load–Deflection Behavior
The applied loads vs. deflections in the mid-span of the four inverted T-beams are presented in Figure 4. It was noted that the negative flexural bearing capacities of the T-beams with steel fibers were more stable and higher than those of the T-beams without steel fibers. In addition, the maximum deflection of the SFRC T-beams was not significantly improved compared with ordinary concrete T-beams; for example, the deflection of the NF6S beam was slightly lower than that of the NF6N beam, which was unexpected. The bearing capacity of the T-beams reinforced with steel fibers did not decrease significantly during the loading processes, while the T-beams without steel fibers showed a significant reduction. In particular, the bearing capacity of the NF4N T-beam at the moment of steel bar fracture decreased by about 50 kN compared to that of the NF4S T-beam. In these experiments, the final failure of the T-beams was the fracture of the longitudinal reinforcements; therefore, the maximum deflection value of the SFRC T-beams reinforced with high-strength reinforcements did not improve significantly. This was likely due to the early fracture of the reinforcement in the T-beams since the mechanical properties of steel bars and concrete materials are sometimes random. During the loading test of the NF4N, NF4S, NF6N, and NF6S T-beams, the maximum resisting moment load values were 195.4, 201, 198.2, and 207.1 kN, respectively. Meanwhile, their maximum deflections were 30.7, 35, 35.9, and 33.9 mm, which are summarized in Table 4.
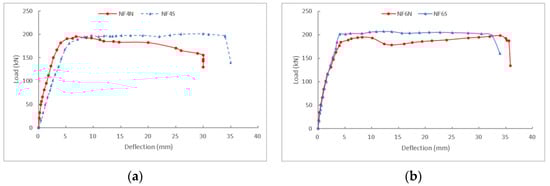
Figure 4.
Experimental load–deflection curves for (a) NF4N and NF4S, and (b) NF6N and NF6S.
3.3. Average Strain of Compressive Reinforcements
Figure 5 demonstrates the strain of the longitudinal reinforcements before the yielding stage. It was observed that the relationship between the strain before the yielding of the tensile reinforcements and the loadings of these two groups of T-beams was not significantly different. This phenomenon agrees with the theory, because the recorded strains were for 400 MPa steel bars with a diameter of 10 mm in the T-beams, and the bars with different ultimate strengths were in the compressive zone of the T-beams. From the curve data, it can be noted that under the same loads, the strains of the steel bars in the SFRC T-beams were lower than those of the ordinary concrete T-beams. This indicates that steel fibers play a certain role in concrete T-beams, such as delaying the development of cracks and reducing the crack width. This finding was identical to that of Doo et al.’s rectangular beam research [31,32]. This proved that the experimental data are reliable since SFRC bore much more tensile strength than NC.
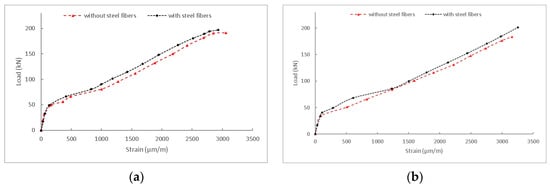
Figure 5.
Load–strain curves for (a) NF4N and NF4S, and (b) NF6N and NF6S.
4. Numerical Investigation
4.1. FE Modeling
All loading processes of the inverted T-beams were simulated with ABAQUS standard 6.14–1, and the detailed results are presented and discussed in the following paragraphs. The models were created based on the actual experiment as well as some parameters of concrete and steel rebars (presented in Figure 6 and Figure 7). During the whole modeling process, individual components were assembled into multiple components and then turned into a whole model using several commands in Abaqus such as MOVE, ROTATE, DUPLICATE the array, add geometric CONSTRAINT, and other operations.
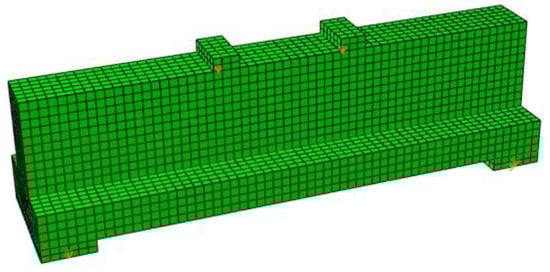
Figure 6.
Finite element model of torsional failure T-beam.
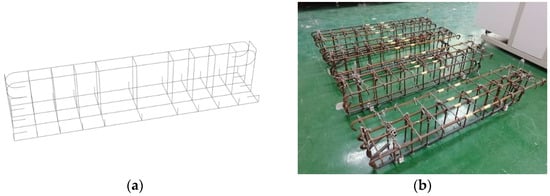
Figure 7.
Finite element models and reinforcement cages: (a) finite element model of steel bar in inverted bending failure T-beam and (b) steel cages in inverted bending failure T-beams.
Meanwhile, dynamic and explicit analysis steps were adopted, and the total number of analysis steps was 500. It was troublesome and time-consuming to create contact and constraint. The face with large stiffness and thick mesh was taken as the master face. Therefore, the steel backing plates were selected as the master surface and the beam as the slave surface. The “TIE” constraint (T1/B1/B2) was adopted between the bearing steel backing plates, loading steel backing plates, and concrete T-beam. According to the boundary conditions of the simply supported beam, the left pinned support degree of freedom was limited to U1, U2, U3 (Y, Z, and X axes), UR2, and UR3 (moments), and the right roller support was limited to U1, U2 (Y and Z axes), UR2, and UR3. The torsion effect was not considered in this analysis since a pure bending on the T-beam only needs to limit UR1.
4.2. FEA Validation
4.2.1. Stress Distributions and Deformed Shapes
The stress distributions and deformed shapes of the concrete and steel cages in the four inverted T-beams simulated with ABAQUS/standard 6.14-1 are presented in Figure 8, Figure 9, Figure 10 and Figure 11, respectively. It was observed that the total failure trends of the T-beams were almost the same individually, with the experimental results including concrete stress distributions, deflections, ultimate strength locations in the concrete, and cracks. As shown in Figure 8 and Figure 9, the maximum concrete compressive stress of the four T-beams was distributed near the inner areas of the steel backing plates in the mid-span of the web. The concrete stresses in the middle area of the web between the loading points and bearing supports were also higher, which was the shear stress distribution area. In addition, the mid-span of the flange, which was the concrete tension concentration area, showed that the stress was lower because the concrete in the tension area had already cracked. Therefore, the stress was lower than that of other areas, which was presented by the dark blue regions.
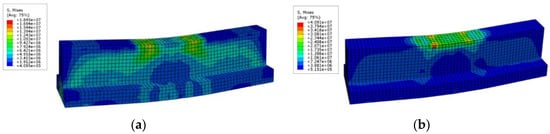
Figure 8.
Stress distributions in the concrete of T-beams reinforced with 400 MPa steel bars: (a) NF4N and (b) NF4S.
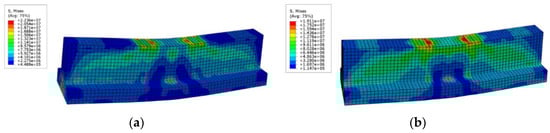
Figure 9.
Stress distributions in the concrete of T-beams reinforced with 600 MPa steel bars: (a) NF6N and (b) NF6S.
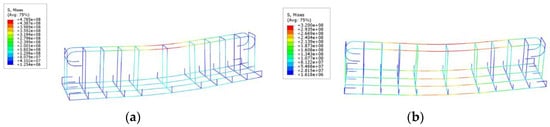
Figure 10.
Stress distributions in T-beams reinforced with 400 MPa steel bars: (a) NF4N and (b) NF4S.
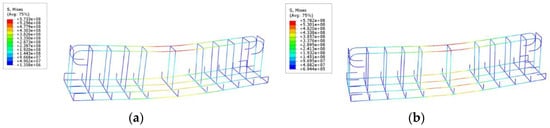
Figure 11.
Stress distributions in T-beams reinforced with 600 MPa steel bars: (a) NF6N and (b) NF6S.
Both the deformations and the locations of the maximum compressive and tension reinforcement stresses in the mid-span areas were in good agreement with the experimental results. However, the maximum stress values of the reinforcements were slightly different from those of the experiments and reinforcement strengths. This was mainly because the Abaqus software cannot successfully model the dowel action provided by the longitudinal reinforcements in the simulation process, which can only be compensated by increasing the concrete tensile stress. Otherwise, the models would be subjected to vertical shear failure in the loading process. Therefore, since the flexural bearing capacity of the NF4N beam (Figure 12a) was the lowest, the proportion of the total vertical shear force in the beam borne by the concrete tensile stress was higher than that of other beams. As a result, the maximum stress of the tensile reinforcements was the lowest, which was depicted by the blue-colored region of the steel reinforcement.
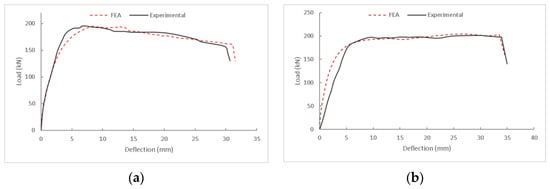
Figure 12.
Experimental and FEA load–deflection curves for T-beams reinforced with 400 MPa steel bars: (a) NF4N and (b) NF4S.
4.2.2. Comparisons between the Load–Deflection Curves
The comparisons between the load–deflection curves based on the experimental and numerical loading process results of the four inverted T-beams are presented in Figure 12 and Figure 13. Based on the comparison of two kinds of data and curves, it can be seen that the finite element software successfully simulated the loading process of inverted T-beams. For the two groups of T-beams without steel fibers, the data curves of the finite element analysis and the experiments were basically consistent at the initial stage. The results indicated that the theoretical data of the initial stiffness and material strength of these two groups of T-beams were very close to the actual experimental data. However, for two groups of SFRC T-beams with steel bars of different strengths, the two types of curves showed a certain degree of deviation at the initial stage. The loading values of the finite element data curves represented by the red dotted line were slightly higher than the experimental value curves represented by the black solid line at the initial stage. This phenomenon illustrated that the beam stiffness and material stress–strain relationship data in the experiment were lower slightly than the values inputted into the finite element software. This may be due to some small concrete cracks that had occurred as a result of concrete shrinkage or during the carrying and installation during the experimental setup.
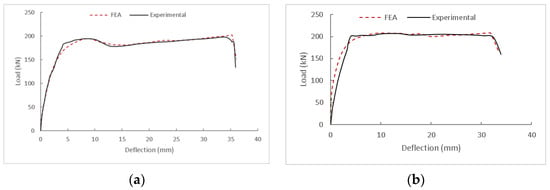
Figure 13.
Experimental and FEA load–deflection curves for T-beams reinforced with 600 MPa steel bars: (a) NF6N and (b) NF6S.
Furthermore, in the finite element model’s curves, the last deflection position, where the sudden drop of the beam’s bearing capacity was based on the experimental data, was achieved by adjusting the stress–strain of the materials. Although the actual final failures of some T-beams were mainly caused by fractures of longitudinal reinforcements and then concrete crushing, the T-beam models cannot successfully simulate the phenomenon of capacity drop. However, it can be approximated by adjusting both the stress of the steel bars and the stress–strain of the concrete, which were evident by the good agreement of the drop between the experimental and FEA results. It was difficult to avoid the discrepancy between the experimental data and finite element models in simulating the final failures of the T-beams. The discrepancies in the actual specimen dimensions and steel reinforcement position, the discrepancies in the actual material strength and strain compared to the input values in the model, and the discrepancies in experimentally recorded data can all lead to this difference. The more precise adjustment of these parameter values in the models and improvement in accuracy during the experimental process should improve the accuracy of the simulation results.
4.3. Effect on Ratio of Longitudinal Reinforcement with FEA Prediction
4.3.1. Stress Distributions and Deformed Shapes
The inverted T-beam models reinforced with different ratios of longitudinal reinforcements were simulated with the validated models. Figure 14, Figure 15, Figure 16, Figure 17, Figure 18 and Figure 19 show the stress distributions and deformed shapes in the concrete of T-beams reinforced with and without steel fibers as well as different longitudinal reinforcements with diameters of 6, 8, and 12 mm. They all failed under flexure, and the ultimate stress formed in the mid-span of the web near the steel plates. The concrete stress shown in the diagram failed to reach the ultimate strength of the concrete inputted into the T-beam models because the concrete with large compressive stress in the mid-span of the web already exceeded the strain of the ultimate strength. Therefore, the concrete strength in the FEA was less than the concrete’s ultimate strength. Furthermore, the flanges in the middle span of the T-beams were already cracked in the tension states, so their colors were blue, which represented low tensile stress.
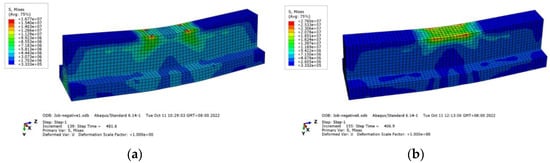
Figure 14.
Stress distributions in the concrete of T-beams reinforced with 400 MPa Ø6 mm steel bars (a) without steel fibers and (b) with steel fibers.
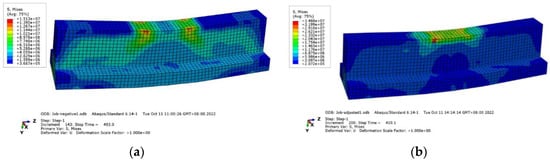
Figure 15.
Stress distributions in the concrete of T-beams reinforced with 400 MPa Ø8 mm steel bars (a) without steel fibers and (b) with steel fibers.
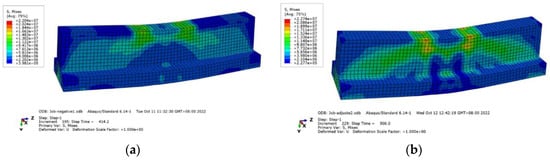
Figure 16.
Stress distributions in the concrete of T-beams reinforced with 400 MPa Ø12 mm steel bars (a) without steel fibers and (b) with steel fibers.
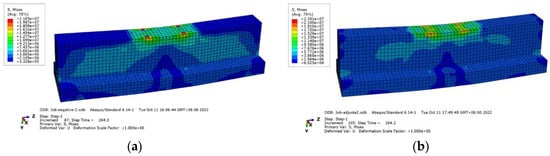
Figure 17.
Stress distributions in the concrete of T-beams reinforced with 600 MPa Ø6 mm steel bars (a) without steel fibers and (b) with steel fibers.
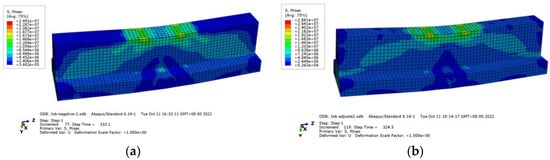
Figure 18.
Stress distributions in the concrete of T-beams reinforced with 600 MPa Ø8 mm steel bars (a) without steel fibers and (b) with steel fibers.
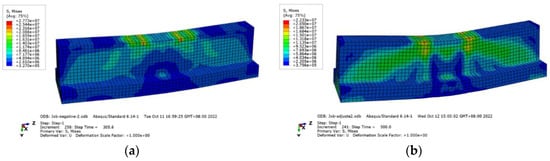
Figure 19.
Stress distributions in the concrete of T-beams reinforced with 600 MPa Ø12 mm steel bars (a) without steel fibers and (b) with steel fibers.
Figure 20, Figure 21, Figure 22, Figure 23, Figure 24 and Figure 25 present the stress distributions and deformed shapes in the steel bars of T-beams reinforced with and without steel fibers as well as different longitudinal reinforcements with diameters of 6, 8, and 12 mm. The stress distributions and deflection deformations of the reinforcements in the diagrams were very similar to the behaviors of the reinforcements in the actual experimental T-beams simulated in Abaqus/standard 6.14-1. The maximum compressive stress and tensile reinforcement stress formed in the upper and lower part of the T-beam span. However, the reinforcement stress changed significantly according to the change in other parameters. For example, for T-beams reinforced using tensile longitudinal reinforcements with a smaller diameter of 6 mm, the compressive bar stress was almost the lowest. Furthermore, for T-beams reinforced using tensile reinforcements with a diameter of 12 mm, most parts of the corresponding compressive reinforcements in the mid-span web were red, which indicates that they were in a state of very high compressive stress. This experimental phenomenon supports the mechanical theory of reinforced concrete beams.
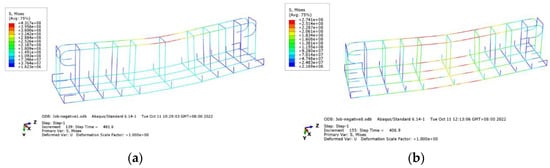
Figure 20.
Stress distributions in T-beams reinforced with 400 MPa Ø6 mm steel bars (a) without steel fibers and (b) with steel fibers.
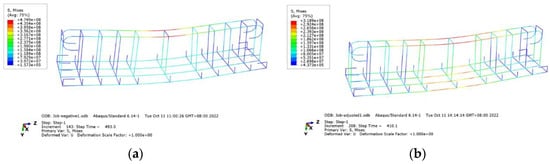
Figure 21.
Stress distributions in T-beams reinforced with 400 MPa Ø8 mm steel bars (a) without steel fibers and (b) with steel fibers.
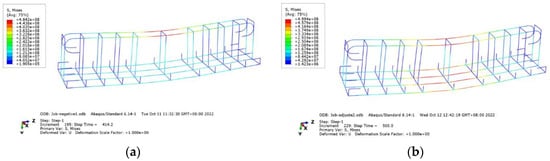
Figure 22.
Stress distributions in T-beams reinforced with 400 MPa Ø12 mm steel bars (a) without steel fibers and (b) with steel fibers.
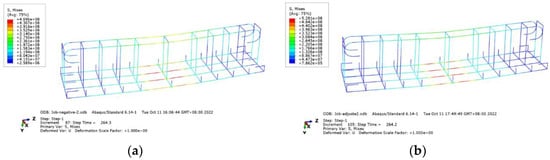
Figure 23.
Stress distributions in T-beams reinforced with 600 MPa Ø6 mm steel bars (a) without steel fibers and (b) with steel fibers.
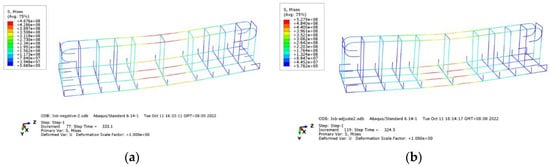
Figure 24.
Stress distributions in T-beams reinforced with 600 MPa Ø8 mm steel bars (a) without steel fibers and (b) with steel fibers.
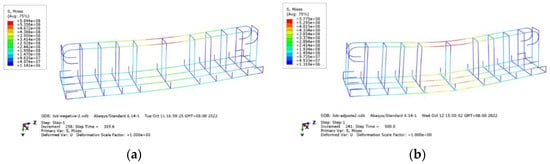
Figure 25.
Stress distributions in T-beams reinforced with 600 MPa Ø12 mm steel bars (a) without steel fibers and (b) with steel fibers.
On the other hand, for T-beams reinforced with 600 MPa reinforcements, the stresses of the compressive reinforcements were significantly higher than those of reinforcements in the 400 MPa groups. This indicated that the concrete and reinforcements in the compressive areas had higher strains, and the high-strength reinforcements corresponded to the developing stress. The materials had only been partially utilized and did not achieve ultimate compressive strength. In addition, it can be seen from the diagrams that the stresses of the tensile reinforcements in the SFRC T-beams reinforced with longitudinal reinforcements of the same diameter were higher than those of ordinary concrete T-beams. This phenomenon could be due to the higher deflections of SFRC T-beams and the relatively higher strains of tensile reinforcements. This was consistent with the theory of reinforced concrete and material mechanics. Similarly, the calculation results of the finite element models also proved that Abaqus software can successfully predict the negative flexural behaviors of SFRC T-beams. Of course, there are some limitations in the finite element software, and the conclusions need to be further verified by actual experiments and practical projects.
4.3.2. Loads vs. deflections in FEA
The applied loads vs. deflections in the mid-span of the T-beams are presented in Figure 26 and Figure 27, respectively. In general, the negative flexural bearing capacity of the T-beams without steel fibers represented by the red dotted line was significantly lower than for the SFRC T-beams, represented by the dark solid lines. This phenomenon illustrated that adding steel fibers into concrete can improve the negative flexural bearing capacity of T-beams reinforced with two kinds of strength reinforcements.
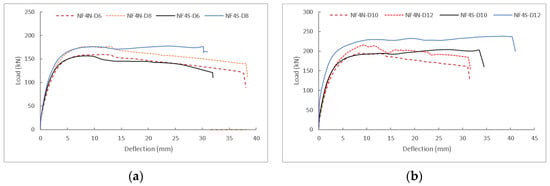
Figure 26.
FEA load–deflection curves of T-beams reinforced with different longitudinal reinforcements: (a) with 400 MPa steel bars, D6–8 mm, and (b) with 400 MPa steel bars, D10–12 mm.
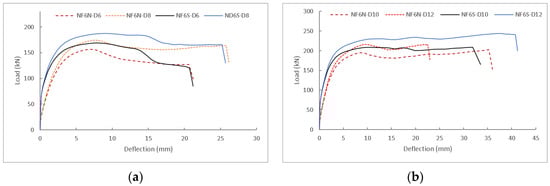
Figure 27.
FEA load–deflection curves of T-beams reinforced with different longitudinal reinforcements: (a) with 600 MPa steel bars, D6–8 mm, and (b) with 600 MPa steel bars, D14–16 mm.
However, the influence of the steel fibers on the deflection of the T-beams was somewhat complex. For the NF4N/S group of T-beams reinforced with steel bars with diameters of 6 and 8 mm, the deflections of the SFRC T-beams were significantly smaller than those of the beams without steel fibers. This may be due to the T-beams being reinforced with lower-strength and smaller-diameter longitudinal reinforcements, which lowered the concrete compressive zone depth, and the high strain behavior of the SFRC had not been developed. In addition, due to the addition of steel fibers into the concrete, the concrete force in the tensile zone of the T-beam was higher than that of the T-beams without steel fibers, and a higher concrete compressive zone depth was required. Therefore, the concrete in the compressive zone of the SFRC T-beam was crushed earlier than the concrete without steel fibers. The compressive zone in the SFRC was considerably reduced, and the bearing capacity of the T-beam decreased suddenly when the SFRC was damaged. For the T-beams with steel bars with bigger diameters, the deflections of the SFRC T-beams were significantly higher than those of T-beams without steel fibers. This may be due to the higher concrete compressive zone depth and the development of enough higher strain. On the other hand, the performance of the 400 MPa T-beam reinforced with steel bars with diameters of 6 and 8 mm fluctuated significantly. This may be due to the reduced FEA simulation reliability since the parameters were adjusted. Therefore, more experiments are needed in order to verify these phenomena, such as continuing to study the influence of the different shapes, materials, and strengths of steel fibers on the performance of reinforced concrete T-beams. A comparison with the conclusions of this research will further validate such findings.
4.3.3. Discussion of Load vs. Deflection in FEA
The simulation results of this group of inverted T-beams, including the bearing capacity, the maximum mid-span deflection, and the incremental percentage, are summarized in Table 5 and Table 6. Meanwhile, the relationship curves and histograms between both the increment percentages of loading and deflection and the diameters of tensile reinforcements are shown in Figure 28 and Figure 29.
Table 5.
Load and deflection increment percentage of inverted SFRC T-beams reinforced with 400 MPa steel bars.
Table 6.
Load and deflection increment percentage of inverted SFRC T-beams reinforced with 600 MPa steel bars.
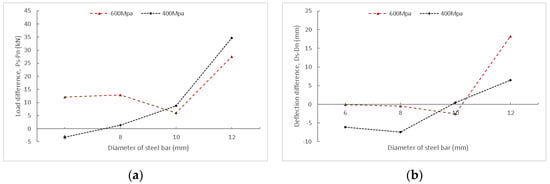
Figure 28.
Increment–diameter curves of SFRC T-beams reinforced with 400 MPa and 600 MPa steel bars: (a) loading, (b) deflection.
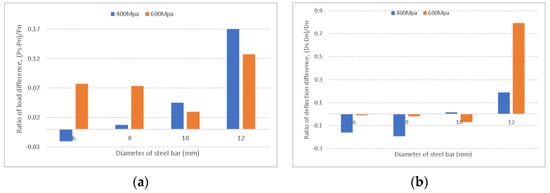
Figure 29.
Loading and deflection increment ratio of SFRC T-beams reinforced with 400 MPa and 600 MPa steel bars: (a) loading, (b) deflection.
Based on the overall trends in the figures, by adding steel fibers into the T-beam concrete, the deflections of the T-beams reinforced with lower-strength and smaller-diameter longitudinal bars failed to increase significantly but decreased to a certain extent. Almost all of the negative flexural capacity of the SFRC T-beams was higher than for beams without steel fibers. The bearing capacity of the NF4N T-beam was slightly higher than that of the NF4S beam, which may be due to the change in the neutral axis depth caused by the greater SFRC resultant force than that of ordinary concrete. In addition, the negative flexural capacities and mid-span deflections of the SFRC T-beams increased more significantly than in those without steel fibers when the reinforcement strength and diameter were improved (D = 12). This may be due to the increase in the concrete compressive zone depth in the T-beams. Moreover, the stress and strain of the SFRC were higher than those of ordinary concrete.
5. Conclusions
This study presents the behaviors of four inverted T-beams, half of which were reinforced with steel fibers and 600 MPa steel bars. The test results indicated that adding steel fibers into T-beams can slightly increase the negative flexural capacity and deflection in the mid-span for T-beams reinforced with both 400 MPa and 600 MPa steel bars. However, the increments of the negative flexural capacity and deflection of the SFRC T-beams reinforced with both 400 MPa and 600 MPa steel bars were not significant. The inverted T-beam models were simulated using ABAQUS/standard 6.14-1, and the results were in considerable agreement with the experimental behaviors. This proved that the models could predict the negative failure behaviors of T-beams after changing certain parameters, including the ratio of longitudinal reinforcement, for investigating the negative flexural behaviors of T-beams.
The negative flexural behaviors of the T-beams reinforced with 600 MPa steel bars and steel fibers were increased more than those without steel fibers after the Ø10 mm steel bars were changed for Ø6 mm, Ø8 mm, and Ø12 mm bars. However, the effectiveness of the SFRC on the T-beams reinforced with both 400 and 600 MPa reinforcements was different when the diameter of the longitudinal reinforcements was changed. Therefore, the degree of loading and the deflection increment were analyzed and discussed based on the data and curves from the FEA. The following conclusions can be drawn from the experimental and numerical analyses performed:
- In this group of experiments, the effects of adding steel fibers to concrete on the negative flexural failure performance of T-beams reinforced with two different strengths of reinforcements were obvious, especially the post-peak performance. However, the increments of flexural capacities and deflections in the mid-span were not significant, especially for the NF4N/S group beams reinforced with smaller-diameter reinforcements, for which almost no effect was observed on the performance of the T-beams.
- The experimental results indicated that, for reinforcements with a diameter of 14 mm but different strengths, the increments of the negative flexural capacity and deflections in the mid-span of the T-beams with 600 MPa were less than the corresponding data for the T-beams with 400 MPa.
- The negative flexural failure data for the SFRC T-beams showed that, within the range of reinforcements discussed for this group, the greater the diameter of the tensile reinforcement, the more significant the effects of the steel fibers, both for 400 and for 600 MPa T-beams. The influence of steel fibers on the performance of T-beams made with steel bars of different compressive strength is somewhat complex. The variation trends in ultimate load and deflection are related to the diameter of the tensile steel bars.
- Abaqus/standard 6.14-1 finite element software can successfully simulate the negative flexural failure processes of SFRC T-beams by properly adjusting the properties of the material in the models based on the performance of the material in the experiments. The numerical simulation results may be very close to those obtained during experimental processes (deviation value of key points is around 1~3%), such as for negative flexural capacity and deflection in the mid-span.
- With adjusted T-beam models, the finite element software Abaqus/standard 6.14-1 could successfully predict the negative flexural failure performance of other T-beams with different parameters. The simulation results were comparable to the theory that steel fibers can increase the negative flexural performance of T-beams. However, the greater the difference in the parameters updated from the experimental values, the lower the reliability of the prediction results.
Author Contributions
Conceptualization, Z.H. and N.N.; methodology, Z.H.; software, Z.H.; validation, N.N.; formal analysis, Z.H.; investigation, Z.H.; resources, Z.H.; data curation, Z.H.; writing—original draft preparation, Z.H.; writing—review and editing, N.N.; visualization, Z.H.; supervision, N.N.; project administration, Z.H.; funding acquisition, Z.H. All authors have read and agreed to the published version of the manuscript.
Funding
This research was funded by Xi’an Siyuan University.
Data Availability Statement
The raw data supporting the conclusions of this article will be made available by the authors on request.
Conflicts of Interest
The authors declare no conflict of interest.
References
- Tavakoli, H.R.; Jalali, P.; Mahmoudi, S. Experimental evaluation of the effects of adding steel fiber on the post-cyclic behavior of reinforced self-compacting concrete beams. J. Build. Eng. 2019, 25, 100771. [Google Scholar] [CrossRef]
- Liu, H.; Xiang, T.; Zhao, R. Research on non-linear structural behaviors of prestressed concrete beams made of high strength and steel fiber reinforced concretes. Constr. Build. Mater. 2009, 23, 85–95. [Google Scholar] [CrossRef]
- Lee, J.-Y.; Shin, H.-O.; Yoo, D.-Y.; Yoon, Y.-S. Structural response of steel-fiber-reinforced concrete beams under various loading rates. Eng. Struct. 2018, 156, 271–283. [Google Scholar] [CrossRef]
- Wang, Y.D.; Yang, S.; Han, M.; Yang, X. Experimental Study of Section Enlargement with Reinforced Concrete to Increase Shear Capacity for Damaged Reinforced Concrete Beams. Appl. Mech. Mater. 2013, 256, 1148–1153. [Google Scholar] [CrossRef]
- Wang, Y.; Ibarra, L.; Pantelides, C. Seismic Retrofit of a Three-Span RC Bridge with Buckling-Restrained Braces. J. Bridge Eng. 2016, 21, 04016073. [Google Scholar] [CrossRef]
- JGJ/T 465-2019; Standard for Design of Steel Fiber Reinforced Concrete Structures. China Building Industry Press: Beijing, China, 2019.
- Khalid, S.F.; Juki, M.I. Fiber Reinforced Concrete Pullout, Toughness Index & Application; Penerbit UTHM Univeriti Tun Hussein Onn: Parit Raja, Malaysia, 2018.
- Yoo, D.-Y.; Yang, J.-M. Effects of stirrup, steel fiber, and beam size on shear behavior of high-strength concrete beams. Cem. Concr. Compos. 2018, 87, 137–248. [Google Scholar] [CrossRef]
- Tran, T.T.; Pham, T.M.; Hao, H. Experimental and analytical investigation on flexural behavior of ambient cured geopolymer concrete beams reinforced with steel fibers. Eng. Struct. 2019, 200, 109707. [Google Scholar] [CrossRef]
- JG/T 472-2015; Steel Fiber Reinforced Concrete. Ministry of Housing and Urban-Rural Development: Beijing, China, 2015.
- ACI 318R-14; Building Code Requirements for Structural Concrete. ACI: Farmington Hills, MI, USA, 2014.
- GB 50010-2010; Code for Design of Concrete Structures. Ministry of Housing and Urban-Rural Construction of the People’s Republic of China: Beijing, China, 2010.
- Chen, C.; Xiaodong, Y.; Wen, P.; Haowei, K. Experimental research on flexrual performance of reinforced concrete beams with 600 Mpa steel bars. Build. Struct. 2018, 48, 6. [Google Scholar]
- T/CCIAT 0016-2020; Specification for Application of 600 MPa Hot-Rolled Ribbed High-Strength Bars. China Construction Industry Association: Beijing, China, 2020.
- Domski, J. A blurred border between ordinary concrete and SFRC. Constr. Build. Mater. 2016, 112, 247–252. [Google Scholar] [CrossRef]
- Gali, S.; Subramaniam, K.V.L. Investigation of the dilatant behavior of cracks in the shear response of steel fiber reinforced concrete beams. Eng. Struct. 2017, 152, 832–842. [Google Scholar] [CrossRef]
- Caggiano, A.; Gambarelli, S.; Martinelli, E.; Nistico, N.; Pepe, M. Experimental characterization of the post-cracking response in Hybrid Steel/Polyproppylene Fiber-Reinforced Concrete. Constr. Build. Mater. 2016, 125, 1035–1043. [Google Scholar] [CrossRef]
- Deng, M.; Sun, Y.; Zhang, S.; Shu, H.; Li, T. Shaking table test of single-story brick-wood structures of rural builings strenthened with HDC. Eng. Mech. 2024, 41, 90–102. (In Chinese) [Google Scholar]
- Carlesso, D.M.; de la Fuente, A.; Cavalaro, S.H.P. Fatigue of cracked high performance fiber reinforced concrete subjected to bending. Constr. Build. Mater. 2019, 220, 444–455. [Google Scholar] [CrossRef]
- Folino, P.; Ripani, M.; Xargay, H.; Rocca, N. Comprehensive analysis of Fiber Reinforced Concrete beams with conventional reinforcement. Eng. Struct. 2020, 202, 109862. [Google Scholar] [CrossRef]
- Pereiro-Barcelo, J.; Lopez-Juarez, J.A.; Ivorra, S.; Bonet, J.L. Experimental analysis of longitudinal shear between the web and flanges of T-beams made of fiber-reinforced concrete. Eng. Struct. 2019, 196, 109280. [Google Scholar] [CrossRef]
- Fallah-Valukolaee, S.; Hashemi, S.K.; Nematzadeh, M. Effect of steel fiber on flexural performance of bilayer concrete beams with steel and GFRP rebars: Experiments and predictions. Structures 2022, 39, 405–418. [Google Scholar] [CrossRef]
- Jaber, M.H.; Abd Al-Zahra, B.I.; Ibrahim, A.A.; Hassan, R.F.; Al-Salim, N.H.; Hussein, H.H. Exploring the Effect of Varying Fiber Dosages as Stirrup Substitutes in Torsion-Loaded Concrete Beams. Buildings 2023, 13, 1865. [Google Scholar] [CrossRef]
- Keshtegar, B.; Bagheri, M.; Yaseen, Z.M. Shear strength of steel fiber-unconfined reinforced concrete beam simulation: Application of novel intelligent model. Compos. Struct. 2019, 212, 230–242. [Google Scholar] [CrossRef]
- Tan, T.H.; Nguyen, N.B.; Li, B.; Chuan Chew, K.; Kwang Thung, S. Design Considerations and Guidelines in The Use of Grade 600 Steel Reinforcements for Reinforced Concrete Construction. IOP Conf. Ser. Mater. Sci. Eng. 2019, 603, 052037. [Google Scholar] [CrossRef]
- Guan, J.; Liu, L.; Zhang, Q.; Bai, W.; Yao, X.; Zhao, S. Experimental study and calculation method of mid-span deformation of RC beams with 600 MPa steel bars. J. Build. Struct. 2021, 8, 59–72. [Google Scholar]
- Zheng, Y. Principles of Concrete Mechanics and Component Design, 2nd ed.; Xi’an Jiaotong University Press: Xi’an, China, 2018. [Google Scholar]
- Shewalul, Y.W. Numerical and FEA investigation of sectional capacity and moment redistribution behavior of steel fiber reinforced concrete (SFRC) beam. Heliyon 2021, 7, e07354. [Google Scholar] [CrossRef] [PubMed]
- GB/T 50152-2012; Standard for Test Method of Concrete Structures. Ministry of Housing and Urban-Rural Development: Beijing, China, 2012.
- Gali, S.; Subramaniam, K.V.L. Influence of cohesive stresses on shear capacity of reinforced SFRC beams without stirrups: A discrete crack approach. Eng. Fract. Mech. 2018, 206, 218–232. [Google Scholar] [CrossRef]
- Doo, Y.Y.; Banthia, N.; Young, S.Y. Flexural behavior of ultra-high-performance fiber-reinforced concrete beams reinforced with GFRP and steel rebars. Eng. Struct. 2016, 111, 246–262. [Google Scholar]
- Doo, Y.Y.; Banthia, N.; Jun, M.Y.; Young, S.Y. Size effect in normal-and high-strength amorphous metallic and steel fiber reinforced concrete beams. Constr. Build. Mater. 2016, 121, 676–685. [Google Scholar]
Disclaimer/Publisher’s Note: The statements, opinions and data contained in all publications are solely those of the individual author(s) and contributor(s) and not of MDPI and/or the editor(s). MDPI and/or the editor(s) disclaim responsibility for any injury to people or property resulting from any ideas, methods, instructions or products referred to in the content. |
© 2024 by the authors. Licensee MDPI, Basel, Switzerland. This article is an open access article distributed under the terms and conditions of the Creative Commons Attribution (CC BY) license (https://creativecommons.org/licenses/by/4.0/).