Abstract
Both the high CO2 emissions associated with cement production and the increasing demand for concrete call for the use of binder types that can be produced in a more climate-friendly way than that of ordinary Portland cement. To ensure that these binders can also be used in reinforced concrete structures, their influence on the corrosion behavior of embedded steel reinforcement must be investigated. In the study presented here, the passivation behavior of steel in mortars made from various new types of binders is investigated. In addition to alkali-activated materials with high and low calcium contents, a calcium sulfoaluminate cement and a binder produced from calcium silicate hydrate (C-S-H) phases, synthesized in an autoclave, were investigated. While the steel clearly passivated in the alkali-activated slag and the C-S-H binder, the calcium sulfoaluminate cement showed the lowest open circuit potentials and polarization resistances, indicating a less effective level of passivation. The metakaolin geopolymer with a potassium-based activator showed an onset of passivation that was dependent on the environment of the specimens at an early age, whereas the alkali-activated fly ash with a sodium-based activator showed a delay in passivation that was not influenced by the environment of the specimens at an early age.
1. Introduction
The production of cement accounts for roughly 8% of the global anthropogenic CO2 emissions [1,2]. Around 90% of the CO2 emissions associated with cement production result from clinker production, whereas more than 60% of the emissions are generated during the decomposition of limestone [3]. In total, 99.8% of the clinker produced globally is based on ordinary Portland cement (OPC) [3]. This results in enormous potential savings in greenhouse gas emissions through the use of cement types that do not require Portland cement clinker. There are several approaches to develop binder types that are alternatives to OPC and research is being carried out worldwide to enable their practical use in construction. Additionally, to use these types of binder in reinforced concrete structures, the durability of the steel reinforcement in contact with the concrete must be ensured. The first step in this process is the passivation of the steel in contact with the concrete which is ensured for the cement types whose use in reinforced concrete is covered by the current standardization. The passivation of steel in established mortar or concrete is strongly dependent on the pore solution composition and, in particular, the pH and the oxygen availability at the steel surface [4,5,6]. In this study, different types of binders that are produced without Portland cement clinker are investigated regarding their influence on the passivation behavior of steel.
Investigated Binder Types Alternative to OPC
Calcium sulfoaluminate (CA) cement, also referred to as Ye’elimite-based cement, is the only cement type investigated here that is already produced in large amounts, but with a quantity around 1000 times less than that of OPC [3]. By replacing limestone with a calcium sulfate component in the initial material, CO2 emissions can be significantly reduced during the burning process for the clinker [7,8]. In addition, the burning temperature is lower than with Portland clinker, so that less energy is required for production. In construction practice, CA cement is particularly used in China [7] but is also commercially available in Europe. The pore solution of CA-based mortars and concretes has a lower pH compared to OPC-based materials [9,10,11,12,13,14,15]. For the pH of the pore solution at the age of 28 days, values of pH between 11.5 and 12.9 have been reported [10,11,13,15]. Another difference in the pore solution chemistry of CA-based concretes and mortars is the higher content of sulfate, chloride and aluminum hydroxide [10,13,15]. The influence of CA on the passivation of steel was formerly investigated by Wang et al. [13,16] at artificial pore solutions and at concretes by both Carsana et al. [11,17] and Yang [18]. The investigations on pore solutions show that the SO42− ions contained in the pore solution counteract the passivation of steel, while the OH− ions and Al(OH)4− ions favor its passivation. Although corrosion phenomena, which occur at a young sample age, are observed in the tests on steel in CA concrete, a passivating effect is still noted [11,17]. Rapid hardening and high early age strength is typical for CA cement [7,8,11,19]. Therefore, they are usually mixed with a retardant. Above that, cementitious materials made from CA cement tend to self-desiccate [17,18,19].
Celitement is a hydraulic binder that is produced on the basis of C-S-H phases, produced by autoclaving a mixture of calcium oxide and silica [3]. Quartz sand can be used as the silica source and a smaller amount of limestone is required than for OPC. This saves CO2, which is produced during the decarbonation of the limestone. In addition, the maximum temperature in the autoclave is lower than the burning temperature of the clinker, meaning that less energy is required to generate the temperature [20]. The synthesis product from the autoclave is hydraulically inert but is then activated by a mechanochemical grinding treatment [21]. After mixing with water, the hydration process takes place and the paste, mortar or concrete hardens. This new type of binder was developed by researchers from the Karlsruhe Institute of Technology (KIT) and is called Celitement [3,22]. It is produced at a pilot plant in small amounts [22]. The pH of the pore solution in pastes made with Celitement is around 12.7 [9,21].
The production of alkali-activated materials (AAMs) does not require limestone, which releases CO2 during decarbonation. Nevertheless, CO2 is also released during the production of the initial materials, but in a much smaller amount than in the OPC production [20]. AAMs are made of precursors that are activated by highly alkaline solutions like water glasses or NaOH and are divided into the following two groups: AAMs with high calcium content in the initial material are referred to as alkali-activated slags (AASs), because the high calcium content is usually brought by slag as a precursor. When precursors with low calcium contents like fly ash or metakaolin are activated, they are called geopolymers. This separation is also useful when investigating the corrosion behavior: The pore solutions of AASs show a higher content of reduced sulfur species that have an influence on the oxygen availability at the steel surface and are, therefore, more comparable to blast furnace cements [23,24]. Geopolymers usually do not show high amounts of sulfur species in their pore solutions [23,24,25,26,27]. The pH of AAM pore solutions is initially very high due to the highly alkaline activator but can decrease significantly over time depending on the selected precursor and activator [9,23,27,28]. Investigations on the passivation of steel in contact with geopolymers were carried out by Fan et al. [29], where a bi-layer structure of the passive film, similar to the passive layer in OPC, was found. The inner layer consists of Fe3O4 and the outer layer is mainly Fe2O3 and FeOOH. The time to passivation was observed to be longer than for steel in OPC-based materials [28,30]. Extensive investigations of the influence of AAS pore solutions on the passivation of steel have been carried out by Mundra [23]. The sulfur species in the simulated pore solutions were found to alter the layer formed on the steel surface. The inner layer was assumed to be Fe(OH)2 (which may oxidize further, if sufficient oxygen is available) and the outer layer is an Fe-S complex which resembles disordered mackinawite.
2. Materials and Methods
To investigate the influence of the alternative binder types mentioned above on the passivation of steel reinforcement, electrochemical tests on mortar specimens with a maximum grain size of 2 mm have been carried out. For a better comparison of the results, the following two cement types standardized in EN 197-1 [31] were used: mortars based on OPC (CEM I) and slag cement (CEM III/B) were tested as references. The first results showed a possible dependency of the passivation behavior on the time frame that the test specimens remained in their sample containers they were cast in. This was assumed for the geopolymers and the CA. Therefore, additional tests with deviating treatment at a young age for these binder types were carried out.
2.1. Materials and Mixes
In addition to two reference cements (CEM I and CEM III/B), mortar was produced with the alternative binder types CA (next base) and Celitement. From the group of AAMs, two geopolymers (metakaolin- and fly ash-based) and an alkali-activated slag were investigated. The identifiers used in the course of this publication, information on the mortar mixtures and the water-to-binder (w/b) ratios are given in Table 1. CEN standard sand with a grain size of 0.08 to 2 mm in a binder-to-sand ratio of 1:3 was used to produce the mortars. The w/b ratios were adapted for workability. To calculate the w/b ratios of the AAMs, the liquid portion of the activator solutions and added water were attributed to the water, while the solids content of the activator and the precursor were fully attributed to the binder. As Celitement is a prehydrated binder, the water demand is lower. Superplasticizer based on polycarboxylic ether (PCE) was used.

Table 1.
Overview of investigated materials, w/b ratios and used identifiers.
The chemical compositions of the initial materials are summarized in Table A1 in Appendix A.
2.2. Electrochemical Tests
For each binder type, three cylindrical mortar specimens were produced, according to the three-electrode setup shown in Figure 1.
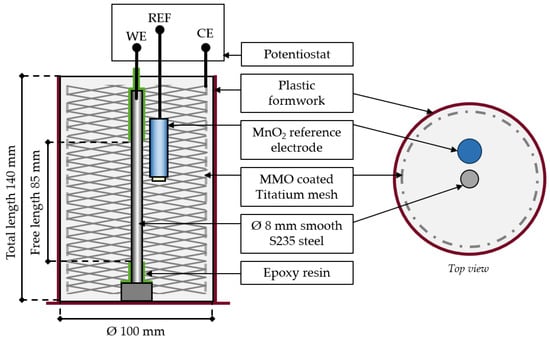
Figure 1.
Schematic representation of the specimen design.
The smooth steel S235 (DIN EN 10025-2) [32] used as working electrodes was sandblasted prior to the installation in the formwork. The elemental composition of the steel determined using Optical Emission Spectroscopy (OES) is given in Table 2. The top and bottom of the working electrodes were sealed by epoxy resin to create a free length of 85 mm exposed to the mortar under test. MnO2 reference electrodes were used and were directly embedded in the mortar. The potential of the MnO2 reference vs. a standard hydrogen electrode (SHE) is +434 mV. Mixed Metal Oxide (MMO)-coated titanium mesh was used as counter electrodes.
Table 2.
Elemental composition of the steel, values in %.
The specimens were covered with plastic sheets and kept in a laboratory climate (20 ± 2 °C, 50 ± 5 % r. h.). They were connected to a potentiostat directly after casting. At the age of seven days, the plastic sheets were removed. The specimens stayed in their formwork for the whole measurement.
Electrochemical tests were performed as listed in Table 3. The measurements were carried out up to an age of 28 days. The open circuit potential (OCP) of the working electrodes vs. the embedded reference electrode was measured and impedance spectra were taken daily. These tests are considered to allow for the formation of the passive layer without disturbance due to the low polarization. At the age of 28 days, an anodic polarization curve starting from OCP was carried out. A slow polarization rate was applied to ensure steady state conditions also in mortars with high resistivities.
Table 3.
Overview of the measurement parameters for the electrochemical tests.
The specimens were split after the tests and the working electrodes were visually inspected for corrosion products and photographed. To check for crevice corrosion, the epoxy sealings at the steel ends were also removed.
3. Results and Discussion
3.1. Open Circuit Potential and Polarization Curve
The results of the OCP measurements taken directly after casting up to an age of 28 days are shown in Figure 2. The potential values are converted to the standard hydrogen electrode scale and each point is a mean value of the three specimens produced for each type of binder. The potential ranges given on the right-hand side of Figure 2, given in ref. [33] and converted to the SHE scale, show the variability in the OCP of passive steel in different binder types, depending on the redox system in the pore solution.
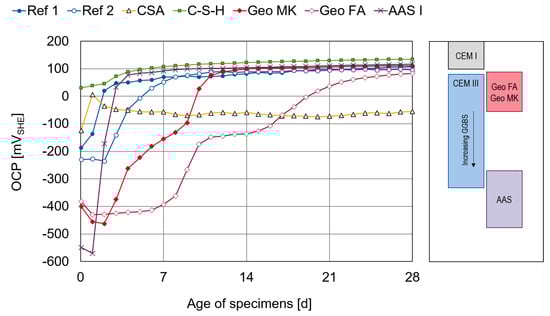
Figure 2.
(Left): Results of OCP measurements over 28 days as mean value of three specimens each. (Right) Potential ranges adapted from [33].
The potential increases with ongoing passivation, indicating a declining probability of corrosion [5]. The reference series Ref 1 (CEM I) shows increasing values from day 0 to day 4 and only a slight increase from day 4 to day 7. The values remain almost stable after 7 days. The Ref 2 specimens (CEM III) need more time for passivation. Most of the change happens between day 3 and day 10. After that, the values show only a slight increase and are in the same range as the OCP measured in Ref 1.
The CSA shows a different behavior, with rather positive values at the beginning increasing up to day 1, followed by a decrease and no clear trend after that. The potentials remain around 150 mV more negative than for the other types of binders. The potential value itself is not a clear indication as to whether the steel is passive or not, because the OCP is strongly dependent on the pore solution composition and the pH, oxygen availability and moisture content of the mortar [33,34]. However, the unclear trend of the OCP readings from CSA seems to indicate the samples may not be fully passivating. This might be associated with the period of time the specimens remained within their containers, which can affect the availability of oxygen at the steel surface. This was further investigated and is described in Section 4.
The C-S-H series shows comparably positive values from the beginning and over the whole measurement duration up to an age of 28 days. The values are increasing and remain almost stable from the age of 7 days.
The potential values of the two geopolymers Geo MK and Geo FA show a delayed start of passivation and progress in two steps. Both reach the same value of OPC as the other binders, apart from CSA, but for the Geo MK it takes 12 days to reach a stable OCP and for the Geo FA the values are just starting to stabilize at the end of the measurement after 28 days. The plastic sheets have been removed from the specimens at the age of 7 days. This might have an influence on the passivation time of the geopolymers. Therefore, this was checked in an additional series of tests shown in Section 4, where the containers and plastic sheets were removed at the age of 2 days.
The most negative potentials at the beginning are observed in the AAS specimens. The potential increases and reaches almost stable values within 5 to 7 days, with similar values to the other binders, apart from CSA. This behavior is not typical for AASs, where more negative values can be expected, as seen in the potential ranges marked next to the graph [24,33].
The anodic current density plots of all 21 specimens at the age of 28 days are shown in Figure 3. The potentials are converted to the standard hydrogen scale and corrected by the influence of IR by calculating the potential shift with the measured current and the resistance with the minimum phase angle in the frequency range between 100 Hz and 10 kHz from the impedance spectra from the same day [35]. To calculate the current density, the surface area of the working electrode in contact with the mortar was used. The curves of all binder types follow the shape of a passive working electrode, with no breakthrough potential up to the oxygen evolution potential at around 850 mVSHE. This behavior is consistent with the description of passive steel in mortar seen in [36]. The current density curves for the Geo FA specimens show a slight increase after 400 mVSHE. This could indicate a corrosion activity but the slope is low, however, so this is more likely to be attributed to generalized corrosion rather than to pitting. The shape of the AAS I polarization curves does not show the deviation from other binder types, which is sometimes observed in sulfide-containing media [24,25].
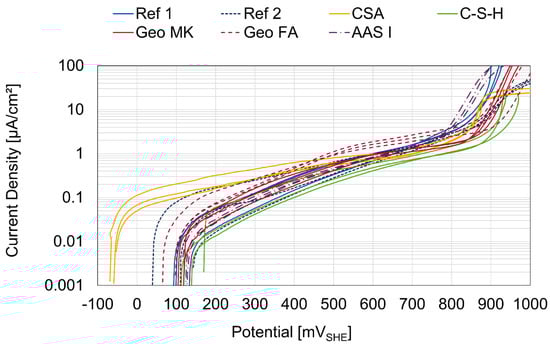
Figure 3.
Anodic polarization curves of all 21 specimens at the age of 28 days.
3.2. Results of AC Impedance Spectroscopy
To obtain a better understanding of the processes taking place at the steel surfaces, the results of the AC impedance spectroscopy measurements are discussed in this section. An impedance spectrum was recorded for each of the three specimens per binder type every day between day 1 and day 28. Figure 4 shows an example of the raw data measured on one of the three specimens of the Geo FA series. All 28 measurements of the specimen are plotted in the figure to show the evolution of the curves over time from dark blue (day 1) to orange (day 28). The Bode plot is shown on the left and the Nyquist representation is on the right. In the high frequency region of the Bode plot, the increase in the resistivity of the mortar can be observed. The low-frequency region is influenced by the interface between the mortar and the steel surface. A change in the system between days 9 and 10 is evident here and resulted in a rather sudden decrease in the minimum phase angle and the capacitance associated with the steel mortar interface. At the same time, the polarization resistances increase, represented by the increasing diameter of the only partially visible semicircle in the Nyquist plot in the observed frequency range.
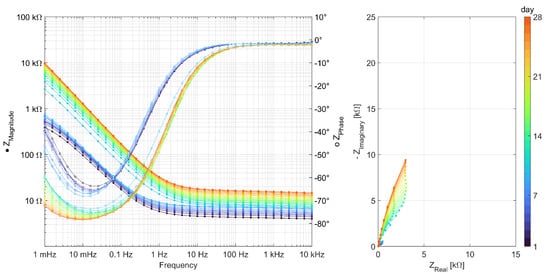
Figure 4.
Representation of EIS measurements carried out daily over 28 days on a specimen of the series Geo FA.
Impedance spectra from all other binder types can be seen in Appendix A, Figure A1, Figure A2, Figure A3, Figure A4, Figure A5 and Figure A6. The quality of measurement data, in terms of linearity and stability over the time period to undertake the measurement, was verified using a Kramers–Kronig transformation [37,38]. To analyze the impedance spectra and compare the evolution of different parameters between the different binder types, all impedance spectra were fitted with the equivalent electric circuits (EECs) shown in Figure 5.
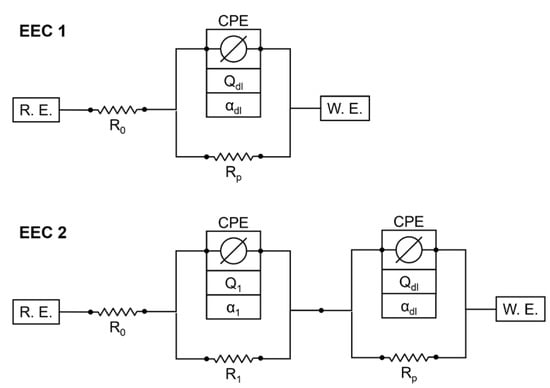
Figure 5.
Equivalent electric circuits used to fit the EIS data.
Most of the binder types showed the typical Randles shape but with a deformed semicircle, probably due to inhomogeneities in the steel mortar interface. Therefore, a constant phase element (CPE) instead of an ideal capacitor was used [39,40]. These inhomogeneities can be variations of the properties along the electrode surface or in a direction normal to the surface [41]. In a first attempt, all impedance spectra were fitted with the EEC 1. For CSA, C-S-H and Geo MK, the fit quality of EEC 1 was worse than for the Ref 1 specimens, therefore a second CPE and Ohmic resistance in parallel were added, to take care of additional effects in the frequency range between 10 mHz and 100 Hz. For the C-S-H, this influence is visible in the Nyquist plot (see Figure A4), where the beginning of the semi-circle follows a different pattern to the expected curve. This was the same for CSA. In the Geo MK specimens, an additional effect becomes more obvious in the Bode plot, where the phase shows additional turning points between 10 mHz and 100 Hz (see Figure A5). Capacitive influences in the frequency range over 1 kHz were not considered. The quality of the fits with the different EECs over time is shown in Figure 6 as a mean value of three specimens. The fit results of EEC 1, which were discarded for some binder types (dashed lines and gray legend entries), were not included in the following graphs of the fit results but were used to check the comparability of the parameters from the different EECs.
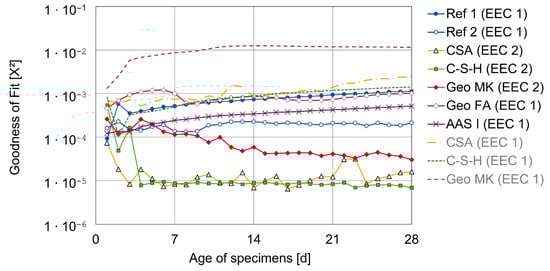
Figure 6.
Fit quality as mean value of three specimens of used and discarded equivalent circuits (EECs).
The resistance R0 is the lowest Ohmic resistance that can be measured in the observed frequency domain. It is mainly a representation of the electrical resistance of the mortar between the steel surface and the reference electrode [42,43]. Because of the unknown geometry of the electric field, these values cannot be used to calculate resistivities, but all specimens had the same setup and dimensions. Therefore, the values are considered to be comparable to each other. The fit results for R0 as the mean value of the three specimens are shown in Figure 7.
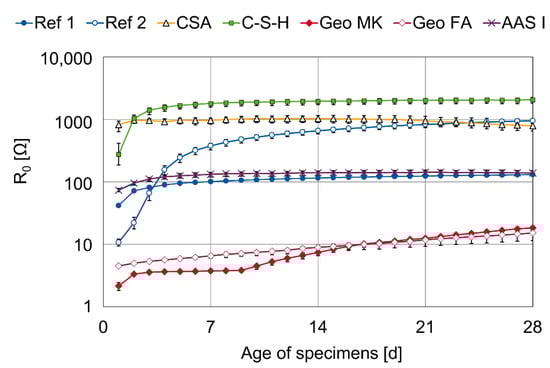
Figure 7.
Fit results for the resistance R0 connected in series.
The change of the values over time and the differences between the different binder types are in good agreement with resistivities investigated at the same mortar mixes in a four-electrode setup with known geometry in a former investigation published in [44]. However, the storage conditions are not exactly the same in the current investigation and the investigations on the resistivity [44], because the specimens were sealed in [44] and, in the investigation described in this paper, the specimens can dry because the upper surface is exposed to the atmosphere. CSA shows a high R0 in this investigation from the beginning, which starts to lower from the age of 14 days. The resistivity of the CSA mortar in [44] shows a rather linear increase over time. Similar observations are made by Carsana et al. [17], where the resistivity of a CSA concrete in sealed specimens shows a slow decrease after a sharp increase within the first day, and a rather linear increase is observed in water-stored CSA specimens.
The highest R0 from day 3 onwards is observed in the C-S-H series, followed by CSA. In the case of CSA, the high resistance is caused by a pore solution with comparably low conductivity; in the case of C-S-H, a dense microstructure causes this high electric resistance [9,44,45]. The R0 values of the investigated geopolymers are very low, which is also consistent with the literature findings [33,46,47].
The fit results for the capacitances Qdl and the corresponding αdl as mean values of three specimens are shown in Figure 8. To assess the quantitative information, effective capacitances would be necessary [41,48], but the change of the values over time is also valuable; corresponding to the increase in the OCP values, the Qdl values decrease during passivation [49]. For most of the binders, this drastic change happens in the first few days. Just the Geo FA specimens show a different behavior and the capacitance drops after 9 days, which supports the assumption of delayed passivation. Another exception is series CSA, where, analogous to the OCP measurements, no distinct trend is obvious. The values of αdl are between 0.75 and 1.0. For α = 1, the CPE is estimated to be an ideal capacitor; for α = 0, the CPE behaves like an Ohmic resistance and α = 0.5 can be attributed to diffusion processes [40,50,51,52]. So, the values determined here confirm the estimation of capacitive behavior.
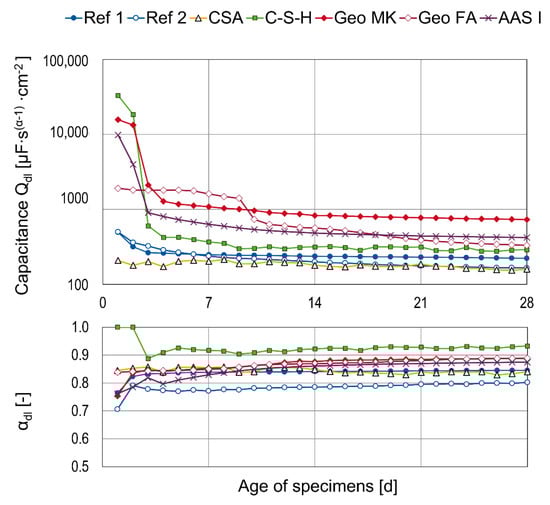
Figure 8.
Fit results for the capacitance Qdl and αdl as mean values of three specimens.
The polarization resistance Rp is mainly the charge transfer resistance through the interface between the steel and the mortar but may also contain resistive components from diffusion processes [53]. The fit results for Rp are shown in Figure 9.
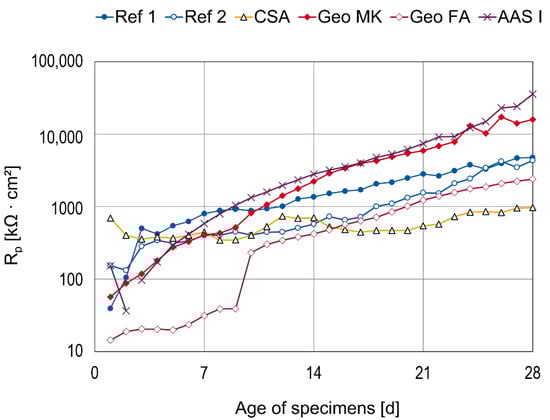
Figure 9.
Fit results for the polarization resistance Rp.
Most of the points are shown as the mean value of three specimens. Individual fits for which the polarization resistance could not be specified with an error <10% were excluded. For the C-S-H specimens, polarization resistances could not be reliably estimated from the impedance spectra (see Figure A4). However, the beginning of the semicircles visible in the Nyquist plots indicate continuously increasing and comparably high polarization resistances. The polarization resistances for the reference cements increased over the whole 28 days. Ref 2 (CEM III) shows lower polarization resistances than Ref 1 (CEM I) but they reach the same order of magnitude after 25 days. Increasing values are also seen in Geo MK and AAS I, where the highest polarization resistances could be estimated. Geo FA shows lower polarization resistances than the reference cements, especially in the initial period. This trend is similar to the OCP measurements, where a sharp increase in these values occurs between days 9 and 10. The capacitance values drop at the same time. CSA shows comparably high values of polarization resistances in the initial period but in accordance with the OCP and Qdl measurements, there is not a clear trend over time. At the end of the test, these specimens show the lowest polarization resistances in the range of about 1000 kΩcm2.
The fit results for the second CPE are shown in Figure 10 for three different binder types, where EEC 2 was used. For α = 1, the CPE is estimated to be an ideal capacitor; for α = 0, the CPE behaves like an Ohmic resistance and α = 0.5 can be attributed to diffusion processes [40,50,51,52]. It is, therefore, assumed that diffusion processes influence the system in the cases of CSA and C-S-H, whilst a layer formation with mainly capacitive properties is possible for Geo MK.
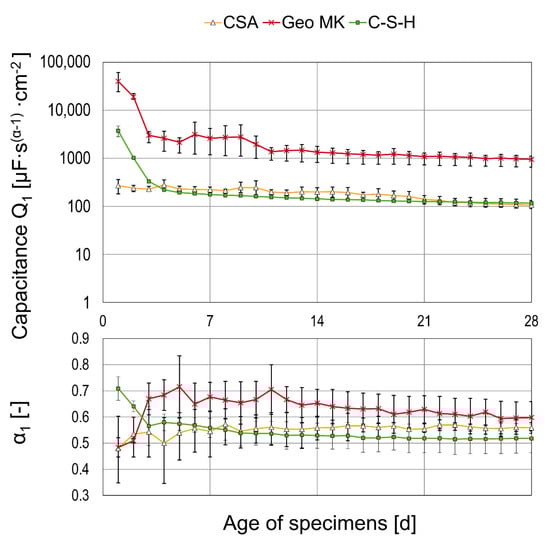
Figure 10.
Fit results for the capacitance Q1 and belonging alpha as mean values of three specimens.
3.3. Working Electrodes after the Test
Pictures from the working electrodes after the tests are shown in Figure 11. No signs of corrosion were observed in the Ref 1, Ref 2, C-S-H and AAS I mortars. A few scattered corrosion spots were observed on the steel surface of the CSA mortars. The geopolymers Geo FA and Geo MK showed shallow corrosion marks over the whole surface in contact with the mortar. Crevice corrosion was not observed in any of the specimens.
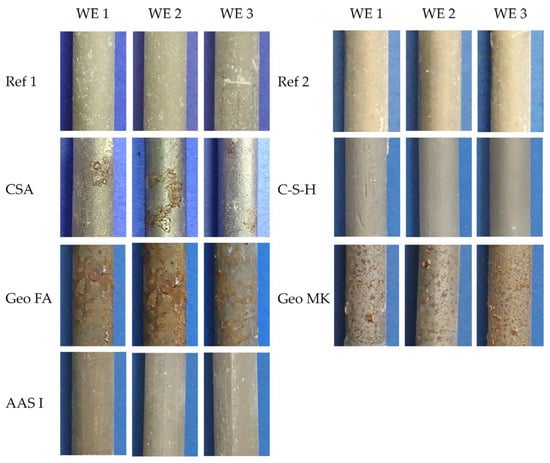
Figure 11.
Working electrodes after the tests.
The mortars that showed signs of corrosion on the steel surfaces were selected for further tests to answer the following questions:
- Was the passivation influenced by the storage conditions, where the specimens were covered by plastic sheets for the first 7 days and stayed in their formwork for the whole 28 days?
- Has the corrosion occurred before or during the determination of the polarization curve?
4. Additional Tests on the Influence of Early Age Treatment on Geopolymers and CSA
The binder types that showed signs of corrosion in the tests described above were investigated in additional tests to study the influence of the storage conditions on the onset of passivation. Therefore, three new specimens for each binder type were produced in the same setup as before (see Figure 1). In a deviation from the tests described above, these test specimens were stripped at the age of 2 days and stored in the laboratory (20 °C, 50% RH). The OCP was measured for a period of 14 days. Subsequently, an anodic polarization curve was recorded, analogous to the parameters listed in Table 3, but on only one of the three test specimens. The aim was to see whether the corrosion phenomena occurred prior to or were caused by the polarization.
The results of the OCP measurements on the additional specimens as a mean value of three specimens are displayed in Figure 12. The Geo MK specimens show a direct reaction when the formwork was removed after two days, resulting in an immediate sharp increase in the OCP in all three specimens. For this mortar formulation, an influence of early age treatment is obvious. In the test specimens that stayed in their formwork for 28 days and were covered with plastic sheets (not airtight) for the first 7 days (see Figure 2), passivation also began after 2 days, but the OCP only increased slowly until the plastic sheets were removed after 7 days. Possible causes for this could be the consumption of oxygen, because the specimens were enclosed by their containers and the plastic sheets on top.
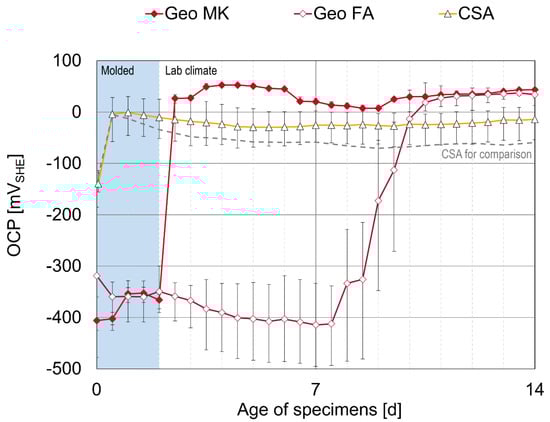
Figure 12.
OCP measurements on additional specimens that were removed from formwork at the age of 2 days, displayed as mean values of three specimens.
Different conclusions can be drawn for the Geo FA specimens. Even if the test specimens are stripped after 2 days (Figure 12), the OCP only begins to rise after 7–9 days, similar to the test specimens that stayed in formwork (Figure 2). The delay in the onset of passivation is, therefore, not attributed to the storage conditions, but rather to the slow reaction kinetics of the fly ash geopolymer activated by sodium silicate and NaOH. However, the time from the onset of passivation to reach stable, more positive OCP values is shorter in the specimens removed from the formwork.
The potential development of CSA shows a similar curve to that of the test specimens in molds, but with slightly more positive OCP values. The values from Figure 2 are shown for comparison as a gray dashed line in Figure 12. Other authors also observed more negative potential values in CSA than in OPC-based concrete [11]. The difference in OCP values of CSA and OPC concretes observed in other studies was more significant in higher relative humidity, where drying is less likely [11].
The pictures of the working electrodes after the additional tests are shown in Figure 13. The electrodes on the left side have undergone the anodic polarization test at the age of 14 days, those on the right side have not. The Geo MK electrodes do not show any corrosion spots, not even the polarized sample. This leads to the assumption that the passivation in the demolded specimens in a laboratory climate was more protective than in the molded specimens. At the Geo FA electrodes, corrosion only occurred on the polarized sample, which indicates that the corrosion happened due to the high polarization over a certain time. The description of the polarization curves (Section 3.1, Figure 3) suggests that these corrosion phenomena took place at a potential above 400 mVSHE. The generalized corrosion can be an effect of a passivation layer that is still weak, because passivation has been delayed. In addition, the polarization can cause a movement of OH− ions away from the working electrode, leading to a decrease in pH at the steel surface. In a rapid migration test on this mortar, comparatively low voltages and short test durations were sufficient to allow chloride ions to migrate into the mortar [54], which indicates that OH− ions may also migrate more easily in this mortar than in mortars made from other binder types.
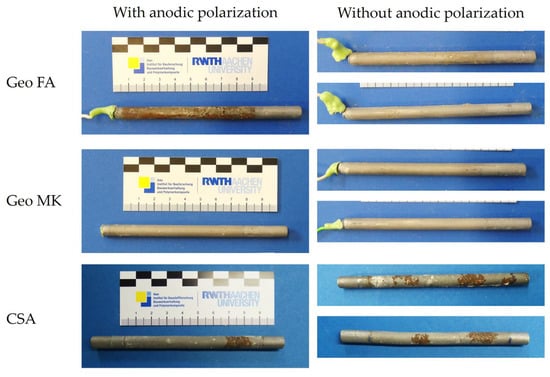
Figure 13.
Working electrodes from additional tests with and without anodic polarization.
The electrodes from the additional CSA specimens showed signs of corrosion, regardless of whether they had been polarized or not. It is, therefore, concluded that the corrosion spots occurred because of weak passivation and the presence of chloride and sulfate ions in the CSA pore solution that can promote corrosion. Other authors have also observed that corrosion spots tend to occur in CSA in the early days prior to passivation commencing [17].
5. Summary
The two cement types used as references show the expected behavior in steel passivation. The passivation of steel in Ref 1 (CEM I) mortar starts immediately after casting and almost stable OCP values with just a slight increase are reached after 5 to 7 days. Increasing OCP values tend to occur together with rising polarization resistances and a decrease in the double-layer capacitances. The passive state at the age of 28 days was confirmed using a polarization curve without peaks in the current density up to the potential associated with oxygen evolution and uncorroded surfaces of the working electrodes after the test. The same applies for Ref 2 (CEM III/B) with the only difference being that the OCP readings start to increase at the age of 3 days and take until the age of 11–13 days to remain stable. The slower passivation is also reflected in the polarization resistances that need until day 25 to reach the same values that the Ref 1 specimens attain.
CSA showed the lowest OCP values at the age of 28 days, without a clear trend to rising values. The same applies to the polarization resistances from EIS. The values were in the region of 1000 kΩ ∙ cm2 after 28 days and were, therefore, lower than for all other binders. The polarization curves do not show peaks that would indicate pitting, but rather locally distributed signs of corrosion were visible on the steel surfaces after the tests. Slightly more positive OCP values were observed in additional tests where desiccation could take place unhindered. But the indifferent trend remains the same under this treatment. Corrosion products were also visible in the additional tests on polarized and nonpolarized samples, so it is concluded that the corrosion products occurred before the age of 14 days. Carsana et al. [17] observed higher current densities and lower potentials with this binder in the initial stages of curing and concluded that visible corrosion spots can occur in the early stages of passivation in the mortar. Also, the high resistivity of CSA was confirmed [17]. According to earlier investigations, this is an effect of a pore solution with comparably low conductivity [44]. The weak passivation of steel in CSA mortar observed in this study can be an effect of the lower pH of the pore solution and high amounts of SO42− and Cl−, typical for CA-based materials [10,11,13,15] and the test conditions where desiccation was impeded. However, the literature findings show better durability characteristics of mixed systems with OPC and CA than with pure CA systems [17,55]; long-term investigations indicate that corrosion protection is possible in CA-based materials even in a chloride-rich environment. So further research is required to describe the corrosion behavior of steel in CA-based materials that are subject to carbonation or chloride ingress.
For Celitement (C-S-H), there are hardly any studies on the influence of corrosion behavior of embedded steel because this binder type is very new and only produced in a small pilot plant that was built in 2011 [22]. The OCP showed values more positive than for the other binder types right from the beginning. They increased immediately and reached stable values after 5 to 7 days, slightly more positive than the other binder types. The increase in potential was accompanied by a decrease in the double-layer capacitances. Polarization resistances could not be reliably determined using EIS. However, the beginning of the semicircles visible in the Nyquist plot indicate continuously increasing and comparably high polarization resistances. The fit values of the impedance spectra indicate a diffusion process influencing the system. The passive state was confirmed by a polarization curve that showed low current densities and steel surfaces without any signs of corrosion after the tests. The high resistivity of this mortar makes electrochemical measurements challenging. Although the reference electrodes were embedded directly in the mortar near the steel surface, the lowest impedance at the age of 28 days shown in the impedance spectra was around 2 kΩ and around 18 times higher than in the CEM I specimens with the same setup. Therefore, in electrochemical experiments with this mortar, the IR-drop has to be expected to have a greater influence on polarization curves and the effect of sweep rates [56] than in comparable experiments with other binder types.
The low-Ca AAMs/geopolymers showed delayed passivation, which was also observed by other authors [28,30]. However, the delay was influenced by the method of storage of the test specimens and the formulation. In the fly ash activated by sodium silicate and NaOH (Geo FA), the passivation of the steel started at the age of 7 days, regardless of whether the test specimens were molded and covered with plastic sheets for seven days or demolded after 2 days and exposed to the laboratory climate. The passivation of the steel in the Geo FA specimens seems weaker than in OPC at the tested ages, indicated by lower polarization resistances and the presence of visible corrosion products that occurred during the anodic polarization curve. Unpolarized steel surfaces remained without corrosion products. The delay of the onset of passivation indicates that this formula should be tested at a later age because the passivation can still occur after 28 days. The passivation of the steel in the metakaolin activated by potassium silicate showed a storage-dependent onset of passivation. In the specimens that were kept in molds and covered with plastic sheets, the OCP started to rise at the age of three days and took until an age of ~14 days to reach almost stable values. The steel surfaces polarized at the age of 28 days showed corrosion spots evenly distributed over the steel surface, although the polarization resistances estimated from impedance spectroscopy were higher than in OPC. The specimens that were demolded and kept in the laboratory from the age of two days showed an immediate rise of the OCP after demolding and no signs of corrosion, even after polarization at the age of 14 days. The onset of passivation was found to be more delayed in the fly ash activated by a sodium-based activator than in the metakaolin activated by a potassium-based activator. Tittarelli et al. [28] observed that the delay in the onset of passivation was more distinct in a metakaolin combined with a sodium-based activator than in fly ash combined with a potassium-based activator. This indicates that the early passivation behavior might be more influenced by the type of activator than by the type of precursor. However, systematic research on the impact of the activator solution on passivation is recommended. The resistivity of the geopolymers was very low compared to the other binder types, which is consistent with the literature findings [33,46,47].
The high-Ca AAM (AAS I) leads to the passivation of the steel. The OCP values were the lowest at the beginning but showed a sharp increase and reached stable values at the age of five to seven days. The passive state at the age of 28 days was confirmed by polarization resistances higher than in the reference cements, a polarization curve with a passive shape and steel surfaces that show no signs of corrosion after the polarization. However, the results are not typical in some details. The OCP values of steel in AASs can be considerably lower than in OPC and polarization curves can have a different shape, probably due to the amount of reduced sulfur species in the pore solution of AASs [23,24,25]. This was not observed here but can be explained by the low content of sulfur in the investigated AAS. The pressed-out pore solution of the investigated AAS showed a content of total sulfur of 8.79 mM at the age of seven days and 3.34 mM at the age of 28 days, respectively. This is low compared to the pore solutions of other alkali-activated slags.
6. Conclusions
From the measurements, the following conclusions can be drawn for the passivation of steel in the investigated mortar formulations made of different novel binder types as an alternative to OPC:
- The CA mortar shows a weaker passivation during the observed period up to an age of 28 days, at least when desiccation is impeded. Lower and fluctuating OCP and polarization resistances are observed than in other binder types.
- The mortar based on Celitement (C-S-H) leads to passivation of the steel and reaches stable conditions within 5 to 7 days. The OCP was slightly more positive than for the other binder types investigated here, right from the beginning. Electrochemical measurements can be challenging because of the high resistivity of the mortar.
- The two low-Ca AAMs (geopolymers) based on fly ash or metakaolin showed very low electric resistances of the mortars. The onset of passivation was influenced by the storage condition of the specimens at a young age in the potassium silicate-activated metakaolin. The passivation of steel in alkali-activated fly ash (with sodium-based activator) was delayed and started approximately 7–9 days after casting. This effect was independent of the storage condition.
- The steel in the AAS mortar passivated within 5–7 days. However, the results differ from typical AASs in OCP values and polarization curve shape, which is attributed to the low sulfur content in the investigated AAS.
The findings obtained here will be verified by ongoing investigations into different concrete formulations and further developed by tests on the corrosion behavior of steel reinforcement in different mortars due to chloride ingress.
Author Contributions
R.A.: funding acquisition, project administration, conceptualization, investigation, data curation, formal analysis, visualization, writing—original draft preparation and writing—review and editing; M.R.: funding acquisition, supervision and writing—review and editing. All authors have read and agreed to the published version of the manuscript.
Funding
This research was funded by the German Research Foundation (DFG), grant number 416337623.
Data Availability Statement
The data presented in this study are available on request from the corresponding author.
Conflicts of Interest
The authors declare no conflicts of interest.
Appendix A
Table A1.
Chemical composition of the initial materials (wt.-%).
Table A1.
Chemical composition of the initial materials (wt.-%).
| SiO2 | Al2O3 | Fe2O3 | CaO | MgO | MnO | TiO2 | K2O | Na2O | SO3 | |
|---|---|---|---|---|---|---|---|---|---|---|
| CEM I (Ref 1) | 20.50 | 4.70 | 2.90 | 63.20 | 1.30 | 0.03 | 0.20 | 1.22 | 0.28 | 3.20 |
| CEM III/B (Ref 2) | 30.5 | 8.80 | 1.40 | 45.80 | 6.20 | 0.11 | 0.55 | 1.04 | 0.34 | 2.20 |
| A (CSA) | 6.70 | 24.00 | 3.30 | 43.30 | 1.10 | 0.01 | 1.09 | 0.27 | 0.09 | 17.40 |
| Celitement (C-S-H) | 40.90 | 2.00 | 1.20 | 43.10 | 1.20 | 0.01 | 0.03 | 0.86 | 0.29 | 0.00 |
| Metakaolin (Geo MK) | 65.80 | 21.20 | 4.30 | 2.20 | 0.50 | 0.01 | 0.80 | 0.49 | 0.16 | 0.10 |
| Fly ash (Geo FA) | 56.15 | 21.83 | 8.68 | 5.61 | 2.29 | 0.08 | 0.94 | 2.19 | 0.89 | 0.45 |
| Slag (AAS I) | 29.28 | 17.61 | 1.35 | 41.05 | 6.05 | 0.24 | 0.59 | 0.14 | 0.84 | 0.74 |
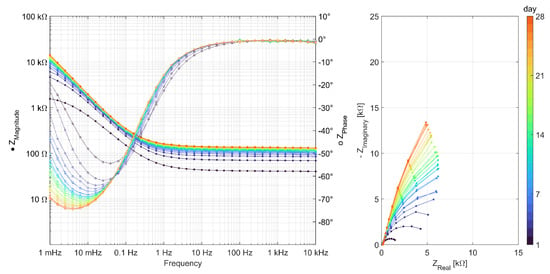
Figure A1.
EIS measurements carried out daily over 28 days for series Ref 1 (CEM I).
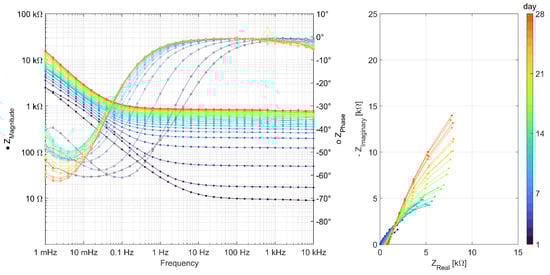
Figure A2.
EIS measurements carried out daily over 28 days for series Ref 2 (CEM III).
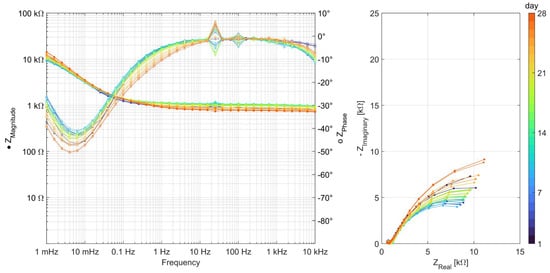
Figure A3.
EIS measurements carried out daily over 28 days for series CSA.
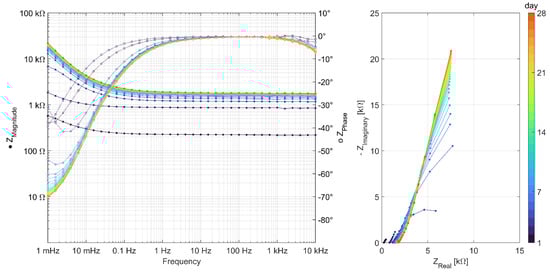
Figure A4.
EIS measurements carried out daily over 28 days for series C-S-H (Celitement).
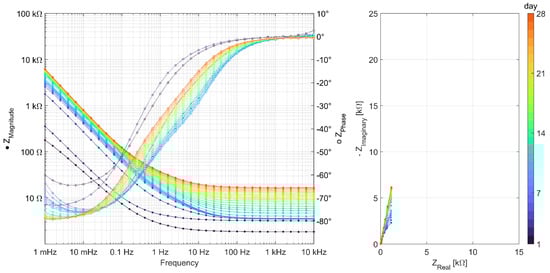
Figure A5.
EIS measurements carried out daily over 28 days for series Geo MK.
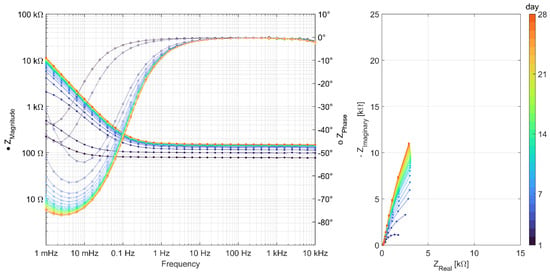
Figure A6.
EIS measurements carried out daily over 28 days for series AAS I.
References
- Olivier, J.G.J.; Janssens-Maenhout, G.; Muntean, M.; Peters, J.A. Trends in Global CO2 Emissions: 2016 Report. 2016. Available online: https://www.pbl.nl/en/publications/trends-in-global-co2-emissions-2016-report (accessed on 1 February 2024).
- Miller, S.A.; Horvath, A.; Monteiro, P.J.M. Readily implementable techniques can cut annual CO2 emissions from the production of concrete by over 20%. Environ. Res. Lett. 2016, 11, 74029. [Google Scholar] [CrossRef]
- Scrivener, K.; Ben Haha, M.; Juilland, P.; Levy, C. Research needs for cementitious building materials with focus on Europe. RILEM Tech. Lett. 2022, 7, 220–252. [Google Scholar] [CrossRef]
- Alhozaimy, A.; Hussain, R.R.; Al-Negheimish, A. Significance of oxygen concentration on the quality of passive film formation for steel reinforced concrete structures during the initial curing of concrete. Cem. Concr. Compos. 2016, 65, 171–176. [Google Scholar] [CrossRef]
- Poursaee, A.; Hansson, C.M. Reinforcing steel passivation in mortar and pore solution. Cem. Concr. Res. 2007, 37, 1127–1133. [Google Scholar] [CrossRef]
- Poursaee, A. Corrosion of Steel in Concrete Structures, 2nd ed.; Elsevier Science & Technology: San Diego, CA, USA, 2023; ISBN 978-0-12-821840-2. [Google Scholar]
- Sharp, J.H.; Lawrence, C.D.; Yang, R. Calcium sulfoaluminate cements—Low-energy cements, special cements or what? Adv. Cem. Res. 1999, 11, 3–13. [Google Scholar] [CrossRef]
- Glasser, F.P.; Zhang, L. High-performance cement matrices based on calcium sulfoaluminate–belite compositions. Cem. Concr. Res. 2001, 31, 1881–1886. [Google Scholar] [CrossRef]
- Kraft, B.; Achenbach, R.; Ludwig, H.-M.; Raupach, M. Hydration and Carbonation of Alternative Binders. CMD 2022, 3, 19–52. [Google Scholar] [CrossRef]
- Andac, M.; Glasser, F.P. Pore solution composition of calcium sulfoaluminate cement. Adv. Cem. Res. 1999, 11, 23–26. [Google Scholar] [CrossRef]
- Carsana, M.; Bianchi, M.; Canonico, F.; Buzzi, L.; Capelli, L.; Bertolini, L. Corrosion behaviour of steel embedded in calcium sulphoaluminate-cement concrete. In Proceedings of the 14th International Congress on the Chemistry of Cement, Beijing, China, 13–16 October 2015. [Google Scholar]
- Coppola, L.; Bellezze, T.; Belli, A.; Bignozzi, M.C.; Bolzoni, F.; Brenna, A.; Cabrini, M.; Candamano, S.; Cappai, M.; Caputo, D.; et al. Binders alternative to Portland cement and waste management for sustainable construction—Part 1. J. Appl. Biomater. Funct. Mater. 2018, 16, 186–202. [Google Scholar] [CrossRef] [PubMed]
- Wang, L.; Zhan, S.; Tang, X.; Xu, Q.; Qian, K. Pore Solution Chemistry of Calcium Sulfoaluminate Cement and Its Effects on Steel Passivation. Appl. Sci. 2019, 9, 1092. [Google Scholar] [CrossRef]
- Kalogridis, D.; Kostogloudis, G.; Ftikos, C.; Malami, C. A quantitative study of the influence of non-expansive sulfoaluminate cement on the corrosion of steel reinforcement. Cem. Concr. Res. 2000, 30, 1731–1740. [Google Scholar] [CrossRef]
- Winnefeld, F.; Lothenbach, B. Hydration of calcium sulfoaluminate cements—Experimental findings and thermodynamic modelling. Cem. Concr. Res. 2010, 40, 1239–1247. [Google Scholar] [CrossRef]
- Wang, L.; Jian, Q.; Zhan, S.; Song, Y.; Ruan, S. Chloride-induced corrosion patterns of reinforcements in simulated pore solutions of calcium sulfoaluminate cement concrete: An analytical study. J. Build. Eng. 2024, 82, 108189. [Google Scholar] [CrossRef]
- Carsana, M.; Canonico, F.; Bertolini, L. Corrosion resistance of steel embedded in sulfoaluminate-based binders. Cem. Concr. Compos. 2018, 88, 211–219. [Google Scholar] [CrossRef]
- Yang, F. Corrosion Protection of Steel Embedded in New Sustainable Cementitious Materials. Ph.D. Thesis, Politecnico di Milano, Milan, Italy, 2017. [Google Scholar]
- Tan, B.; Okoronkwo, M.U.; Kumar, A.; Ma, H. Durability of calcium sulfoaluminate cement concrete. J. Zhejiang Univ. Sci. A 2020, 21, 118–128. [Google Scholar] [CrossRef]
- European Cement Research Academy. Development of State of the Art-Techniques in Cement Manufacturing: Trying to Look Ahead; CSI/ECRATechnology Papers 2017; European Cement Research Academy: Duesseldorf, Germany, 2017; Available online: https://ecra-online.org/research/technology-papers (accessed on 20 March 2024).
- Hinder, D.; Zimmermann, A.; Fylak, M. Mechanochemical Activation of the C-S-H binder Celitement. CE/Papers 2023, 6, 54–61. [Google Scholar] [CrossRef]
- Nolting, U.; Dehn, F.; Haist, M.; Link, J. Betone der Zukunft: Herausforderungen und Chancen. In Proceedings of the 14th Symposium Baustoffe und Bauwerkserhaltung, Karlsruher Institut für Technologie (KIT), Karlsruhe, Germany, 21 March 2018; Nolting, U., Dehn, F., Haist, M., Link, J., Eds.; KIT Scientific Publishing: Karlsruhe, Germany, 2018. ISBN 978-3-731507673. [Google Scholar]
- Mundra, S. Corrosion of Steel in Alkali-Activated Materials. Ph.D. Thesis, University of Sheffield, Sheffield, UK, 2018. [Google Scholar]
- Mundra, S.; Samson, G.; Masi, G.; Achenbach, R.; Bastidas, D.M.; Bernal, S.A.; Bignozzi, M.C.; Criado, M.; Cyr, M.; Gartner, N.; et al. Application of electrochemical methods for studying steel corrosion in alkali-activated materials. Mater. Corros. 2023, 74, 988–1008. [Google Scholar] [CrossRef]
- Mundra, S.; Provis, J.L. Mechanisms of passivation and chloride-induced corrosion of mild steel in sulfide-containing alkaline solutions. J. Mater. Sci. 2021, 56, 14783–14802. [Google Scholar] [CrossRef]
- Zuo, Y.; Nedeljković, M.; Ye, G. Pore solution composition of alkali-activated slag/fly ash pastes. Cem. Concr. Res. 2019, 115, 230–250. [Google Scholar] [CrossRef]
- Gruskovnjak, A.; Lothenbach, B.; Holzer, L.; Figi, R.; Winnefeld, F. Hydration of alkali-activated slag: Comparison with ordinary Portland cement. Adv. Cem. Res. 2006, 18, 119–128. [Google Scholar] [CrossRef]
- Tittarelli, F.; Mobili, A.; Giosuè, C.; Belli, A.; Bellezze, T. Corrosion behaviour of bare and galvanized steel in geopolymer and Ordinary Portland Cement based mortars with the same strength class exposed to chlorides. Corros. Sci. 2018, 134, 64–77. [Google Scholar] [CrossRef]
- Fan, L.F.; Zhong, W.L.; Zhang, Y.H. Effect of the composition and concentration of geopolymer pore solution on the passivation characteristics of reinforcement. Constr. Build. Mater. 2022, 319, 126128. [Google Scholar] [CrossRef]
- Mobili, A.; Belli, A.; Giosuè, C.; Bellezze, T.; Tittarelli, F. Metakaolin and fly ash alkali-activated mortars compared with cementitious mortars at the same strength class. Cem. Concr. Res. 2016, 88, 198–210. [Google Scholar] [CrossRef]
- DIN EN 197-1; Zement: Teil 1: Zusammensetzung, Anforderungen und Konformitätskriterien von Normalzement. Beuth Verlag GmbH: Berlin, Germany, 2011.
- DIN EN 10025-2; Warmgewalzte Erzeugnisse aus Baustählen: Teil 2: Technische Lieferbedingungen für Unlegierte Baustähle. Beuth Verlag GmbH: Berlin, Germany, 2019.
- Mundra, S.; Bernal, S.A.; Criado, M.; Hlaváček, P.; Ebell, G.; Reinemann, S.; Gluth, G.J.; Provis, J. Steel corrosion in reinforced alkali-activated materials. RILEM Tech. Lett. 2017, 2, 33–39. [Google Scholar] [CrossRef]
- Elsener, B.; Andrade, C.; Gulikers, J.; Polder, R.; Raupach, M. Recommendations of RILEM TC 154-EMC: Electrochemical techniques for measuring metallic corrosion Half-cell potential measurements-Potential mapping on reinforced concrete structures. Mater. Struct. 2003, 36, 461–471. [Google Scholar] [CrossRef]
- Oelßner, W.; Berthold, F.; Guth, U. The iR drop-well-known but often underestimated in electrochemical polarization measurements and corrosion testing. Mater. Corros. 2006, 57, 455–466. [Google Scholar] [CrossRef]
- Andrade, C. Propagation of reinforcement corrosion: Principles, testing and modelling. Mater. Struct. 2019, 52, 2. [Google Scholar] [CrossRef]
- Barsoukov, E.; Macdonald, J.R. Impedance Spectroscopy: Theory, Experiment, and Applications; John Wiley & Sons: Hoboken, NJ, USA, 2018. [Google Scholar]
- Urquidi-Macdonald, M.; Real, S.; Macdonald, D.D. Application of Kramers-Kronig Transforms in the Analysis of Electrochemical Impedance Data: II. Transformations in the Complex Plane. J. Electrochem. Soc. 1986, 133, 2018–2024. [Google Scholar] [CrossRef]
- Herrera Hernández, H.; Ruiz Reynoso, A.M.; Trinidad González, J.C.; González Morán, C.O.; Miranda Hernández, J.G.; Mandujano Ruiz, A.; Morales Hernández, J.; Orozco Cruz, R. Electrochemical Impedance Spectroscopy (EIS): A Review Study of Basic Aspects of the Corrosion Mechanism Applied to Steels. In Electrochemical Impedance Spectroscopy; El-Azazy, M., Min, M., Annus, P., Eds.; IntechOpen: London, UK, 2020; ISBN 978-1-78985-215-8. [Google Scholar]
- Sánchez, M.; Gregori, J.; Alonso, M.C.; García-Jareño, J.J.; Vicente, F. Anodic growth of passive layers on steel rebars in an alkaline medium simulating the concrete pores. Electrochim. Acta 2006, 52, 47–53. [Google Scholar] [CrossRef]
- Hirschorn, B.; Orazem, M.E.; Tribollet, B.; Vivier, V.; Frateur, I.; Musiani, M. Determination of effective capacitance and film thickness from constant-phase-element parameters. Electrochim. Acta 2010, 55, 6218–6227. [Google Scholar] [CrossRef]
- Andrade, C.; Keddam, M.; Nóvoa, X.R.; Pérez, M.C.; Rangel, C.M.; Takenouti, H. Electrochemical behaviour of steel rebars in concrete: Influence of environmental factors and cement chemistry. Electrochim. Acta 2001, 46, 3905–3912. [Google Scholar] [CrossRef]
- Andrade, C.; Castelo, V.; Alonso, C.; González, J.A. The Determination of the Corrosion Rate of Steel Embedded in Concrete by the Polarization Resistance and AC Impedance Methods. In Corrosion Effect of Stray Currents and the Techniques for Evaluating Corrosion of Rebars in Concrete; Victor, C., Ed.; American Society for Testing and Materials: Philadelphia, PA, USA, 1985; pp. 43–63. ISBN 978-0-8031-0468-6. [Google Scholar]
- Achenbach, R.; Raupach, M.; Kraft, B.; Ludwig, H.-M. Comparative study on the electric resistance of mortars made of low carbon binders. Mater. Today Proc. 2023. [Google Scholar] [CrossRef]
- Achenbach, R.; Raupach, M. Applicability of the formation factor for different alternative binder types investigated on mortars. Corrosion 2023, 79, 709–718. [Google Scholar] [CrossRef] [PubMed]
- Gluth, G.J.G.; Ebell, G.; Hlaváček, P.; Mietz, J. Chloride-induced steel corrosion in alkali-activated fly ash mortar: Increased propensity for corrosion initiation at defects. Mater. Corros. 2020, 71, 749–758. [Google Scholar] [CrossRef]
- Runci, A.; Provis, J.L.; Serdar, M. Revealing corrosion parameters of steel in alkali-activated materials. Corros. Sci. 2023, 210, 110849. [Google Scholar] [CrossRef]
- Benoit, M.; Bataillon, C.; Gwinner, B.; Miserque, F.; Orazem, M.E.; Sánchez-Sánchez, C.M.; Tribollet, B.; Vivier, V. Comparison of different methods for measuring the passive film thickness on metals. Electrochim. Acta 2016, 201, 340–347. [Google Scholar] [CrossRef]
- Sánchez, M.; Gregori, J.; Alonso, C.; García-Jareño, J.J.; Takenouti, H.; Vicente, F. Electrochemical impedance spectroscopy for studying passive layers on steel rebars immersed in alkaline solutions simulating concrete pores. Electrochim. Acta 2007, 52, 7634–7641. [Google Scholar] [CrossRef]
- Kurzweil, P. Angewandte Elektrochemie: Grundlagen, Messtechnik, Elektroanalytik, Energiewandlung, Technische Verfahren; Springer Vieweg: Wiesbaden/Heidelberg, Germany, 2020; ISBN 978-3-658-32420-9. [Google Scholar]
- Orazem, M.E.; Tribollet, B. Electrochemical Impedance Spectroscopy; Wiley: Hoboken, NJ, USA, 2008; ISBN 978-0-470-04140-6. [Google Scholar]
- Volpi, E.; Olietti, A.; Stefanoni, M.; Trasatti, S.P. Electrochemical characterization of mild steel in alkaline solutions simulating concrete environment. J. Electroanal. Chem. 2015, 736, 38–46. [Google Scholar] [CrossRef]
- Feliu, V.; González, J.A.; Adrade, C.; Feliu, S. Equivalent circuit for modelling the steel-concrete interface. II. Complications in applying the stern-geary equation to corrosion rate determinations. Corros. Sci. 1998, 40, 995–1006. [Google Scholar] [CrossRef]
- Achenbach, R.; Kraft, B.I.E.; Raupach, M.; Ludwig, H.-M. Eignung des RCM-Versuchs zur Bestimmung des Chloridmigrationskoeffizienten in Mörteln aus alternativen Bindemitteln. CE/Papers 2023, 6, 1237–1245. [Google Scholar] [CrossRef]
- Moffatt, E.G.; Thomas, M.D.A. Durability of Rapid-Strength Concrete Produced with Ettringite-Based Binders. ACI Mater. J. 2018, 115, 105–115. [Google Scholar] [CrossRef]
- Mansfeld, F.; Kendig, M.W. Determination of the polarization resistance from impedance measurements. Mater. Corros. 1983, 34, 397–401. [Google Scholar] [CrossRef]
Disclaimer/Publisher’s Note: The statements, opinions and data contained in all publications are solely those of the individual author(s) and contributor(s) and not of MDPI and/or the editor(s). MDPI and/or the editor(s) disclaim responsibility for any injury to people or property resulting from any ideas, methods, instructions or products referred to in the content. |
© 2024 by the authors. Licensee MDPI, Basel, Switzerland. This article is an open access article distributed under the terms and conditions of the Creative Commons Attribution (CC BY) license (https://creativecommons.org/licenses/by/4.0/).