
Optimal Microgrids in Buildings with Critical Loads and Hybrid Energy Storage


 ,
,  and
and
Abstract
1. Introduction
Literature Review and the State of the Art
2. Materials and Methods
2.1. Optimization Tool: REopt
- Fuel constraints: burning rates per technology and electricity and thermal outputs.
- Thermal production constraints: nominal equipment thermal power and its production per hour.
- Storage system constraints: state of charge for different moments and the nominal powers of the system.
- Production constraints: minimum and maximum values which should be maintained throughout production.
- Production incentives: economic incentives per technology.
- Power rating: this ensures that the equipment’s power is within the imposed limits.
- Load balancing and grid sales: balance between the microgrid system and the sales with the grid.
- Rate tariff constraints: net metering and peak power demand charges per month or per time of use.
- Minimum utility charge: the minimum payment made to the utility.
- Operating reserves: unused power for each time step.
- Emissions and renewable production targets: if the user provides the relevant information, the tool will optimize performance to achieve the emissions and renewable energy targets.
- Non-negativity: ensures that all variables are positive or zero.
2.2. Buildings Analyzed
- California:
- New York:
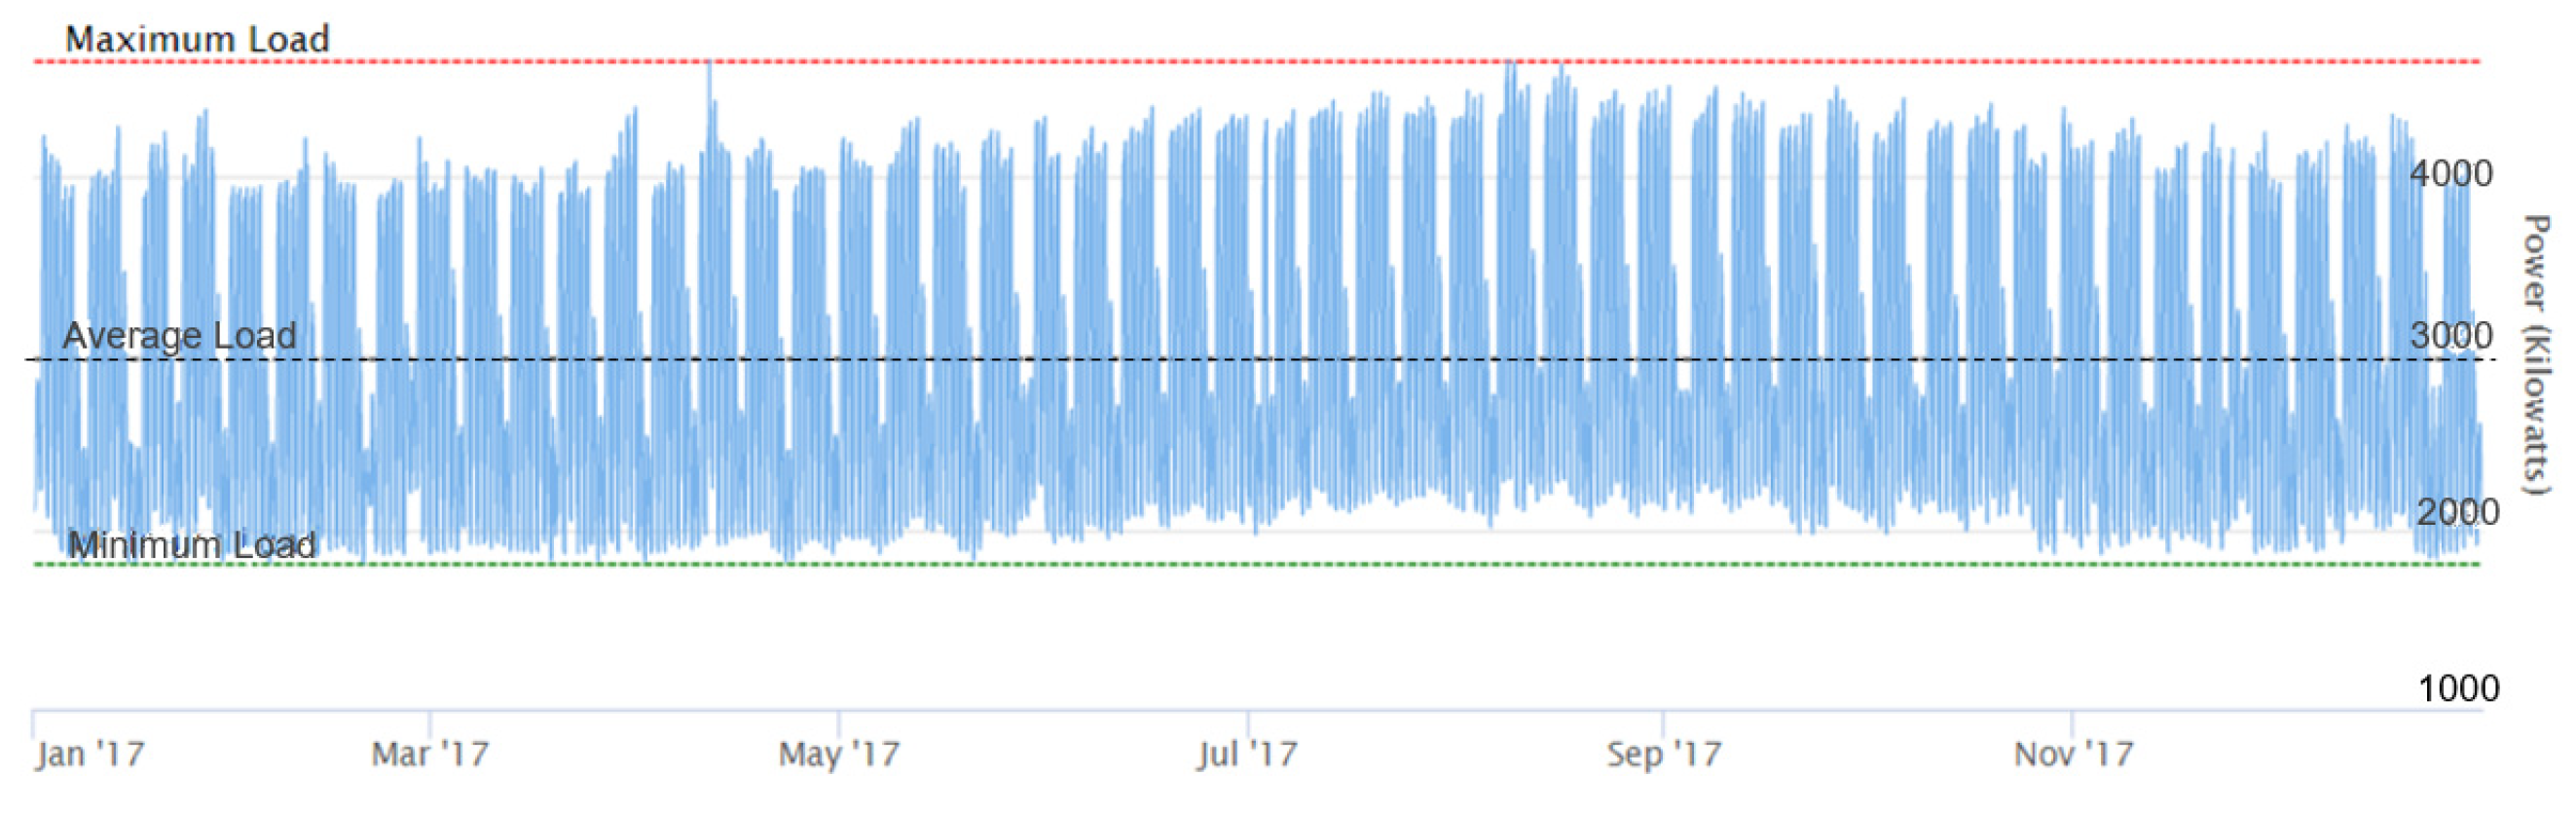
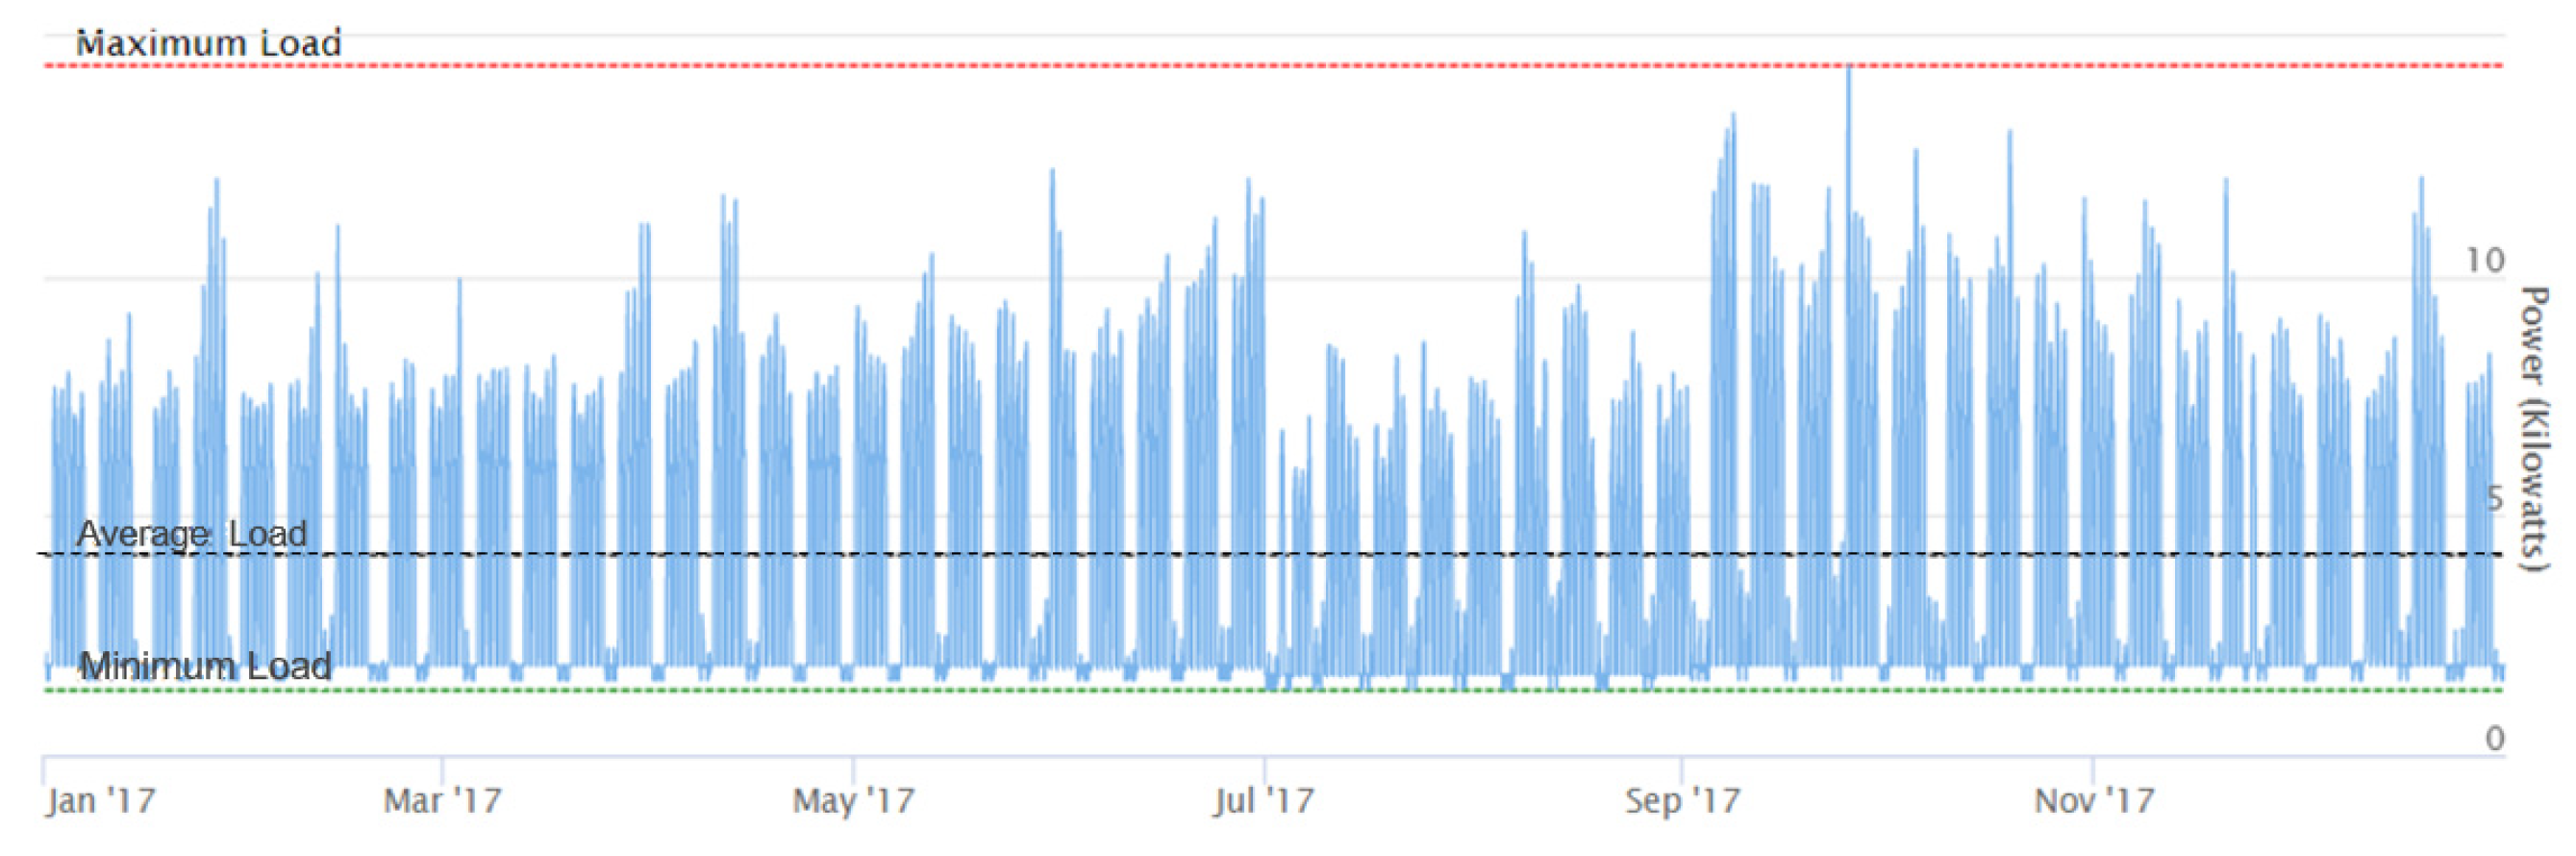
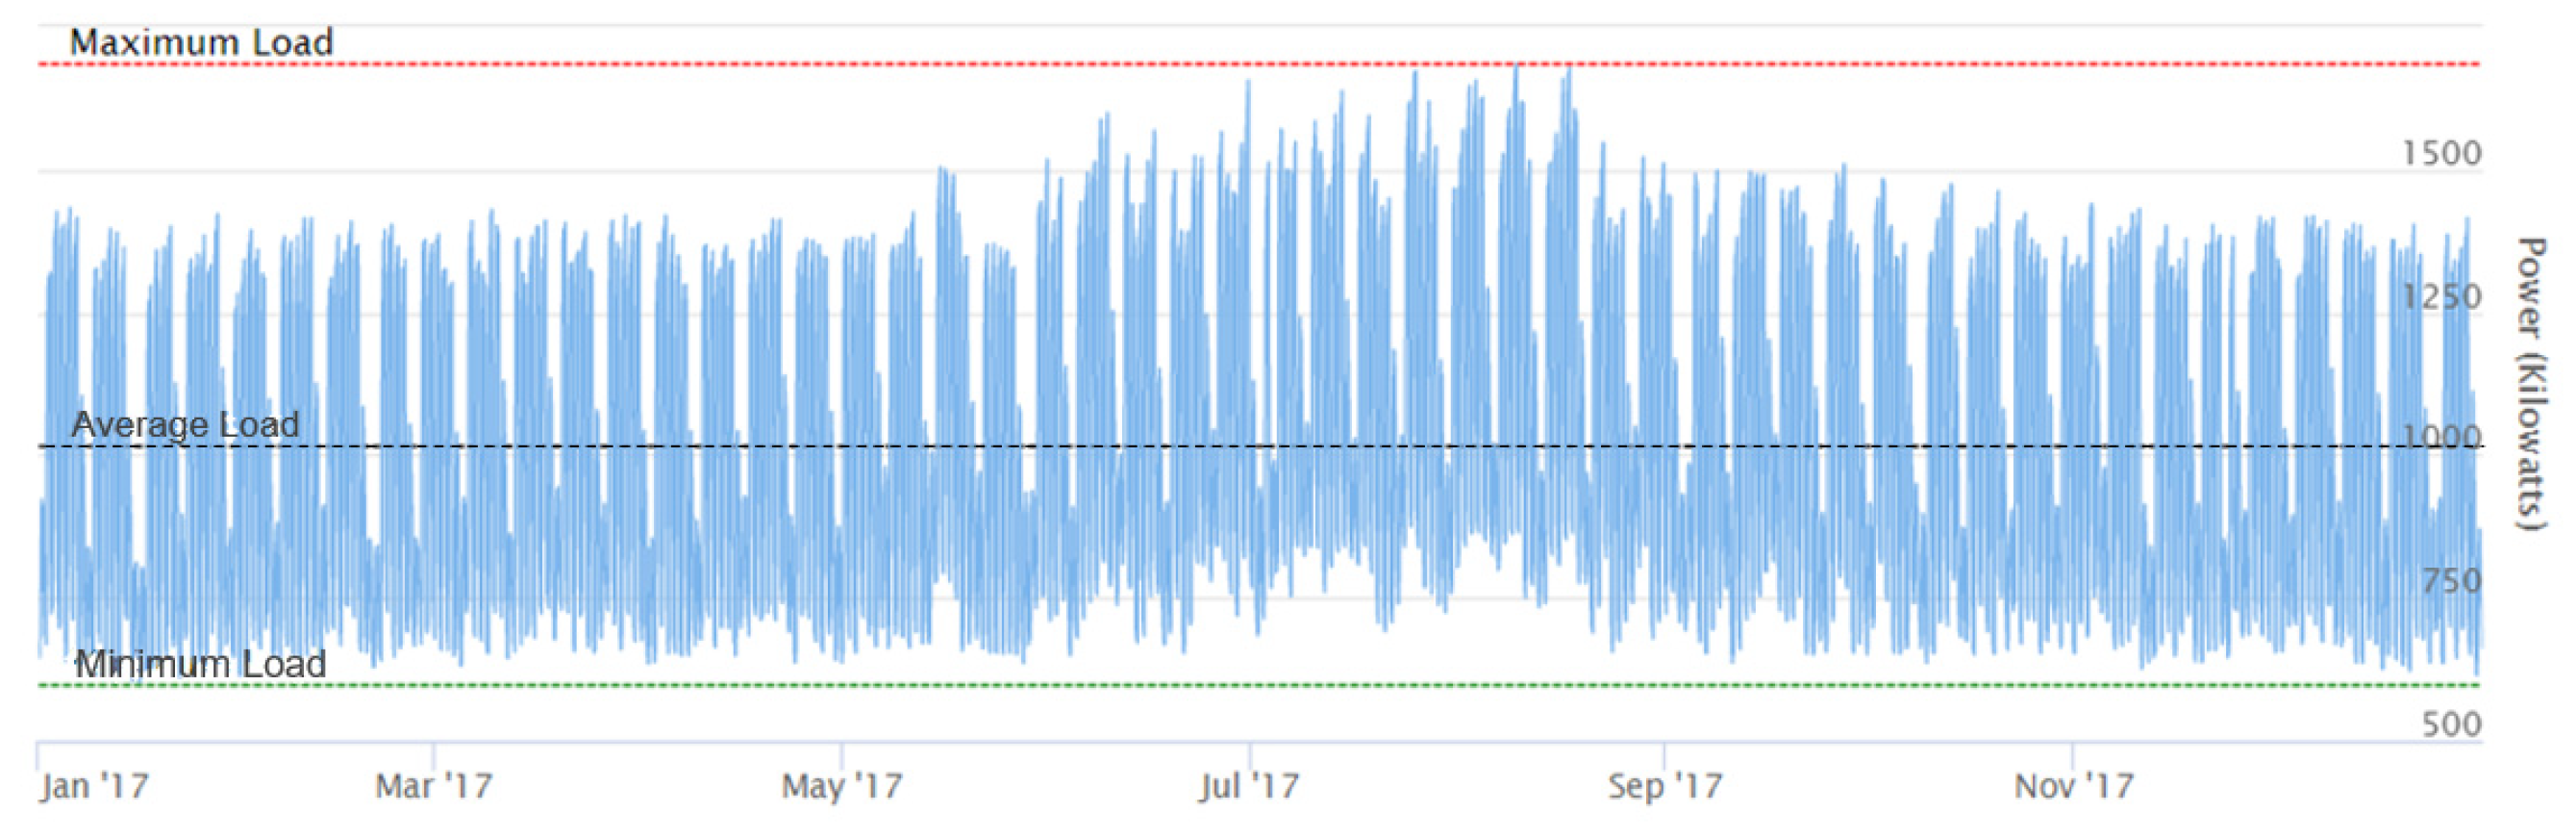
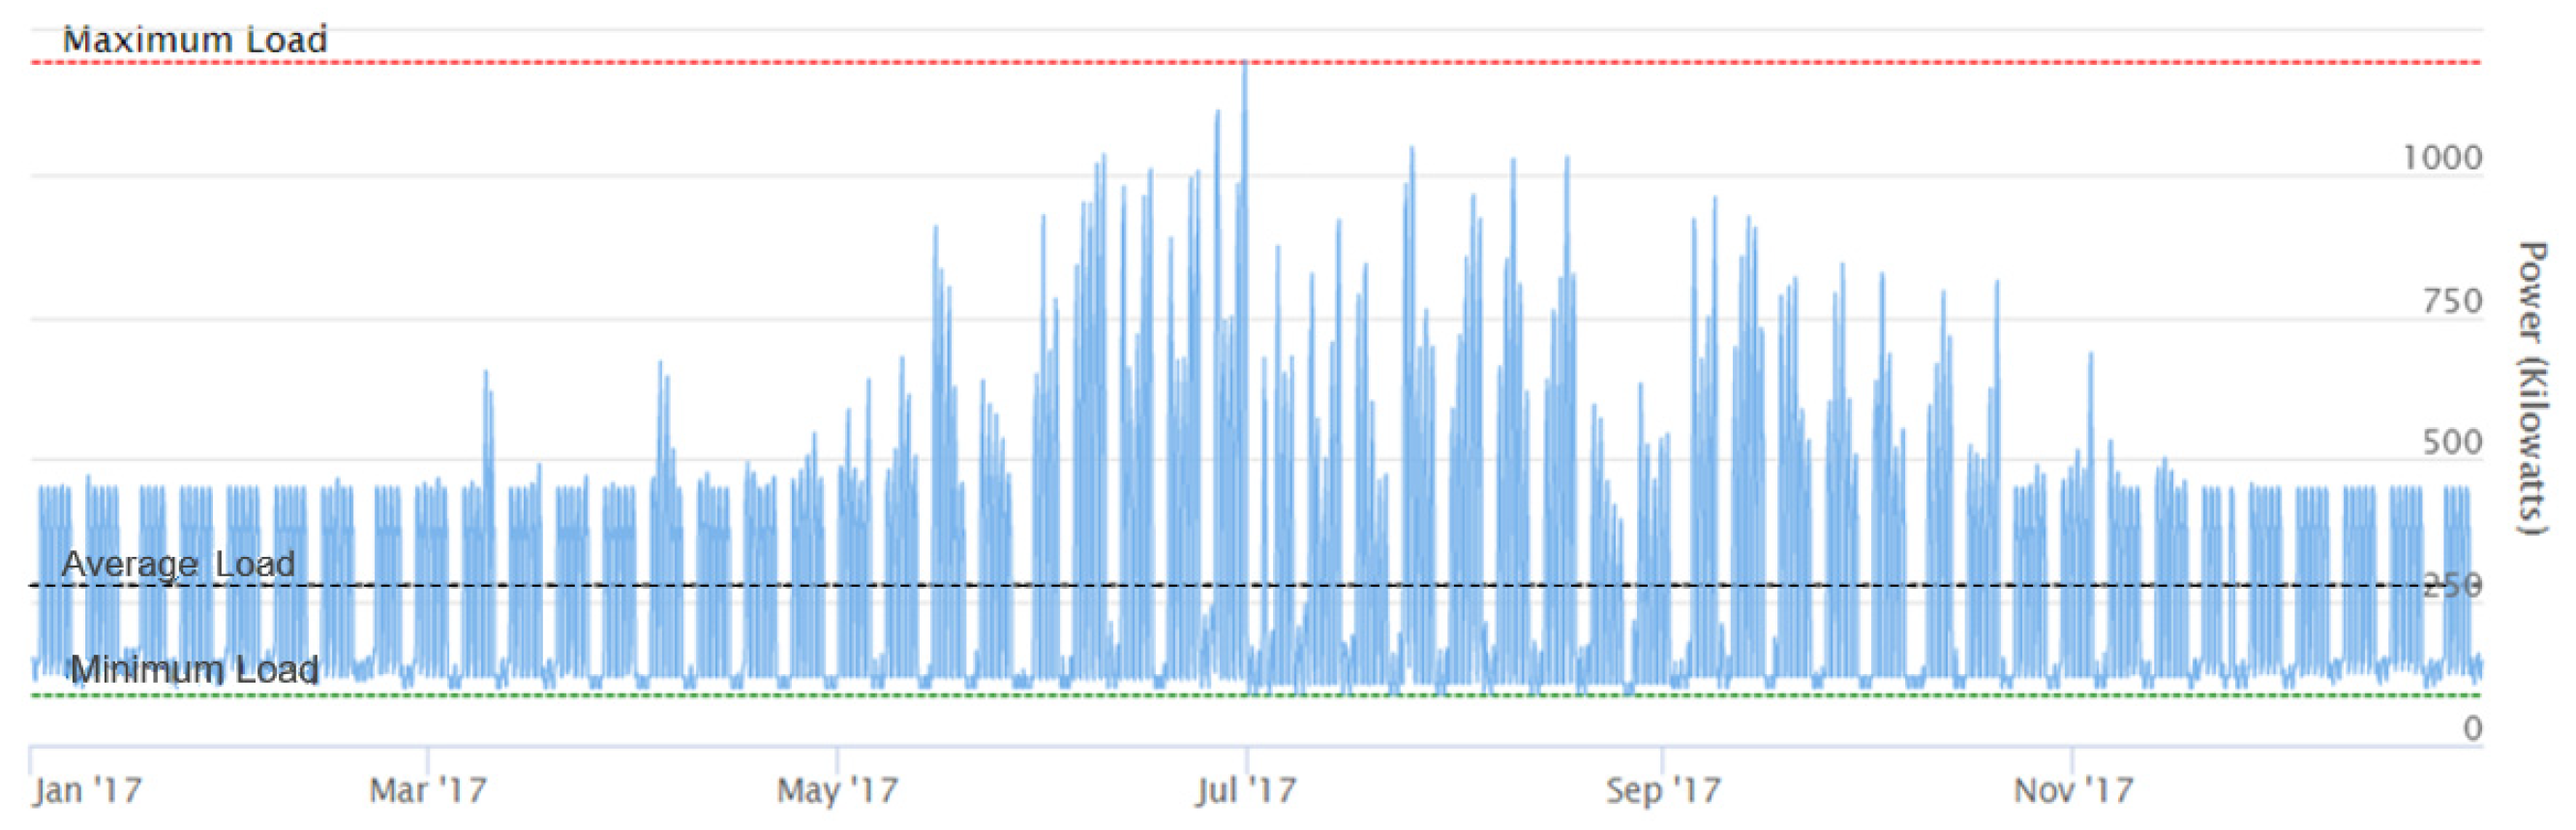
2.2.1. Power Loads
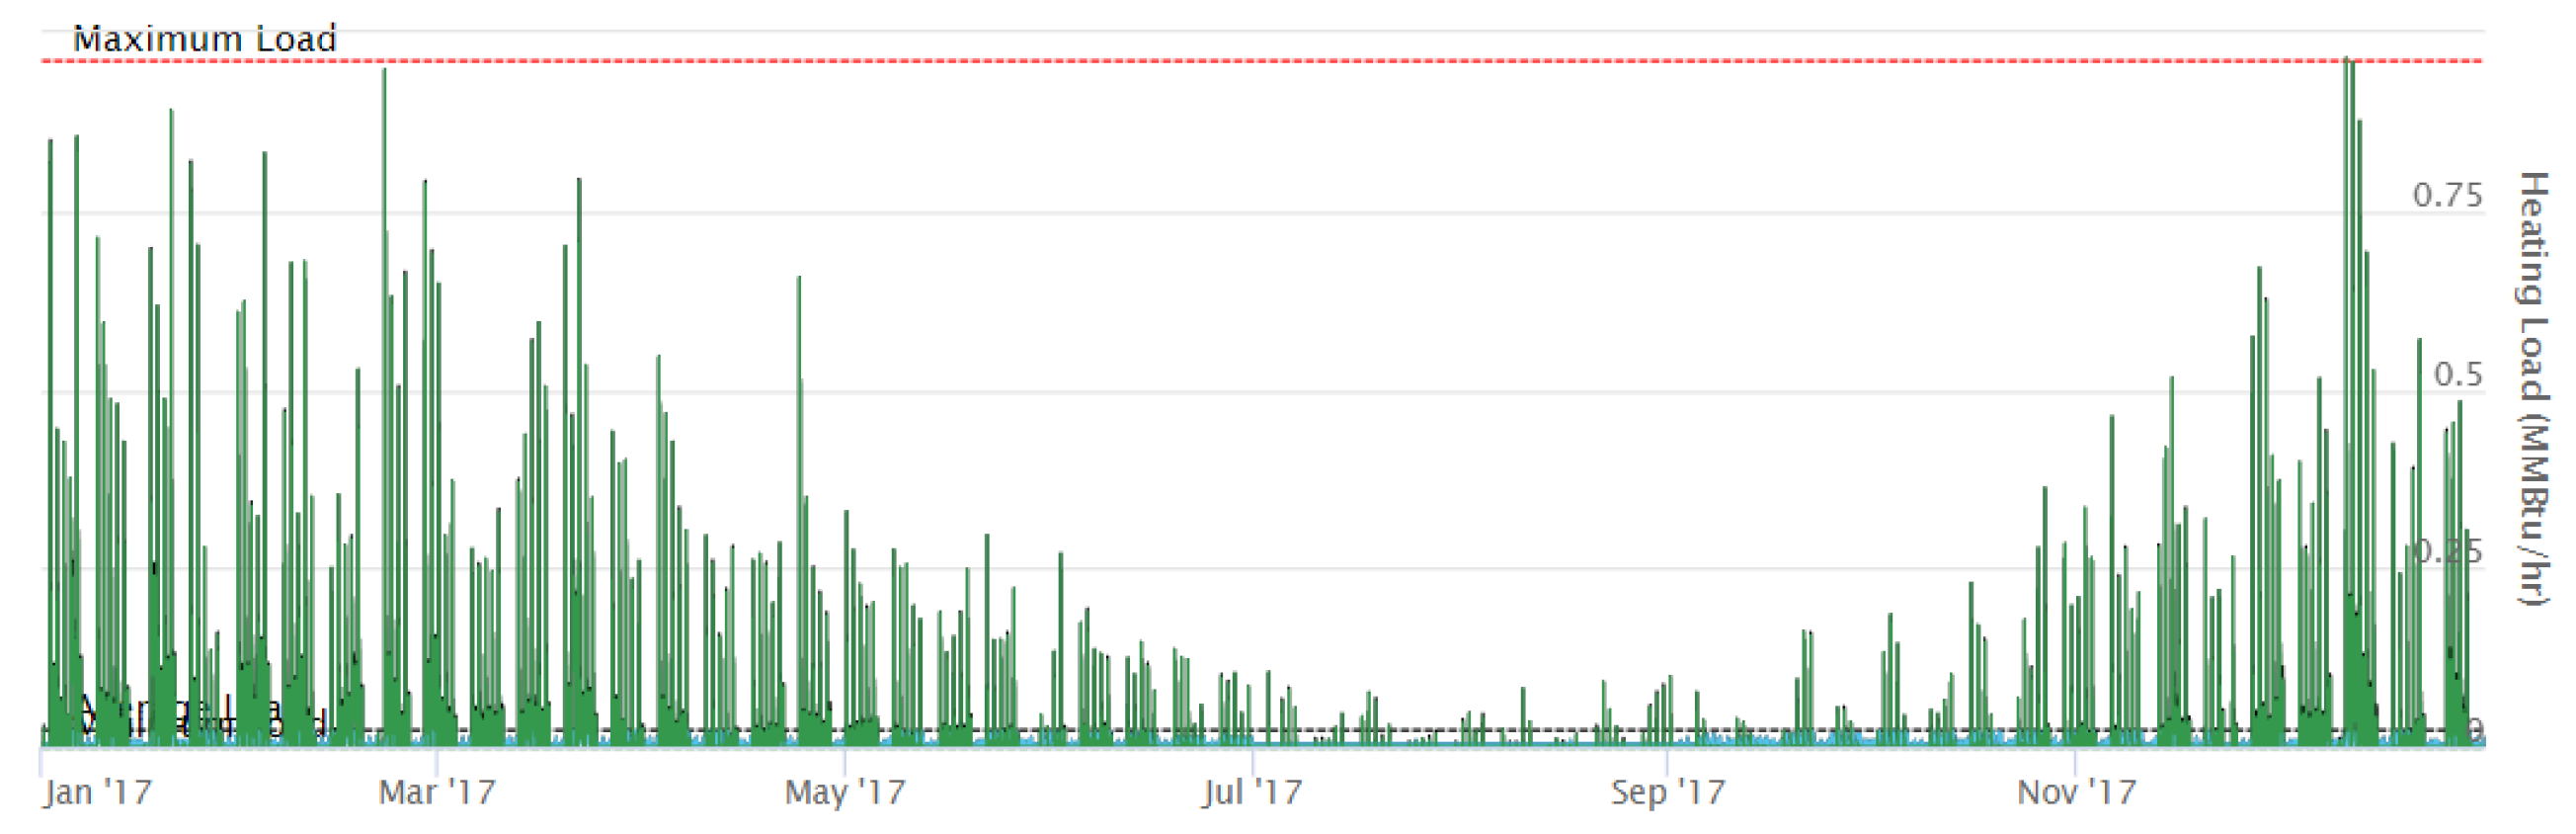
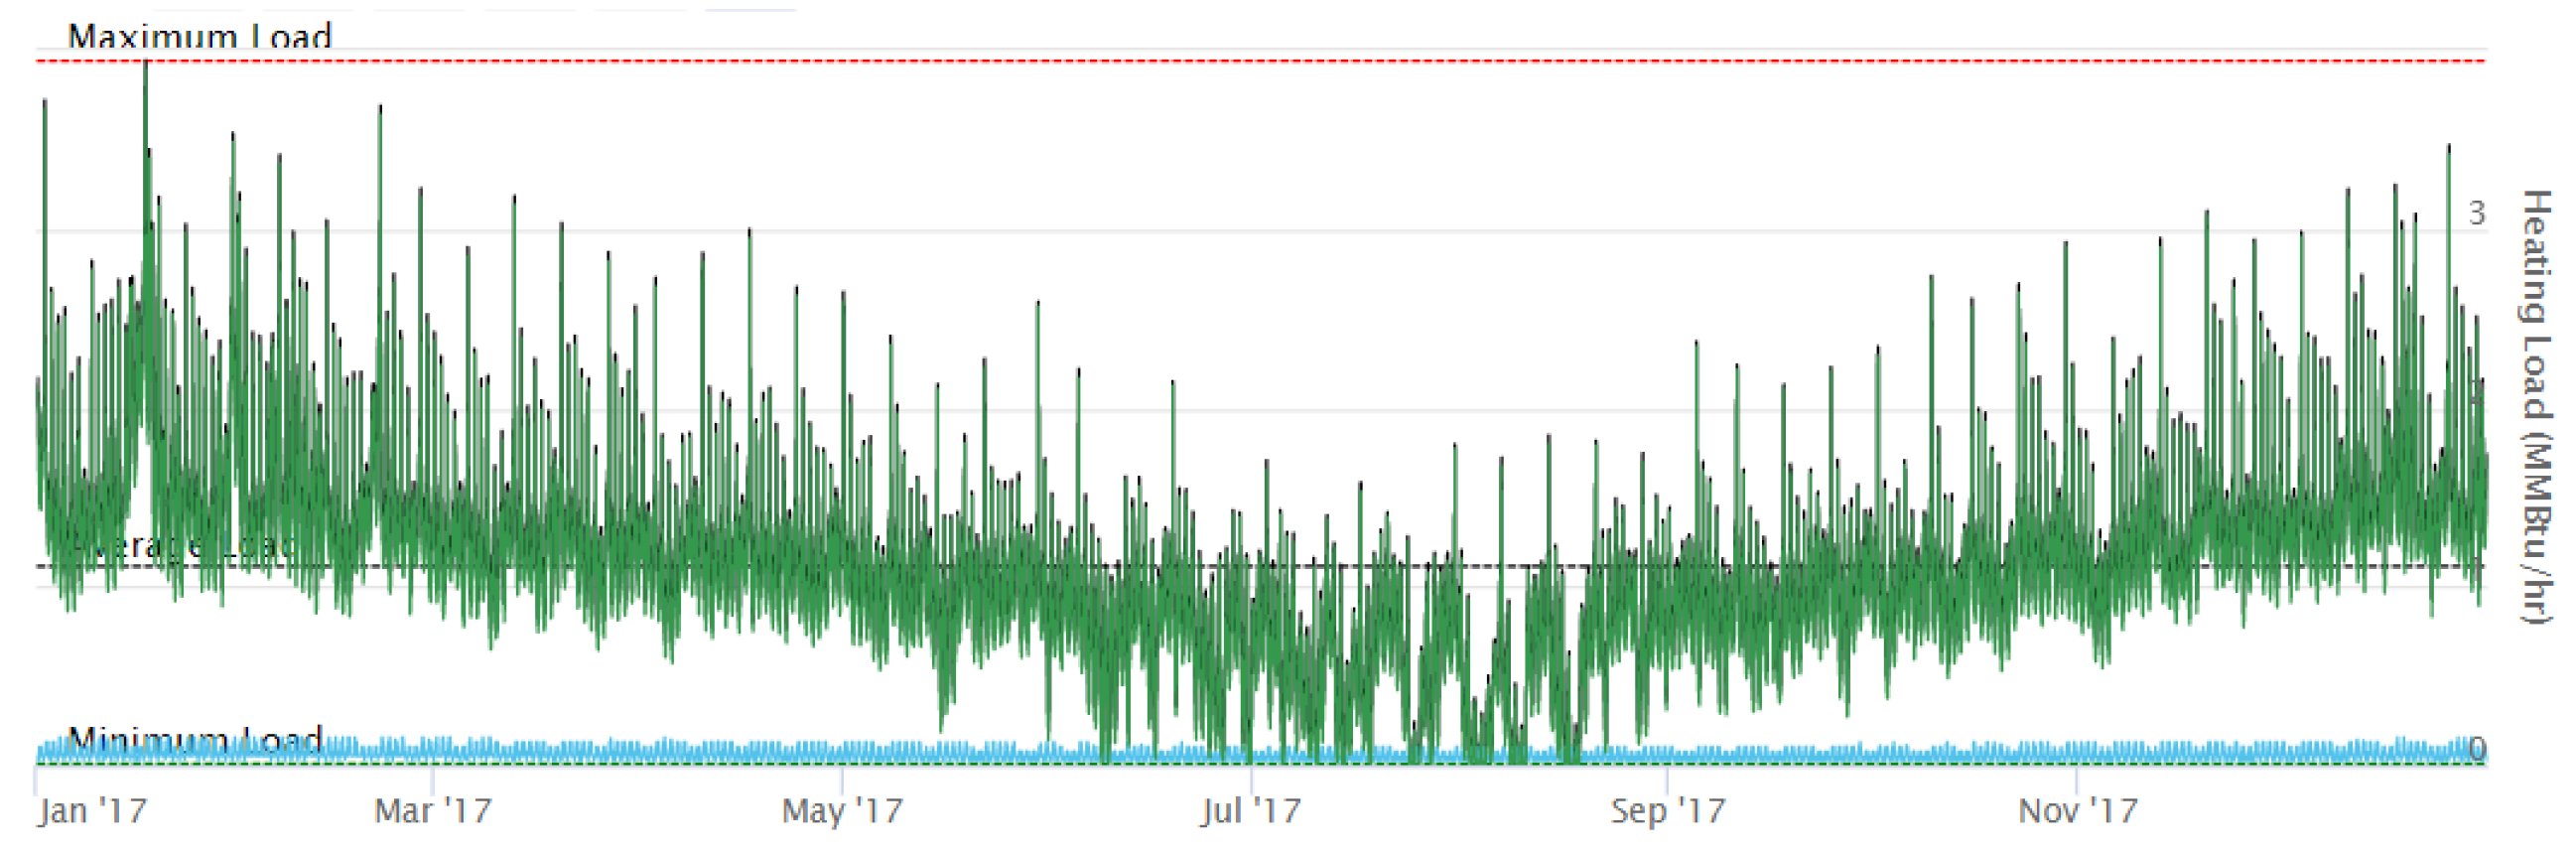
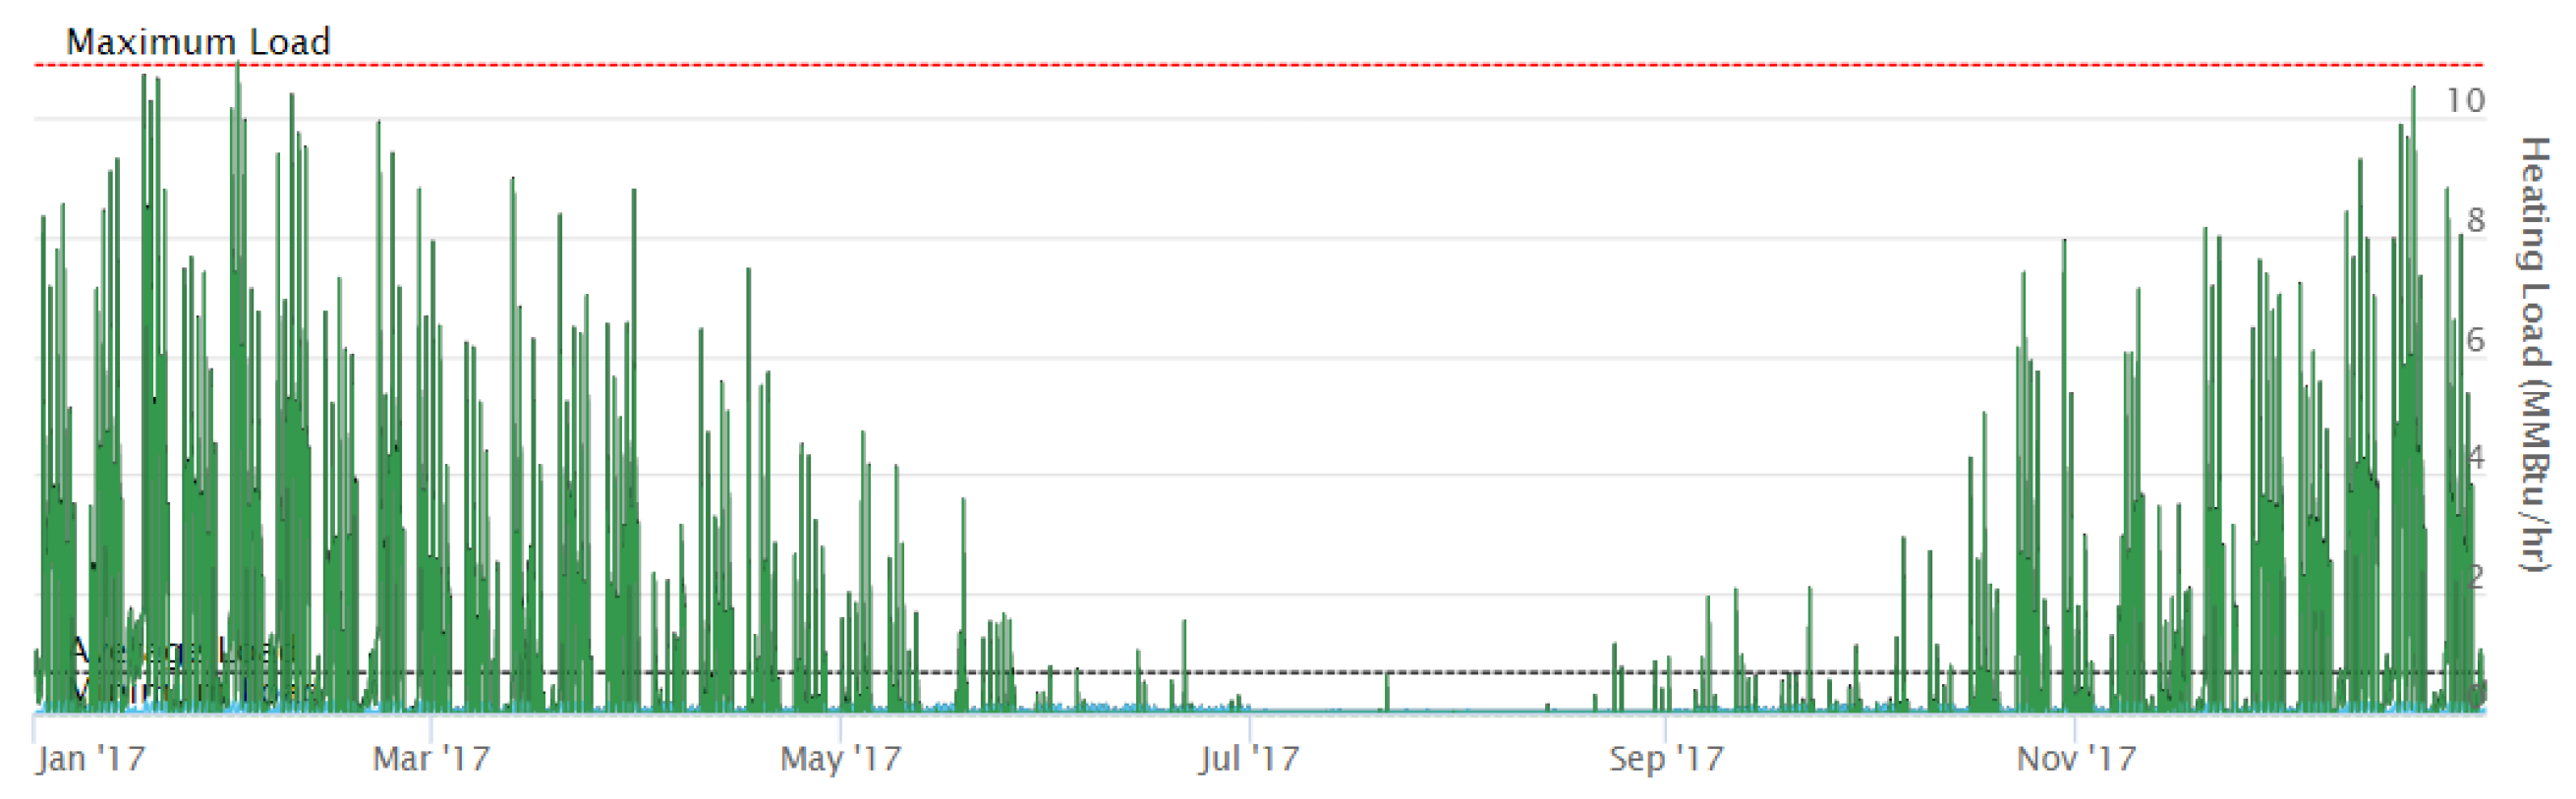
2.2.2. Heating Loads
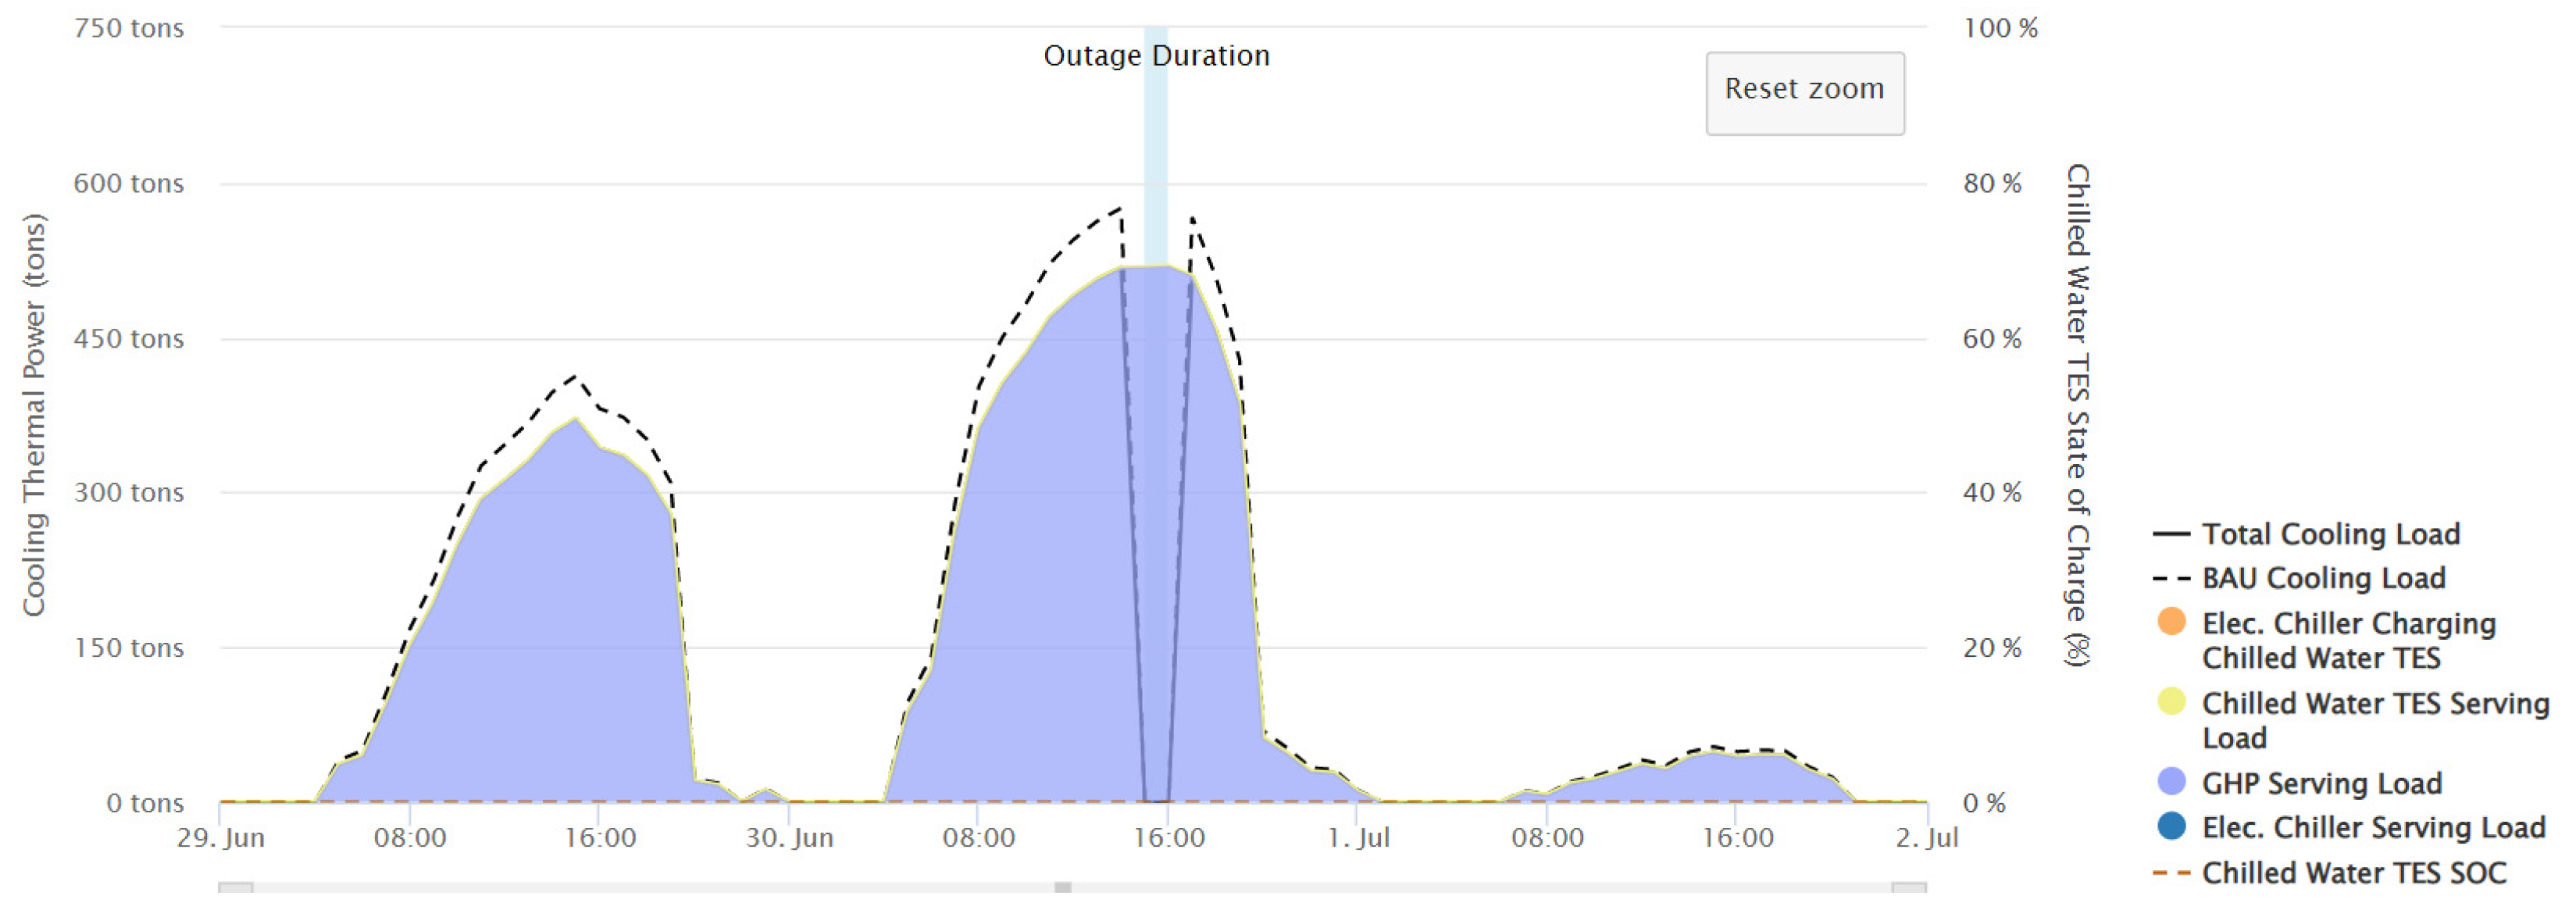
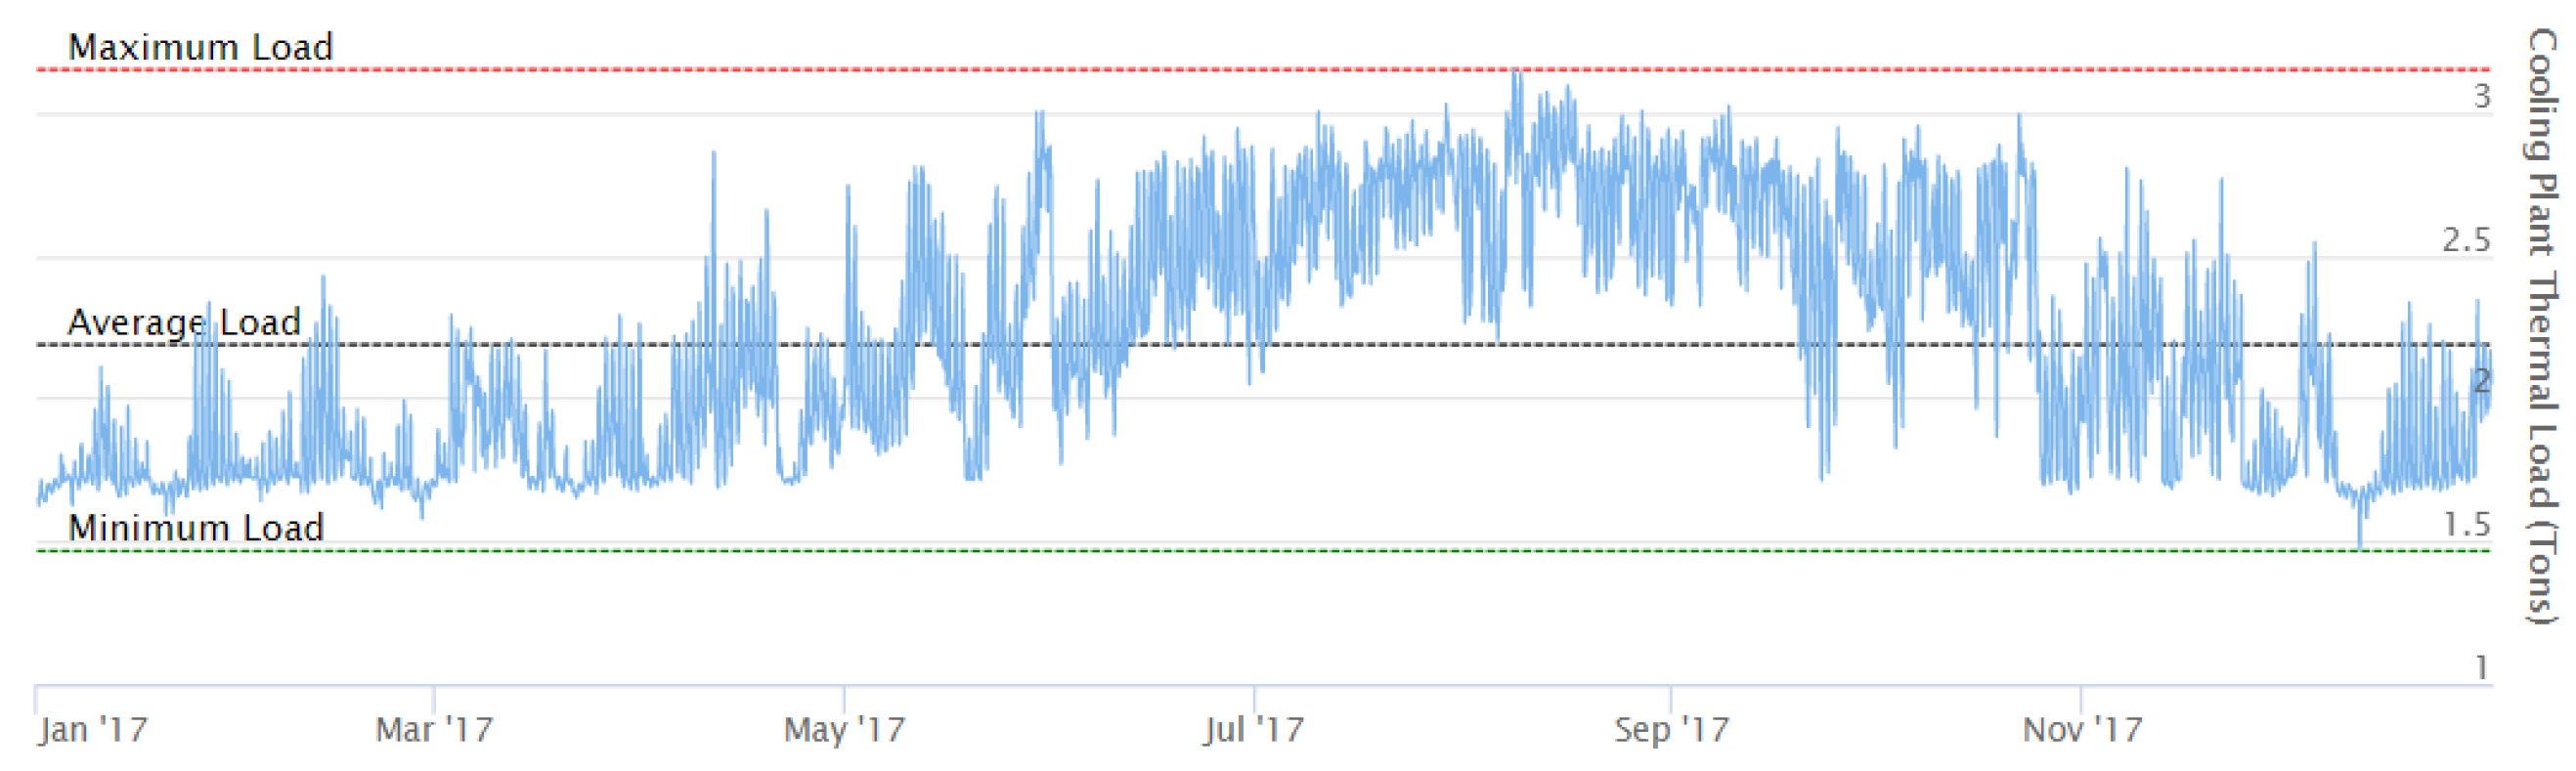
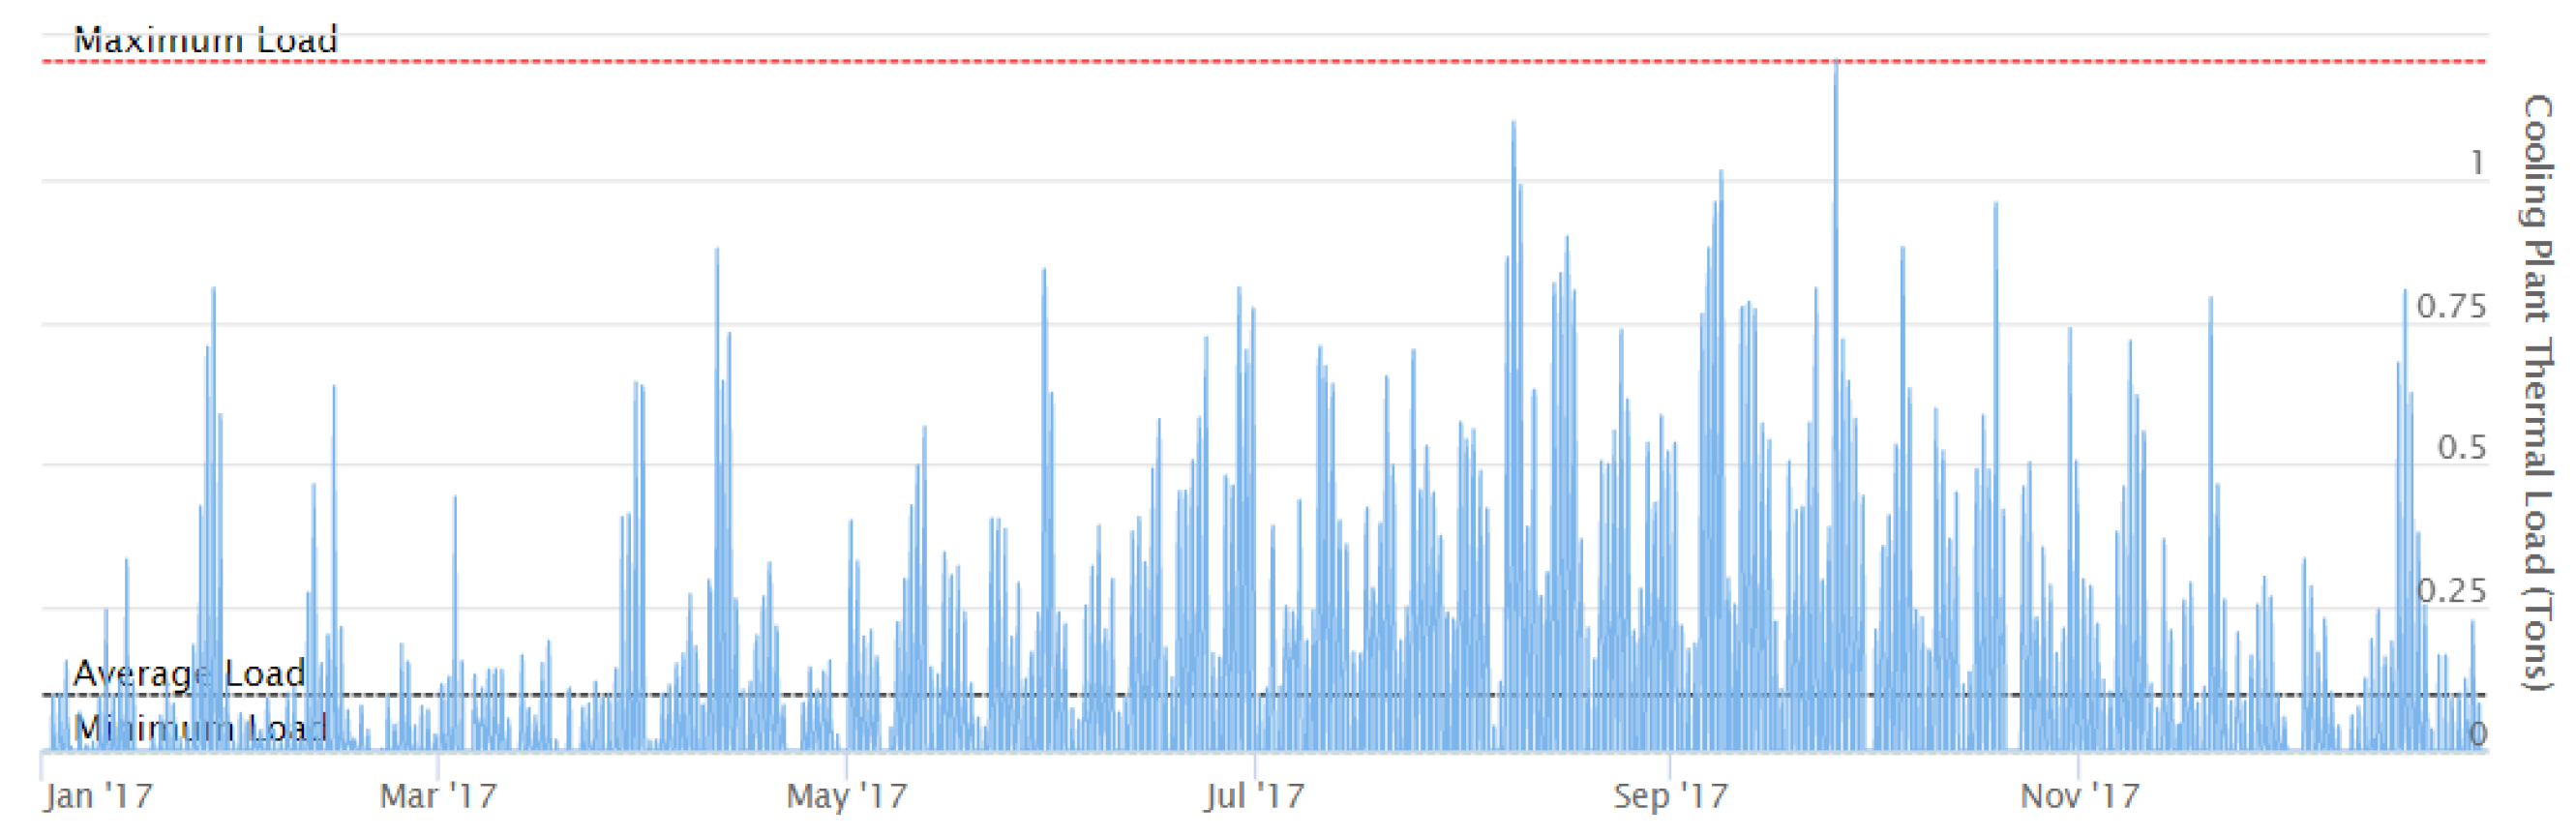
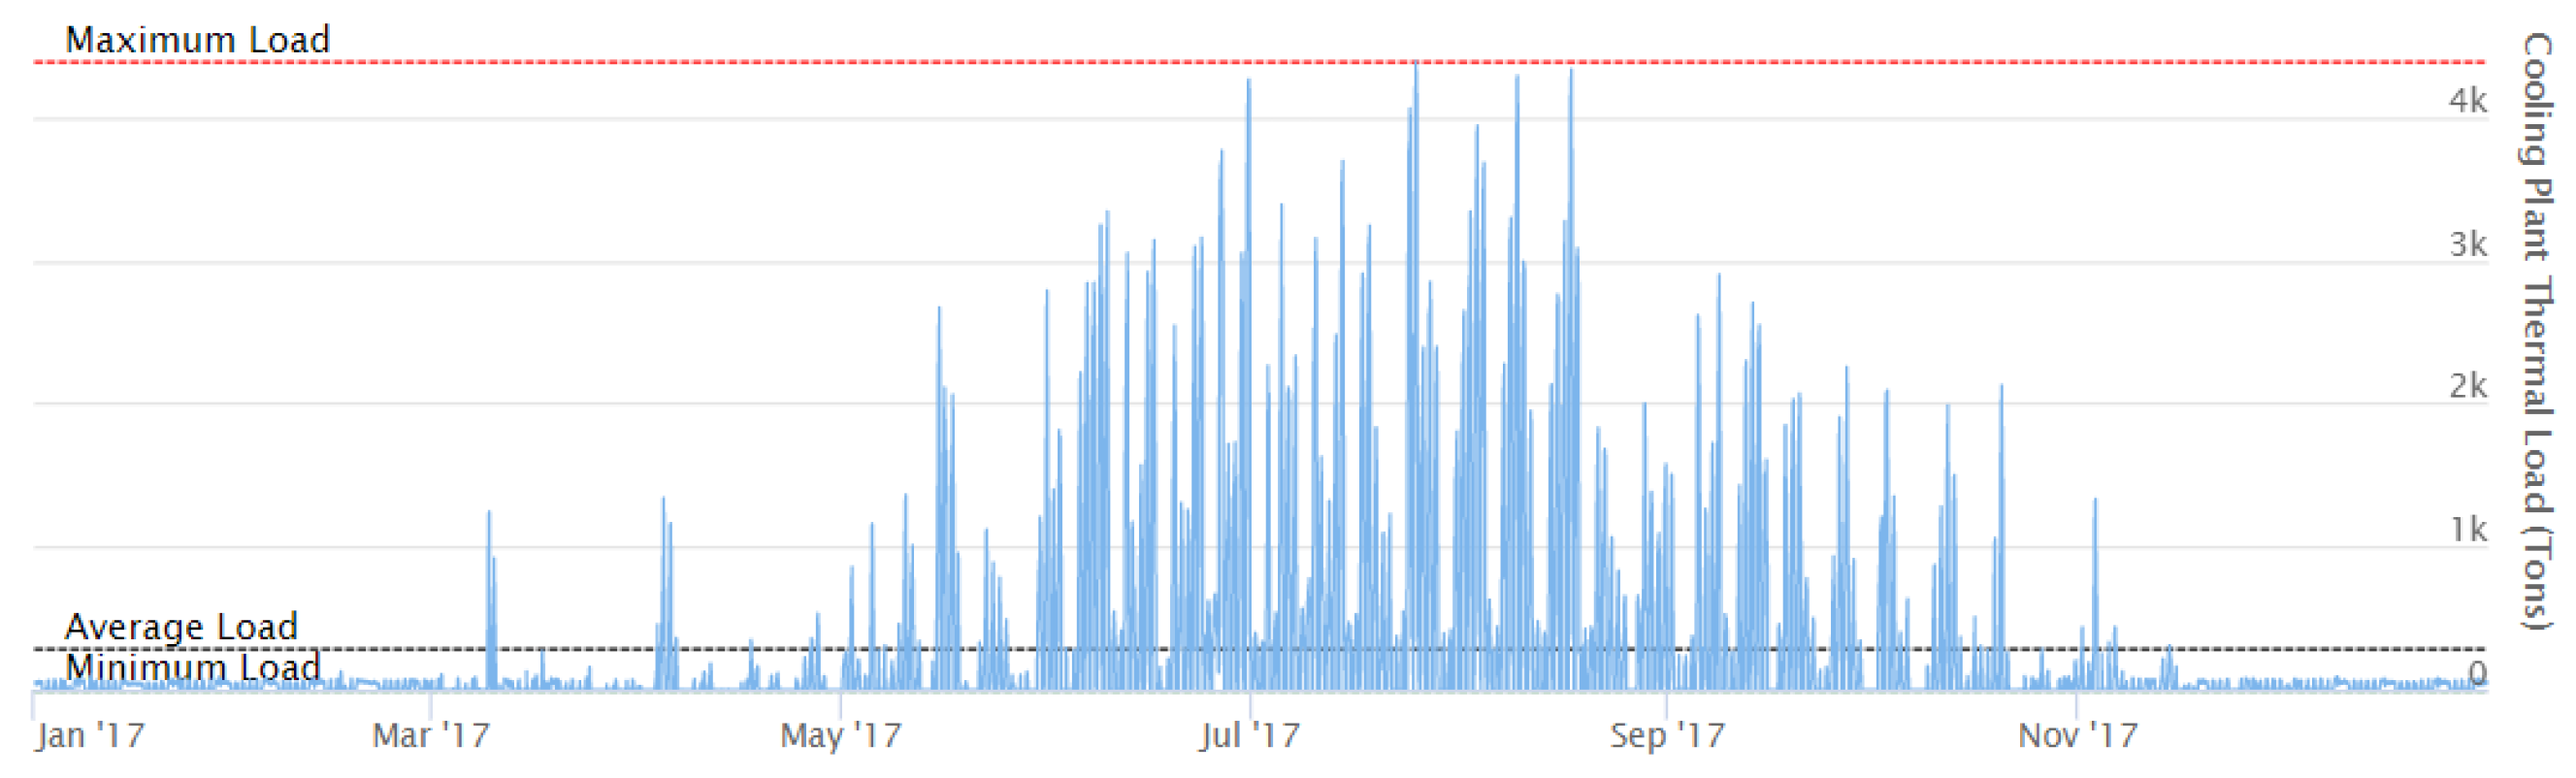
2.2.3. Cooling Plant Thermal Loads
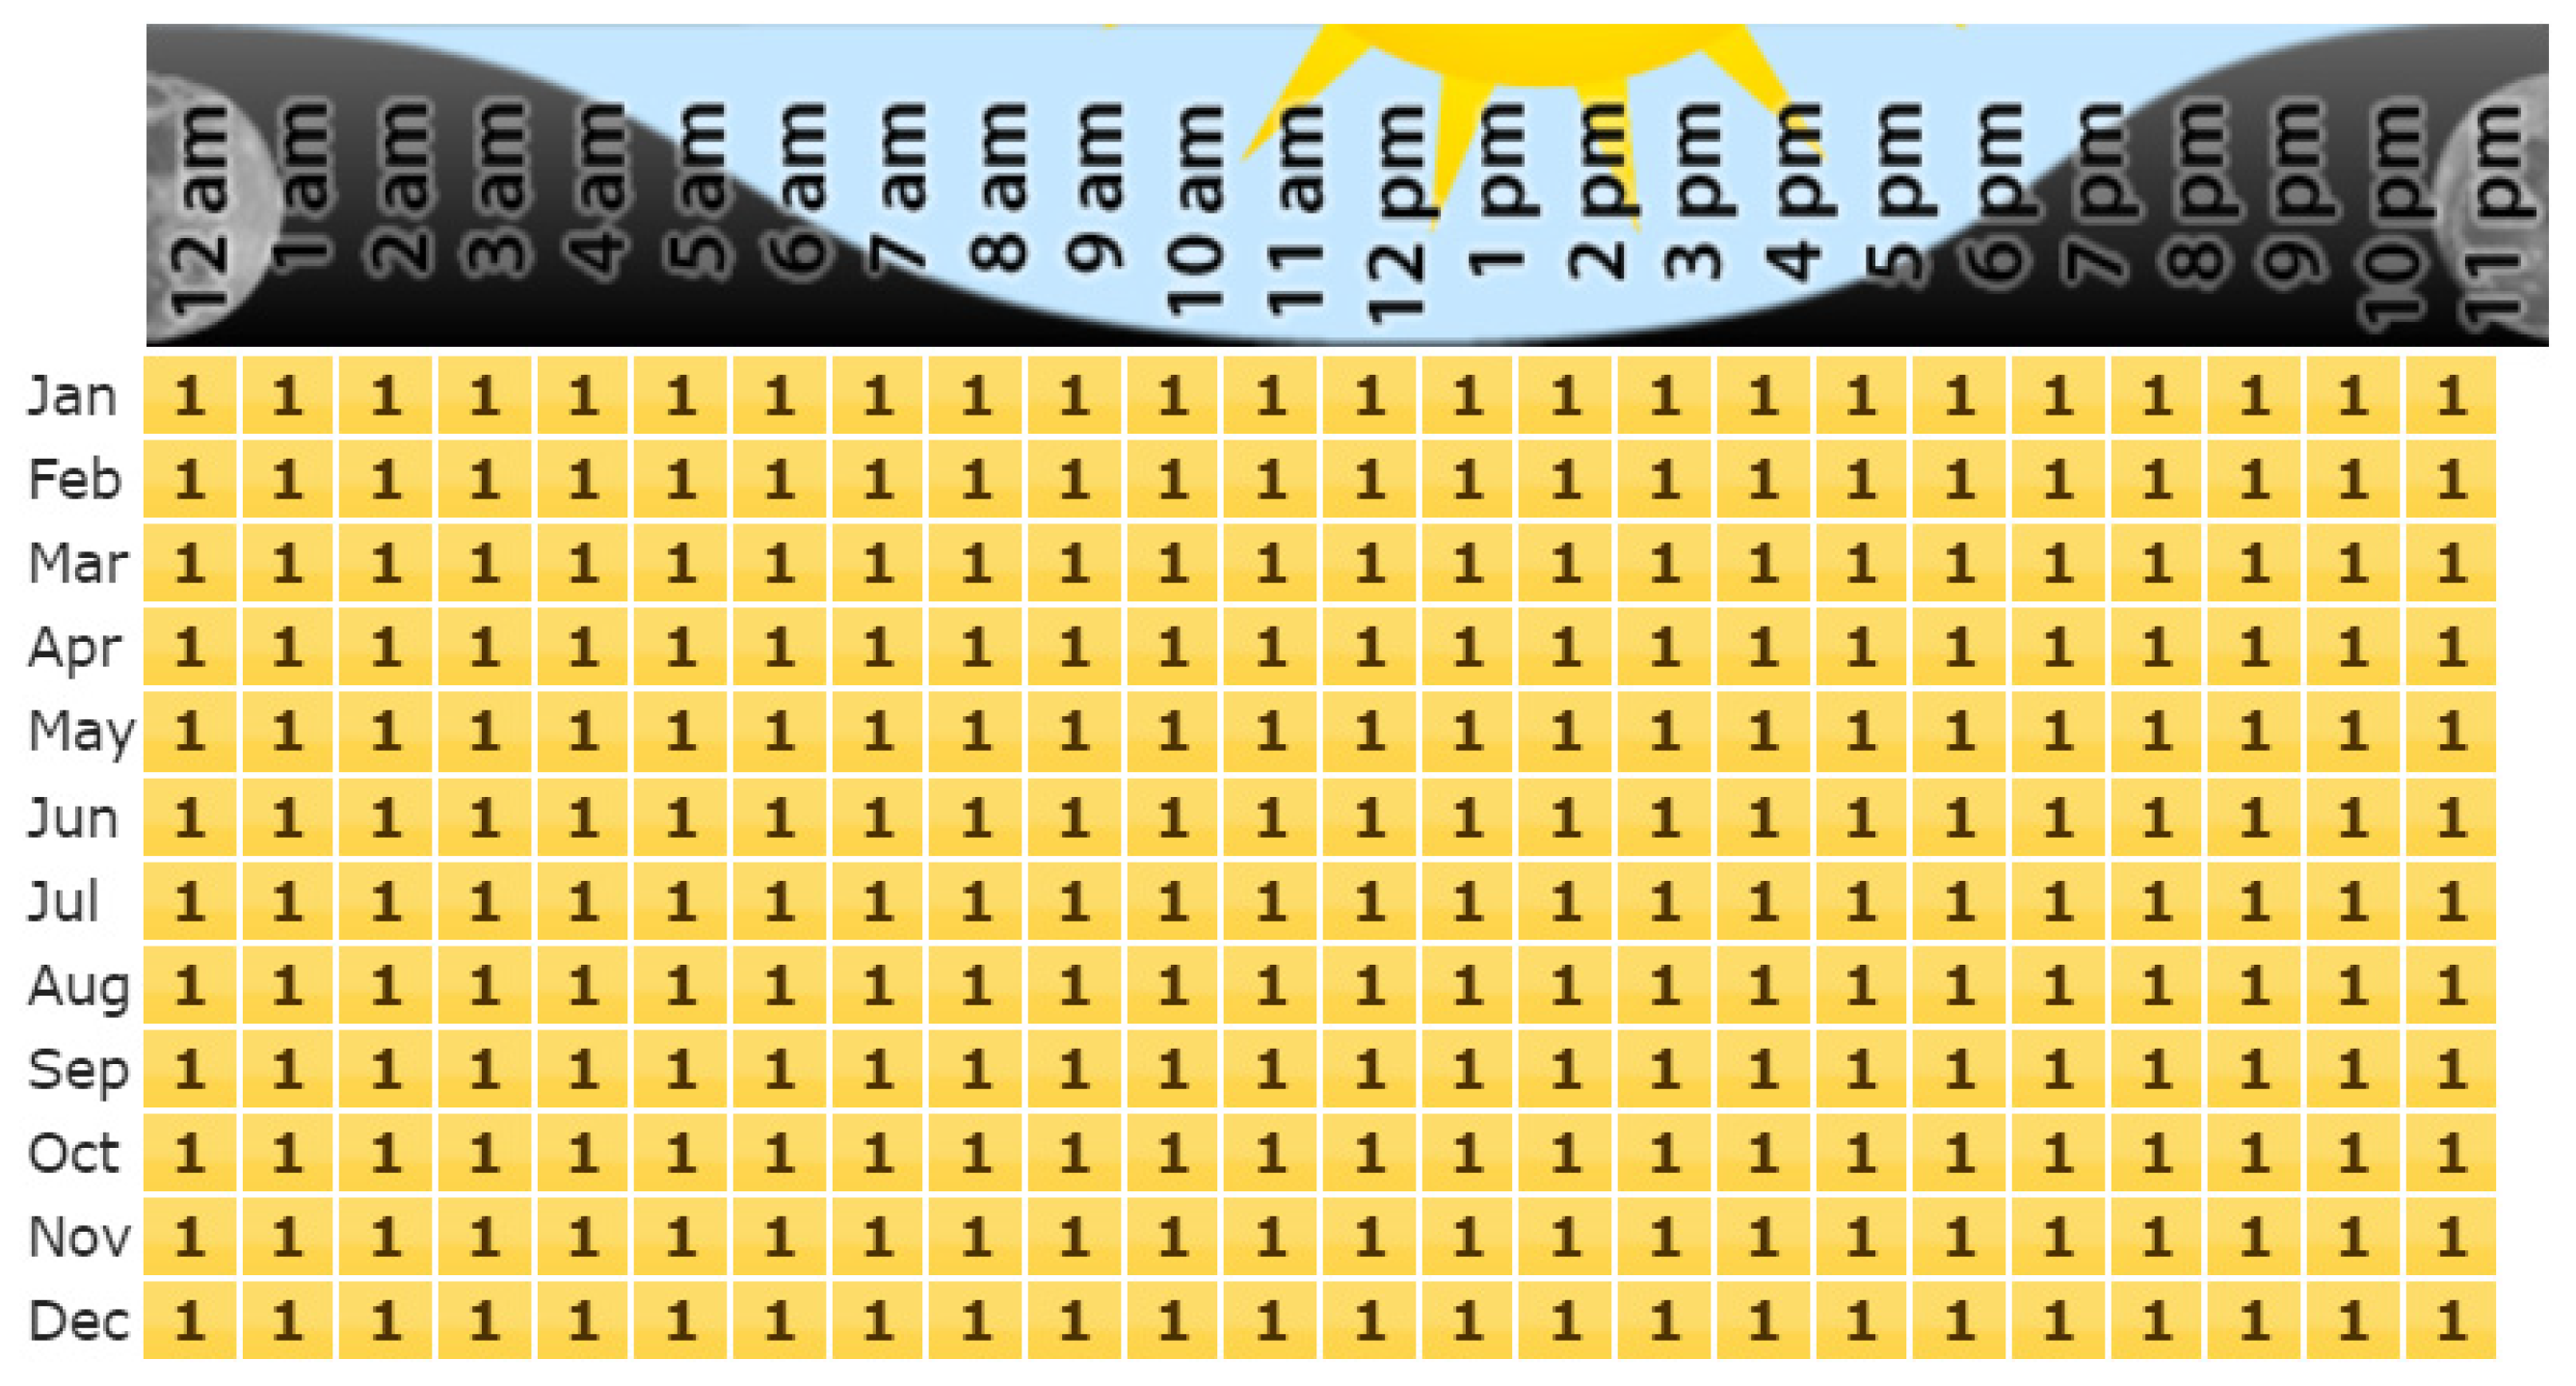
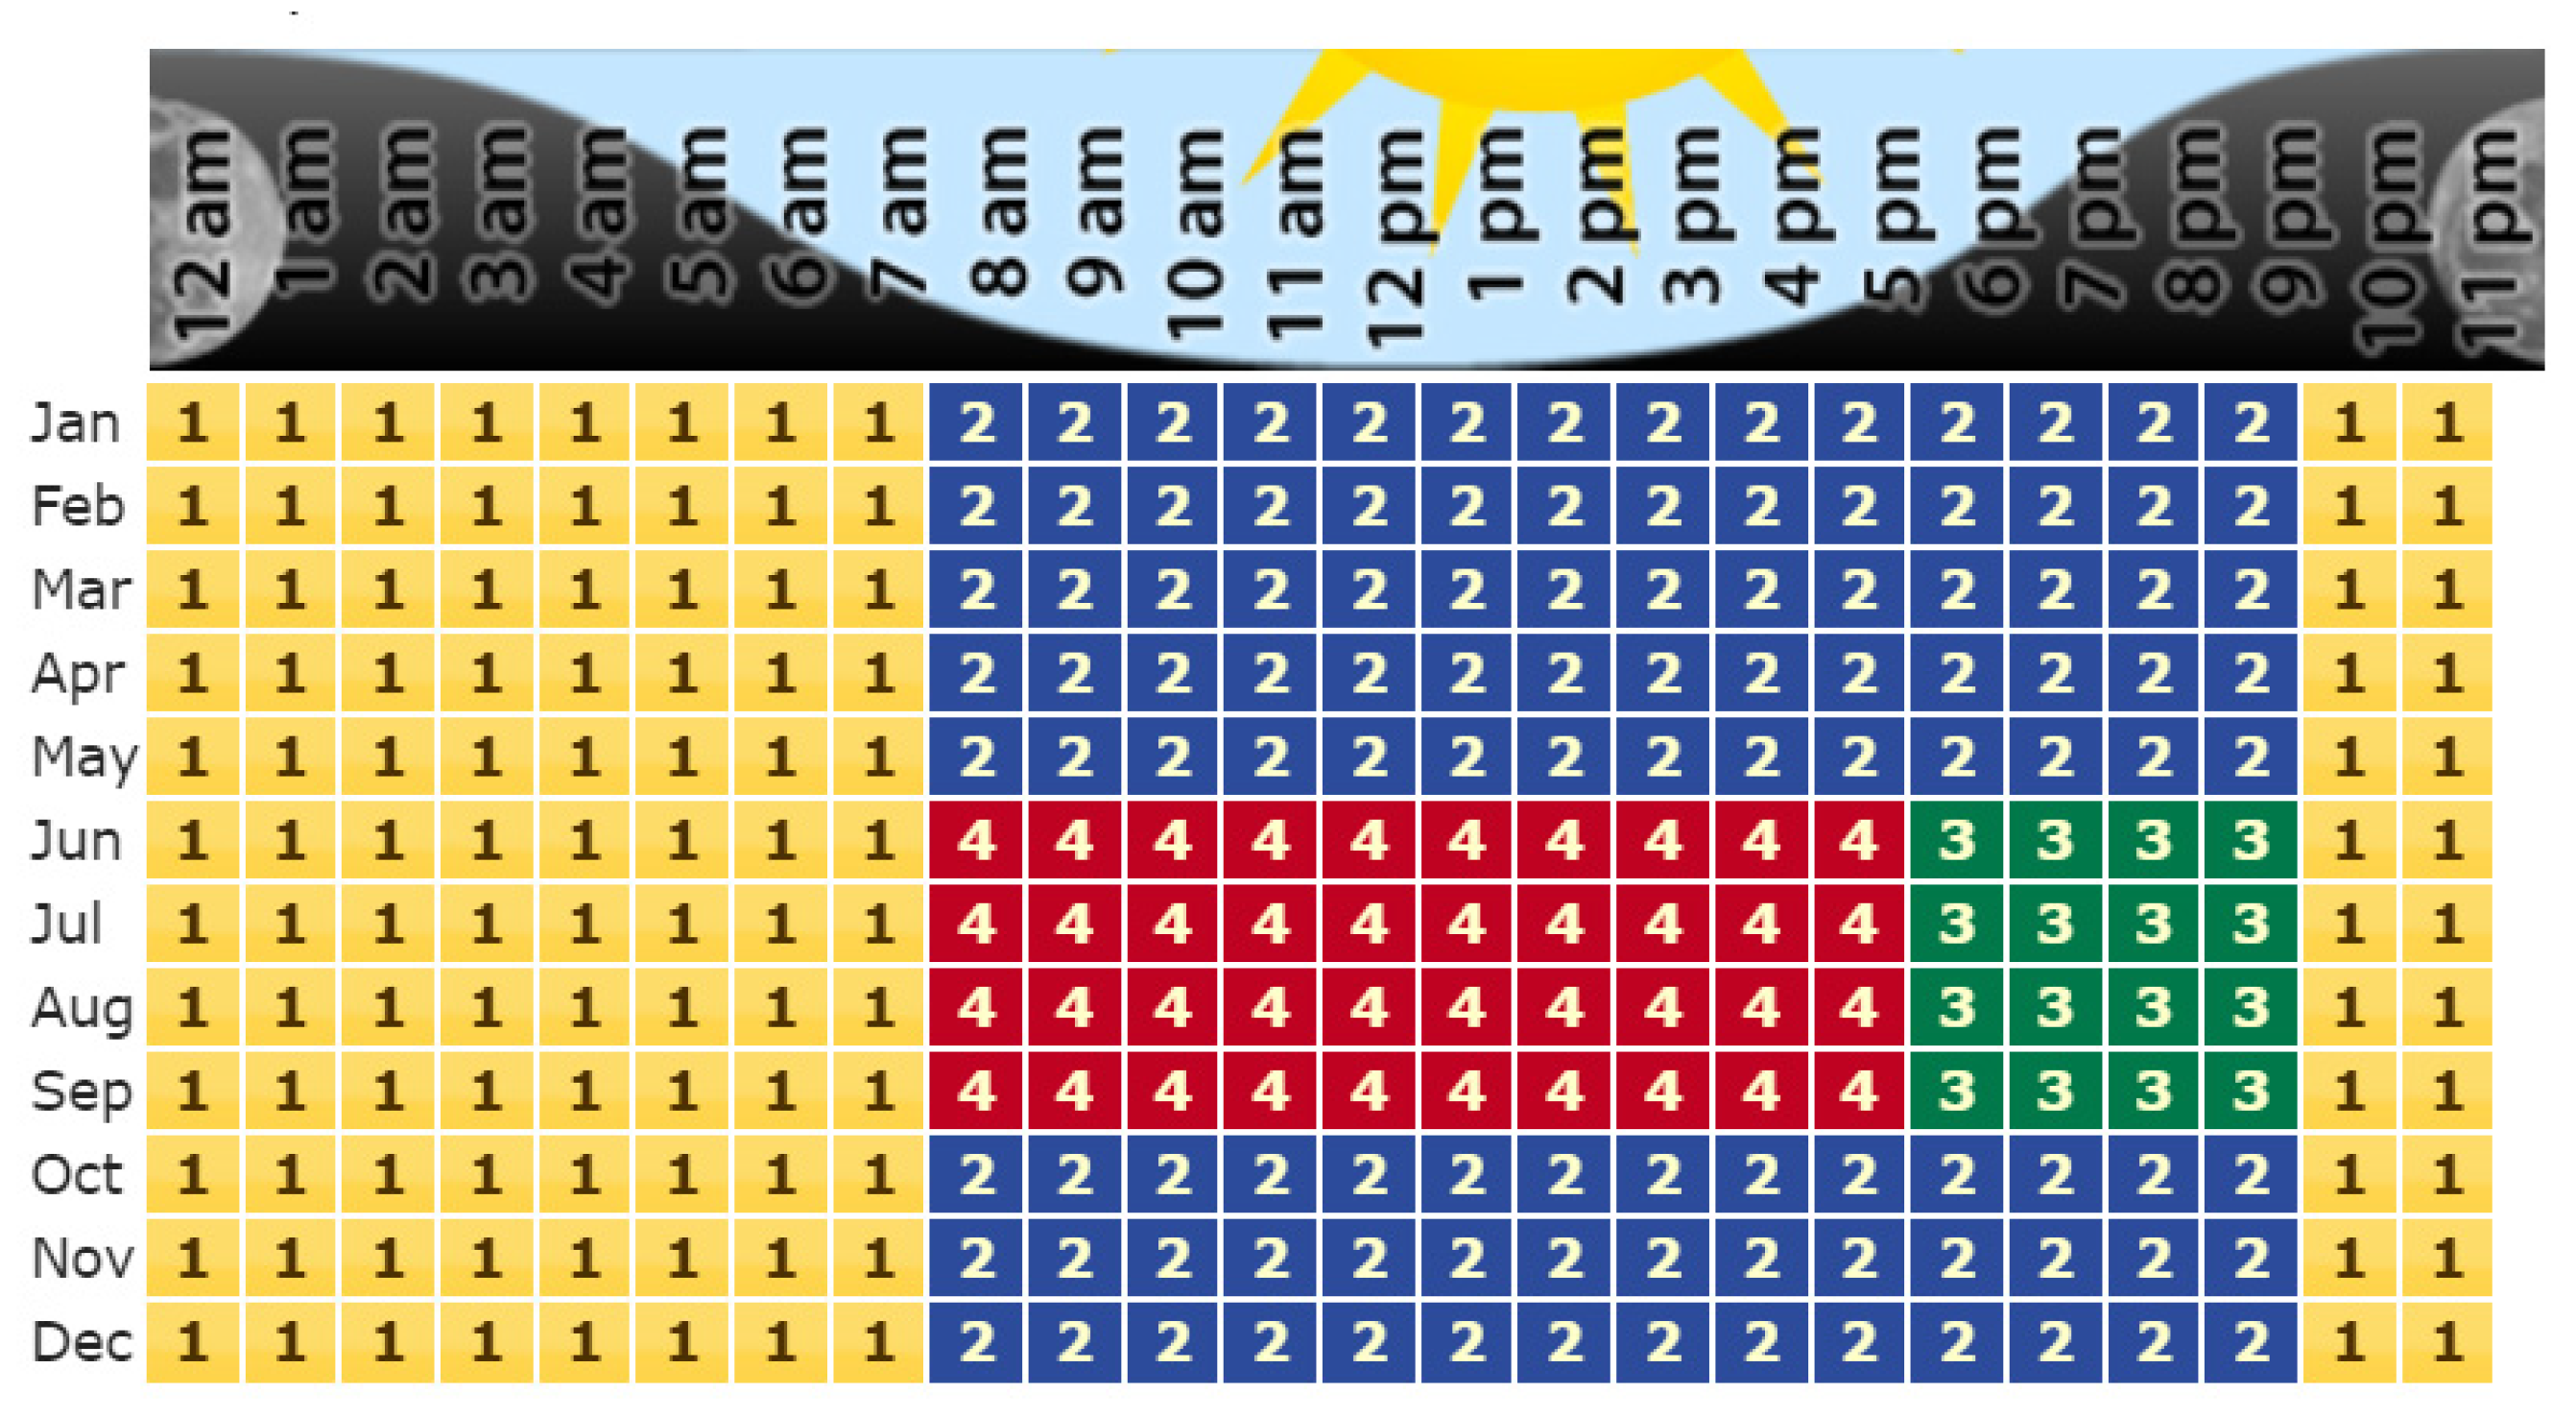
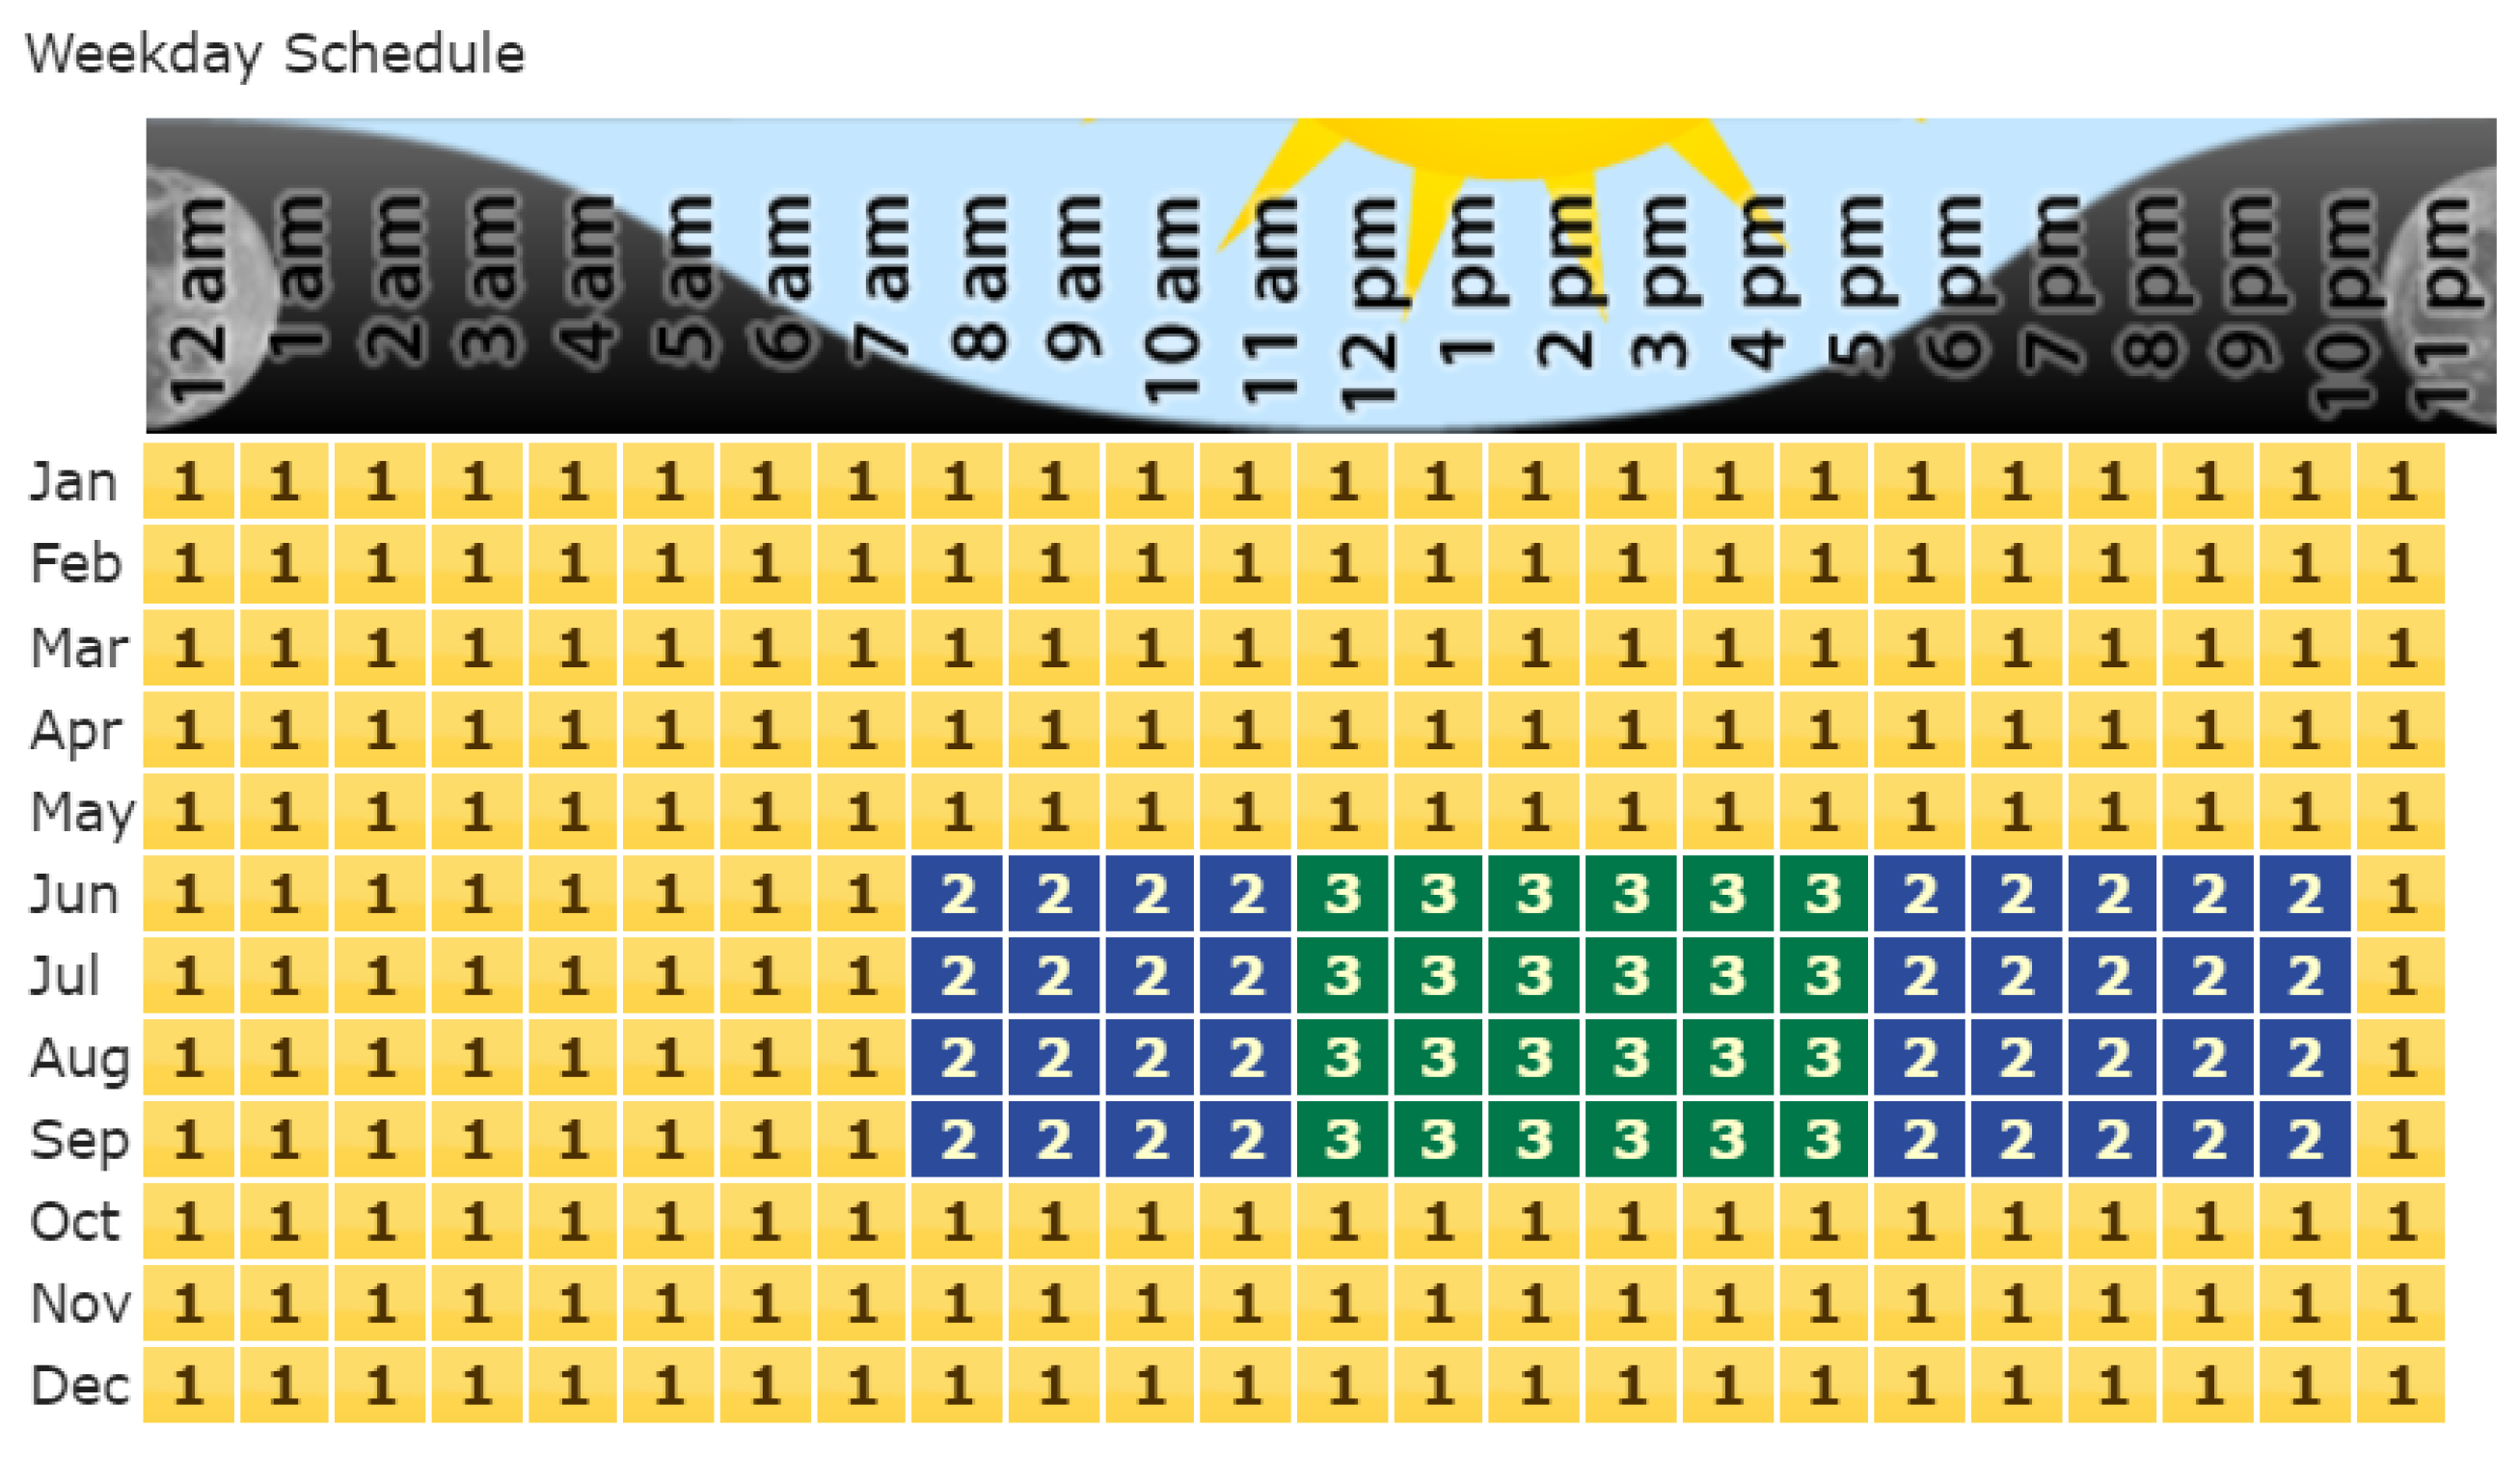
2.3. Tariff Structures
2.3.1. Time-of-Use—General Service—Large: TOU-8 CPP (2–50 kV) Tariff
2.3.2. SC-9—General Large TOD Service [NYC] Tariff
3. Results and Discussion
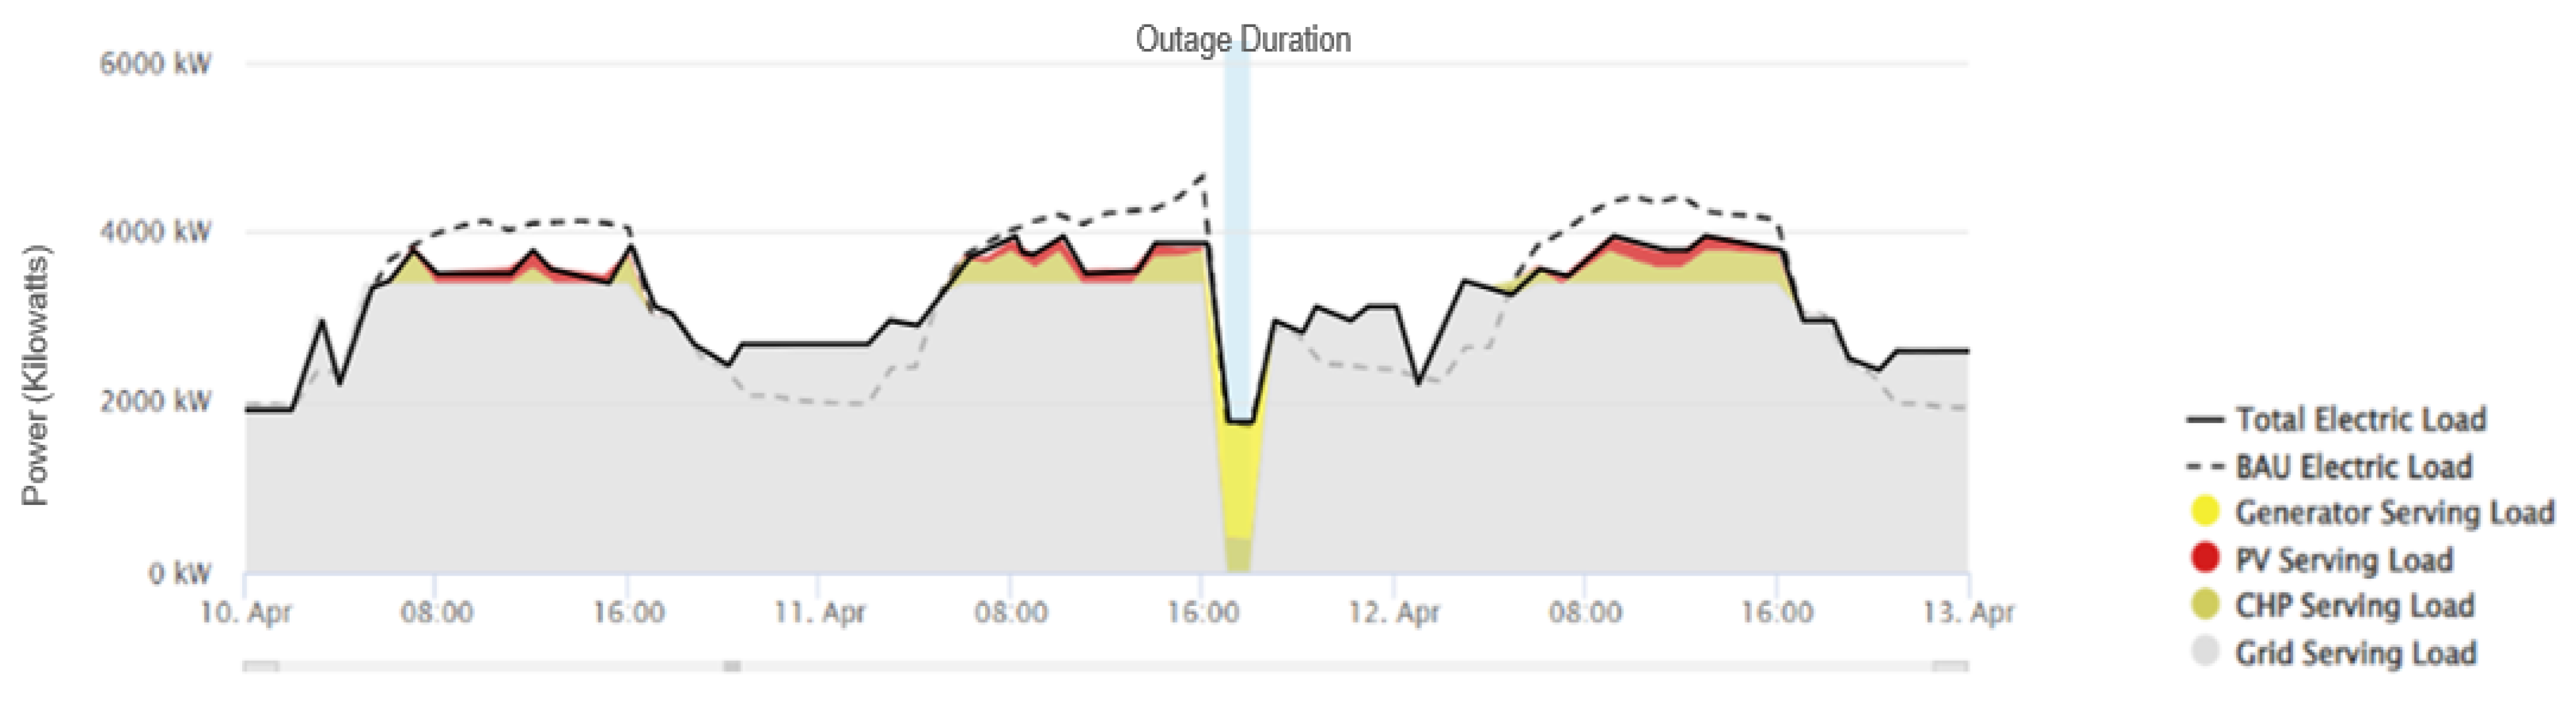
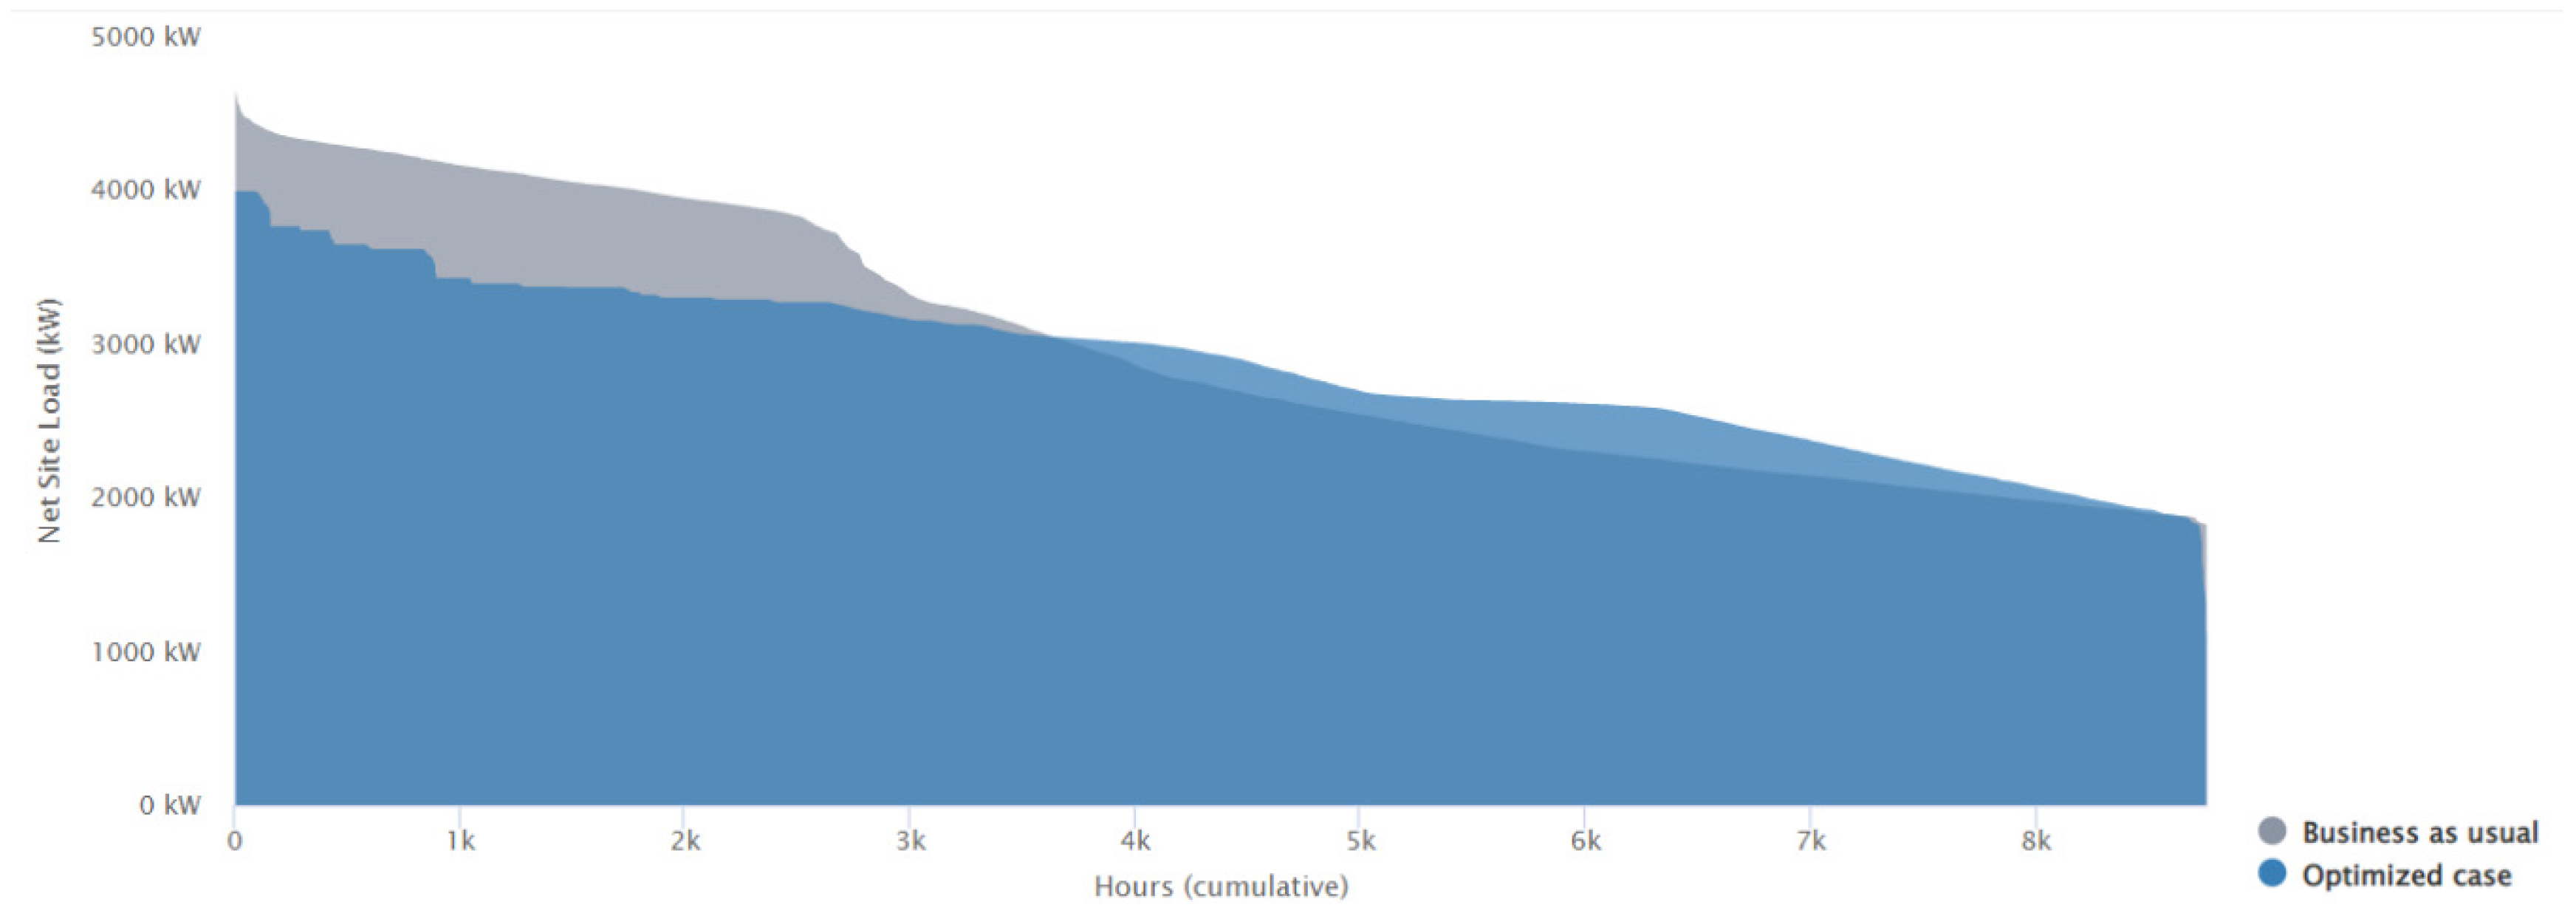
3.1. Palomar Medical Center Escondido (Hospital)
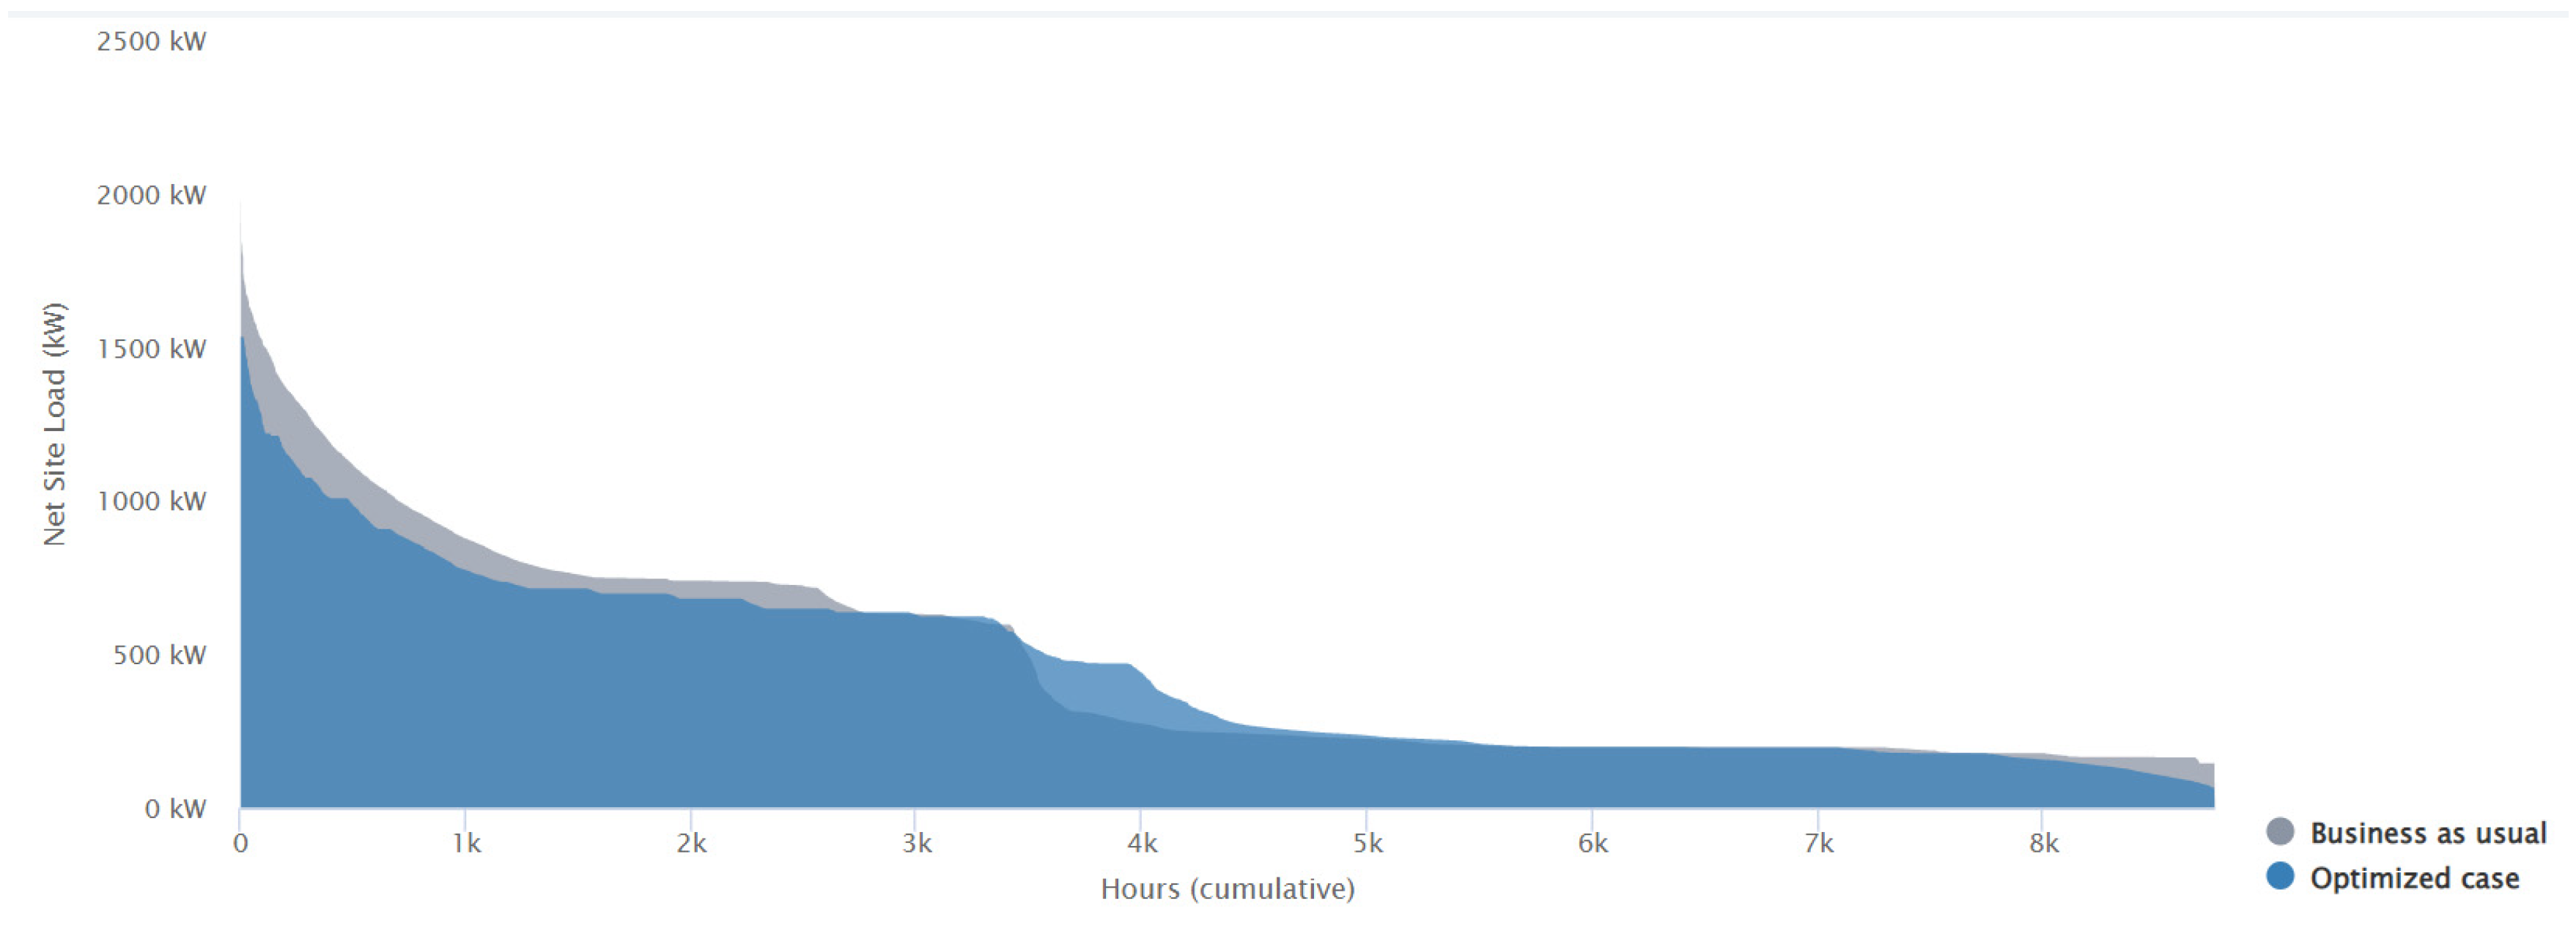
System Performance
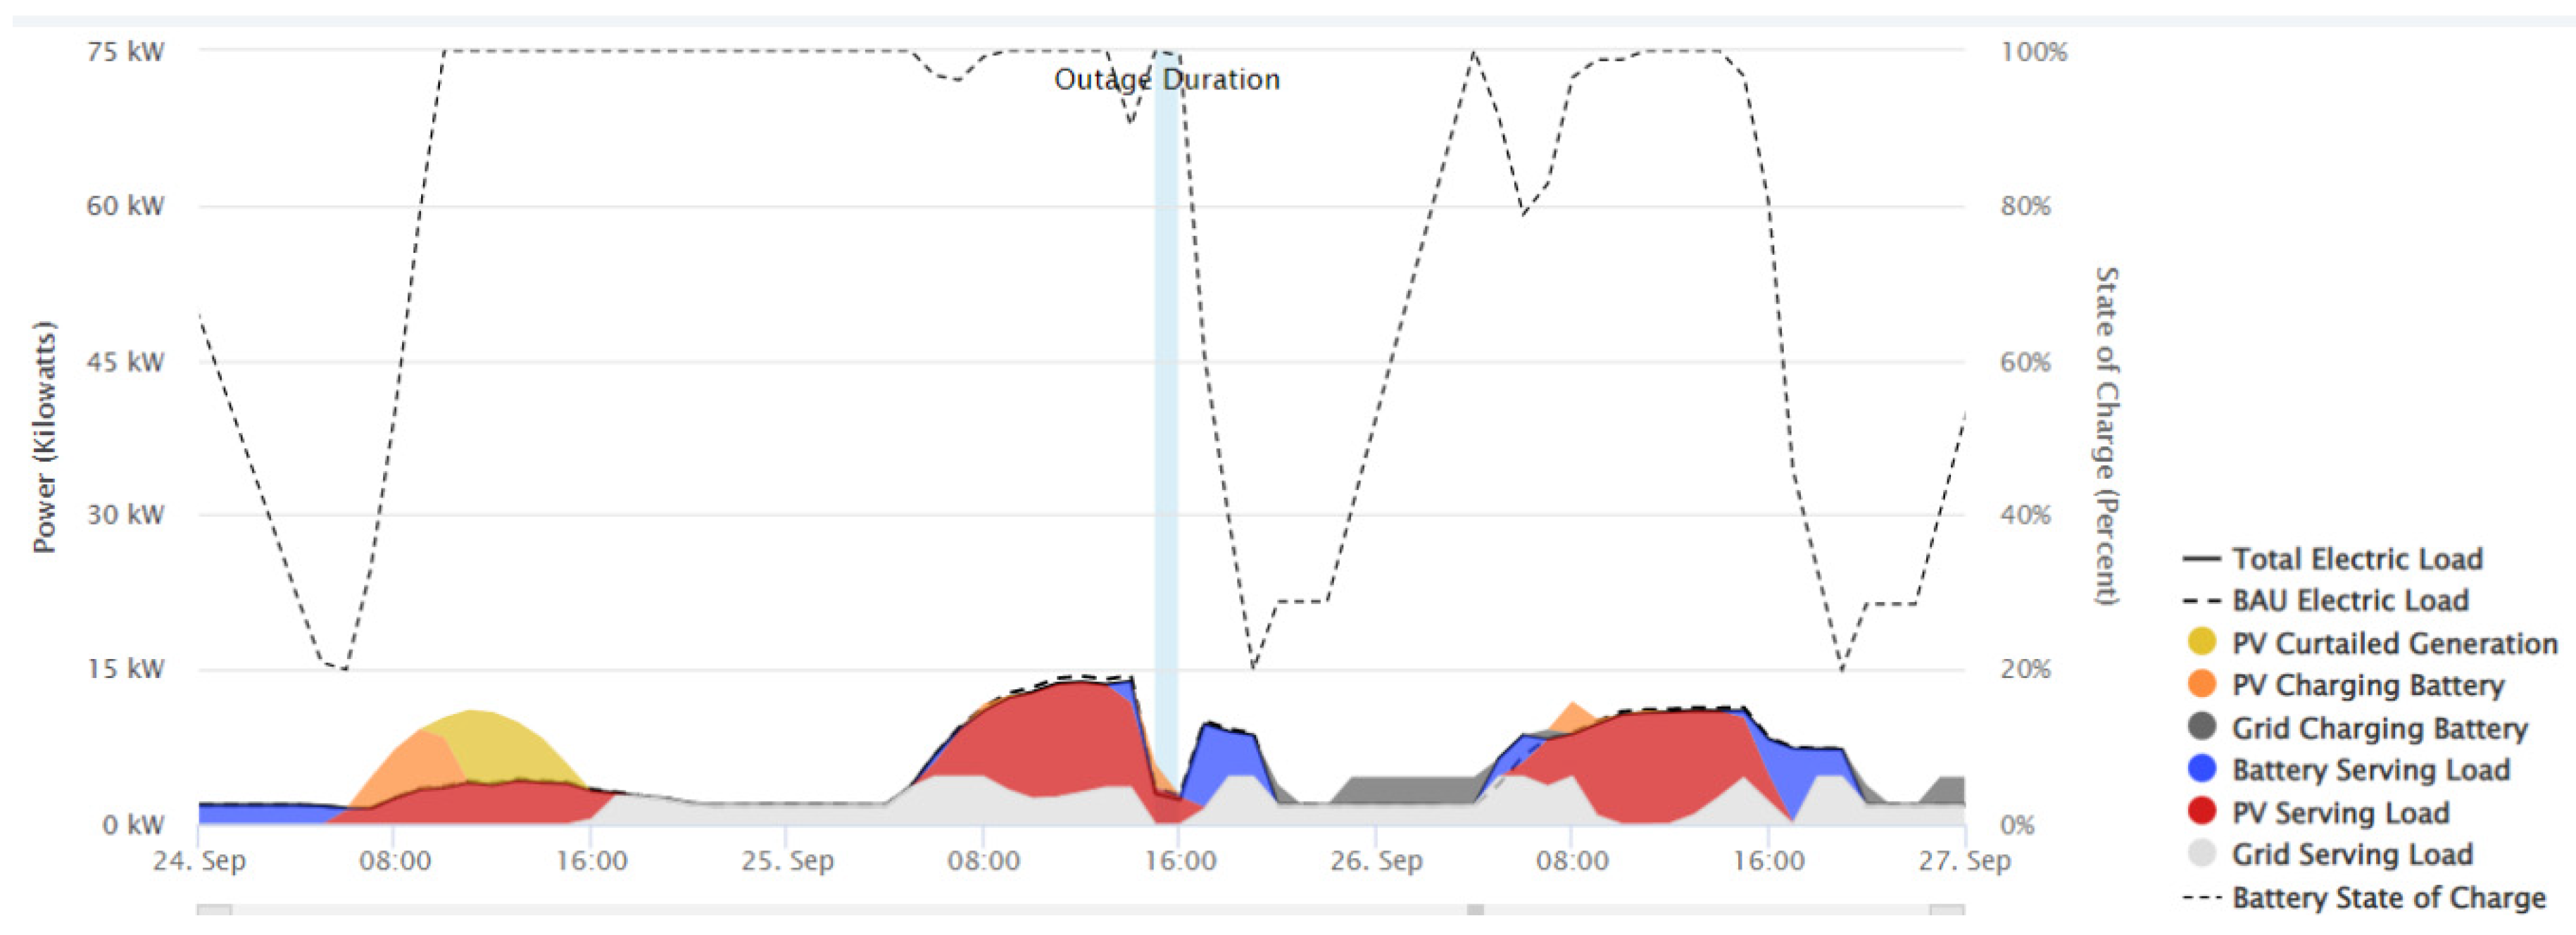
3.2. Camino Nuevo High School (High School)
System Performance
3.3. Golisano Children’s Hospital (Hospital)
System Performance
3.4. Beacon High School (High School)
System Performance
3.5. Discussion
Discussion of Related Research
4. Conclusions
Author Contributions
Funding
Data Availability Statement
Conflicts of Interest
Nomenclature
| AC | Air conditioning |
| BAU | Business-as-Usual |
| CHP | Combined heat and power |
| DER | Distributed Energy Resources |
| DHW | Domestic hot water |
| GHP | Ground source heat pump |
| PV | Photovoltaic solar energy |
| SOC | State of charge |
| TES | Thermal energy storage system |
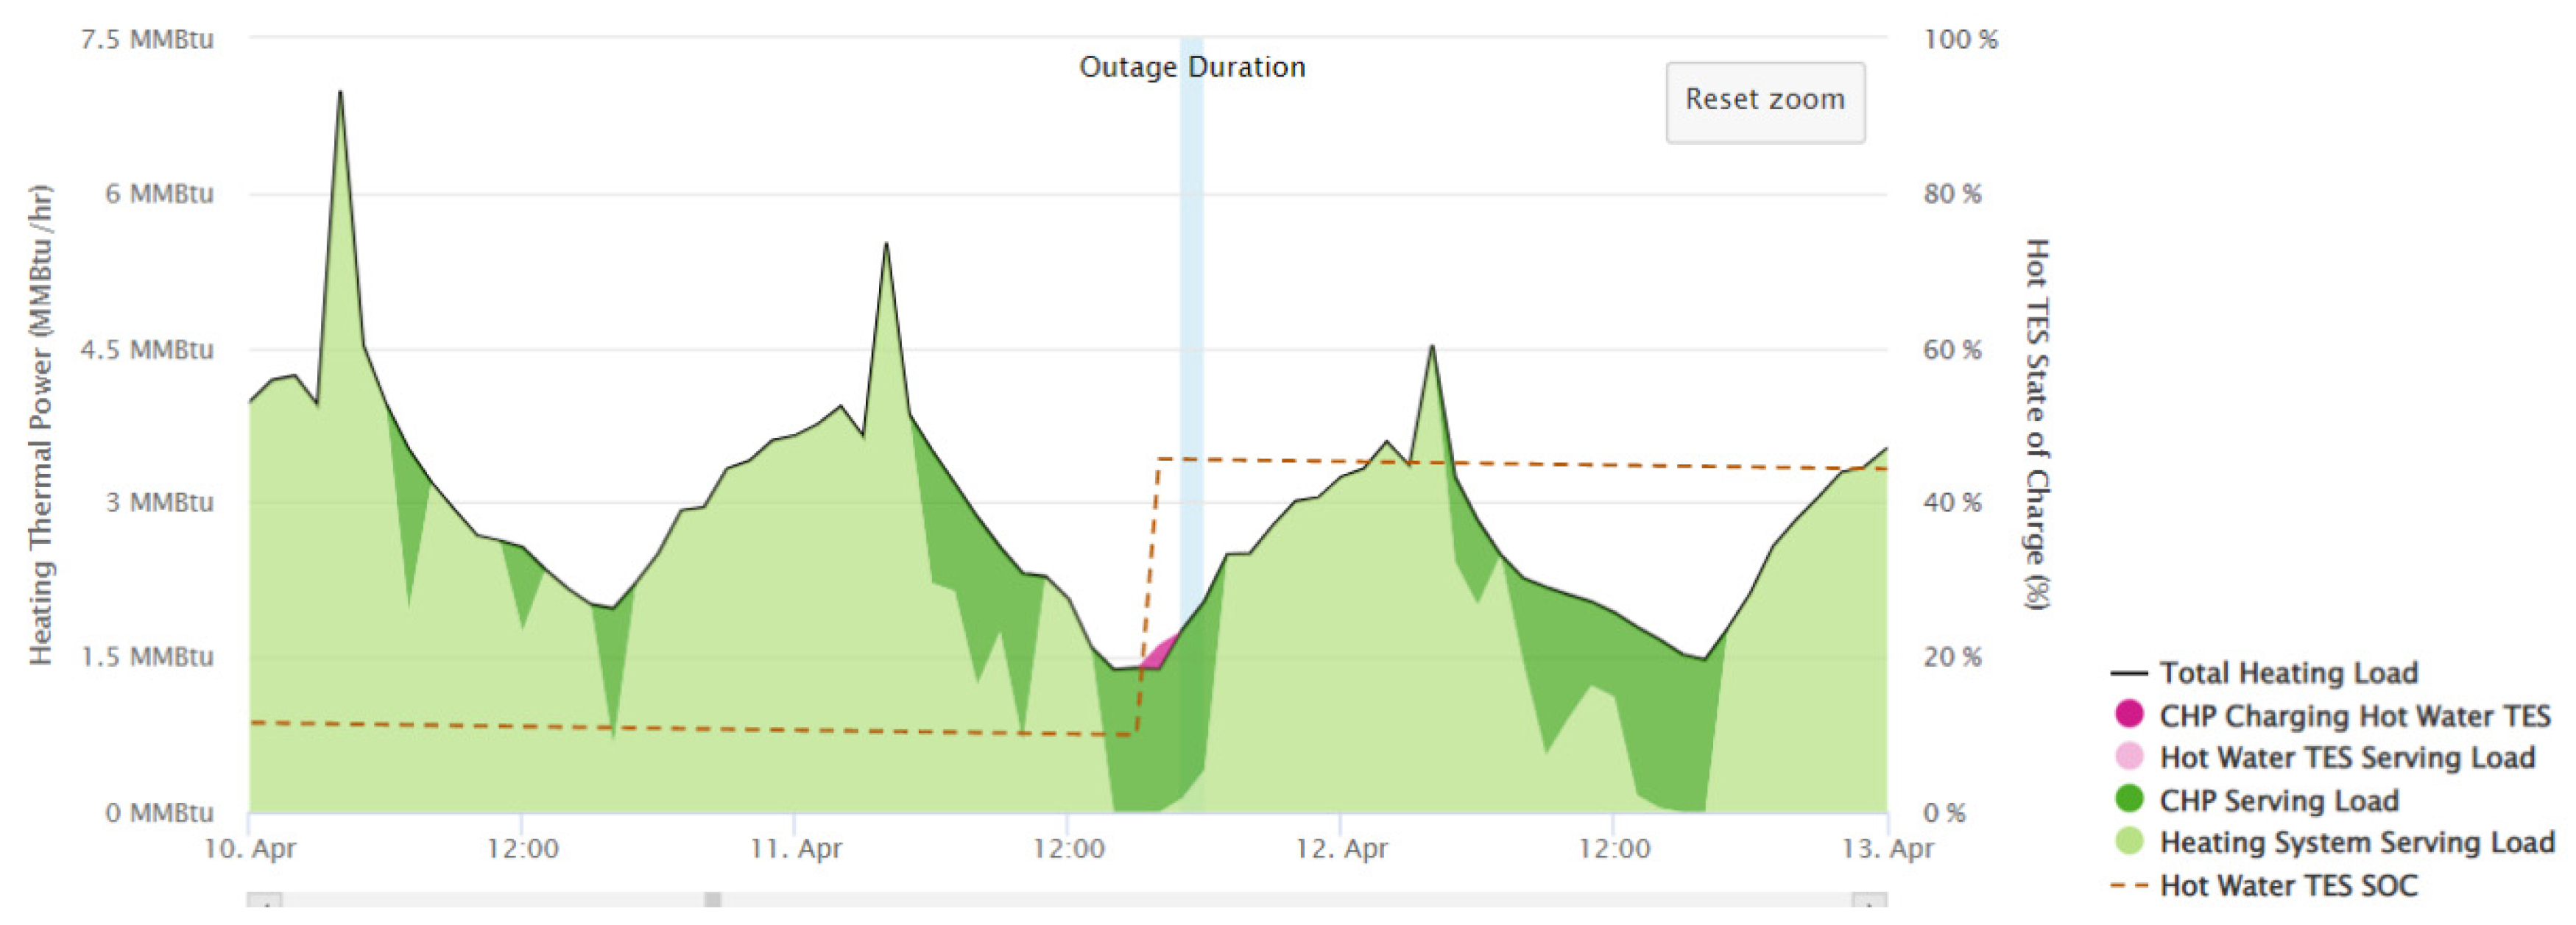
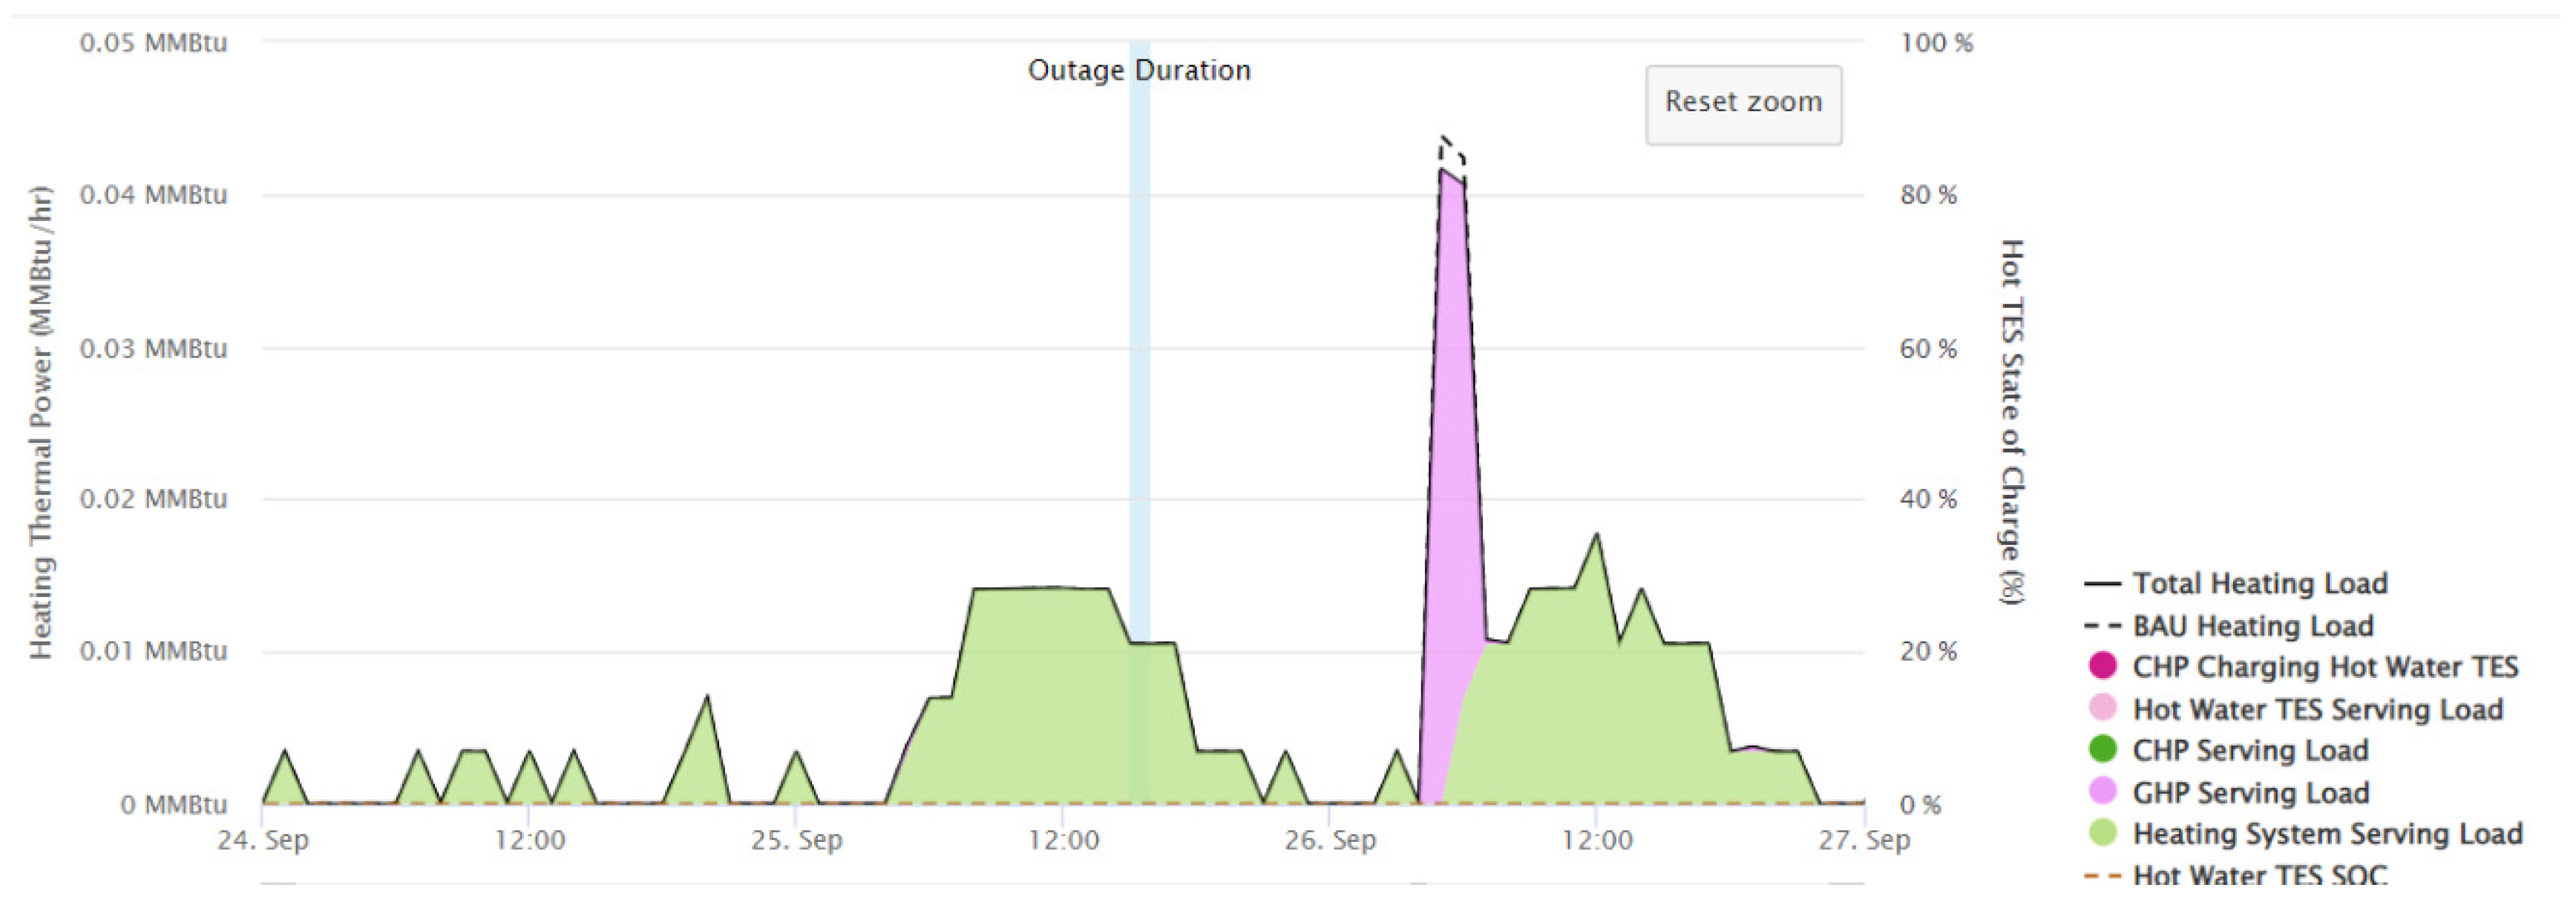
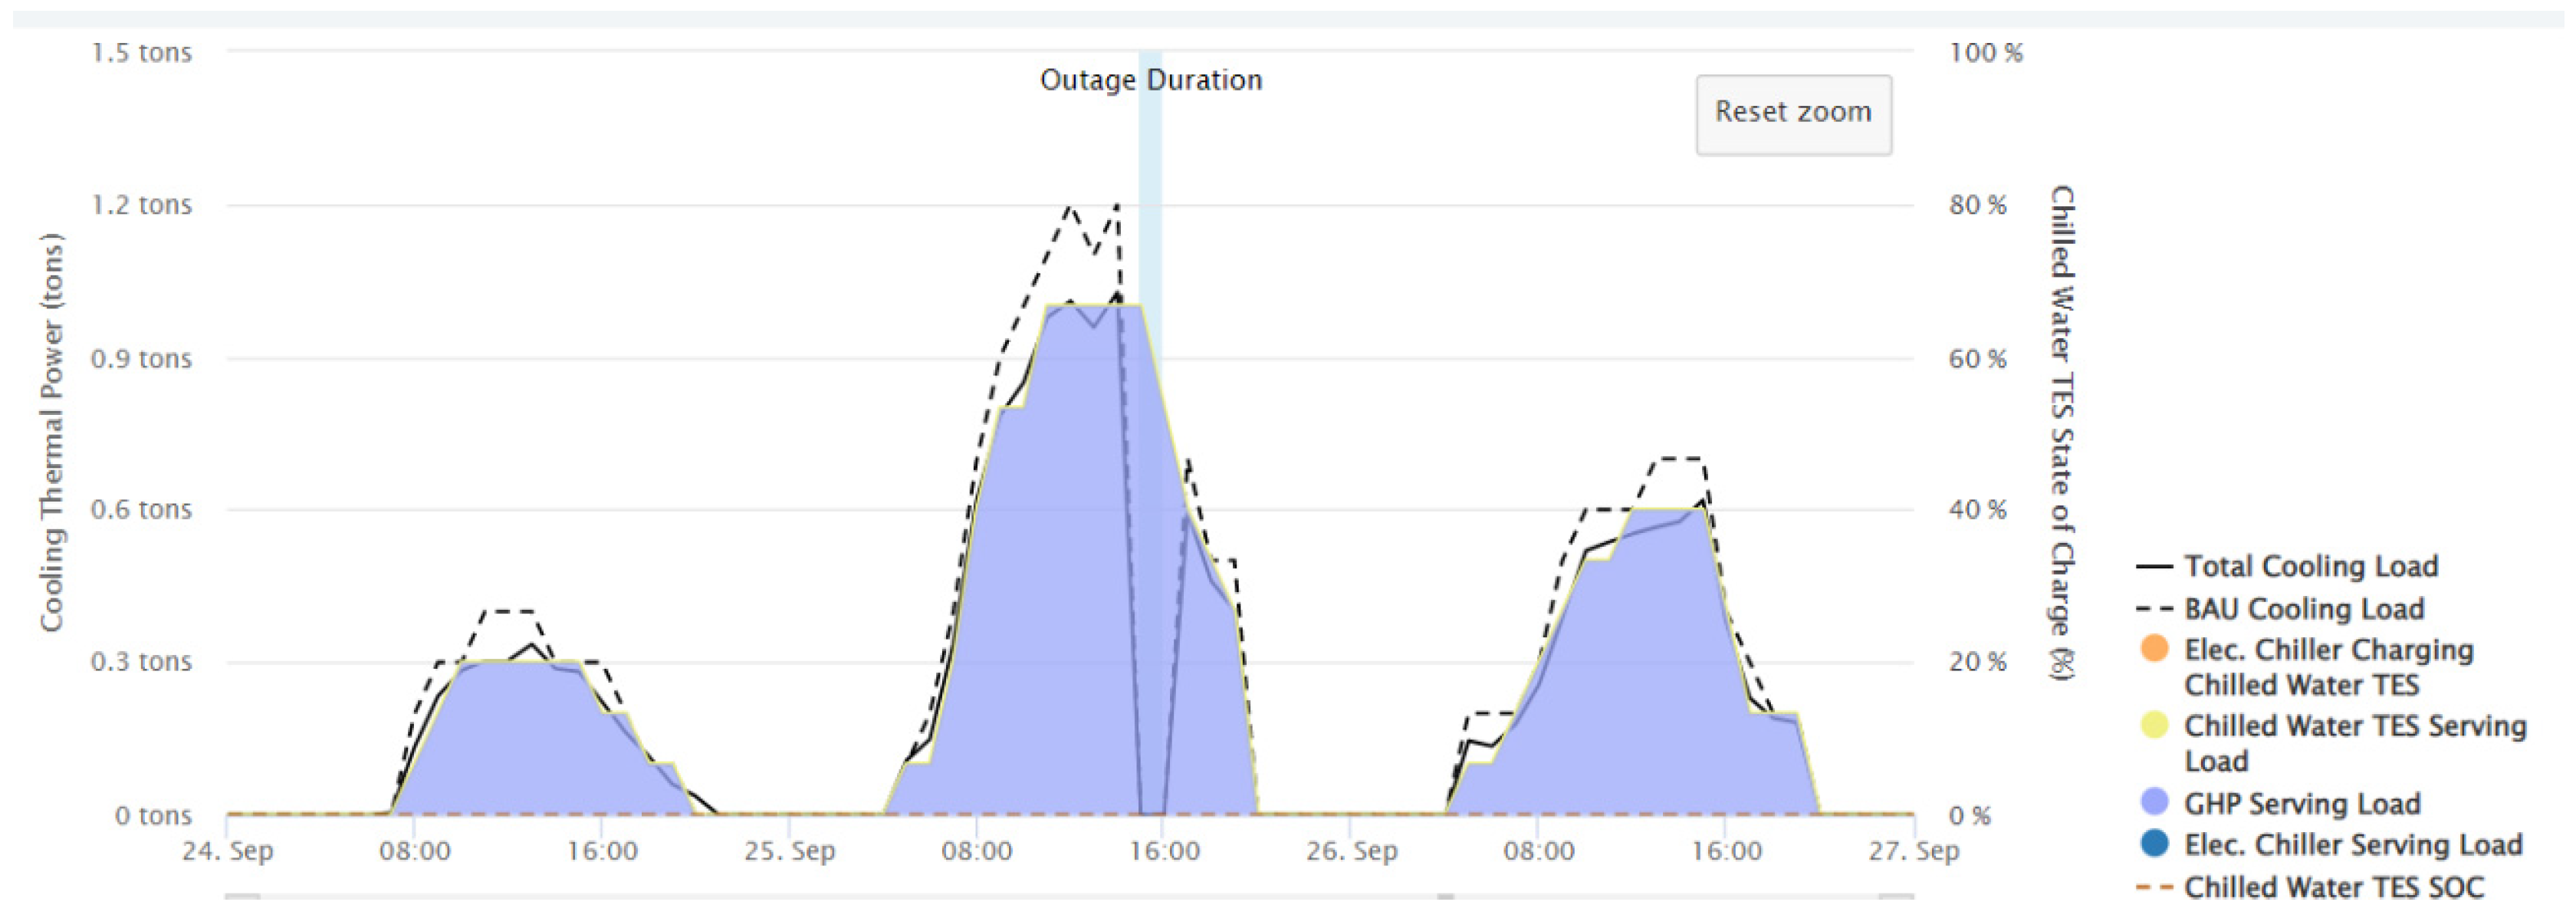
Appendix A. Optimized Thermal and Cooling Dispatch Strategies Palomar Medical Center Escondido (Hospital)


References
- Lemaire, E.; Martin, N.; Nørgård, P.; de Jong, R.; de Graaf, R.; Groenewegen, J.; Kolentin, E.; Tselepis, S. European White Book on Grid-Connected Storage; European Distributed Energy Resources Laboratories: Kassel, Germany, 2011. [Google Scholar]
- Cutler, D.; Olis, D.; Elgqvist, E.; Li, X.; Laws, N.; DiOrio, N.; Walker, A.; Anderson, K. REopt: A Platform for Energy System Integration and Optimization; National Renewable Energy Laboratory: Golden, CO, USA, 2017. [Google Scholar]
- Anderson, K.; Olis, D.; Becker, B.; Parkhill, L.; Laws, N.; Li, X.; Mishra, S.; Kwasnik, T.; Jeffery, A.; Elgqvist, E.; et al. REopt User Manual; National Renewable Energy Laboratory: Golden, CO, USA, 2021. [Google Scholar]
- Farthing, A.; Craig, M.; Reames, T. Optimizing Solar-Plus-Storage Deployment on Public Buildings for Climate, Health, Resilience, and Energy Bill Benefits. Environ. Sci. Technol. 2021, 55, 12528. [Google Scholar] [CrossRef]
- Simons Green Energy. Tips to Reduce Peak Demand Charges on Your Electric Bill. Available online: https://simonsgreenenergy.com.au/renewable-energy-news/how-to-reduce-peak-demand-charges-on-your-electricity-bill/ (accessed on 19 December 2023).
- Kobashi, T.; Choi, Y.; Hirano, Y.; Yamagata, Y.; Say, K. Rapid rise of decarbonization potentials of photovoltaics plus electric vehicles in residential houses over commercial districts. Appl. Energy 2022, 306, 118142. [Google Scholar] [CrossRef]
- Jin, M.; Feng, W.; Marnay, C.; Spanos, C. Microgrid to enable optimal distributed energy retail and end-user demand response. Appl. Energy 2018, 210, 1321–1335. [Google Scholar] [CrossRef]
- Hoang, A.T.; Pham, V.V.; Nguyen, X.P. Integrating renewable sources into energy systems for the smart cities is a sagacious strategy toward the clean and sustainable processes. J. Clean. Prod. 2021, 305, 127161. [Google Scholar] [CrossRef]
- Reynolds, J.; Ahmad, M.W.; Rezgui, Y.; Hippolyte, J.-L. Operational supply and demand optimisation of a multi-vector district energy system using artificial neural networks and a genetic algorithm. Appl. Energy 2019, 235, 699–713. [Google Scholar] [CrossRef]
- IEEE Std 493-2007; IEEE Recommended Practice for the Design of Reliable Industrial and Commercial Power Systems, (Revision of IEEE Std 493-1997). IEEE: Piscataway, NJ, USA, 2007; pp. 1–383.
- Kirchner, M.; McCoy, W.J. Backup generation considerations for telecommunication/central office applications. In Proceedings of the INTELEC 2008—IEEE 30th International Telecommunications Energy Conference, San Diego, CA, USA, 14–18 September 2008; pp. 1–6. [Google Scholar]
- Ahlgren, B.; Hidell, M.; Ngai, E.C.-H. Internet of Things for Smart Cities: Interoperability and Open Data. IEEE Internet Comput. 2016, 20, 52–56. [Google Scholar] [CrossRef]
- Liu, X.; Shahidehpour, M.; Li, Z.; Liu, X.; Cao, Y.; Bie, Z. Microgrids for enhancing the power grid resilience in extreme conditions. IEEE Trans. Smart Grid 2017, 8, 589–597. [Google Scholar]
- Zhang, P.; Wang, Y.; Xiao, W.; Li, W. Reliability Evaluation of Grid-Connected Photovoltaic Power Systems. IEEE Trans. Sustain. Energy 2012, 3, 379–389. [Google Scholar] [CrossRef]
- Bazilian, M.; Onyeji, I.; Liebreich, M.; MacGill, I.; Chase, J.; Shah, J.; Gielen, D.; Arent, D.; Landfear, D.; Zhengrong, S. Re-considering the economics of photovoltaic power. Renew. Energy 2013, 53, 329–338. [Google Scholar] [CrossRef]
- Sayed, A.; El-Shimy, M.; El-Metwally, M.; Elshahed, M. Reliability, Availability and Maintainability Analysis for Grid-Connected Solar Photovoltaic Systems. Energies 2019, 12, 1213. [Google Scholar] [CrossRef]
- Rezkallah, M.; Chandra, A.; Singh, B.; Singh, S. Microgrid: Configurations, control and applications. IEEE Trans. Smart Grid 2019, 10, 1290–1302. [Google Scholar] [CrossRef]
- Moradi, M.H.; Eskandari, M.; Hosseinian, S.M. Operational Strategy Optimization in an Optimal Sized Smart Microgrid. IEEE Trans. Smart Grid 2015, 6, 1087–1095. [Google Scholar] [CrossRef]
- Kotra, S.; Mishra, M.K. Design and Stability Analysis of DC Microgrid With Hybrid Energy Storage System. IEEE Trans. Sustain. Energy 2019, 10, 1603–1612. [Google Scholar] [CrossRef]
- Li, X.; Du, X.; Jiang, T.; Zhang, R.; Chen, H. Coordinating multi-energy to improve urban integrated energy system resilience against extreme weather events. Appl. Energy 2022, 309, 118455. [Google Scholar] [CrossRef]
- Hossain, A.; Pota, H.R.; Hossain, J.; Blaabjerg, F. Evolution of microgrids with converter-interfaced generations: Challenges and opportunities. Int. J. Electr. Power Energy Syst. 2019, 109, 160–186. [Google Scholar] [CrossRef]
- Mishra, S.; Anderson, K.; Miller, B.; Boyer, K.; Warren, A. Microgrid resilience: A holistic approach for assessing threats, identifying vulnerabilities, and designing corresponding mitigation strategies. Appl. Energy 2020, 264, 114726. [Google Scholar] [CrossRef]
- Borghei, M.; Ghassemi, M. Optimal planning of microgrids for resilient distribution networks. Int. J. Electr. Power Energy Syst. 2021, 128, 106682. [Google Scholar] [CrossRef]
- Afonaa-Mensah, S.; Odoi-Yorke, F.; Majeed, I.B. Evaluating the impact of industrial loads on the performance of solar PV/diesel hybrid renewable energy systems for rural electrification in Ghana. Energy Convers. Manag. X 2024, 21, 100525. [Google Scholar] [CrossRef]
- Yuan, J.; Jiao, Z.; Xiao, X.; Emura, K.; Farnham, C. Impact of future climate change on energy consumption in residential buildings: A case study for representative cities in Japan. Energy Rep. 2024, 11, 1675–1692. [Google Scholar] [CrossRef]
- Hervás-Zaragoza, J.; Colmenar-Santos, A.; Rosales-Asensio, E.; Colmenar-Fernández, L. Microgrids as a mechanism for improving energy resilience during grid outages: A post COVID-19 case study for hospitals. Renew. Energy 2022, 199, 308–319. [Google Scholar] [CrossRef]
- Panwar, M.; Chanda, S.; Mohanpurkar, M.; Luo, Y.; Dias, F.; Hovsapian, R.; Srivastava, A.K. Integration of flow battery for resilience enhancement of advanced distribution grids. Int. J. Electr. Power Energy Syst. 2019, 109, 314–324. [Google Scholar] [CrossRef]
- Tobajas, J.; Garcia-Torres, F.; Roncero-Sánchez, P.; Vázquez, J.; Bellatreche, L.; Nieto, E. Resilience-oriented schedule of microgrids with hybrid energy storage system using model predictive control. Appl. Energy 2022, 306, 118092. [Google Scholar] [CrossRef]
- Sun, Q.; Wu, Z.; Ma, Z.; Gu, W.; Zhang, X.-P.; Lu, Y.; Liu, P. Resilience enhancement strategy for multi-energy systems considering multi-stage recovery process and multi-energy coordination. Energy 2022, 241, 122834. [Google Scholar] [CrossRef]
- Galvan, E.; Mandal, P.; Sang, Y. Networked microgrids with roof-top solar PV and battery energy storage to improve distribution grids resilience to natural disasters. Int. J. Electr. Power Energy Syst. 2020, 123, 106239. [Google Scholar] [CrossRef]
- Zhou, Y.; Panteli, M.; Moreno, R.; Mancarella, P. System-level assessment of reliability and resilience provision from microgrids. Appl. Energy 2018, 23, 374–392. [Google Scholar] [CrossRef]
- Gilani, M.A.; Kazemi, A.; Ghasemi, M. Distribution system resilience enhancement by microgrid formation considering distributed energy resources. Energy 2020, 191, 116442. [Google Scholar] [CrossRef]
- Souto, S.; Parisio, A.; Taylor, P.C. MPC-based framework incorporating pre-disaster and post-disaster actions and transportation network constraints for weather-resilient power distribution networks. Appl. Energy 2024, 362, 123013. [Google Scholar] [CrossRef]
- Tavakoli, M.; Shokridehaki, F.; Akorede, M.F.; Marzband, M.; Vechiu, I.; Pouresmaeil, E. CVaR-based energy management scheme for optimal resilience and operational cost in commercial building microgrids. Int. J. Electr. Power Energy Syst. 2018, 100, 1–9. [Google Scholar] [CrossRef]
- Younesi, A.; Shayeghi, H.; Safari, A.; Siano, P. Assessing the resilience of multi microgrid based widespread power systems against natural disasters using Monte Carlo Simulation. Energy 2020, 207, 118220. [Google Scholar] [CrossRef]
- Mishra, D.K.; Ray, P.K.; Li, L.; Zhang, J.; Hossain, M.; Mohanty, A. Resilient control based frequency regulation scheme of isolated microgrids considering cyber attack and parameter uncertainties. Appl. Energy 2022, 306, 118054. [Google Scholar] [CrossRef]
- Amirioun, M.; Aminifar, F.; Lesani, H.; Shahidehpour, M. Metrics and quantitative framework for assessing microgrid resilience against windstorms. Int. J. Electr. Power Energy Syst. 2019, 104, 716–723. [Google Scholar] [CrossRef]
- Ge, P.; Teng, F.; Konstantinou, C.; Hu, S. A resilience-oriented centralised-to-decentralised framework for networked microgrids management. Appl. Energy 2022, 308, 118234. [Google Scholar] [CrossRef]
- Song, M.; Deng, R.; Yan, X.; Sun, W.; Gao, C.; Yan, M.; Ban, M.; Xia, S. Two-stage decision-dependent demand response driven by TCLs for distribution system resilience enhancement. Appl. Energy 2024, 361, 122894. [Google Scholar] [CrossRef]
- Arsoon, M.M.; Moghaddas-Tafreshi, S.M. Peer-to-peer energy bartering for the resilience response enhancement of networked microgrids. Appl. Energy 2020, 261, 114413. [Google Scholar] [CrossRef]
- Cai, S.; Xie, Y.; Wu, Q.; Xiang, Z. Robust MPC-based microgrid scheduling for resilience enhancement of distribution system. Int. J. Electr. Power Energy Syst. 2020, 121, 106068. [Google Scholar] [CrossRef]
- Wu, D.; Ma, X.; Huang, S.; Fu, T.; Balducci, P. Stochastic optimal sizing of distributed energy resources for a cost-effective and resilient Microgrid. Energy 2020, 198, 117284. [Google Scholar] [CrossRef]
- Masrur, H.; Sharifi, A.; Islam, R.; Hossain, A.; Senjyu, T. Optimal and economic operation of microgrids to leverage resilience benefits during grid outages. Int. J. Electr. Power Energy Syst. 2021, 132, 107137. [Google Scholar] [CrossRef]
- Wang, Y.; Rousis, A.O.; Strbac, G. Resilience-driven optimal sizing and pre-positioning of mobile energy storage systems in decentralized networked microgrids. Appl. Energy 2022, 305, 117921. [Google Scholar] [CrossRef]
- Zhang, W.; Valencia, A.; Gu, L.; Zheng, Q.P.; Chang, N.-B. Integrating emerging and existing renewable energy technologies into a community-scale microgrid in an energy-water nexus for resilience improvement. Appl. Energy 2020, 279, 115716. [Google Scholar] [CrossRef]
- Nelson, J.; Johnson, N.G.; Fahy, K.; Hansen, T.A. Statistical development of microgrid resilience during islanding operations. Appl. Energy 2020, 279, 115724. [Google Scholar] [CrossRef]
- Shi, Q.; Li, F.; Olama, M.; Dong, J.; Xue, Y.; Starke, M.; Winstead, C.; Kuruganti, T. Network reconfiguration and distributed energy resource scheduling for improved distribution system resilience. Int. J. Electr. Power Energy Syst. 2021, 124, 106355. [Google Scholar] [CrossRef]
- Ni, F.; Zheng, Z.; Xie, Q.; Xiao, X.; Zong, Y.; Huang, C. Enhancing resilience of DC microgrids with model predictive control based hybrid energy storage system. Int. J. Electr. Power Energy Syst. 2021, 128, 106738. [Google Scholar] [CrossRef]
- Shahid, M.U.; Khan, M.M.; Hashmi, K.; Boudina, R.; Khan, A.; Jiang, Y.; Tang, H. Renewable energy source (RES) based islanded DC microgrid with enhanced resilient control. Int. J. Electr. Power Energy Syst. 2019, 113, 461–471. [Google Scholar] [CrossRef]
- Manohar, M.; Koley, E.; Ghosh, S. Enhancing resilience of PV-fed microgrid by improved relaying and differentiating between inverter faults and distribution line faults. Int. J. Electr. Power Energy Syst. 2019, 108, 271–279. [Google Scholar] [CrossRef]
- Wu, R.; Sansavini, G. Integrating reliability and resilience to support the transition from passive distribution grids to islanding microgrids. Appl. Energy 2020, 272, 115254. [Google Scholar] [CrossRef]
- Younesi, A.; Shayeghi, H.; Siano, P.; Safari, A. A multi-objective resilience-economic stochastic scheduling method for microgrid. Int. J. Electr. Power Energy Syst. 2021, 131, 106974. [Google Scholar] [CrossRef]
- Gargari, M.Z.; Hagh, M.T.; Zadeh, S.G. Preventive maintenance scheduling of multi energy microgrid to enhance the resiliency of system. Energy 2021, 221, 119782. [Google Scholar] [CrossRef]
- Tabar, V.S.; Ghassemzadeh, S.; Tohidi, S. Increasing resiliency against information vulnerability of renewable resources in the operation of smart multi-area microgrid. Energy 2021, 220, 119776. [Google Scholar] [CrossRef]
- Mishra, S.; Anderson, K. Probabilistic Resilience of DER Systems—A Simulation Assisted Optimization Approach. In Proceedings of the 2021 IEEE Power & Energy Society Innovative Smart Grid Technologies Conference (ISGT), Washington, DC, USA, 16–18 February 2021; pp. 1–5. [Google Scholar] [CrossRef]
- Kumar, G.M.S.; Cao, S. Quantifying and enhancing the energy resilience of zero-emission train station systems against power outages via electrified train-building integrations. Energy Convers. Manag. X 2024, 22, 100531. [Google Scholar] [CrossRef]
- Commonwealth of Massachusetts. Massachusetts Household Heating Costs Forecast of energy Prices for Heating Fuels during 2021/22 Winter Heating Season. Available online: https://www.mass.gov/info-details/massachusetts-household-heating-costs (accessed on 19 December 2023).
- Clean Colition. VOR123: Value-of-Resilience. Unleashing Community Microgrids to Deliver Cost-Effective Resilience Benefits to Businesses, Municipalities, and Communities. Available online: https://clean-coalition.org/disaster-resilience/ (accessed on 15 January 2024).
- Clean Coalition. The Elusive Value-of-Resilience Has Been Successfully Quantified. This Clean Coalition Breakthrough Will Help Unleash Solar Microgrids by Accounting for Their Full Value. Available online: https://clean-coalition.org/news/elusive-value-of-resilience-quantified/ (accessed on 15 January 2024).
- PV Magazine. Think We Can’t Place a Value on Resilience? Think Again. Available online: https://pv-magazine-usa.com/2020/09/02/think-we-cant-place-a-value-on-resilience-think-again/ (accessed on 15 January 2024).
- Clean Coalition. How a Standardized Value of Resilience Will Proliferate Community Microgrids. The Ability to Easily Comprehend the Value of Resilience (VOR) is Key to Unleashing the Indefinite Power Backup Capabilities of Renewables-Driven Microgrids. Available online: https://clean-coalition.org/news/value-of-resilience-to-proliferate-community-microgrids/ (accessed on 15 January 2024).
- Jeffrey, M.; Ericson, S.; Jenket, D. Emergency Diesel Generator Reliability and Installation Energy Security. Golden, CO: National Renewable Energy Laboratory. NREL/TP-5C00-76553. 2020. Available online: https://www.nrel.gov/docs/fy20osti/76553.pdf (accessed on 15 January 2024).
- New York State Energy Research and Development Authority (NYSERDA); New York State Department of Public Service (DPS); New York State Division of Homeland Security and Emergency Services (DHSES). Microgrids for Critical Facility Resiliency in New York State. Available online: https://www.nyserda.ny.gov/-/media/Project/Nyserda/Files/Publications/Research/Electic-Power-Delivery/Microgrids-Report-Summary.pdf (accessed on 15 January 2024).
- Patsios, C.; Wu, B.; Chatzinikolaou, E.; Rogers, D.J.; Wade, N.; Brandon, N.P.; Taylor, P. An integrated approach for the analysis and control of grid connected energy storage systems. J. Energy Storage 2016, 5, 48–61. [Google Scholar] [CrossRef]
- ASHRAE. HVAC Systems and Equipment. In ASHRAE Handbook; Thermal Storage; ASHRAE: New York, NY, USA, 2016; Chapter 51. [Google Scholar]
- IEEE. IEEE 1366-2022—IEEE Guide for Electric Power Distribution Reliability Indices; IEEE: Piscataway, NJ, USA, 2022. [Google Scholar]
- EIA. Table B.1 Major Disturbances and Unusual Occurrences, Year-to-Date 2023. Available online: https://www.eia.gov/electricity/monthly/epm_table_grapher.php?t=epmt_b_1 (accessed on 18 January 2022).
- UCL. EnRiMa Energy Efficiency and Risk Management in Public Buildings Deliverable D7.3: Advisory Report on the Potential Capacity Expansion Policy. Available online: http://www.homepages.ucl.ac.uk/~ucakasi/Research/deliverable31032014.pdf (accessed on 18 January 2022).
- UCL. Energy Efficiency and Risk Management in Public Buildings Deliverable D4.3: Stochastic Optimization Prototype. Available online: https://people.dsv.su.se/~martinh/EnRiMa/sites/default/files/D43_SOP_public.pdf (accessed on 18 January 2022).
- Willis, H.L.; Scott, W.G. Distributed Power Generation: Planning and Evaluation; CRC: Boca Raton, FL, USA, 2000. [Google Scholar]
- Palomar Medical Center Escondido. Available online: https://thrive.kaiserpermanente.org/care-near-you/southern-california/san-diego/locations/palomar-medical-center/ (accessed on 17 December 2023).
- Turner Construction Company. Camino Nuevo High School. Available online: https://www.turnerconstruction.com/experience/project/D7A/camino-nuevo-high-school (accessed on 17 January 2022).
- University of Rochester Medical Center Rochester. Quick Facts about the New Golisano Children’s Hospital. Available online: https://www.urmc.rochester.edu/childrens-hospital/golisano-gift/quick-facts.aspx (accessed on 17 January 2022).
- School Construction News. New York High School Hastens Construction. Available online: https://schoolconstructionnews.com/2015/01/21/new-york-high-school-hastens-construction/ (accessed on 17 January 2022).
- Northwest CHP TAP. CHP Feasibility Assessment The University of Montana; Northwest CHP TAP: Missoula, MO, USA, 2012. [Google Scholar]
- OpenEI. Time-of-Use—General Service—Large: TOU-8 CPP (2Kv–50kV). Available online: https://apps.openei.org/IURDB/rate/view/56bbdd3c5457a391068b4568 (accessed on 18 January 2022).
- OpenEI. SC-9—General Large TOD Service [NYC]. Available online: https://apps.openei.org/IURDB/rate/view/5cd200395457a3c62754e9d3 (accessed on 18 January 2022).
- Oprea, S.V.; Bâra, A.; Ifrim, G. Flattening the electricity consumption peak and reducing the electricity payment for residential consumers in the context of smart grid by means of shifting optimization algorithm. Comput. Ind. Eng. 2018, 122, 125–139. [Google Scholar] [CrossRef]


| Case | Avg. Load (kW) |
|---|---|
| Palomar Medical Center | 2969 |
| Golisano Children’s Hospital | 1015 |
| Beacon High Shcool | 280 |
| Camino Nuevo High School | 4 |
| Case | Min. Load (kW) | Date |
|---|---|---|
| Palomar Medical Center | 1818 | 19 February |
| Golisano Children’s Hospital | 601 | 16 January |
| Beacon High School | 88 | 26 August |
| Camino Nuevo High School | 1 | 5 August |
| Case | Max. Load (kW) | Date |
|---|---|---|
| Palomar Medical Center | 4649 | 11 April |
| Golisano Children’s Hospital | 1686 | 9 August |
| Beacon High School | 1199 | 30 June |
| Camino Nuevo High School | 14 | 25 September |
| Case | Avg. Heating Load (kW) | Avg. Space Heating Load (kW) | Avg. DHW Load (kW) |
|---|---|---|---|
| Palomar Medical Center | 1122 | 1061 | 62 |
| Golisano Children’s Hospital | 331 | 311 | 21 |
| Beacon High School | 211 | 199 | 12 |
| Camino Nuevo High School | 9 | 6 | 3 |
| Case | Min. Heating Load (kW) | Min. Space Heating Load (kW) | Min. DHW Load (kW) |
|---|---|---|---|
| Palomar Medical Center | 35 (8 August) | 9 | 26 |
| Golisano Children’s Hospital | 9 (24 July) | 0 | 9 |
| Beacon High School | 0 (8 January) | 0 | 0 |
| Camino Nuevo High School | 0 (1 January) | 0 | 0 |
| Case | Max. Heating Load (kW) | Max. Space Heating Load (kW) | Max. DHW Load (kW) |
|---|---|---|---|
| Palomar Medical Center | 3578 (2 January) | 3549 | 141 |
| Golisano Children’s Hospital | 1157 (17 January) | 1143 | 47 |
| Beacon High School | 3197 (11 December) | 3194 | 59 |
| Camino Nuevo High School | 281 (31 January) | 281 | 6 |
| Case | Avg. Load (Tons) |
|---|---|
| Beacon High School | 288.69 |
| Golisano Children’s Hospital | 263.1 |
| Palomar Medical Center | 2.2 |
| Camino Nuevo High School | 0.1 |
| Case | Min. Load (Tons) | Date |
|---|---|---|
| Beacon High School | 0 | 2 January |
| Golisano Children’s Hospital | 5.5 | 17 January |
| Palomar Medical Center | 1.5 | 12 December |
| Camino Nuevo High School | 0 | 1 January |
| Case | Max. Load (Tons) | Date |
|---|---|---|
| Beacon High School | 438.3 | 25 July |
| Golisano Children’s Hospital | 480.3 | 9 August |
| Palomar Medical Center | 3.2 | 8 August |
| Camino Nuevo High School | 1.21 | 25 September |
| Location | Building Typology | Size (ft2/m2) | Land Available for PV and Wind (Acres/m2) | Annual Energy Consumption (kWh) | Annual Heating System Fuel Consumption (kWh) | Annual Cooling Plant Thermal Energy Consumption (ton hour) | Annual Existing Heating System Fuel Cost ($/kWh) [57] | Annual CHP Fuel Cost ($/kWh) [57,75] | Outage Duration (hours) [66] | Electricity Rate | Critical Load Factor (%) |
|---|---|---|---|---|---|---|---|---|---|---|---|
| 2185 Citracado Parkway, Escondido, CA 92029 (Escondido, California) | Palomar Medical Center Escondido (hospital) | 740,000/ 68,748 [71] | 1.54/6249 | 26,005,070 | 9,835,585 | 24,865,560 | 6817 | 6817 | 1.36 | Time-of-Use—General Service—Large: TOU-8 CPP (2–50 kV) [76] | 50% |
| 601 Elmwood Ave, Rochester, NY 14642, (Rochester, New York) | Golisano Children’s Hospital (hospital) | 200,000/ 18,580 [73] | 0.57/2322 | 7,371,115 | 2,898,472 | 1,909,570 | 6817 | 6817 | 1.36 | SC-9—General Large TOD Service [NYC] [77] | 50% |
| 3500 W Temple St, Los Angeles, CA 90004, (Los Angeles, California) | Camino Nuevo High School (high school) | 30,000/ 2787 [72] | 0.34/1393 | 36,764 | 64,476 | 889 | 6817 | 6817 | 1.36 | Time-of-Use—General Service—Large: TOU-8 CPP (2–50 kV) [76] | 25% |
| 522 W 44th St, New York, NY 10036, (New York, New York) | Beacon High School (high school) | 232,000/ 21,553 [74] | 0.76/3079 | 4,077,640 | 1,117,479 | 342,049 | 6817 | 6817 | 1.36 | SC-9—General Large TOD Service [NYC] [77] | 25% |
| Location | Latitude and Longitude | Average Horizontal Daily Global Solar Irradiation (kWh/m2/day) * |
|---|---|---|
| 2185 Citracado Parkway, Escondido, CA 92029 (Escondido, California) | Latitude: 33.13° N Longitude: 117.14° W | 6.15 |
| 3500 W Temple St., Los Angeles, CA 90004, (Los Angeles, California) | Latitude: 34.09° N Longitude: 118.3° W | 6.17 |
| 601 Elmwood Ave., Rochester, NY 14642, (Rochester, New York) | Latitude: 43.13° N Longitude: 77.62° W | 4.37 |
| 522 W 44th St., New York, NY 10036, (New York, New York) | Latitude: 40.77° N Longitude: 73.98° W | 4.69 |
| Period | Rate ($/kW) |
|---|---|
| 1 | 0 |
| 2 | 6.41 |
| 3 | 23.24 |
| Period | Rate ($/kW) |
|---|---|
| 1 | 0 |
| 2 | 11.48 |
| 3 | 15.56 |
| 4 | 23.89 |
| Concept | Description |
|---|---|
| Solar capacity | 257 kW PV size |
| Wind installation size | 0 kW wind size (no wind installation) |
| Battery power and capacity | No batteries |
| Diesel generator size | 1362 kW generator size |
| CHP electric capacity | 387 kW CHP reciprocating engine size |
| Hot water TES tank size | 4176 gal hot water TES tank size |
| Chilled water TES tank size | 824,649 gal chilled water TES tank size |
| GHP and ground loop system size | 0 tons heat pump capacity size (no GHP system) 0 vertical heat exchange wells |
| Potential life cycle savings (25 years) | USD 319,915 |
| Concept | Description |
|---|---|
| Solar capacity | 16 kW PV size |
| Wind capacity | 0 kW wind size (no wind installation) |
| Battery power and capacity | 15 kW battery power 22 kWh battery capacity |
| Diesel generator size | 0 kW generator size (no generator) |
| CHP electric capacity | 0 kW CHP reciprocating engine size (no CHP) |
| Hot water TES tank size | 0 gal hot water TES tank size (no hot water TES) |
| Chilled water TES tank size | 0 gal chilled water TES tank size (no chilled water TES) |
| GHP and ground loop system size | 67 tons heat pump capacity size 8 vertical heat exchange wells |
| Potential life cycle savings (25 years) | USD 51,771 |
| Concept | Description |
|---|---|
| Solar capacity | 95 kW PV size |
| Wind capacity | 0 kW wind size (no wind installation) |
| Battery power and capacity | 23 kW battery power 0 kWh battery capacity (no batteries) |
| Diesel generator size | 552 kW generator size |
| CHP electric capacity | 100 kW CHP reciprocating engine size |
| Hot water TES tank size | 5084 gal hot water TES tank size |
| Chilled water TES tank size | 256,176 gal chilled water TES tank size |
| GHP and ground loop system size | 0 tons heat pump capacity size (no GHO installation) 0 vertical heat exchange wells |
| Potential life cycle savings (25 years) | USD 136, 957 |
| Concept | Description |
|---|---|
| Solar installation size | 127 kW PV size |
| Wind installation size | 0 kW wind size |
| Battery power and capacity | 273 kW battery power 1481 kWh battery capacity |
| Diesel generator size | 0 kW generator size |
| CHP electric capacity | 209 kW CHP reciprocating engine size |
| Hot water TES tank size | 0 gal hot water TES tank size |
| Chilled water TES tank size | 0 gal chilled water TES tank size |
| GHP and ground loop system size | 588 tons heat pump capacity size 217 vertical heat exchange wells |
| Potential life cycle savings (25 years) | USD 975,440 |
Disclaimer/Publisher’s Note: The statements, opinions and data contained in all publications are solely those of the individual author(s) and contributor(s) and not of MDPI and/or the editor(s). MDPI and/or the editor(s) disclaim responsibility for any injury to people or property resulting from any ideas, methods, instructions or products referred to in the content. |
© 2024 by the authors. Licensee MDPI, Basel, Switzerland. This article is an open access article distributed under the terms and conditions of the Creative Commons Attribution (CC BY) license (https://creativecommons.org/licenses/by/4.0/).
Share and Cite
Rosales-Asensio, E.; de Loma-Osorio, I.; Palmero-Marrero, A.I.; Pulido-Alonso, A.; Borge-Diez, D. Optimal Microgrids in Buildings with Critical Loads and Hybrid Energy Storage. Buildings 2024, 14, 865. https://doi.org/10.3390/buildings14040865
Rosales-Asensio E, de Loma-Osorio I, Palmero-Marrero AI, Pulido-Alonso A, Borge-Diez D. Optimal Microgrids in Buildings with Critical Loads and Hybrid Energy Storage. Buildings. 2024; 14(4):865. https://doi.org/10.3390/buildings14040865
Chicago/Turabian StyleRosales-Asensio, Enrique, Iker de Loma-Osorio, Ana I. Palmero-Marrero, Antonio Pulido-Alonso, and David Borge-Diez. 2024. "Optimal Microgrids in Buildings with Critical Loads and Hybrid Energy Storage" Buildings 14, no. 4: 865. https://doi.org/10.3390/buildings14040865
APA StyleRosales-Asensio, E., de Loma-Osorio, I., Palmero-Marrero, A. I., Pulido-Alonso, A., & Borge-Diez, D. (2024). Optimal Microgrids in Buildings with Critical Loads and Hybrid Energy Storage. Buildings, 14(4), 865. https://doi.org/10.3390/buildings14040865