Article

Seismic Vulnerability Analysis of Concrete-Filled Steel Tube Structure under Main–Aftershock Earthquake Sequences

1
School of Architecture and Civil Engineering, Zhongyuan University of Technology, Zhengzhou 451191, China
2
College of Civil Engineering, Nanyang Institute of Technology, Nanyang 473004, China
*
Author to whom correspondence should be addressed.
Buildings 2024, 14(4), 869; https://doi.org/10.3390/buildings14040869
Submission received: 18 February 2024 / Revised: 17 March 2024 / Accepted: 21 March 2024 / Published: 22 March 2024
(This article belongs to the Special Issue Achieving Resilience and Other Challenges in Earthquake Engineering)

Abstract

:
Earthquakes are often followed by higher-intensity aftershocks, which tend to aggravate the accumulated and more severe damage to building structures. The seismic vulnerability of concrete-filled steel tube (CFST) structures under major aftershocks is more complex. In this paper, a CFST frame and a frame with buckling-restrained braces (BRBs) are studied, and the finite element analysis software Midas 2022 is used to analyze the seismic vulnerability of the two types of structures under main shock and main–aftershock. The results show that the structural vulnerability of the two structures is significantly higher under the main–aftershock sequences than under the main shock alone. Compared with the CFST structure, the structure with BRBs can effectively reduce the structural displacement and the hysteretic energy, decrease the plastic deformation risk of the structural components, and improve the seismic performance. The structure with BRBs can significantly reduce the probability of structural collapse under the main–aftershock sequence and can provide a reliable guarantee of the stability of the building.

1. Introduction

Historical seismic data show that main earthquakes are usually accompanied by a series of powerful and destructive aftershocks [1,2,3]. In 2023, an earthquake occurred in Turkey with an interval of only 9 h, and successive secondary earthquakes posed the risk of severe damage to or even the collapse of buildings [4,5,6]. The short interval between the main earthquake and the secondary aftershocks makes it difficult to repair and strengthen damaged buildings in a timely and effective manner. The buildings that have been damaged to a certain extent during the main earthquake are further damaged and collapse under the action of strong aftershocks, and the cumulative effect of structural damage is very obvious. Among these earthquake sequences, the main-aftershocks are of particular concern [7,8]. Xu et al. [9] and Ali and Khosrow [10] observe that the probability of failure significantly increases under the synergistic effect of main shocks and aftershocks, and that considering the effects of aftershocks can mitigate the risk of collapse. Rinaldin et al. [11] conducted a time–history analysis using earthquake records greater than or equal to PGA as aftershocks and found that structures under multiple earthquakes had higher requirements for ductility. Henry et al. [12] used observable physical damage factors to produce the most accurate and stable estimates of aftershock collapse vulnerability. Raghunandan et al. [13] studied the correspondence between the structural damage degree in the main earthquake and the ability of aftershock collapse, quantified the physical indexes of the visual evaluation criteria, and quickly predicted the aftershock collapse ability of the structure. Hassan et al. [14] propose that a model based on cumulative absolute velocity is the most effective method for predicting structural damage. Zhang and Jiang [15] used seismic vulnerability theory to study the failure probability of a high-rise frame structure. Zhou et al. [16,17] established an incremental damage ratio prediction model with the structural period and main–aftershock intensity ratio as parameters, and found that the significant cumulative damage caused by the main–aftershock sequences will result in a higher structural vulnerability under the action of the main–aftershock sequence than that under the action of the main shock alone. Hu et al. [18] propose a quantification method for structural elasticity under the influence of the main–aftershock. Wen et al. [19] presented an approach to assess the vulnerability of buildings under main–aftershock sequences, and studied the influence of aftershocks on the fragility of buildings under different limit states. The probability of masonry structural collapse limit state and wood-frame structure increase greatly in damaged structures during main earthquakes [20,21,22], while the response of the infilled frames to the aftershocks significantly depends on the damage experienced during the main shock [23]. Shunsuke et al. [24] conclude that low-rise RC frames have a low response to repeated earthquake sequences. Benavent-Climent [25,26] proposed the seismic energy damage index method, and Chen and Ma [27] and Mohsen et al. [28] used this method to evaluate the structural damage after the main–aftershock. A method for structural analysis under main shock–aftershock earthquake sequences is proposed by Zhang et al. [29], and it provides a new method of analyzing and evaluating structural cumulated damage and seismic performance under main shock–aftershock earthquake sequences and other earthquake sequences. Dizaj et al. [30] assess the vulnerability of ageing reinforced concrete (RC) frames subject to real main shock–aftershock (MS-AS) ground motion sequences. Song et al. [31] and Zhong et al. [32], respectively, used the double incremental dynamic analysis method and the main–aftershock earthquake probability demand model to analyze structural vulnerability, and found that seismic vulnerability increases with the increase in aftershock intensity.
Concrete-filled steel tube structures are comprised of two distinct materials with contrasting properties, namely steel and concrete. Their seismic performance is more complex than that of steel structures and reinforced concrete structures. In the Belt and Road Initiative, CFST structures will become one of the optimal configurations for the construction of many processes, and have broad application prospects in high-rise buildings and high-seismic-fortification-intensity zones [33]. Zhang et al. [34] found that the reserve coefficient of anti-collapse of concrete-filled steel tubular frame–core tube structures is greater than the recommended value, and that the structure has a good anti-collapse ability. Yang et al. [35] adopted an IDA method to obtain the collapse margin ratio (CMR) of the inter-story isolated structure, and found that appropriate isolation layer design can reduce structural vulnerability during main–aftershock sequences. Mazzon et al. [36] found that tuned mass dampers (TMDs) can dissipate most of the seismic energy. Frappa et al. [37] suggest the installation of external steel frames with dissipative braces to improve the seismic behavior of a building. Wang et al. [38] found that long-duration seismic motion significantly increases the cumulative damage of CFST frames with BRBs. Zhang et al. [39] found that buckling-restrained braces effectively improved the seismic performance of steel–concrete frames, and that vulnerability analysis should consider the effects of strain rate and seismic sequences. Shan et al. [40] introduced IDA to analyze the vulnerability of CFST frame–RC core tube structures and proposed an improved collapse risk-targeted seismic design method. It is evident that there is still insufficient in-depth investigation into the seismic vulnerability of concrete-filled steel tube structures under main–aftershock earthquake sequences.
The existing studies on the susceptibility of CFST structures mainly focus on the assessment of structural or member damage under a single earthquake, while only a few studies have comparatively analyzed the susceptibility to the effects of aftershocks and additional bracing, lacking further analyses. In this paper, the finite element analysis software Midas 2022 is used to establish the structure model of a CFST frame and a frame with BRBs. Based on the selection of natural seismic waves and the artificial main–aftershock sequences, we analyze the damage degree, energy time curve, and fragility of the CFST frame and the frame with BRBs under different main aftershock sequences. In addition, we also evaluated the effect of BRBs on the seismic performance of the structures. It can provide a reference for subsequent engineering design and construction of the CFST frame structure.

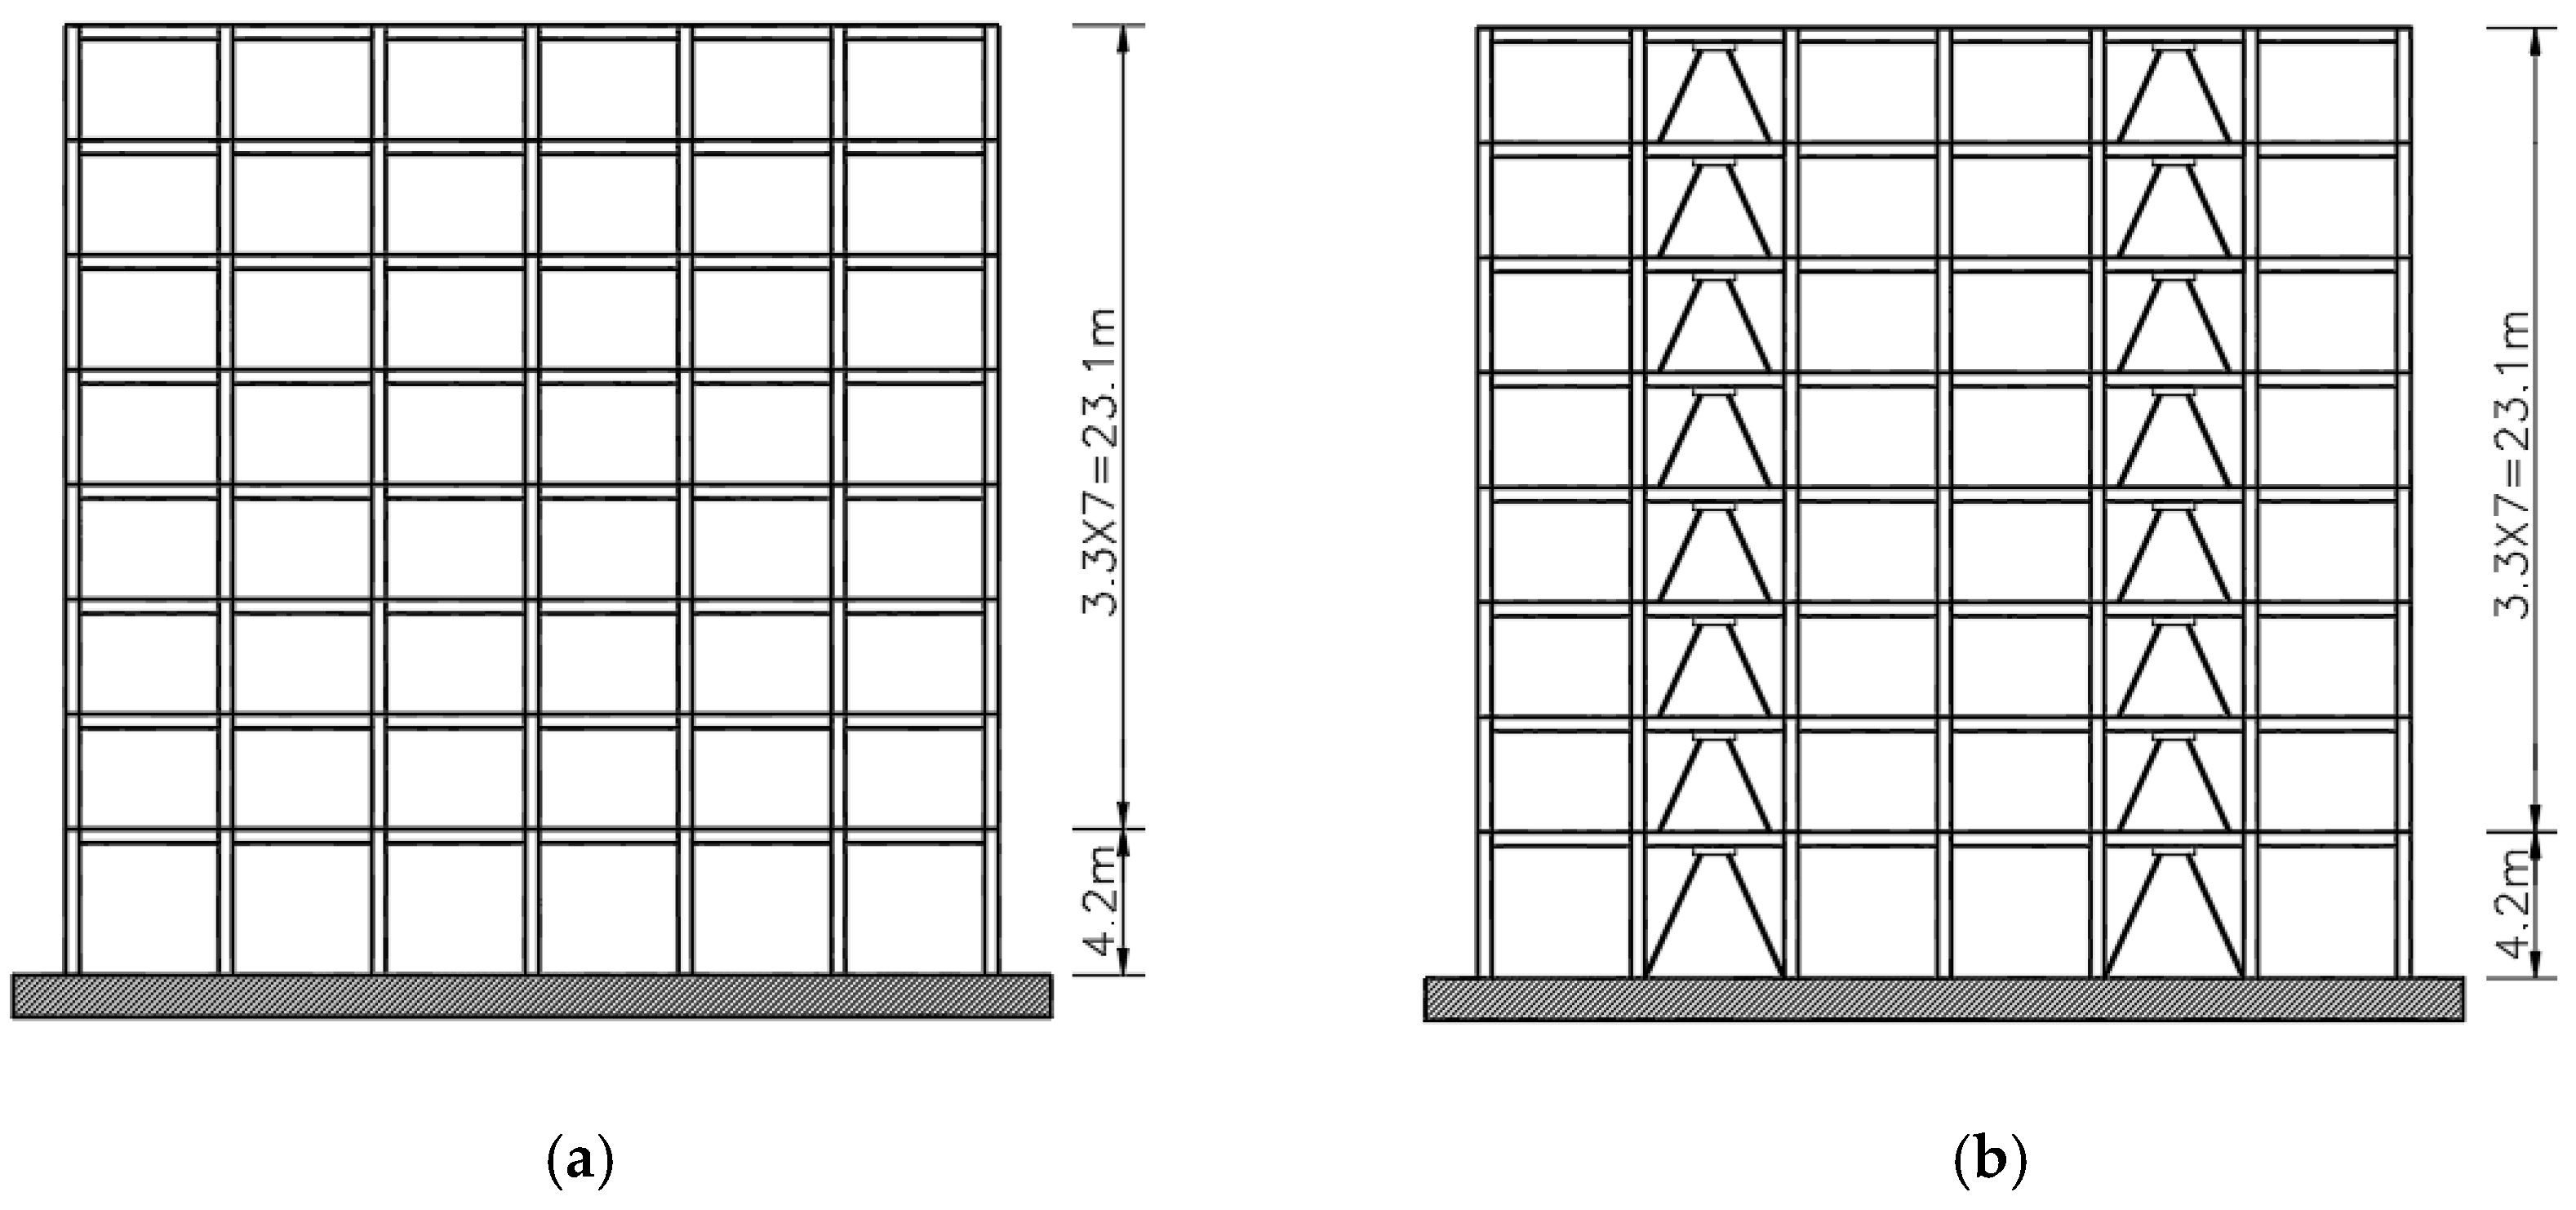
2. Structural Model Information and Finite Element Modeling

According to the Chinese code for the seismic design of buildings [41], an eight-story steel girder–circular steel tubular concrete column frame structure was designed, with the plan layout shown in Figure 1. The lengthwise direction has six spans with a length of 43.2 m and the transverse direction has three spans with a width of 15 m. The height of the first layer is 4.2 m, and the remaining layers are 3.3 m. The live loads of the floor and the roof are 2 kN/m2, the constant load of the roof is 5 kN/m2, and the constant load of the floor is 3.5 kN/m2. The concrete strength grade is C30. The basic parameters of the components and seismic design are shown in Table 1, Table 2 and Table 3. The structural elevation arrangement is shown in Figure 2a. In order to investigate the effect of energy-consuming bracing on the structural seismic performance under main–aftershock earthquake sequences, anti-buckling restraint braces were added to the original frame, as shown in Figure 2b, and the braces were arranged in a herringbone pattern.
The elastic–plastic dynamic time–history analyses of two frames were carried out by the nonlinear finite element analysis software Midas 2022. Shell elements are used to simulate concrete floors, and nonlinear beam elements are used to simulate beams and columns. A link element was adopted to model BRBs. The constrained concrete constitutive model was used for the concrete constitutive model, while the bilinear kinematic hardening model was used for the steel constitutive model [42]. The anti-buckling-restrained braces only supported the core material to connect with the frame structure to ensure that the core material could withstand all the axial forces, while the external steel tube only provided the restraining function to the core material, and no adhesive bonding was used between the core material and the external steel tube to reduce the friction between the interfaces. The Bouc–Wen model [42,43] was selected. In the dynamic analysis process, the P-Δ effect was considered, and the convergence of the structure was controlled based on the displacement criterion. We adopted the Newmark integral solution method and set the structural Rayleigh damping ratio to 0.05.

3. Incremental Dynamic Analysis under the Action of Main–Aftershock Earthquake Sequences

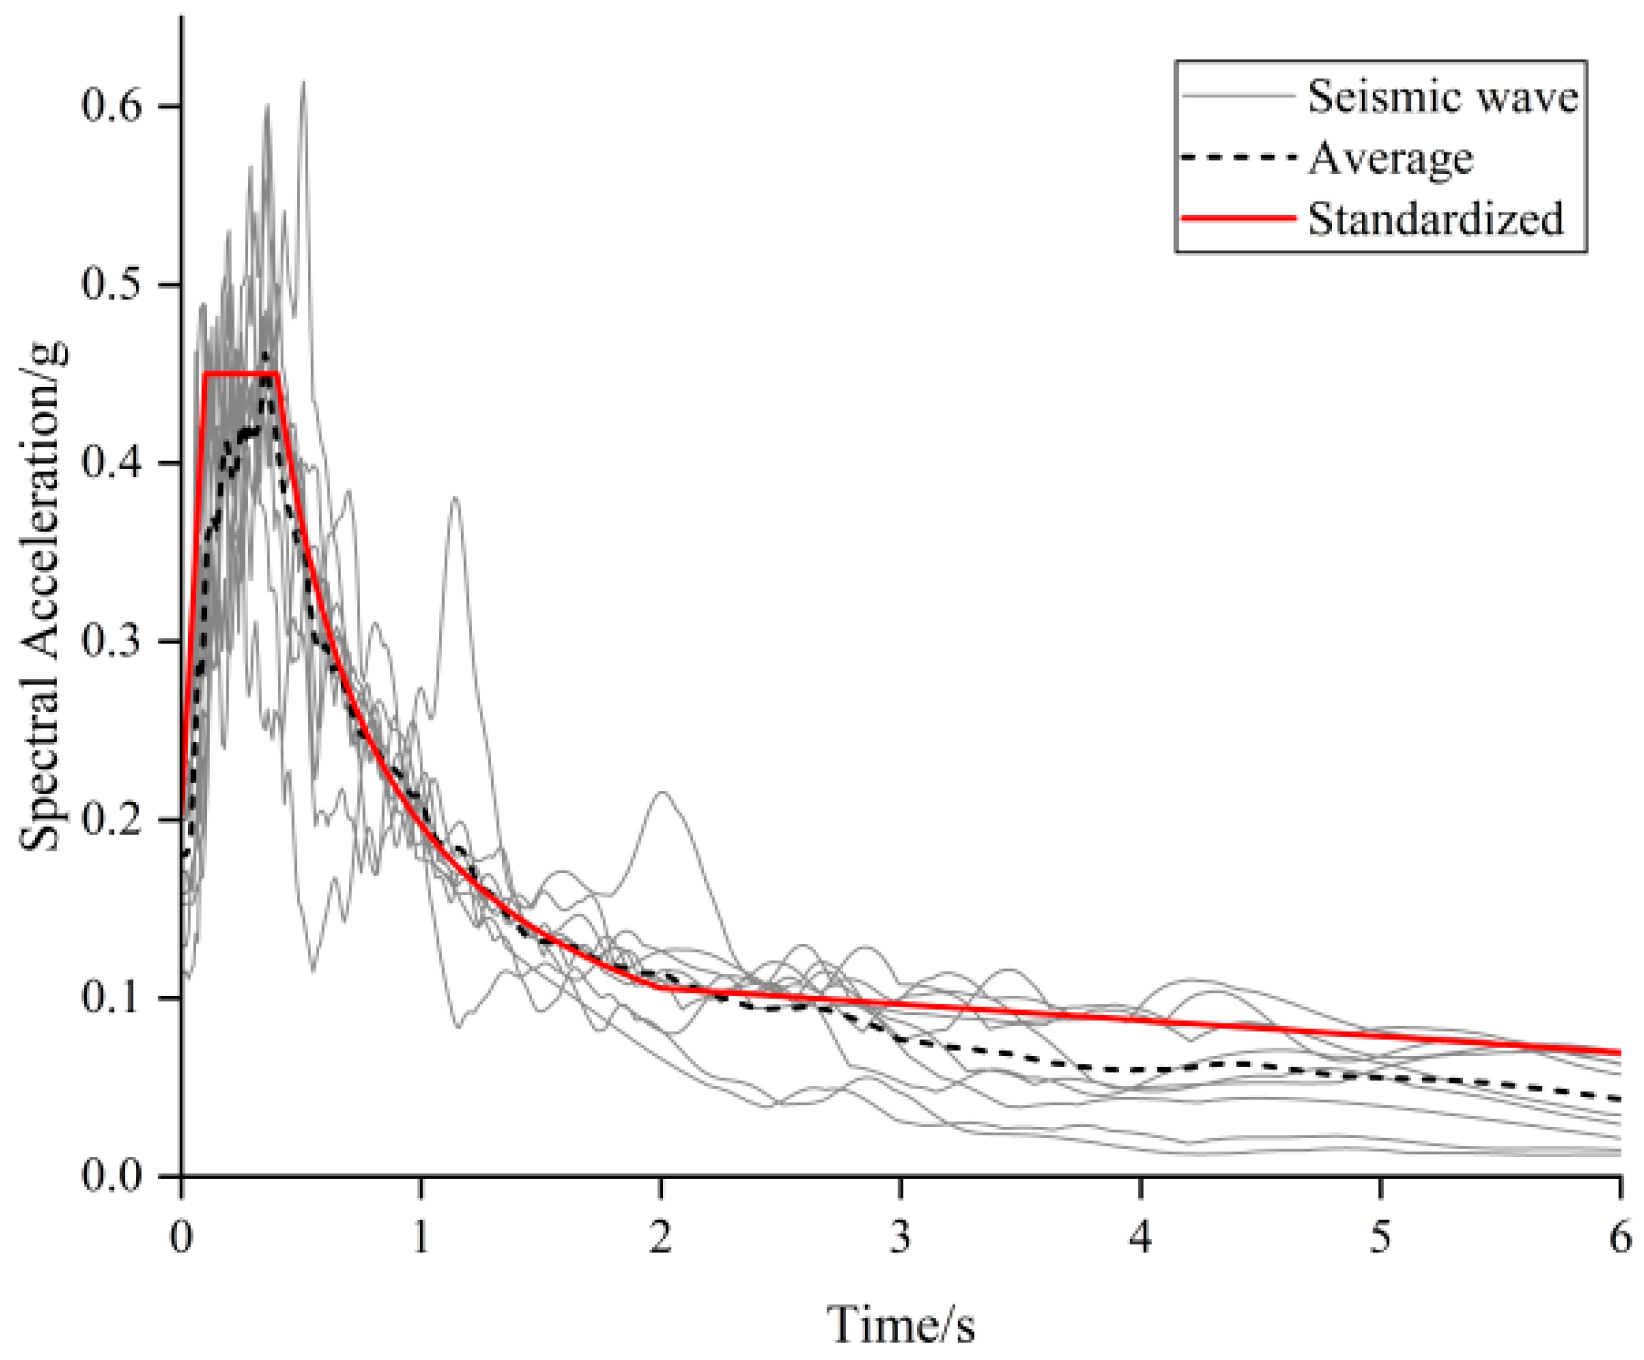
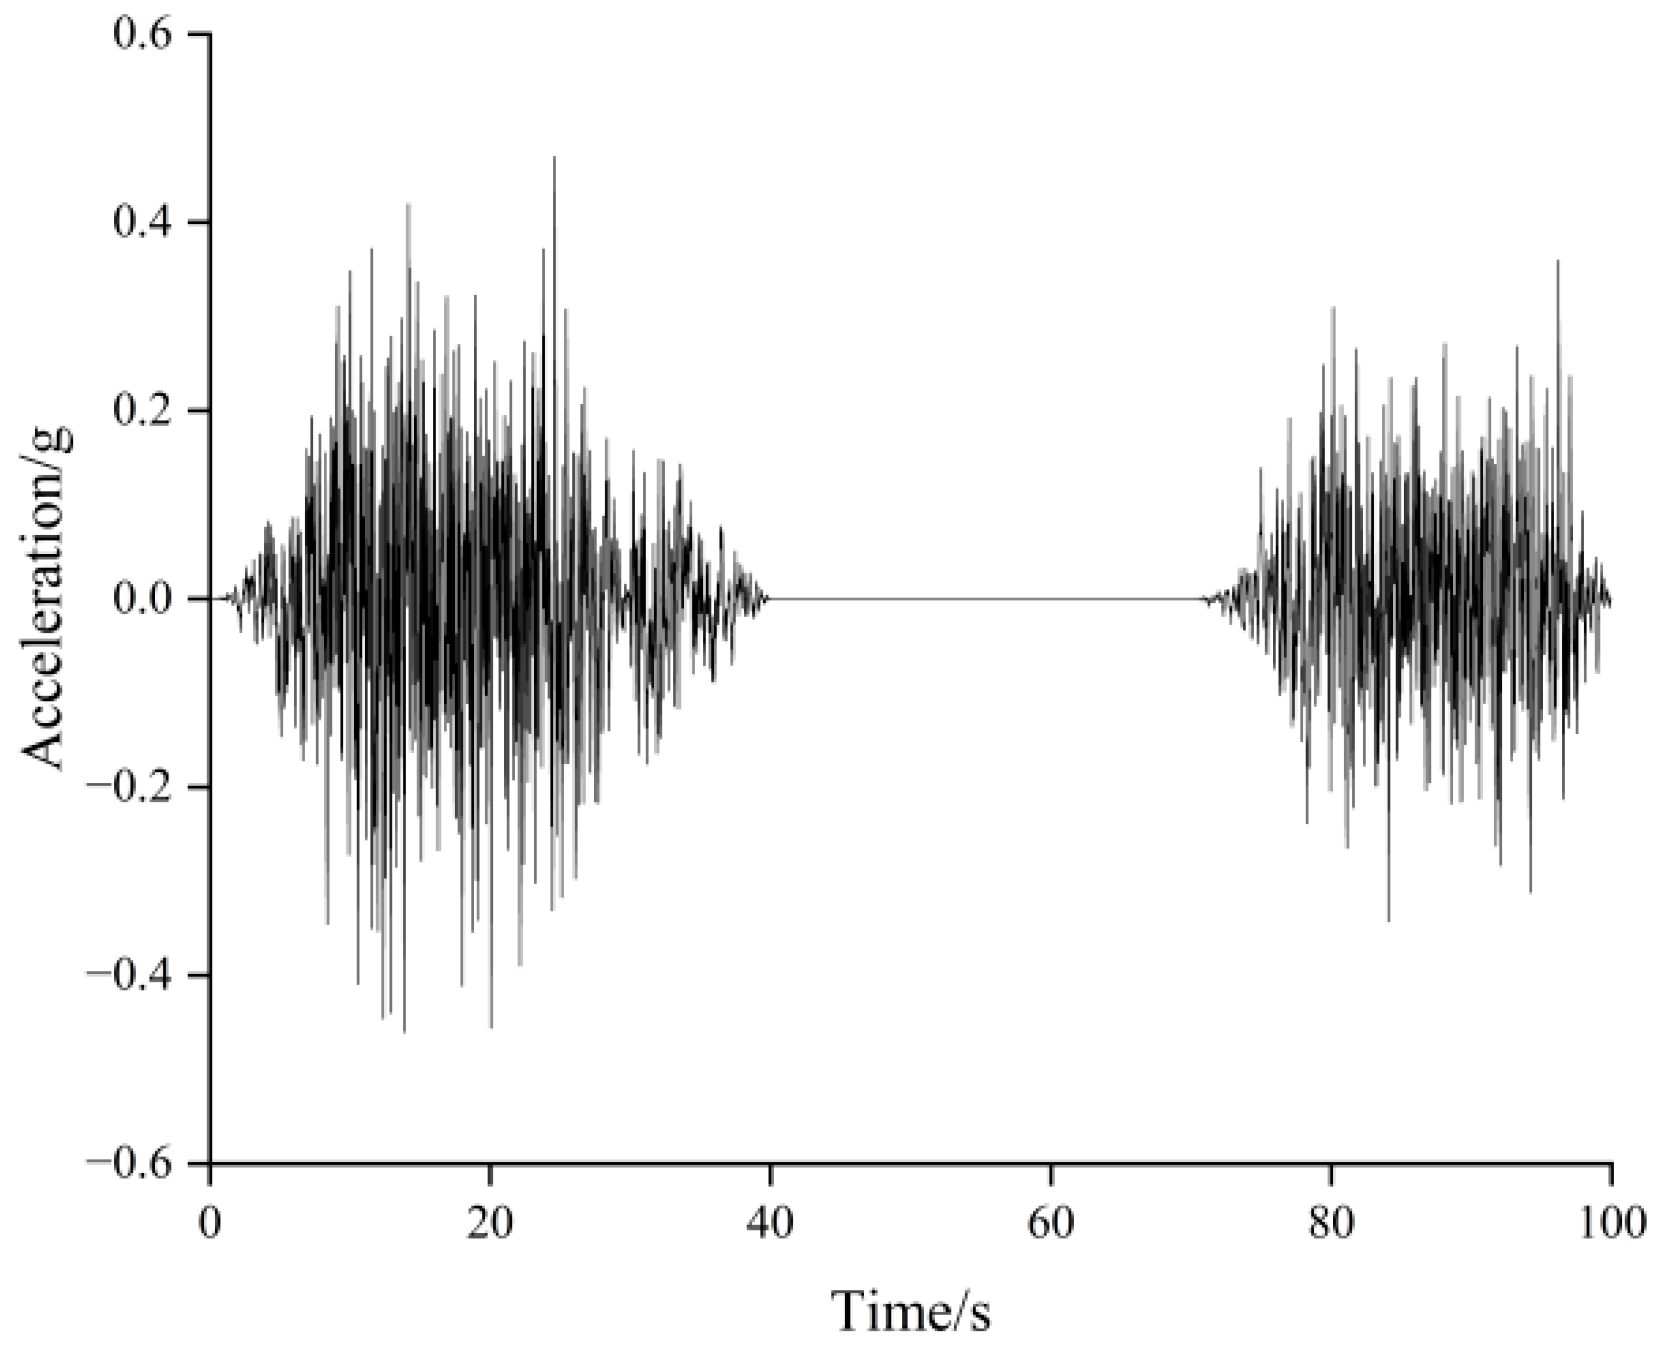
3.1. Seismic Wave Selection and Main–Aftershock Earthquake Sequence Construction

According to the Chinese Standard for the seismic resilience assessment of buildings [44], the principle of dual control of peak acceleration and peak velocity was adopted to ensure that the selected ground motion met the minimum values of both acceleration and velocity. Ten seismic waves, as shown in Table 4, were selected from the Pacific Earthquake Engineering Research Center (PEER) for analysis, including six natural and four synthetic seismic waves, and the normalized ground acceleration response spectrum is shown in Figure 3.
The attenuation method [45] was used to construct the main aftershock sequence, and the Hunt&Fill unequal step amplitude modulation method was adopted for amplitude modulation. Considering the actual response characteristics of earthquake actions, a 30 s interval was introduced between the two input seismic waves to ensure that the structural response was sufficiently completed after the initial earthquake action and preserve the plastic damage caused by the first seismic input. The construction methodology of the main–aftershock earthquake sequences is illustrated in Figure 4. A seismic wave propagation model with bi-directional input was used, with the long and short dimensions defined as the major and minor directions, respectively. In the primary direction of propagation, the seismic wave was directly input into the model in its original form, while in the secondary direction of propagation, the input seismic wave passed through a reduction coefficient which was multiplied by 0.85.

3.2. Dynamic Response Analysis

Based on the two-parameter seismic damage model proposed by Park and Ang [46], the finite element model proposed in Section 2 was used for dynamic elastic–plastic analysis. The software used plastic strain to evaluate the damage to components, the evaluation criteria were based on the Chinese Standard for Anti-Collapse Design of Building Structures [47], and the results of structural elastic–plastic seismic response under two seismic sequences with a PGA of 0.4 g were compared (Figure 5).
From Figure 5, it can be observed that the structural damage at the bottom is particularly significant under the two seismic sequences. Under the influence of the aftershock sequence, the structural damage in the middle and lower parts is further aggravated, resulting in an increase in the upper structural damage value. In contrast, the seismic performance of the CFST structure with BRBs is obviously better than that of the CFST structure without. The frame with BRBs can effectively control the damage degree of the beams and columns, particularly reducing the damage value of columns connected to the supports, and improve the overall stability and safety of the building.

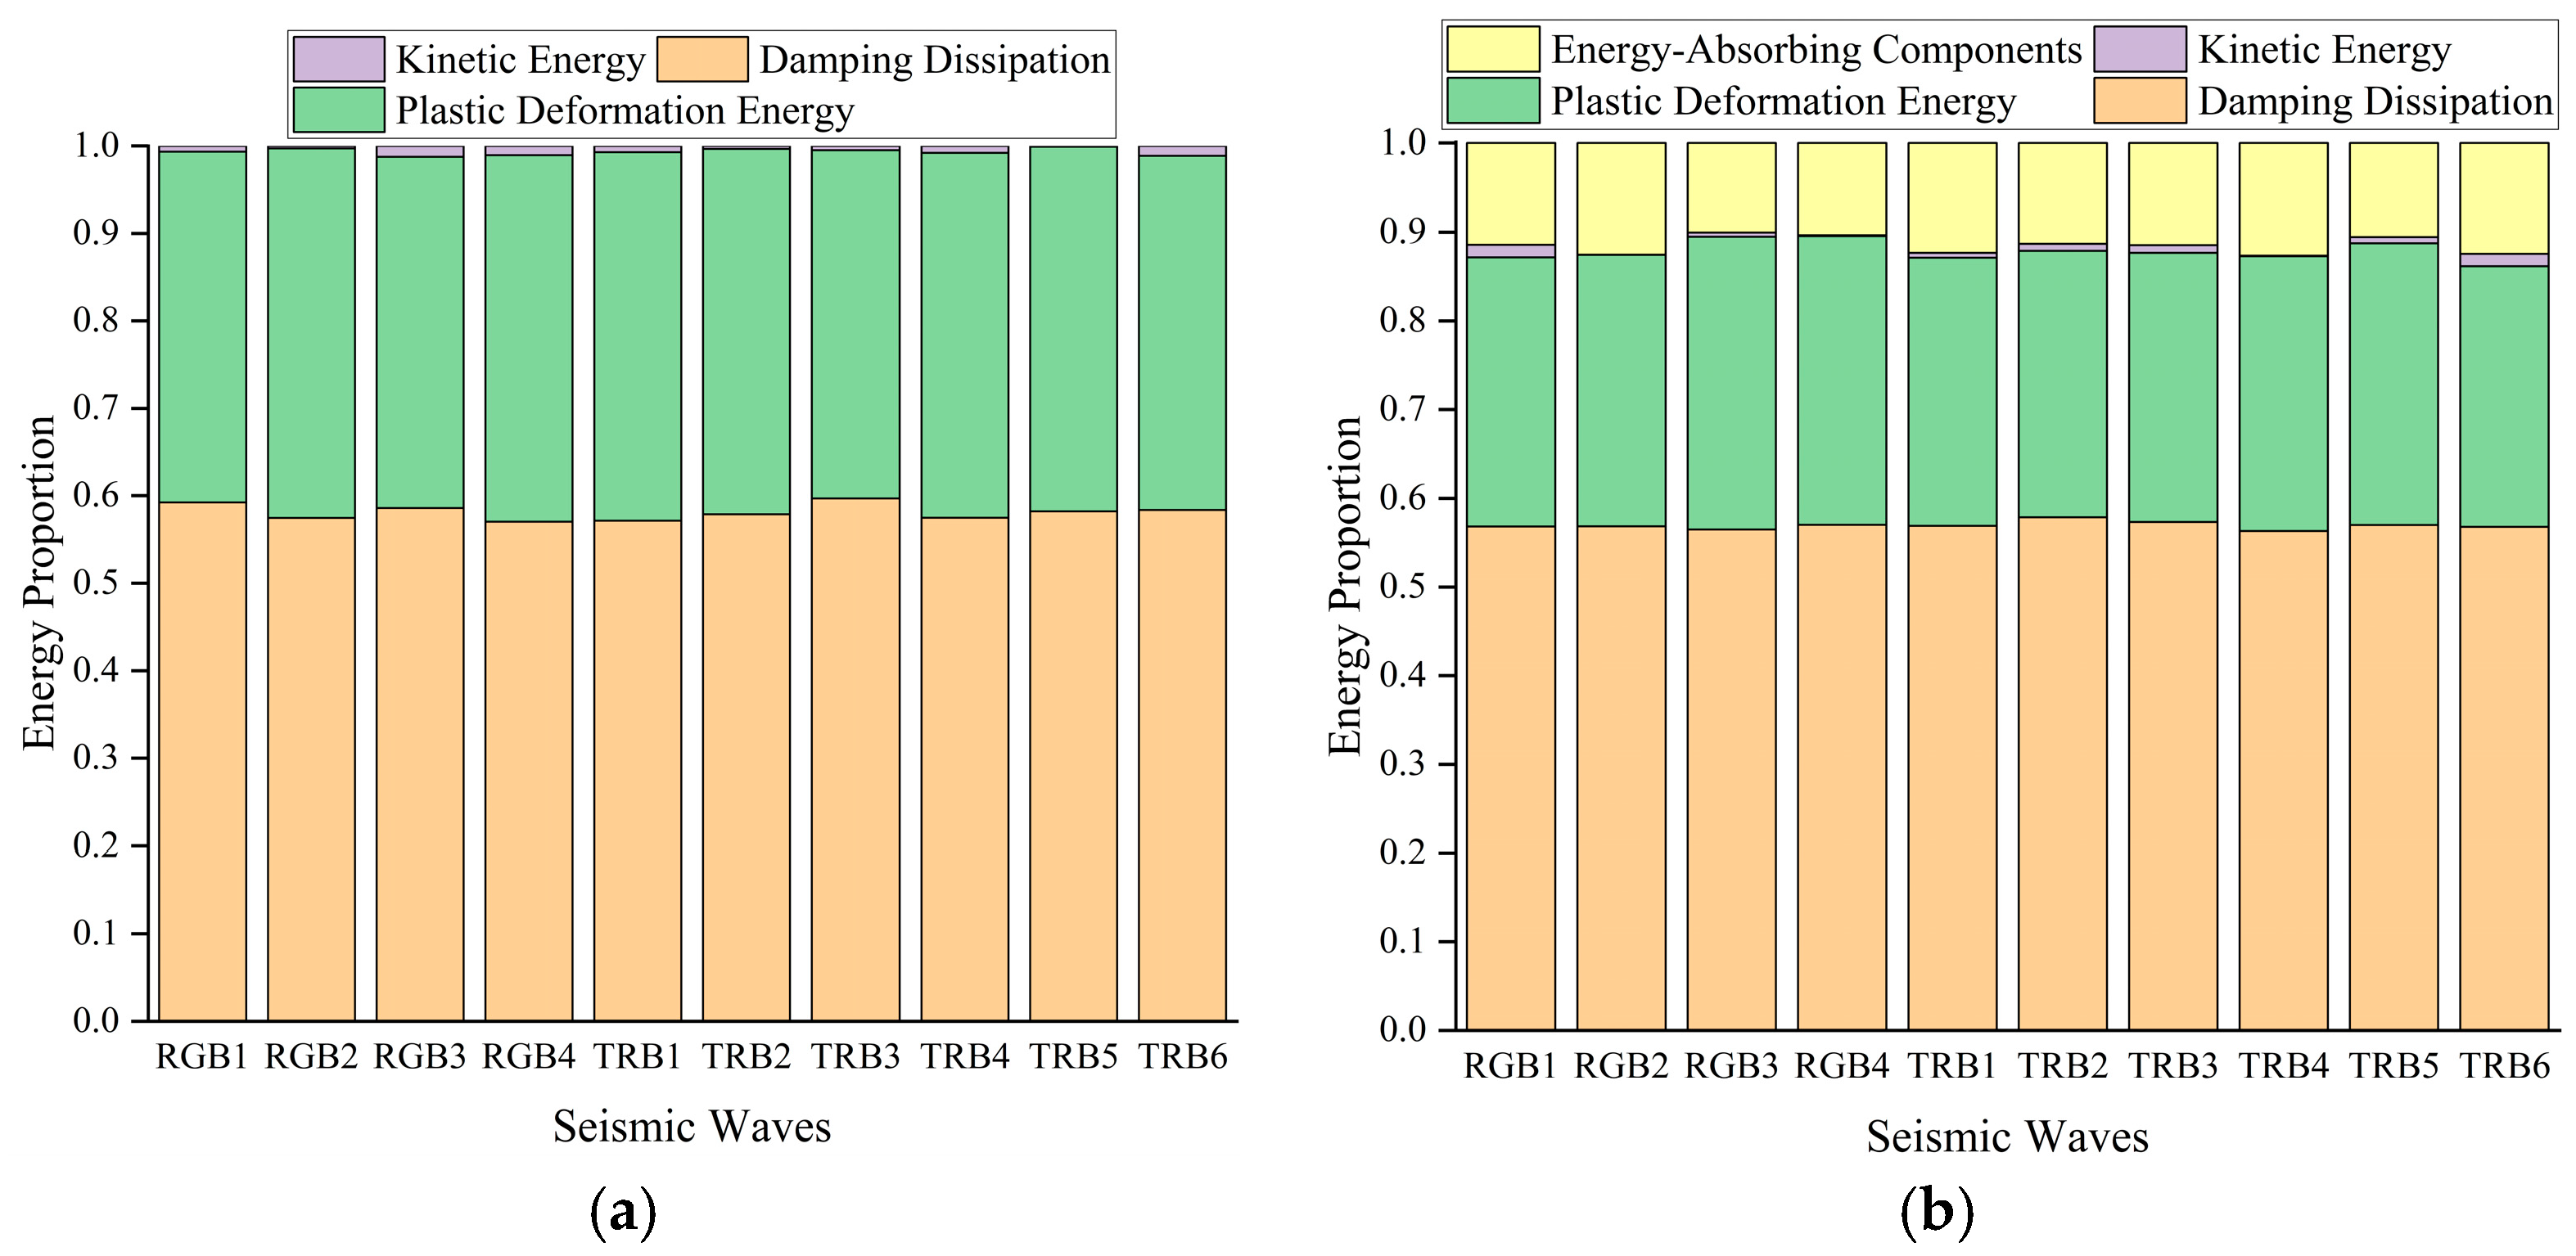
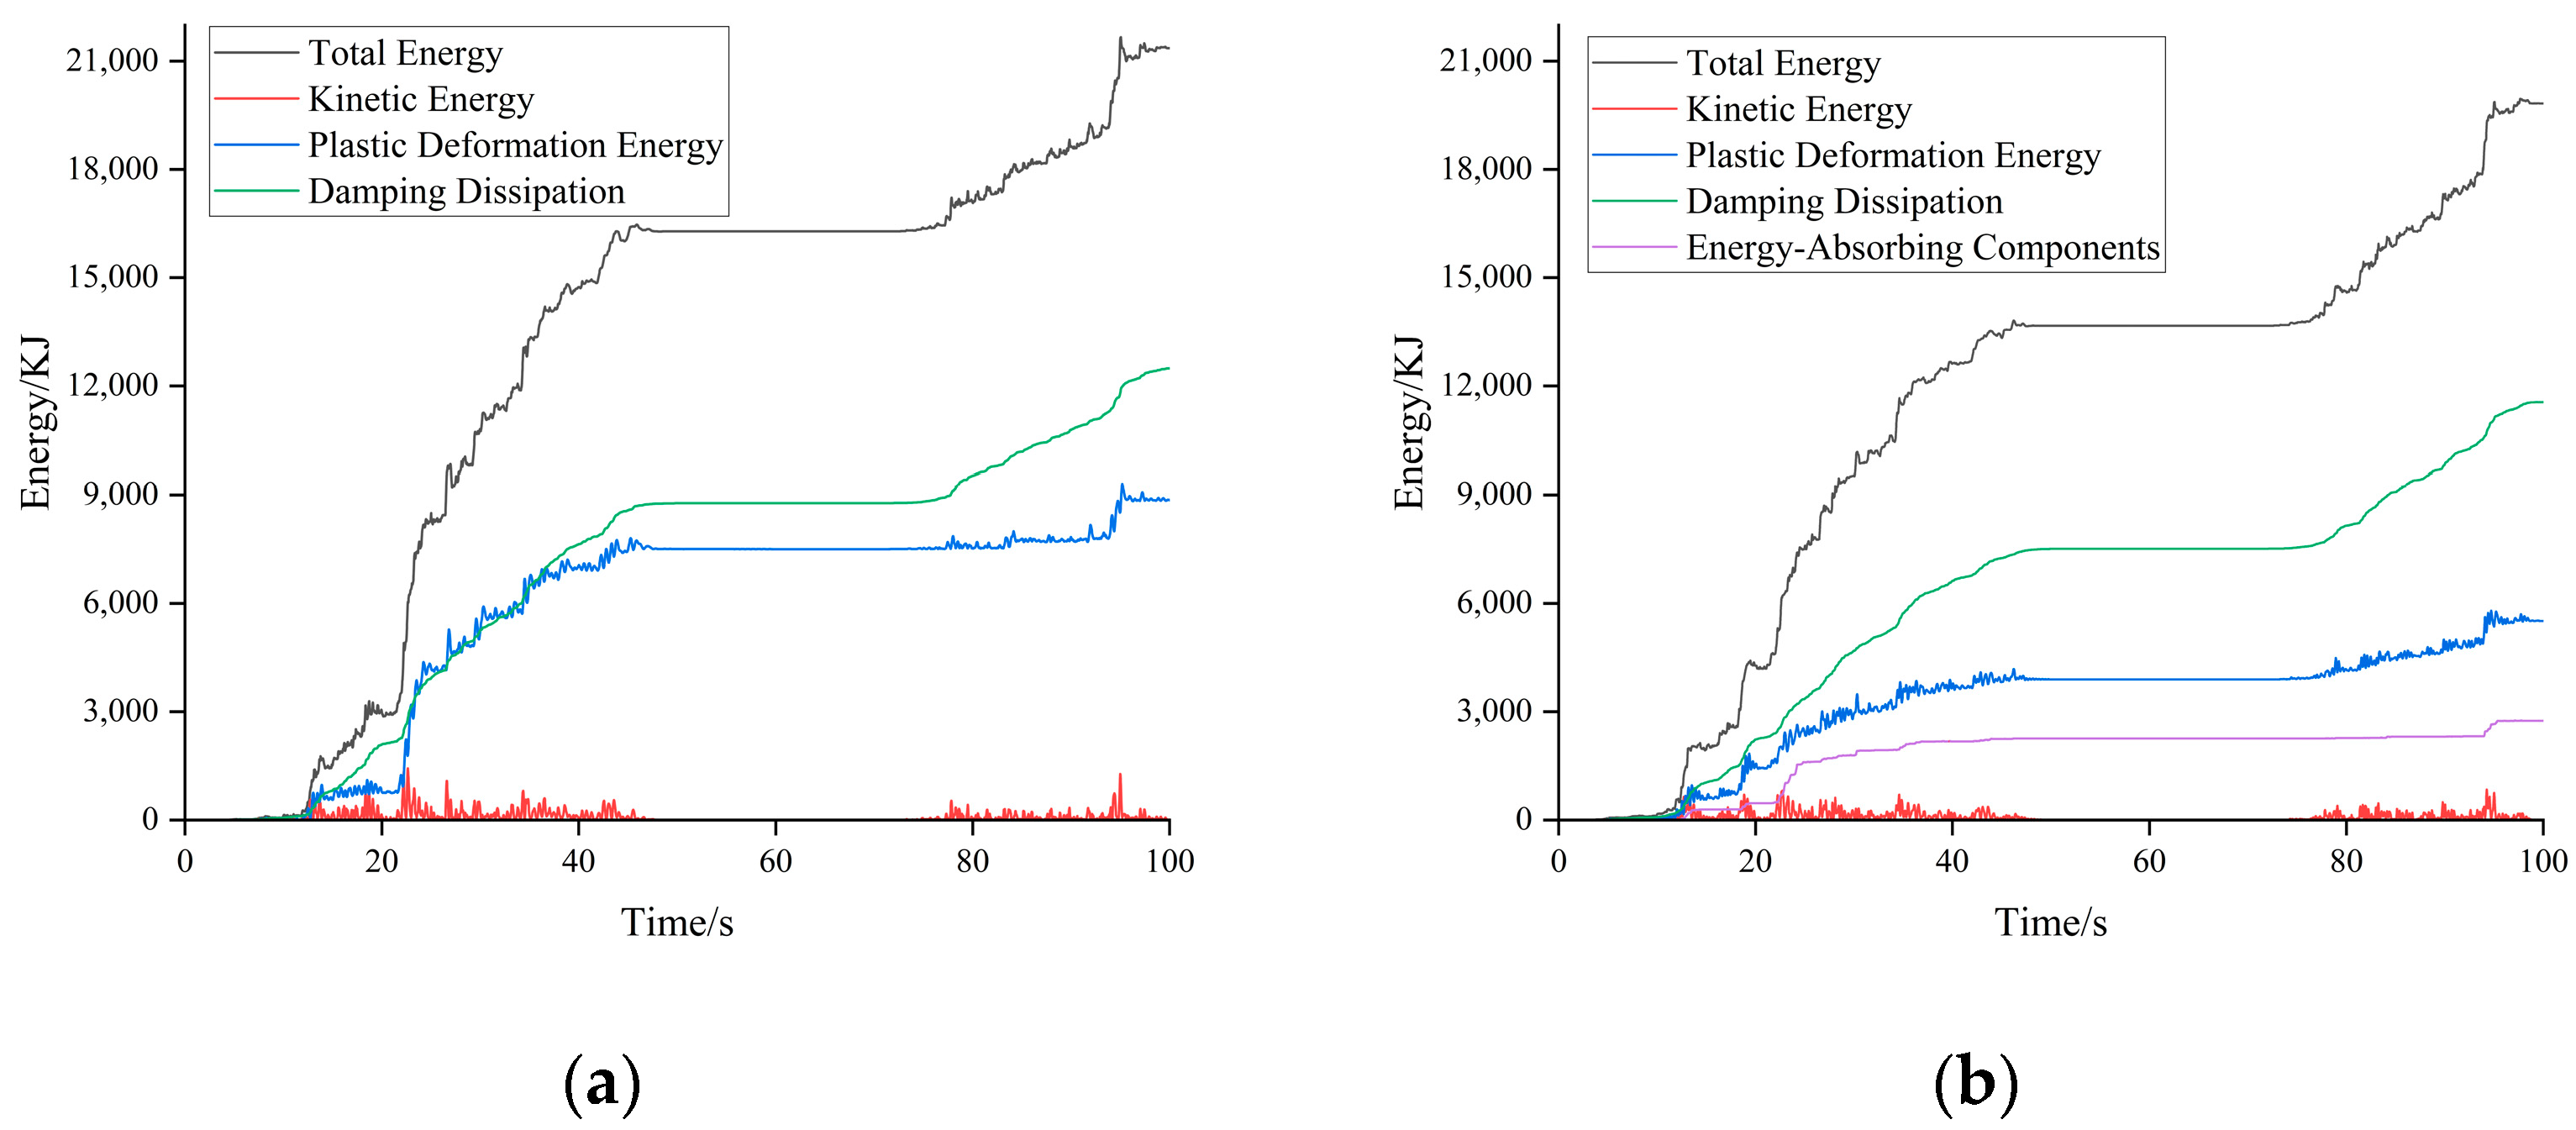
3.3. Structural Energy Dissipation Analysis

Under the action of earthquakes, the energy-consuming components in a concrete-filled steel tube frame structure system are mainly concrete-filled steel tube columns and steel beams. In order to further explore the consumption mechanism of earthquake energy in a structure, the seismic wave was adjusted to 400 gal, and the elastic–plastic dynamic time–history analysis was carried out on the structural model. The energy distribution ratio at T = 100 s is shown in Figure 6. The structural energy–time curves under seismic wave RGB3 are shown in Figure 7.
According to Figure 6a, it can be seen that the structural damping energy and plastic deformation energy account for 58% and 40% of the total energy, respectively. The structure mainly dissipates seismic energy through structural damping and component plastic deformation. The CFST structure can effectively absorb seismic energy and has good ductility and toughness. Figure 6b shows that BRB energy consumption accounts for about 12%, and that the damping energy and plastic deformation energy of the structure are reduced by about 3% and 9%, respectively. It can be concluded from Figure 7 that the structural kinetic energy fluctuates within a certain range with time and generally disappears after the earthquake. However, this does not mean that the effect of structural kinetic energy can be ignored. The kinetic energy change can reflect the change of the structural motion velocity. During the 30 s interval between the two seismic sequences, the structural total energy and other energy dissipation remained constant. When the aftershock sequence was input, the BRB support had already been damaged and the absorbed energy was limited, so the increase rate of damping energy and strain energy in Figure 7b also increased. Therefore, increasing BRB support can reduce the structural deformation and damage degree under earthquake action.

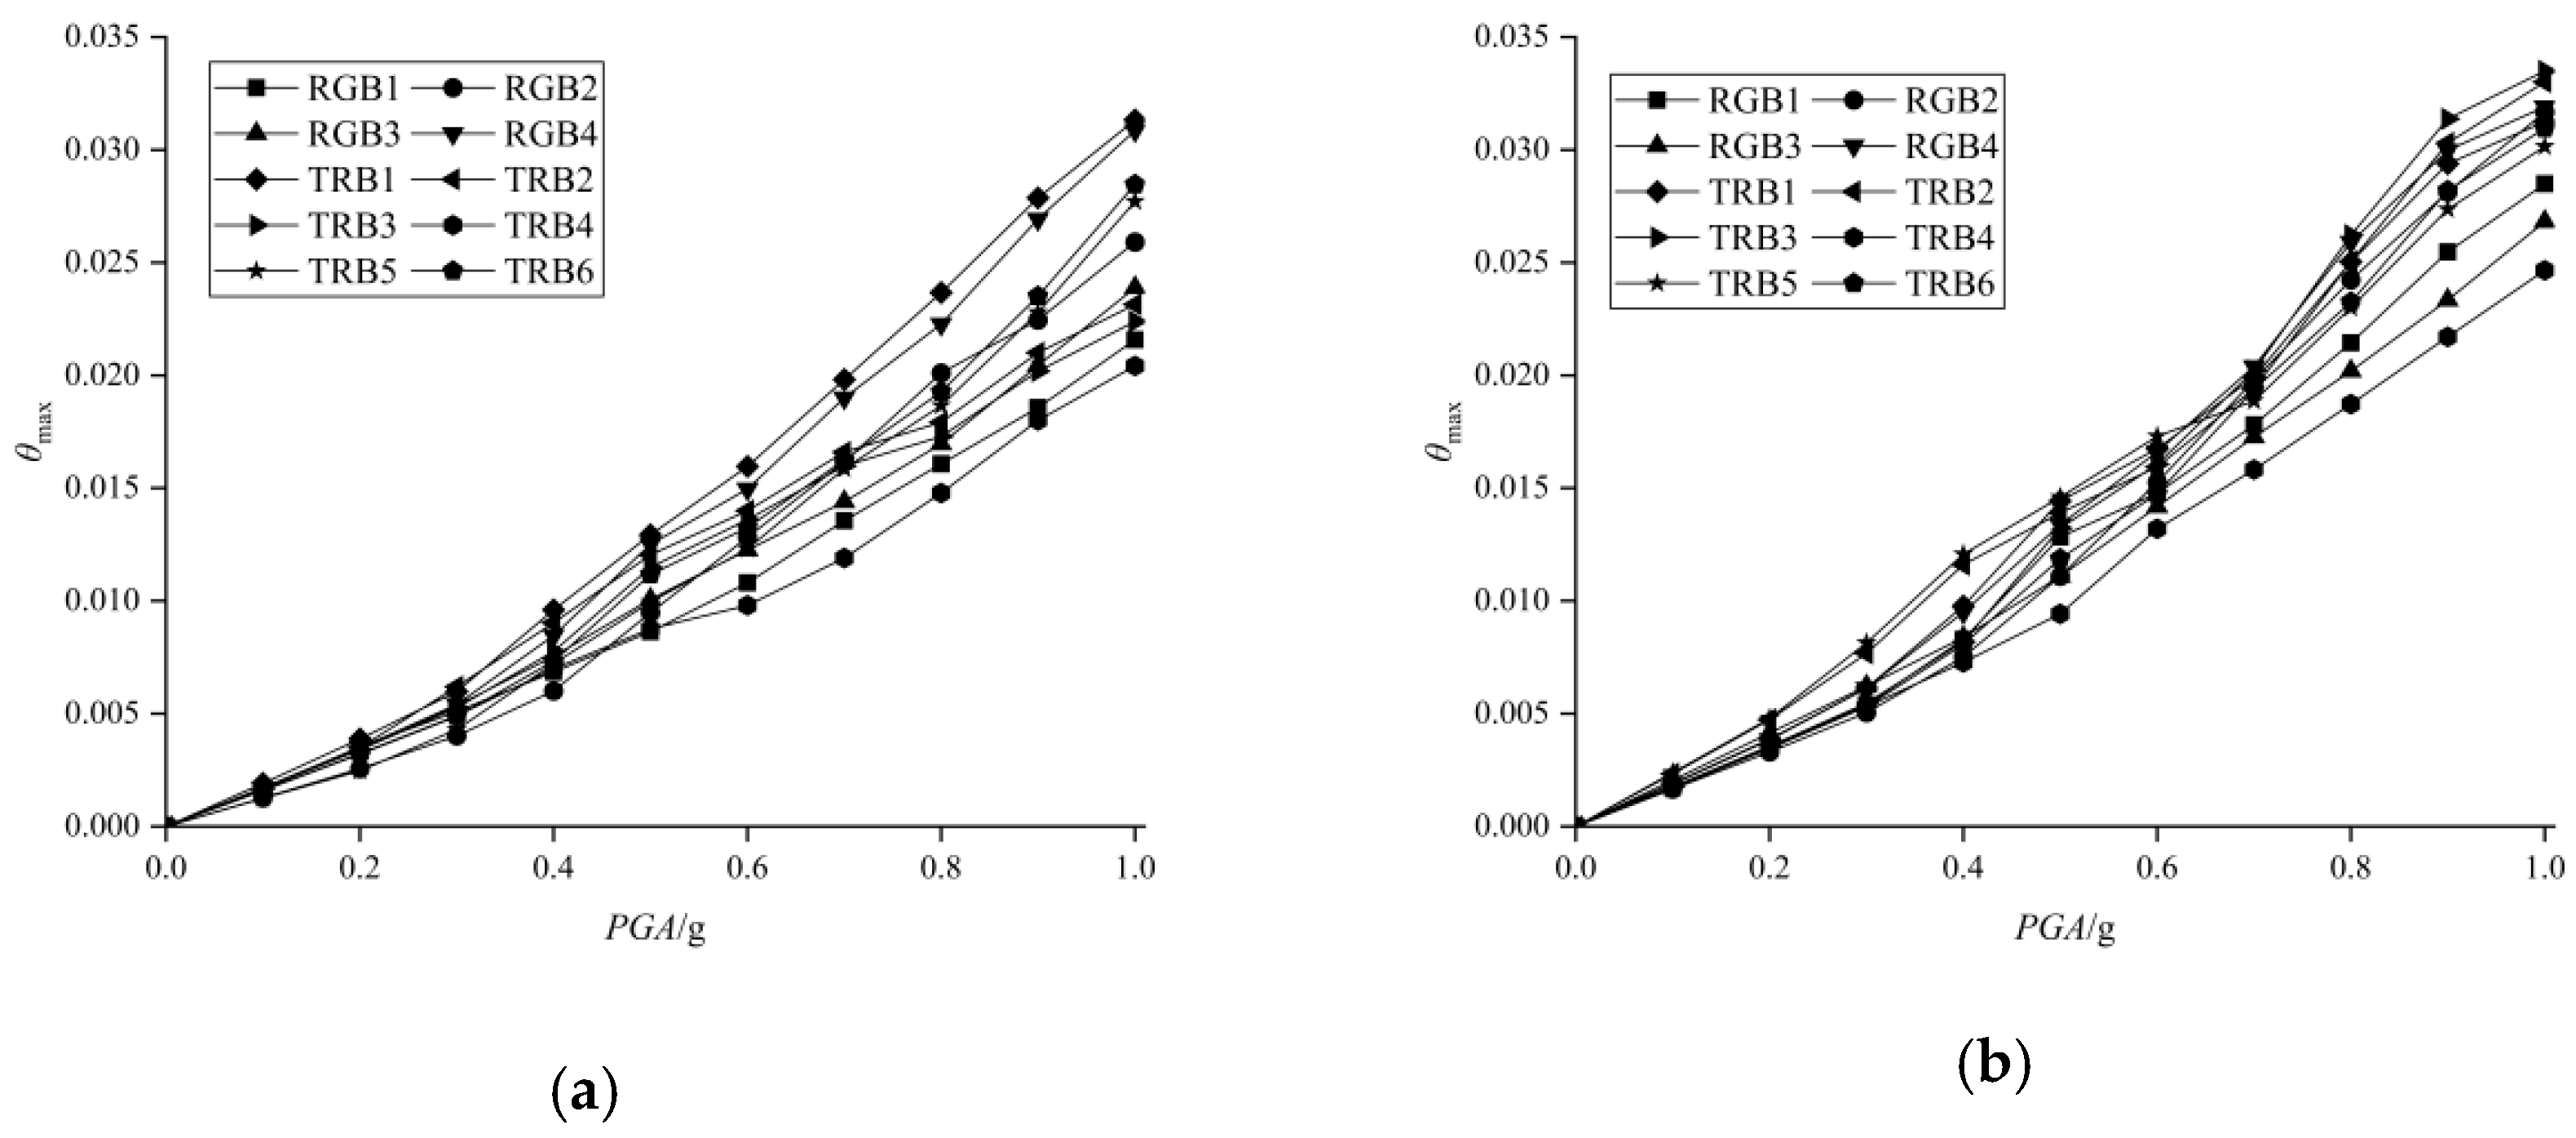
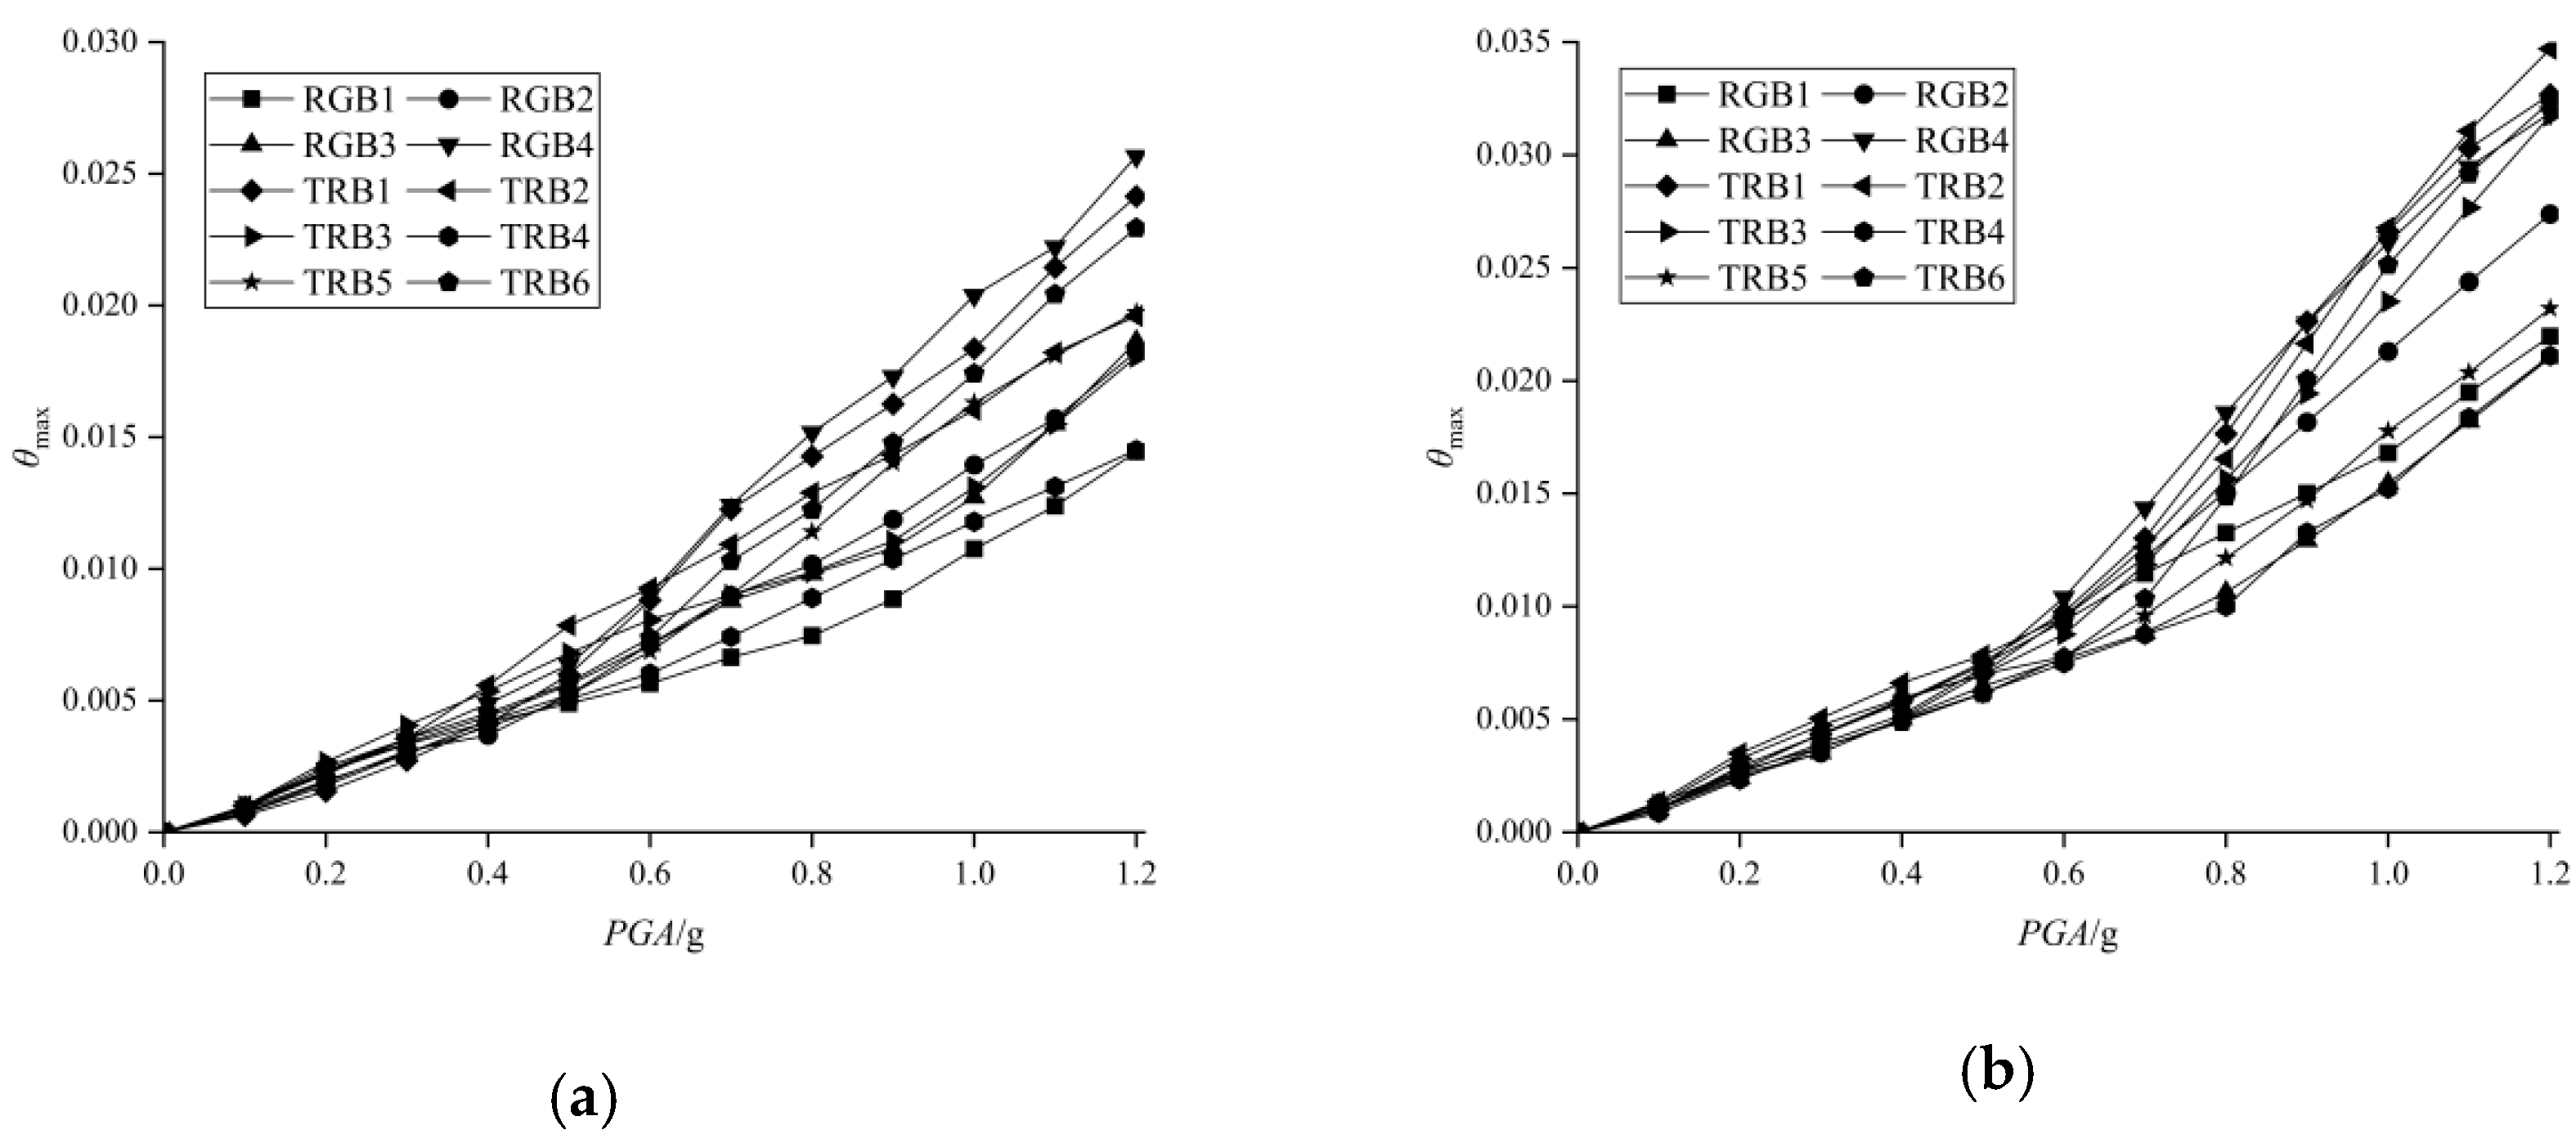
3.4. Incremental Dynamic Analysis

The IDA curve is a relationship curve between ground motion intensity measure (IM) and structure damage measure (DM), which is used to describe the damage change process of structure under different earthquake intensities. PGA was selected as the ground motion intensity index (IM), and the maximum inter-story drift ratio (θmax) was selected as the damage index (DM). The IDA curves obtained by the incremental dynamic analysis under the main earthquake and the main–aftershock conditions are shown in Figure 8 and Figure 9, respectively.
From Figure 8 and Figure 9, it is evident that IDA curve clusters of both types exhibited good overall convergence. As the PGA increases, the θmax of the structure gradually increases, indicating that the structure can effectively reflect the dynamic response of earthquakes. When the PGA is less than 0.2 g, the interlayer displacement response of the structure is basically similar, indicating that the structure is in the elastic stage or has just entered the elastic–plastic stage and is less affected by earthquake vibrations. When PGA > 0.3 g, the IDA curve appears differentiated, and the differentiation is relatively uniform, indicating that the structure has entered the elastic–plastic stage and is greatly affected by the earthquake. It also shows that the selected model fully takes into account the randomness of an earthquake and can reflect the response characteristics of the structure under different earthquake vibrations. By comparing the IDA curves in Figure 8 and Figure 9, it can be observed that when the PGA is below the limit of the working conditions of the components, the buckling-restrained brace components can effectively absorb seismic energy and support the structure, and ensure the stability of the structure. When the PGA exceeds the limit of the working conditions of the components, the seismic responses of the two frame structures begin to be similar. Nevertheless, the seismic response of the frame structure with BRBs is significantly smaller. This is attributed to the fact that the supporting components can continue to constrain the displacement of the structure and reduce seismic damage to the building.
In summary, the main shock sequences initially cause significant damage to the structure, resulting in substantial residual deformation of the structure. Subsequently, the aftershocks have an amplifying effect on the structural damage under the main shock, which further affected the resistance of the structure to the earthquake action. However, the concrete-filled steel tube frame with BRBs can improve the deformation magnitude of the structure under earthquake action, increase the stiffness of the structure against lateral displacement, and enhance overall stability.

4. Seismic Vulnerability Analysis

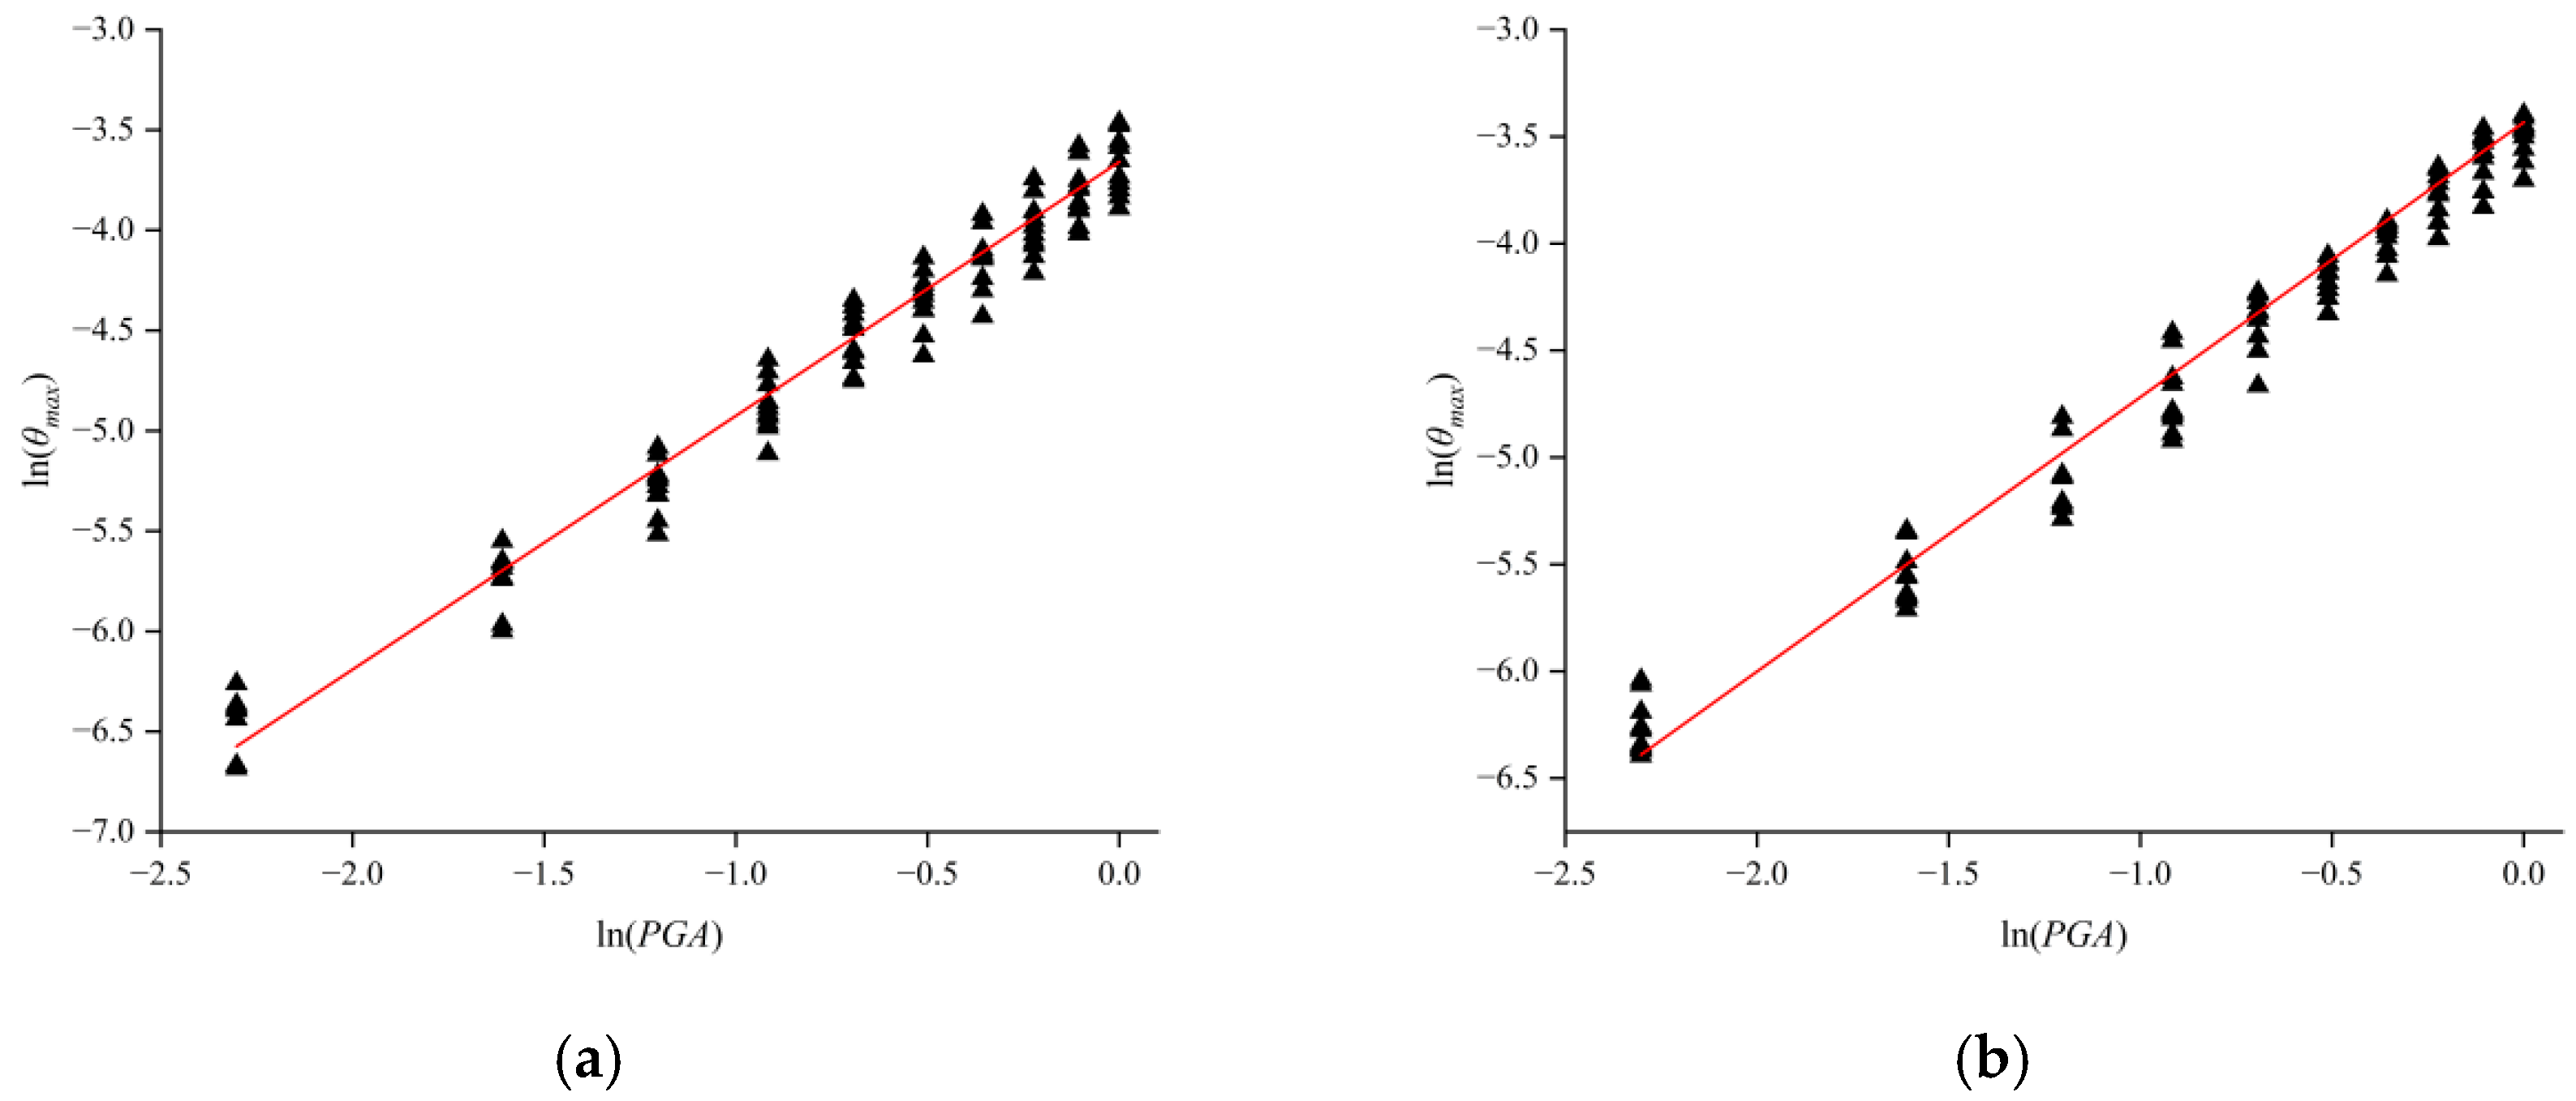
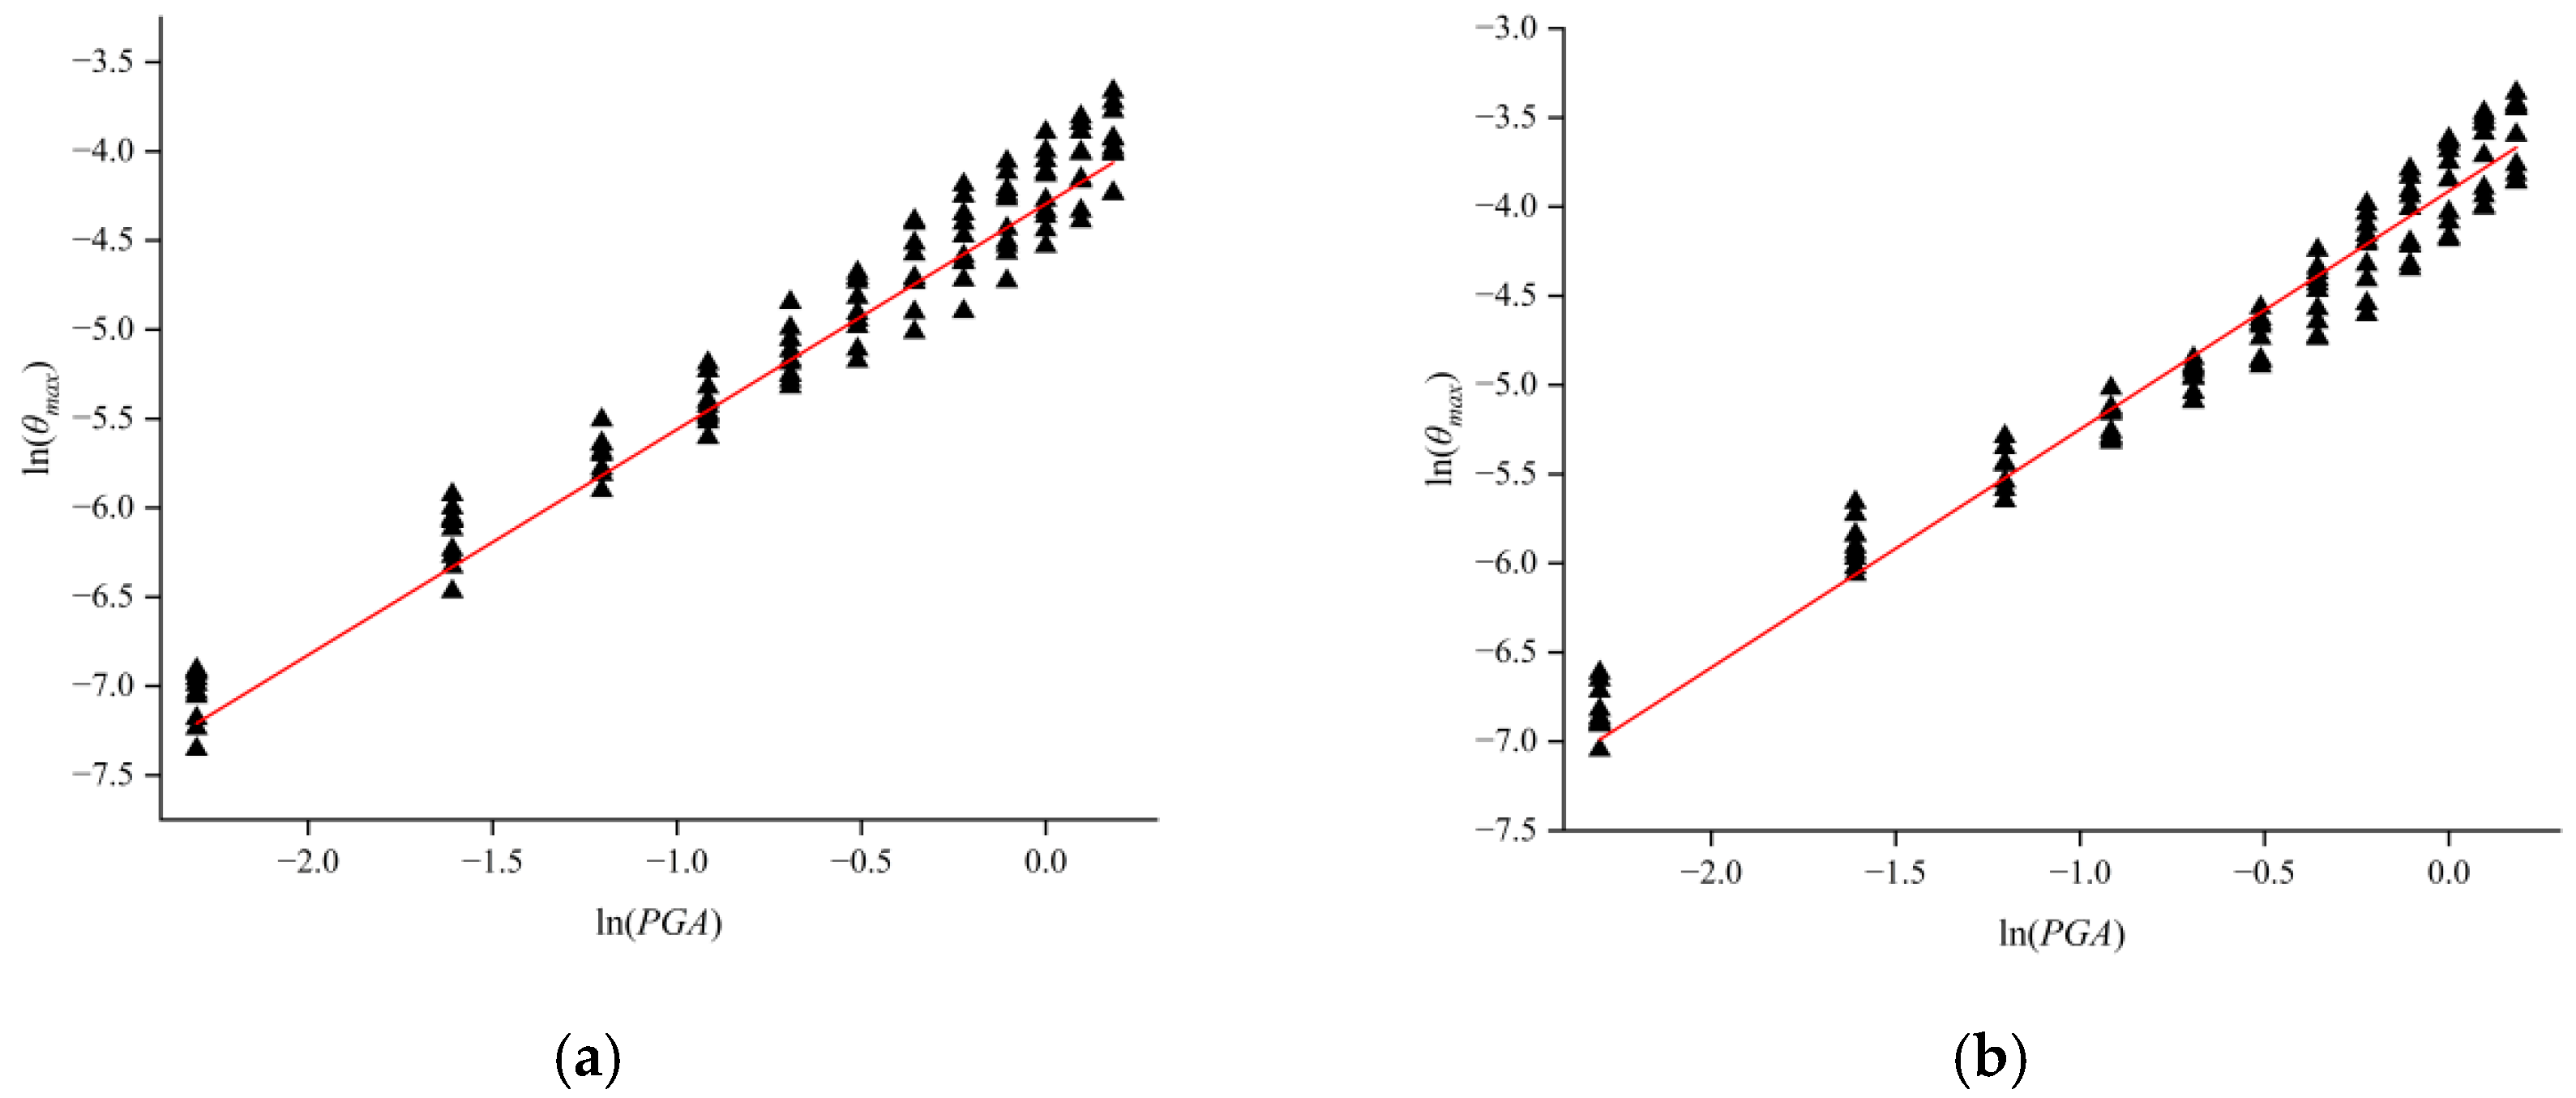
4.1. Probabilistic Seismic Demand Model

Based on the Chinese code [41] and FEMA [48], the four performance levels of the structure were defined as normal operation (NO), immediate occupancy (IO), life safety (LS), and collapse prevention (CP), and the limits of the structural performance indicators corresponding to each performance level are shown in Table 5.
To establish a seismic vulnerability model for structures, a probabilistic seismic demand analysis is required to determine the probability relationship between the seismic response of the structure and the seismic intensity. In general, the relationship between DM and IM [49] is as follows:
D M = a ( I M ) b
By taking the logarithm of Equation (1), a logarithmic linear relationship between DM and IM is obtained as follows:
In ( D M ) = I n ( a ) + b In ( I M )
Equation (2) is the seismic demand probability relation, and parameters a and b can be obtained by the linear regression of IDA data. The seismic responses of the structure under the influence of main and aftershock earthquakes are analyzed in Figure 10 and Figure 11. Under the same damage limit condition, the ground motion intensity required for the main earthquake is significantly higher than that of the main aftershock earthquake. The linear regression equations are obtained by logarithmic fitting of seismic response parameters, as shown in Equations (3)–(6).
The formula for an uncontrolled structure under the action of main shock is as follows:
ln(θmax) = 1.2657ln(PGA) – 3.6586
The formula for an uncontrolled structure under the action of aftershock is as follows:
ln(θmax) = 1.3139ln(PGA) – 3.4326
The formula for a BRB-supported structure under the action of main shock is as follows:
ln(θmax) = 1.2659ln(PGA) – 4.2935
The formula for a BRB-supported structure under the action of aftershock is as follows:
ln(θmax) = 1.3363ln(PGA) – 3.9116

4.2. Seismic Susceptibility Curve Analysis

The exceeding probability formula of the structure under seismic dynamic response is expressed in the form of standard normal distribution function as follows:
P f = Φ ( In D ^ In C ^ β c 2 + β d 2 )
where D ^ is the median of the seismic demand of the structure, which can be obtained from the seismic demand probability model; C ^ is the median of the seismic capacity of the structure, which is taken as the limit value of each limit state; and βc, βd are the logarithmic standard deviation of C ^ and D ^ , respectively. It is pointed out in the literature [50] that β c 2 + β d 2 can be obtained by statistics, and it is set to 0.5 when PGA is the variable.
The exceeding probabilities of the structure under various performance indexes and different PGA values were calculated according to Equation (7), and the vulnerability probability curves are plotted in Figure 12. As can be seen, under the same PGA, the exceeding probability of the four performance levels gradually decreased, which is consistent with the requirement of the maximum inter-story drift ratio. Given a certain limit state, the structural vulnerability curves under the main aftershock sequence are all above the main shock vulnerability curves. This showed that the potential damage caused to the structure by the main aftershock sequence is higher than that of the main shock alone. When the structure is in the normal operation stage, the vulnerability curves under the action of the two earthquake sequences are almost similar, and the vulnerability of the structure is less affected by the earthquake sequence. The seismic vulnerability curve is steeper than other stages, indicating that the structure exceeds the elastic inter-story drift angle more easily under earthquake action. At the stage of immediate occupation and life safety, the gap between the vulnerability curves gradually expands, indicating that the structure experiences a certain degree of plastic damage under the action of the main earthquake, while the main–aftershock series aggravates the plastic damage of the structure and makes the performance of the structure exhibit greater instability. At the stage of collapse prevention, the vulnerability curves gradually tend to flatten with the increasing PGA, and these curves also reflect that the structure has reached the elastoplastic limit state. These gentle curves also reflect that the CFST frame structure has a certain energy dissipation and ductility capacity and indicate that the structure has the ability to resist collapse.
Comparing Figure 12a,b, it can be observed that under the same seismic peak acceleration conditions, the structure with BRBs significantly reduces the risk of structural collapse compared with the uncontrolled frame structure, and demonstrates higher seismic resistance and more reliable structural performance. In addition, the main–aftershock vulnerability curves of the structure with BRBs show a larger interval, indicating that it has a good ability to absorb and disperse seismic energy. Under the action of seismic sequences, the structure with BRBs reduces the degree of plastic deformation of the members, and ensures the bearing capacity of the structure and reduces the risk of overall failure.

4.3. Analysis of Structural Vulnerability Matrix

From the susceptibility curves in Figure 12, the probability of the structure exceeding each limit state when subjected to frequent (0.07 g), design-based (0.2 g), and rare (0.4 g) earthquakes can be predicted, and the structural seismic susceptibility matrices are calculated, as shown in Table 6 and Table 7.
As can be seen from Table 6 and Table 7, under frequent earthquake intensity, the exceeding probabilities of the normal operating limit state of the uncontrolled structure and the structure with BRBs under the main earthquake are 0.6% and 0.1%, respectively, and the exceeding probabilities increase by 0.2% and 0.1% after increasing aftershocks, respectively. The probabilities of other limit states are not exceeded, and the structure meets the seismic requirement of “no damage under minor earthquake”. In the case of medium earthquake intensity, the exceeding probabilities of the immediate occupation limit state of the uncontrolled structure and the structure with BRBs under the main earthquake are 1.1% and 0.2%, respectively, and the exceeding probability increases by 0.4% and 0.3% after the addition of aftershocks, respectively. There is no exceeding probability of the life safety limit state of the structure. The structure is mainly damaged slightly, and meets the seismic requirement of “no unrepairable damage under moderate earthquake”. Under rare earthquake intensity, the exceeding probabilities of the life safety limit state of the uncontrolled structure and BRB structure under the main earthquake are 2.3% and 0.5%, and the exceeding probability increases by 1% and 0.5% after increasing the aftershock, respectively. The probability of exceeding preventing collapse cannot occur in the structure. The structure is mainly moderately damaged, and meets the seismic requirement of “no collapse under severe earthquake”. In conclusion, the probability of the structure reaching each limit state increases with the increase in the main earthquake intensity. The aftershock action can further aggravate the structural damage under the main shock, and the probability of the BRB damping structural system reaching the damage state is significantly lower than that of the uncontrolled structure. The correct use of BRB components can significantly reduce the structural damage degree under earthquake action, and improve the stability and safety of the structure.

5. Conclusions

The following conclusions are obtained from the analysis of seismic vulnerability of concrete-filled steel tube frame structures:
  • The IDA curve patterns of each group of seismic waves are basically consistent. When PGA > 0.3 g, the IDA curve appears nonlinear, and with the increase in PGA, the slope of the IDA curve increases gradually due to the stiffness degradation caused by structural damage under earthquake. For the same PGA, the structural displacement of BRBs is small, and the effect of the aftershock is larger than that of the main shock alone.
  • The seismic vulnerability analysis shows that the exceeding probabilities of the two structures under the action of the main–aftershock sequence are greater than that under the action of the main earthquake alone. When the structures are in the normal operation stage, their vulnerability is less affected by earthquake sequences. In the other three stages, the gap between the vulnerability curves of the main and main–aftershock earthquake sequences gradually widens, and the structure exhibits a certain degree of plastic damage under the action of the main earthquake.
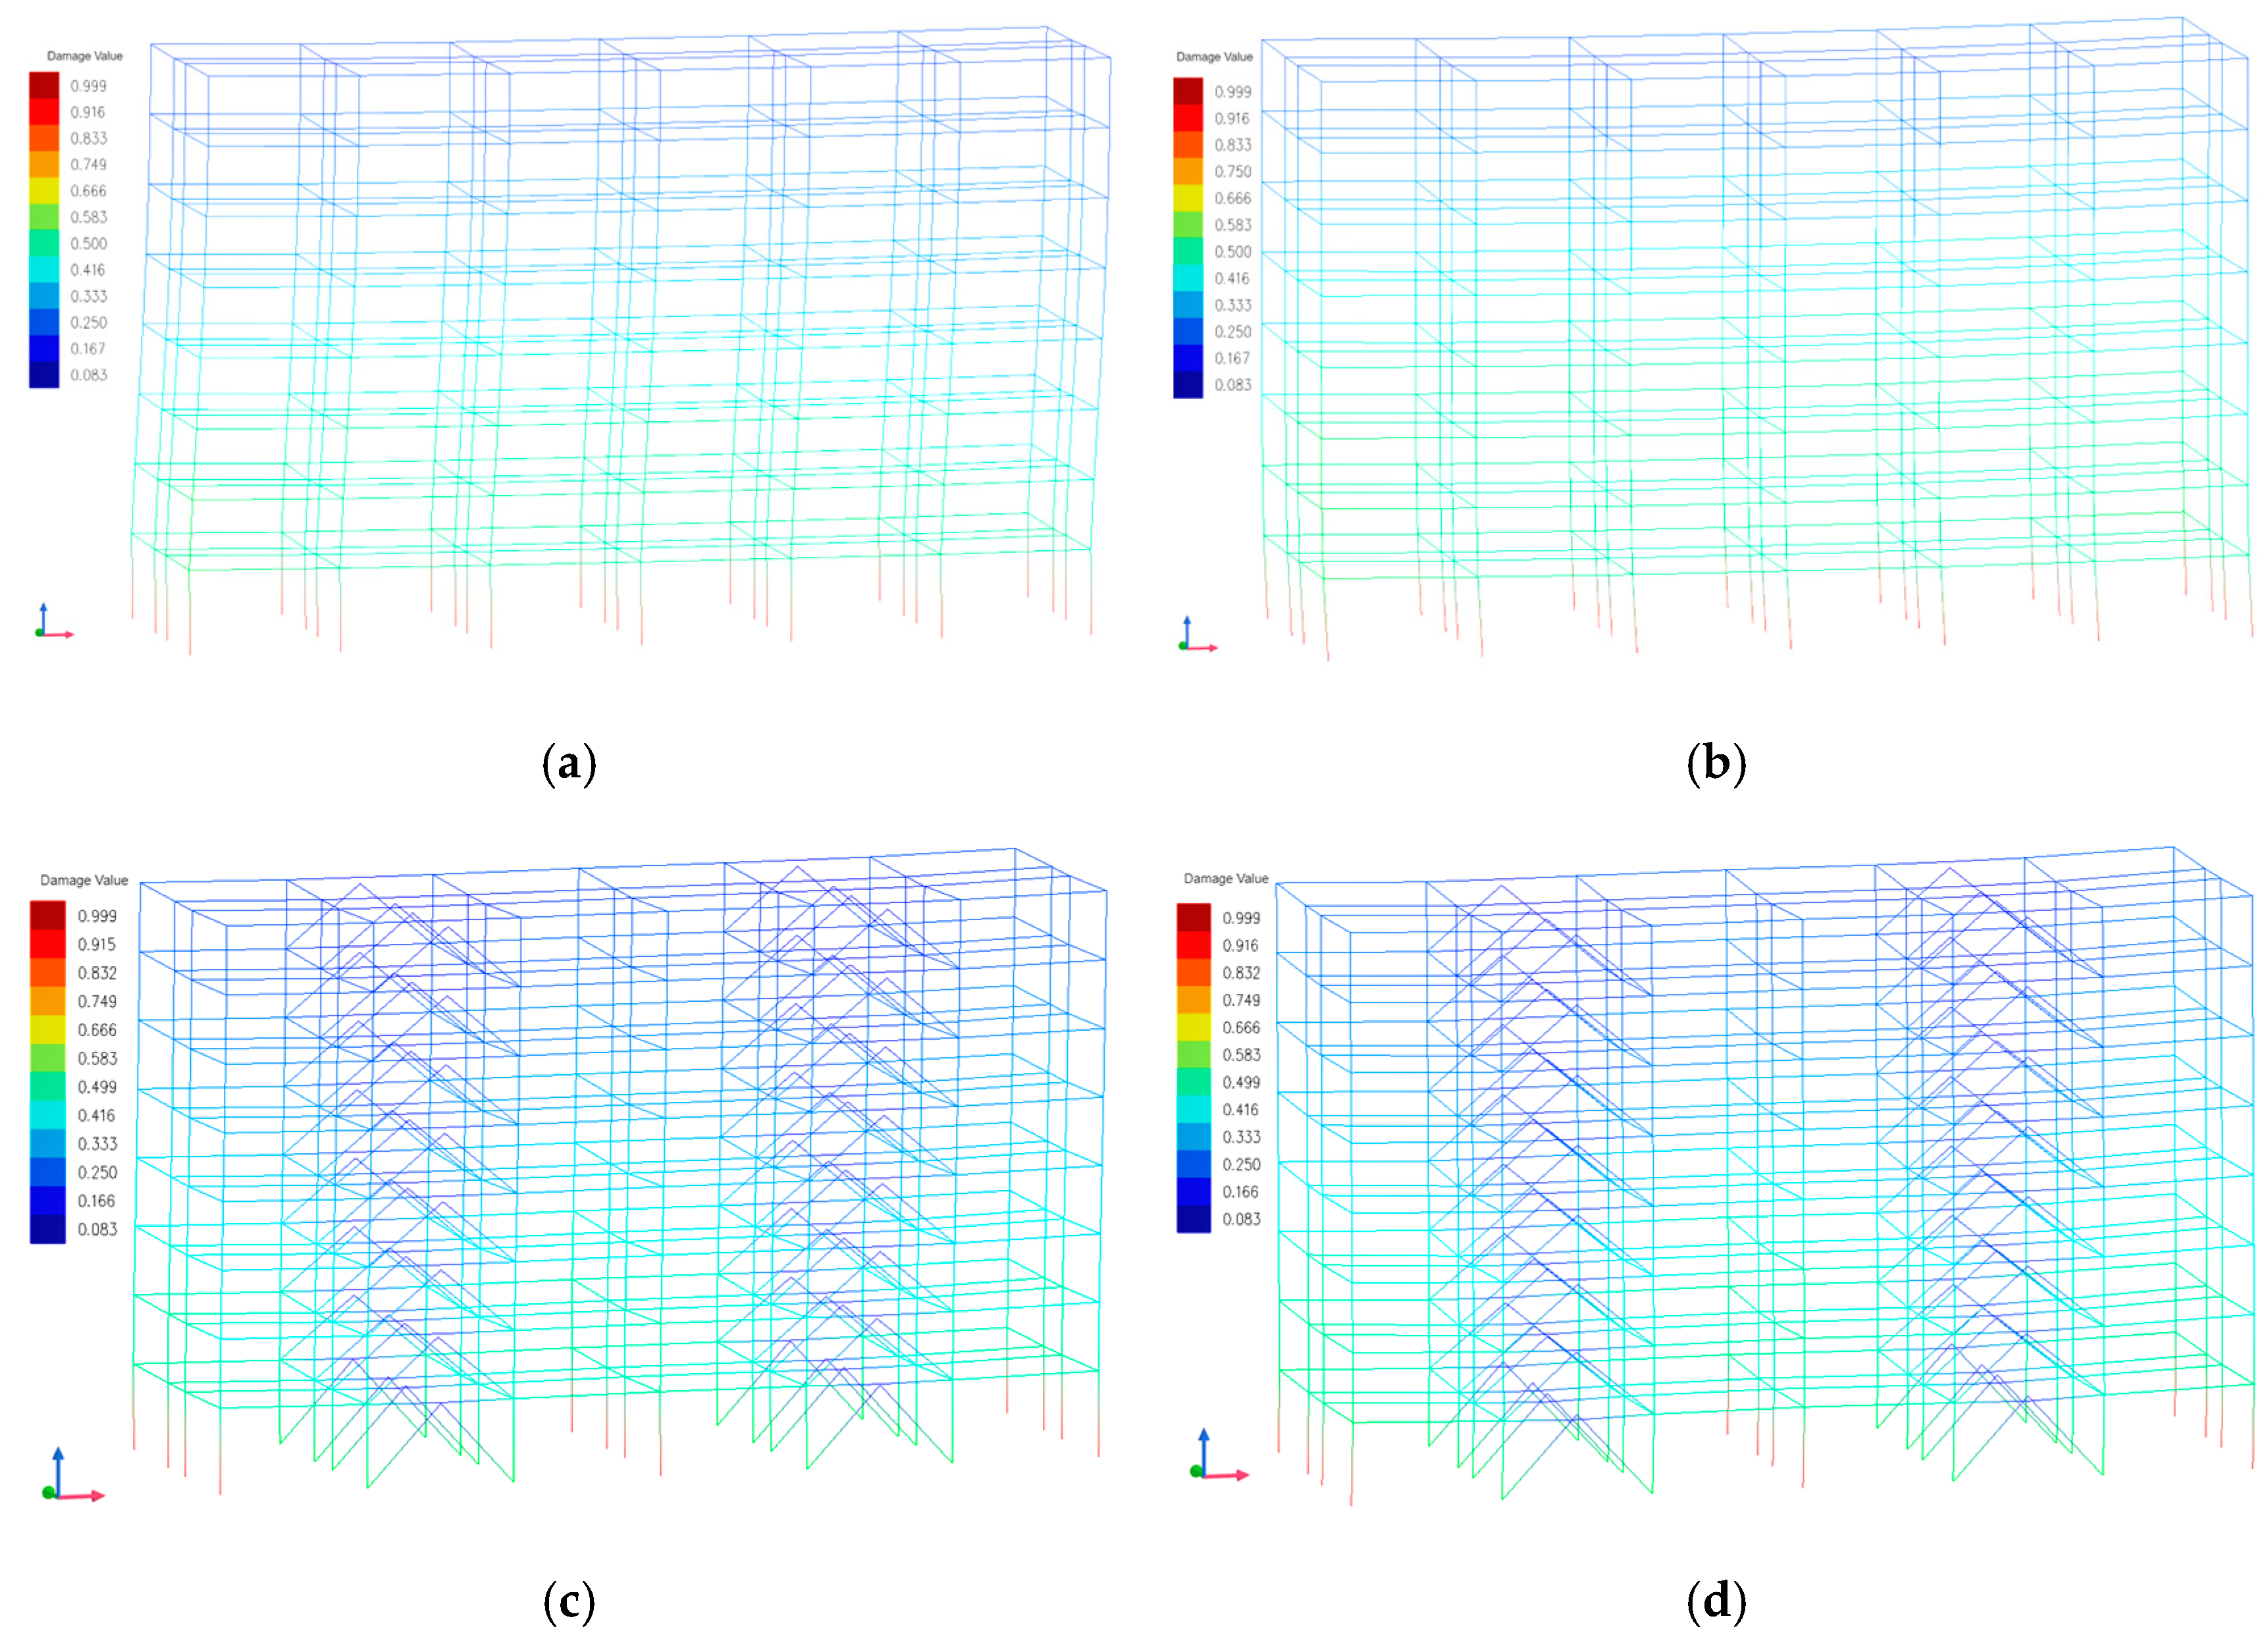
  • Using finite element simulation, the characteristics of column and beam damage distribution were identified. The damage of columns is concentrated in the middle and lower parts of the structure, and the damage to the middle columns is more serious than that of the side columns. With the addition of BRB members, seismic energy can be dissipated effectively. This can reduce the plastic deformation of components, especially columns connected to the support, and provide effective technical solutions for the seismic reinforcement of columns.
  • Under the same limit state, the occurrence of aftershocks will increase the probability of structural collapse risk, while adding anti-buckling restraint supports can significantly reduce the overtaking probability of the structure under different limit states. Aftershocks can increase the probability of structural failure by 4% to 8%, and the addition of anti-buckling restraint supports can reduce the probability of structural failure by approximately 25%. Therefore, the effect of aftershocks on the structure cannot be ignored, and the addition of anti-buckling restraint supports can upgrade the seismic resistance of the structure.

Author Contributions

C.Z. and Y.L.: Conceptualization, Methodology. J.L.: Software, Formal analysis, Visualization. Q.C.: Validation. Z.S.: Investigation, Resources. J.L.: Writing—original draft preparation. C.Z.: Writing—review and editing. All authors have read and agreed to the published version of the manuscript.

Funding

The research is funded by the Foundation of Henan Educational Committee (21A560017, 16B560005).

Data Availability Statement

The raw data supporting the conclusions of this article will be made available by the authors on request.

Conflicts of Interest

The authors declare no conflicts of interest.

References

  1. Lee, Y.T.; Turcotte, D.L.; Rundle, J.B.; Chen, C.C. After shock statistics of the 1999 Chi-Chi, Taiwan earthquake and the concept of omori times. Pure Appl. Geophys. 2013, 170, 221–228. [Google Scholar] [CrossRef]
  2. Wang, W.L.; Wu, J.P.; Fang, L.H.; Wang, C.Z. Relocation of the Yushu Ms7.1 earthquake and its aftershocks in 2010 from HypoDD. Sci. China Earth Sci. 2013, 56, 182–191. [Google Scholar] [CrossRef]
  3. Fang, D. Summary of Earthquake Activities in 2022. Earthq. Res. Sichuan 2023, 02, 1–11. [Google Scholar] [CrossRef]
  4. Ozturk, M.; Arslan, M.H.; Dogan, G.; Ecemis, A.S.; Arslan, H.D. School buildings performance in 7.7 Mw and 7.6 Mw catastrophic earthquakes in southeast of Turkey. J. Build. Eng. 2023, 79, 107810. [Google Scholar] [CrossRef]
  5. Binici, B.; Yakut, A.; Kadas, K.; Demirel, O.; Akpinar, U.; Canbolat, A.; Yurtseven, F.; Oztaskin, O.; Aktas, S.; Canbay, E. Performance of RC buildings after Kahramanmaraş Earthquakes: Lessons toward performance based design. Earthq. Eng. Eng. Vib. 2023, 22, 883–894. [Google Scholar] [CrossRef]
  6. Ozturk, M.; Arslan, M.H.; Korkmaz, H.H. Effect on RC buildings of 6 February 2023 Turkey earthquake doublets and new doctrines for seismic design. Eng. Fail. Anal. 2023, 153, 107521. [Google Scholar] [CrossRef]
  7. Li, Q.; Ellingwood, B.R. Performance evaluation and damage assessment of steel frame buildings under main shock-aftershock earthquake sequences. Earthq. Eng. Struct. Dyn. 2007, 36, 405–427. [Google Scholar] [CrossRef]
  8. Liu, J.; Huang, X.; He, T.; Wang, N.; Du, Y. Seismic risk analysis for inter-story isolation structure collapse under main aftershock sequence. J. Vib. Shock 2023, 42, 194–203+259. [Google Scholar] [CrossRef]
  9. Xu, J.; Chen, J.; Ding, G. Fragility analysis and life cycle cost assessment of RC frame under mainshock-aftershock seismic sequences through IDA. Earthq. Eng. Eng. Dyn. 2015, 35, 206–212. [Google Scholar] [CrossRef]
  10. Banayan-Kermani, A.; Bargi, K. Seismic collapse assessment of intermediate RC moment frames subjected to mainshock-aftershock sequences. Results Eng. 2023, 20, 101629. [Google Scholar] [CrossRef]
  11. Giovanni, R.; Marco, F.; Ljuba, S.; Laudio, A.C. On the behaviour of steel CBF for industrial buildings subjected to seismic sequences. Structures 2020, 28, 2175–2187. [Google Scholar] [CrossRef]
  12. Burton, H.V.; Sreekumar, S.; Sharma, M.; Han, S. Estimating aftershock collapse vulnerability using mainshock intensity, structural response and physical damage indicators. Struct. Saf. 2017, 68, 85–96. [Google Scholar] [CrossRef]
  13. Raghunandan, M.; Liel, A.B.; Luco, N. Aftershock collapse vulnerability assessment of reinforced concrete frame structures. Earthq. Eng. Struct. Dyn. 2015, 44, 419–439. [Google Scholar] [CrossRef]
  14. Hassan, M.; Sipcic, N.; Vasdravellis, G. Seismic performance evaluation of high-post-yield stiffness concentrically braced steel frames under mainshock-consistent-aftershock sequences. Earthq. Eng. Struct. Dyn. 2023, 52, 2222–2250. [Google Scholar] [CrossRef]
  15. Zhang, Z.; Jiang, Y. Failure Probability and Economic Loss Assessment of a High-Rise Frame Structure under Synthetic Multi-Dimensional Long-Period Ground Motions. Buildings 2024, 14, 252. [Google Scholar] [CrossRef]
  16. Zhou, Z.; Yu, X.; Lu, D. Study on the incremental damage ratios of structures due to mainshock-aftershock Earthquake sequences. Eng. Mech. 2021, 38, 147–159. [Google Scholar] [CrossRef]
  17. Zhou, Z.; Yu, X.; Lu, D. Fragility analysis and safety evaluation of reinforced concrete frame structures subjected to mainshock-aftershock earthquake sequences. Eng. Mech. 2018, 35, 134–145. [Google Scholar] [CrossRef]
  18. Hu, J.; Wen, W.P.; Zhai, C.H.; Pei, S.S.; Ji, D.F. Seismic resilience assessment of buildings considering the effects of mainshock and multiple aftershocks. J. Build. Eng. 2023, 68, 106110. [Google Scholar] [CrossRef]
  19. Wen, W.P.; Zhai, C.H.; Ji, D.F.; Li, S.; Xie, L.L. Framework for the vulnerability assessment of structure under mainshock-aftershock sequences. Soil Dyn. Earthq. Eng. 2017, 101, 41–52. [Google Scholar] [CrossRef]
  20. Zhou, Q.; Xia, Y.; Zhao, W.; Guo, Q. Vulnerability analysis of masonry structure considering sequence of mainshock-aftershock. World Earthq. Eng. 2023, 39, 52–61. [Google Scholar] [CrossRef]
  21. Zhang, Y.; Wang, Z.; Jiang, L.; Skalomenos, K.; Zhang, D. Seismic fragility analysis of masonry structures considering the effect of mainshock-aftershock sequences. Eng. Struct. 2023, 275, 115287. [Google Scholar] [CrossRef]
  22. Van de Lindt, J.W. Experimental investigation of the effect of multiple earthquakes on wood-frame structural integrity. Pract. Period. Struct. Des. Constr. 2008, 13, 111–117. [Google Scholar] [CrossRef]
  23. Di Trapani, F.; Malavisi, M. Seismic fragility assessment of infilled frames subject to mainshock/aftershock sequences using a double incremental dynamic analysis approach. Bull. Earthq. Eng. 2019, 17, 211–235. [Google Scholar] [CrossRef]
  24. Shunsuke, O.; Sozen, M.A. Behavior of Multistory Reinforced Concrete Frames during Earthquakes; Structural Research Series No. 392; University of Illinois Urban: Champaign, IL, USA, 1972. [Google Scholar]
  25. Benavent-Climent, A. A seismic index method for vulnerability assessment of existing frames: Application to RC structures with wide beams in Spain. Bull. Earthq. Eng. 2011, 9, 491–517. [Google Scholar] [CrossRef]
  26. Benavent-Climent, A.; Escobedo, A.; Donaire-Avila, J.; Oliver-Saiz, E.; Ramírez-Márquez, A.L. Assessment of expected damage on buildings subjected to Lorca earthquake through an energy-based seismic index method and nonlinear dynamic response analyses. Bull. Earthq. Eng. 2014, 12, 2049–2073. [Google Scholar] [CrossRef]
  27. Chen, T.; Ma, G. Post-earthquake performance and damage evaluation of RC frames under mainshock-aftershock sequence based on energy concept. Earthq. Eng. Eng. Dyn. 2023, 43, 161–170. [Google Scholar] [CrossRef]
  28. Kalateh-Ahani, M.; Amiri, S. A Park-Ang damage index-based framework for post-mainshock structural safety assessment. Structures 2021, 33, 820–829. [Google Scholar] [CrossRef]
  29. Zhang, P.; Kang, Z.; Ou, J. Damage and seismic performance analysis of RC frame structures under mainshock-aftershock earthquake sequences. Earthq. Eng. Eng. Dyn. 2014, 34, 1–8. [Google Scholar] [CrossRef]
  30. Dizaj, E.A.; Salami, M.R.; Kashani, M.M. Seismic Vulnerability Assessment of Ageing Reinforced Concrete Structures under Real Mainshock-Aftershock Ground Motions. Struct. Infrastruct. Eng. 2021, 18, 1674–1690. [Google Scholar] [CrossRef]
  31. Song, P.Y.; Wang, C.; Sun, Q.Q. Mainshock-aftershock fragility surfaces analysis of reinforced concrete frame structures using a double incremental dynamic analysis approach. Structures 2023, 56, 104868. [Google Scholar] [CrossRef]
  32. Zhong, Z.L.; Feng, L.Q.; Shen, J.X.; Du, X.L. Seismic fragility analysis of subway station structure subjected to sequence-type ground motions. Tunn. Undergr. Space Technol. 2024, 144, 105570. [Google Scholar] [CrossRef]
  33. Lyu, J.; Yao, S.; Zhao, H.; Zhou, T.; Xi, P. Research progress on application of new filling materials in concrete-filled steel tube structures. J. Chang’an. Univ. 2023, 43, 54–68. [Google Scholar] [CrossRef]
  34. Zhang, S.; Li, Z.; Ma, Y.; Guo, S. Research on seismic vulnerability of concrete-filled rectangular tubular frame-SPSW core tube structure based on IDA method. World Earthq. Eng. 2021, 1, 48–56. [Google Scholar] [CrossRef]
  35. Yang, F.; Liu, D.; Lei, M.; Zheng, Y.; Zhao, T.; Gao, L. Seismic fragility analysis of the inter-story isolated structure for the influence of main-aftershock sequences. Adv. Mech. Eng. 2023, 15, 1–14. [Google Scholar] [CrossRef]
  36. Mazzon, L.; Frappa, G.; Pauletta, M. Effectiveness of Tuned Mass Damper in Reducing Damage Caused by Strong Earthquake in a Medium-Rise Building. Appl. Sci. 2023, 13, 6815. [Google Scholar] [CrossRef]
  37. Frappa, G.; Pauletta, M. Seismic retrofitting of a reinforced concrete building with strongly different stiffness in the main directions. In Proceedings of the 14th Fib International PhD Symposium in Civil Engineering, Rome, Italy, 5–7 September 2022; pp. 5–7. [Google Scholar]
  38. Wang, J.; Li, B.; Wang, Y.; Li, G. Probabilistic Seismic Fragility Evaluation of CFST Frames with Buckling-Restrained Braces. J. Tianjin Univ. 2023, 56, 311–322. [Google Scholar] [CrossRef]
  39. Zhang, H.; Li, C.; Jiang, S.M.; Liu, P.F.; Gao, G.M. Fragility Analysis of Concrete-Filled Steel Tubular Frame Structures with BRBs under Multiple Earthquakes Considering Strain Rate Effects. Appl. Sci. 2020, 10, 165. [Google Scholar] [CrossRef]
  40. Shan, W.; Zhou, X.; Lin, X.; Pan, G. Collapse risk-targeted seismic design of concrete-filled steel tube frame-RC core tube structures. Structures 2023, 55, 1470–1480. [Google Scholar] [CrossRef]
  41. GB 50011-2010; Code for Seismic Design of Buildings. Ministry of Housing and Urban-Rural Development of the People’s Republic of China: Beijing, China, 2016.
  42. Ren, C.C.; Xu, Z.G.; Xiao, C.Z.; Sun, J.C.; Jin, L.F.; Gao, J. Application of unbonded brace in super high-rise structure with cantilever truss. Build. Struct. 2013, 43, 54–59. [Google Scholar] [CrossRef]
  43. Zhou, X.L.; Lei, J.R. Contrastive analysis of BRB’s mechanical models. J. Sichuan Univ. Sci. Eng. 2015, 28, 21–26. [Google Scholar] [CrossRef]
  44. GB/T 38591-2020; Standard for Seismic Resilience Assessment of Buildings. Ministry of Housing and Urban-Rural Development of the People’s Republic of China: Beijing, China, 2020.
  45. Goda, K.; Taylor, C.A. Effects of aftershocks on peak ductility demand due to strong ground motion records from shallow crustal earthquakes. Earthq. Eng. Struct. Dyn. 2012, 41, 2311–2330. [Google Scholar] [CrossRef]
  46. Park, Y.J.; Ang, A.H.S. Mechanistic seismic damage model for reinforced concrete. J. Struct. Eng. 1985, 111, 722–739. [Google Scholar] [CrossRef]
  47. T/CECS 392-2021; Standard for Anti-Collapse Design of Building Structures. Tsinghua University, China Academy of Building Research: Beijing, China, 2021.
  48. FEMA P1050; NEHRP Recommended Provisions for Seismic Regulations for New Buildings and Other Structures. Federal Emergency Management Agency: Washington, DC, USA, 2015.
  49. Cornell, C.A.; Jalayer, F.; Hamburger, R.O.; Foutch, D.A. The probabilistic basis for the 2000 SAC Federal Emergency Management Agency steel moment frame guidelines. J. Struct. Eng. 2002, 128, 526–533. [Google Scholar] [CrossRef]
  50. Liu, P.; Wang, C.; Zhang, J. Fragility analysis of high strength reinforced concrete frame structures subjected to mainshockaftershock earthquake sequences. World. Earthq. Eng. 2022, 38, 20–27. [Google Scholar] [CrossRef]
Figure 1. Layout plan.
Buildings 14 00869 g001
Figure 2. Elevation plan: (a) concrete-filled steel tube frame, (b) concrete-filled steel tube frame with BRBs.
Buildings 14 00869 g002
Figure 3. Acceleration response spectrum of seismic recordings.
Buildings 14 00869 g003
Figure 4. Main–aftershock sequences.
Buildings 14 00869 g004
Figure 5. Structural damage values: (a) main seismic damage values of the CFST frame, (b) aftershock damage values of the CFST frame, (c) main seismic damage value of the frame with BRBs, (d) aftershock damage value of the frame with BRBs.
Buildings 14 00869 g005
Figure 6. Allocation ratio of each energy term under earthquake action: (a) seismic energy consumption of CFST frame; (b) seismic energy consumption of CFST frame with BRBs.
Buildings 14 00869 g006
Figure 7. Structural energy–time curves of seismic wave RGB3: (a) CFST frame, (b) CFST frame with BRBs.
Buildings 14 00869 g007
Figure 8. IDA curves of concrete-filled steel tube frame: (a) main shock IDA curves; (b) aftershock IDA curves.
Buildings 14 00869 g008
Figure 9. IDA curves of concrete-filled steel tube frame with BRBs: (a) main shock IDA curves; (b) aftershock IDA curves.
Buildings 14 00869 g009
Figure 10. Data fitting of concrete-filled steel tube frame: (a) main shock; (b) aftershock.
Buildings 14 00869 g010
Figure 11. Data fitting of concrete-filled steel tube frame with BRBs: (a) main shock; (b) aftershock.
Buildings 14 00869 g011
Figure 12. Seismic vulnerability curves of the structural: (a) CFST frame; (b) CFST frame with BRBs.
Buildings 14 00869 g012
Table 1. Parameters of beams and column.
Component NamesSection Size/mmMaterial Grade
steel tube columnΦ600 × 12Q345
longitudinal beamHM550 × 300 × 11 × 18Q345
transverse beamHM594 × 302 × 14 × 23Q345
Table 2. Parameters of BRBs.
Story NumberYield Capacity/kNEffective Cross-Sectional Area/mm2Elastic Rigidity (kN/mm)
1–41692.814906.7238.22
5–81151.163336.7162.13
Table 3. Seismic design parameters.
Seismic ParametersValue
site categoryClass II
seismic precautionary categoryClass C
seismic groupingsecond group
seismic precautionary intensity8-degree
design basic acceleration of ground motion0.2 g
design characteristic period of ground motion0.4 s
Table 4. Seismic wave information.
Serial NumberSeismic Wave NameStation InformationParticular YearEarthquake MagnitudePGA/gTime/s
Main ShockAftershock
1TRB1Boshro-oyeh19956.90.280.24100
2TRB2Sedeh19956.50.150.07100
3TRB3Tabas19997.50.850.690
4TRB4Amboy19907.50.720.5100
5TRB5Baker19796.60.420.33100
6TRB6Barstow19796.50.420.28100
7RGB1Lucerne19926.70.60.51100
8RGB2Santa19926.60.220.16100
9RGB3Tarzana19967.10.620.53100
10RGB4Crescenta19987.61.080.91100
Table 5. Limit value of inter-story drift ratio.
Limit StatesNOIOLSCP
[θ]1/5501/2501/1201/50
Table 6. Seismic vulnerability matrix for concrete-filled steel tube frame (%).
Earthquake LevelMain ShockMain–Aftershock
NOIOLSCPNOIOLSCP
frequent0.60000.8000
design-based23.61.10026.41.500
rare85.029.52.3088.3353.30
Table 7. Seismic vulnerability matrix for concrete-filled steel tube frame with BRBs (%).
Earthquake LevelMain ShockMain–Aftershock
NOIOLSCPNOIOLSCP
frequent0.10000.2000
design-based1.00.2001.60.500
rare38.48.50.5045.711.31.00
Disclaimer/Publisher’s Note: The statements, opinions and data contained in all publications are solely those of the individual author(s) and contributor(s) and not of MDPI and/or the editor(s). MDPI and/or the editor(s) disclaim responsibility for any injury to people or property resulting from any ideas, methods, instructions or products referred to in the content.

