Article

Biomethane Microturbines as a Storage-Free Dispatchable Solution for Resilient Critical Buildings

by
Enrique Rosales-Asensio
1,
Iker de Loma-Osorio
2,
Emin Açıkkalp
3 and
David Borge-Diez
2,*
1
Department of Electrical Engineering, University of Las Palmas de Gran Canaria, Campus de Tafira S/n, 35017 Las Palmas de Gran Canaria, Spain
2
Department of Electrical, Systems and Automation Engineering, University of León, Campus de Vegazana S/n, 24071 León, Spain
3
Department of Mechanical Engineering, Engineering Faculty, Eskisehir Technical University, 26470 Eskisehir, Turkey
*
Author to whom correspondence should be addressed.
Buildings 2023, 13(10), 2516; https://doi.org/10.3390/buildings13102516
Submission received: 11 September 2023 / Revised: 28 September 2023 / Accepted: 30 September 2023 / Published: 4 October 2023

Abstract

:
Climate-change-related events are increasing the costs of power outages, including losses of product, revenue, and productivity. Given the increase in meteorological disasters in recent years related to climate change effects, the number of costly blackouts, from an economic perspective, has increased in a directly proportional manner. As a result, there is increasing interest in the use of alternators to supply dependable, instantaneous, and uninterruptible electricity. Traditional research has focused on the installation of diesel backup systems to ensure power requirements without deeply considering the resilience capabilities of systems, which is the ability of a system to recover or survive adversity, such as a power outage. This research presents a novel approach focusing on the resiliency impact of backup systems’ storage-free dispatchable solutions on buildings and compares the advantages and disadvantages of biomethane microturbines, natural gas engines, and diesel engines backup systems, discussing the revenue resulting from the resilience provided by emergency generators. The results show that, for several diesel fuel and natural gas safety assumptions, natural gas alternators have a lower probability of failure at the time of a blackout than diesel generators, and therefore, resilience increases.

1. Introduction

The modern economy and supply chain depend heavily on electricity in their day-to-day operation [1,2,3], and this dependency is especially critical in cities. Climate-change-related events are increasing the risk of power outages that can cause significant problems in both households and commercial buildings [4], which is of significant importance in the commercial sector and critically important in food distribution [5]. In this regard, power outages cause lost sales in shops [6,7,8], damage to equipment [4], a loss of data on computers [9], and the deterioration of products [10,11,12,13]. In addition to interrupting daily work [14], critical care facilities such as hospitals may have difficulty keeping necessary emergency power [15,16]. The electrical grid is vulnerable to extreme weather conditions [17], and these events are related to climate change consequences. As shown in Figure 1, the aging of the power grid, which must meet growing demand—as well as an increase in the number of storms and extreme environmental situations that can damage the power system—has caused an increase in the number of blackouts in the US. Mechanical failures, part defects, and transformer and power cable failures are common causes of power system problems [18]. Natural hazards such as earthquakes, storms, floods, and heat waves are among the main causes of power outages [19].
Three out of the five costliest hurricanes in the history of the US took place in 2017 [21]. Florence [22] and Hurricane Michael [23] also caused major power outages in 2018. In October 2008, a power company in Northern California intentionally cut off the electricity supply to nearly 60,000 users to reduce the risk of fire from power lines during extreme winds [24]. In practice, the cost of blackouts associated with a particular level of reliability is difficult to estimate because such costs can consist of a combination of direct and indirect components [25]. Although these costs may not be correct, they are clearly significant [26]. The 2003 blackout between the United States and Canada affected more than 50 million people and had an estimated cost of more than USD 6 billion [27], of which USD 1 billion corresponded to New York City alone [28]. The annual costs of severe weather-related blackouts fluctuate significantly and are higher in storm years, such as with Hurricane Ike in 2008 (a year in which the estimated cost was between USD 40 billion and USD 75 billion), and Superstorm Sandy in 2012 (a year in which the cost of blackouts ranged from USD 27 billion to USD 75 billion) [29]. Electronic equipment is now being used extensively in retail outlets, so better power quality standards are needed [30]. With respect to backup systems, the decision to invest in such systems and the total cost of the outage increases as the duration of the outage increases [31]. In this regard, the growing number of users who have installed their own backup systems is a result of the excessive cost of blackouts [32]. Many businesses without a backup system are considering their purchase, and those who already are in possession of a backup electricity supply are examining how to add more resilience against blackouts. Understanding the costs and potential benefits, in addition to the resilience linked to the emergency power systems, is critical to plan.
In the scientific literature, it is possible to find many research papers exploring how to improve energy resiliency and backup generator applications; however, this literature lacks a deep analysis of storage-free dispatchable solutions in terms of building resilience. Among the most notable studies may be those carried out by Diboma et al., who estimated power interruption costs to industries [33]; Abdisa, who examined how firms respond to power outages [34]; Szakonyi et al., who conducted an empirical examination of how the use of generators has changed in the industry [35]; Kim et al., who estimated the power outage costs of the industrial sector by not only considering production loss but also the customer’s inconvenience and various damages [36]; Wolf et al., who quantified the macroeconomic costs resulting from power outages [37]; Amoah et al., who provided new estimates of households’ willingness to pay to reduce electricity outages and contributed to debate the validity of contingent valuation results for energy reliability [38]; and the investigation conducted by Oseni, who examined the extent to which an improvement in publicly supplied electricity can reduce backup generation [39].
Earlier research lacks a comparison of prime mover types for storage-free dispatchable solutions for enhancing reliability and resiliency in commercial buildings and applications where these events can result in extensive economic and social damage. This research presents a novel approach in order to study the best design of storage-free dispatchable solutions in commercial buildings to ensure maximum flexibility and resilience in cases of power disruption events. A novel deep survey of gray literature and updated literature related to the topic is addressed in the paper, and it was possible to find that—despite the diversity of approaches—this paper contributes to the pool of existing knowledge by providing a novel economic and resilience analysis of backup generators for commercial buildings.
The paper is structured as follows: this first section briefly discusses outage economics issues; in the next section, a theoretical background on economic and resiliency issues about backup systems will be explored; in the second section, the calculation methodology used to conduct the research will be shown; in the third section all the case studies will be presented and discussed; and, subsequently, in the last section, conclusions will be presented. Our novel conclusions prove that the differences in failure probability between diesel and natural gas generators are quite small and depend on several factors. Regarding biomethane microturbines, they have the lowest probability of the three technologies assessed to fail at the time of a blackout and can also be combined with biomethane generation systems. The results show that, from an economic point of view, it can be concluded that the use of diesel engines as a backup system can be the best option.

Literature Review

In the present research, it will be assumed that the backup system will consist of a single generator that can meet all the peak loads demanded by the building in which it is installed. For the year 2006 and for the United States, Philips et al. [40] showed that the percentage of all installations with a backup generator using diesel fuel, natural gas, and propane was 85%, 10%, and 4%, respectively. From an economic point of view, being powered by tanker trucks (as is the case with backup generators that use diesel as fuel) is detrimental [41]. Natural gas is supplied through pipelines [42], which ideally ensure an interruptible fuel source [43]. Oil has the advantage over natural gas of being able to be stored on-site, which is not generally an option for natural gas [44]. Although extremely rare, interruptions in natural gas supply and/or transportation affect the risk profile of each power plant (or group of power plants) [45]. Generators using natural gas as a fuel must necessarily have access to pipelines [46,47]. On the other hand, diesel generators require constant refueling, which results in higher operating costs, negative environmental impacts, and more complex fuel planning [48].
Refueling problems are more severe during earthquakes or electromagnetic pulse attacks, which can affect multiple regions within a country [49]. In this case, because of the problems caused by major power outages, the private refueling process will be interrupted [49]. Unfortunately, many fuels, especially gasoline and diesel, have a limited storage time [50]. This is the reason why it is impractical to store massive quantities of gasoline or diesel to prepare for emergencies [50]. Under normal storage conditions, it is expected that fuel can remain in a usable condition for twelve months, after which, it is advisable to replace the deposit with “fresh” fuel if possible [51]. Because emergency diesel generators are normally found in densely populated areas, their increased use for electricity generation will also increase public exposure to their harmful emissions [52,53].
The main aim of an emergency power system is to grant electricity in case of a power failure [54]. That said, it is also possible to conduct an integration of energy into the grid, which might bring added benefits to backup system installations [54]. Allowing the sale of electricity generated by backup systems during peak demand and being able to take part in the “installed capacity market” could reduce the price of electricity and increase reliability for all users [55].

2. Proposed Methodology

This section describes the different methods used to analyze system resilience, and the proposed model is used to calculate the results shown in Section 4.

2.1. Backup System Reliability

NEI 99-02 [56] offers guidance on the data and calculations relating to the identification and definition of the three types of failure in emergency diesel generators [57]: (i) failure to start, (ii) failure to load and run, and (iii) failure to run [56]. Each of these types of failures has a reference reliability value [57].

2.1.1. Failure to Start

The failure to start (FTS) represents the failure of a generator to either manually or automatically (i) start on a bus under-voltage condition, (ii) reach the required rate of voltage and speed, (iii) close the output breaker, (iv) participate in a black start process, or in other words, sequence safety-related electrical loads into the respective safety-related bus [58]. Emergency generators normally run infrequently and for a limited period [59]. In this sense, the regulations of the United States Environmental Protection Agency limit the operation of emergency generators to a maximum of 100 h per year for testing and maintenance (while the electrical grid is available) [59] and to an unlimited period when there is a failure in the electrical grid [59]. A further analysis of the mode of operation of backup systems shows that a modest percentage of generation that can be given to this technology is indicative of a country’s development and the reliability of its electricity grid [60].
A crucial element to consider is the fact that emergency diesel generators are taken out of service for testing and maintenance [61]. Maintenance is conducted to repair any faults or to correct any degradation (corrective maintenance) and through planned maintenance to ensure that the emergency diesel generator runs reliably, i.e., to prevent equipment failure (preventive maintenance) [61]. In this sense, the unavailability of diesel generators due to testing and maintenance may be the dominant part of the overall unavailability of emergency diesel generators [61,62,63].
It should also be mentioned that data availability may enable the owners of backup generators to reschedule maintenance to ensure the availability of more generators [64]. In this sense, power producers usually schedule the maintenance of units during the low season, during periods of lower demand, when energy and capacity prices are lower on average [65]. There are a few elements that will influence unexpected unavailability. One of the most notable in emergency diesel generators is voltage control failures, which can be identified as starting failures given the inclusion of the requirement to achieve the required speed and voltage [57].

2.1.2. Failure to Run

Failure to start likelihood is normally calculated through a model that only depends on the time-independent stress induced by the starts [58,66]. In contrast, failure to run is calculated based on demand and rate probabilities on an hourly basis and is, therefore, time-dependent [67]. According to the failure to start probability defined by Fairfax et al. [68], the failure to start probabilities for standby demands and load demands are 0.67% and 0.15%, respectively. According to hourly failure rates from Fairfax et al. [68], failure to run probabilities for standby demands and load demand are 0.172% (508 h) and 0.086% (1160 h), respectively.

2.1.3. Failure of Fuel Supply

To supply a few hours’ reserve, the calculated fuel tank size will vary [69]. Annex A of National Fire Protection Association 110 suggests 48 to 96 h as a minimum fuel capacity for emergency generators [70]. It also offers suggestions for long-term fuel storage [70].
  • Diesel Fuel Supply
According to Philips et al., backup generators that use diesel as a fuel and that are placed at store retailer facilities can provide, on average, a power duration of 36 h [40]. Because the research presented here focuses on commercial facilities, a duration of 36 h was used as a baseline assumption. Diesel generators are strictly dependent on stored or transported fuel for operation, which creates significant vulnerability during major disasters [71,72]. In this sense, because the storage capacity of a tank depends on (i) the average fuel consumption, (ii) the security of the fuel supply, and (iii) economic factors [73], high-capacity fuel storage will reduce the risk of blackouts due to fuel supply failure [73].
  • Natural Gas Fuel Supply
Diesel fuel needs to be stored in copious quantities on-site to ensure a certain running time for the generators [74]. In contrast, natural gas and renewable natural gas (RNG) are transported through underground pipelines [75] and are susceptible to several incidents in the gas network [76]. The inherent reliability of natural gas pipelines has led to the acceptance of this technology by companies, which have progressively chosen more backup natural gas generators [77]. Because natural gas is supplied through underground pipelines rather than by diesel trucks, supplies are less likely to be compromised during major disasters that result in power outages [77]. A common cause of pipeline damage is the construction and excavation activities of contractors, construction companies, and homeowners—this damage can be avoided by checking where underground utilities are before digging [78]. In this respect, natural gas/RNG can be much more dependable than electricity supplies, with the added advantage that gas can be stored if needed [79].
  • Correlation between electrical and natural gas interruptions
Compared with aboveground storage, the underground storage of natural gas supplies significantly higher and cheaper volumes of necessary storage [80]. Moreover, if carefully constructed and checked, these facilities supply added levels of security compared with aboveground storage [80]. Consequently, natural gas is typically stored underground [81,82] in three types of facilities. These underground facilities are (i) depleted deposits in oil and/or natural gas fields, (ii) aquifers, and (iii) salt cave formations [83,84]. Independent of the electricity grid [85,86], natural gas infrastructure is also more resilient [85] and performs better in terms of reliability and availability [87]. That said, irrespective of the theoretical independence between gas distribution networks and electricity networks, in practice, there are interdependencies between these networks that have a final impact on the security of the supply [88]. Although less vulnerable than aboveground infrastructure [89], extreme conditions can also affect underground infrastructure [89]. This was the case in December 2017 in California when a few severe landslides carrying large rocks formed openings in the ground and exposed underground pipelines [89]. Similarly, a loss of electricity due to damage to the electrical infrastructure can create a “demand-side destruction” in areas where natural gas supplies fuel for power plants [89]. This was the case in Florida, where aggregate demand for natural gas fell considerably between the 7th and 11th of September 2017, largely because of a loss of demand for electricity [89].
A greater correlation between systems implies a greater probability of coincidental interruptions [90]. For the investigation presented here, the probability of a coincidental interruption in natural gas and electricity systems was differentiated according to the criteria of whether (i) the interruption is of short duration or whether (ii) a significant long-term failure exists. A significant power failure is usually defined as any long-term incident that requires the involvement of local and/or state emergency management organizations to coordinate the provision of food, water, heating, and shelter [91]. In this regard, because extreme conditions are needed for underground gas infrastructure to be affected [89] and because these extreme conditions will typically lead to long-term outages, it is expected that these outages will have higher system correlations than short-term outages.
With the gray literature existing at the time of the writing of the research presented here, it was only possible to obtain an incomplete picture of the frequency of failures that occur interdependently between natural gas and electricity infrastructures [92]. Recent experience with the interdependence between natural gas and electricity networks is a call to action to improve the availability of data on the operational characteristics of both [92]. To illustrate the situation, the North American Electric Reliability Corporation recognized the absence of the systematic collection of statistical data on natural gas system outages [93]. That said, several reports have been selected to present relevant information about the possibility of coincidental power outages (see Table 1).
Analyzing the percentage of coincidental interruptions in Table 1, it can be seen how this percentage is much higher for the California wildfires of 2017. The explanation for this circumstance could be that fires in general can cause interruptions to natural gas networks in infrastructure found aboveground [89]. In the case of Hurricane Sandy in New York, the percentage, 3.06%, is also relatively high. The explanation for this result could be the fact that New York’s natural gas infrastructure has been in use for almost two centuries and that aging pipelines are more prone to leakage and vulnerable to storm damage and ground movement [101]. Therefore, these results are considered outliers.
As a result of these considerations, the base probability of coincidental gas and electricity outages for long-duration events was estimated to be 1.5%, which is approximately halfway between the percentage of coincidental outages in Table 1. Because fuel supply agreements typically show that all deliveries will be made within 24 to 36 h after the order has been placed [103], this upper limit of 36 h has been chosen to define when an outage should be considered “long-term”. It should be considered that, as shown in Table 1, most of the time, only electricity and not natural gas outages occurred. Since no data are available on correlations for short-term outages, it was assumed that the probability of simultaneous electricity and natural gas interruption ranges from zero to the upper limit, which represents long-term blackouts. Table 2 shows a short, clear description of system failure rate estimation.

2.2. Costs and Benefits

Standby generators are installed for reliability purposes to keep the service of critical processes in case of the loss of the electrical power source [104]. However, costs may be a major factor in choosing a diesel generator or using natural gas or RNG [105,106]. The total cost of generating power from a backup system includes capital costs, non-fuel operating and maintenance costs, fuel costs, and decommissioning [107,108,109]. The benefits of backup generators include improved power reliability [110] and the ability to supply auxiliary services to the electricity grid [111]. This section supplies a cost summary of the backup generator and its associated economic benefits.
The dimensioning of backup systems is mainly based on the verification of technical reliability and the calculation of the lifecycle costs of the system [112,113]. The general equation to be solved is (Equation (1)):
L i f e   c y c l e   c o s t s = I n s t a l l a t i o n   c o s t s + D e c o m m i s s i o n i n g   c o s t s + M a i n t e n a n c e   c o s t s + F u e l   c o s t s B e n e f i t s
The prices of fuel, supply, maintenance [114,115], and the electrical load to be satisfied [115] are key factors in the evaluation of lifecycle costs and system reliability. Regulators and planners of electrical power systems often use the term “lost load value” to refer to the lost electrical load [116]. This term stands for the amount that the average consumer would pay to avoid a blackout [116,117]. It should be noted that the information about what individuals and society are willing and able to pay to avoid the consequences of blackouts is limited [118]. For the investigation presented here, the term “lost load value” will be considered within the potential revenues and included in the avoided outage costs.
In the past, the use of gaseous fuels in industrial applications for backup power purposes was avoided [119,120]. This decision was based on the following criteria: cost-effectiveness, power density, and perceived reliability [120]. Nevertheless, recent technological innovations such as air/fuel mixture optimization have changed these criteria [120]. Considering nominal power ranging between 350 kW to 500 kW, a cost of USD 264/kW was assumed for diesel generators, USD 792/kW was assumed for natural gas generators [121], and USD 1185/kW was assumed for biomethane microturbines [119].
To prove their ability to start and accept the required loads, standby systems should be evaluated periodically according to a documented schedule [122,123]. In the investigation presented here, an operation and maintenance cost of USD 20/kW/year was assumed for diesel generators, USD 30/kW/year was assumed for natural gas generators, and USD 8/kW/year was assumed for biomethane microturbines [119,124]. While some maintenance cost models differentiate between fixed O&M (operation and maintenance) costs (USD /kW) and variable O&M costs (USD/kWh) [119], other models compute O&M costs on a global basis [124]. In the investigation presented here, only fixed maintenance costs will be considered.
Although biomethane microturbines and natural gas generators need higher first costs, operating costs are typically much lower than those of diesel generators [125]. In this respect, both biomethane microturbines and natural gas can be expected to offer much lower incremental fuel costs than diesel [126,127].
Apart from avoiding the costs associated with electricity outages, backup generators can generate economic benefits for the owner if they also meet the operation requirements. Outage costs vary depending on (i) the time of day, (ii) the season, (iii) the duration and size of the outage, (iv) who suffers the loss of power, and (v) whether the outage is expected or unexpected [128,129]. Ancillary services can generate revenue for the owner of standby generators if they meet the performance requirements [130]. In this sense, these benefits can be provided, among other mechanisms, through energy sales in the hourly market [130]. As a result, the actual net revenues of a backup system will be the revenues obtained from the sale of energy and ancillary services (like commercial generators) minus operating expenses [131], as stated in the next equation (Equation (2)):
N e t   r e v e n u e = E n e r g y   s a l e   r e v e n u e + A n c i l l a r y   s e r v i c e   r e v e n u e O p e r a t i n g   e x p e n s e s
The size of these revenues will increase if operational efficiency is improved [131].
To make a comparison between the different generator technologies, the net present Value (NPV) is used (Equation (3)):
N P V = t = 0 n R t 1 + i t
where
  • R t : net cashflow (revenues–expenses) for a specific period t;
  • i: interest rate;
  • t: number of time periods.

2.3. Simulation with REopt Lite

For the analysis of the different scenarios for each generator type, the REopt Lite application was used. REopt Lite is NREL’s REopt web tool, which perfects the size and operating strategies of microgrids, storage, and energy/water systems. This tool is a monolith mixed-integer linear program that recommends the best mix of renewable and distributed energy, conventional generation, and energy storage technologies. This model is an extension of [132], which seeks design and dispatch decisions for a system of distributed energy resources that minimizes the cost of capital, operations, maintenance, fuel, utilities, the net of production incentives, and energy exports.
Economic resilience and environmental targets can be set in Reopt, and these are its main data inputs:
  • Drivers: Energy costs and revenues, economic factors, and resilience and environmental goals;
  • Technology options: Renewable generation, conventional generation, and energy storage;
  • Loads: Electric loads, heating and cooling loads, and dispatchable loads.
  • Once the optimization is finished, the next outputs are obtained:
  • Technology recommendations;
  • Optimal dispatch strategy;
  • Economic outputs: Capital cost, operating cost, lifecycle cost, and net present value.
Regarding resiliency, REopt has three types of resiliency analysis within the model:
  • Optimizing for grid-connected benefits and evaluating added resiliency;
  • Optimizing system sizes for a given outage duration;
  • Including the value of resiliency in the objective function.
For this study, the second resiliency analysis was chosen since an outage duration is provided as the model input. In addition, the simulation considers a critical load factor of 75% [133].
It is also relevant to mention some of the assumptions and caveats considered by REopt Lite since they affect this study too [134]. These are the most relevant ones for this case:
  • The load data reflecting one year of consumption and future loads may change (increase, decrease, and/or shift in timing).
  • Optimization is based on modeling the hourly loads, generation, and storage dispatch; intra-hour variability may impact savings.
  • Optimized dispatch reflects the model’s optimal forecast of modeled loads, so the results present the maximum economic potential of the modeled technologies.
  • Critical loads can be difficult to estimate; this contributes uncertainty to resilience analysis.
  • In case of grid outage, additional integration costs may be needed to facilitate microgrid capabilities that allow the system to operate independently.
  • When operating in grid-connected mode, REopt assumes that batteries are dispatched to minimize operational costs, and they may not be at a high state of charge when the outage occurs.

3. Results and Discussion

Among all possible types of commercial facilities, supermarkets were chosen for the assessment presented herein. This is because electrical and fire codes do not force these retailers to have emergency power systems. Nonetheless, there is a chance of substantial economic losses during blackouts because of lost sales in addition to the deterioration of frozen goods. In the investigation presented here, it is assumed that the backup system is adequately estimated to completely feed the critical loads of the facility at the time of an outage from the electricity grid. An important finding was the fact that using backup systems might either curtail expenses or generate benefits for a few scenarios.
Some supermarkets have backup systems that are only capable of supplying electricity to the cash registers and lighting but not to the refrigerators [135]. This was the case in 2012 for the only large supermarket in the city of South Amboy, New Jersey [135,136]. After 84 years of operation, this supermarket was forced to close in 2012 because of losses caused by a major power outage [135,136]. In the investigation presented here, an analysis will be conducted for a hypothetical supermarket found at the following site:
  • 611 Bordentown Ave, South Amboy, NJ, 08879.

3.1. Electricity Consumption

To generate the average hourly energy demand profiles, values accessible through Commercial Reference Buildings [137,138], the U.S. Energy Information Administration [139], and the REopt software [140] were used. A short statement of the main points of the power estimated for a single-story, 45,000 ft2 (4180 m2) supermarket is included in Table 3 and Figure 2.

3.2. Assumed Costs

Table 4 supplies a summary of the backup system installation costs and the maintenance costs for the three types of diverse generators: diesel, natural gas, and biomethane microturbine. The backup system expenses include switching equipment (circuit breakers, disconnectors, and other types of switches), as well as any emission controls needed to be run for non-emergency purposes. Expenses related to the fuels that are used to supply power at the present time (2021) and predicted expense increases for the assessment span are presented in Table 5.

3.3. Backup System

In supermarkets, refrigeration is the most critical load in the energy system since it manages to keep the products in good condition. Hence, the minimum size of the backup system should fulfill the refrigeration demand, which is between 43% [160] and 57% [161] of the total installed load. Since the maximum annual peak demand is 481.46 kW for the analyzed case, it is assumed that a backup generator with nominal power ranging in size from 275 to 500 kW will be sufficient to meet critical loads. Furthermore, for the simulation, a critical load factor of 75% [133] will be used, which stands for the ratio of actual kilowatt-hours used to the total possible kilowatt-hours that could be used at the kW level.
Microgrid upgrade costs are supposed to reach 30% of the system’s capital cost [162]. and avoided outage costs are supposed to be USD 3 per kWh [162]. Apart from (i) fixed, one-time expenses incurred on the purchase and (ii) operation and maintenance costs, it is necessary to consider fuel consumption costs. The fuel consumption data for generators were obtained from representative generator model data sheets. Fuel consumed depending on the percentage load is shown in Table 6. The linear adjustments of the data available in Table 6 are shown in Figure 3. From an electrical point of view, diesel engines are the most efficient technology, as can be seen in Figure 3.
Table 7 shows that, considering only variable costs, both NGG and biomethane microturbines show a lower marginal cost for energy produced by the generator than the DG.

3.4. Average Availability Depending on the Type of Generator Used

Table 8 shows how dependable the diverse types of generators (diesel, natural gas, or biomethane microturbines) are against power outages. During this time, the generators are considered to offer both backup and ancillary services. As can be seen in Table 8, the biomethane microturbines have a considerably greater probability of continuity than the other technologies.

3.5. Markets and Revenue Opportunities

New Jersey has a wholesale electricity market in which electricity suppliers and buyers send bids to sell and buy energy [179]. The investigation presented here assumed that, through generators, it is possible to reduce power consumption quickly and, for a brief period, avoid peak consumption (peak shaving). In addition, sometimes it is possible to avoid buying electricity from the power grid because the user can generate his own electricity at a lower cost than the price of market electricity rates.

3.6. Market Analysis

New Jersey is found within the PJM control area [180]. In this case, the electricity supply company selected to conduct the analysis presented here is the Public Service Electric and Gas Company. For the case studies presented in this research, the “LPG Rate Schedule—General Lighting and Power Service” [181,182,183] rate was used. For the assessment presented here, it will be assumed that the supermarket does not choose a third supplier, thus using the Basic Generation Service, BGS [184].

3.6.1. Diesel Engine as Storage-Free Dispatchable Solution for Critical Power Supply

The REopt Lite software developed by NREL was used to perform the energy resilience analysis assuming the following inputs:
  • Outage duration (hours): 36 h;
  • Critical load factor (%): 75%;
  • Microgrid upgrade cost: 30% of system capital cost;
  • Avoided outage costs: USD 3 per kWh.
It can be seen that the most cost-effective diesel generator should be sized at 354 kW so that the critical load can be met at the proposed site. Figure 4 shows the system performance for the specified outage period, which is replicated throughout the year.
Figure 5 shows the reduction in peak load that occurs when a storage-free dispatchable 354 kW diesel engine is implemented for critical power supply.
Figure 6 presents an evaluation of the amount of time that the proposed system will sustain the critical load for outages starting at every hour of the year.
Figure 7 shows that, supposing an avoided outage cost of USD 3 per kWh and a microgrid upgrade cost of 30% of the system capital cost, the NPV, after microgrid costs and benefits, will be USD 2,124,798. In this analysis, an avoided outage cost of USD 3/kWh is enough to obtain USD 2,124,798 of revenue if this diesel-based backup is installed and one outage happens during the lifecycle of the installation. The avoided outage cost was calculated using the Interruption Cost Estimate (ICE) Calculator (a tool designed to estimate interruption costs associated with reliability improvements) [185].

3.6.2. Natural Gas Engine as Storage-Free Dispatchable Solution

The REopt Lite software developed by NREL was used to perform the energy resilience analysis assuming the following inputs:
  • Outage duration (hours): 36 h;
  • Critical load factor (%): 75%;
  • Microgrid upgrade cost: 30% of system capital cost;
  • Avoided outage costs: USD 3 per kWh.
As with the diesel generator case, the natural gas engine had a size of 354 kW to meet the proposed location critical load.
Since the nominal power (354 kW) is the same as the simulated power for the previously displayed diesel case, the system performance, the net load duration, and the outage simulation performance for the natural gas engine are identical to the ones presented in Figure 4, Figure 5, and Figure 7, respectively.
Figure 8 shows that, supposing an avoided outage cost of USD 3 per kWh and a microgrid upgrade cost of 30% of the system capital cost, the NPV after microgrid costs and benefits will be USD 1,930,083. In this analysis, an avoided outage cost of USD 3/kWh is enough to obtain USD 1,930,083 of revenue if this natural gas engine system is installed and one outage happens during the lifecycle of the installation.

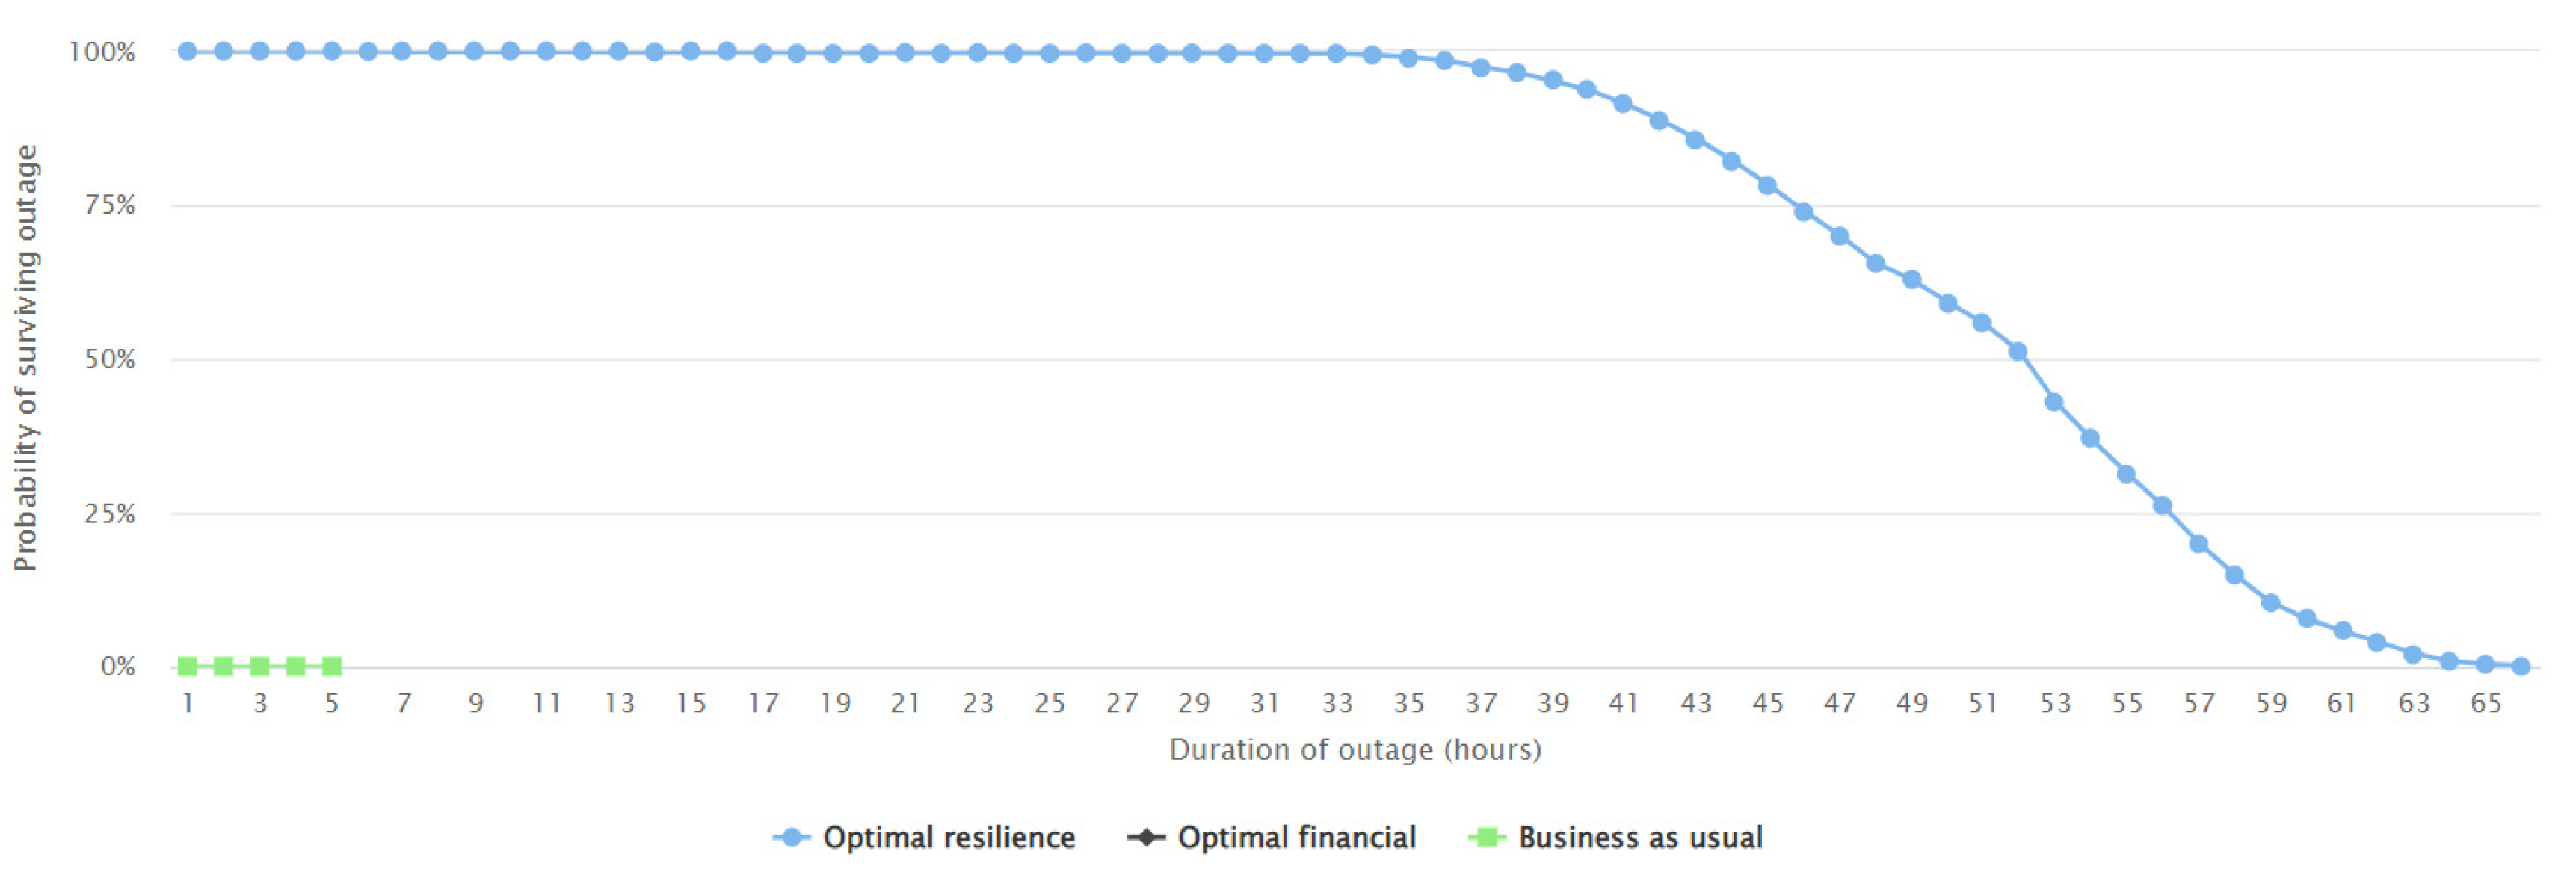
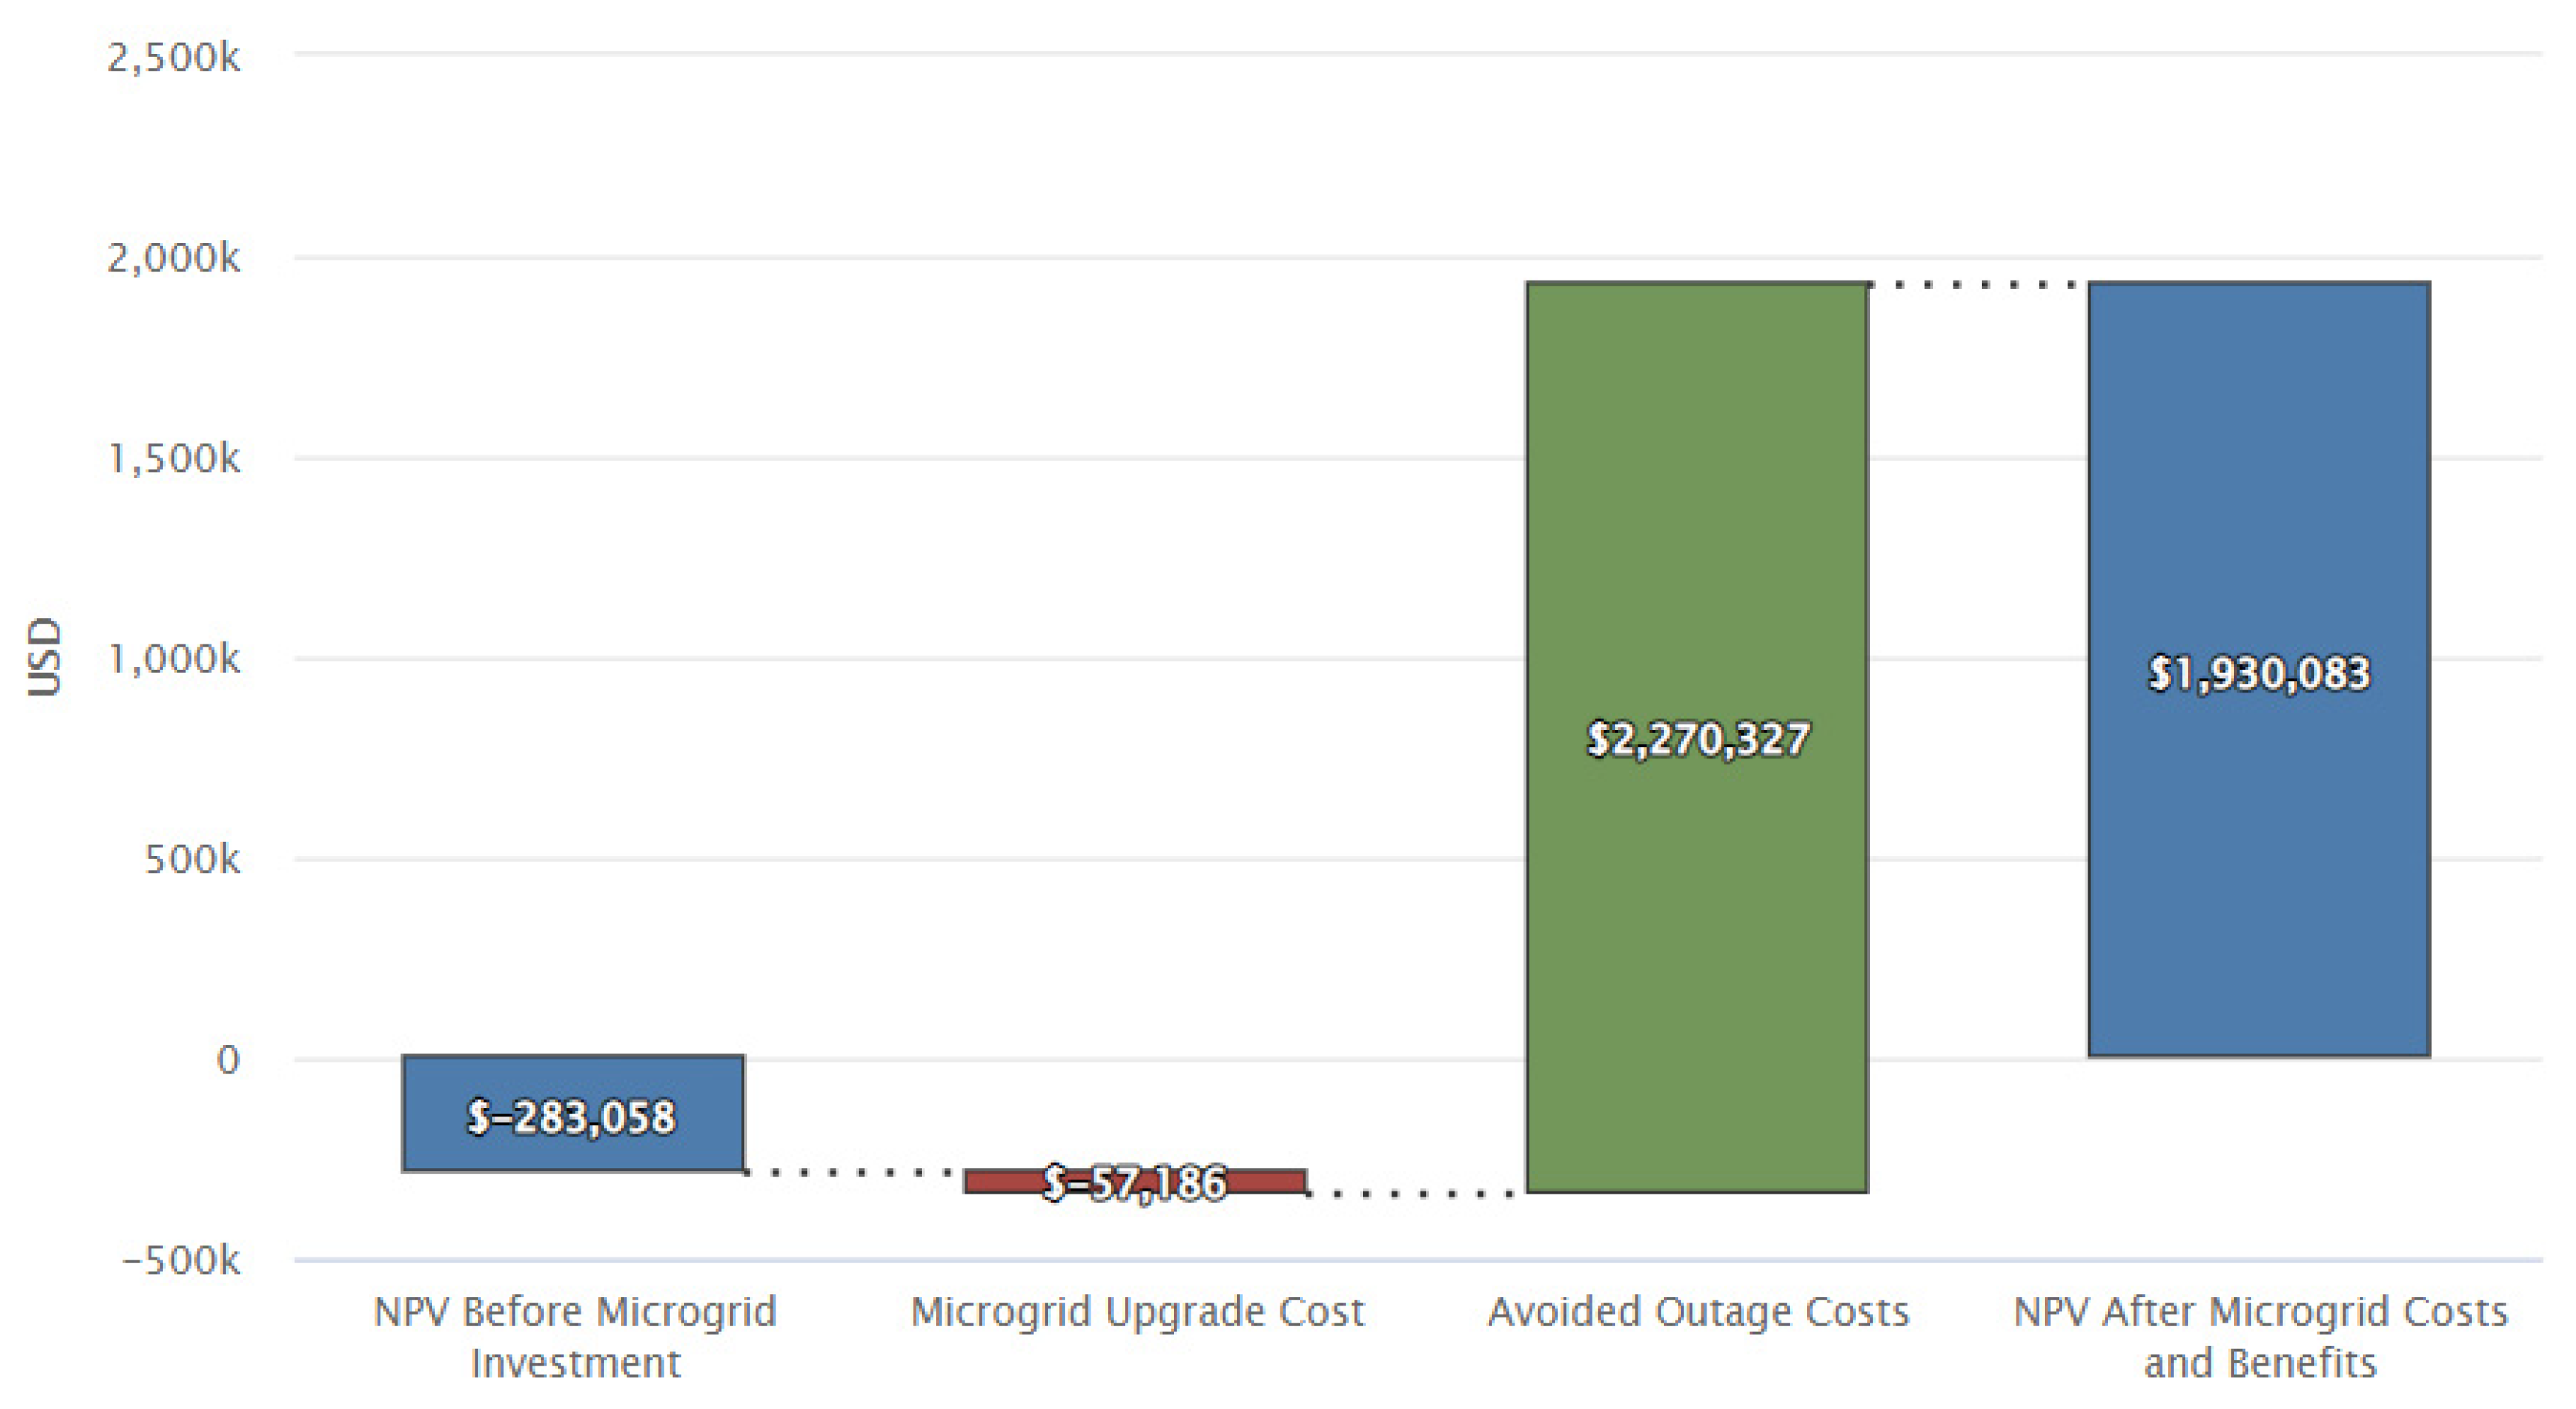
3.6.3. Biomethane Microturbine as Storage-Free Dispatchable Solution

The REopt Lite software developed by NREL was used to perform the energy resilience analysis assuming the following inputs:
  • Outage duration (hours): 36 h;
  • Critical load factor (%): 75%;
  • Microgrid upgrade cost: 30% of system capital cost;
  • Avoided outage costs: USD 3 per kWh.
As in the diesel and natural gas generator cases, a 354 kW power biomethane microturbine was selected to meet the critical load of the proposed site.
Since the nominal power (354 kW) is the same as the simulated power for the previously displayed diesel and natural gas cases, the system performance, the net load duration, and the outage simulation performance for the natural gas engine are identical to the ones presented in Figure 4, Figure 5, and Figure 7, respectively.
Figure 9 shows that, supposing an avoided outage cost of USD 3 per kWh and a microgrid upgrade cost of 30% of the system capital cost, the NPV after microgrid costs and benefits will reach USD 1,872,573. In this analysis, an avoided outage cost of USD 3/kWh is enough to obtain USD 1,872,573 of revenues if this effective biomethane microturbine system is installed and one outage happens during the lifecycle of the installation.
A positive NPV means that the backup system can not only protect the user from a resilience point of view but also bring revenue to the backup system owner because of the services provided to the power supply. It should be remarked that markets and tariffs are dynamic, and as such, the revenues obtained from supplying a range of ancillary services also vary during the time the installation is working. There are some regions where significant financial opportunities exist to reduce the cost of owning a backup generator. In any case, in those scenarios, where backup generators can supply auxiliary services, the economic results are better. As can be seen in this section, the auxiliary service revenues obtained in the case of an outage and the lower operating costs of the modeled backup systems can compensate for their higher capital cost. That said, and given regulation issues, in some cases, it is not possible to run diesel generators for purposes other than as backup generators. This could influence the choice of the type of generator.
The increase in wildfires and extreme weather events requires a redesign of power systems to maximize resilience and reduce potential outages. This analysis shows that it is possible to greatly improve the reliability and resilience of a critical facility suffering a grid power outage by means of the integration of an optimally designed microgrid focused on maintaining a required critical load factor for an average outage duration. The results show that it is feasible to maintain up to 75% of the load factor in a 36 h duration outage event, obtaining a positive NPV. This provides a new design paradigm in which the design of a new building energy system can be integrated with an optimally resilient system and, at the same time, avoid the outage costs and obtain a positive economic outcome. The proposed methodology can be applied to many different scenarios worldwide, and it is necessary to remark that other non-accountable benefits—such as continuity in sanitary facility operation and the avoidance of food deterioration in food storage buildings—are obtained. It is necessary to remark that the results show that the integration of renewable energy generators such as biomethane turbines is economically and technically feasible, providing a resilient solution that contributes to decarbonization. Future research can focus on the development of fuel supply schemes that can maximize the fuel supply and storage reliability so that the studied facility can maintain the required fuel levels during the outages. In this sense, it is necessary to remark that the three studied fuels can be effectively stored on-site using diesel tanks, liquified natural gas systems, and biomethane tanks, reducing possible supply disruptions in case of a supply outage. Therefore, it is necessary to develop future research on fuel supply optimization that can ensure that the power generation requirements are assured and, at the same time, that the storage costs are minimal.

4. Conclusions

Power outages due to weather-related events and wildfires have increased during the last few years, and it is necessary to design resilient energy systems that can supply the required energy supply to critical buildings. This research presents the results of an optimal design scheme applied to critical buildings in order to reduce the effects of a power outage by ensuring that a high percentage of the critical load supply is maintained. A multi-scenario analysis for different microgrid systems with different power generators was performed using the REopt Lite tool. The results show that there are benefits resulting from the use of several backup systems configured to also obtain economic benefits by supplying ancillary services to the electricity grid. Although in most cases the electricity interruptions are not long, in areas that are prone to natural disasters, there is a greater likelihood of long-term outages, and specific strategies for this possibility must be considered. The use of backup generators to supply auxiliary services can significantly compensate for the necessary investment in such generators. A parametric analysis was performed for diesel, natural gas, and biomethane generators. The results show that the increased use of generators can also help to improve system reliability and that, to improve economic performance, as storage-free dispatchable solutions for critical power supply use expensive fuel, the optimal mode of operation would be one in which the generator is in operation regularly but for a small amount of time per day. In the research case studies presented here, diesel generators provide lower capital costs, which makes them a better choice than natural gas generators and biomethane microturbines. An important result is that it is possible to integrate renewable energy-driven generator systems in resilient microgrids. Biomethane microturbines are designed specifically for mission-critical loads, offer minimal maintenance, and are modular solutions with the highest reliability for the three technologies assessed. Considering that natural gas prices for industrial customers in the US are typically around 0.73 USD/MWh, biomethane’s higher costs make this technology uncompetitive in the absence of government subsidies. It can be concluded that, depending on which is the preponderant design parameter (cost of capital, cost of operation, or reliability of the scheme), the storage-free dispatchable solution for the critical power supply to be selected will vary.

Author Contributions

Conceptualization, D.B.-D., I.d.L.-O., E.A. and E.R.-A.; methodology, D.B.-D., I.d.L.-O., E.A. and E.R.-A.; writing—original draft, D.B.-D., I.d.L.-O., E.A. and E.R.-A.; data curation, D.B.-D., I.d.L.-O., E.A. and E.R.-A.; writing—review and editing, D.B.-D., I.d.L.-O., E.A. and E.R.-A. All authors have read and agreed to the published version of the manuscript.

Funding

This research received no external funding.

Acknowledgments

The authors gratefully acknowledge the support of the “RIASE” international research network for its support in the development of this research.

Conflicts of Interest

The authors declare no conflict of interest.

Nomenclature

BTMBiomethane microturbine
DGDiesel generator
EFCElectrical and fire codes
FTSFailure to start
ICE Interruption cost estimate
LCCLifecycle cost
NGNatural gas
NGGNatural gas generator
NPVNet present value
O&MOperation and maintenance
RNGRenewable natural gas

References

  1. Härö, E.; Järvensivu, S.M.; Alilehto, J.; Haravuori, P. Electricity: How Long Could We Survive without It? Sweco AB: Stockholm, Sweden; Available online: https://www.swecourbaninsight.com/urban-energy/electricity-how-long-could-we-survive-without-it/ (accessed on 26 October 2019).
  2. National Academies of Sciences, Engineering, and Medicine. Enhancing the Resilience of the Nation’s Electricity System; The National Academies Press: Washington, DC, USA, 2017. [Google Scholar]
  3. Dorf, R.D. The Electrical Engineering Handbook, 2nd ed.; CRC Press: Boca Ratón, FL, USA, 1997. [Google Scholar]
  4. Foster Fuels’ Mission Critical. The Effects of a Power Outage on a Business. Brookneal: Foster Fuels Emergency Response Team. Available online: https://www.fosterfuelsmissioncritical.com/power-outage-effects-businesses/ (accessed on 26 October 2019).
  5. Liddiard, R.; Gowreesunker, B.L.; Spataru, C.; Tomei, J.; Huebner, G. The vulnerability of refrigerated food to unstable power supplies. Energy Procedia 2017, 123, 196–203. [Google Scholar] [CrossRef]
  6. Oxford Business Group. The Report: Kenya 2014; Oxford Business Group: London, UK, 2014. [Google Scholar]
  7. World Bank. Value Lost Due to Electrical Outages (% of Sales for Affected Firms). Available online: https://data.worldbank.org/indicator/IC.FRM.OUTG.ZS (accessed on 26 October 2019).
  8. Ramachandran, V.; Shah, V.K.; Moss, T. How Do Ashing Firms Respond to Unreliable Power? Exploring Firm Heterogeneity Using k-Means Clustering; Center for Global Development: Washington, DC, USA, 2018. [Google Scholar]
  9. Kent, R. Energy Management in Plastics Processing: Strategies, Targets, Techniques, and Tools; Elsevier: Amsterdam, The Netherlands, 2019. [Google Scholar]
  10. Topi, H.; Tucker, A. Computing Handbook: Information Systems and Information Technology; CRC: Boca Ratón, FL, USA, 2014. [Google Scholar]
  11. Franks, B. Taming the Big Data Tidal Wave: Finding Opportunities in Huge Data Streams with Advanced Analytics; Wiley: Chichester, UK, 2012. [Google Scholar]
  12. Mills, E.; Jones, R. An Insurance Perspective on U.S. Electric Grid Disruption Costs; Lawrence Berkeley National Laboratory: Berkeley, CA, USA, 2016.
  13. U.S. Environmental Protection Agency. Valuing the Reliability of Combined Heat and Power; U.S. Environmental Protection Agency: Washington, DC, USA, 2007.
  14. Peters, G. Perspectives on Protecting the Electric Grid from an Electromagnetic Pulse or Geomagnetic Disturbance; U.S. Senate Committee on Homeland Security and Governmental Affairs: Washington, DC, USA, 2019. Available online: https://www.hsgac.senate.gov/imo/media/doc/Opening%20Statement-Peters-2019-02-27.pdf (accessed on 26 October 2019).
  15. Department of Homeland Security. Power Outage Incident Annex to the Response and Recovery Federal Interagency Operational Plans: Managing the Cascading Impacts from a Long-Term Power Outage; Department of Homeland Security: Washington, DC, USA, 2017.
  16. Hirschbold, M. Can Hospitals Ever Be Fully Prepared for Massive Power Outages? Schneider Electric: Rueil-Malmaison, France, 2014; Available online: https://blog.se.com/healthcare/2014/01/16/can-hospitals-ever-fully-prepared-massive-power-outages/ (accessed on 26 October 2019).
  17. Allen-Dumas, M.R.; Binita, K.C.; Cunliff, C.I. Extreme Weather and Climate Vulnerabilities of the Electric Grid: A Summary of Environmental Sensitivity Quantification Methods; Oak Ridge National Laboratory: Oak Ridge, TN, USA, 2019.
  18. Yu, W.; Pollitt, M.G. Does Liberalisation Cause More Electricity Blackouts? Evidence from a Global Study of Newspaper Reports; EPRG Working Paper 0827; University of Cambridge: Cambridge, UK, 2009. [Google Scholar]
  19. OSCE. Protecting Electricity Networks from Natural Hazards; Organization for Security and Co-Operation in Europe: Vienna, Austria, 2016. [Google Scholar]
  20. Climate Central. Available online: https://www.climatecentral.org (accessed on 20 May 2023).
  21. Consortium for Ocean Leadership. Natural Disasters Cost U.S. A Record $306 Billion Last Year. Available online: https://oceanleadership.org/natural-disasters-cost-u-s-record-306-billion-last-year/ (accessed on 28 October 2019).
  22. Stewart, S.R.; Berg, R. Hurricane Florence. Hurricane Florence (AL062018) 31 August–17 September 2018; National Hurricane Center Tropical Cyclone Report; National Hurricane Center: Miami, FL, USA, 2018.
  23. EIA. EIA Hurricane Michael Electricity Status Report: Tracking the Electricity Impact of Hurricane Michael on the Southeastern Region of the United States; U.S. Energy Information Administration (EIA): Washington, DC, USA, 2018.
  24. May, A.; Lam, K. PG&E Keeps Nearly 60,000 Northern California Customers in the Dark to Reduce Wildfire Risk. Available online: https://eu.usatoday.com/story/money/nation-now/2018/10/15/pge-voluntarily-shut-off-power-north-california-wildfires/1646686002/ (accessed on 28 October 2019).
  25. Munasinghe, M. Optimal Electricity Supply: Reliability, Pricing, and System Planning; World Bank: Washington, DC, USA, 1981. [Google Scholar]
  26. Enchanted Rock. The Affordable Microgrid: Securing Electric Reliability through Outsourcing; Enchanted Rock: Houston, TX, USA, 2018. [Google Scholar]
  27. The National Academies Press. The Power of Change: Innovation for Development and Deployment of Increasingly Clean Energy Technologies; The National Academies Press: Washington, DC, USA, 2016. [Google Scholar]
  28. Sovacool, B.K.; Sidortsov, R.V.; Jones, B.R. Energy Security, Equality and Justice; Routledge: London, UK, 2014. [Google Scholar]
  29. Executive Office of the President. Economic Benefits of Increasing Electric Grid Resilience to Weather Outages; Executive Office of the President: Washington, DC, USA, 2013.
  30. Orlando Utilities Commission. Power Quality Analysis: Protecting Your Sensitive Business Equipment. Available online: https://www.ouc.com/business/electric-services/power-quality-analysis (accessed on 3 December 2019).
  31. Oseni, M.O.; Pollitt, M.G. The Economic Costs of Unsupplied Electricity: Evidence from Backup Generation among African Firms; EPRG Working Paper 1326; University of Cambridge: Cambridge, UK, 2013. [Google Scholar]
  32. Lazard. Levelized Cost of Energy Analysis 9.0; Lazard: Boston, MA, USA, 2016. [Google Scholar]
  33. Dibomaa, B.S.; Tatietse, T.T. Power interruption costs to industries in Cameroon. Energy Policy 2013, 62, 582–592. [Google Scholar] [CrossRef]
  34. Abdisa, L.T. Power outages, economic cost, and firm performance: Evidence from Ethiopia. Util. Policy 2018, 53, 111–120. [Google Scholar] [CrossRef]
  35. Szakonyi, D.; Urpelainen, J. Electricity sector reform and generators as a source of backup power: The case of India. Energy Sustain. Dev. 2013, 17, 477–481. [Google Scholar] [CrossRef]
  36. Kim, K.; Cho, Y. Estimation of power outage costs in the industrial sector of South Korea. Energy Policy 2017, 101, 236–245. [Google Scholar] [CrossRef]
  37. Wolf, A.; Wenzel, L. Regional diversity in the costs of electricity outages: Results for German counties. Util. Policy 2016, 43, 195–205. [Google Scholar] [CrossRef]
  38. Amoaha, A.; Ferrini, S.; Schaafsma, M. Electricity outages in Ghana: Are contingent valuation estimates valid? Energy Policy 2019, 135, 110996. [Google Scholar] [CrossRef]
  39. Oseni, M.O. Get rid of it: To what extent might improved reliability reduce self-generation in Nigeria? Energy Policy 2016, 93, 246–254. [Google Scholar] [CrossRef]
  40. Phillips, J.A.; Wallace, K.E.; Kudo, T.Y.; Eto, J.H. Onsite and Electric Power Backup Capabilities at Critical Infrastructure Facilities in the United States; Argonne National Laboratory: Lemont, IL, USA, 2016.
  41. The Ministry of Environment—United Nations Development Programme. National Greenhouse Gas Inventory: Report and Mitigation Analysis for the Energy Sector in Lebanon; UNDP Lebanon: Beirut, Lebanon, 2015. [Google Scholar]
  42. The Institute of Energy Economics, Japan. IEEJ Outlook 2019. Energy Transition and a Thorny Path for 3E Challenges: Energy, Environment and Economy; The Institute of Energy Economics, Japan: Tokyo, Japan, 2018. [Google Scholar]
  43. Cummins Power Generation. Peaking Power: Flexible Gas Fueled Solutions for Peak Demand; Cummins Power Generation: Columbus, OH, USA, 2012. [Google Scholar]
  44. Logan, J.; Marcy, C.; McCall, J.; Flores-Espino, F.; Bloom, A.; Aabakken, J.; Cole, W.; Jenkin, T.; Porro, G.; Liu, C.; et al. Electricity Generation Baseline Report; National Renewable Energy Laboratory: Denver, CO, USA, 2017.
  45. NERC. Special Reliability Assessment: Potential Bulk Power System Impacts Due to Severe Disruptions on the Natural Gas System; North American Electric Reliability Corporation: Atlanta, Georgia, 2017. [Google Scholar]
  46. Shavel, I.; Hagerty, J.M.; Powers, N.; Yang, Y. Electricity Baseline Report for the US Power System Contract No. 238857; The Brattle Group: Boston, MA, USA, 2015. [Google Scholar]
  47. Resource Dynamics Corporation. Market Potential for Flexible Opportunity Fuels: Industrial Steam Generation and Process Heating; Oak Ridge National Laboratory: Oak Ridge, TN, USA, 2012.
  48. Thomsen, N.; Wagner, T.; Hoisington, A.; Schuldt, S. A sustainable prototype for renewable energy: Optimized prime-power generator solar array replacement. Int. J. Energy Prod. Manag. 2019, 4, 28–39. [Google Scholar] [CrossRef]
  49. The Electric Infrastructure Security (EIS) Council. Electric Infrastructure Protection Handbook II: Volume 1—Fuel Resilient Fuel Resources for Power Generation in Black Sky Events; The Electric Infrastructure Security Council: Washington, DC, USA, 2016. [Google Scholar]
  50. Wellington, L.G. Prepare Today: Survive Tomorrow; Blue Star Books: Santa Cruz, CA, USA, 2013. [Google Scholar]
  51. BP. Long Term Storage of Diesel. Available online: https://www.bp.com/content/dam/bp-country/en_au/media/fuel-news/long-term-storage-diesel.pdf (accessed on 18 December 2019).
  52. NESCAUM. Air Quality, Electricity, and Backup Stationary Diesel Engines in the Northeast; NESCAUM: Boston, MA, USA, 2012. [Google Scholar]
  53. Garcia, A.; Bailer, T.; Keogh, M.; Castelli, B. Integrating Public Health and Environmental Protection into Demand Response Programs; Center for Energy and Climate Solutions: Arlington, IL, USA, 2002. [Google Scholar]
  54. Ma, Z.; Eichman, J.; Kurtz, J. Fuel Cell Backup Power Unit Configuration and Electricity Market Participation: A Feasibility Study; National Renewable Energy Laboratory: Denver, CO, USA, 2017.
  55. Gilmore, E.A.; Lave, L.B. Increasing Backup Generation Capacity and System Reliability by Selling Electricity during Periods of Peak Demand. Available online: https://www.usaee.org/usaee2007/submissions/OnlineProceedings/7480-Gilmore_Lave_ConfProceedings.pdf (accessed on 21 December 2019).
  56. Nuclear Energy Institute. Regulatory Assessment Performance Indicator Guideline; Nuclear Energy Institute: Washington, DC, USA, 2013. Available online: https://www.nrc.gov/docs/ML1326/ML13261A116.pdf (accessed on 21 December 2019).
  57. Mrowca, B. Emergency Diesel Generator Failure Review 1999–2001; Information Systems Laboratories: Rockville, MD, USA, 2011. Available online: https://www.nrc.gov/docs/ML1125/ML11259A101.pdf (accessed on 21 December 2019).
  58. Robinson, D.; Atcitty, C.; Zuffranieri, J.; Arent, D. Impact of Distributed Energy Resources on the Reliability of a Critical Telecommunications Facility; Sandia National Laboratories: Albuquerque, NM, USA, 2006.
  59. Divine, T. Power-Generation Systems in High-Performance Buildings. Available online: https://www.csemag.com/articles/power-generation-systems-in-high-performance-buildings/?OCVALIDATE= (accessed on 26 January 2020).
  60. Lam, N.L.; Wallach, E.; Hsu, C.W.; Jacobson, A.; Alstone, P.; Purohit, P.; Klimont, Z. The Dirty Footprint of the Broken Grid the Impacts of Fossil Fuel Backup Generators in Developing Countries; International Finance Corporation: Washington, DC, USA, 2019. [Google Scholar]
  61. Samanta, P.; Kim, I.; Uryasev, S.; Penoyar, J.; Vesely, W. Emergency Diesel Generator: Maintenance and Failure Unavailability, and Their Risk Impacts; Brookhaven National Laboratory: New York, NY, USA, 1994.
  62. Schroeder, J.A. Enhanced Component Performance Study: Emergency Diesel Generators 1998–2016; Idaho National Laboratory: Idaho Falls, ID, USA, 2018. Available online: https://inldigitallibrary.inl.gov/sites/sti/sti/6618432.pdf (accessed on 26 January 2020).
  63. U.S. Nuclear Regulatory Commission. Component Reliability Data Sheets 2015 Update. Available online: https://nrcoe.inl.gov/resultsdb/publicdocs/AvgPerf/ComponentReliabilityDataSheets2015.pdf (accessed on 26 January 2020).
  64. Harmsen, N. Energy Market Operator Issues Mixed Blackout Forecast for SA, Victoria during Summer. Available online: https://www.abc.net.au/news/2017-09-06/aemo-forecast-mixed-blackout-risk-for-south-australia-victoria/8875798 (accessed on 26 January 2020).
  65. Prada, J.F. The Value of Reliability in Power Systems—Pricing Operating Reserves; Massachusetts Institute of Technology: Cambridge, MA, USA, 1999. [Google Scholar]
  66. Winfield, D.J. Long term reliability analysis of standby diesel generators. Reliab. Eng. Syst. Saf. 1988, 21, 293–308. [Google Scholar] [CrossRef]
  67. Mannan, S. Lees’ Loss Prevention in the Process Industries: Hazard Identification, Assessment and Control, 3rd ed.; Elsevier: Burlington, MA, USA, 2013; Volume 1. [Google Scholar]
  68. Fairfax, S.; Dowling, N.; Weidknecht, P. Reliability assessment of a large diesel generator fleet. In Proceedings of the 2019 IEEE Industry Applications Society Annual Meeting, Baltimore, MD, USA, 29 September–3 October 2019. [Google Scholar]
  69. Working Group 9. Infrastructure Sharing during Emergencies Backup Power Subcommittee Shared Services; The Communications, Security, Reliability and Interoperability Council IV: Washington, DC, USA, 2015.
  70. ASCO Power Technologies. White Paper Can Building Codes Ensure Power Reliability? ASCO Power Technologies: Florham Park, NJ, USA, 2017. [Google Scholar]
  71. Anderson, K.; Laws, N.D.; Marr, S.; Lisell, L.; Jimenez, T.; Case, T.; Li, X.; Lohmann, D.; Cutler, D. Quantifying and monetizing renewable energy resiliency. Sustainability 2018, 10, 933. [Google Scholar]
  72. Grizard, E. Diesel Generators Are Not the Answer to Today’s Energy Blackouts. Available online: https://www.bloomenergy.com/blog/diesel-generators-are-not-answer-todays-energy-blackouts (accessed on 28 January 2020).
  73. Ruud, C. Why Not Go Green?—An Analysis of the Viability of Solar PV Mini-Grids in Tanzania; Norwegian University of Life Sciences: As, Norway, 2013. [Google Scholar]
  74. Vreeburg, H. Supporting Continuity: The Impact of Fuel. Available online: https://datacenter.com/news_and_insight/supporting-continuity-the-impact-of-fuel/ (accessed on 2 February 2020).
  75. Petrol, D.D. Distribution Systems for Natural Gas. Available online: https://www.petrol.eu/companies-and-services/business-solutions/solutions/natural-gas-distribution-systems (accessed on 2 February 2020).
  76. ActewAGL. Distribution 2017–21 Access Arrangement Information Act Gas Networks Asset Management Plan RY16–RY21. Available online: https://www.aer.gov.au/system/files/ActewAGL%20Distribution%20AAI%20Appendix%206.01%20-%20Asset%20Management%20Plan%20-%20July%202015.pdf (accessed on 2 February 2020).
  77. Generac Power Systems, Inc. Natural Gas Reliability the Pipeline Is Strong; Regional Acceptance is Growing. Available online: https://www.generac.com/Industrial/all-about/natural-gas-fuel/natural-gas-reliability/the-pipeline-is-strong (accessed on 2 February 2020).
  78. Bloomer, C. What Pipeline Companies Are Doing to Keep Their Operations Safe. Available online: https://cepa.com/wp-content/uploads/2018/07/2018_PipelineOperations_ENG.pdf (accessed on 2 February 2020).
  79. Walker, I.R. Reliability in Scientific Research: Improving the Dependability of Measurements, Calculations, Equipment and Software; Cambridge University Press: Cambridge, UK, 2011. [Google Scholar]
  80. British Geological Survey. Underground Natural Gas Storage in the UK. Available online: https://www.bgs.ac.uk/research/energy/undergroundGasStorage.html (accessed on 4 May 2020).
  81. Folga, S.; Talaber, L.; McLamore, M.; Kraucunas, I.; McPherson, T.; Parrott, L.; Manzanares, T. Literature Review and Synthesis for the Natural Gas Infrastructure; Argonne National Laboratory: Argonne, IL, USA, 2015.
  82. Natural Gas Council. Natural Gas Systems: Reliable & Resilient; Natural Gas Council: Washington, DC, USA, 2017. [Google Scholar]
  83. American Petroleum Institute. Supporting the American Way of Life: The Importance of Natural Gas Storage; American Petroleum Institute: Washington, DC, USA, 2016. [Google Scholar]
  84. U.S. Energy Information Administration. The Basics of Underground Natural Gas Storage. Available online: https://www.eia.gov/naturalgas/storage/basics/ (accessed on 4 May 2020).
  85. Fuel Cell and Hydrogen Energy Association. Resiliency of Stationary Fuel Cells and the Natural Gas Grid. Available online: https://www.wbdg.org/resources/resiliency-stationary-fuel-cells-and-natural-gas-grid (accessed on 4 May 2020).
  86. Clarke, C. On the Road to a Green Energy UK: Integrated Gas & Electricity Networks Support the Journey; Wales & West Utilities: Newport, RI, USA, 2017. [Google Scholar]
  87. Liss, W.; Rowley, P. Assessment of Natural Gas and Electric Distribution Service Reliability; Gas Technology Institute: Des Plaines, IL, USA, 2018. [Google Scholar]
  88. Li, T.; Eremia, M.; Shahidehpour, M. Interdependency of Natural Gas Network and Power System Security. IEEE Trans. Power Syst. 2008, 23, 1817–1824. [Google Scholar] [CrossRef]
  89. ICF. Case Studies of Natural Gas Sector Resilience Following Four Climate-Related Disasters in 2017; SoCalGas: Los Angeles, CA, USA, 2018. [Google Scholar]
  90. FPI. Securely Connected: An Assessment of the Contribution of Interconnectors to Security of Supply in Great Britain; FTI Consulting LLP: London, UK, 2019. [Google Scholar]
  91. State of New Jersey. State of New Jersey 2019 Hazard Mitigation Plan: Power Failure; State of New Jersey: Trenton, NJ, USA, 2019.
  92. Apt, J.; Freeman, G.; Dworkin, M. The Natural Gas Grid Needs Better Monitoring. Available online: https://issues.org/the-natural-gas-grid-needs-better-monitoring/ (accessed on 4 May 2020).
  93. NERC. 2013 Special Reliability Assessment: Accommodating an Increased Dependence on Natural Gas for Electric Power Phase II: A Vulnerability and Scenario Assessment for the North American Bulk Power System; North American Electric Reliability Corporation: Washington, DC, USA, 2013. [Google Scholar]
  94. FEMA. The California Fires Coordination Group: A Report to the Secretary of Homeland Security; Office of the Under Secretary, U.S. Department of Homeland Security: Washington, DC, USA, 2004.
  95. NERC. February 2011 Southwest Cold Weather Event. Available online: https://www.nerc.com/pa/rrm/ea/Pages/February-2011-Southwest-Cold-Weather-Event.aspx (accessed on 4 May 2020).
  96. NERC. Hurricane Sandy Event Analysis Report; North American Electric Reliability Corporation: Washington, DC, USA, 2014. [Google Scholar]
  97. SDG&E. San Diego Gas & Electric Company Prepared Direct Testimony of Concentric Energy Advisors Wildfire Risk Premium; San Diego Gas & Electric Company: San Diego, CA, USA, 2019. [Google Scholar]
  98. PG&E. Response to Notice Re California Wildfires; Pacific Gas and Electric Company: San Francisco, CA, USA, 2019. [Google Scholar]
  99. Office of Cybersecurity, Energy Security, and Emergency Response. California Wildfires—Energy Infrastructure Impacts October 30, 2003; Office of Cybersecurity, Energy Security, and Emergency Response: Washington, DC, USA, 2003.
  100. FERC. Report on Outages and Curtailments during the Southwest Cold Weather Event of February1–5, 2011: Causes and Recommendations; Federal Energy Regulatory Commission: Washington, DC, USA, 2011.
  101. NCDP. After Hurricane Sandy: Lessons Learned for Bolstering Energy Resilience; National Center for Disaster Preparedness at the Earth Institute: New York, NY, USA, 2013. [Google Scholar]
  102. DOE. Comparing the Impacts of Northeast Hurricanes on Energy Infrastructure; Office of Electricity Delivery and Energy Reliability-U.S. Department of Energy: Washington, DC, USA, 2013.
  103. City of Tracy. Exhibit B: Technical Specifications for Gasoline and Diesel Fuel Supplier 2018–2020. Available online: https://www.cityoftracy.org/documents/20180918_CC_AP.pdf (accessed on 4 May 2020).
  104. Willis, H.L.; Rashid, M.H. Protective Relaying: Principles and Applications, 3rd ed.; CRC Press: Boca Ratón, FL, USA, 2006. [Google Scholar]
  105. Clifford Power. 10 Things to Consider When Purchasing an Automatic Standby Generator for Business. Available online: https://www.cliffordpower.com/10-things-to-consider-when-purchasing-an-automatic-standby-generator-for-business/ (accessed on 4 May 2020).
  106. Kurtz, J.; Saur, G.; Sprik, S.; Ainscough, C. Backup Power Cost of Ownership Analysis and Incumbent Technology Comparison; National Renewable Energy Laboratory: Denver, CO, USA, 2014.
  107. Hudson, C.R. Cost Estimate Guidelines for Advanced Nuclear Power Technologies; Oak Ridge National Laboratory: Oak Ridge, TN, USA, 1986.
  108. Myers, M.L.; Fuller, L.C. A Procedure for Estimating Nonfuel Operation and Maintenance Costs for Large Steam-Electric Power Plants; Oak Ridge National Laboratory: Oak Ridge, TN, USA, 1979.
  109. Economic Modeling Working Group. Cost Estimating Guidelines for Generation IV Nuclear Energy Systems; OECD: Paris, France, 2007. [Google Scholar]
  110. Asian Development Bank. Handbook on Battery Energy Storage System; Asian Development Bank: Manila, Philippines, 2018. [Google Scholar]
  111. Ma, Z.; Eichman, J.; Kurtz, J. Fuel Cell Backup Power System for Grid Server and Micro-Grid in Telecommunication Applications; National Renewable Energy Laboratory: Denver, CO, USA, 2018.
  112. Vasallo, M.J.; Andujar, J.M.; Garcia, C.; Brey, J. A methodology for sizing backup fuel-cell/battery hybrid power systems. IEEE Trans. Ind. Electron. 2010, 57, 1964–1975. [Google Scholar] [CrossRef]
  113. Oluwaseun, B. Ogunmodede—Modeling and Solving Large-Scale Optimization Problems: Case Studies in Renewable Energy and Mining; Colorado School of Mines: Golden, CO, USA, 2021. [Google Scholar]
  114. GENERAC. Diesel, Natural Gas, Dual-Fuel, Bi-Fuel… How Do I Choose? Available online: https://www.generac.com/Industrial/all-about/selecting-the-best-fuel-option (accessed on 6 May 2020).
  115. Crouch, M. Fuel Cell Systems for Base Stations: Deep Dive Study; GSMA: London, UK, 2011. [Google Scholar]
  116. Wolfram, C. Measuring the Economic Costs of Electricity Outages. Available online: https://blogs.berkeley.edu/2012/11/07/measuring-the-economic-costs-of-electricity-outages/ (accessed on 6 May 2020).
  117. Schmid, E. The Cost of Blackouts in Europe. Available online: https://cordis.europa.eu/article/id/126674-the-cost-of-blackouts-in-europe (accessed on 6 May 2020).
  118. Anderson, K.; Hotchkiss, E.; Murphy, C. Valuing Resilience in Electricity Systems; National Renewable Energy Laboratory: Denver, CO, USA, 2019.
  119. Lazard. Lazard’s Levelized Cost of Energy Analysis—Version 11.0; Lazard: Boston, MA, USA, 2017. [Google Scholar]
  120. Kirchner, M. Understanding Backup Power System Fuel Choices: Why Diesel Remains Popular as a Fuel Supply, Engineers Have Several Additional Fuel Options from Which to Choose. Available online: https://www.csemag.com/articles/understanding-backup-power-system-fuel-choices/ (accessed on 6 May 2020).
  121. Stamp, J.E.; Baca, M.J.; Munoz-Ramos, K.; Schenkman, B.L.; Eddy, J.P.; Smith, M.A.; Guttromson, R.; Henry, J.M.; Jensen, R.P. City of Hoboken Energy Surety Analysis: Preliminary Design Summary; Sandia National Laboratories: Albuquerque, NM, USA, 2014.
  122. DOE. Backup Power Sources for DOE Facilities; U.S. Department of Energy: Washington, DC, USA, 2000.
  123. Center for Chemical Process Safety. Guidelines for Safe and Reliable Instrumented Protective Systems; Wiley: Chichester, UK, 2007. [Google Scholar]
  124. Benth, F.E.; Kholodnyi, V.A.; Laurence, P. Quantitative Energy Finance: Modeling, Pricing, and Hedging in Energy and Commodity Markets; Springer Science+Business Media: New York, NY, USA, 2014. [Google Scholar]
  125. NRCAN. Natural Gas in Remote and Northern Communities and Industry; Natural Resources Canada: Gatineau, QC, Canada, 2018.
  126. Olser, C. Diesel & Thermal Electricity Generation Options; Intergroup Consultants: Winnipeg, MB, Canada, 2011. [Google Scholar]
  127. Pramac. Continuous Power without the Hassle of Refueling. Available online: https://www.pramac.com/gas2 (accessed on 8 May 2020).
  128. Ericson, S.; Lisell, L. A flexible framework for modeling customer damage functions for power outages. Energy Syst. 2020, 11, 95–111. [Google Scholar] [CrossRef]
  129. United States Congress. New York Blackout of July 13, 1977: Costs and Preventive Act on: Hearing before the Subcommittee on Energy and Power of the Committee on Interstate and Foreign Commerce, House of Representatives, Ninety-Fifth Congress, Second Session; United States Congress: Washington, DC, USA, 1978.
  130. Erockhld. Next Generation Data Center Backup Power Systems; Enchanted Rock: Houston, TX, USA, 2018. [Google Scholar]
  131. Pfeifenberger, J.; Spees, K.; Chang, J.; Aydin, M.G.; Graf, W.; Cahill, P. The Future of Ontario’s Electricity Market: A Benefits Case Assessment of the Market Renewal Project; The Brattle Group: Boston, MA, USA, 2017. [Google Scholar]
  132. Hirwa, J.; Ogunmodede, O.; Zolan, A.; Newman, A.M. Optimizing design and dispatch of a renewable energy system with combined heat and power. Optim. Eng. 2022, 23, 1–31. [Google Scholar] [CrossRef]
  133. Ratkiewich, R.; Enis, J.; Resiliency and Microgrid Team; California Public Utilities Commission. Value of Resiliency—4 Pillar Methodology; Mitigation Measure Assessment and presentations by Sandia and Lawrence Berkeley National Labs: Pillar 2, USA; 2021. [Google Scholar]
  134. Krah, K. Reopt® Lite Overview-Resilience Analysis: Clear Sky Tampa Bay; NREL: Golden, CO, USA, 2021.
  135. NJ.com. Sandy Causes N.J. Supermarket to Close up Shop after 84 Years. Available online: https://www.nj.com/news/2012/11/sandy_causes_nj_supermarket_to.html (accessed on 8 May 2020).
  136. Public Broadcasting Service. Sandy Causes Only Supermarket in South Amboy to Close. Available online: https://www.pbs.org/video/njtoday-sandy-causes-only-supermarket-south-amboy-close/ (accessed on 8 May 2020).
  137. US Office of Energy Efficiency & Renewable Energy. Commercial Reference Buildings. Available online: https://www.energy.gov/eere/buildings/commercial-reference-buildings (accessed on 8 May 2020).
  138. Deru, M.; Field, K.; Studer, D.; Benne, K.; Griffith, B.; Torcellini, P.; Liu, B.; Halverson, M.; Winiarski, D.; Rosenberg, M.; et al. U.S. Department of Energy Commercial Reference Building Models of the National Building Stock; National Renewable Energy Laboratory: Denver, CO, USA, 2011.
  139. U.S. Energy Information Administration. U.S. Electric System Operating Data. Available online: https://www.eia.gov/realtime_grid (accessed on 8 May 2020).
  140. Anderson, K.H.; Cutler, D.S.; Olis, D.R.; Elgqvist, E.M.; Li, X.; Laws, N.D.; DiOrio, N.A.; Walker, H.A. Reopt: A Platform for Energy System Integration and Optimization; National Renewable Energy Laboratory: Denver, CO, USA, 2017.
  141. U.S. Energy Information Administration. Henry Hub Natural Gas Spot Price. Available online: https://www.eia.gov/dnav/ng/hist/rngwhhdD.htm (accessed on 10 May 2020).
  142. U.S. Energy Information Administration. Natural Gas Prices. Available online: https://www.eia.gov/dnav/ng/ng_pri_sum_dcu_SNJ_a.htm (accessed on 8 May 2020).
  143. COMSTAT. Natural Gas Price Forecast: 2020, 2021 and Long Term to 2050. Available online: https://comstat.comesa.int/ncszerf/natural-gas-price-forecast-2020-2021-and-long-term-to-2030 (accessed on 8 May 2020).
  144. DNV GL AS. Oil and Gas Forecast to 2050: Energy Transition Outlook 2017; DNV GL AS: Høvik, Norway, 2017. [Google Scholar]
  145. U.S. Energy Information Administration. Natural Gas. Available online: https://www.eia.gov/outlooks/aeo/pdf/AEO2020%20Natural%20Gas.pdf (accessed on 8 May 2020).
  146. Carl, J.; Talbott, S. Distributed Power in the United States: Prospects and Policies; Hoover Institution Press: Stanford, CA, USA, 2013. [Google Scholar]
  147. California Council on Science and Technology. Biomethane in California Common Carrier Pipelines: Assessing Heating Value and Maximum Siloxane Specifications; California Council on Science and Technology: Sacramento, CA, USA, 2018. [Google Scholar]
  148. Lambert, M. Biogas: A Significant Contribution to Ashingtonng Gas Markets? Oxford University: Oxford, UK, 2017. [Google Scholar]
  149. Milbrandt, A.; Bush, B.; Melaina, M. Biogas and Hydrogen Systems Market Assessment; National Renewable Energy Laboratory: Golden, CO, USA, 2016.
  150. National Petroleum Council. Renewable Natural Gas for Transportation: An Overview of the Feedstock Capacity, Economics, and GHG Emission Reduction Benefits of RNG as a Low-Carbon Fuel; National Petroleum Council: Washington, DC, USA, 2012. [Google Scholar]
  151. Cooley, D.; Murray, B.; Ross, M.; Lee, M.Y.; Yeh, K. An Economic Evaluation of North Carolina’s Landfill Biogas Development Potential; Duke Nicholas Institute: Durham, NC, USA, 2013. [Google Scholar]
  152. New York Economic Development Corporation. Hunts Point Anaerobic Digestion Feasibility Study; New York Economic Development Corporation: New York, NY, USA, 2010. [Google Scholar]
  153. Summers, M.D.; Williams, D.W.; Yazdani, R.; De Long, S.K. Optimizing Biogas Production from Organic Waste through RNA/DNA Molecular Testing; California Energy Commission: Sacramento, CA, USA, 2015.
  154. Ely, C.; Williams, R.; Martynowicz, T.; Kosusko, M. Evaluating Biogas Management Technologies. Available online: https://www.biocycle.net/2016/10/24/evaluating-biogas-management-technologies/ (accessed on 11 June 2020).
  155. U.S. Energy Information Administration. Petroleum & Other Liquids. Available online: https://www.eia.gov/dnav/pet/hist/LeafHandler.ashx?n=PET&s=EMD_EPD2D_PTE_NUS_DPG&f=W (accessed on 10 May 2020).
  156. U.S. Energy Information Administration. Conversion Factors. Available online: https://www.eia.gov/outlooks/aeo/pdf/appg.pdf (accessed on 10 May 2020).
  157. U.S. Energy Information Administration. Thermal Conversion Factor Source Documentation. Available online: https://www.eia.gov/totalenergy/data/monthly/pdf/sec12_a_doc.pdf (accessed on 10 May 2020).
  158. U.S. Energy Information Administration. Petroleum & Other Liquids. Gasoline and Diesel Fuel Update. Available online: https://www.eia.gov/petroleum/gasdiesel/ (accessed on 10 May 2020).
  159. U.S. Energy Information Administration. Electricity. Available online: https://www.eia.gov/outlooks/aeo/pdf/AEO2020%20Electricity.pdf (accessed on 10 May 2020).
  160. Energy STAR. Energy STAR Building Manual. 11. Facility Type: Supermarkets and Grocery Stores. Revised January 2008; Energy STAR: Charlotte, NC, USA, 2008. [Google Scholar]
  161. DSO Electric Cooperative. Managing Energy Costs in Grocery Stores; DSO Electric Cooperative: Solomon, KS, USA, 2004. [Google Scholar]
  162. Rosales-Asensio, E.; de Simón-Martín, M.; Rosales, A.-E.; Colmenar-Santos, A. Solar-plus-storage benefits for end-users placed at radial and meshed grids: An economic and resiliency analysis. Int. J. Electr. Power Energy Syst. 2021, 128, 106675. [Google Scholar] [CrossRef]
  163. Generac. MD500, 15.2 L, 500 kW: Industrial Diesel Generator Set; Generac Power Systems: Waukesha, WI, USA, 2019. [Google Scholar]
  164. Generac. MG500, 25.8 L, 500 kW: Industrial Spark-Ignited Generator Set; Generac Power Systems: Waukesha, WI, USA, 2019. [Google Scholar]
  165. Badea, N. Design for Micro-Combined Cooling, Heating and Power Systems; Springer: Berlin, Germany, 2015. [Google Scholar]
  166. Portland General Electric. Non-Solar Distributed Generation Market Research; Portland General Electric: Portland, OR, USA, 2015. [Google Scholar]
  167. Goldstein, L.; Hedman, B.; Knowles, D.; Freedman, S.I.; Woods, R.; Schweizer, T. Gas-Fired Distributed Energy Resource Technology Characterizations; National Renewable Energy Laboratory: Golden, CO, USA, 2003.
  168. Omogoye, O.S.; Ogundare, A.B.; Akanji, I.O. Development of a cost-effective solar/diesel independent power plant for a remote station. J. Energy 2015, 2015, 828745. [Google Scholar] [CrossRef]
  169. Powermag. Diesel Gensets Aim at the Future. Available online: https://www.powermag.com/diesel-gensets-aim-at-the-future/ (accessed on 11 May 2020).
  170. U.S. Energy Information Administration. Table 8.2. Average Tested Heat Rates by Prime Mover and Energy Source, 2008–2018. Available online: https://www.eia.gov/electricity/annual/html/epa_08_02.html (accessed on 11 May 2020).
  171. U.S. Energy Information Administration. Table A6 Approximate Heat Rates for Electricity, and Heat Content of Electricity. Available online: https://www.eia.gov/totalenergy/data/browser/index.php?tbl=TA6#/?f=A&start=1949&end=2019&charted=5-6-7-8 (accessed on 11 May 2020).
  172. U.S. Energy Information Administration. Table 8.1. Average Operating Heat Rate for Selected Energy Sources. Available online: https://www.eia.gov/electricity/annual/html/epa_08_01.html (accessed on 11 May 2020).
  173. Energy and Environmental Analysis. Advanced Microturbine System: Market Assessment; Oak Ridge National Laboratory: Washington, DC, USA, 2003.
  174. Groh, S.; Van der Straeten, J.; Lasch, B.E.; Gershenson, D.; Leal Filho, W.; Kammen, D.M. Decentralized Solutions for Developing Economies Addressing Energy Poverty through Innovation; Springer Briefs in Energy: Berlin, Germany, 2015. [Google Scholar]
  175. Oktoviano, G.; Dipti, S. Sustainable Energy Solutions for Remote Areas in the Tropics; Springer: Berlin, Germany, 2020. [Google Scholar]
  176. FERC. 2010 ISO/TRO Metrics Report, ISO New England (ISO-NE): Appendix F; Federal Energy Regulatory Commission: Washington, DC, USA, 2010.
  177. FERC. 2015 ISO/TRO Metrics Report; Federal Energy Regulatory Commission: Washington, DC, USA, 2015.
  178. Capstone Turbine Corporation. Secure Power Uninterruptible Power Solutions. Available online: https://d16a519alwszqc.cloudfront.net/_f59d74a9c2538abc9cedbf55d1d830c6/capstoneturbine/db/204/6496/file/Secure+Power+Brochure_lowres.pdf (accessed on 13 June 2020).
  179. United States General Accounting Office. Energy Markets: Additional Actions Would Help Ensure That FERC’s Oversight and Enforcement Capability Is Comprehensive and Systematic; United States General Accounting Office: Washington, DC, USA, 2003.
  180. PJM. New Jersey State Report: July 2017; PJM: Norristown, PA, USA, 2017. [Google Scholar]
  181. OpenEI. Rate Schedule GLP—General Lighting and Power Service. Available online: https://openei.org/apps/USURDB/rate/view/5d0a74865457a33e46474944 (accessed on 13 May 2020).
  182. Public Service and Gas Company. Tariff for Electric Service; Public Service Electric and Gas Company: Newark, NJ, USA, 2018. [Google Scholar]
  183. PSEG. Summary of Electric and Gas Rate Schedules: For Commercial and Industrial Customers; Public Service Electric and Gas Company: Newark, NJ, USA, 2019. [Google Scholar]
  184. State of New Jersey: Board of Public Utilities. BGS Auction. Available online: https://www.state.nj.us/bpu/about/divisions/energy/bgs.html (accessed on 13 May 2020).
  185. Interruption Cost Estimate (ICE) Calculator. Lawrence Berkeley Nationa Laboratory and Nexant, Inc. Available online: https://icecalculator.com/interruption-cost (accessed on 13 May 2020).
Figure 1. Number of electrical disturbances between 2000 and 2021 in the US. Source of data: [20].
Buildings 13 02516 g001
Figure 2. Typical annual demand profile for a one-story, 45,000 ft2 (4180 m2) supermarket found in South Amboy, New Jersey. Source: adapted from [137,138,139,140].
Buildings 13 02516 g002
Figure 3. Fuel consumption for modeled generators. Source: adapted from [163,164,165,166,167].
Buildings 13 02516 g003
Figure 4. System performance for a diesel engine as a storage-free dispatchable solution for critical power supply. Source: own elaboration.
Buildings 13 02516 g004
Figure 5. Net load duration for a diesel engine as a storage-free dispatchable solution for critical power supply. Source: own elaboration.
Buildings 13 02516 g005
Figure 6. Outage simulation for a diesel engine as a storage-free dispatchable solution for critical power supply. Source: own elaboration.
Buildings 13 02516 g006
Figure 7. Resilience costs and benefits for a diesel engine as a storage-free dispatchable solution for critical power supply. Source: own elaboration.
Buildings 13 02516 g007
Figure 8. Resilience costs and benefits for a natural gas engine as a storage-free dispatchable solution for critical power supply. Source: own elaboration.
Buildings 13 02516 g008
Figure 9. Resilience costs and benefits for an effective biomethane microturbine as a storage-free dispatchable solution for critical power supply. Source: own elaboration.
Buildings 13 02516 g009
Table 1. Power outages, natural gas interruptions, and percentage of coinciding interruptions for several events in the US. Source: adapted from [89,94,95,96,97,98,99,100,101,102].
EventYearPower Outages (Total Number of Users)Natural Gas Interruptions (Total Number of Users)Percentage of Coinciding Interruptions
California wildfires 2003 [94]200358,700 [99]1000 [99]1.70%
February 2011 Southwest Cold Weather Event [95]20114,400,000 [100]50,000 [100]1.13%
Hurricane Sandy (New Jersey) [96]20122,615,291 [101,102]32,000 [101,102]1.22%
Hurricane Sandy (New York) [96]20122,097,933 [101,102]80,000 [101]3.06%
California wildfires 2017 (San Diego Gas & Electric Company) [97]201785,000 [89]4800 [89]5.65%
California wildfires 2017 (Pacific Gas and Electric Company) [98]2017359,000 [89]42,000 [89]11.70%
Table 2. Estimates of system failure rates. Source: adapted from [40,68,89,94,95,96,97,98,99,100,101,102,103].
Type of FailureReference EstimateLower RangeUpper Range
Failure to start (standby demand) [68]0.67%0.33%1.48%
Failure to start (load demand) [68]0.15%0.08%0.3%
Failure to run (standby demand) [68]0.172%0.086%0.346%
Failure to run (load demand) [68]0.086%0.043%0.173%
Diesel fuel supply [40,103]36 h18 h72 h
Fuel supply failure (natural gas long-duration) [89,94,95,96,97,98,99,100,101,102]1.5%0.75%3%
Table 3. Peak demands for the modeled supermarket. Source: adapted from [137,138,139,140].
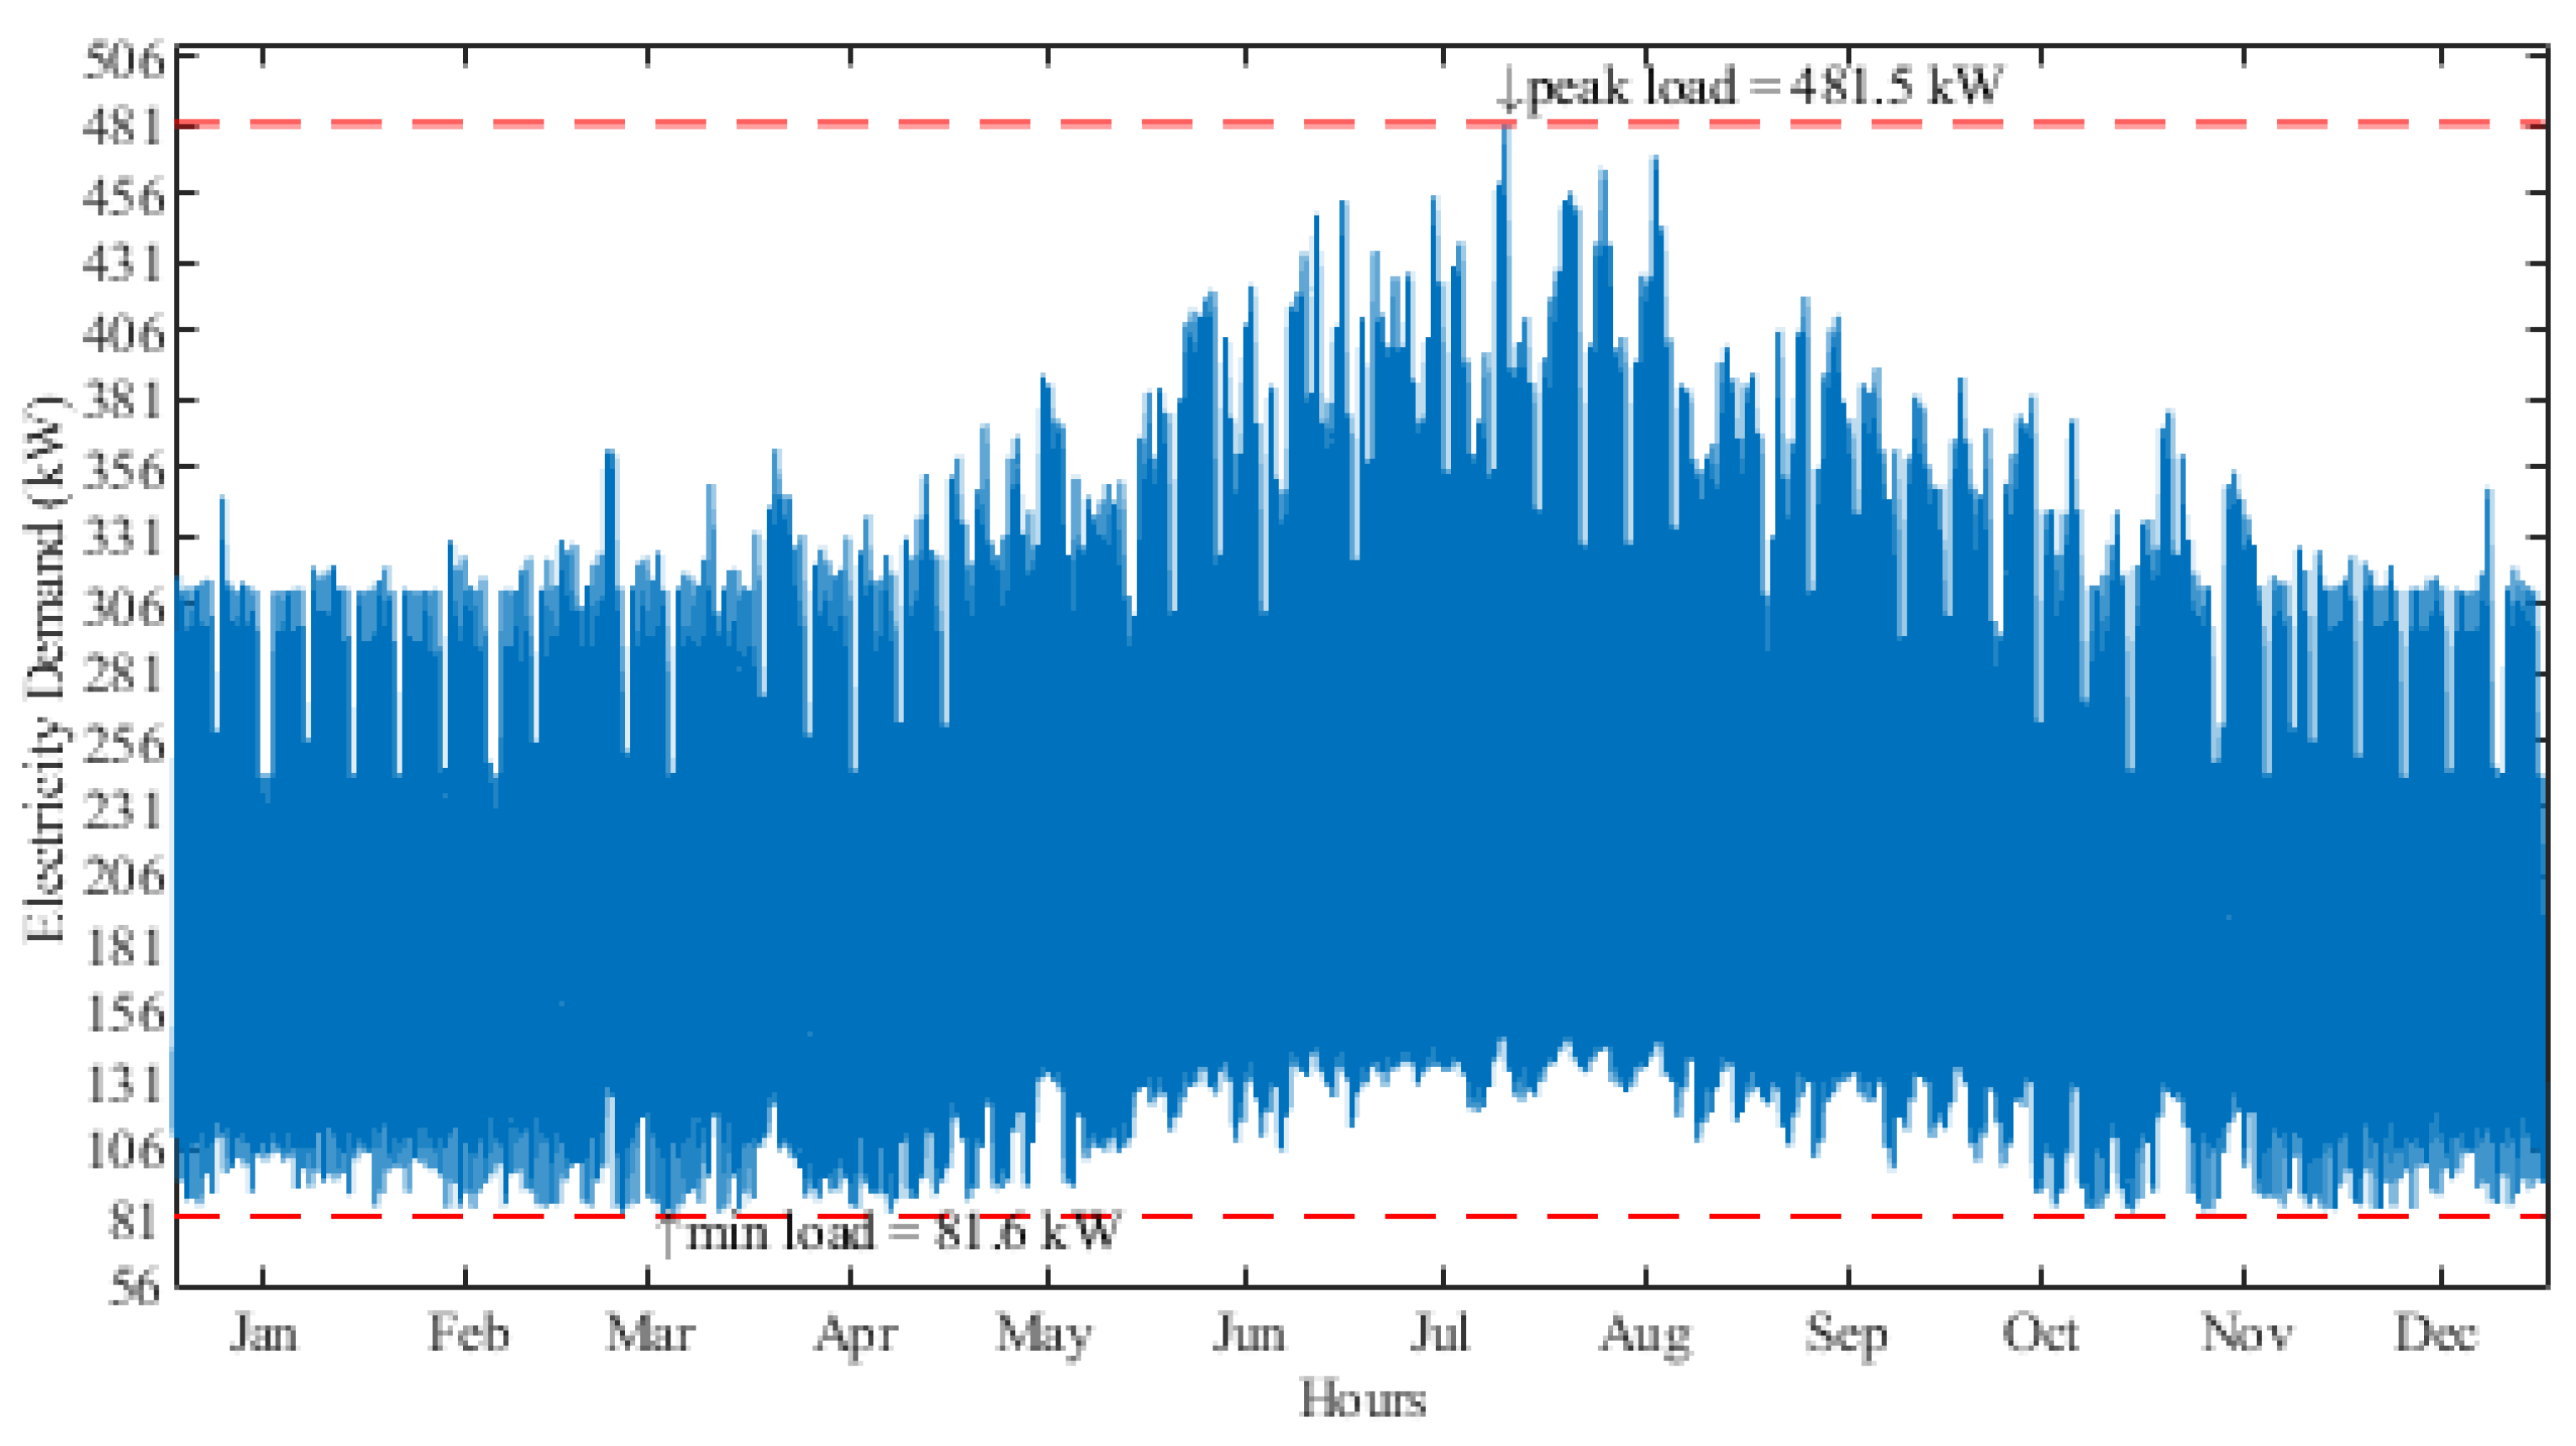
Monthly Peak Demand (kW)
Month
January344.89
February322.55
March362.03
April356.71
May389.22
June453.46
July481.46
August469.61
September415.77
October387.56
November375.90
December348.00
TOTAL ENERGY (kWh)2,018,760
AVERAGE LOAD (kW)230.45
MAXIMUM ANNUAL PEAK DEMAND (kW)481.46
Table 4. Capital, running, and maintenance costs for a 350 to 500 kW rated generator. Source: adapted from [119,121,124].
Generator TypeDGNGGBMT
Fixed, one-time expenses incurred on the purchase (USD/kW) [119,124]2647921185
Operation and maintenance costs (USD/kW/year) [121]20308
Annual increase in maintenance costs2%2%2%
Table 5. Variations in fuel costs and electricity tariffs. Source: adapted from [141,142,143,144,145,146,147,148,149,150,151,152,153,154,155,156,157,158,159].
Variation in Fuel Costs and Electricity Tariffs
Cost of natural gas (USD/kWh), Year 0 [141,142,143,144,145]753.2
Cost of biomethane (USD/kWh), Year 0 [146,147,148,149,150,151,152,153,154]2840
Cost of diesel (USD/kWh), Year 0 [155,156,157]5504
Cost of diesel (USD/gallon), Year 0 [155]11.73
Cost of electricityVariable according to tariff
Annual increase in the cost of natural gas [143,144,145]2.2%
Annual increase in the cost of biomethane [146]2.5%
Annual increase in the cost of diesel [158]1.3%
Annual increase in the cost of electricity [159]−0.15%
Table 6. Fuel consumption for a 500 kW rated emergency power system depending on load percentage. Source: adapted from [163,164,165,166,167].
Generator TypeDiesel (l/h) [163]Diesel (US Gallon/h)Diesel
(kW)
Natural Gas (m3/h) [164]Natural Gas (kW)Biomethane Microturbine
(l/h)
Biomethane Microturbine
(kW)
[165,166,167]
Percentage of load at 25%42.2811.17454.2672747.3344.74480.64
Percentage of load at 50%66.2817.51712.161031069.7189.22958.34
Percentage of load at 75%91.4224.15981.791351397.95133.931438.98
Percentage load at 100%121.1332.001301.241661720.33178.671919.62
Table 7. Total discounted expenses per unit of kWh produced. Source: adapted from [119,168,169,170,171,172,173,174,175,176].
Generator TypeDiesel EngineNatural Gas EngineBiomethane Microturbine
Plant size (MW)0.35 to 0.50.35 to 0.50.35 to 0.5
Fuel cost (USD/kWh)5504753.22840
Amount of thermal energy needed to generate one electrical kWh (heat rate) [170,171,172,173]3.082.643.27
Fixed operation and maintenance costs (USD/kW-y)20308
Variable operation and maintenance costs (USD/kW-y)000
Costs necessary for the construction of the plant without considering interest rates2647921185
Interest rate [119,174,175]8.3%8.3%8.3%
Mortgage period (years)202020
Table 8. Weighted average availability by resource category, ISO-NE, 2010–2013. Source: adapted from [176,177,178].
Year2010201120122013
Diesel reliability (%)93.393.292.293.5
Natural gas reliability (%)
Difference (taking diesel engine reliability as a reference) (%)
95.8
+2.5
95.9
+2.7
96.1
+3.9
96.4
+2.9
Biomethane microturbines (%)
(Set of 7 microturbines working in an emergency backup mode)
Difference (taking diesel engine reliability as a reference) (%)
99.9
+6.6
99.9
+6.7
99.9
+7.2
99.9
+6.4
Disclaimer/Publisher’s Note: The statements, opinions and data contained in all publications are solely those of the individual author(s) and contributor(s) and not of MDPI and/or the editor(s). MDPI and/or the editor(s) disclaim responsibility for any injury to people or property resulting from any ideas, methods, instructions or products referred to in the content.

