Article

The Influence of Excitation Method on the Strength of Glass Powder High-Strength Cementitious Materials

College of Architecture and Environment, Sichuan University, Chengdu 610065, China
*
Author to whom correspondence should be addressed.
Buildings 2024, 14(3), 569; https://doi.org/10.3390/buildings14030569
Submission received: 27 January 2024 / Revised: 13 February 2024 / Accepted: 18 February 2024 / Published: 21 February 2024

Abstract

:
Recycling economy and the re-utilization of solid waste have become important parts of sustainable development strategy. To improve the utilization rate of waste glass, glass powder high-strength cementitious material (GHSC) was prepared by replacing part of the cement in the cementitious material with ground waste glass powder. Firstly, the effect of glass powder particle size on the flexural and compressive strength of GHSC was investigated by the gray correlation method, and the optimal grinding time was obtained. Additionally, the effect of the magnitude of steam curing temperature and the length of steam curing time on the compressive strength and flexural strength of GHSC was investigated, and the mechanism of the effect of the curing regime on the strength was explored by examination of the microstructure. Finally, to simplify the curing process of GHSC, the effects of Ca(OH)2 and Na2SO4 as excitation agents on the compressive strength and flexural strength of GHSC at different dosing levels were compared. The results showed that glass powder with a particle size of less than 20 μm would improve the compressive strength and flexural strength of the specimen. Steam curing can significantly improve the flexural strength and compressive strength of GHSC specimens. At a steam curing temperature of 90 °C for a duration of three days, the compressive strength and flexural strength of GHSC increased by 76.7% and 98.2%, respectively, compared with the standard curing specimens. Ca(OH)2 and Na2SO4 as excitation agents significantly enhanced the compressive and flexural strengths of GHSC under standard curing conditions.

1. Introduction

Effective from 1 September 2020, the “Solid Waste Pollution Prevention and Control Law of the People’s Republic of China” emphasizes the advancement of construction waste management through segregation, treatment, recycling, and holistic process control. Waste glass, a significant component of construction waste, poses a critical challenge in terms of disposal and recycling. Owing to its exceptionally low water absorption rate, robust durability, and hardness comparable to natural sand and gravel, numerous scholars have investigated the use of waste glass aggregates of varied particle sizes. These studies involve substituting conventional coarse [1,2] and fine [2,3,4] aggregates in concrete with recycled glass aggregates to examine the mechanical properties of the resulting recycled concrete and to determine the most effective replacement ratios for waste glass [5]. This research lays a foundational basis for the integrated recycling and utilization of waste glass in construction.
Research [6] has identified a risk of alkali-silica reaction when using waste glass as a recycled glass aggregate in concrete, leading to concerns about its safe incorporation. However, a study by Guo et al. [7] shows that reducing waste glass to a finer glass powder and incorporating it as a supplementary cementitious material in concrete mitigates this reaction with the cement base. Furthermore, a key factor in triggering the alkali-silica reaction in waste glass is the presence of ample water [8]. Since the preparation process of High-Strength Cementitious material (HSC) uses less water and contains more active ingredients [9,10], if waste glass powder is regarded as an active ingredient, replacing part of the cement in the preparation of concrete can further reduce the possibility of alkali-silicic acid reaction after the introduction of glass powder [11]. It can be seen that the application of fine glass powder in high-strength concrete has a large potential for development.
Conversely, glass powders with a particle size below 75 μm, despite their inherent pozzolanic properties [12], have been observed to significantly reduce the early-stage strength of concrete when used as a partial cement replacement [8]. This suggests a lower initial reactivity of the glass powder. To address this, researchers have explored various methods to enhance its early pozzolanic activity [13]. Khan et al. [14] produced recycled glass powder foam concrete with varying particle sizes, finding that a greater proportion of particles under 45 μm improved the bonding with the cement matrix. Studies by Kashani et al. [15] and Pranshoo et al. [16] confirmed that smaller glass powder particles exhibit higher activity, as explained through microstructural analyses. From a chemical standpoint, Song [13] investigated activating agents in cement mortars with waste glass powder, discovering that sodium sulfate outperformed slaked lime in stimulating glass powder activity. Liu et al. [17] analyzed the effect of different curing temperatures on the hydration of glass powder in cement, showing that higher temperatures enhance both cement hydration and glass powder activity. However, it remains unclear whether these methods to enhance pozzolanic activity are as effective in high-strength cementitious material (HSC), which contains abundant active ingredients and has lower concentrations of Ca2+ and Ca(OH)2, leading to a distinct hydration profile compared to conventional concrete.
Considering these aspects, the current study employs glass powder as a supplementary cementitious material, substituting it for a portion of cement in the fabrication of Glass Powder High-Strength Cementitious material (GHSC). The investigation prioritizes mechanical properties as key performance indicators, examining how grinding duration, curing temperature, and curing duration influence GHSC’s mechanical characteristics. Additionally, to streamline the curing procedure, this study also conducts experimental analysis on the impact of different types and amounts of activators on GHSC’s mechanical properties. This research aims to underpin the efficient recycling and application of glass powder in cementitious materials, contributing to more sustainable construction practices.

2. Experimental

2.1. Raw Materials

The cement was P-O 42.5R cement; the fly ash was grade I ultrafine fly ash produced by Henan Rongchangsheng Water Purification Material Factory; the fine aggregate was natural river sand sieved through a 0.5 mm mesh, with an average particle size of 322 µm and an apparent density of 2.65 g/cm3; and the silica fume was provided by Henan Hengwang Chemical Building Materials Co. The particle size distribution curve of the above materials is shown in Figure 1. The glass type is tempered flat glass, which comes from a waste collection station; the superplasticizer is Shanghai Qinhe polycarboxylic superplasticizer, with a water-reducing rate of 23%. The chemical components of the cementitious materials are shown in Table 1.

2.2. Preparation of Glass Powders of Different Finenesses

Waste glass, after cleaning, drying, and crushing, was passed through a 0.5 mm standard sieve. Glass particles of size less than 0.5 mm were washed and dried, then put into a WZM-type horizontal ball mill for ball milling. Milling times of 4 h, 8 h, 16 h, and 24 h produced ground glass powder of varying dimensions. The apparent morphology of the waste glass after milling is shown in Figure 2.

2.3. Test Program

2.3.1. Baseline Mixing Ratios and Specimen Production Methods

According to the results of the group’s previous tests, the baseline mixing ratio is shown in Table 2, in which the quantity of superplasticizer is determined according to the binding material. Cement accounts for 55% of the total mass of binding material, glass powder accounts for 20% of the total mass of binding material, silica fume accounts for 20% of the total mass of binding material, fly ash accounts for 5% of the total mass of binding material, the sand binder ratio is 0.7, the water binder ratio is 0.18, and the superplasticizer accounts for 2% of the total mass of binding material. The raw materials were weighed according to the mixing ratio then added to the mixer for a first dry mixing lasting 3 min, after which we added the superplasticizer and water and continued to mix for 5 min, mixing uniformly in two layers into 40 mm × 40 mm × 160 mm cement sand molds, then molded by vibration for 120 s on a vibration table at a vibration frequency of 50 Hz. Six samples were tested at each point during the compressive strength test. Three samples were tested at each point during the flexural strength test. The compression surface size was 40 × 40 mm2 during the compressive strength test.
The surface of the molded specimen was covered with a layer of plastic film and numbered, put into a standard concrete curing box for 24 h, and then demolded and moved into a rapid concrete curing box. The specimens were then subjected to steam curing at 90 °C for 72 h. After removal, the specimens were transferred to a standard concrete curing box to continue curing until the age of the specimens was 7 d. Finally, once the specimens had reached the age for flexural and compressive strength testing according to GB/T 17671-1999 [18], they were tested.
The loading rate for compressive strength testing was 2.4 kN/s. The loading rate for flexural strength testing was 0.05 kN/s.

2.3.2. Effect of Grinding Time on GHSC Strength

Glass powder with grinding times of 4 h, 8 h, 16 h, and 24 h was used for specimen preparation. The mix ratio used for the test was the benchmark mix ratio shown in Table 2, and the test was started when the specimens had cured for 7 d.

2.3.3. Effect of Curing Temperature on GHSC Strength

The test mix ratio was the base mix ratio indicated in Table 2, the curing temperature and curing method are displayed in Table 3, and the curing age of every test specimen was 7 days.

2.3.4. Effect of Curing Time on GHSC Strength

The test mix ratio was the benchmark mix ratio displayed in Table 2, and Table 4 displays the steam curing temperature and time. Each specimen had a curing age of 7 days.

2.3.5. Effect of Activator on GHSC Strength

The activators used were Ca(OH)2 and Na2SO4. The percentage of activator dosing was calculated based on the glass powder quality. Table 5 displays the specimen baseline mixing ratios and curing procedures, and the base baseline mixing ratio was consistent with the description in Table 2. Standard curing procedures were used, and tests of compressive and flexural strength were conducted after a curing time of 7 days.

3. Gray Correlation Analysis Method

Gray correlation analysis is an analytical method based on the geometric proximity of a sequence of behavioral factors at the micro or macro level which aims to analyze and determine the degree of influence between the factors, or the degree of contribution of the factors to the main behavior. It is capable of discovering the interrelationships between the factors in the system and comparing the degree of influence of different factors on the target value, so as to find the most dominant factor in each variable. Gray correlation analysis does not require a high sample size, and the analysis results are also consistent with qualitative analysis, which is widely practical. The analysis process is as follows: m time series are used to represent m influencing factors respectively, as shown in Equation (1):
{ x 1 ( 0 ) ( k ) } , k = 1 , 2 , , N 1 ;   { x 2 ( 0 ) ( k ) } , k = 1 , 2 , , N 2 ;   { x m ( 0 ) ( k ) } , k = 1 , 2 , , N m
N1, N2, and N3 all belong to the set of natural numbers and are not necessarily equal. The time series { x 0 ( k ) } , k = 1 , 2 , , N 0 is called the parent sequence. The corresponding { x i ( 0 ) ( k ) } , k = 1 , 2 , , N m is called the subsequence. The correlation coefficient of the subsequence to the parent sequence at time k can be defined as Equation (2):
ξ 0 i ( k ) = min i min k | x 0 ( k ) x i ( k ) | + ρ max i max k | x 0 ( k ) x i ( k ) | | x 0 ( k ) x i ( k ) | + ρ max i max k | x 0 ( k ) x i ( k ) |
where ρ is the discrimination coefficient, which serves to increase the significance of the difference between the correlation coefficients, and is generally taken as 0.5.
The correlation degree of the parent sequence to the subsequence is r 0 i ( k ) = 1 N k = 1 N ξ 0 i ( k ) . Since Δ i ( k ) = | x 0 ( k ) x i ( k ) | is used in the calculation ξ 0 i ( k ) , it is not possible to distinguish whether the factors are positively or negatively correlated, so we have to use the following correlation polarity determination method, as shown in (3) and (4):
σ i = i = 1 N x i ( k ) k i = 1 N x i ( k ) i = 1 N k n
σ k = i = 1 N k 2 1 n ( k = 1 N k ) 2
where n is the sample size of x i ( k ) . If sgn ( σ i σ k ) = sgn ( σ j σ k ) , then xi and xj are positively correlated; if sgn ( σ i σ k ) = sgn ( σ j σ k ) , then xi and xj are negatively correlated.
Correlation is a measure of the polarity of the association between factors, and the greater its value, the greater the correlation between the subsequence and the parent sequence. A positive correlation indicates that the subsequence enhances the parent sequence; a negative correlation indicates that the subsequence weakens the parent sequence.

4. Results and Discussion

4.1. Correlation Analysis between Particle Size and Strength of Glass Powder

The results of compressive and flexural strength tests of GHSC after 7 d were used as the parent series to categorize the particle range of glass powders into seven intervals of <5 µm, 5–10 µm, 10–20 µm, 20–30 µm, 30–40 µm, 40–50 µm, and >50 µm, and the particle size distributions of glass powders in the corresponding groups were used as the subsequences. Table 6 displays the compressive and flexural strengths of the corresponding GHSC along with the particle size distributions of glass powders with varying ball milling times; Table 7 displays the outcomes following homogenization and dimensionless processing of the parent and subsequences; and Table 8 displays the outcomes of the gray correlation computations.
From Table 8, it can be seen that the 7 d compressive and flexural strengths of GHSC are correlated with the distribution of glass powder particle sizes. They are positively correlated with strength when the particle sizes of the glass powder particles are <5 µm, 5–10 µm, and 10–20 µm, and negatively correlated with strength when the particle sizes of the glass powder particles are 20–30 µm, 30–40 µm, 40–50 µm, and >50 µm. This indicates that glass powder particles with particle size less than 20 µm promote both the compressive and flexural strengths of the specimens, while particles with particle size greater than 20 µm weaken both the compressive and flexural strengths of the specimens. Furthermore, an ordered pattern can be seen in the correlations of the coefficients, where the largest contribution to strength was made by glass powder particles smaller than 5 µm, followed by those between 5 and 10 µm, and glass powder particle size of 10–20 µm still contributes to the strength increase, but to a much lesser extent. The strength of the specimens is weakened by the remaining four glass powder particle size intervals when the glass powder particle size surpasses 20 µm. This can be explained from both a physical and a chemical perspective. From a physical perspective, the stronger the cementitious material, the more compact the stacking of the particles, as Table 6 illustrates, and the longer the ball milling time, the smaller the particle size of the glass powder particles, though the effect on the particle size of glass powder from 5 to 10 µm is not significant. Peng et al. [19] concluded that glass powder particle sizes less than 5 µm are favorable for the realization of the closest stacking. The distribution of glass powder particle sizes at various grinding times in this experiment is depicted in Figure 3, from which it is clear that at 24 h of ball milling, the proportion of glass powder particles with a size smaller than 5 µm increases significantly, improving the compactness of the inter-particle stacking. From a chemical perspective, this is because the smaller particle size of the glass powder has a larger surface area, providing more positions for the reaction, leading to a higher reaction activity, which is consistent with the findings of Fan Lei et al.’s research [20]. Furthermore, Mirzahosseini et al. [21] analyzed the heat of hydration and showed that the heat of hydration of glass powders from 25 to 75 μm incorporated into concrete is similar and lower compared to the heat of hydration of glass powders < 25 μm, indicating that larger glass powder particles have very low activity in the early stage.
From the analysis above, it is evident that using glass powder with a particle size of less than 20 µm to replace cement can increase specimen strength. Within this range, the smaller the particle size of the glass powder, the more significant the enhancement in strength, suggesting that fine grinding effectively boosts GHSC’s mechanical strength. Furthermore, it is recommended to limit and minimize the quantity of glass powder that has a particle size larger than 20 µm. In conclusion, the glass powders used in the subsequent experiments of this study were ball-milled for 24 h.

4.2. Effect of Curing Regime on GHSC Strength

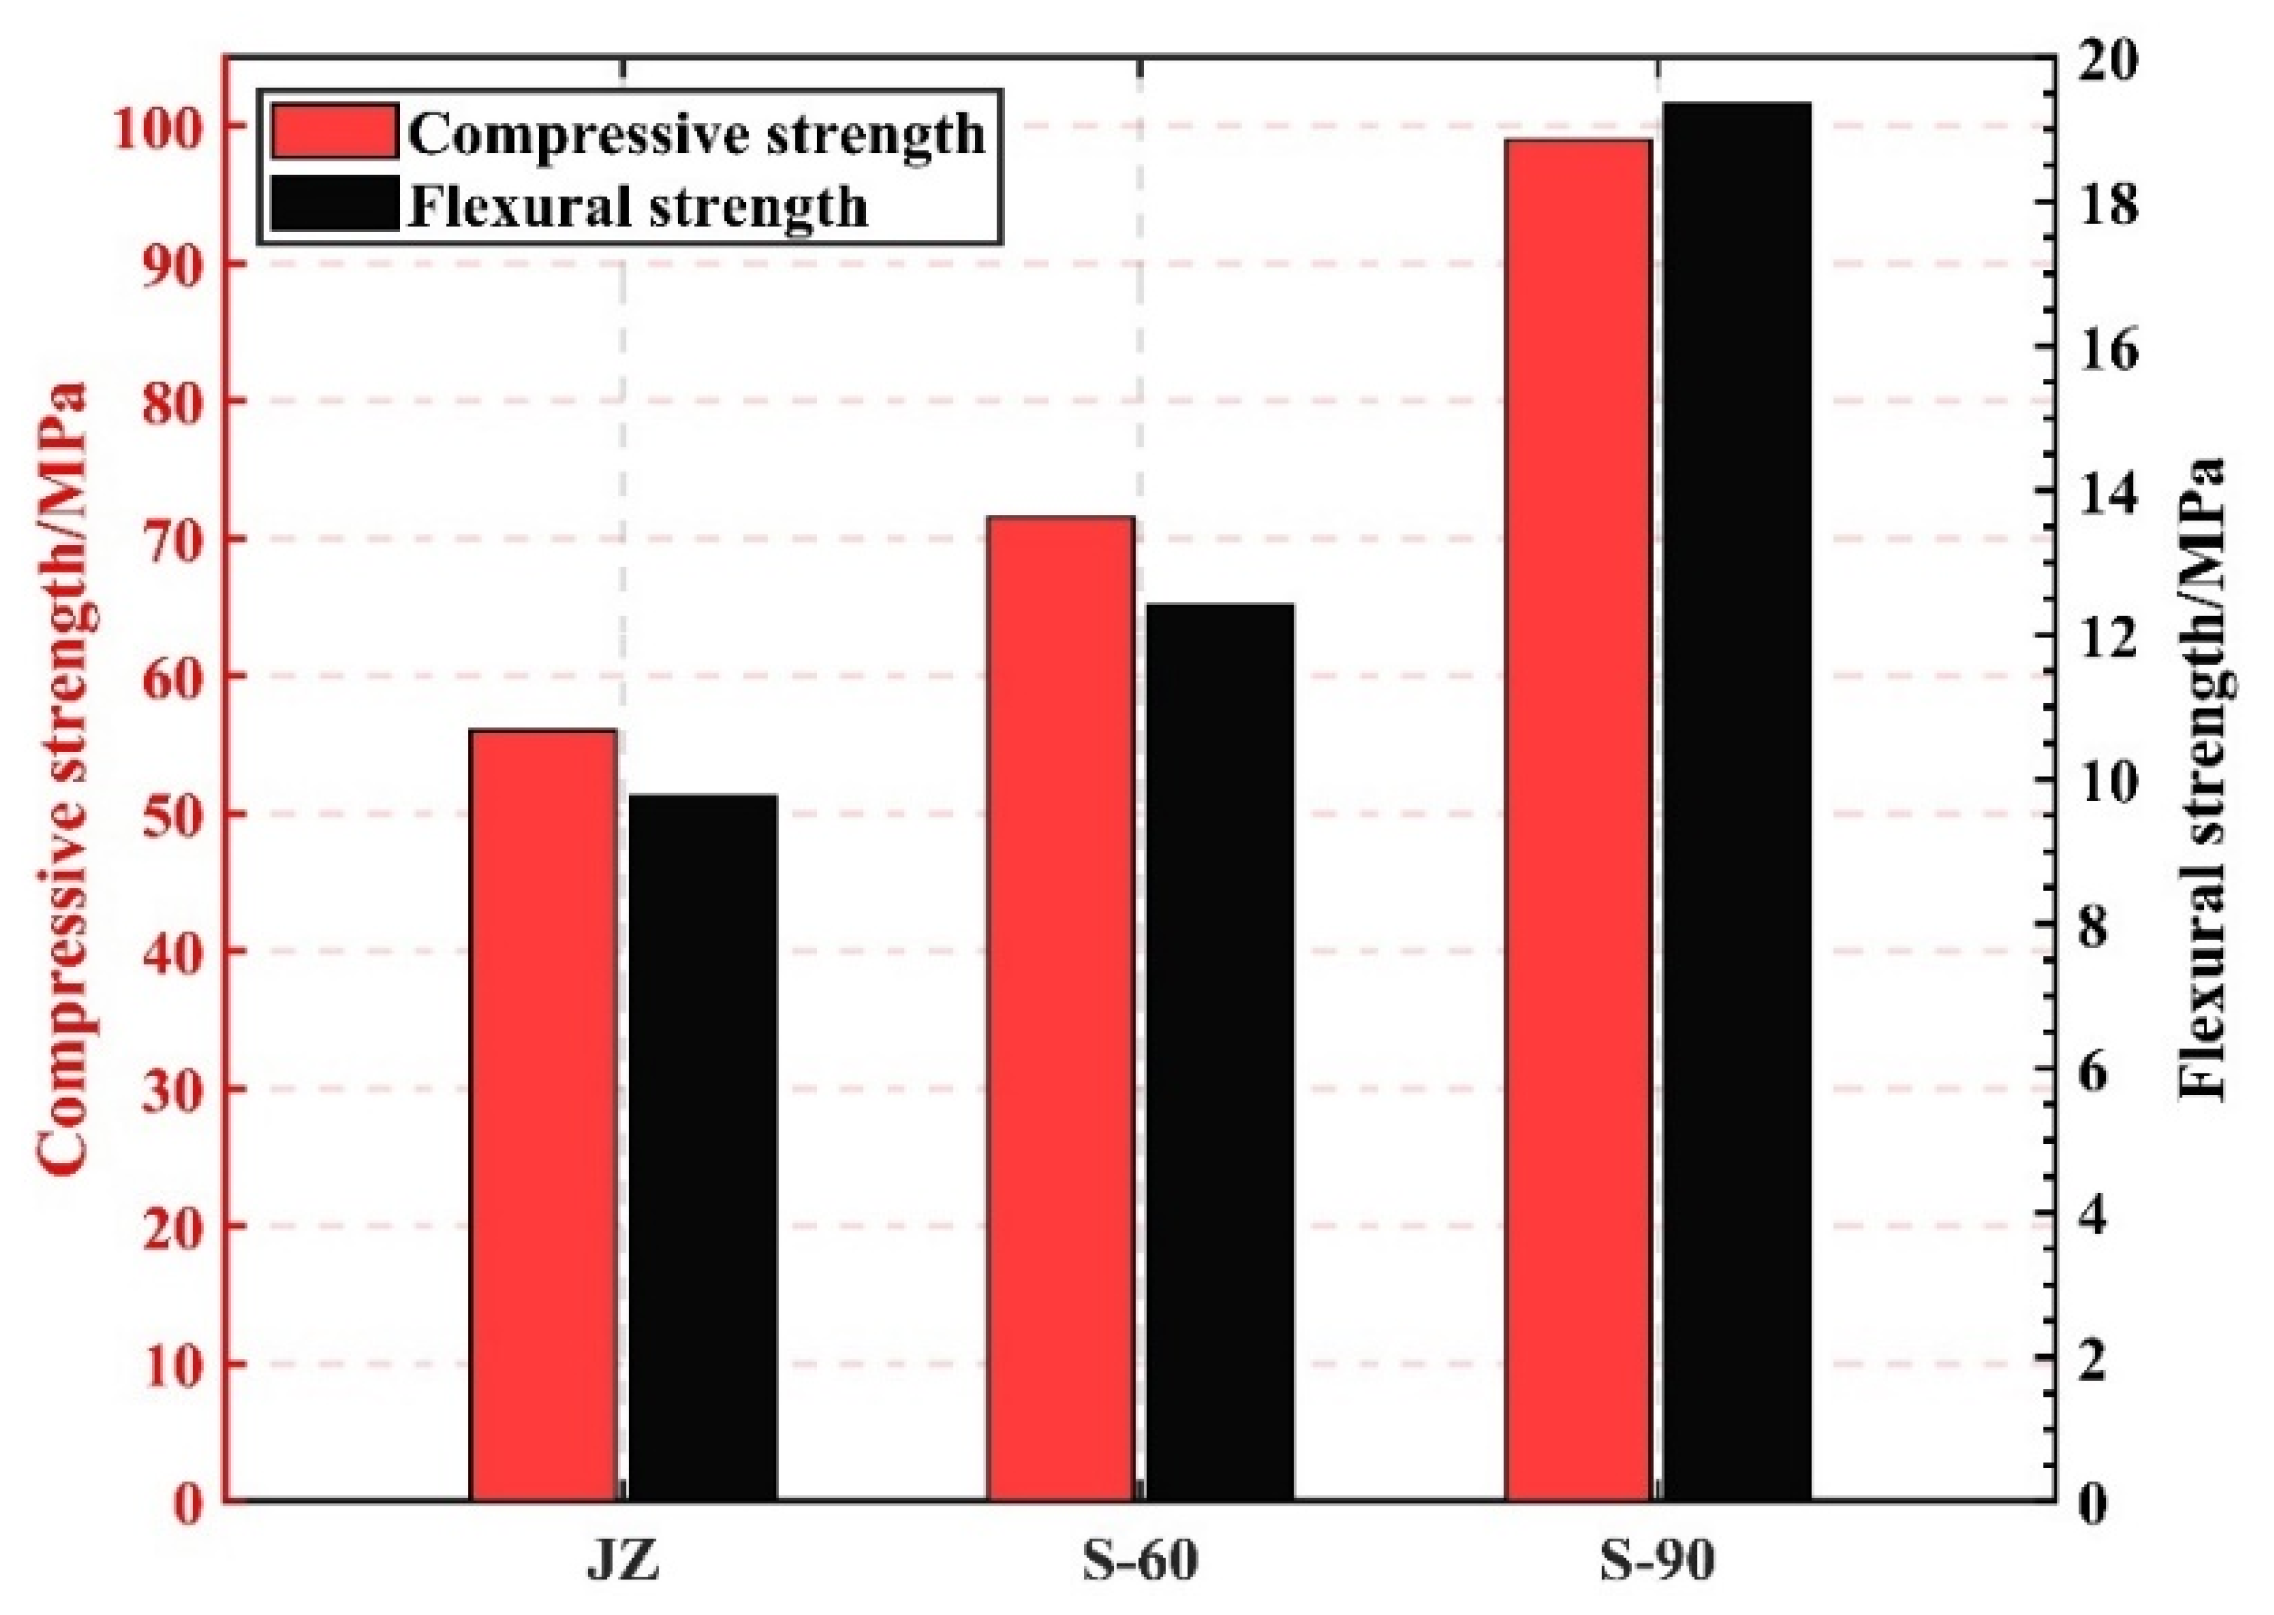
4.2.1. Curing Temperature
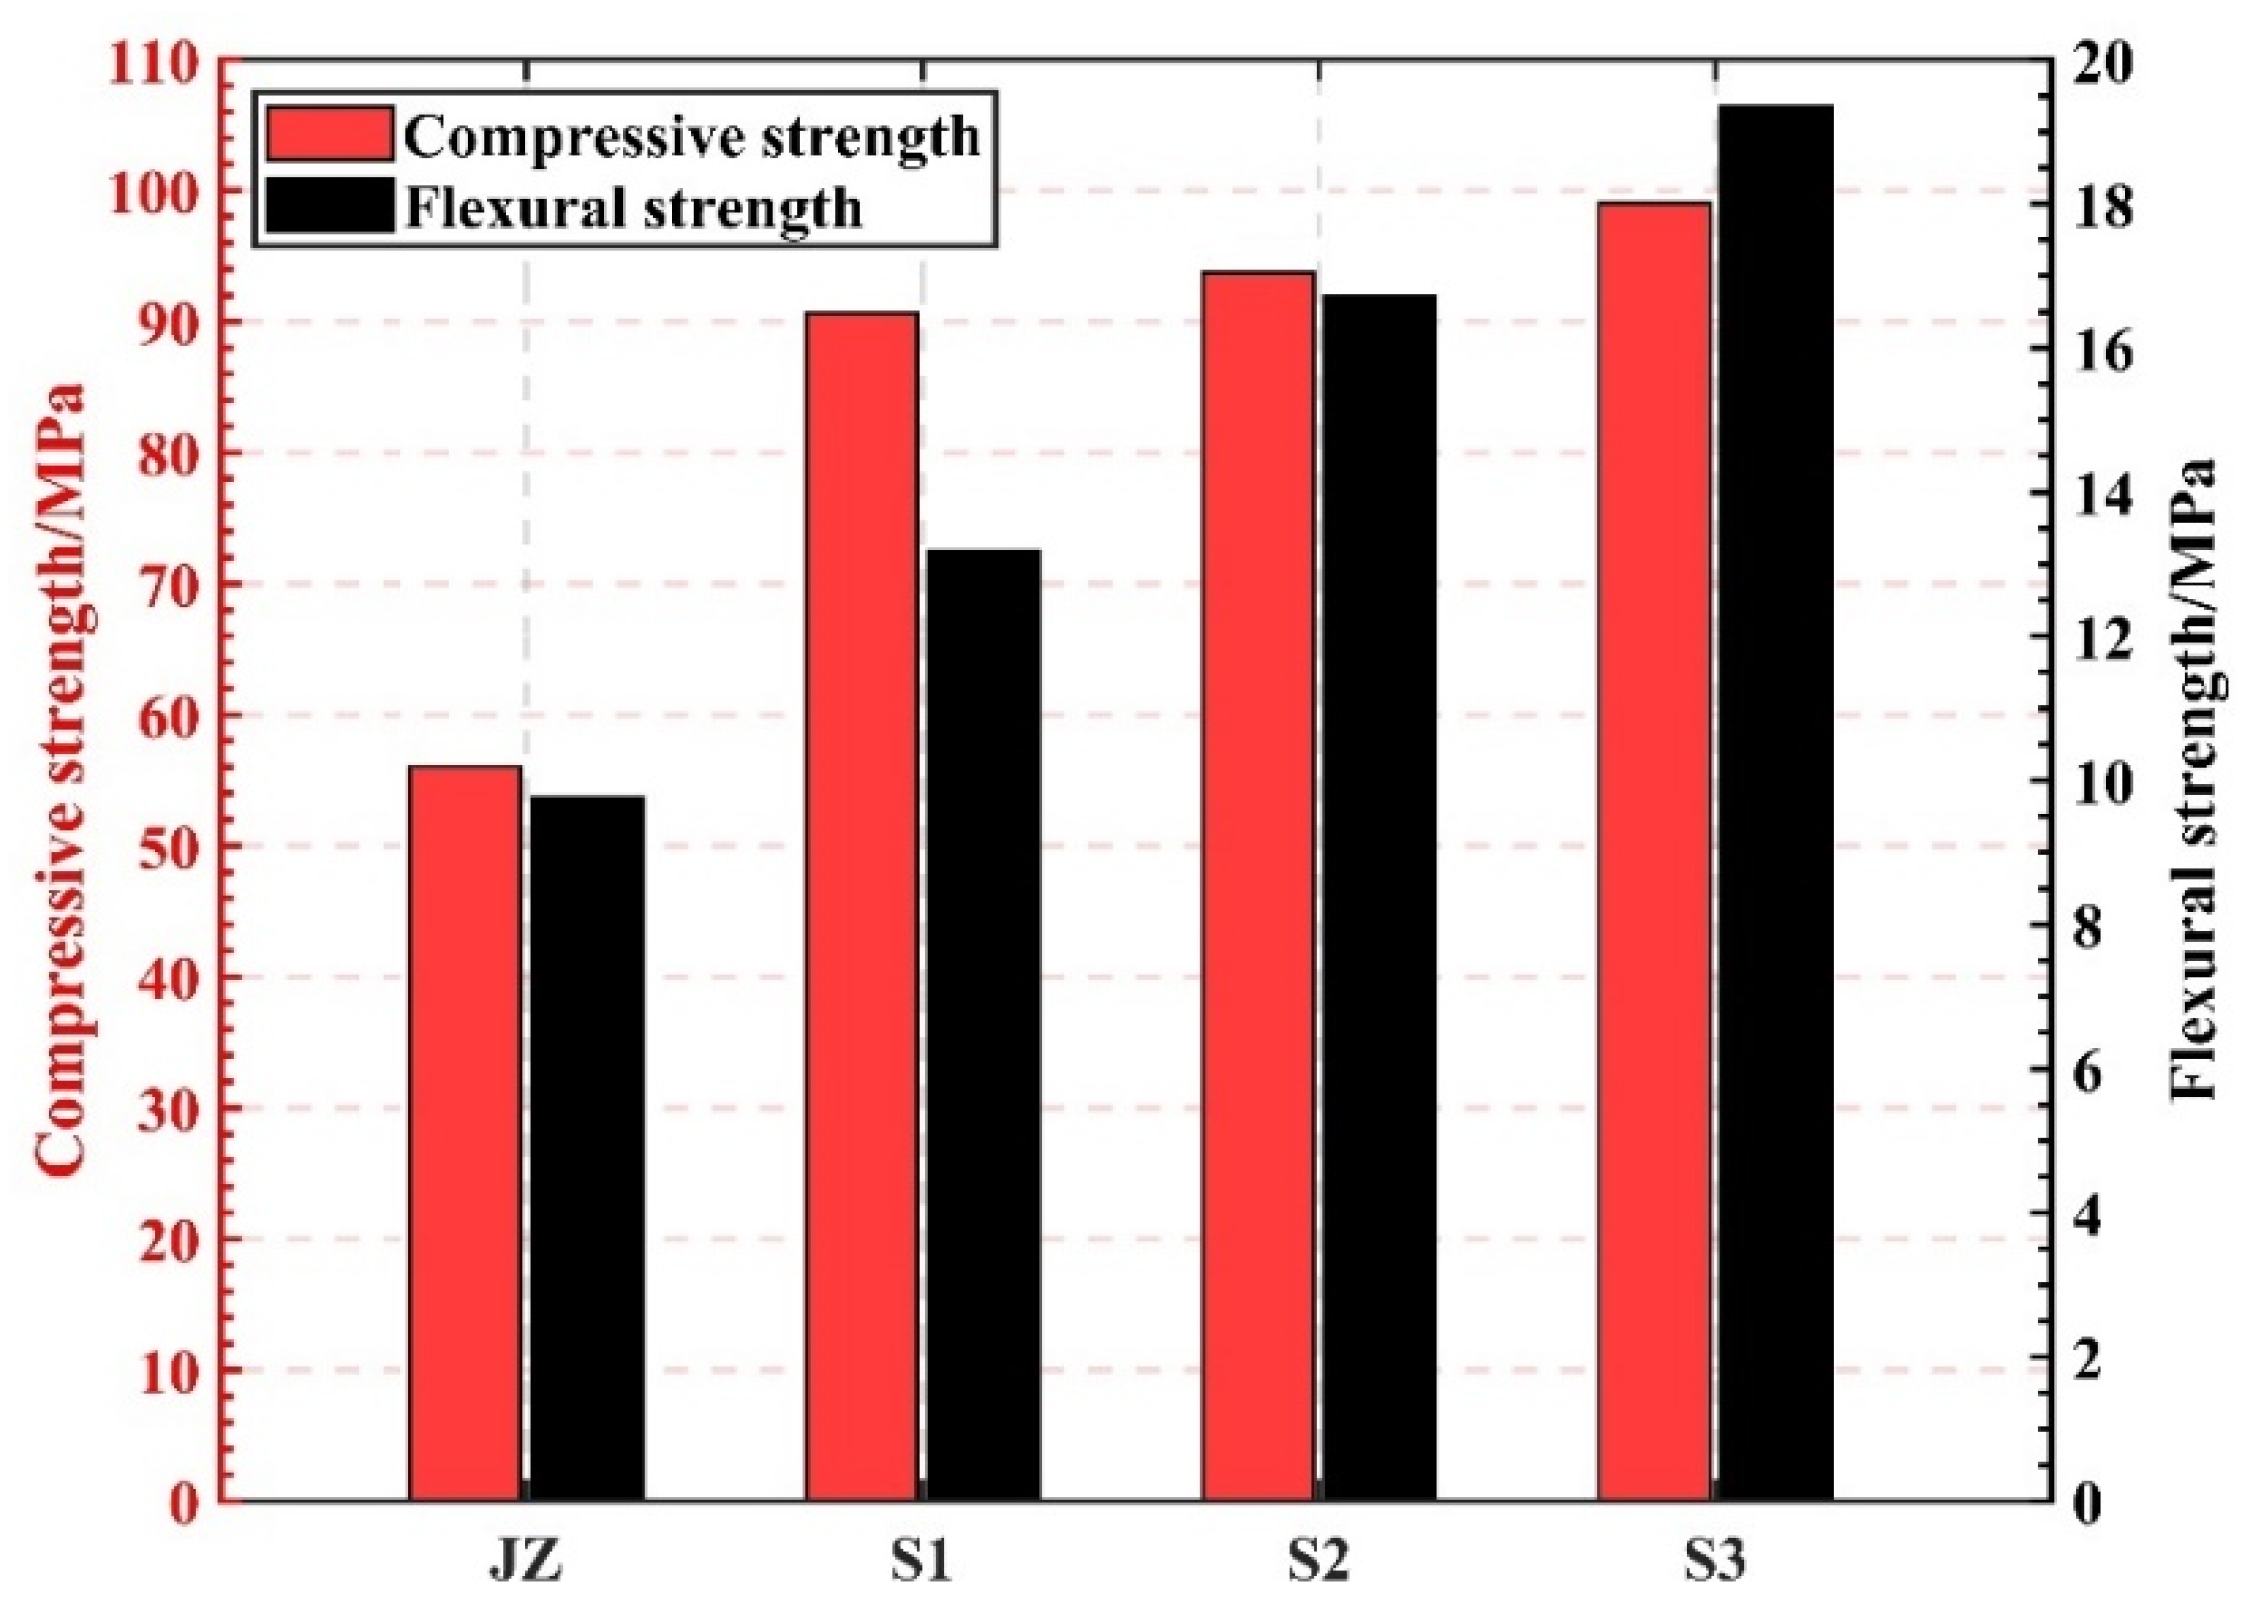
It is evident from Figure 4 that varying the steam curing temperature can boost the strength of GHSC. In addition, the compressive and flexural strengths of the specimens increased the most when the curing temperature was 90 °C. Compared with the specimens with a curing temperature of 60 °C, the compressive and flexural strengths of the specimens increased by 38.3% and 55.8%, respectively, which shows that the growth of the GHSC strengths increased with increasing curing temperature. This is because, on the one hand, a rise in the curing temperature quickens the cement’s rate of hydration and reduces the amount of time needed for the cement to harden latently [22]; on the other hand, a higher curing temperature stimulates the active components inside the specimen and improves the degree of cement hydration [23]. These two factors account for the majority of the notable strength gain. It is important to remember that a higher specimen curing temperature does not necessarily translate into a higher specimen strength. Research has demonstrated [24] that when a specimen curing temperature is too high, the specimen’s early hydration rate is too fast, which will result in an uneven distribution of hydration products as well as an excess of hydration products, and densification uniformity is poor inside the specimen, which will impede the improvement of the specimen’s later strength.

4.2.2. Curing Time

The impact of steam curing time on GHSC strength is depicted in Figure 5. As demonstrated in Figure 5, steam curing greatly increased the GHSC’s compressive and flexural strengths. Specifically, the flexural strength increased linearly with the extension of curing time, while the compressive strength increased slightly but not significantly. This could be because the specimen’s active component can more fully exert its volcanic ash activity when the steam curing time is extended. Additionally, the gel created by the concrete’s secondary hydration fills the pores inside of the specimen, increasing the specimen’s strength [25,26,27]. However, longer high-temperature steam curing time is not favorable for strength improvement; Zhao et al. [28] showed that high-temperature steam curing time that is too long will lead to the slowing down of the hydration rate, and the hydration of cement clinker in the matrix tends to be stagnant. Although high-temperature steam curing accelerates the hydration process of HSC, the long curing time will make the air in the internal pores of cementitious material migrate to the surface of the cementitious material during the molding process, and produce interconnected pores within the cementitious material, which will reduce its strength.

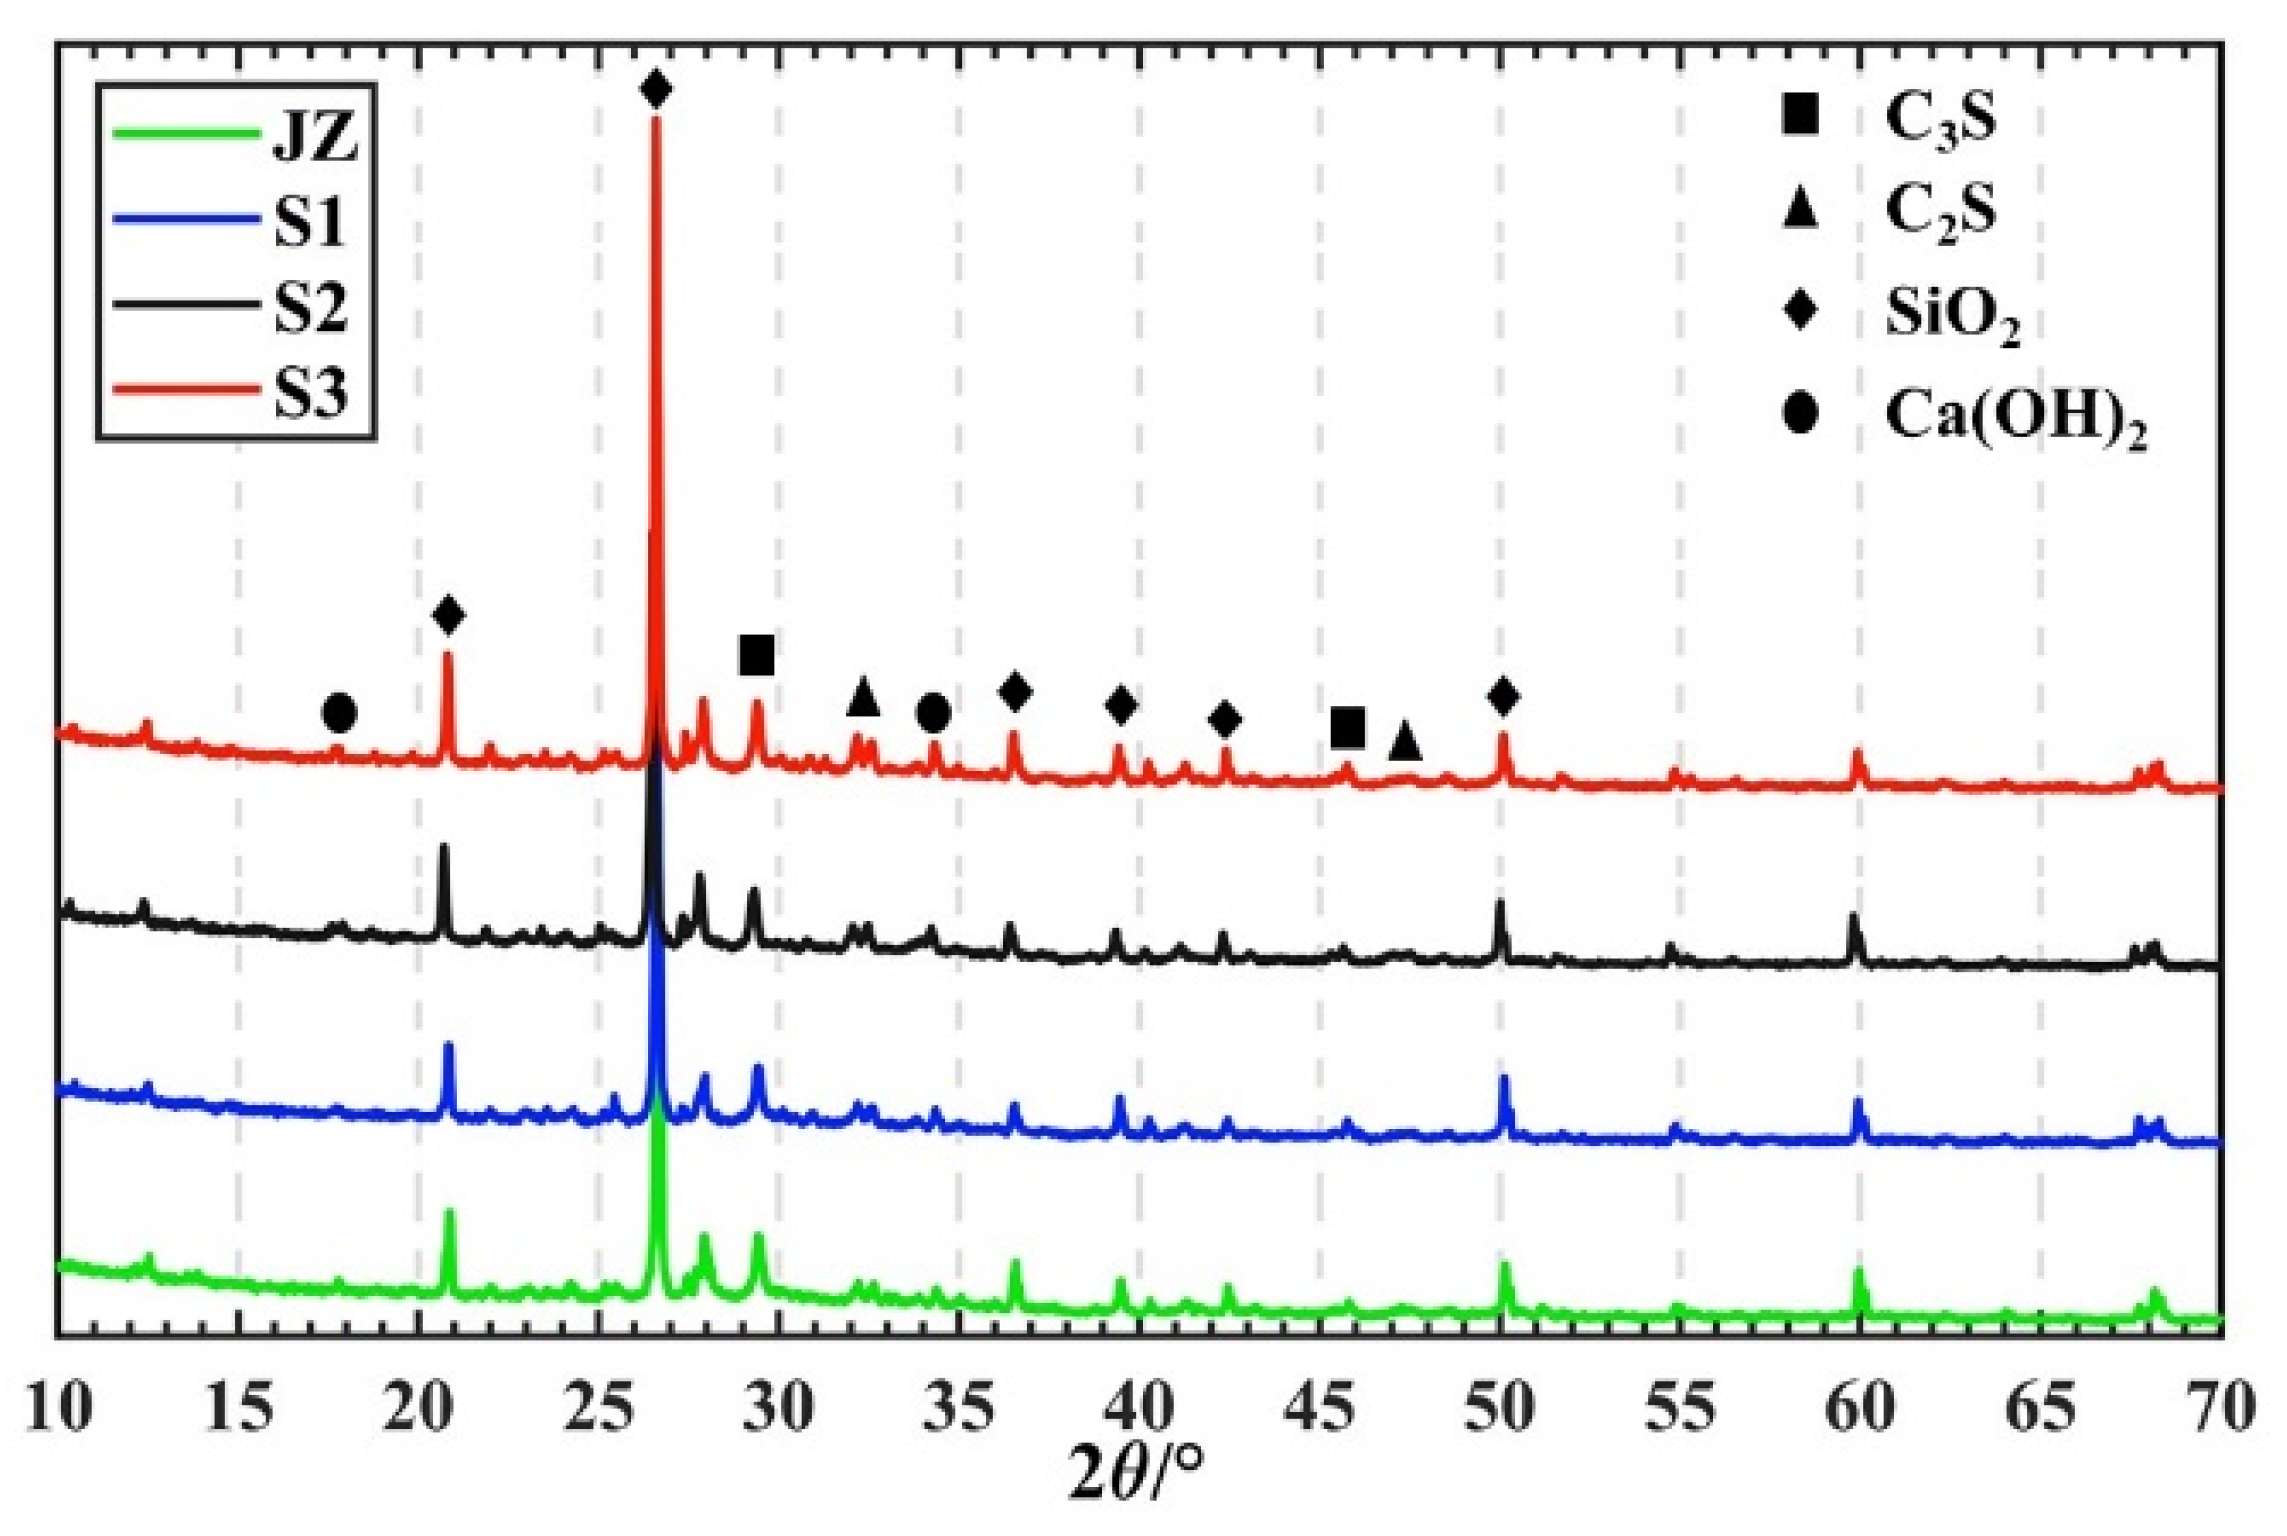
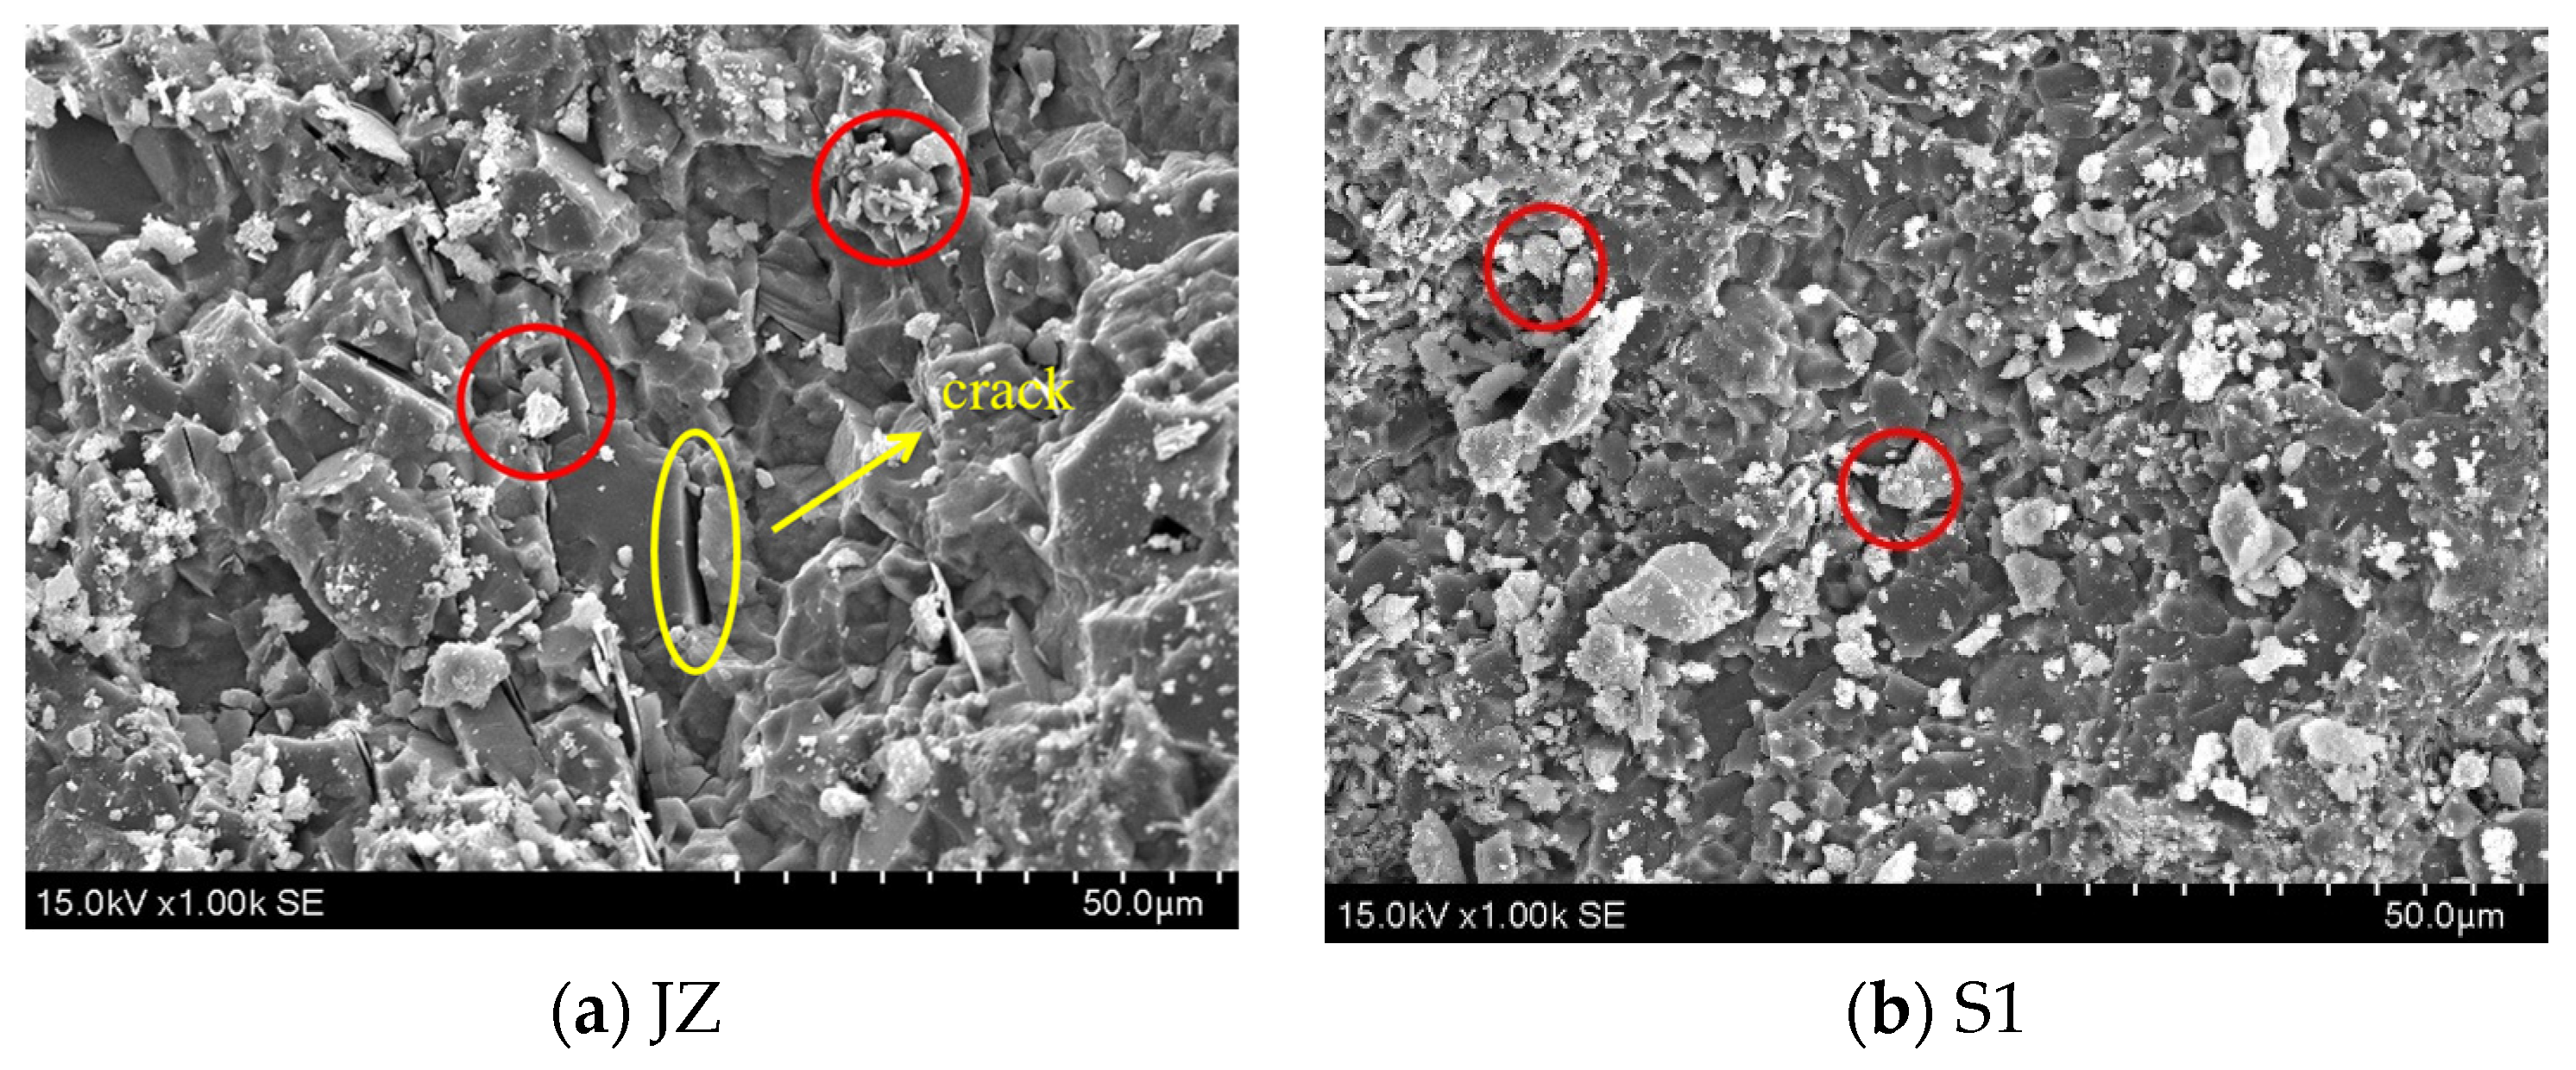
4.2.3. Microanalysis

The specimens were subjected to XRD analysis using Jade 9.0 software to elucidate the mechanism underlying the effect of steam curing time on the change in GHSC strength. The 7 day XRD patterns of each specimen with various steam-curing times are displayed in Figure 6. As seen in Figure 6, SiO2 exhibits the greatest diffraction peaks in all specimens, high crystallinity C-S-H gel was absent from the XRD patterns [29], and only a few diffuse diffraction peaks, resembling steamed buns, were visible close to 2θ = 30°. Furthermore, there are several C3S and C2S diffraction peaks visible throughout the specimen due to its low water-to-cement ratio of 0.18, indicating the presence of a significant amount of unhydrated clinker minerals therein. The intensity of the specimen’s Ca(OH)2 diffraction peaks gradually increased as the steam curing time was extended. The reason for this may be because the active component in GHSC increases the hydration rate inside the specimen with the prolongation of the steam curing time, and a large number of unhydrated cement particles are involved in the reaction so that more Ca(OH)2 is produced, which is therefore manifested as an increase in the intensity of the Ca(OH)2 diffraction peaks in the XRD pattern. However, a change in the intensity of Ca(OH)2 diffraction peaks was not obvious, which may be due to the fact that the activity of the active component inside the specimen was excited and consumed part of the Ca(OH)2, so the change in the intensity of Ca(OH)2 diffraction peaks was not significant.
The SEM pictures of every specimen after 7 days at varying steam curing durations are displayed in Figure 7. Visible cracks in normal cementitious material are indicated by yellow circles. The microstructure of GHSC is more dense compared to that of normal cementitious material. It is difficult to see hexagonal plate-like Ca(OH)2 crystals and needle-like calcite crystals; this is compatible with the test results of XRD. Each specimen’s fly ash is indicated in red in the SEM pictures. Fly ash occurs in relatively regular spherical beads, the composition of most of which does not differ much from the spherical glass particles [30]. Figure 7a shows that the specimen’s hydration products are looser, that there are tiny fractures between the particles, and that there is currently a small number of hydration products on the fly ash particles’ surface. Following that, as the steam conditioning time of the specimens was extended, Figure 7b–d show a gradual increase in the hydration products on the fly ash particles’ inside surface as well as clear indentations. These findings suggest that the fly ash’s activity was enhanced by the extended high-temperature steam conditioning time. In conclusion, when paired with Figure 7a, it becomes evident that each specimen’s microstructure becomes more compact as steam-conditioning time is extended, and the specimen’s microstructure gradually becomes more dense as opposed to initially being loose, indicating that the hydration products become regular and orderly. The macroscale increase in compressive and flexural strength indicates the improvement of the microstructure, which is consistent with the findings of the study conducted by Liu et al. [17].

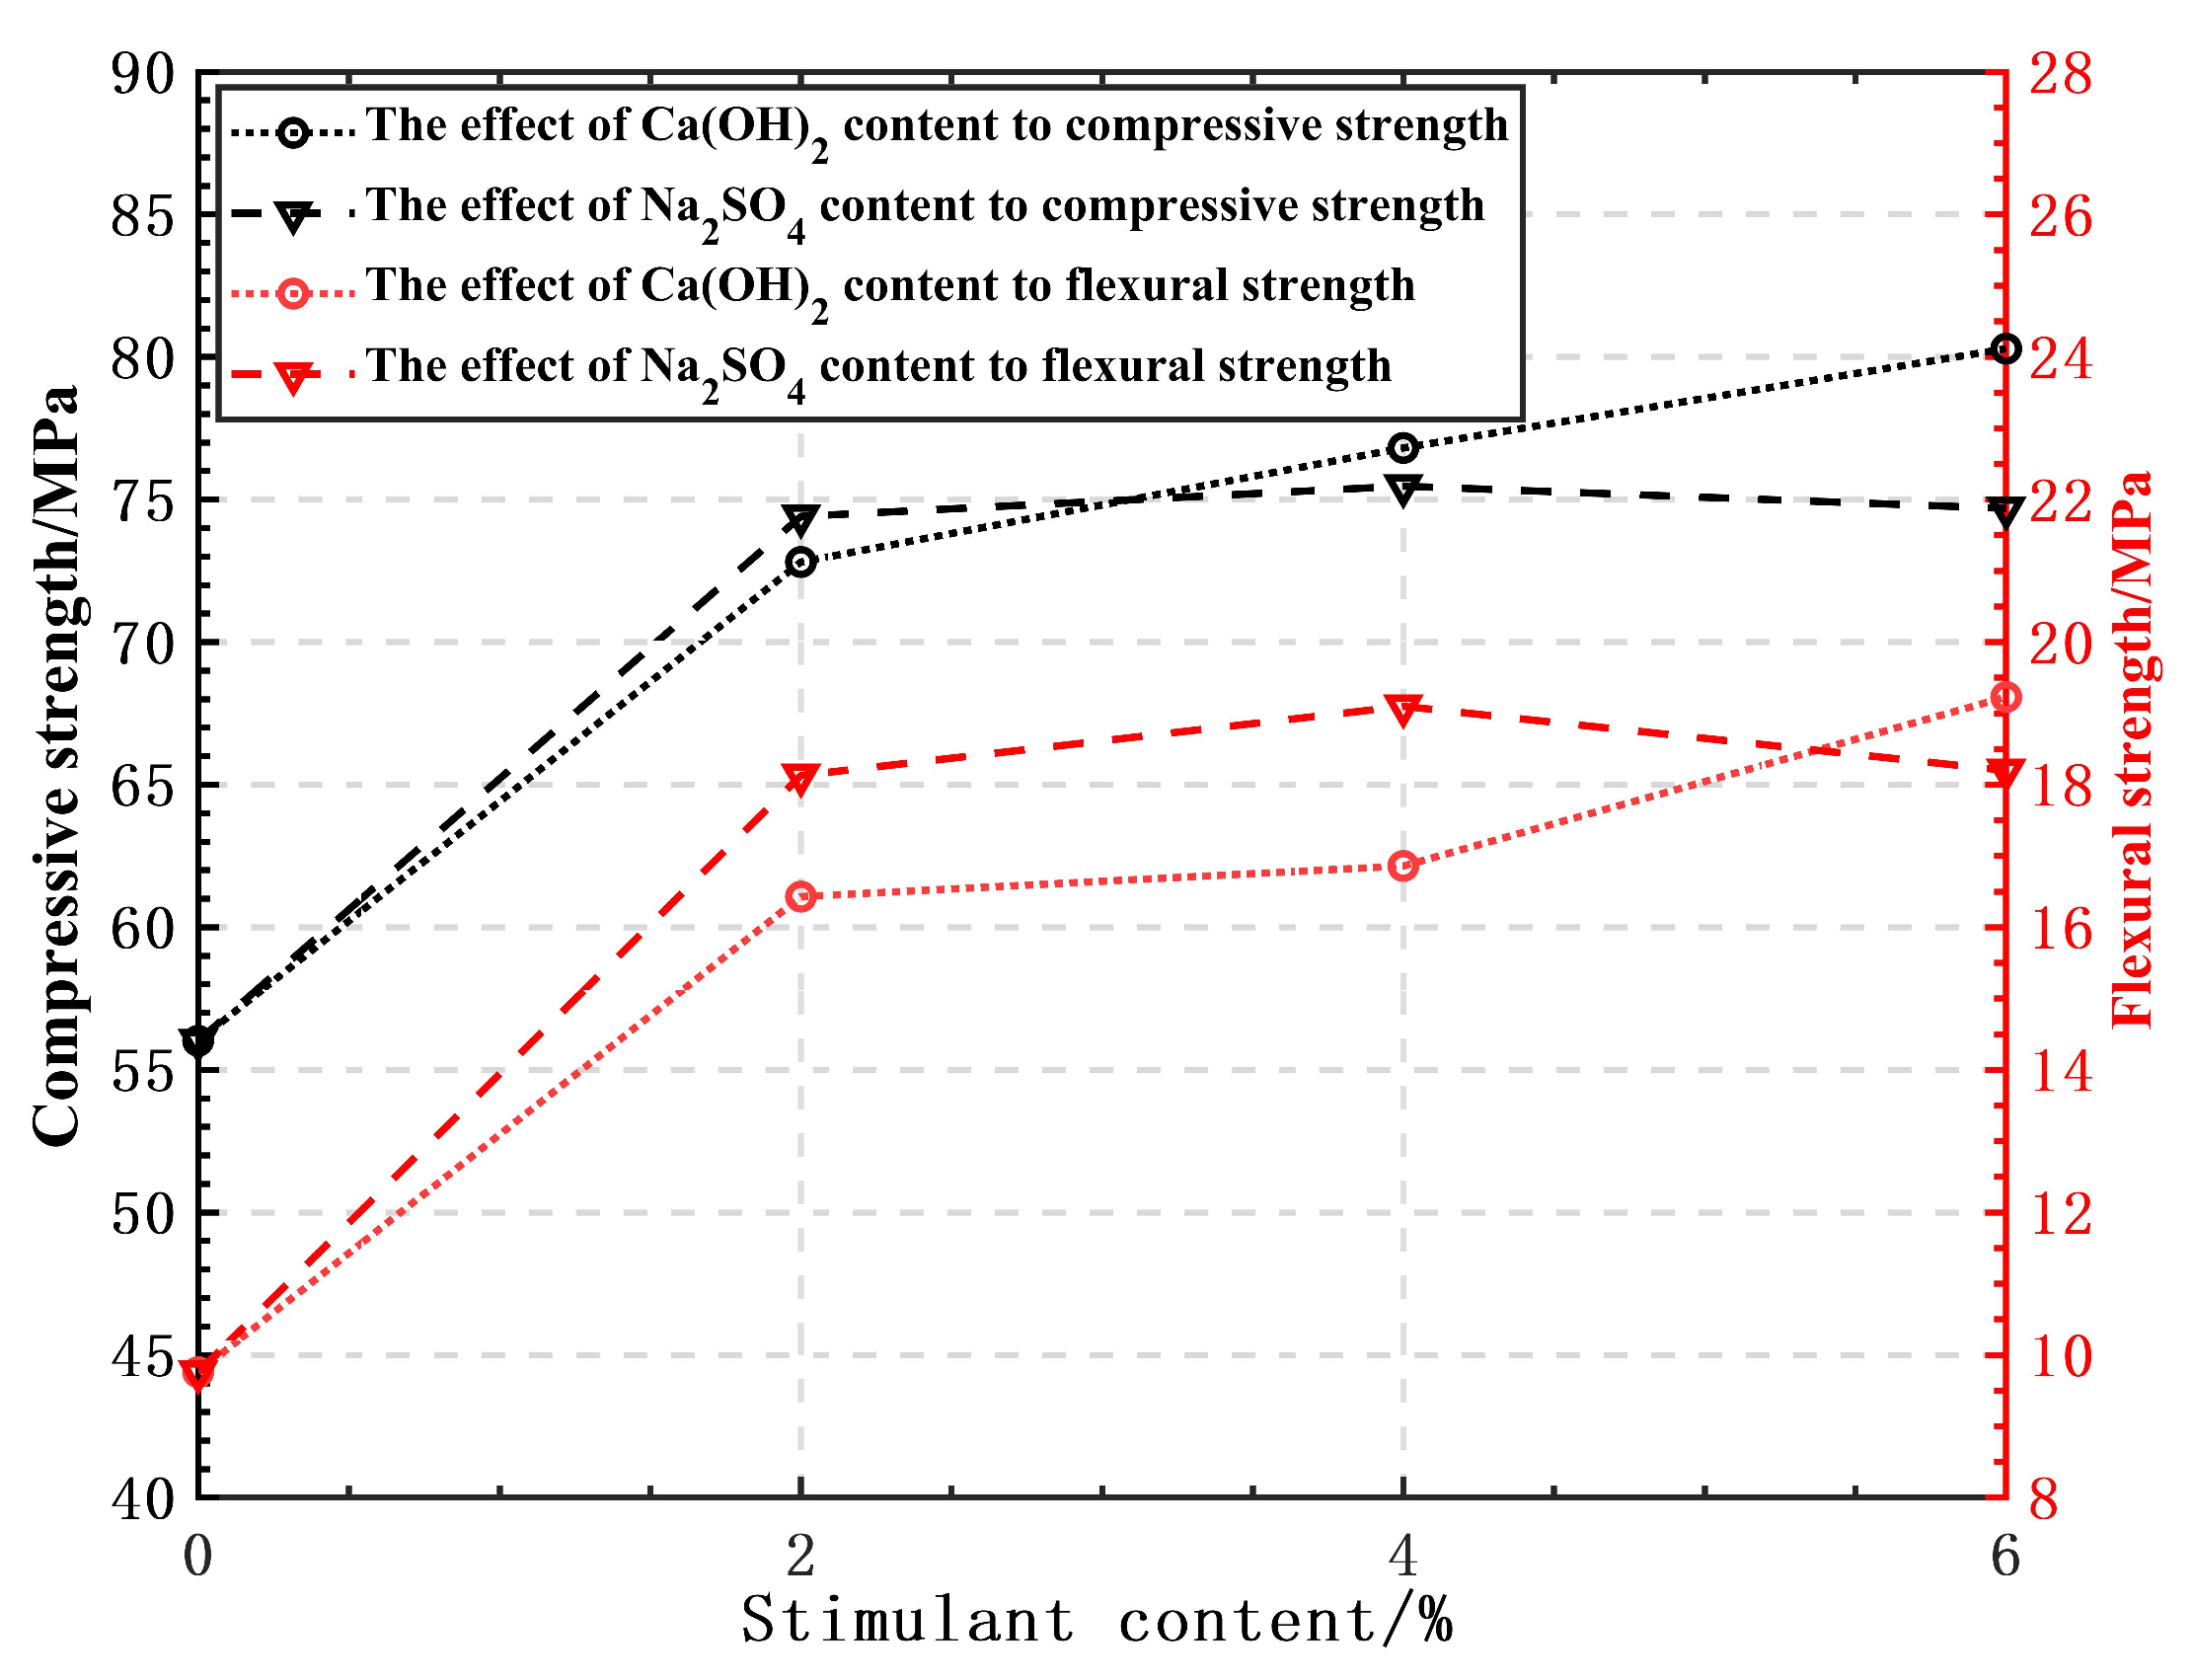
4.3. Effect of Activator on GHSC Strength

The influence of each activator on the flexural and compressive strengths of GHSC at various dosages is displayed in Figure 8. Both Ca(OH)2 and Na2SO4 doping in GHSC can raise the specimens’ compressive and flexural strengths, as shown in Figure 8.
The GHSC’s compressive and flexural strengths improve when Ca(OH)2 doping increases. This is because waste glass powder primarily consists of SiO2-based acidic oxides; with the increase of alkaline activator Ca(OH)2 doping, the OH concentration in the solution gradually increases. Under the action of OH, the Si-O and Al-O bonds on the surface of the waste glass powder particles are more likely to be broken, so that unsaturated active bonds are formed on the surface, and it is easier to produce a hydration reaction with Ca(OH)2 to generate a hydrated calcium silicate and a hydrated calcium aluminate gel [31], which is the main reason for the stimulation of the activity of the waste glass powder. It should be noted that 6% Ca(OH)2 doping in this test still improved the compressive and flexural strengths of the specimens, which is not consistent with the results of the test conducted by Song [13]. This is because, under the test’s mix ratio, the water-to-cement ratio is only 0.18 and the total dosage of active admixture makes up 45% of the cementitious material. As a result, there is a problem with the cement hydration producing less Ca(OH)2 and insufficient alkalinity, and the addition of Ca(OH)2 supplements the concentration of OH-, which has a positive effect on the strength, so the strength of GHSC increases steadily as Ca(OH)2 dosing increases.
When the type of activator is Na2SO4, the compressive and flexural strengths of GHSC show a trend of first increasing and then decreasing with the increase of Na2SO4 doping, so it can be judged that there is an upper limit to the excitation effect of Na2SO4. When the Na2SO4 doping is 4%, compressive strength and flexural strength reach their maximum value; strength starts to decrease after exceeding this doping, but the compressive strength and flexural strength are still improved compared to the benchmark group. This is primarily because the gel on the surface of the glass powder particles and the AlO2− in the liquid phase react with SO42− and Ca2+ to produce calcite Aft, which forms a loose parcel layer on the surface of the particles, and it facilitates the diffusion of Ca2+ into the interior of the particles, where it reacts with SiO2 and Al2O3, thereby stimulating the activity of the glass powder [32]. Additionally, SiO42− in the C-S-H gel can continue to react with Ca2+ to generate C-S-H under the substitution of SO42−, which allows the glass powder to continue being excited [33]; these two factors are primarily responsible for the improvement of GHSC’s mechanical properties.

5. Conclusions

(1) When the particle size of glass powder is smaller, the flexural and compressive strengths of GHSC are greater. The strength of GHSC can be improved when the particle size of glass powder is <20 µm, and in this range the smaller the particle size of glass powder, the more obvious the improvement of GHSC strength. In addition, glass powders above 20 µm have a negative effect on strength, so the amount of glass powders with particle size above 20 µm should be limited and reduced.
(2) Enhancing curing conditions boosts GHSC’s flexural and compressive strengths, with the greatest improvement observed at a steam curing temperature of 90 °C and a duration of 3 days. Compared to standard curing conditions, compressive and flexural strengths increased by 76.4% and 98.2%, respectively. As steam curing time extends, the specimen’s hydration products become more regular and orderly, which is the main contributor to these strength enhancements.
(3) Ca(OH)2 and Na2SO4, used as activators in GHSC preparation, enhance its flexural and compressive strengths. The optimal effect is achieved with 6% Ca(OH)2, while Na2SO4 should not exceed 4%.
It should be noted that the following topics require further research and investigation: (1) how to more efficiently produce glass powder with a particle size of less than 20 µm; (2) given that the flexural and compressive strength of GHSC increases with the extension of steam curing time, whether there is a peak of steam curing time, beyond which the strength tends to decrease; (3) since a large number of active components were introduced in the tests and a range of excitation means were used to increase the activity, does this introduce a risk of alkali-aggregate reactions occurring, and in what way should this be considered.

Author Contributions

Conceptualization, B.L.; Methodology, X.W.; Validation, Z.Z. and B.P.; Investigation, X.W.; Resources, X.W., Z.Z. and B.P.; Writing—original draft, X.W.; Writing—review & editing, X.W.; Supervision, B.L. All authors have read and agreed to the published version of the manuscript.

Funding

This research received no external funding.

Data Availability Statement

The raw data supporting the conclusions of this article will be made available by the authors on request.

Conflicts of Interest

The authors declare no conflict of interest.

References

  1. Pauzi, N.; Hamid, R.; Jamil, M.; Zain, M. The effect of melted-spherical and crushed CRT funnel glass waste as coarse aggregates on concrete performance. J. Build. Eng. 2020, 35, 102035. [Google Scholar] [CrossRef]
  2. Liu, G.Y.; Li, L.J.; Fan, L. Experimental study on mechanical properties of waste glass aggregate concrete. Concrete 2016, 2, 74–76. [Google Scholar]
  3. Xue, L.J.; Guo, G.L.; Lin, Y.J. Mechanical performance of recycled concrete based on waste glass fine aggregate. J. Shaanxi Shaanxi Univ. Technol. (Nat. Sci. Educ.) 2019, 35, 39–44. [Google Scholar]
  4. Tamanna, N.; Tuladhar, R.; Sivakugan, N. Performance of recycled waste glass sand as partial replacement of sand in concrete. Constr. Build. Mater. 2020, 239, 117804. [Google Scholar] [CrossRef]
  5. Zhao, Z.F.; Li, B.X.; Zhu, Y.G. Experimental study on the optimal replacement rate of single mixed waste glass concrete. Adv. Eng. Sci. 2017, 49, 99–106. [Google Scholar]
  6. Li, L.H.; Ren, Z.L.; Yang, J.C.; Liu, S.H. Mechanism of waste glass powder in concrete and its ASR risk. J. Yangtze River Sci. Res. Inst. 2016, 33, 94–99. [Google Scholar]
  7. Guo, P.; Meng, W.; Nassif, H.; Gou, H.; Bao, Y. New perspectives on recycling waste glass in manufacturing concrete for sustainable civil infrastructure. Constr. Build. Mater. 2020, 257, 119579. [Google Scholar] [CrossRef]
  8. Li, B.X.; Wang, Z.W.; Rao, D.; Yu, X. Review on Application of Waste Glass in Cement Concrete. Bull. Chin. Ceram. Soc. 2020, 39, 2449–2457. [Google Scholar]
  9. Shin, H.O.; Yoo, D.-Y.; Lee, J.-H.; Lee, S.-H.; Yoon, Y.-S. Optimized mix design for 180 MPa ultra-high-strength concrete. J. Mater. Res. Technol. 2019, 8, 4182–4197. [Google Scholar] [CrossRef]
  10. Nguyen, T.-T.; Thai, H.-T.; Ngo, T. Optimised mix design and elastic modulus prediction of ultra-high strength concrete. Constr. Build. Mater. 2021, 302, 124150. [Google Scholar] [CrossRef]
  11. Li, D.C.; Chen, X.D.; Huang, D. Study on the effect of glass powder on mechanical properties and ASR of glass aggregate concrete. Concrete 2021, 3, 79–82. [Google Scholar]
  12. Elaqra, H.A.; Haloub, M.A.A.; Rustom, R.N. Effect of new mixing method of glass powder as cement replacement on mechanical behavior of concrete. Constr. Build. Mater. 2019, 203, 75–82. [Google Scholar] [CrossRef]
  13. Song, B.X. Active Provocation Test of Waste Glass Powder. Master’s Thesis, University of South China, School of Civil Engineering, Hengyang, China, 2013. [Google Scholar]
  14. Khan, Q.S.; Sheikh, M.N.; McCarthy, T.J.; Robati, M.; Allen, M. Experimental investigation on foam concrete without and with recycled glass powder: A sustainable solution for future construction. Constr. Build. Mater. 2019, 201, 369–379. [Google Scholar] [CrossRef]
  15. Kashani, A.; Ngo, T.D.; Hajimohammadi, A. Effect of recycled glass fines on mechanical and durability properties of concrete foam in comparison with traditional cementitious fines. Cem. Concr. Compos. 2019, 99, 120–129. [Google Scholar] [CrossRef]
  16. Solanki, P.; Bierma, T.; Jin, G. Properties of flowable fill produced by substituting fly ash with recycled glass powder. Constr. Build. Mater. 2020, 265, 120330. [Google Scholar] [CrossRef]
  17. Liu, S.; Xie, G.; Wang, S. Effect of curing temperature on hydration properties of waste glass powder in cement-based materials. J. Therm. Anal. Calorim. 2014, 119, 47–55. [Google Scholar] [CrossRef]
  18. GB/T 17671-1999; Method of testing cements-Determination of strength (ISO). State Quality Supervision Bureau: Beijing, China, 1999.
  19. Peng, B.; Li, B.X. Feasibility study of waste glass powder used in reactive powder concrete. Build. Decor. Mater. World 2018, 2, 68–73. [Google Scholar]
  20. Fan, L.; Liu, G.Y.; Lu, R.Y.; Jin, D.Z. Influence of glass powder particle size on properties of complex binder. Bull. Chin. Ceram. Soc. 2017, 36, 180–185. [Google Scholar]
  21. Mirzahosseini, M.; Riding, K.A. Influence of different particle sizes on reactivity of finely ground glass as supplementary cementitious material (SCM). Cem. Concr. Compos. 2015, 56, 95–105. [Google Scholar] [CrossRef]
  22. Liu, Y.H. The Effect of Steam Curing on the Swelling and Deformation Characteristics of Cement Paste and Mortar. Master’s Thesis, Central South University, School of Materials Science and Engineering, Changsha, China, 2008. [Google Scholar]
  23. Yan, P.Y.; Cui, Q. Effects of curing regimes on strength development of high-strength concrete. J. Chin. Ceram. Soc. 2015, 43, 133–137. [Google Scholar]
  24. Wang, X.F.; Wang, Y.P.; Wu, L.C. Degradation Phenomenon of Basic Mechanical Properties of Plain Reactive Powder Concrete with Time. Adv. Mater. Res. 2015, 1065–1069, 1871–1874. [Google Scholar] [CrossRef]
  25. Lin, J. Research on Mechanical Properties and Pore Structure of Reactive Powder Concrete. Master’s Thesis, Hainan University, School of Civil Engineering, Haikou, China, 2019. [Google Scholar]
  26. Liao, Y.S.; Yao, J.X.; Deng, F.; Li, H.; Wang, K.; Tang, S. Hydration behavior and strength development of supersulfated cement prepared by calcined phosphogypsum and slaked lime. J. Build. Eng. 2023, 80, 108075. [Google Scholar] [CrossRef]
  27. Liao, Y.; Wang, S.; Wang, K.; Al Qunaynah, S.; Wan, S.; Yuan, Z.; Xu, P.; Tang, S. A study on the hydration of calcium aluminate cement pastes containing silica fume using non-contact electrical resistivity measurement. J. Mater. Res. Technol. 2023, 24, 8135–8149. [Google Scholar] [CrossRef]
  28. Zhao, Q.; He, B.; Cui, X.; Hou, J.; Cui, C. Hydration of reactive powder concrete matrix under long-term hydrothermal condition. J. Chin. Ceram. Soc. 2020, 48, 665–674. [Google Scholar]
  29. Geng, Z.; Tang, S.; Wang, Y.; He, Z.; Wu, K. Stress relaxation properties of calcium silicate hydrate: A molecular dynamics study. J. Zhejiang Univ. Sci. A 2024, 25, 97–115. [Google Scholar]
  30. Yang, C.; Xiong, L.; You, J.J.; Ji, X.; Hu, R. Mechanical properties and microscopic characteristics of fly ash geopolymer concrete containing ordinary portland cement. J. Civ. Environ. Eng. 2024, 19, 1–9. [Google Scholar]
  31. Day, R.L.; Shi, C. Early strength development and hydration of alkali-activated blast furnace slag/fly ash blends. Adv. Cem. Res. 1999, 11, 189–196. [Google Scholar]
  32. Wang, J.-H.; Cai, G.; Wu, Q. Basic mechanical behaviours and deterioration mechanism of RC beams under chloride-sulphate environment. Constr. Build. Mater. 2018, 160, 450–461. [Google Scholar] [CrossRef]
  33. Yang, X.; Peng, H.; Jia, F.; Yue, H. Progress of research on chemical activating mechanisms of fly ash. J. China Coal Soc. 2005, 30, 366–370. [Google Scholar]
Figure 1. Particle size distribution of each material.
Buildings 14 00569 g001
Figure 2. Glass powder after grinding.
Buildings 14 00569 g002
Figure 3. Particle size distribution of glass powder with different grinding times.
Buildings 14 00569 g003
Figure 4. The effect of different curing temperatures on the strength of GHSC at 7 d.
Buildings 14 00569 g004
Figure 5. The effect of steam curing time on the strength of GHSC.
Buildings 14 00569 g005
Figure 6. XRD pattern of GHSC under different steam curing times.
Buildings 14 00569 g006
Figure 7. SEM images of GHSC with different steam curing times.
Buildings 14 00569 g007aBuildings 14 00569 g007b
Figure 8. The influence of various stimulants on the compressive and flexural strengths of GHSC at different dosages.
Buildings 14 00569 g008
Table 1. Chemical composition of main raw materials.
MaterialsSiO2Na2OCaOAl2O3MgOFe2O3SO3K2OMnO
Cement19.390.1862.774.611.163.002.500.45-
Silica90.350.580.921.040.762.160.250.580.24
Fly ash41.390.3419.0014.014.231.821.801.069.03
Glass powder72.4212.018.92.32.80.09-1.04-
Table 2. Mix ratio of GHSC.
Content/%S/CW/CSuperplasticizer/%
Glass PowderSilicaFly AshCement
20205550.70.182
Notes: S/C is sand binder ratio, W/C is water binder ratio.
Table 3. Different curing temperature test programs.
Specimen NumberCuring MethodCuring Temperature/°C
JZStandard curing for 7 d20
S-60Steam curing for 3 d + Standard curing for 4 d60
S-90Steam curing for 3 d + Standard curing for 4 d90
Table 4. Steam curing time test program.
Specimens’ NumberCuring Method
JZStandard curing
S1Steam curing at 90 °C for 1 d + Standard curing for 6 d
S2Steam curing at 90 °C for 2 d + Standard curing for 5 d
S3Steam curing at 90 °C for 3 d + Standard curing for 4 d
Table 5. Activator stimulating activity test program.
Specimen NumberContent/%S/CW/CSuperplasticizer/%ActivatorActivator Content/%
Glass PowderSilicaFly AshCement
JZ20205550.70.182--
C120205550.70.182Ca(OH)22
C220205550.70.182Ca(OH)24
C320205550.70.182Ca(OH)26
N120205550.70.182Na2SO42
N220205550.70.182Na2SO44
N320205550.70.182Na2SO46
Notes: S/C is sand binder ratio, W/C is water binder ratio.
Table 6. The particle size distribution of glass powder with different ball milling times and the compressive and flexural strength of the corresponding GHSC.
Grinding TimeParticle Size/μmCompressive Strength/MPaFlexural Strength/MPa
<55–1010–2020–3030–4040–50>50
4 h16.1399.05219.12515.42114.47810.50415.28155.0110.06
8 h17.3269.24819.20215.05814.30610.22214.63869.8319.12
16 h22.6749.46717.92514.41413.5629.22412.73370.9419.23
24 h29.7919.10915.68913.03312.1788.83111.36995.3824.7
Table 7. Averaging results of subsequence and parent sequence data.
Grinding TimeParticle Size/μmCompressive Strength/MPaFlexural Strength/MPa
<55–1010–2020–3030–4040–50>50
4 h0.7510.9821.0631.0651.0621.0831.1310.7560.550
8 h0.8071.0031.0681.0401.0501.0541.0840.9591.046
16 h1.0551.0270.9970.9950.9950.9510.9430.9751.052
24 h1.3870.9880.8720.9000.8930.9110.8421.3101.351
Table 8. The correlation degree and correlation polarity between the parent sequence and each subsequence.
SubsequenceParticle Size/μm
<55–1010–2020–3030–4040–50>50
Compressive strength subsequence0.78580.65980.6060−0.6262−0.6205−0.6135−0.5735
Flexural strength subsequence0.76370.66730.6348−0.6495−0.6511−0.6235−0.5838
Disclaimer/Publisher’s Note: The statements, opinions and data contained in all publications are solely those of the individual author(s) and contributor(s) and not of MDPI and/or the editor(s). MDPI and/or the editor(s) disclaim responsibility for any injury to people or property resulting from any ideas, methods, instructions or products referred to in the content.

