1. Introduction
Throughout history, the seismic vulnerability of unreinforced masonry (URM) buildings in Croatia has been quite high, as confirmed by many post-earthquake reports [
1,
2,
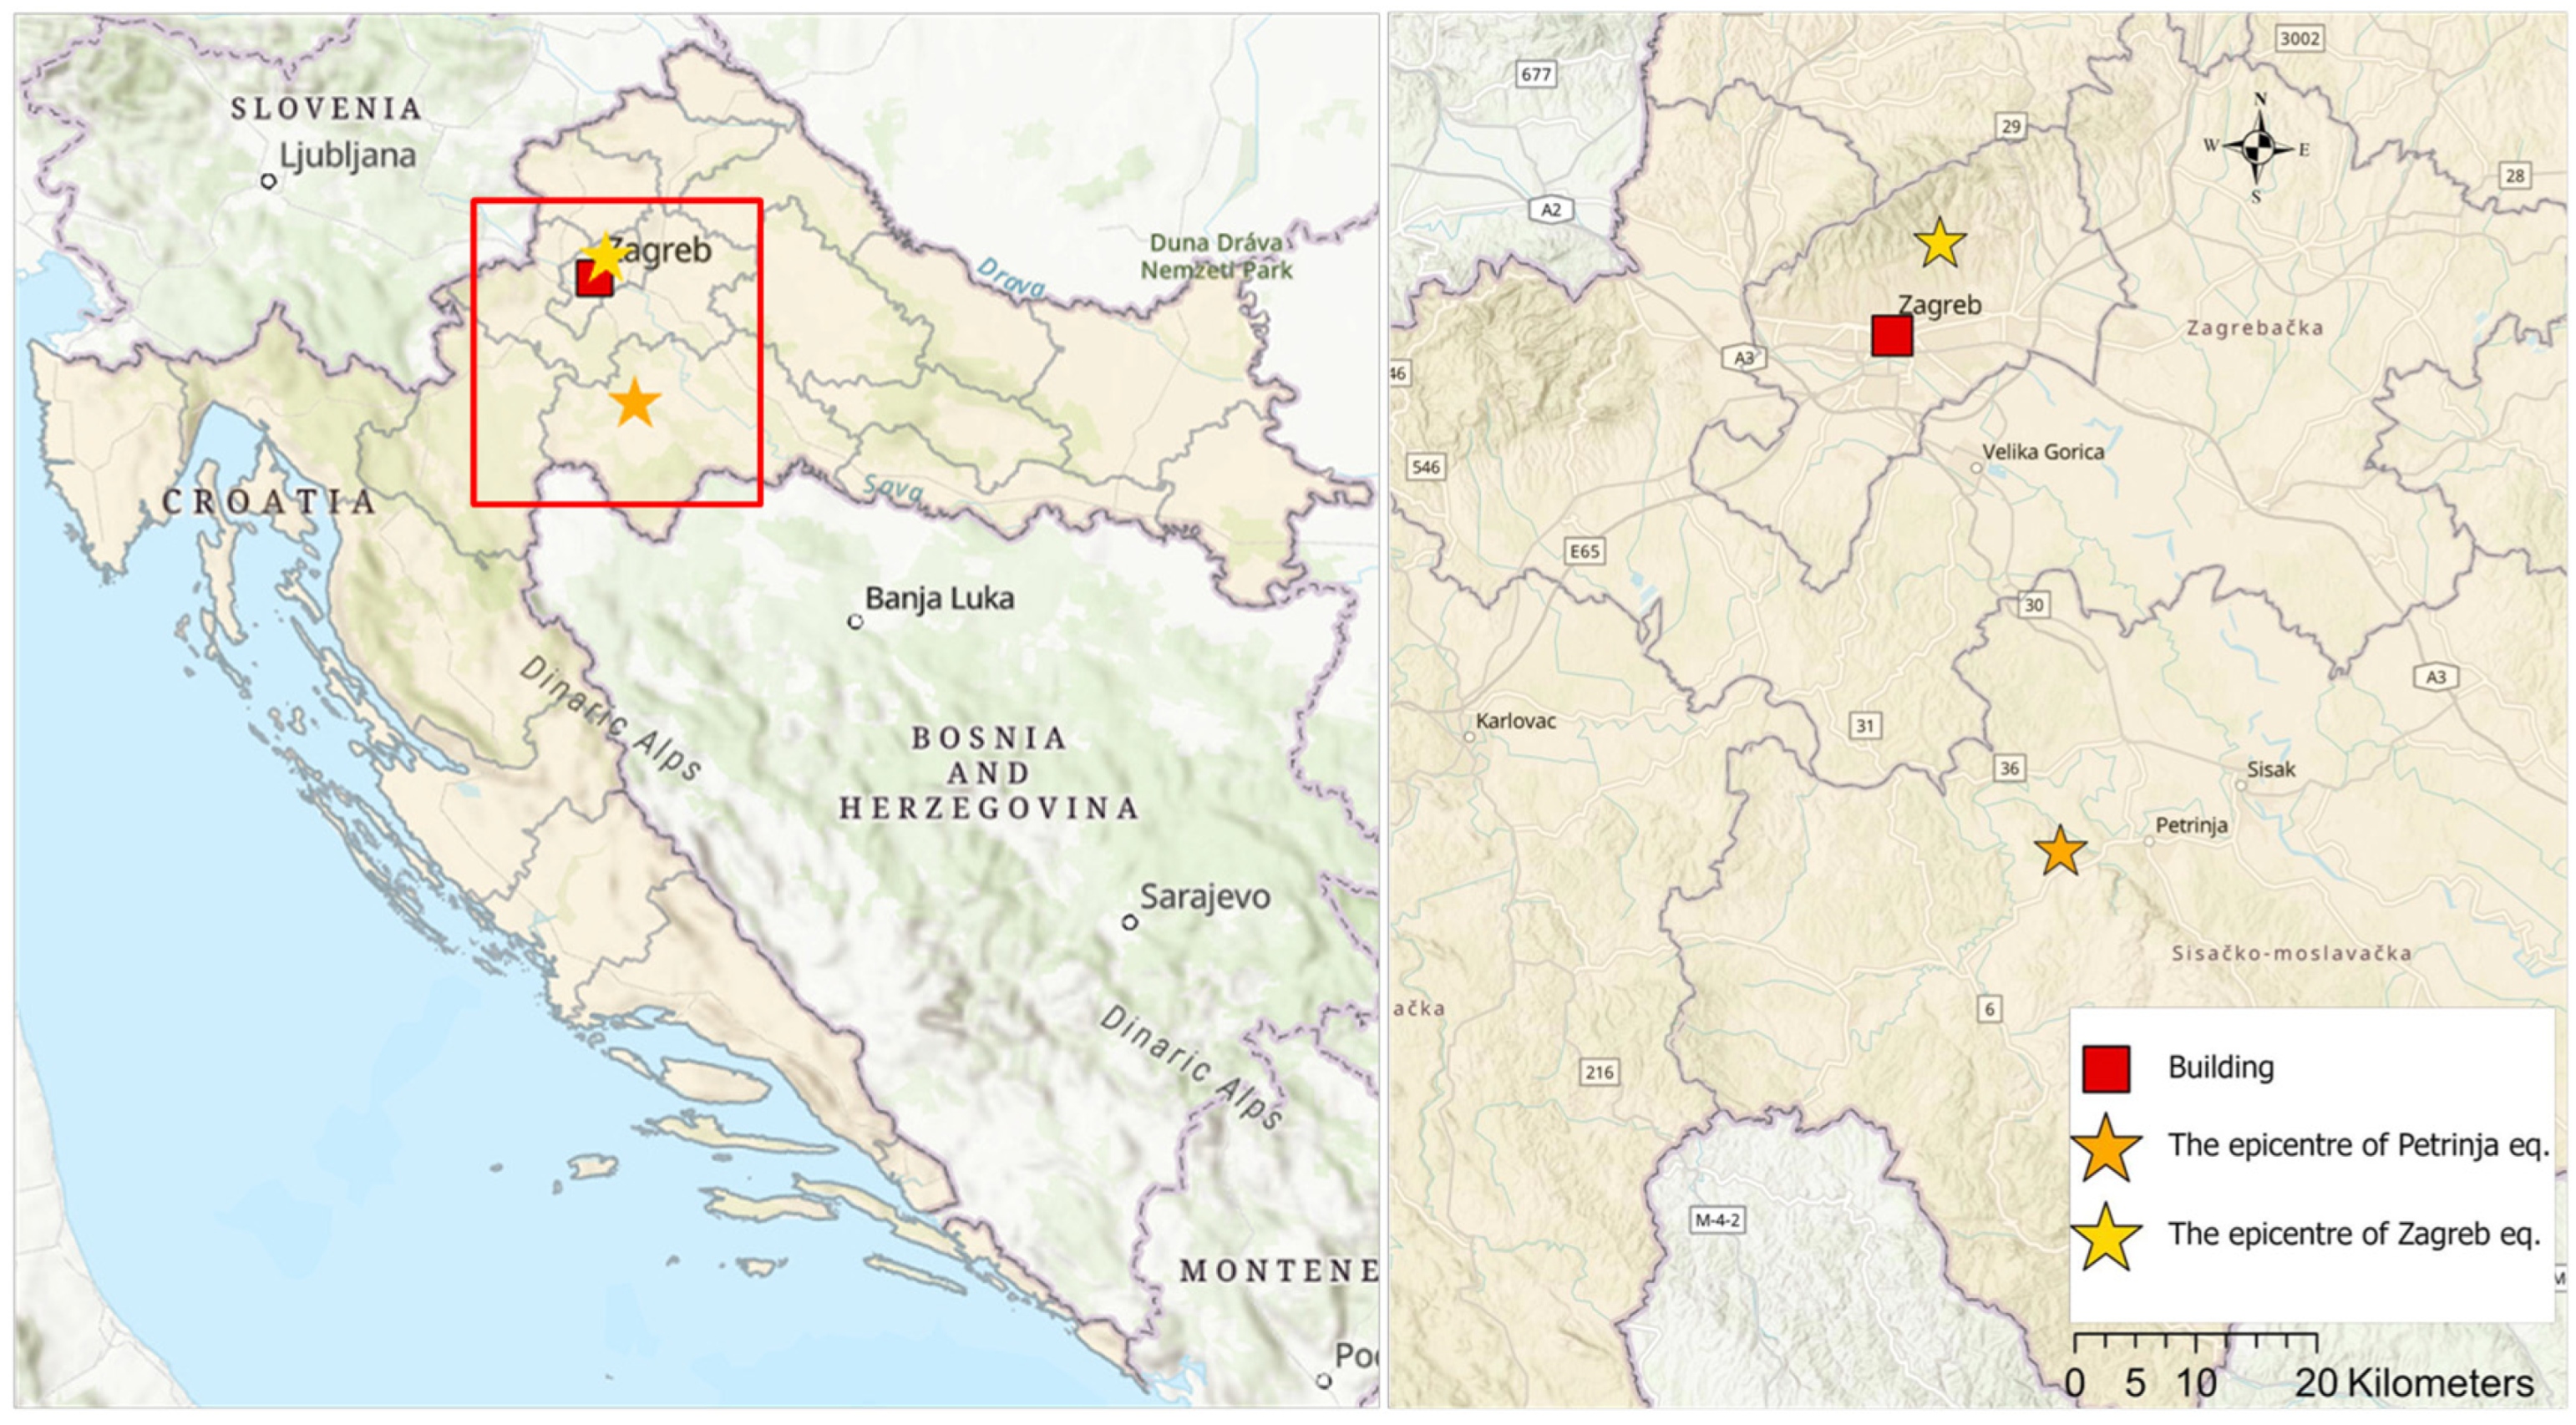
3]. The main reason for this is the construction material, along with the lack of knowledge about seismic design available in the periods when this typology was predominantly built. It was common to consider only vertical loads. The earthquake on 22 March 2020 with a magnitude of 5.4 (Mw) hit the urban area of Zagreb, with the epicenter located about 7 kilometers northeast from the center of Zagreb at a depth of 10 kilometers [
4,
5], causing heavy damage to many traditional unreinforced masonry (URM) buildings in the historic center of Zagreb. The intensity at the epicenter was estimated at VII degrees on the MCS scale. Not long after that, on 29 December 2020, a strong earthquake of magnitude 6.4 (Mw) hit central Croatia with the epicenter 6 km southwest of the city of Petrinja, which is about 50 km from Zagreb (
Figure 1). The intensity at the epicenter near Petrinja was estimated at VIII degrees on the MCS scale and, in Zagreb, the intensity was estimated at VII degrees on the MCS scale [
6].
This strong earthquake caused extensive damage to URM buildings, particularly in Sisak-Moslavina County, but also caused progressive damage to buildings in Zagreb [
7].
The center of Zagreb has a very old building stock, with URM buildings that are more than three stories high and mainly built standalone or within row aggregates. The city center features an array of styles from the medieval to Austro-Hungarian periods (1867–1918), primarily composed of old unreinforced masonry structures, as classified in seismic risk assessment [
8], which were built after the Zagreb earthquake in 1880 [
9]. Their vulnerability was highlighted during the 2020 earthquakes, emphasizing the need for seismic retrofitting to preserve this architectural heritage [
4,
10].
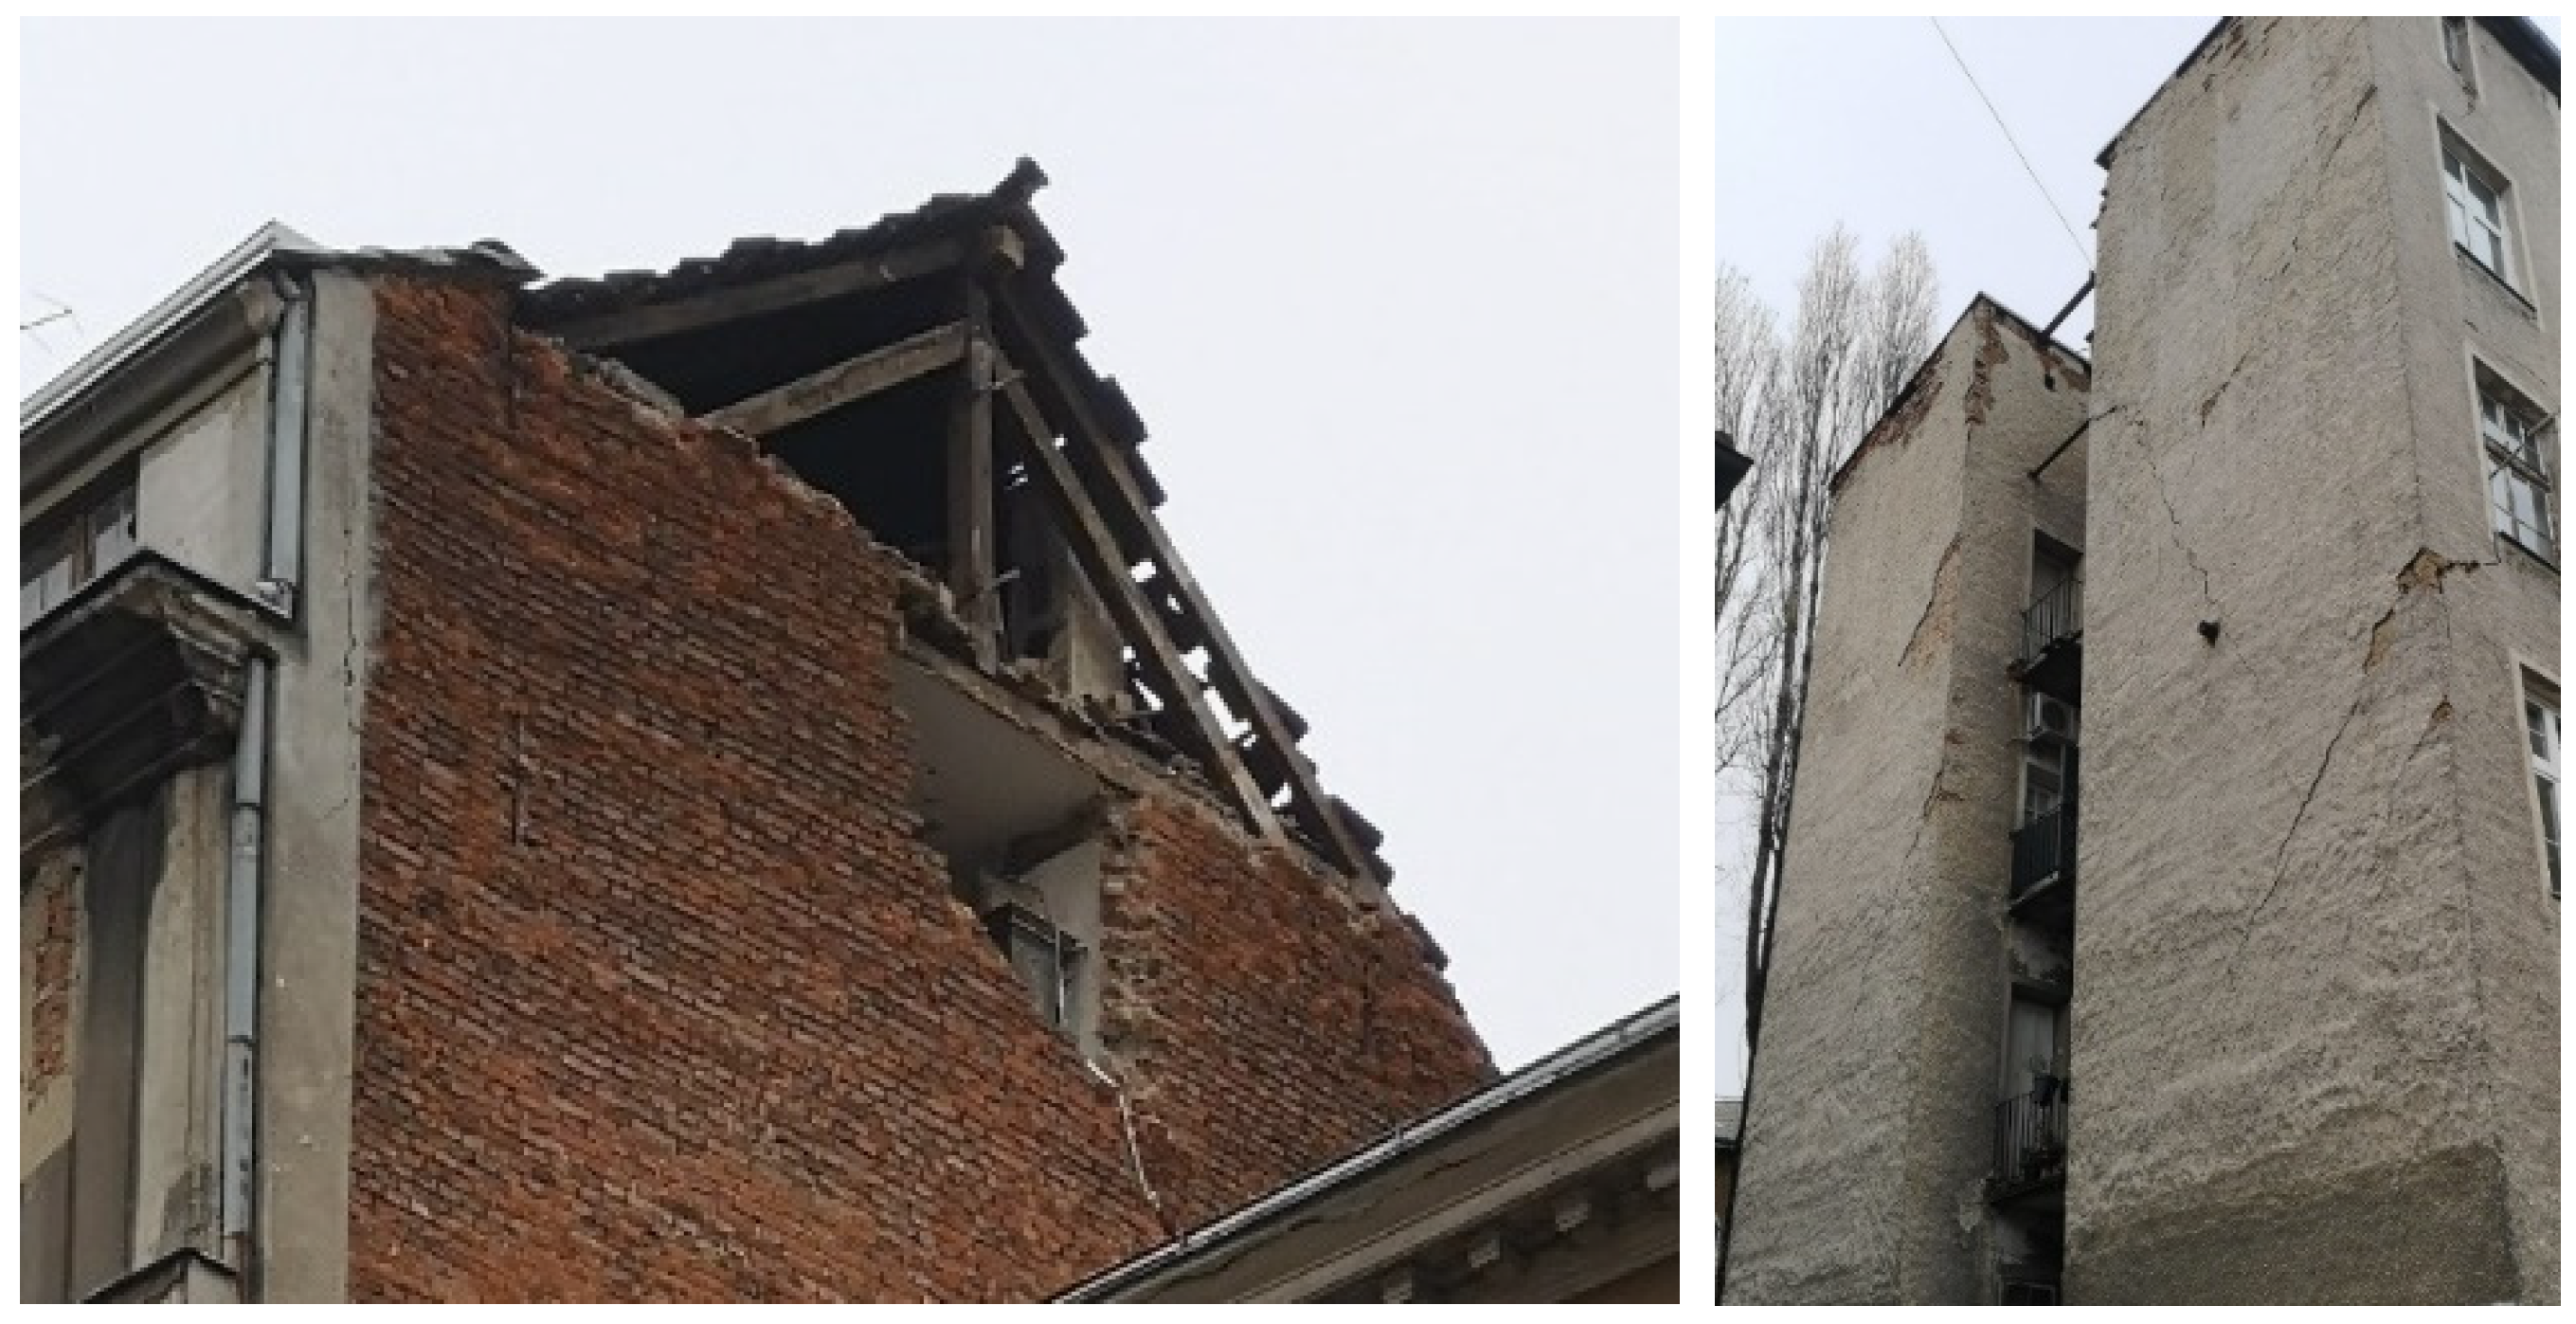
The observed damage included collapsed and damaged chimneys, attics, gable walls, and various other inadequately supported elements (domes, etc.). Other typical damage included separation of gable walls along the height, roof damage, in-plane damage of masonry walls (visible diagonal cracks with cracks often following mortar joints), and damage to lintels and vaults, staircases, and partition walls. As such, the observed failure mechanisms included out-of-plane and in-plane wall failures. Many buildings were affected by the formation of diagonal cracks in load-bearing (structural) and more often non-bearing (non-structural) walls and lintels due to exceedance of the in-plane bearing capacity [
1,
11]. With regard to the safety of occupants, decorative elements such as roof domes, portals, cornices on facades, and decorative sculptures also suffered considerable damage, occasionally falling on to the roads and sidewalks. Usually, these elements were not properly restrained.
The classification and degree of damage caused by the earthquake and the building usability are described in detail in [
12]. Most buildings that were built after 1964 did not suffer any significant damage. Only the infills and the connections with frame structure were occasionally damaged in reinforced concrete frames with infills.
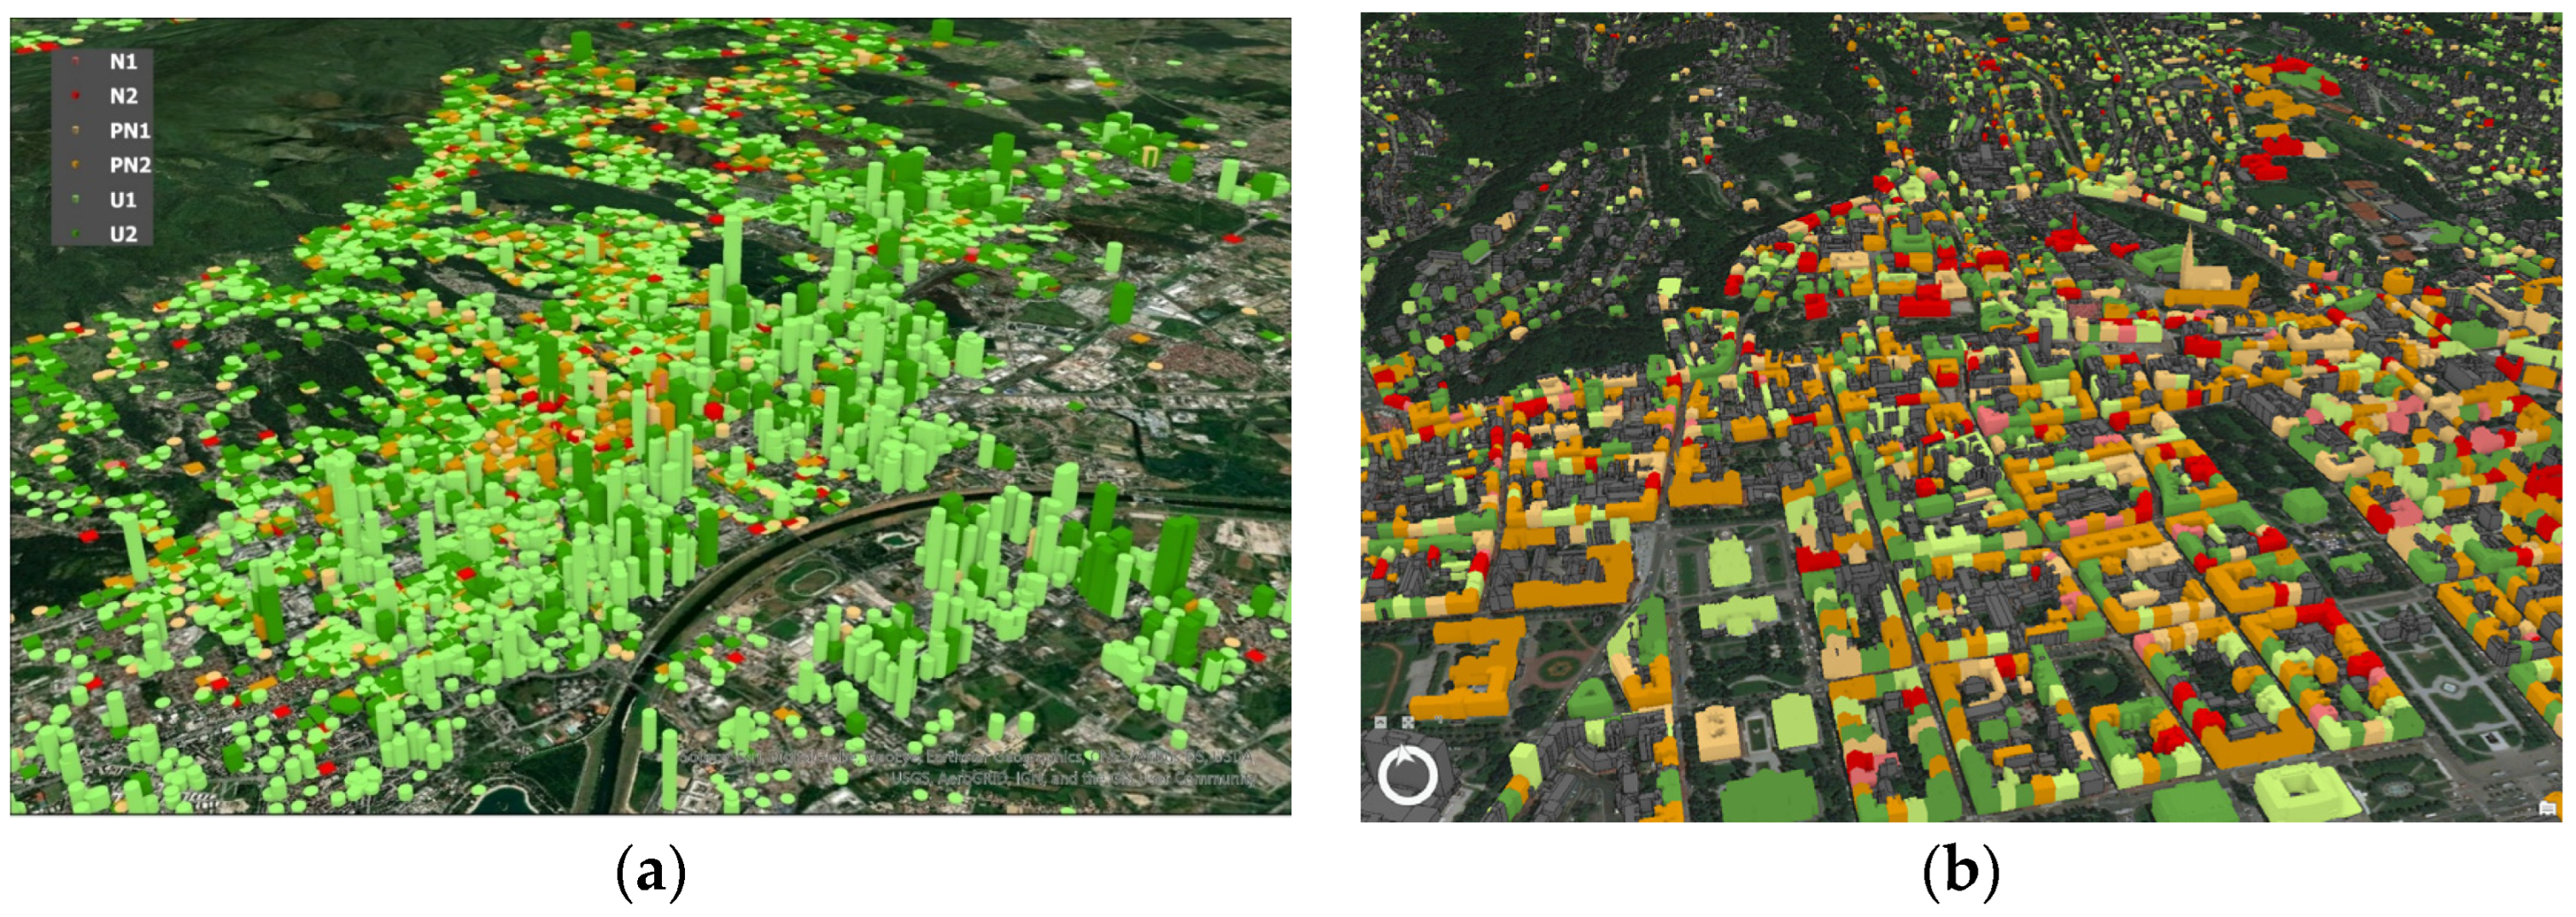
The results obtained through on-site building-by-building inspection of usability, including both residential and commercial–residential buildings, are shown in
Figure 2. It can be observed that most of the damage was concentrated in the historic center of the city.
Flexible wooden beam floors, poor brick and mortar quality, and inadequate connections between load-bearing walls and the floor structures are common for this typology. Also, a dominant direction of load-bearing walls parallel to the street can usually be noted, which supports wooden beams [
11,
13]. More recent studies that deal with the investigation of residential buildings in the city center of Zagreb can be found in [
14,
15,
16].
Problems with conducting seismic assessment of URM buildings are pronounced and there are many studies and papers that have tried to solve them [
17]. For instance, masonry is an inhomogeneous material and its properties depend on many factors that are often not known and are difficult to comprehensively take into account in analysis.
A numerical analysis of a typical URM building in Zagreb is given in [
14], where the building is modeled as freestanding and in row aggregate. In the numerical investigations, the equivalent frame method is applied in the Tremuri software (research version), taking into account the in-plane response and performing nonlinear static and dynamic analyses using the Zagreb and Petrinja earthquake records.
The influence of the building aggregates in the center of Zagreb is very important. The buildings are built so that the gable walls touch each other. Information on the influence of a building aggregate on the fragility of the individual building can be found in [
17,
18], but it should be emphasized that very often this aggregate is interrupted. This is also the case with the typical building considered in this paper, which has no neighbors on one side.
In the unreinforced masonry (URM) building typology, there is a high seismic vulnerability to out-of-plane failure of walls, initiated by perpendicular seismic actions [
19]. Factors such as poor connections of roof and floor structures, lack of horizontal and vertical constraining elements, and relatively low vertical loading on top floors contribute significantly to the development of a kinematic mechanism. The effect of such construction was observed in the Zagreb 2020 earthquake, where predominant damage was caused by overturning of gable walls, chimneys, and building ornaments. To a lesser degree, larger out-of-plane mechanisms were observed, while in-plane failure mechanisms were predominantly observed on partition walls [
4].
Different approaches to seismic assessment of masonry, as well as different strategies of analysis, have been proposed in [
20], with a comprehensive review of the existing modeling strategies for masonry structures.
Moreover, ref. [
21] gives a comparison of different methods of analysis and different numerical models to estimate the seismic behavior of unreinforced masonry buildings with flexible diaphragms, while [
22] presents the comparison of the results of nonlinear static analyses carried out using six software packages on a numerical model of a masonry building.
In [
23], the authors provide a comprehensive review of the critical aspects of nonlinear modeling for evaluating the seismic response of masonry structures where the principles of numerical modeling of masonry buildings are given. Furthermore, ref. [
24] gives a critical analysis and systematic comparison of the results on URM buildings obtained by using several modeling approaches and software package tools on benchmark examples.
Existing irregular masonry buildings are investigated by means of the equivalent frame modeling technique and nonlinear static analysis in [
25], giving particular attention to the selection of load patterns in pushover analysis, and the results are compared with the results of nonlinear dynamic analyses.
A newly developed microelement for a frame element modeling approach that accounts for both in-plane and out-of-plane failure modes is used in research study [
26] for modeling historical masonry buildings with timber floors, and it is highlighted that modeling the out-of-plane behavior has a significant impact on the seismic fragility curves. Furthermore, fragility curves for typical URM buildings with the out-of-plane effect are developed and given in [
27,
28].
For URM buildings, the systematic analysis of seismic behavior must also include the assessment of out-of-plane wall failure [
29,
30], a form of failure that involves an interaction of many mechanisms and is currently the focus of research studies. A still limited number of experimental research campaigns focus on clarifying some issues related to out-of-plane behavior, such as the identification of appropriate boundary conditions [
31], the influence of wall morphology [
32], the loading and displacement capacity of the mechanism [
33,
34,
35,
36], etc. In addition, out-of-plane behavior research is further developed through numerical analyses, including the development of NURBS-based software to compute local mechanisms [
37], a multi-level procedure to identify the geometry and load multiplier of a rigid-body failure mechanism [
38], and more detailed numerical models using the Lattice Discrete Particle Model to capture damage evolution and fracture propagation, i.e., local mechanism formation [
39].
The problem of torsional effects in irregular masonry buildings is presented in [
40] due to nonlinear static analyses and using different modeling approaches. Validation of simplified approaches is generally provided with reference to regular structures, and the conclusion is that structural irregularities are important to consider and can be taken into account through a simplified approach.
Modeling of masonry, even with many material parameters measured on-site, is a relatively demanding task. The problem is compounded by quality measurements of material properties being relatively complex, destructive, and expensive, requiring relatively large portions of walls, and still leaving relatively high uncertainty. When observing numerical models, problems that stand out are interactions between different failure modes (in and out of plane), inadequate connections between perpendicular walls that considerably contribute to out-of-plane failures, and the identification of local failure mechanisms of individual elements [
29]. Another problem is the modeling of construction details, such as overhangs, vaults, the use of jack arches, the connection between wooden floors and URM walls, etc.
Furthermore, creating a model that will take into account all relevant failure mechanisms with sufficient accuracy is challenging just from a numerical perspective, so simplifications are used and various approaches are considered in different software packages. In order to encompass all significant modes of failure, the numerical model needs to be complex. However, increasing complexity also increases the need for input parameters, which are, as already mentioned, scarce [
23].
Against that background, the objective of this study was to conduct a detailed seismic assessment of a typical URM building. This was achieved by applying different modeling methods to predict relevant failure modes and the seismic capacity of the damaged URM building. Valuable results were obtained through on-site building testing comprising dynamic parameters before and after the 2020 Zagreb earthquake. Due to the volume of the work carried out in this study, it has been divided into two papers, where the first one (this article) focuses on building description, parameters considered in modeling, and a number of analysis and modeling methods. The following analysis methods are considered: linear elastic response spectrum and static pushover analysis to account for the global building response, and kinematic analysis of the most common mechanisms for the local out-of-plane response. The second paper describes damage caused by the Zagreb 2020 earthquake and the measured parameters of the damaged building, as well as gives the results of a dynamic analysis of the building response. When assessing the applicability of the results from different models, it is important to emphasize that simpler modeling methods, which are intended to be conservative, will not always consider all possible failure modes and, therefore, may not be conservative or even safe to apply. For URM buildings with timber floors, a dominant failure mechanism not considered by many simpler modeling techniques is out-of-plane failure [
19]. Therefore, in settings such as Zagreb, when considering the load capacity of a building, techniques are required that take into account all significant modes of failure of the building, and in doing so, adequately assess its seismic performance.
2. As-Built State of the Case Study Building and Seismic Hazard at the Site
The entire historical part of the Lower Town of Zagreb was built in the same style, which was based on the guidelines of Austro-Hungarian construction techniques. The buildings mainly have three load-bearing walls parallel to the street, on which a wooden floor structure rests. These walls decrease in thickness with height. The gable walls are perpendicular to the street and they are not load-bearing walls so they are relatively thin. The typical building is often divided into two units, the street part and the courtyard part, and they are connected by a staircase. Structurally, there is a problem of discontinuity of the building. All floor structures comprise wooden beams except for the basement, where there is usually a Prussian vault. The buildings usually have four to five floors above the ground.
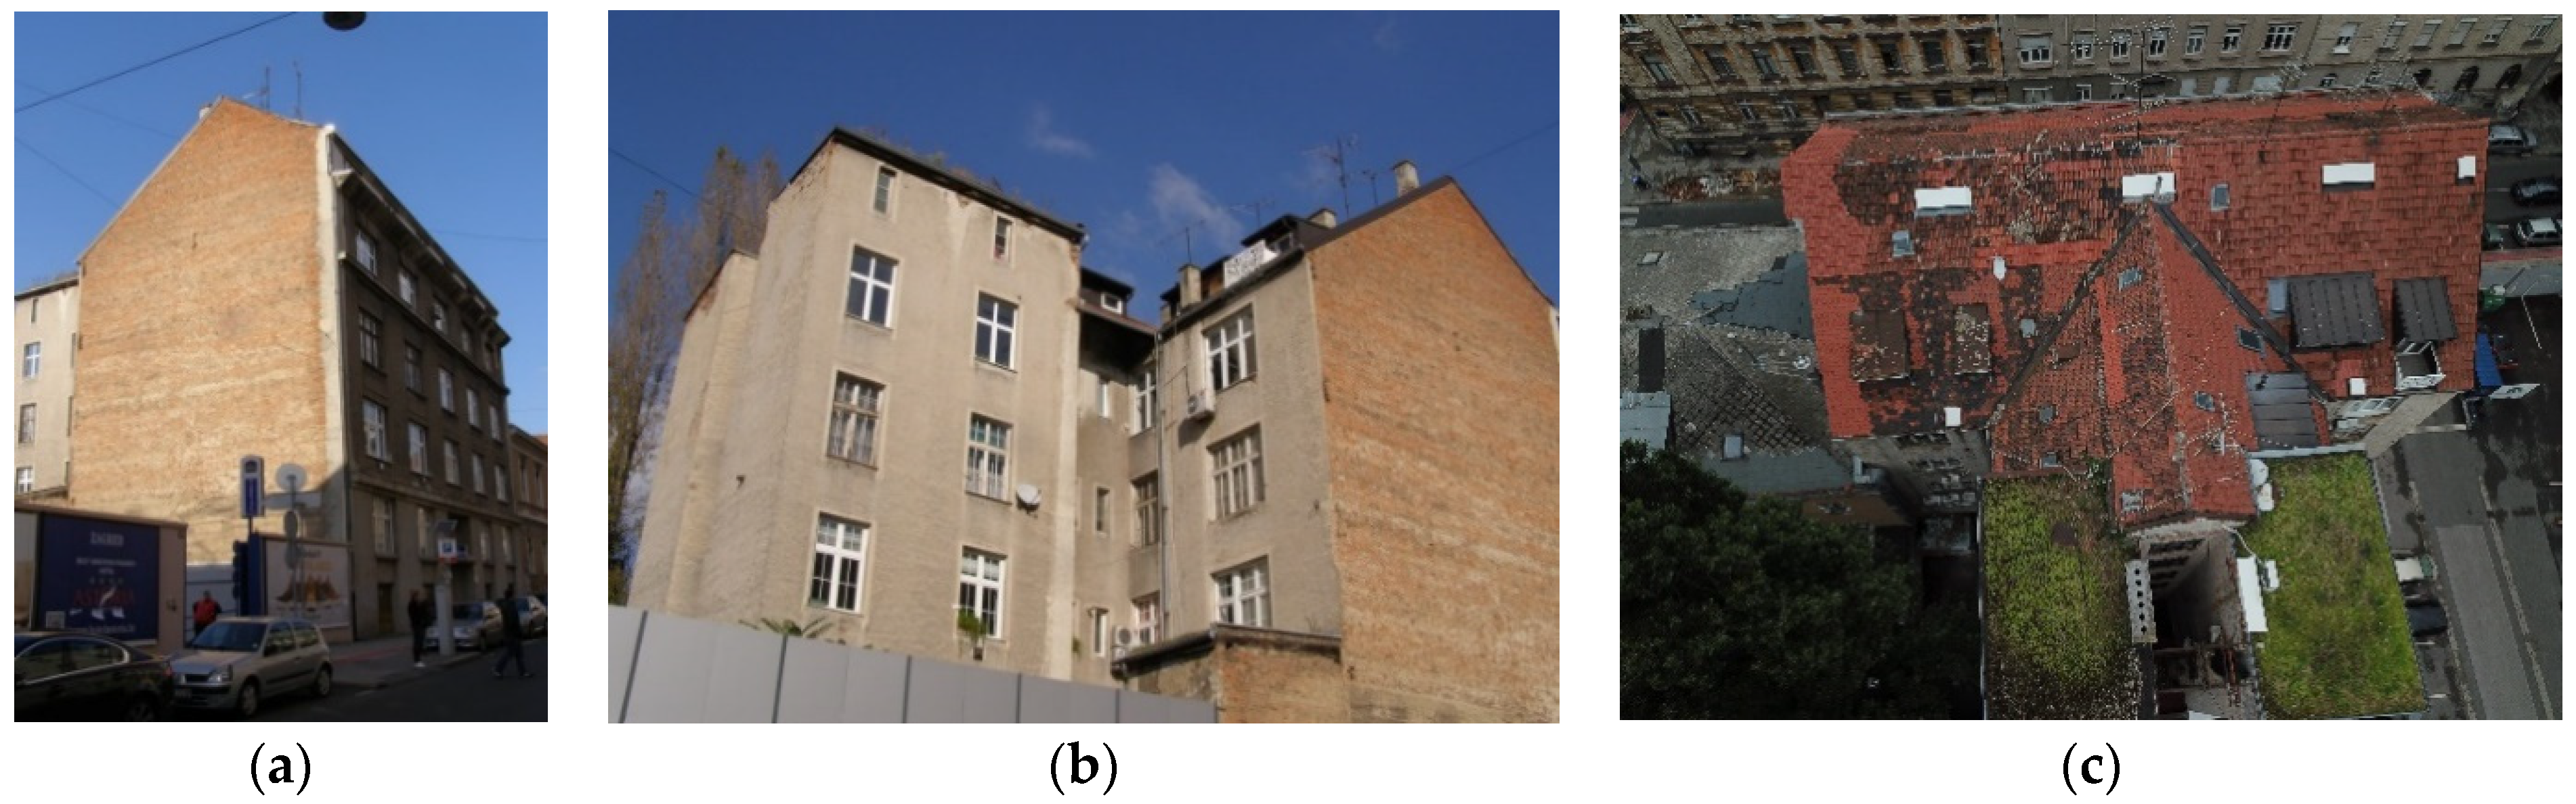
The building analyzed in this study was built in 1922 and is a typical example of a building type found in the Lower Town of Zagreb [
1,
5] (
Figure 3). The epicentral distance to the analyzed building is approximately 8 km.
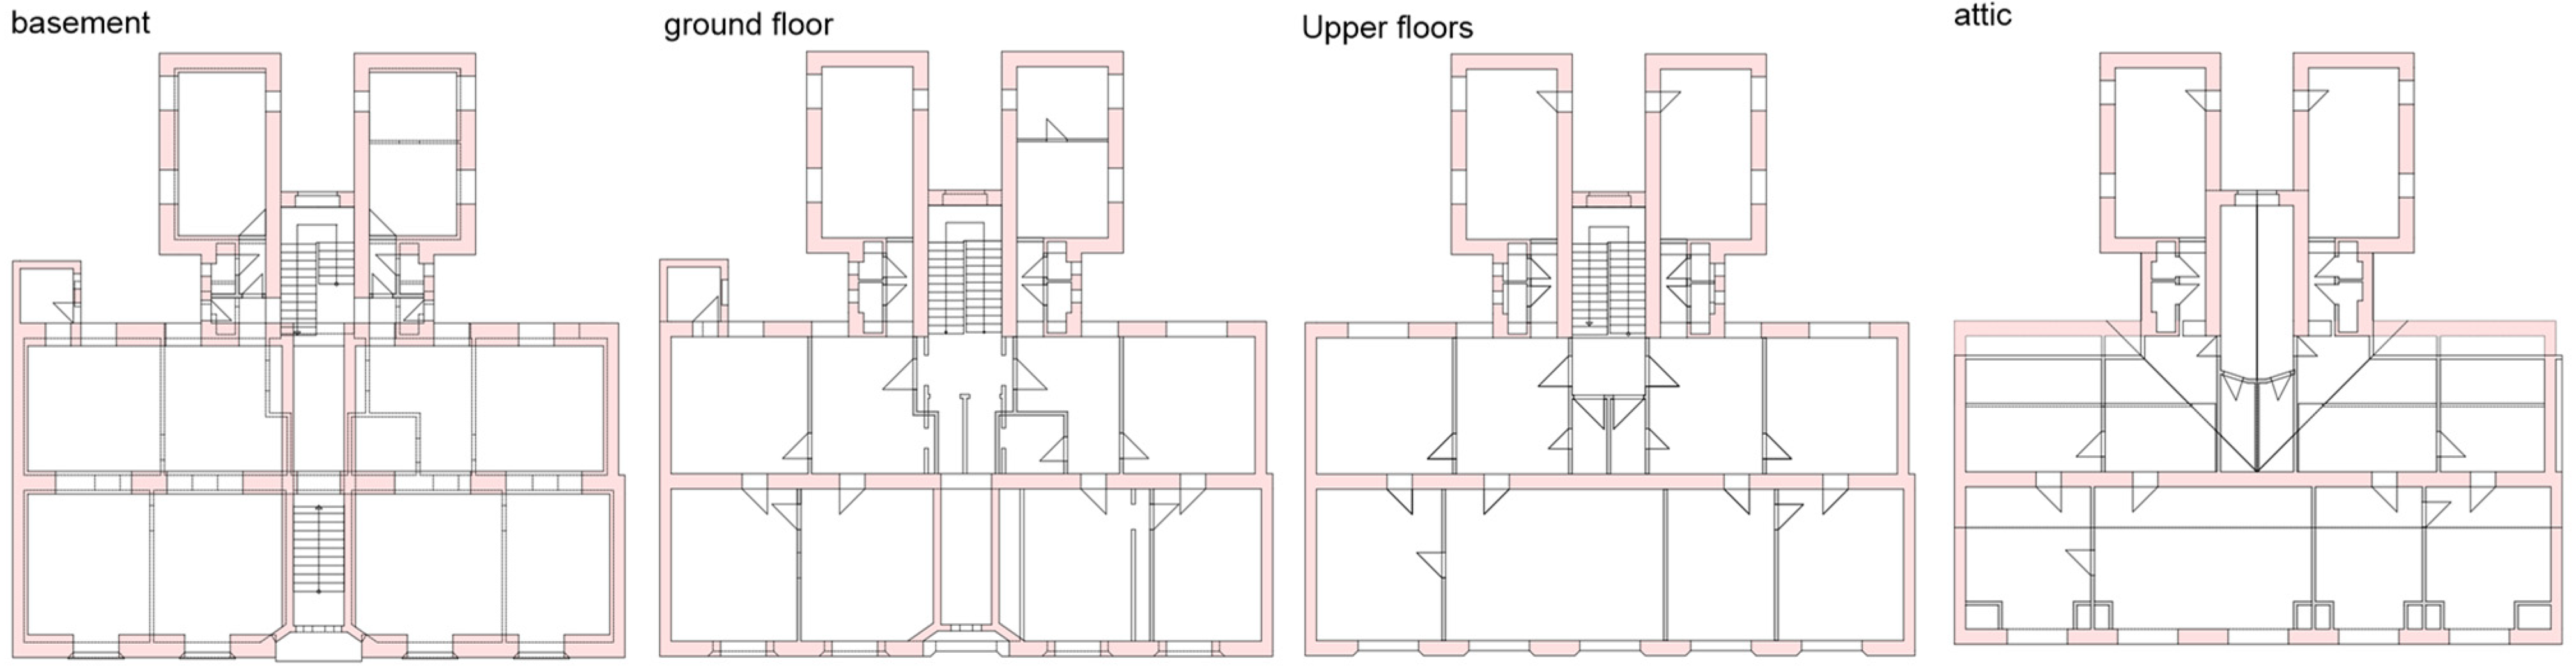
The dimensions of the floor plan are 24.4 × 12 m on the street side and 10.6 × 12 m on the courtyard side, resulting in a gross floor plan area of approximately 407 m
2 and total gross area of the building of around 2440 m
2. The building consists of a basement, ground floor, three stories, and an attic (
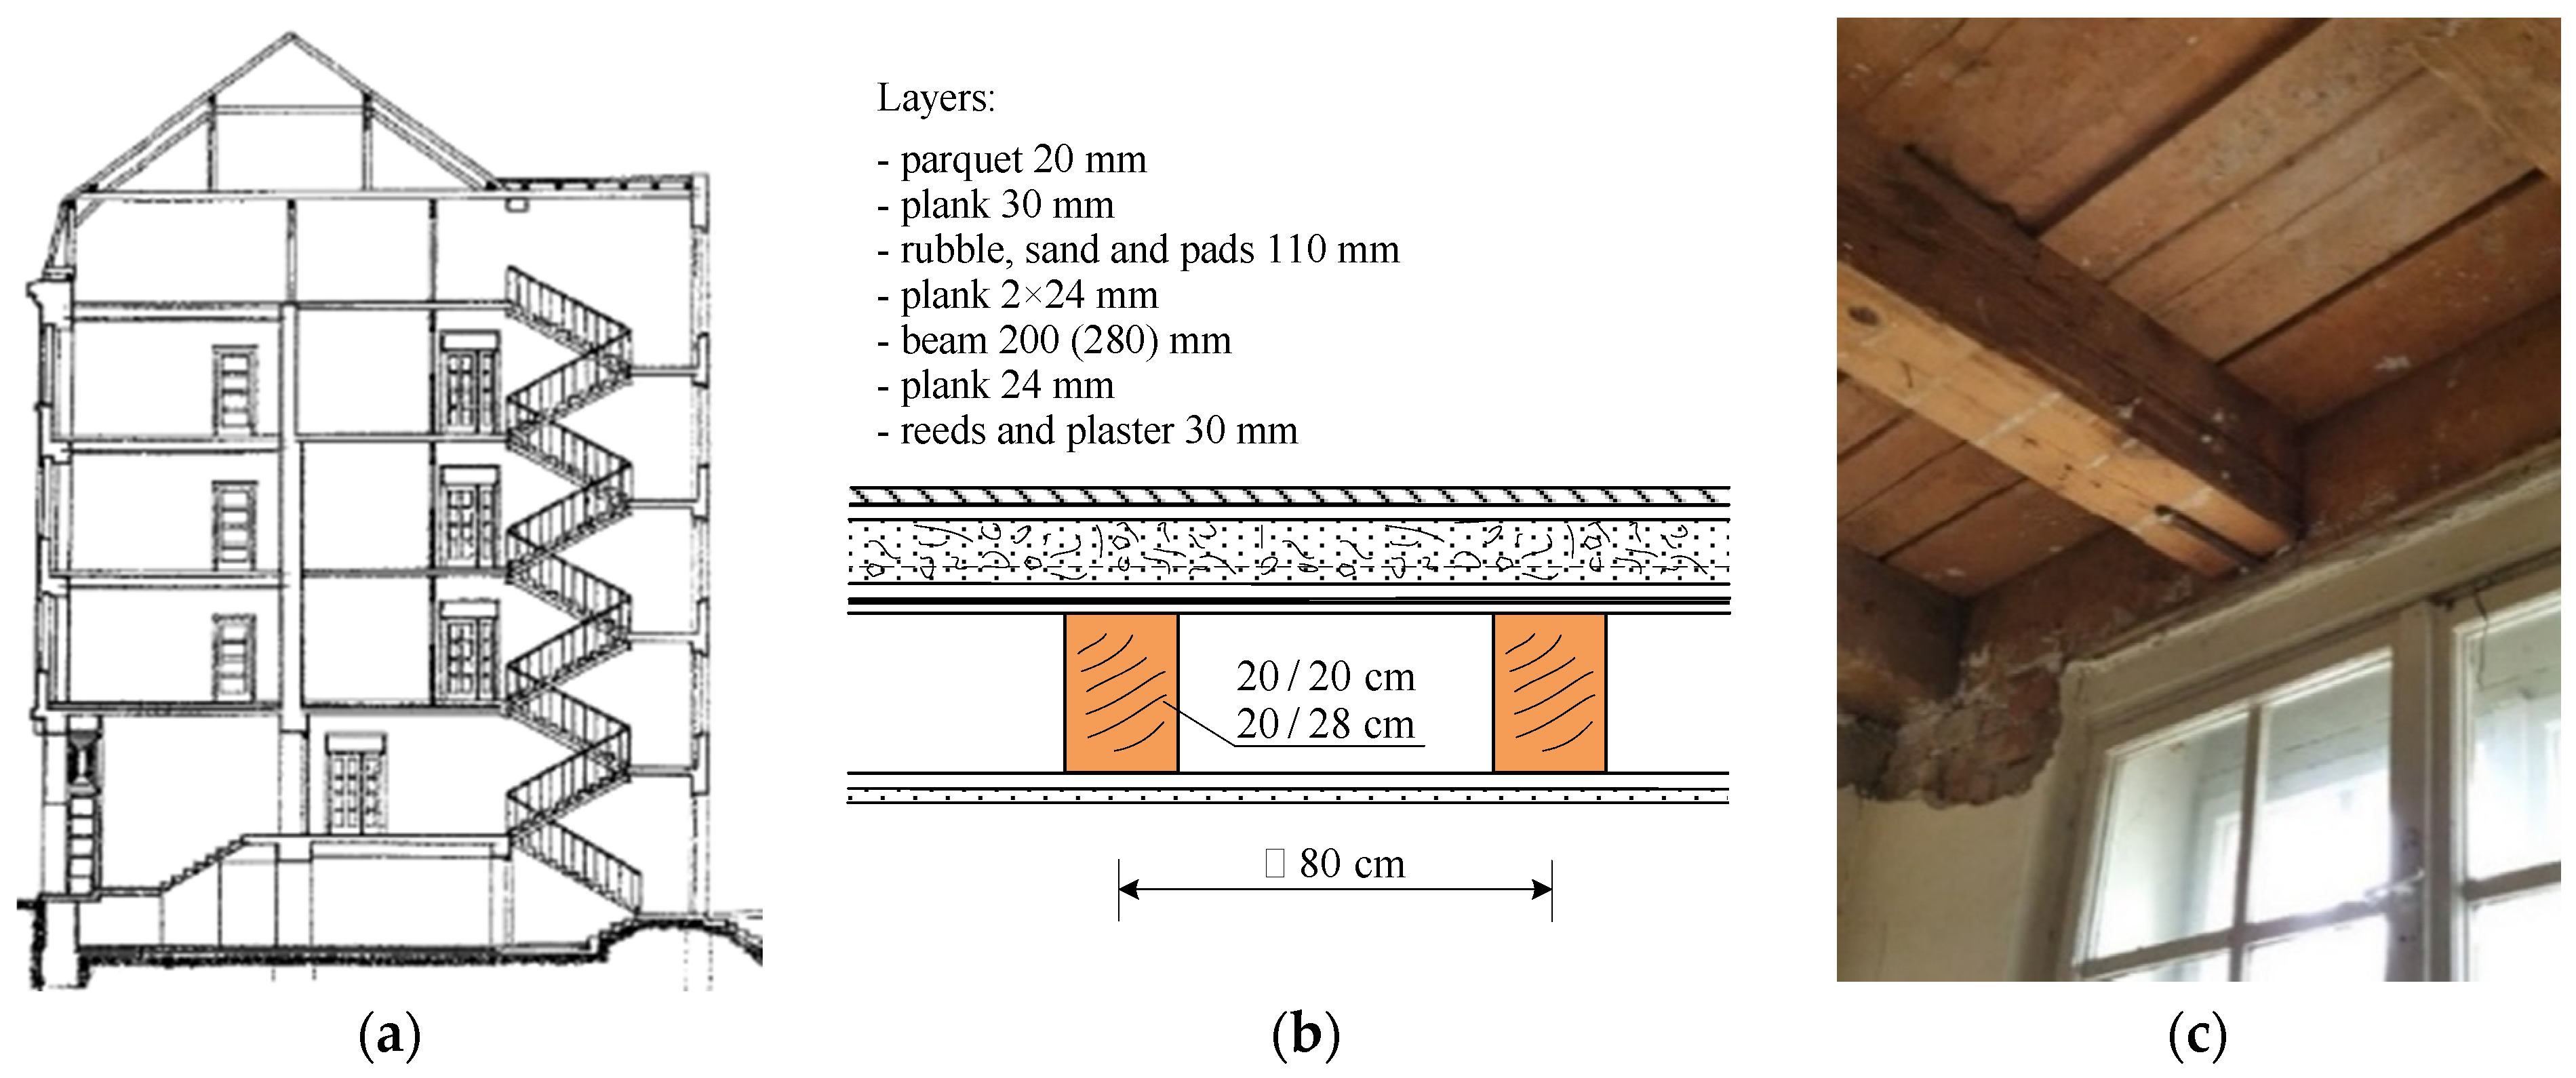
Figure 4). The basement has a height of 3 m, while the ground and first floors are 3.5 m high. The total height of the building is 22.70 m. The annexes on the courtyard side of the existing building are connected to its main part, which faces the street. The floor plan of the building is relatively irregular, with heterogeneous floor structures.
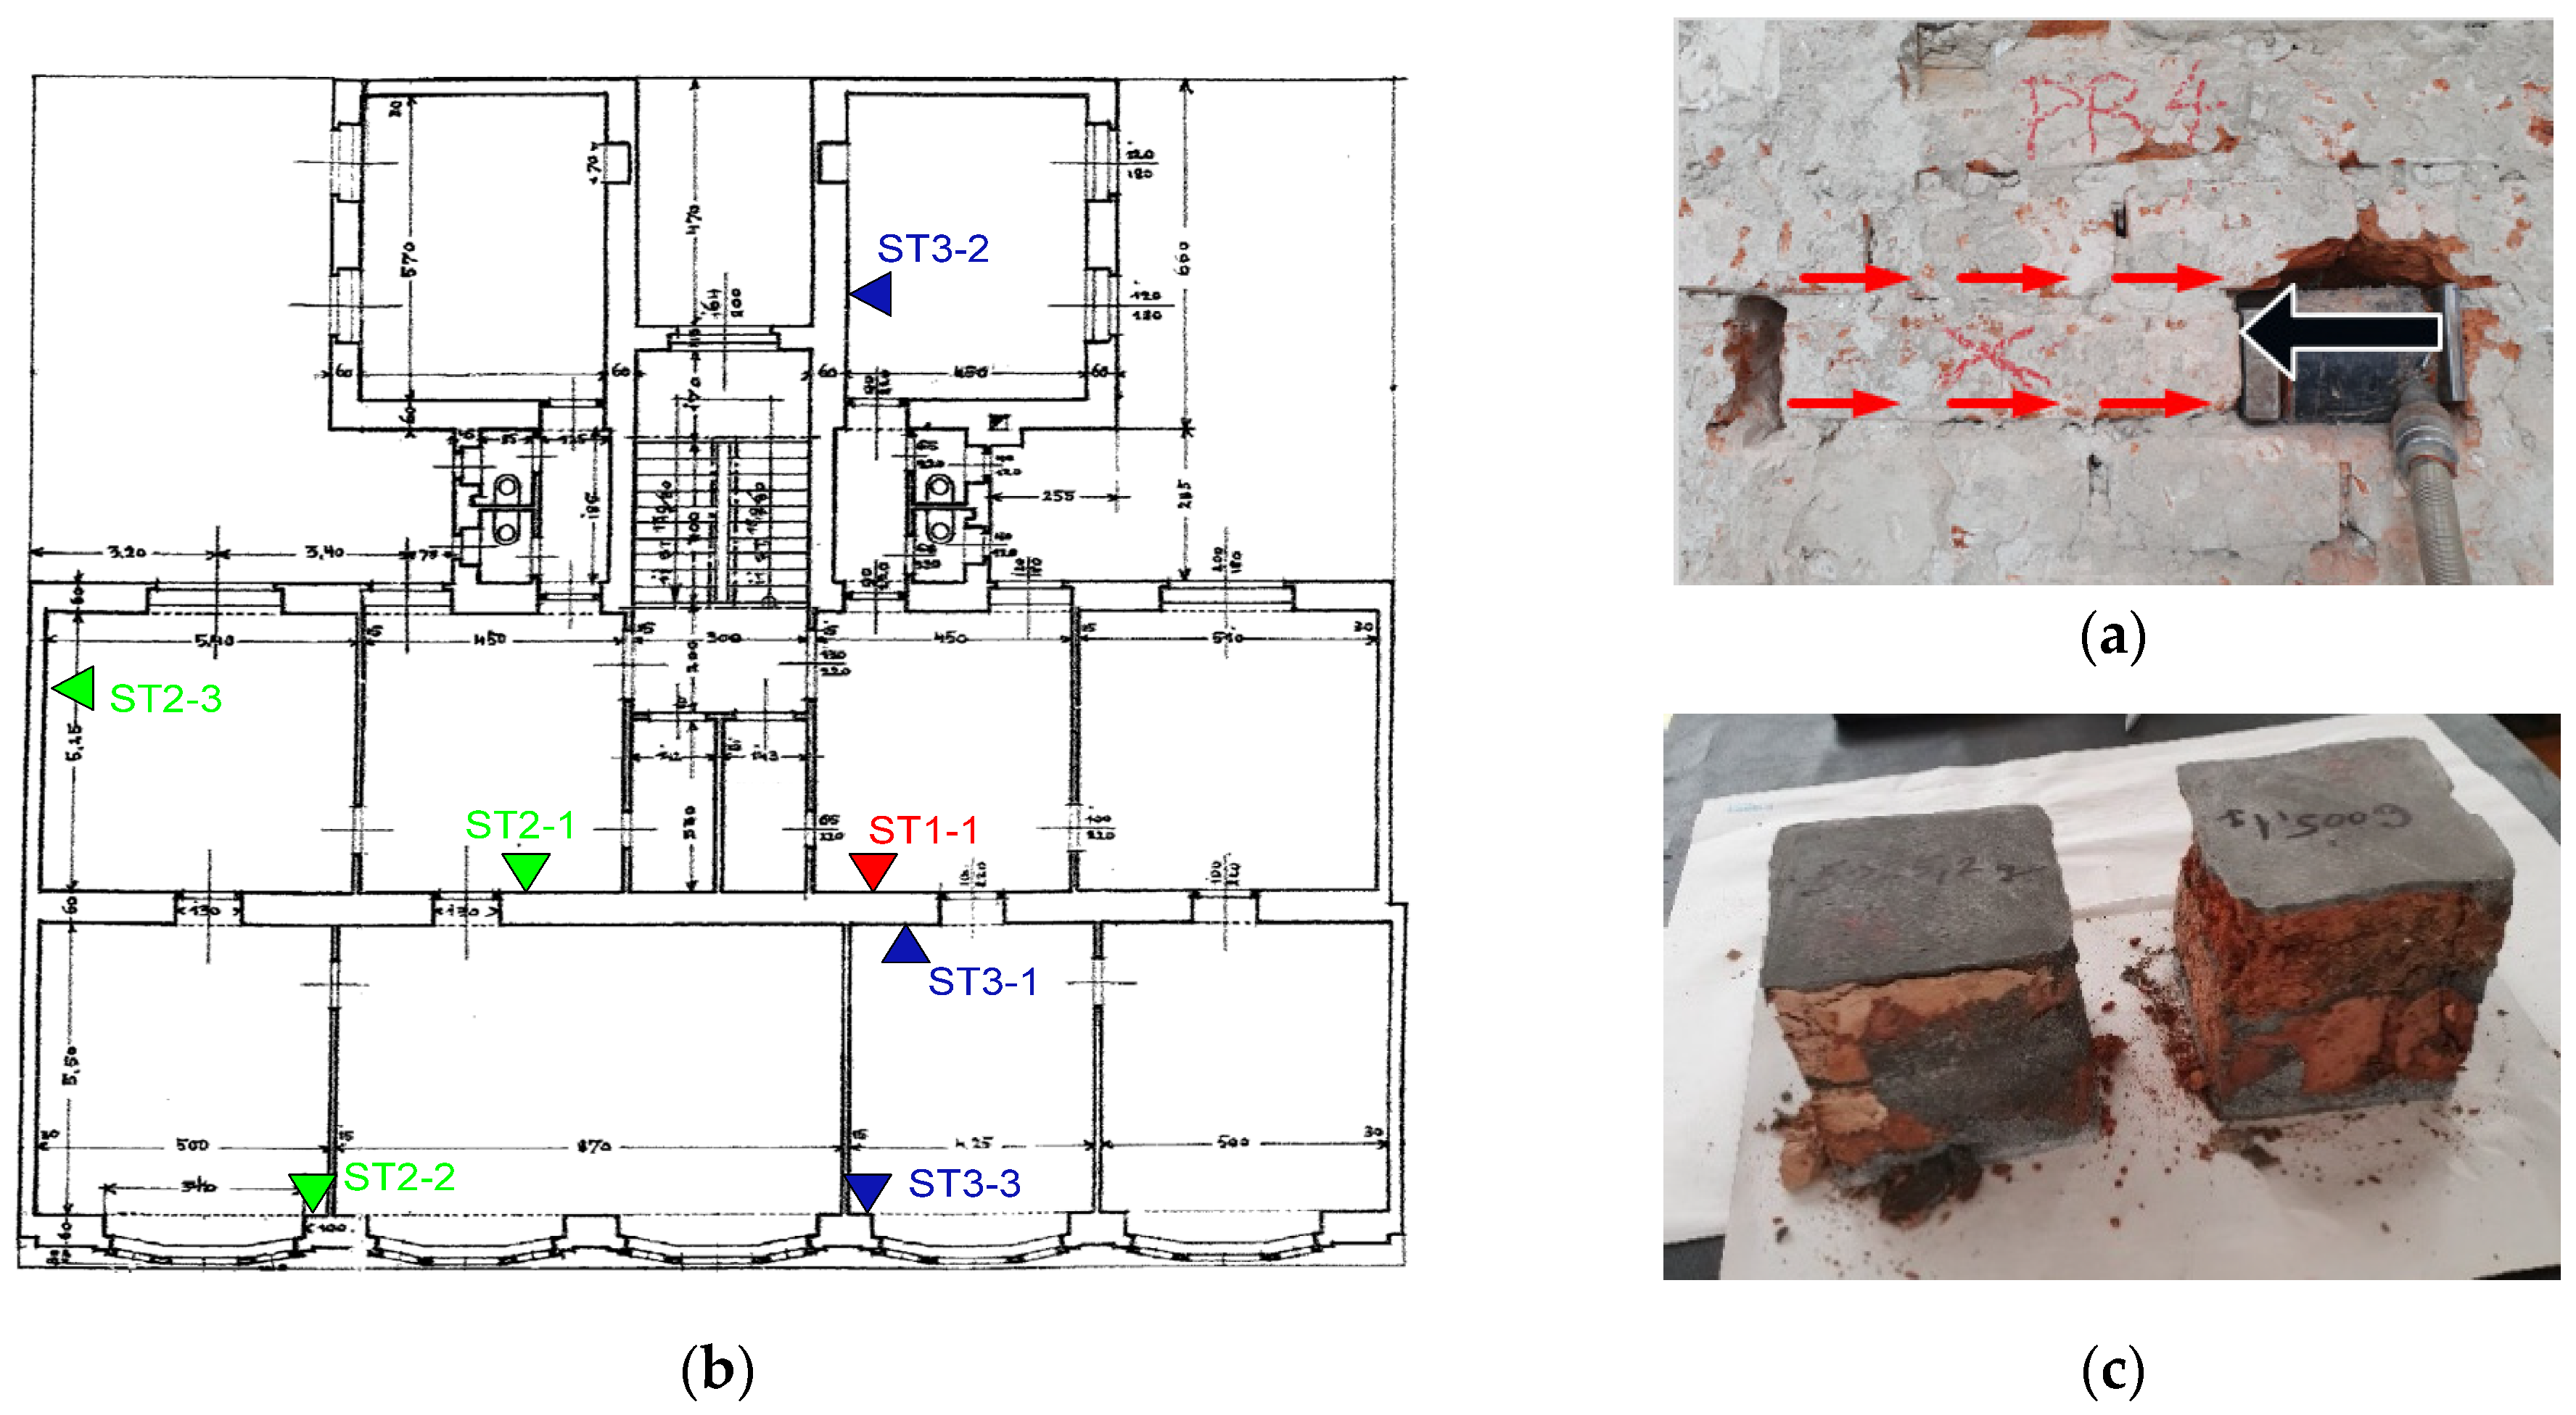
The structure consists of a system of interconnected solid brick walls that extend continuously from the foundation to the roof, so the criterion of regularity in elevation is met. The load-bearing walls are 90, 60, 45, 30, and 15 cm thick, constructed of old solid clay brick (290 × 140 × 65 mm). The partition walls are 7 and 15 cm thick, also built of solid bricks. The walls are connected by spandrels, parapets, and reinforced concrete (RC) beams. The foundations consist of 90 cm thick brick walls built over a layer of concrete.
The floor structure (
Figure 5) located above the basement on the street side of the building is a solid RC slab with a system of RC beams. As for the upper floors, they feature timber joists that are arranged in a transverse manner, with rubble filling used in the floor structure. During renovations, RC slabs measuring 8 cm in thickness were added above the ground floor and the third floor on the southern side of the building. The floor structure consists of timber joists with a layer of concrete with unknown reinforcement and properties on top. In the middle part of the building next to the staircase landing, there is an RC slab supported by RC beams on the edge.
The roof structure is made of timber, and the attic has been adapted into a living space over time. Inside the building, there is a double staircase made of prefabricated RC elements, which are supported by walls and steel profiles. Additionally, there are RC platforms incorporated into the staircase design.
The first inspection of the building was carried out on the day of the earthquake, 22 March 2020, and the building was categorized as temporarily unusable. Severe damage to partition walls, and moderate damage to most load-bearing walls except for the courtyard wall that was severely damaged, was observed. The gables in the attic space of the building and the chimneys were also severely damaged. Slight damage was recorded to the floor structures, the staircase, and the roof structure, with indications of very severe damage to the chimney and some of the tiles falling off. Photographs of the damage are shown in
Figure 6.
The seismic loading was determined on the basis of a reference peak ground acceleration (PGA) for the earthquake return periods of 95, 225, and 475 years. The seismic hazard map of the Republic of Croatia [
41], which can be accessed online at
http://seizkarta.gfz.hr/hazmap/ (accessed on 5 May 2023), was used for the calculation.
5. Numerical Models and Analysis Methods
5.1. Model Description
Various numerical models were generated using the software ETABS v.17 [
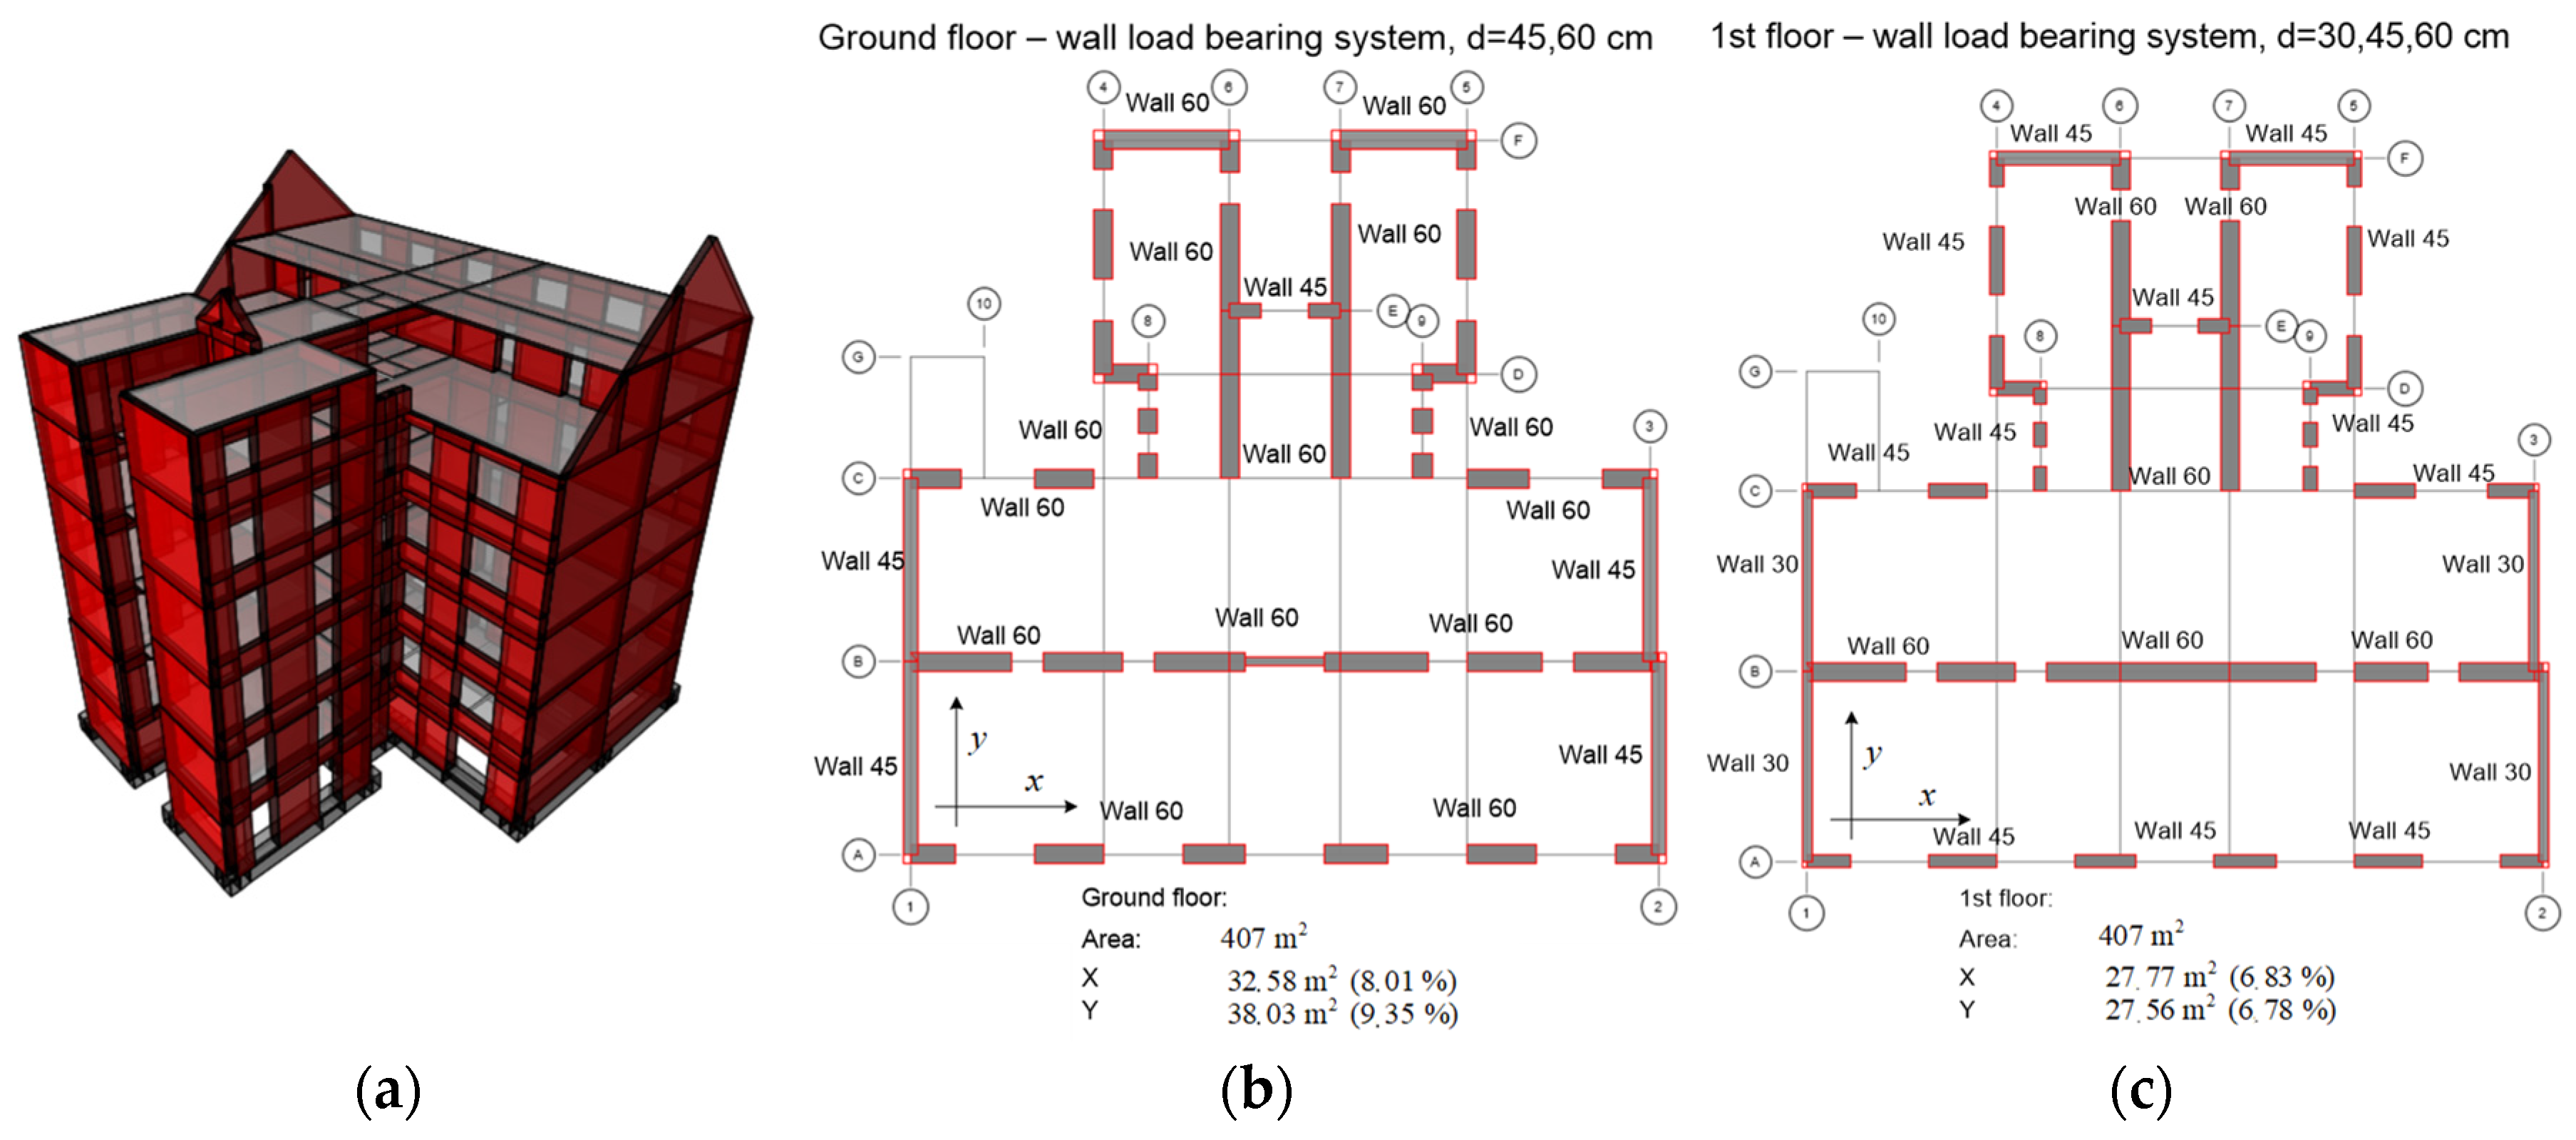
47] through the implementation of the finite element method. A three-dimensional representation of the numerical model that shows a vertical and horizontal load-bearing system is shown in
Figure 10a, and a more detail plan layout for each story and values of the available shear areas of load-bearing walls are displayed in
Figure 10b,c. Material parameter values were determined through experiments. After processing the results and comparing them with the prescribed values, the values shown in
Table 4 were adopted. It is worth noting that some minor interventions in walls and lintels were made in low-quality concrete (C12/15). The partial factor for the material property was taken to have a value of 1.5 for linear calculations, while for nonlinear calculations, the value was 1.0.
The model incorporated the cracking of the cross-sections based on Croatian standards HRN EN 1998-1 and HRN EN 1998-3 (adopted Eurocode 1998 Standard). The initial flexural stiffness of RC beams, columns, and walls was reduced to 50%. Similarly, the shear stiffness of all elements was considered to be 50% of the initial stiffness. The nonlinear behavior of the load-bearing elements accounted for local formation of plastic hinges. The analysis initially focused on the bearing capacity of walls and spandrels, considering various failure mechanisms. It was found that shear failure induced by diagonal cracking or sliding was the dominant mode of failure. The confidence factor in this study was taken as 1.00.
The nonlinear behavior of the model and the elements was taken into account through concentrated plastic hinges placed at critical points in the structure. Concentrated plasticity is defined in frame elements but also in shell elements, and the latter was the most important here because of the walls. The load capacity of walls and spandrels was determined based on various failure mechanisms. To determine the capacity curve of a load-bearing wall, all failure mechanisms were observed and the predominant one was selected (
Table 5). It was found that shear failure arising from the development of diagonal cracks in the wall or shear failure from the sliding of the wall was dominant. There was also a failure of the wall that arose due to crushing of the material in the toe of the wall, which was initiated by its rocking. The deformation capacity and plastic hinge curves of masonry walls and lintels were defined in accordance with HRN EN 1998-3. The load-bearing capacity of reinforced concrete beams was calculated by accounting for and critically analyzing various standards such as HRN EN 1998-3 and ASCE/SEI 41-13 [
48].
The analysis utilized the assumption of semi-rigid diaphragms for the model. Nevertheless, it was crucial to ensure this property of the building in order to effectively utilize the in-plane bearing capacity of the walls. A separate analysis was later carried out for out-of-plane failure mechanisms assuming a lack of quality connections between the walls and the floor structures.
The total load of the structure consisted of the masonry weight and the weight of the floor structures, which was approximately 2.5 kN/m2 in all floor levels except for the basement, where it was 3.5 kN/m2. The additional permanent load was taken to be 1.5 kN/m2, and the imposed load was 2 kN/m2. Finally, the total estimated mass of the building above the foundation was about 3222 t.
Limit states were adopted according to Croatian Technical Regulation for Building Structures (CTRBS), which was introduced after the earthquakes in Croatia in 2020, and established seismic safety requirements for retrofitting of the damaged buildings. Unlike HRN EN 1998-3, which defines three limit states (near collapse (NC), significant damage (SD), and damage limitation (DL)), the CTRBS only considers the limit state of significant damage (SD). Under this limit state, the safety factor can be reduced to 0.5 for level 2 and 0.75 for level 3 of retrofitting.
Level 2 is the mandatory minimum retrofit requirement for residential buildings, like the one examined in this study. It is approximately equivalent to an earthquake event with a return period of 95 years, specifically for the limit state of significant damage. However, it should be emphasized that retrofit level 2 does not provide a satisfactory level of safety.
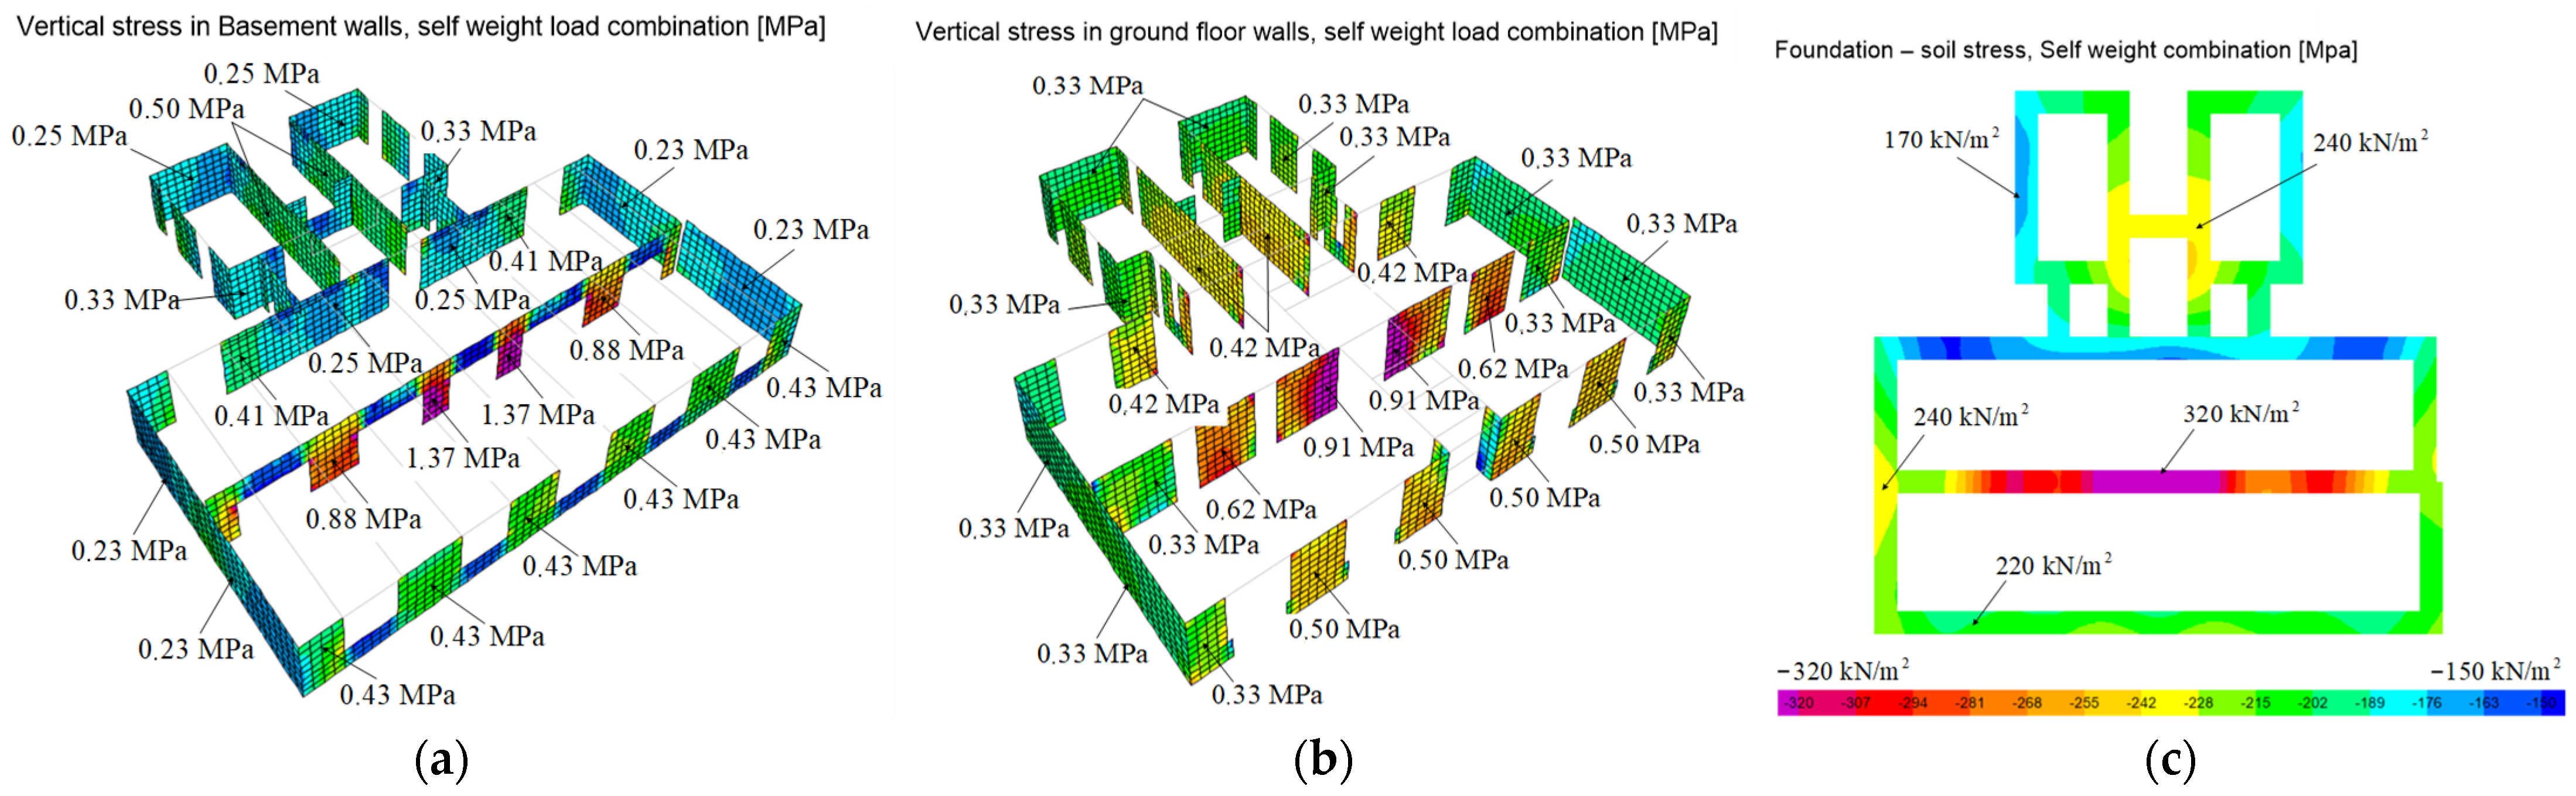
5.2. Vertical Loading Analysis
The results for the vertical loads represent the initial state for the nonlinear analysis, either static or dynamic. This is due to the stress state of elements being directly corelated with their stiffness and ductility when loaded with a lateral load. For the masonry building considered in this study, the most significant influences were those of the axial force on the rotational and shear capacity of the walls. Only the most significant results are provided below, to facilitate an interpretation of the effects of seismic loading on the structure, due to the vast amount of data generated.
The subfigures in
Figure 11 show the load-bearing elements’ normal stresses due to the permanent vertical loads in the basement and on the ground floor. The average stresses of the walls are mainly between 0.3 and 0.6 MPa.
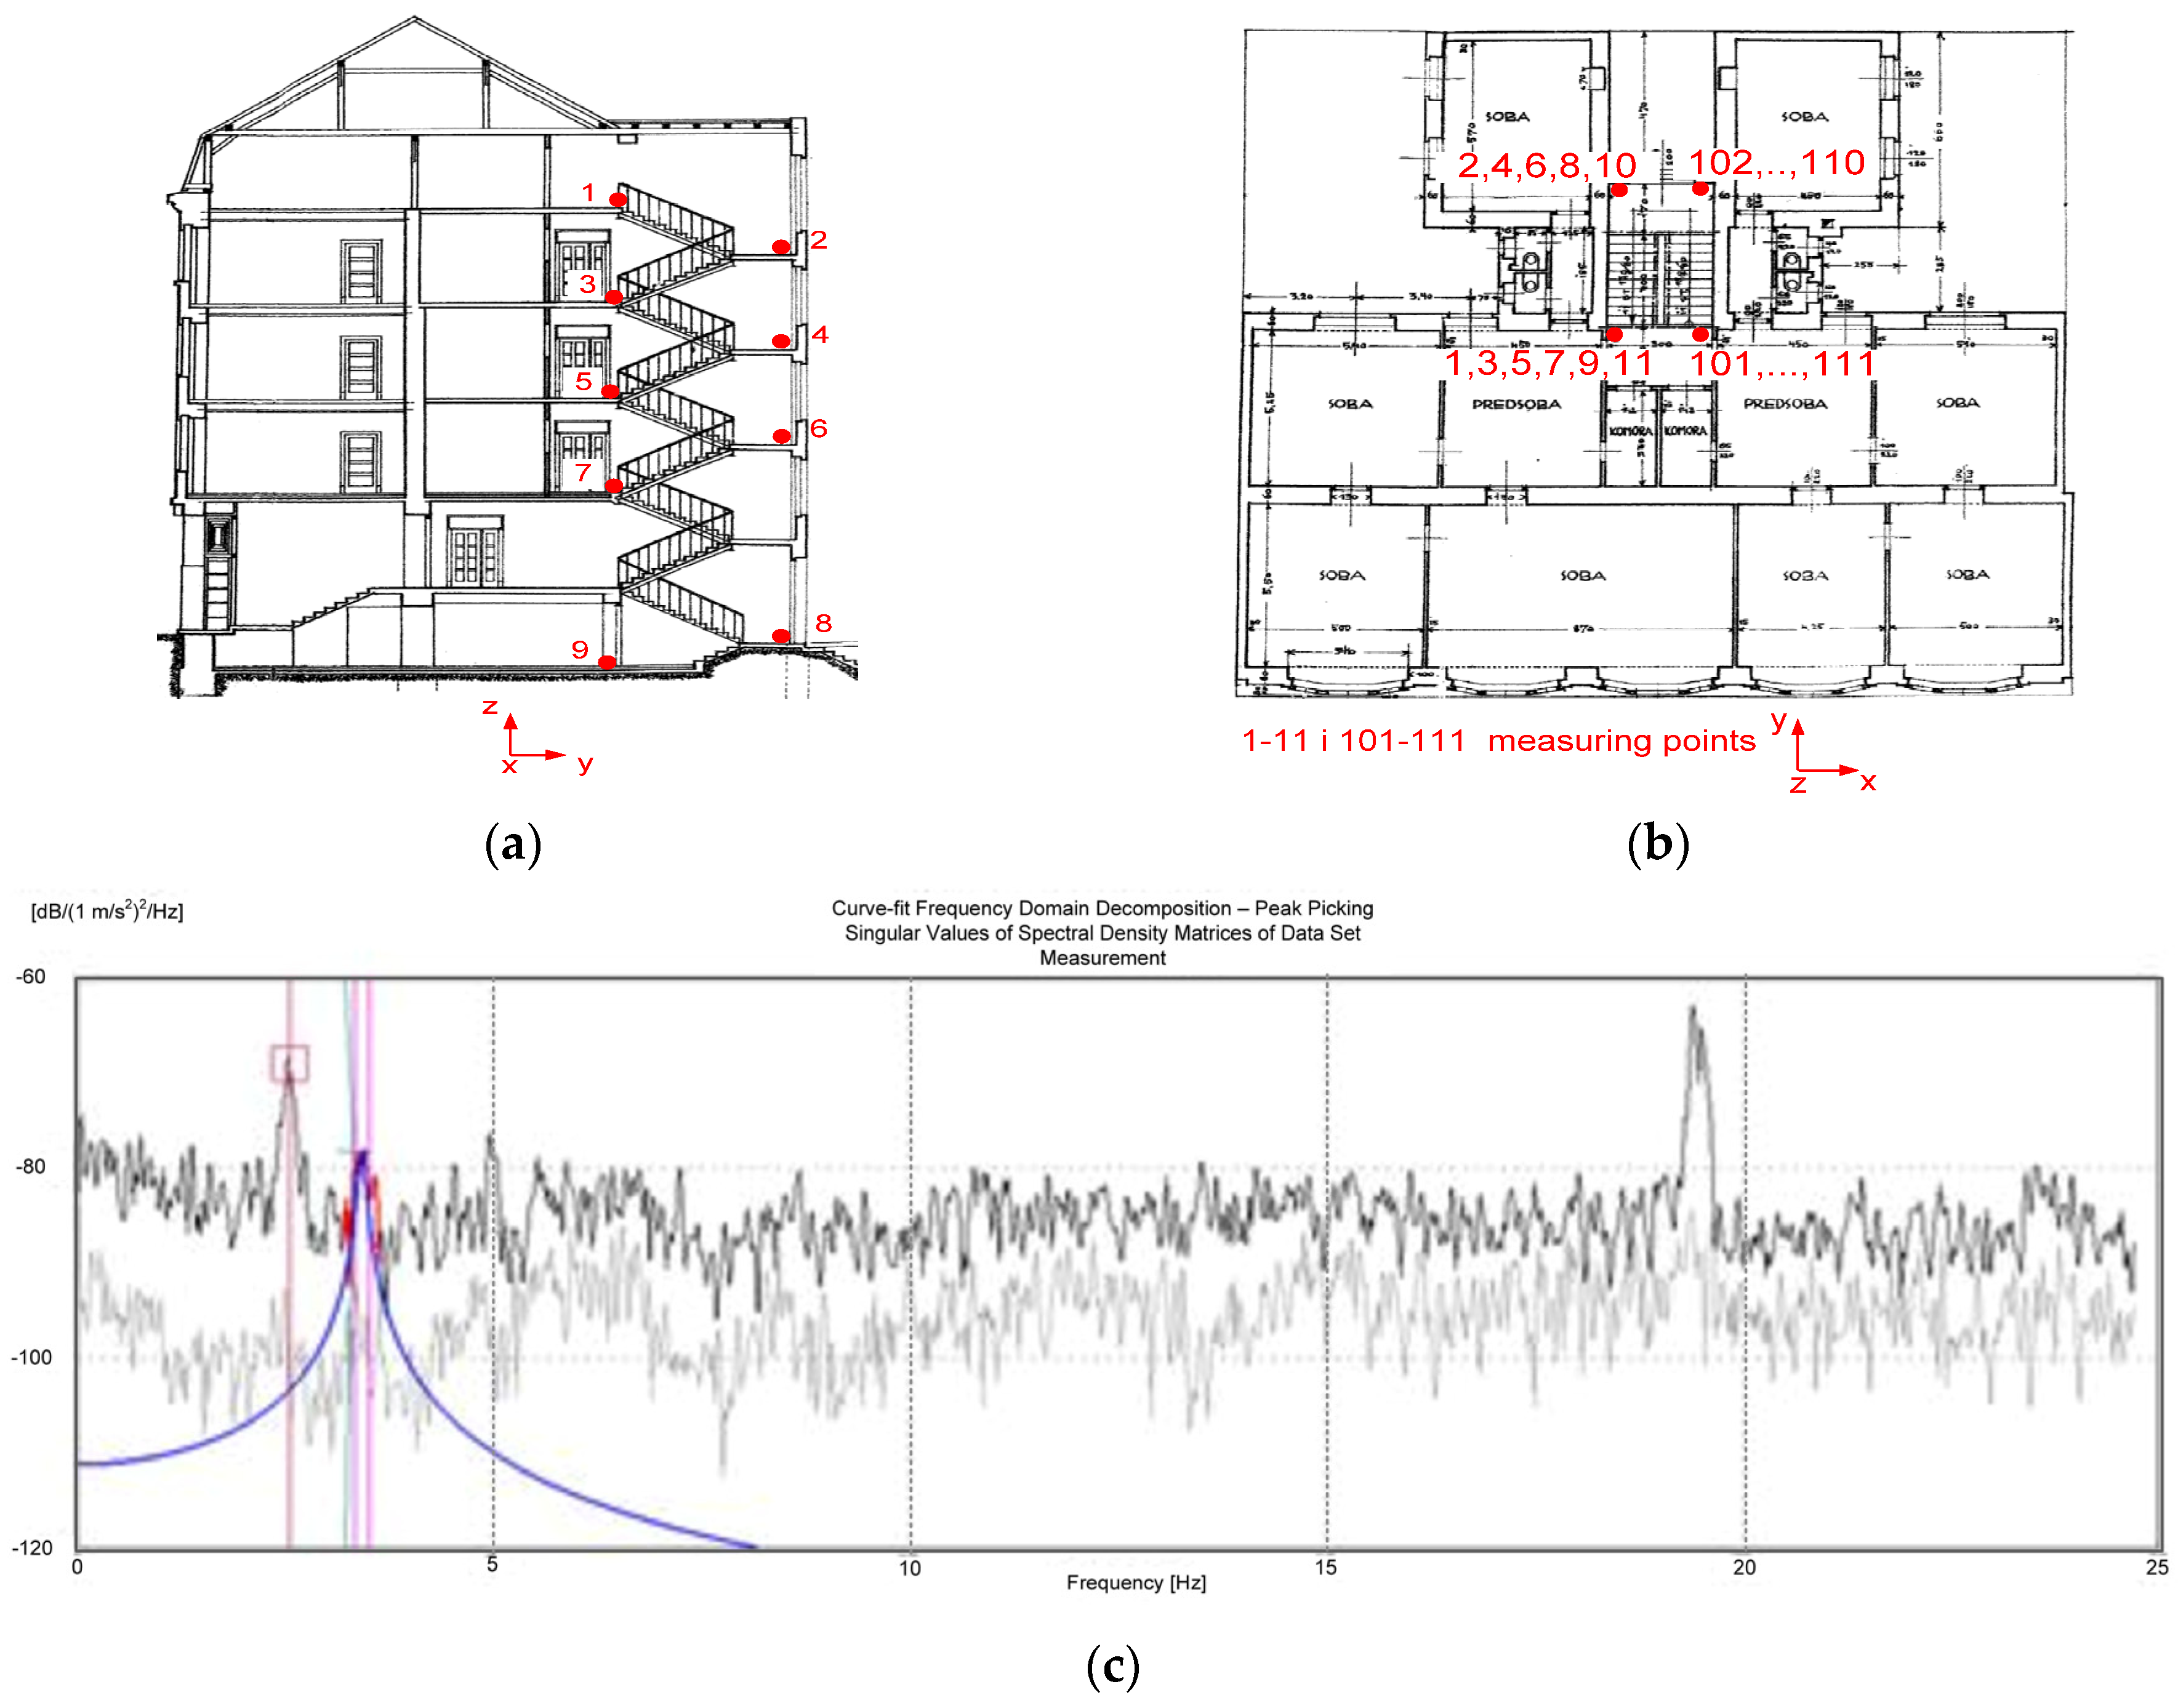
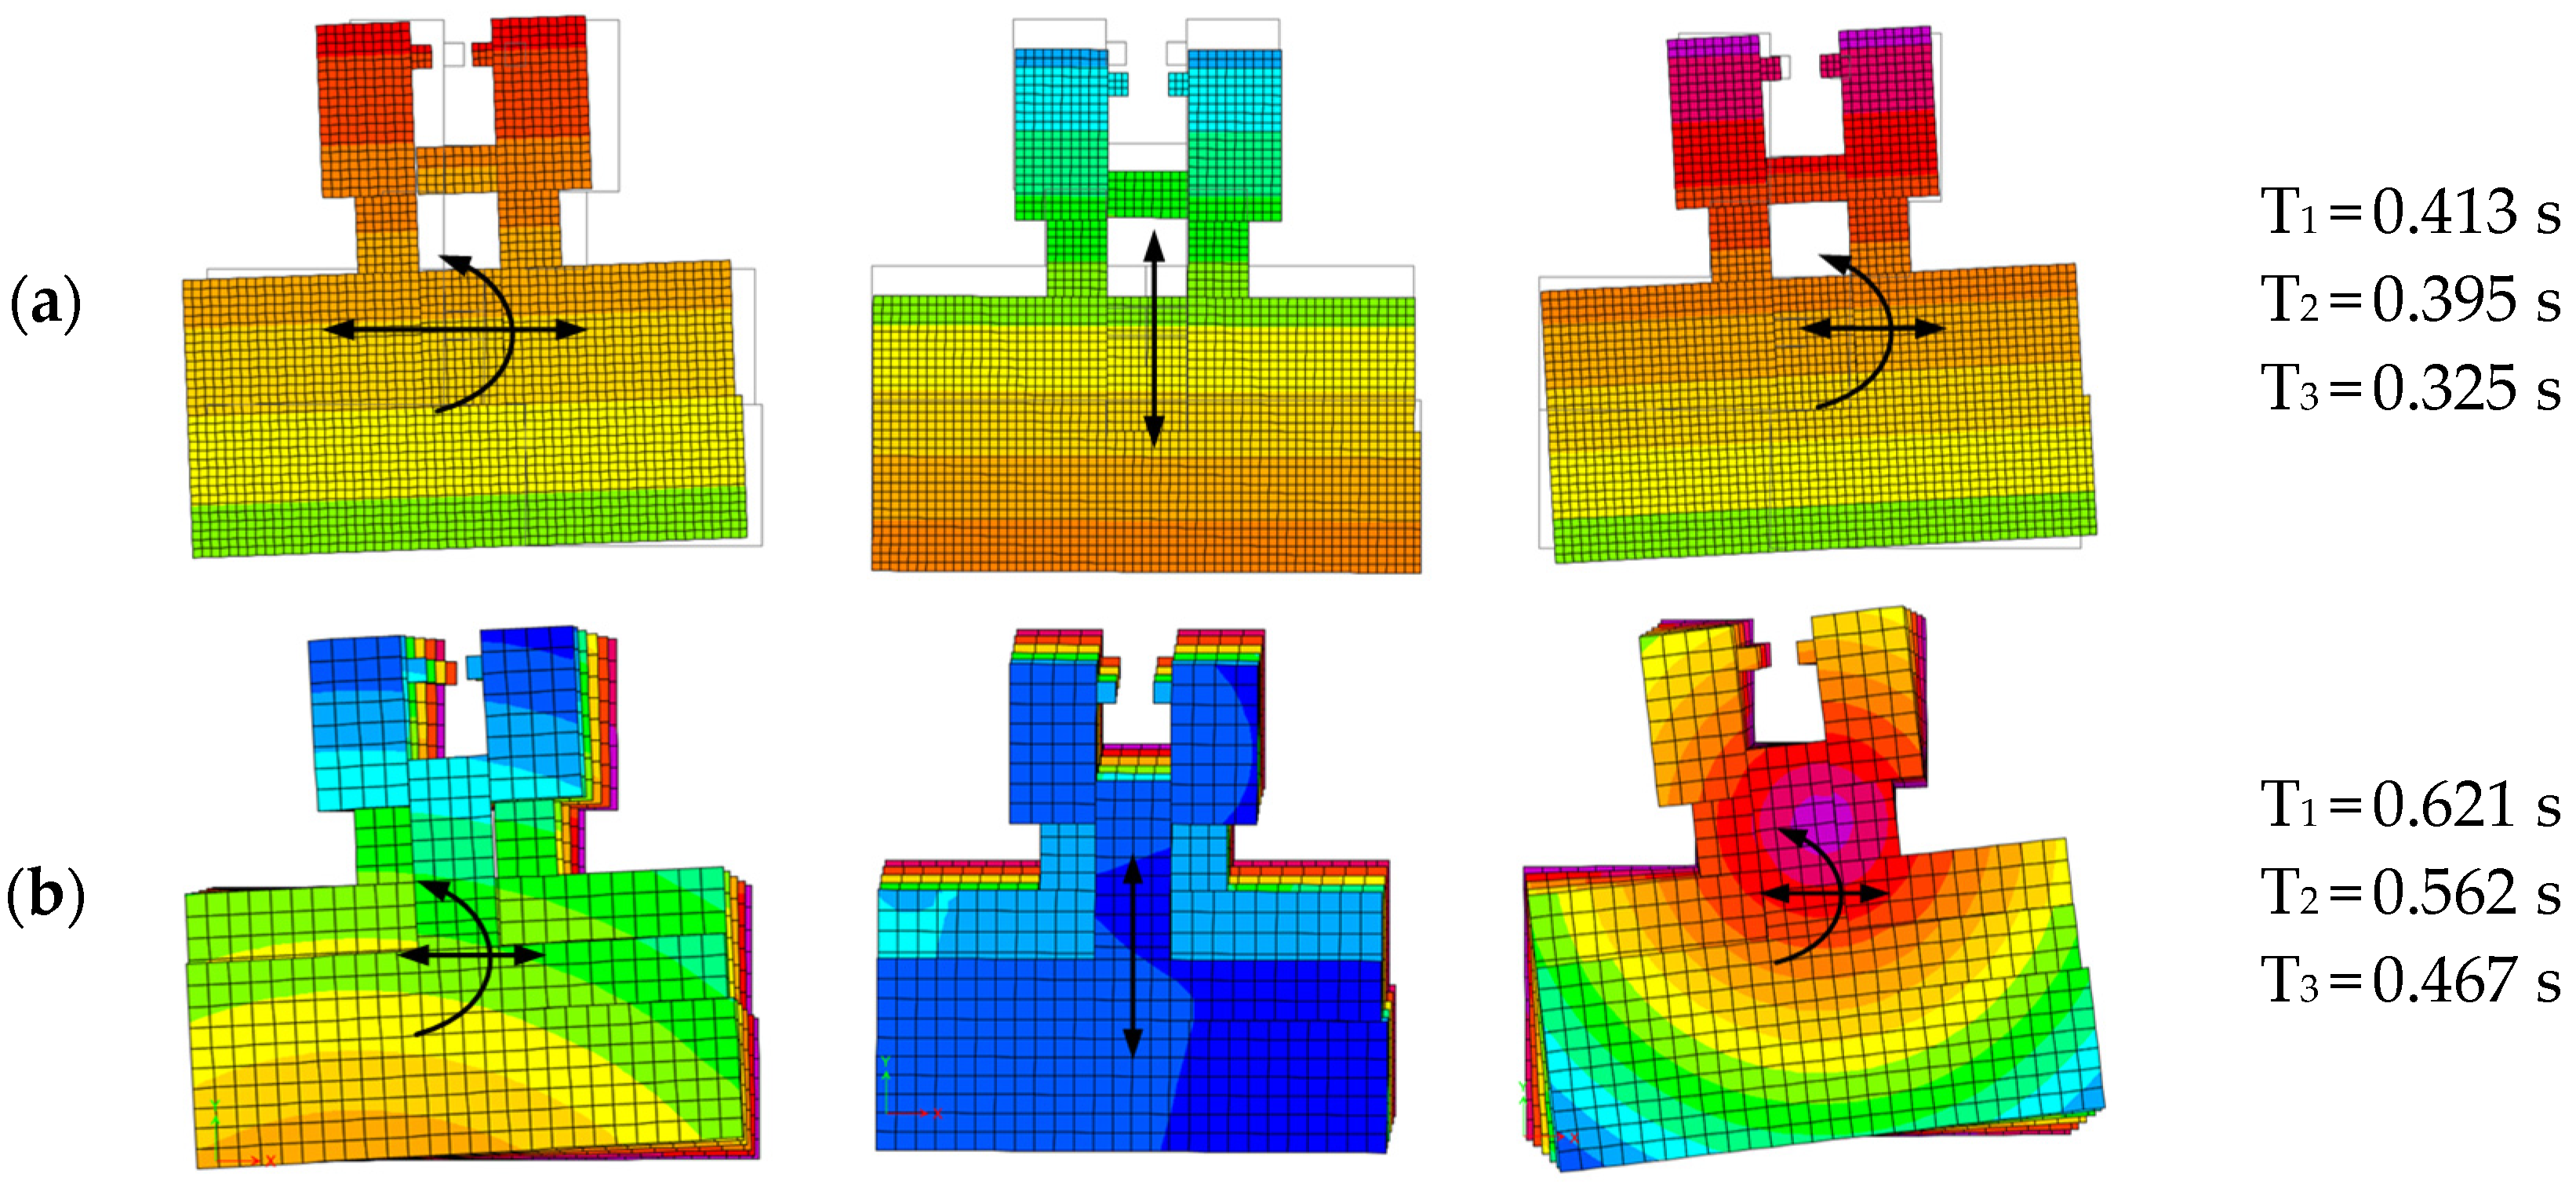
5.3. Dynamic Properties of the Building
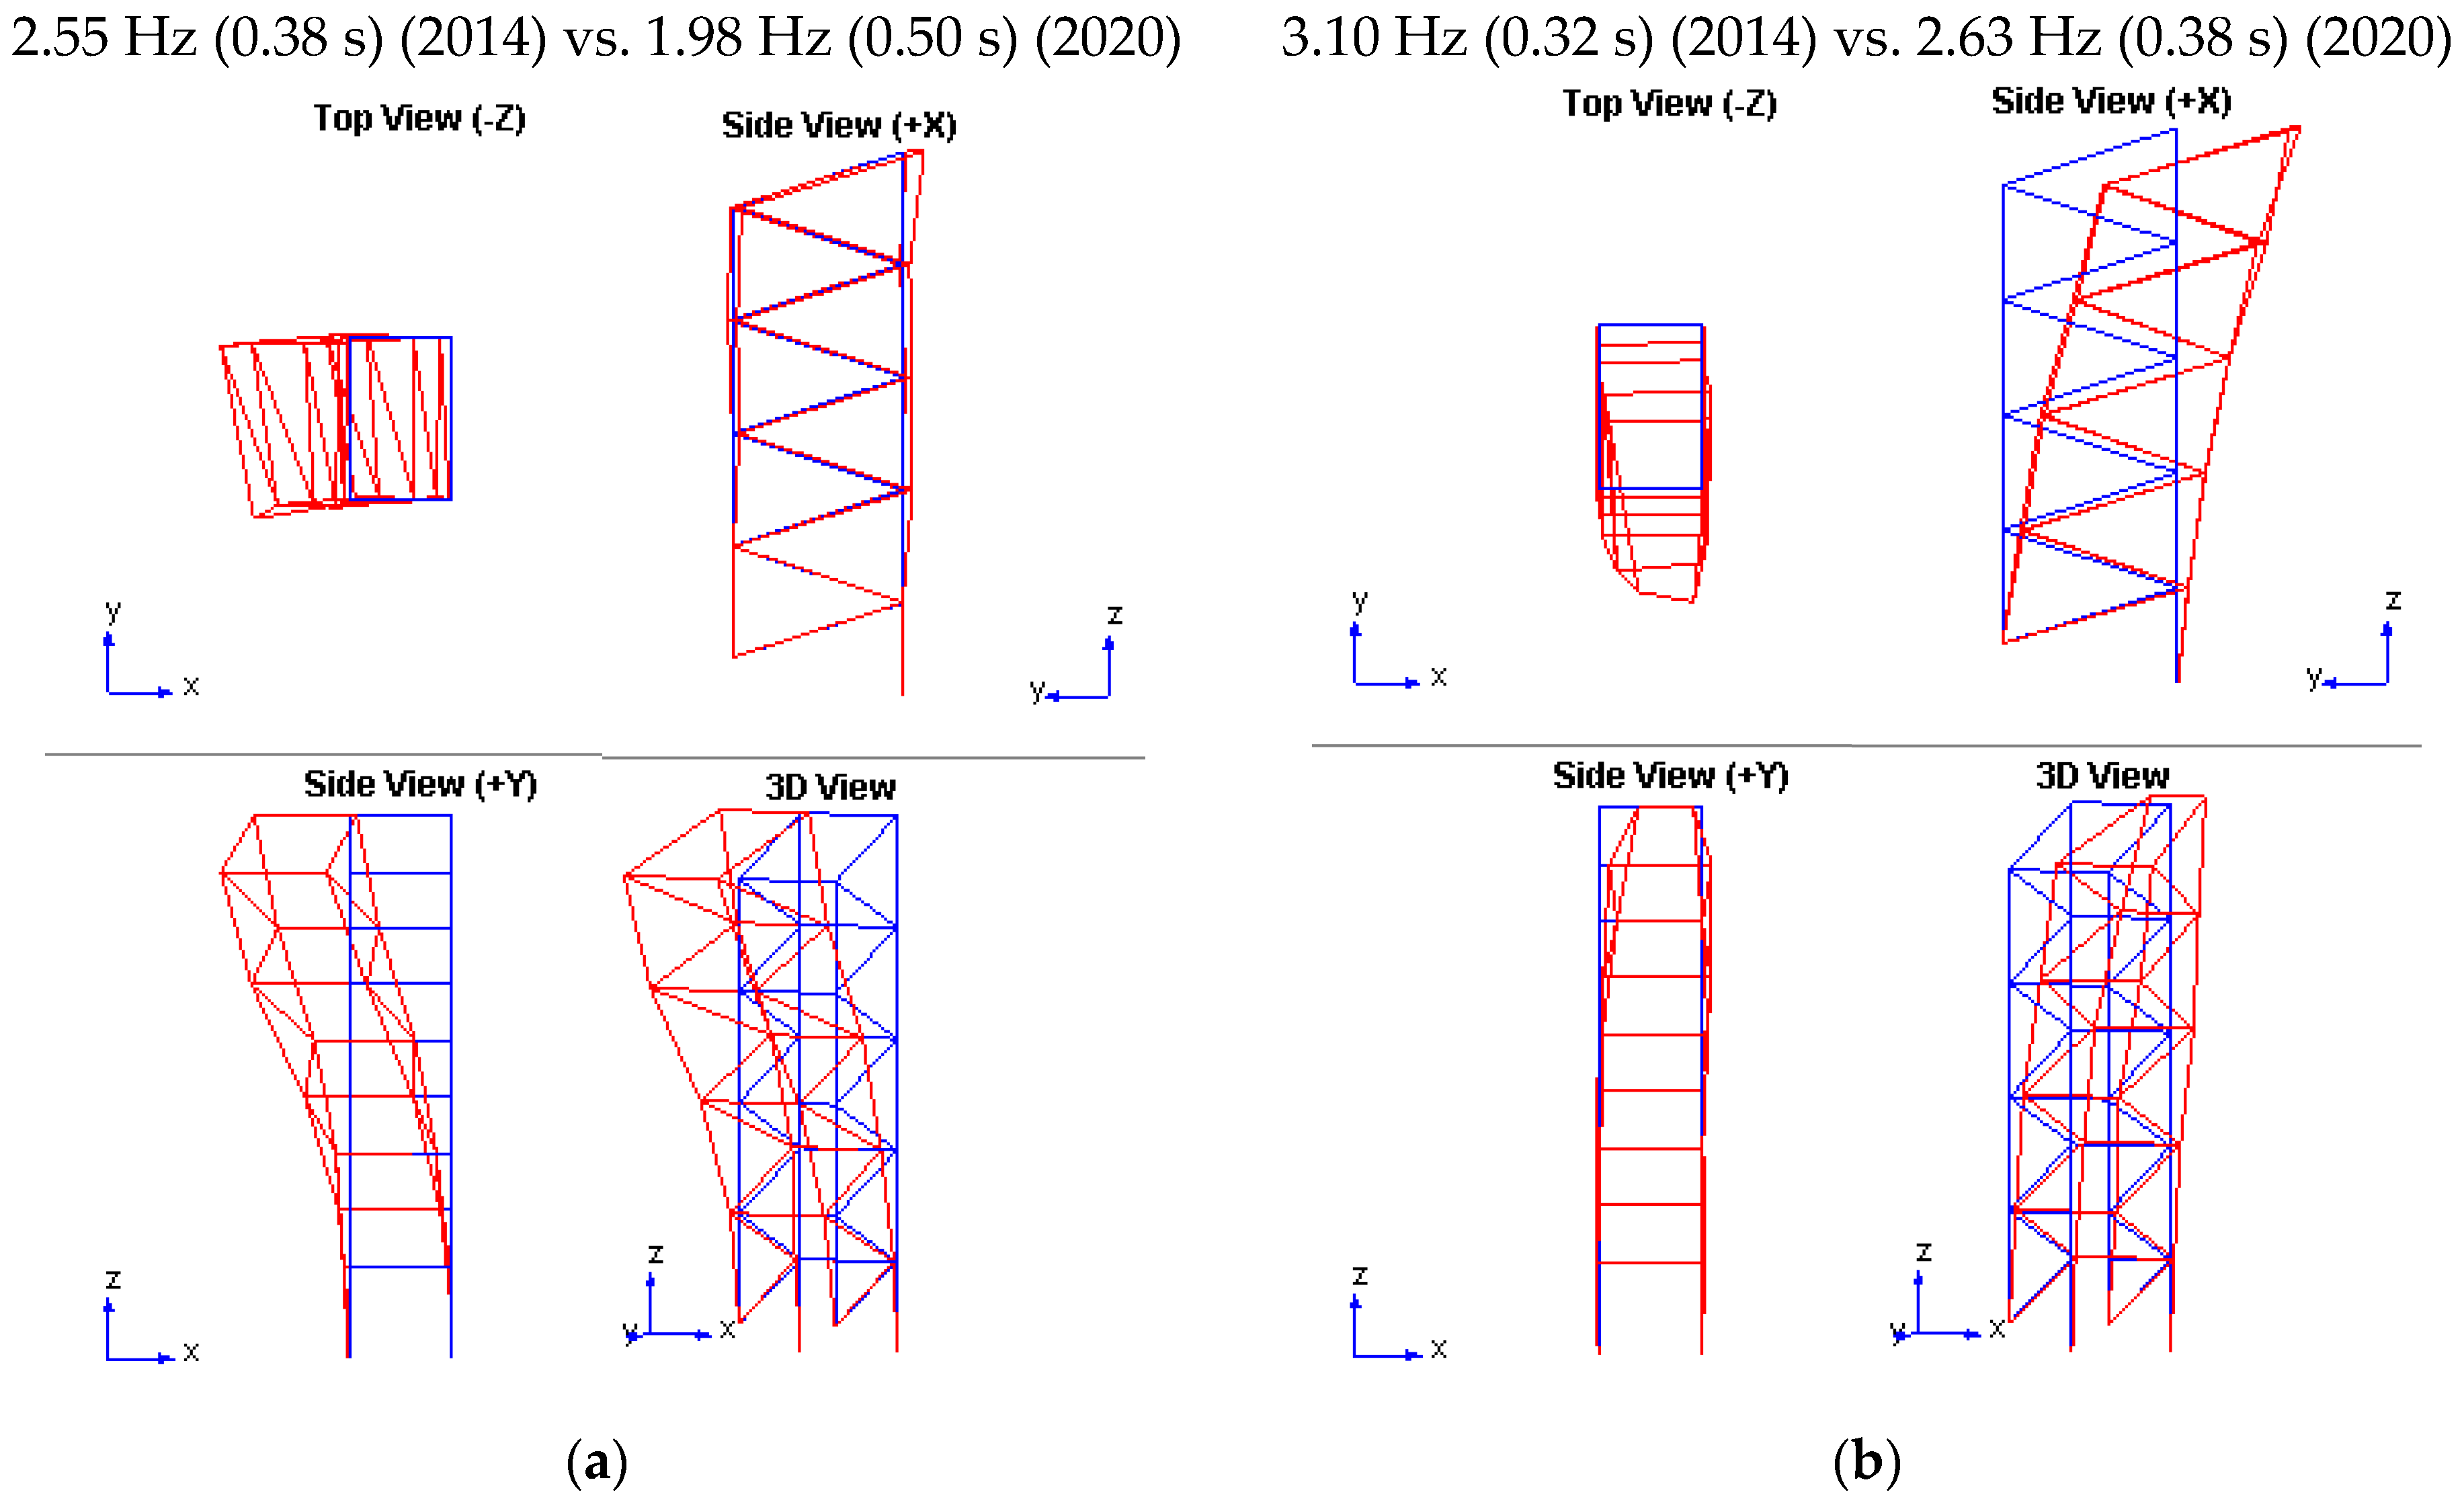
Calibration of the numerical model was carried out to obtain the measured values from the ambient vibration measurements. To achieve this, the internal forces in the structure were analyzed and, based on them, the degree of cracking of each element was determined (reduction in the initial stiffness). The stiffness of the second model for the calculation of natural vibrations was defined near the SD limit state. The periods were prolonged due to a significant reduction in the stiffness of the structure in this case.
Figure 12 shows the natural vibration modes of both models. The second vibration shape does not fully match the shape in the Y direction obtained via measurement since the partition walls are not modeled in the numerical model. In addition, the influence of the adjacent building is neglected. Modal participating mass ratios indicate that in the first natural periods in directions X and Y, the activation of the model mass is larger than 60%.
5.4. Linear Analysis: Response Spectrum Method
A linear analysis using the response spectrum method was firstly considered. The design response spectrum, which is required in the CTRBS for seismic retrofitting at level 2, was used with a return period of 95 years. An eccentricity of 5% and behavior factor of 1.5 were considered in the analysis. Summarized results are presented below.
A check of the LD limit state is not prescribed in the CTRBS; therefore, this was performed according to the standard for new buildings.
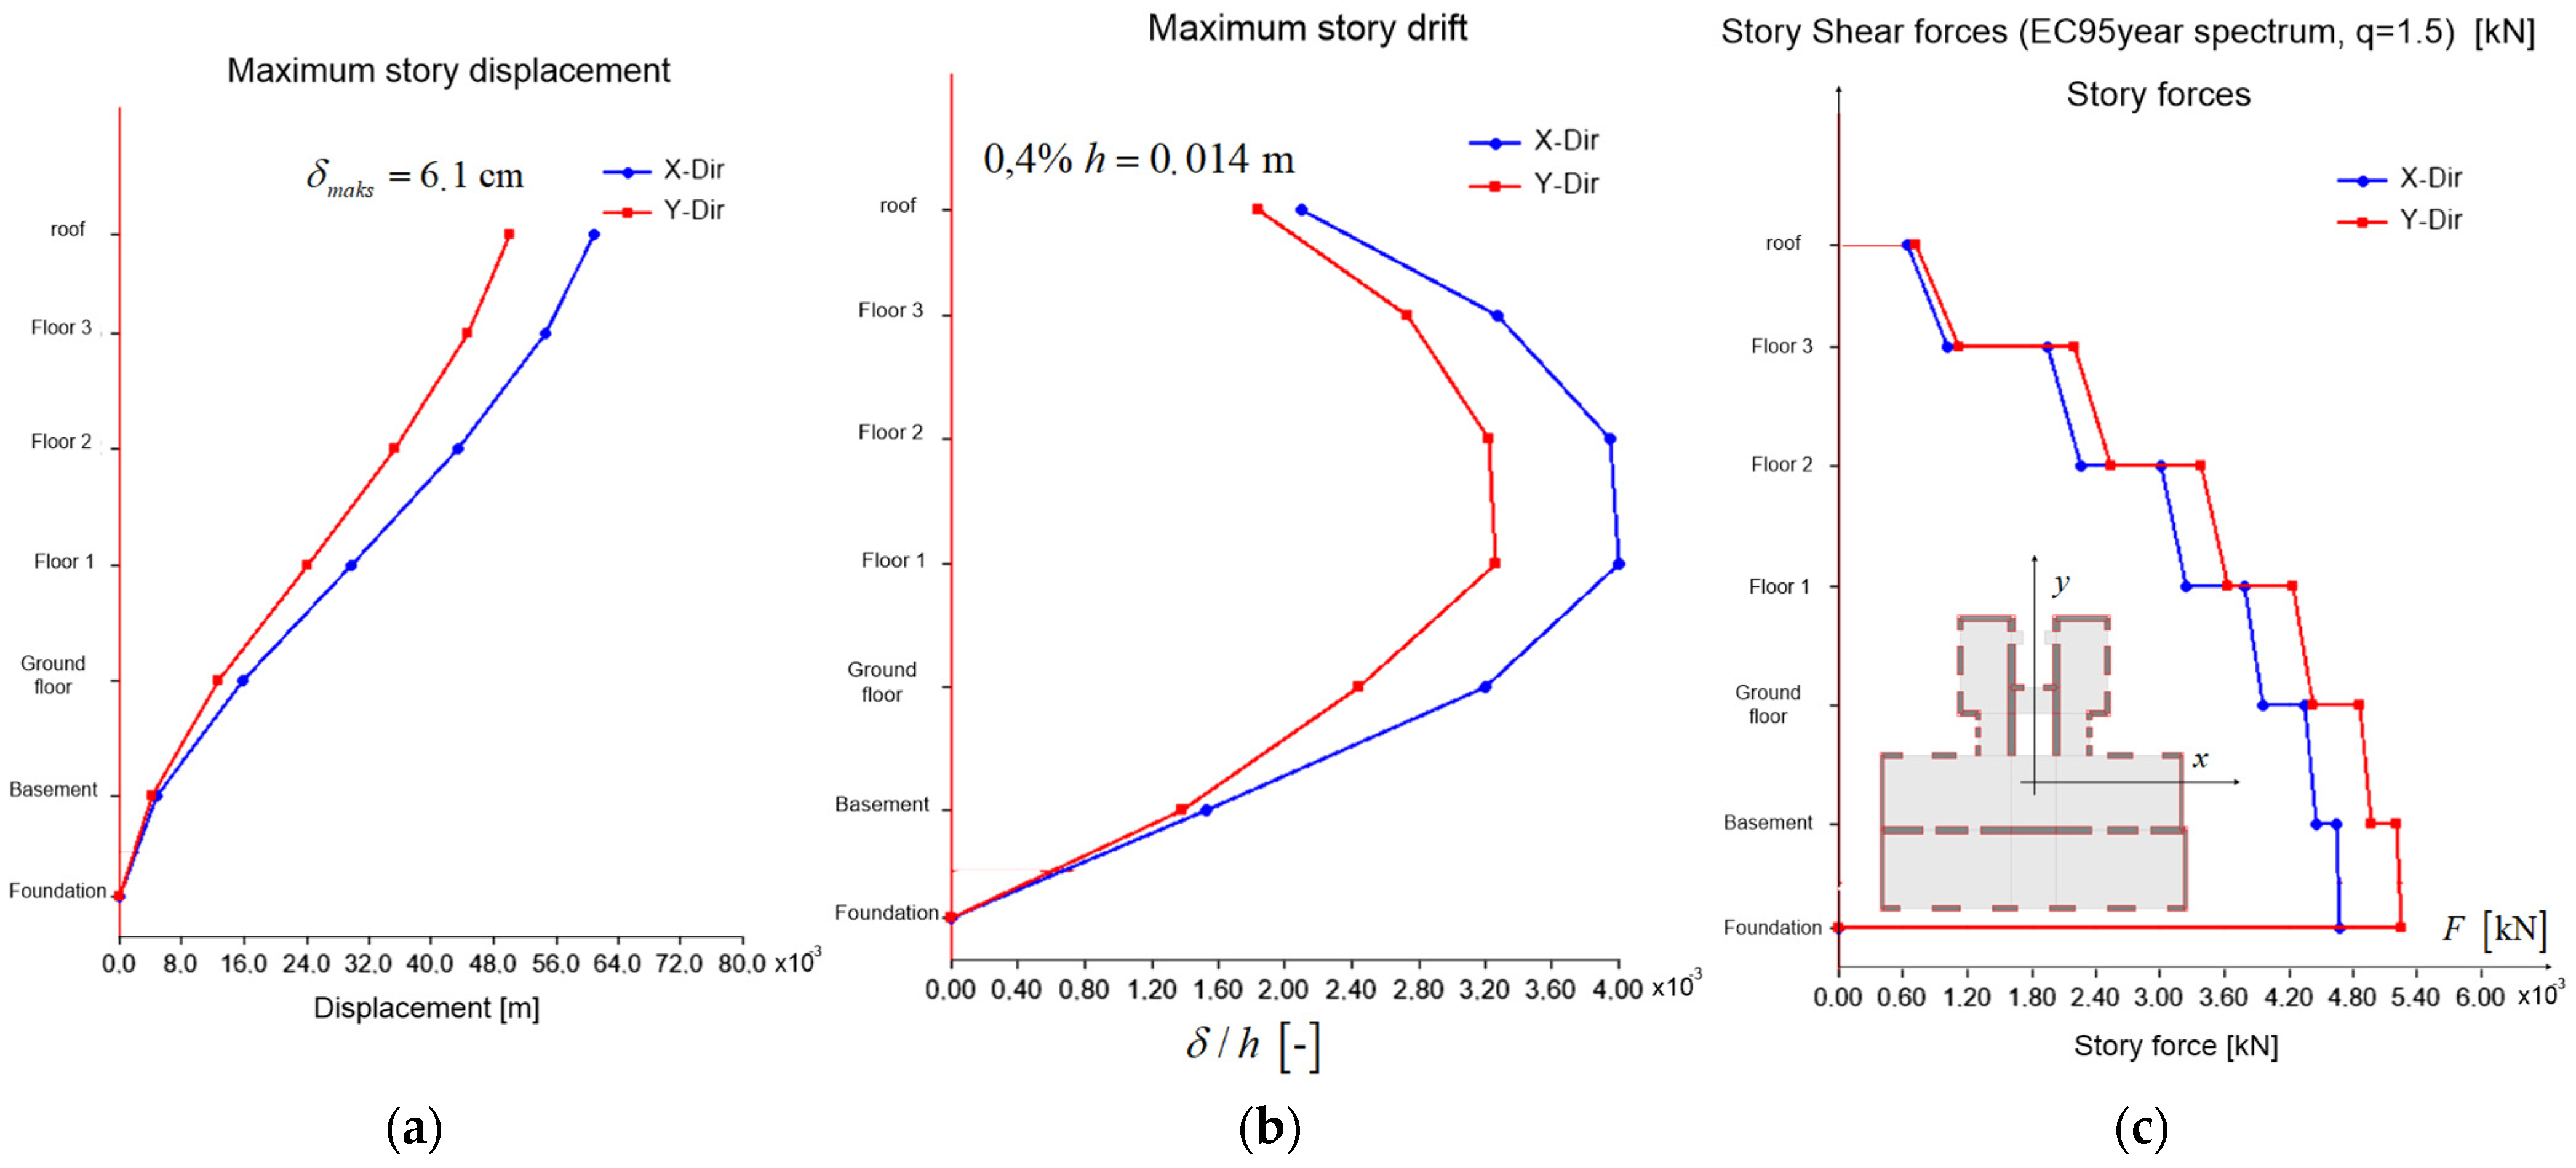
Figure 13a shows the displacement of the center of mass (CM) and maximum displacement for each story, while
Figure 13b shows the inter-story drift. It should be noted that the elastic spectrum was considered in obtaining these results.
It can be observed that the maximum displacements are close to reaching the SD limit state and are up to 6 cm for the X direction and 5 cm for the Y direction in the attic. The maximum value of story drift for the X direction is approximately 0.004 (Δ/h = 0.4%), which is also the bounding value for the SD limit state for elements for which the shear failure mechanism is critical. This is not realistic since the model is linear–elastic, so displacement can be expected to be larger.
The distribution of story shear forces obtained using the design spectrum for a return period of 95 years is shown in
Figure 13c. In the case of a 95-year return period, the value of the base shear (BS) coefficient is 15% for direction X and 16% for direction Y. The average shear stress in each story for a 95-year return period is between 0.14 and 0.16 MPa for the X and Y directions, with higher values corresponding to higher floors due to lesser thicknesses of walls. It is important to note that this method of calculating shear stress provides only a rough estimate and does not accurately represent the actual distribution. Since it is anticipated that the building will not meet the conditions of a 475-year return period earthquake, the analysis focuses on the effects of the 95-year earthquake (a
g = 0.125 g).
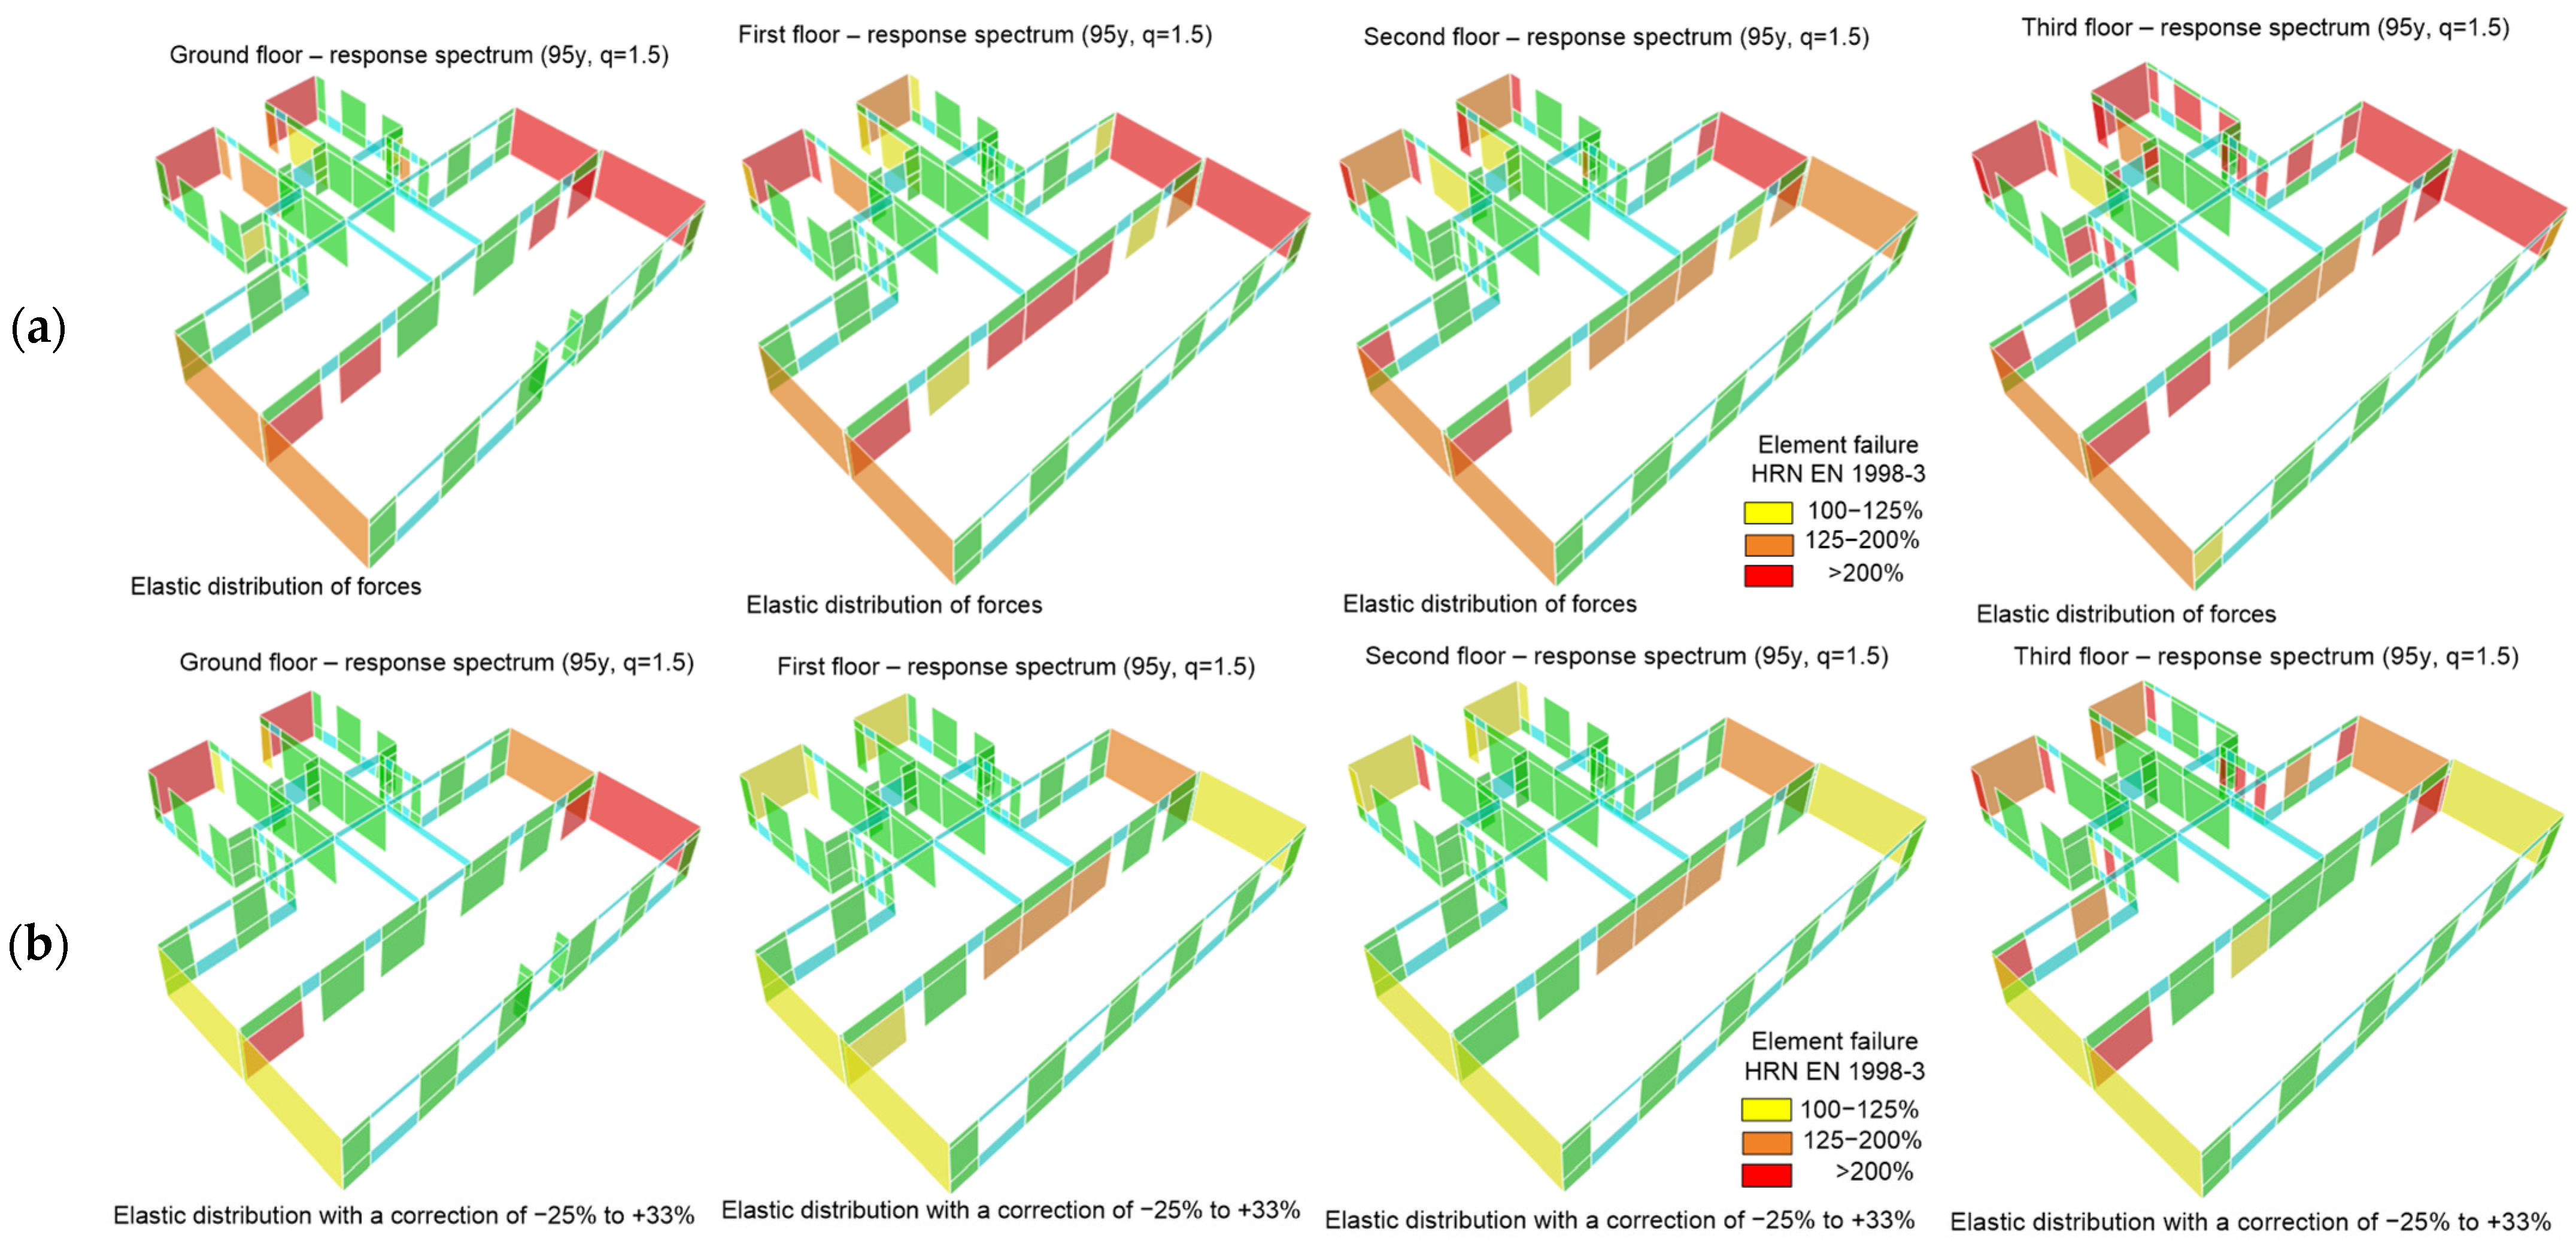
The following
Figure 14 shows the results of wall seismic capacity analysis. It is evident that many elements exceed their shear force capacity by more than 200%, with some walls exceeding the load factor by more than 300%, which is well above the permissible values. In order to account for redistribution of forces due to nonlinear behavior of elements in this type of linear analysis, a redistribution of forces in load-bearing elements ranging from −25% to +33% was performed (according to the Eurocode). The condition for the application of the redistribution is that the resultant lateral force is unchanged (same intensity and position in each story).
Figure 14b illustrates the outcomes of this redistribution, indicating that it has a beneficial impact on the utilization of the cross-section. It is important to highlight that a 25% reduction in internal forces in the critical element does not necessarily lead to a 25% decrease in utilization.
In unreinforced masonry, high forces often lead to a significant reduction in the compressive area of the wall, which is crucial for its resistance to lateral loads. Therefore, a 25% reduction can significantly increase the compressive area and lead to even more of an increase in the element resistance. Besides the resistance of individual elements, it is important to consider the condition of the resultant force during redistribution of the 25% force from critical elements. If the structure has a high degree of static indeterminacy, this is not commonly a problem. However, if there are only a few walls in the floor plan or if there are individual walls that dominate the bearing of lateral loads (typically massive and/or long walls), satisfying the equality of the resultant force can be challenging. In this study, after conducting redistribution of forces in the model, a certain reduction in the utilization of the capacity of the elements was achieved; however, there were still elements exceeding the bearing capacity by over 200%.
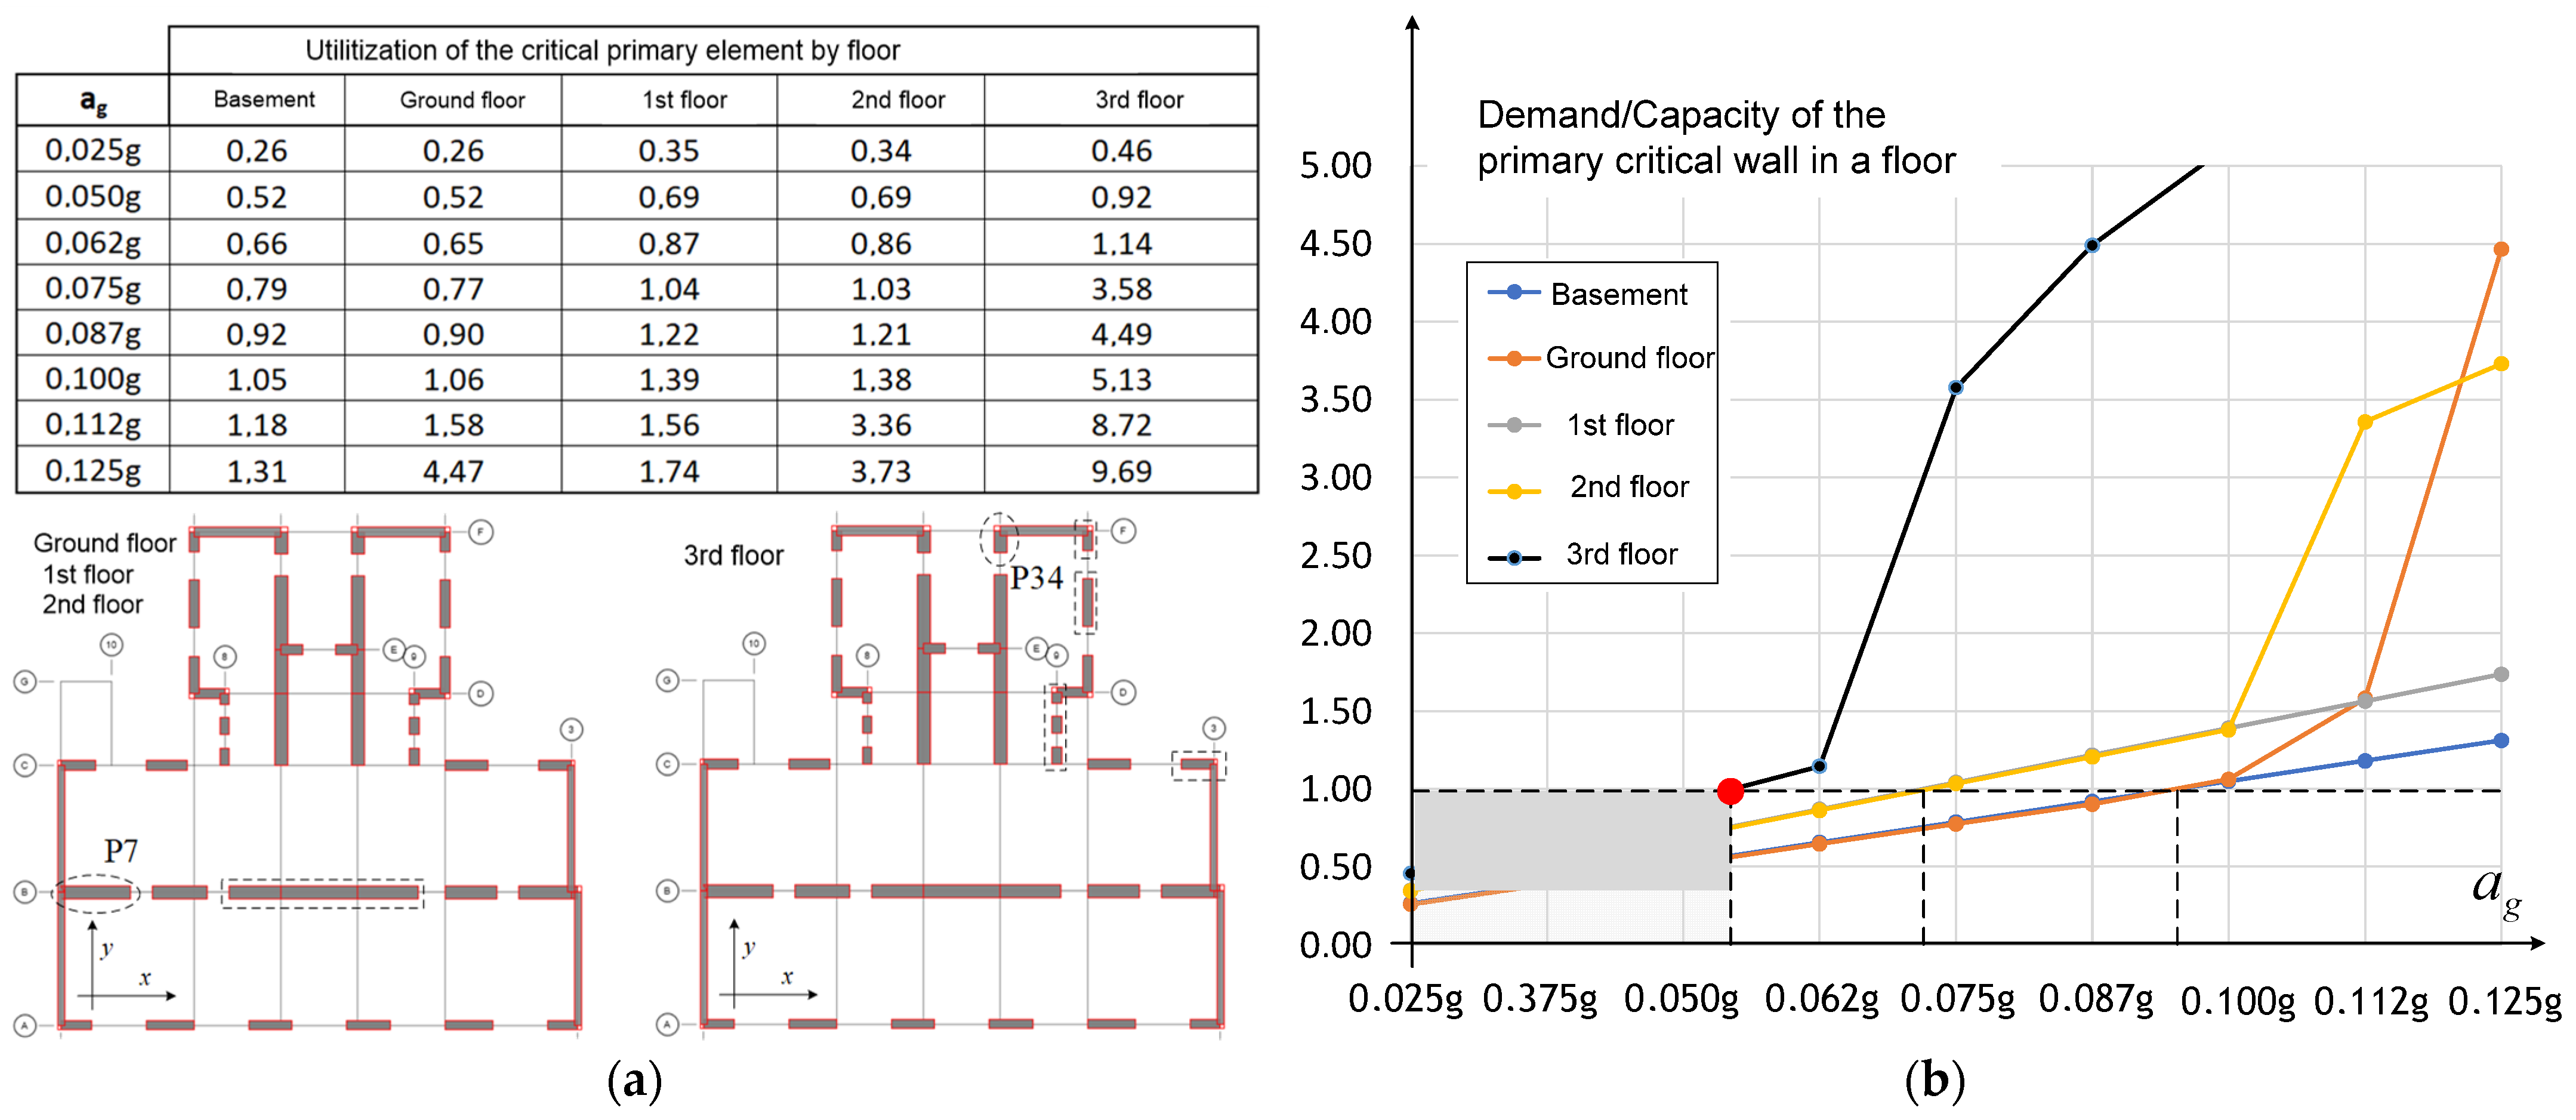
In a further analysis, the response spectrum method was applied to determine the peak ground acceleration a
g at which the structure meets the required seismic capacity. For this purpose, design of the elements was carried out for the shear forces induced by the ground acceleration in the range of a
g = 0.025 g to a
g = 0.125 g. The allowable redistribution of internal forces was also considered in the calculations. Since this is a linear calculation, and some of the shear forces induced by the seismic lateral force changed linearly with the change in a
g, no new calculations needed to be performed. The results of the parametric calculation are shown in
Figure 15. In the table, for each story of the building, the critical element utilization (calculated as the ratio of demand and capacity for lateral force) is given with respect to the peak ground acceleration in the soil category A. The same is shown in the diagram on the right, where the
x-axis indicates the peak ground acceleration a
g value and the ordinate indicates the coefficient of capacity. The critical elements for each floor are marked in the floor plan and in the diagram.
The SD limit state of the building was determined based on the critical elements on the 3rd floor, and was found to be only 43% of the demand for ag = 0.125 g. The SD limit state of critical elements on the 1st and 2nd floors was then found to be 58%, while in the basement and on the ground floor, we found it to be 76% of the 95-year return period ground acceleration.
5.5. Nonlinear Static Method (Pushover)
The numerical model created in Etabs v.17 was extended to take into account the nonlinear behavior of the masonry elements by incorporating element capacity curves. A pushover analysis was conducted by applying various distributions of the lateral force and using the target displacement of the CM.
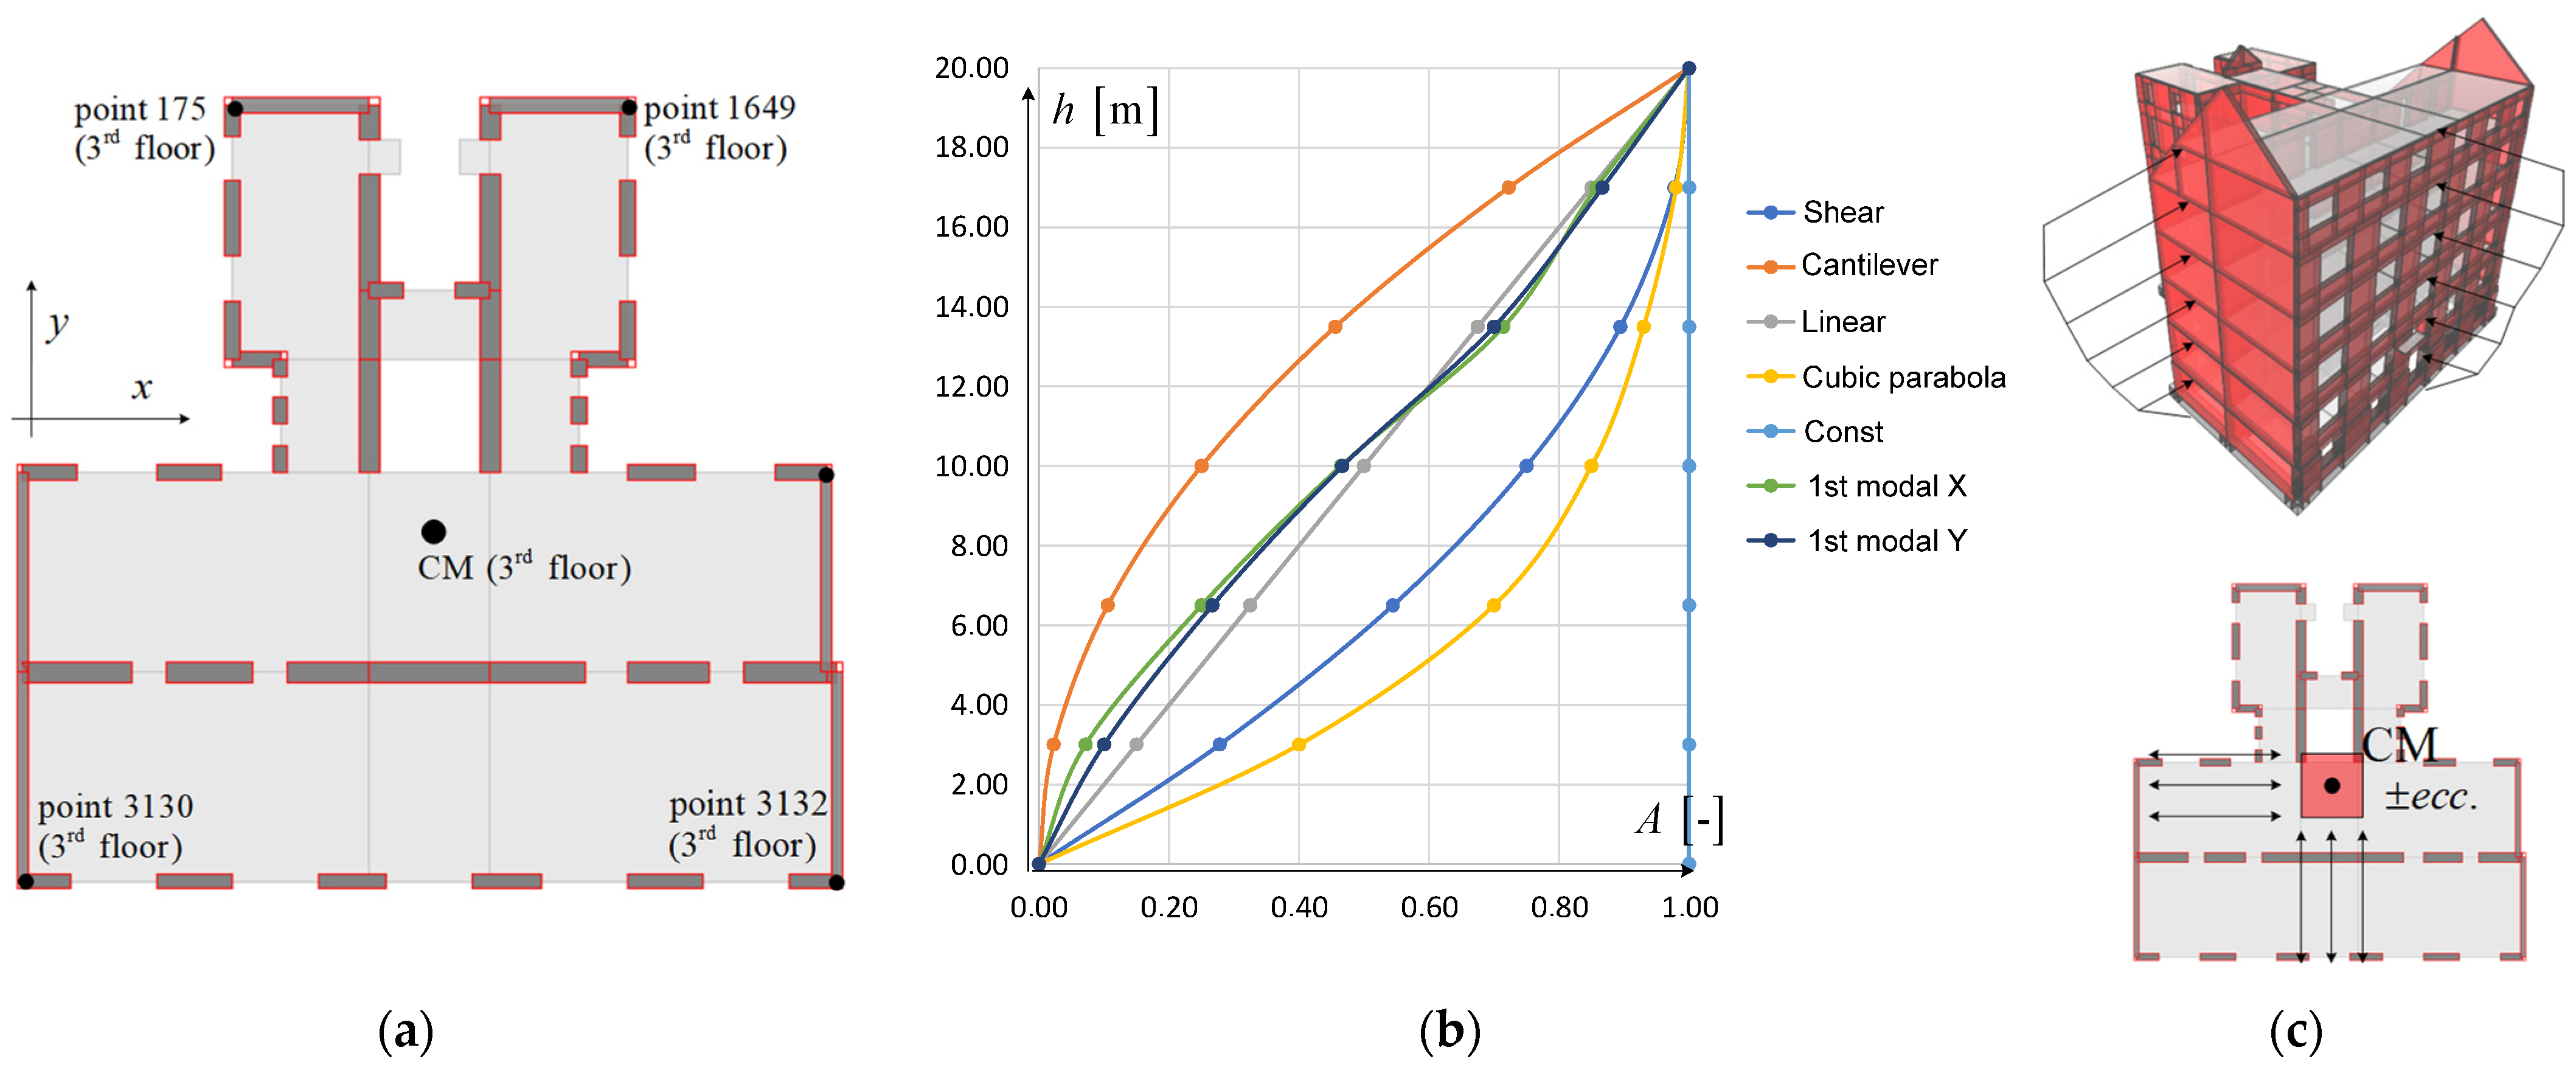
Figure 16b shows the distribution patterns of acceleration along the height of the building. The load is applied in both the positive and negative directions of lateral force in the X and Y directions. Furthermore, the eccentricity value is regarded as being within a range of ±5% of the perpendicular plan dimension to the CM. A total of 72 calculations were carried out, of which only the most significant findings are showcased.
The load distribution that exhibits the most conservative behavior, known as the cantilever deformation line (cantilever), is represented by a dashed line. However, this load pattern is highly unlikely and is not considered relevant. Instead, the load distribution with a linear relationship between acceleration and height (linear) is considered to be the most detrimental. Similarly, but somewhat more favorably, the structure behaves in its load distribution according to the deformation line of the shear building, which follows a parabolic shape (shear).
The most favorable response and maximum load-bearing capacity of the structure were achieved when the lateral load was proportional to the inertial forces caused by the uniform acceleration of the masses. This acceleration pattern, along with the first mode of vibration, was decisive for the calculation using the pushover analysis. The results of the acceleration pattern corresponding to the fundamental mode in a particular direction (1st mode_X, 1st mode_Y) were nearly identical to the linear distribution.
5.6. Building Capacity Curves for X Direction
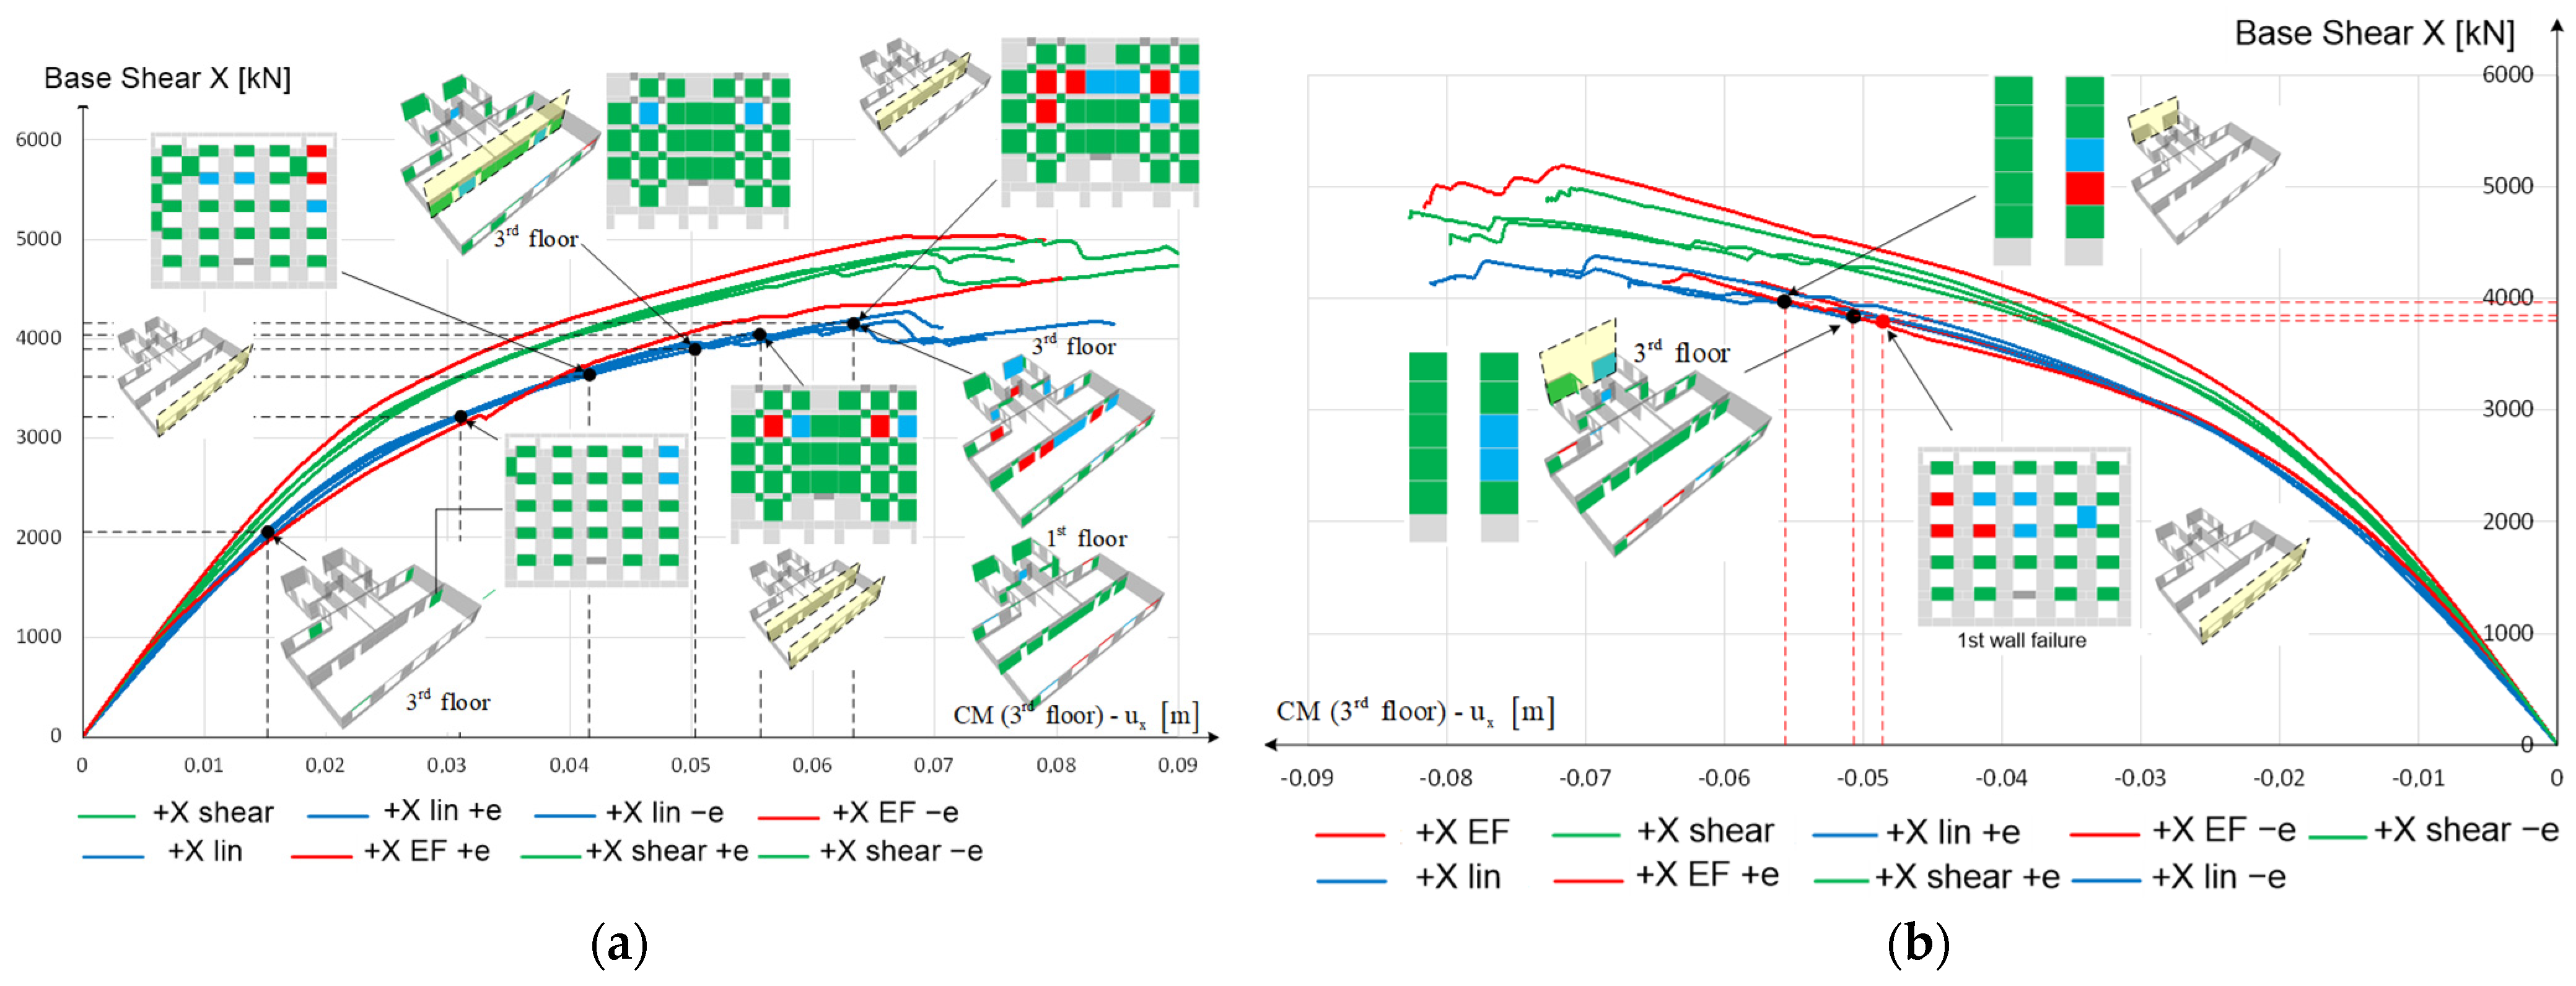
Figure 17a illustrates the most important structural capacity curves for the positive direction X obtained using the load pattern of the lateral force method (red curves X/Y EFn) and the linear distribution (blue curves X/Y lin). The number in front of the marking indicates different directions and values of eccentricity. For a qualitative representation of the failure mechanism and the behavior of critical structural elements, key points on the curve are annotated to indicate structural element damage.
At a base shear value of approximately 2000 kN (base shear factor—BS = 6.2%) and a displacement of the CM on the 3rd floor of 1.5 cm, several structural elements reached a state of limited damage, resulting in a decrease in stiffness, as observed on the pushover curve. As the base shear increased, cracks opened, the stiffness of the building decreased, and damage occurred of several elements. The damage began on the 3rd floor of the building, where the load-bearing elements reached their yielding point. Nonetheless, these masonry structural elements have the ability to deform beyond their yielding point while retaining their load-bearing capacity. Therefore, an adequate approximation of the pushover curves for individual elements is crucial for a high-quality analysis of the building pushover curve.
The first failure of a structural element occurred at a base shear force value of 3200 kN (B.S. = 10%) and a displacement of the CM on the 3rd floor of 3.1 cm. Several spandrels were observed to be in the SD limit state at this point. The next significant point was the failure of the spandrels on the street façade of the building at a base shear value of 3700 kN and a displacement of the CM on the 3rd floor of 4.2 cm. At this point, all the piers were still in a state of limited damage. It should be emphasized that these were “weak” spandrels, which are typical for masonry buildings in Zagreb.
The first pier failure occurred at a lateral force value of 4000 kN (B.S. = 12.5%) and a CM displacement of the 3rd floor of 5.1 cm. These were the piers on the 3rd floor in the central longitudinal axis of the building that reached the drift capacity, meaning localized failure of the floor structure could occur. It can be assumed that, at this point, the building was in a state of near collapse and had the highest degree of damage. Global failure occurred at a lateral force value of 4200 kN (B.S. = 13%) and a displacement of the 3rd floor CM of 6.3 cm. It should be noted that the walls of the basement, ground floor, and 1st floor were not critical for a positive direction of lateral force in the X direction.
The capacity curves for the negative X direction of the lateral load are depicted in
Figure 17b. Similar to the previous case, the spandrels were the first to reach the SD limit state and so could be considered critical. In this scenario, the failure mechanism of the load-bearing system was initiated with the failure of the western courtyard wall on the 1st and 2nd floors. These walls reached the SD limit state at a lateral force of 3900 kN and a CM displacement of the 3rd floor of 5.1 cm, and their failure occurred when the displacement reached 5.6 cm. These piers were relatively rigid and located far from the CM, exposing them to significant shear forces caused by torsional effects resulting from the asymmetry and eccentricity of the load.
5.7. Building Capacity Curves for Y Direction
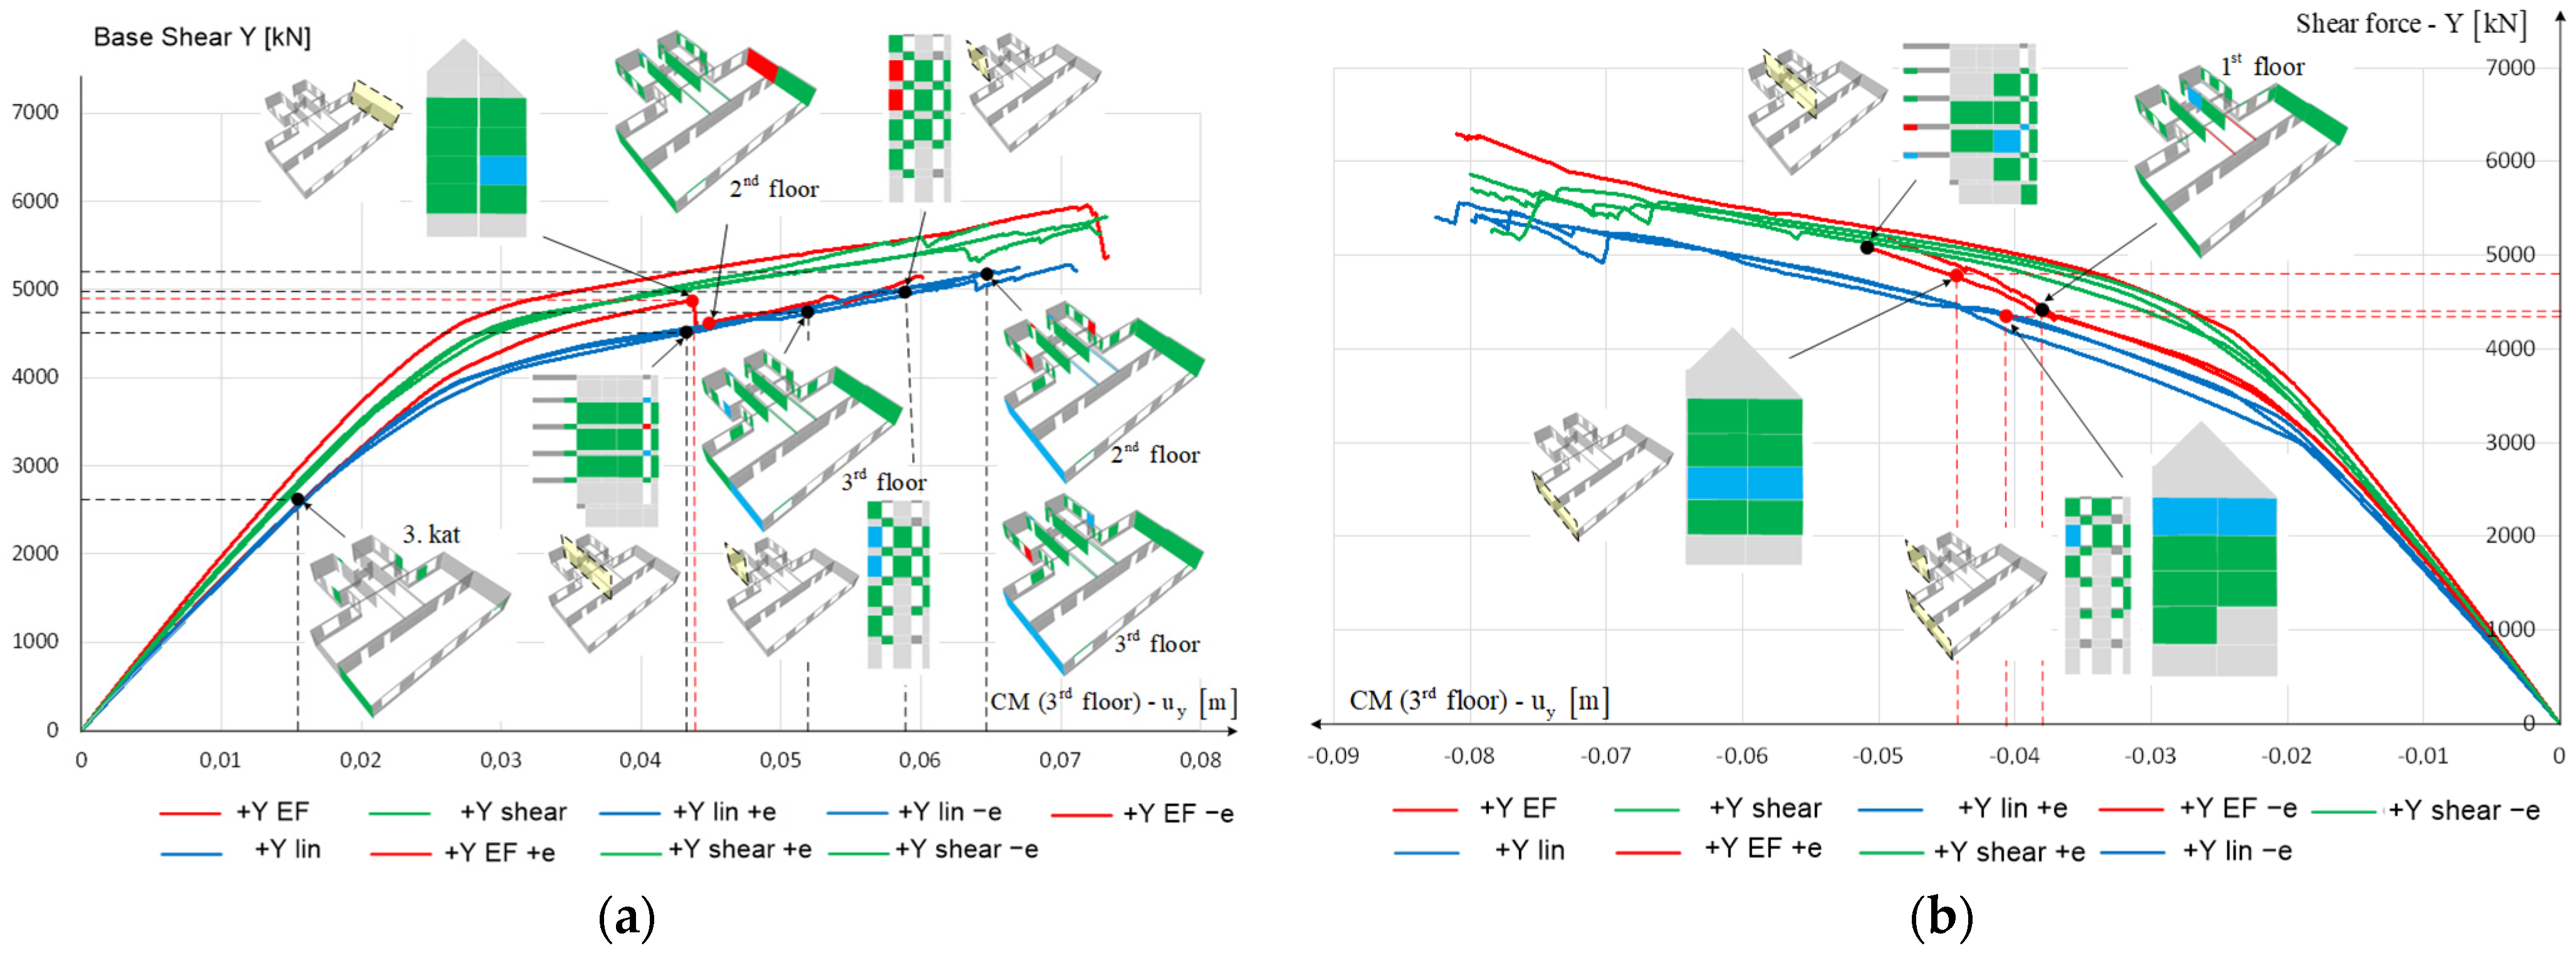
Capacity curves for the positive Y direction of lateral force are shown in
Figure 18a. It is evident from the figure that some structural elements experienced an LD state when the base shear reached 2600 kN (B.S. = 8.1%) and the displacement of the 3rd floor CM was 1.6 cm. Primarily, these elements were located on the 3rd floor.
Just like the previous load case, applying the load in the Y direction also led to a consistent occurrence of exceeding the limit state for spandrels in terms of the SD. The spandrels that were critical and had limited rotation capacity were located at the edge of the central transverse wall along the staircase towards the west side of the building. The structural piers first exhibited failure when subjected to a lateral force of 4500 kN (B.S. = 14%) and a displacement of 4.3 cm at the 3rd floor CM. The piers located on the north side of the building’s north gable wall were the primary components that initially reached the SD limit state. This included the piers on the 1st floor, followed by the capacity of the piers on the 2nd floor being exceeded. Depending on the eccentricity of the load, the outermost south walls could also be regarded as critical components due to the building’s symmetry in this direction. An interesting observation made of the capacity curve was a sudden significant drop (red curve) caused by the failure of the piers of the north gable wall. Despite the failure of several piers, the total lateral force continued to increase as the load increased. The walls of the courtyard façade on the 2nd and 3rd floors were the next elements where the SD limit state was exceeded in the transverse direction. As for the X direction, the building experienced critical pier failures primarily on its upper levels. Although the SD limit state was reached in several elements, the structure still maintained load-bearing capacity and ductility, preventing the building from collapsing. The ultimate displacement of the 3rd floor CM during global building collapse was estimated to be around 6.0 cm. The basement and ground floor walls were not considered critical for action in the positive Y direction.
The capacity curves for the lateral load in the negative Y direction (
Figure 18b) indicate that the critical components were the spandrels, which reached the SD limit state first. In addition to the south gable wall, the staircase wall in the courtyard on the first floor of the building was also identified as critical for this load direction. In addition, it is important to note that the load-bearing capacity of reinforced concrete beams in the axes of the staircase was exceeded.
The failure mechanism of the vertical load-bearing system started when the piers in the south gable wall on the 3rd floor or in the western part were affected by the damaged piers in the staircase wall on the 1st floor of the building. These piers reached an SD limit state when subjected to a lateral force of about 4300 kN and a displacement of the 3rd floor CM of 3.9 cm.
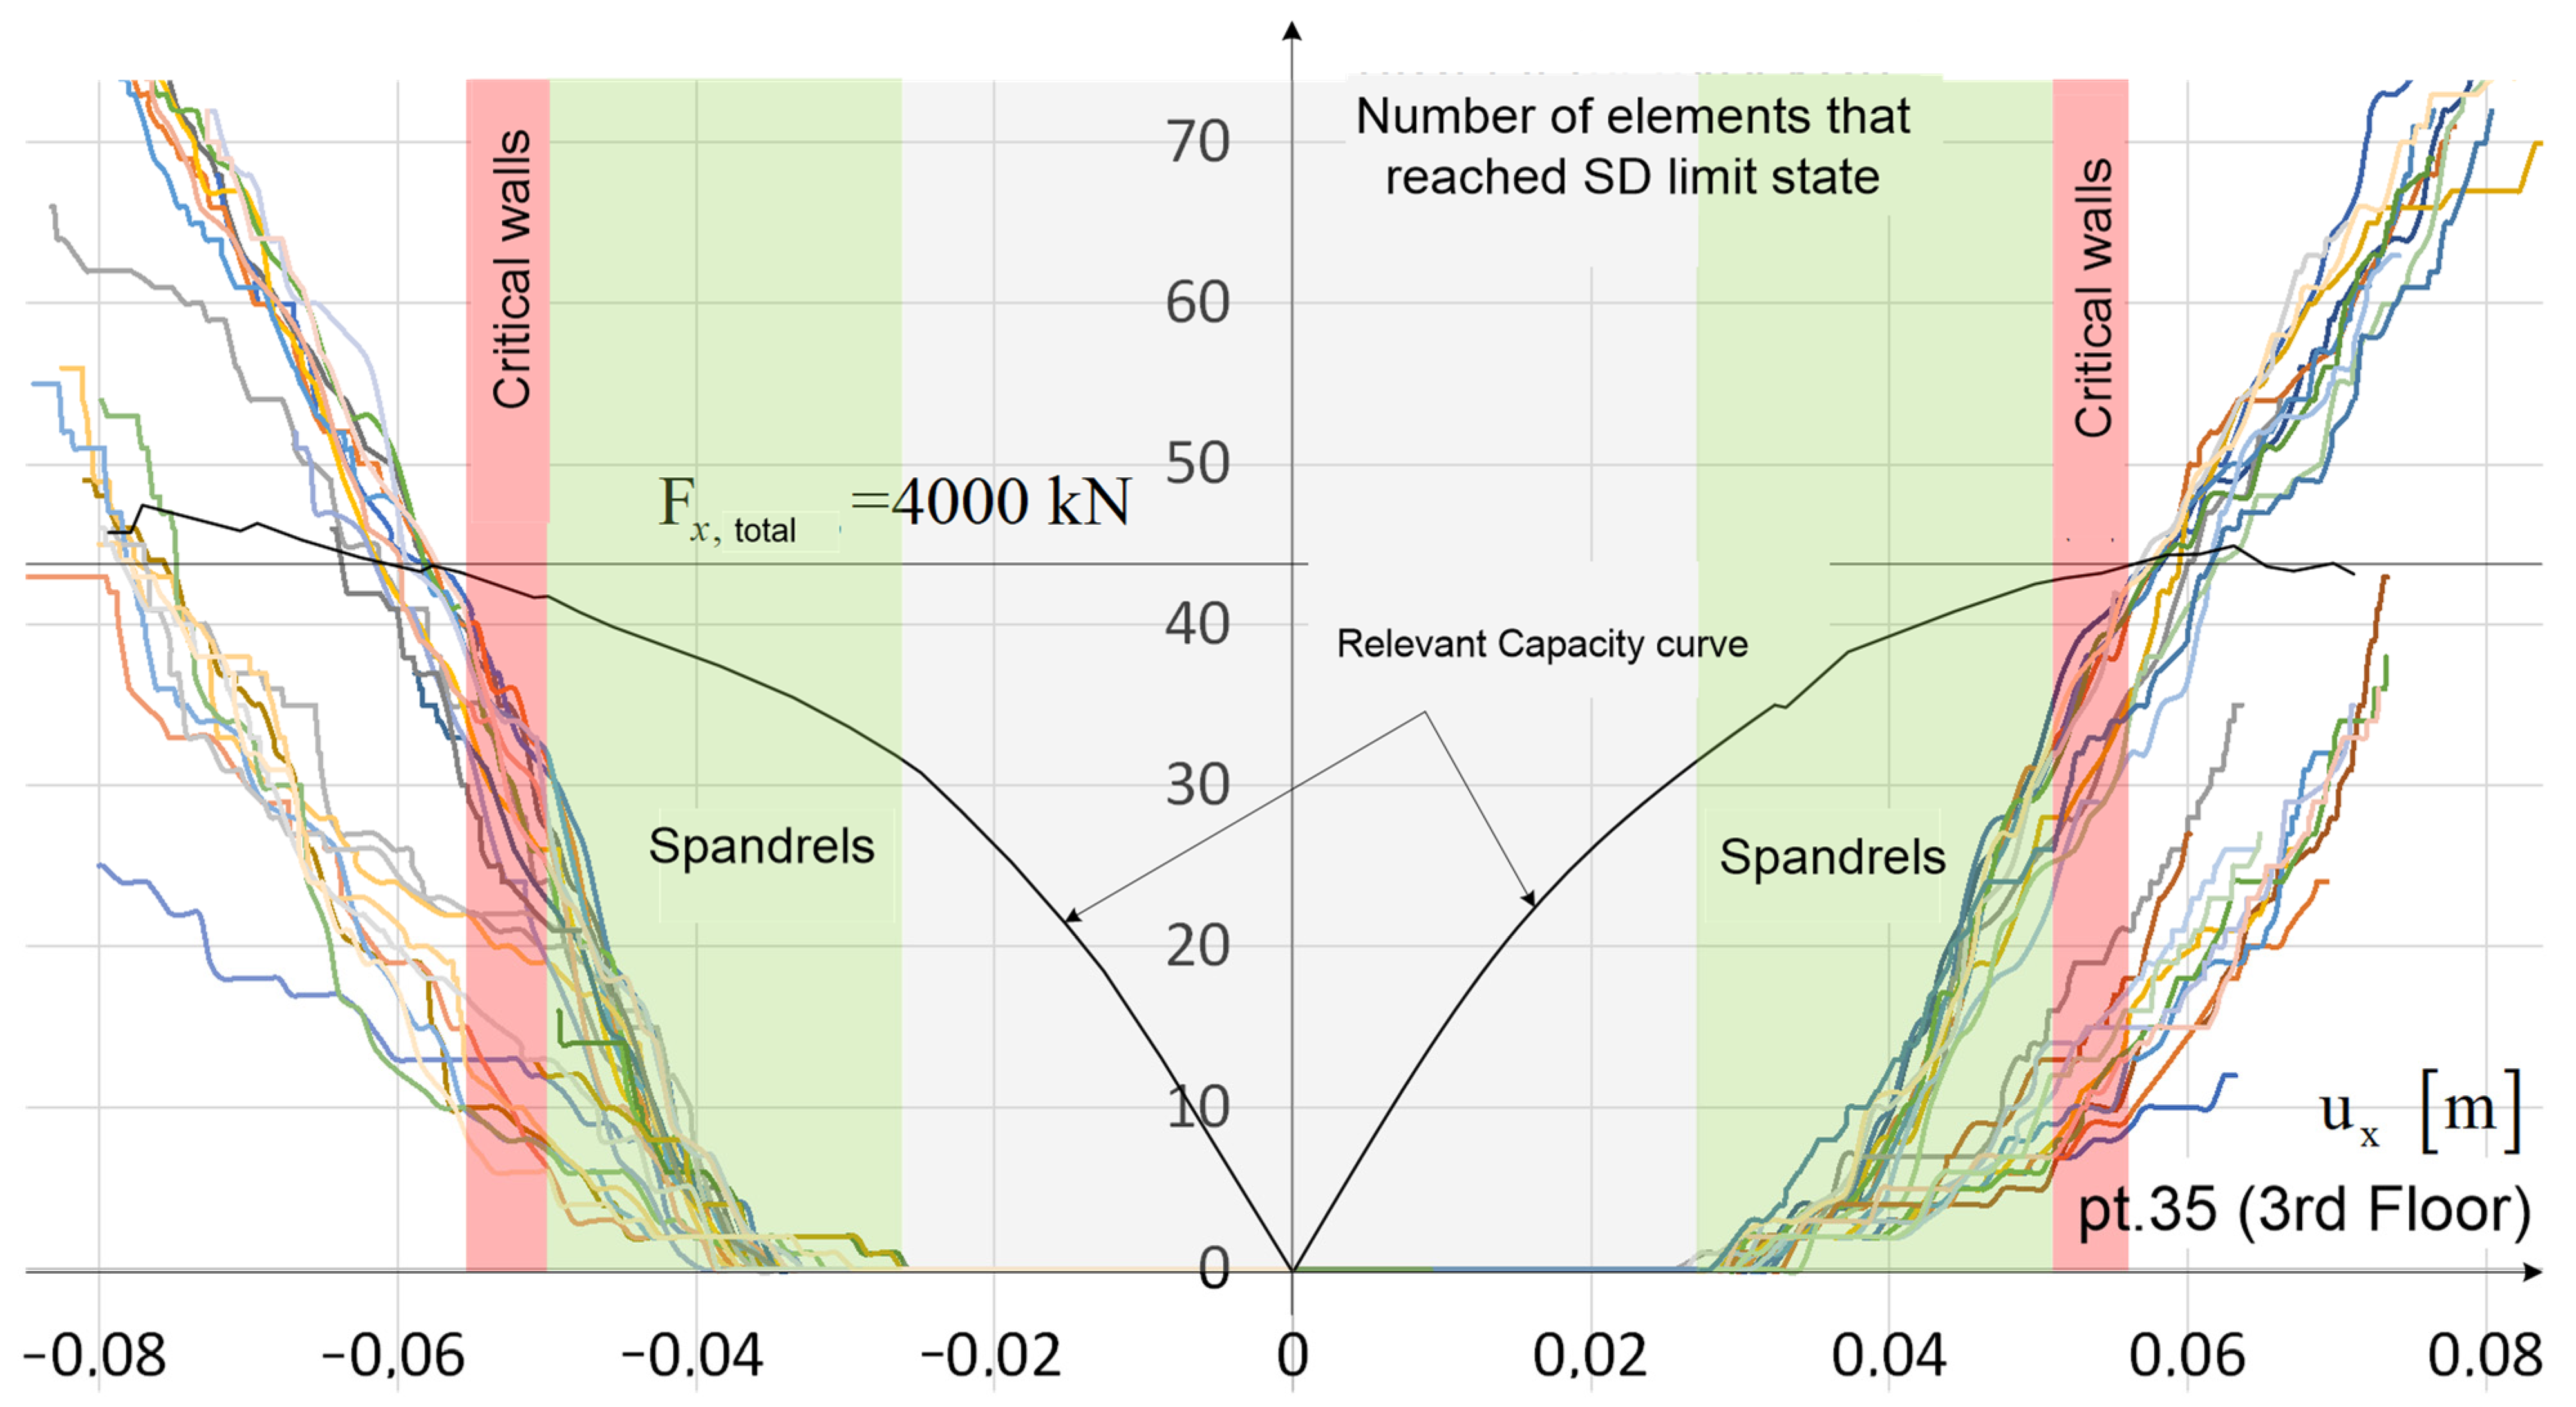
Figure 19 presents a diagram showcasing the cumulative count of elements that reached the significant damage limit state. The diagram overlaps with the most important bearing capacity curve for the X direction. An area where the spandrels begin to enter a state of SD (highlighted in green) can be observed. It can be seen that in this area, a large number of spandrels, depending on the load case, enter a state of SD, and for critical cases already analyzed, the number is 38. After that, at a displacement of CM of about 5.1 cm, the critical pier enters a state of SD (red area), and soon after that, the critical pier also fails (near the red area).
5.8. Calculation of Capacity and Demand of the Building
The bearing capacity and building deformation requirement were also determined, which was achieved by reducing the system to an equivalent single-degree-of-freedom system (SDOF). The procedure was performed using the N2 method [
49,
50].
For each of the 72 load cases, a bearing capacity curve was obtained and verification for the peak ground acceleration was performed. Relevant curves and important parameters are laid out in the following text and figures.
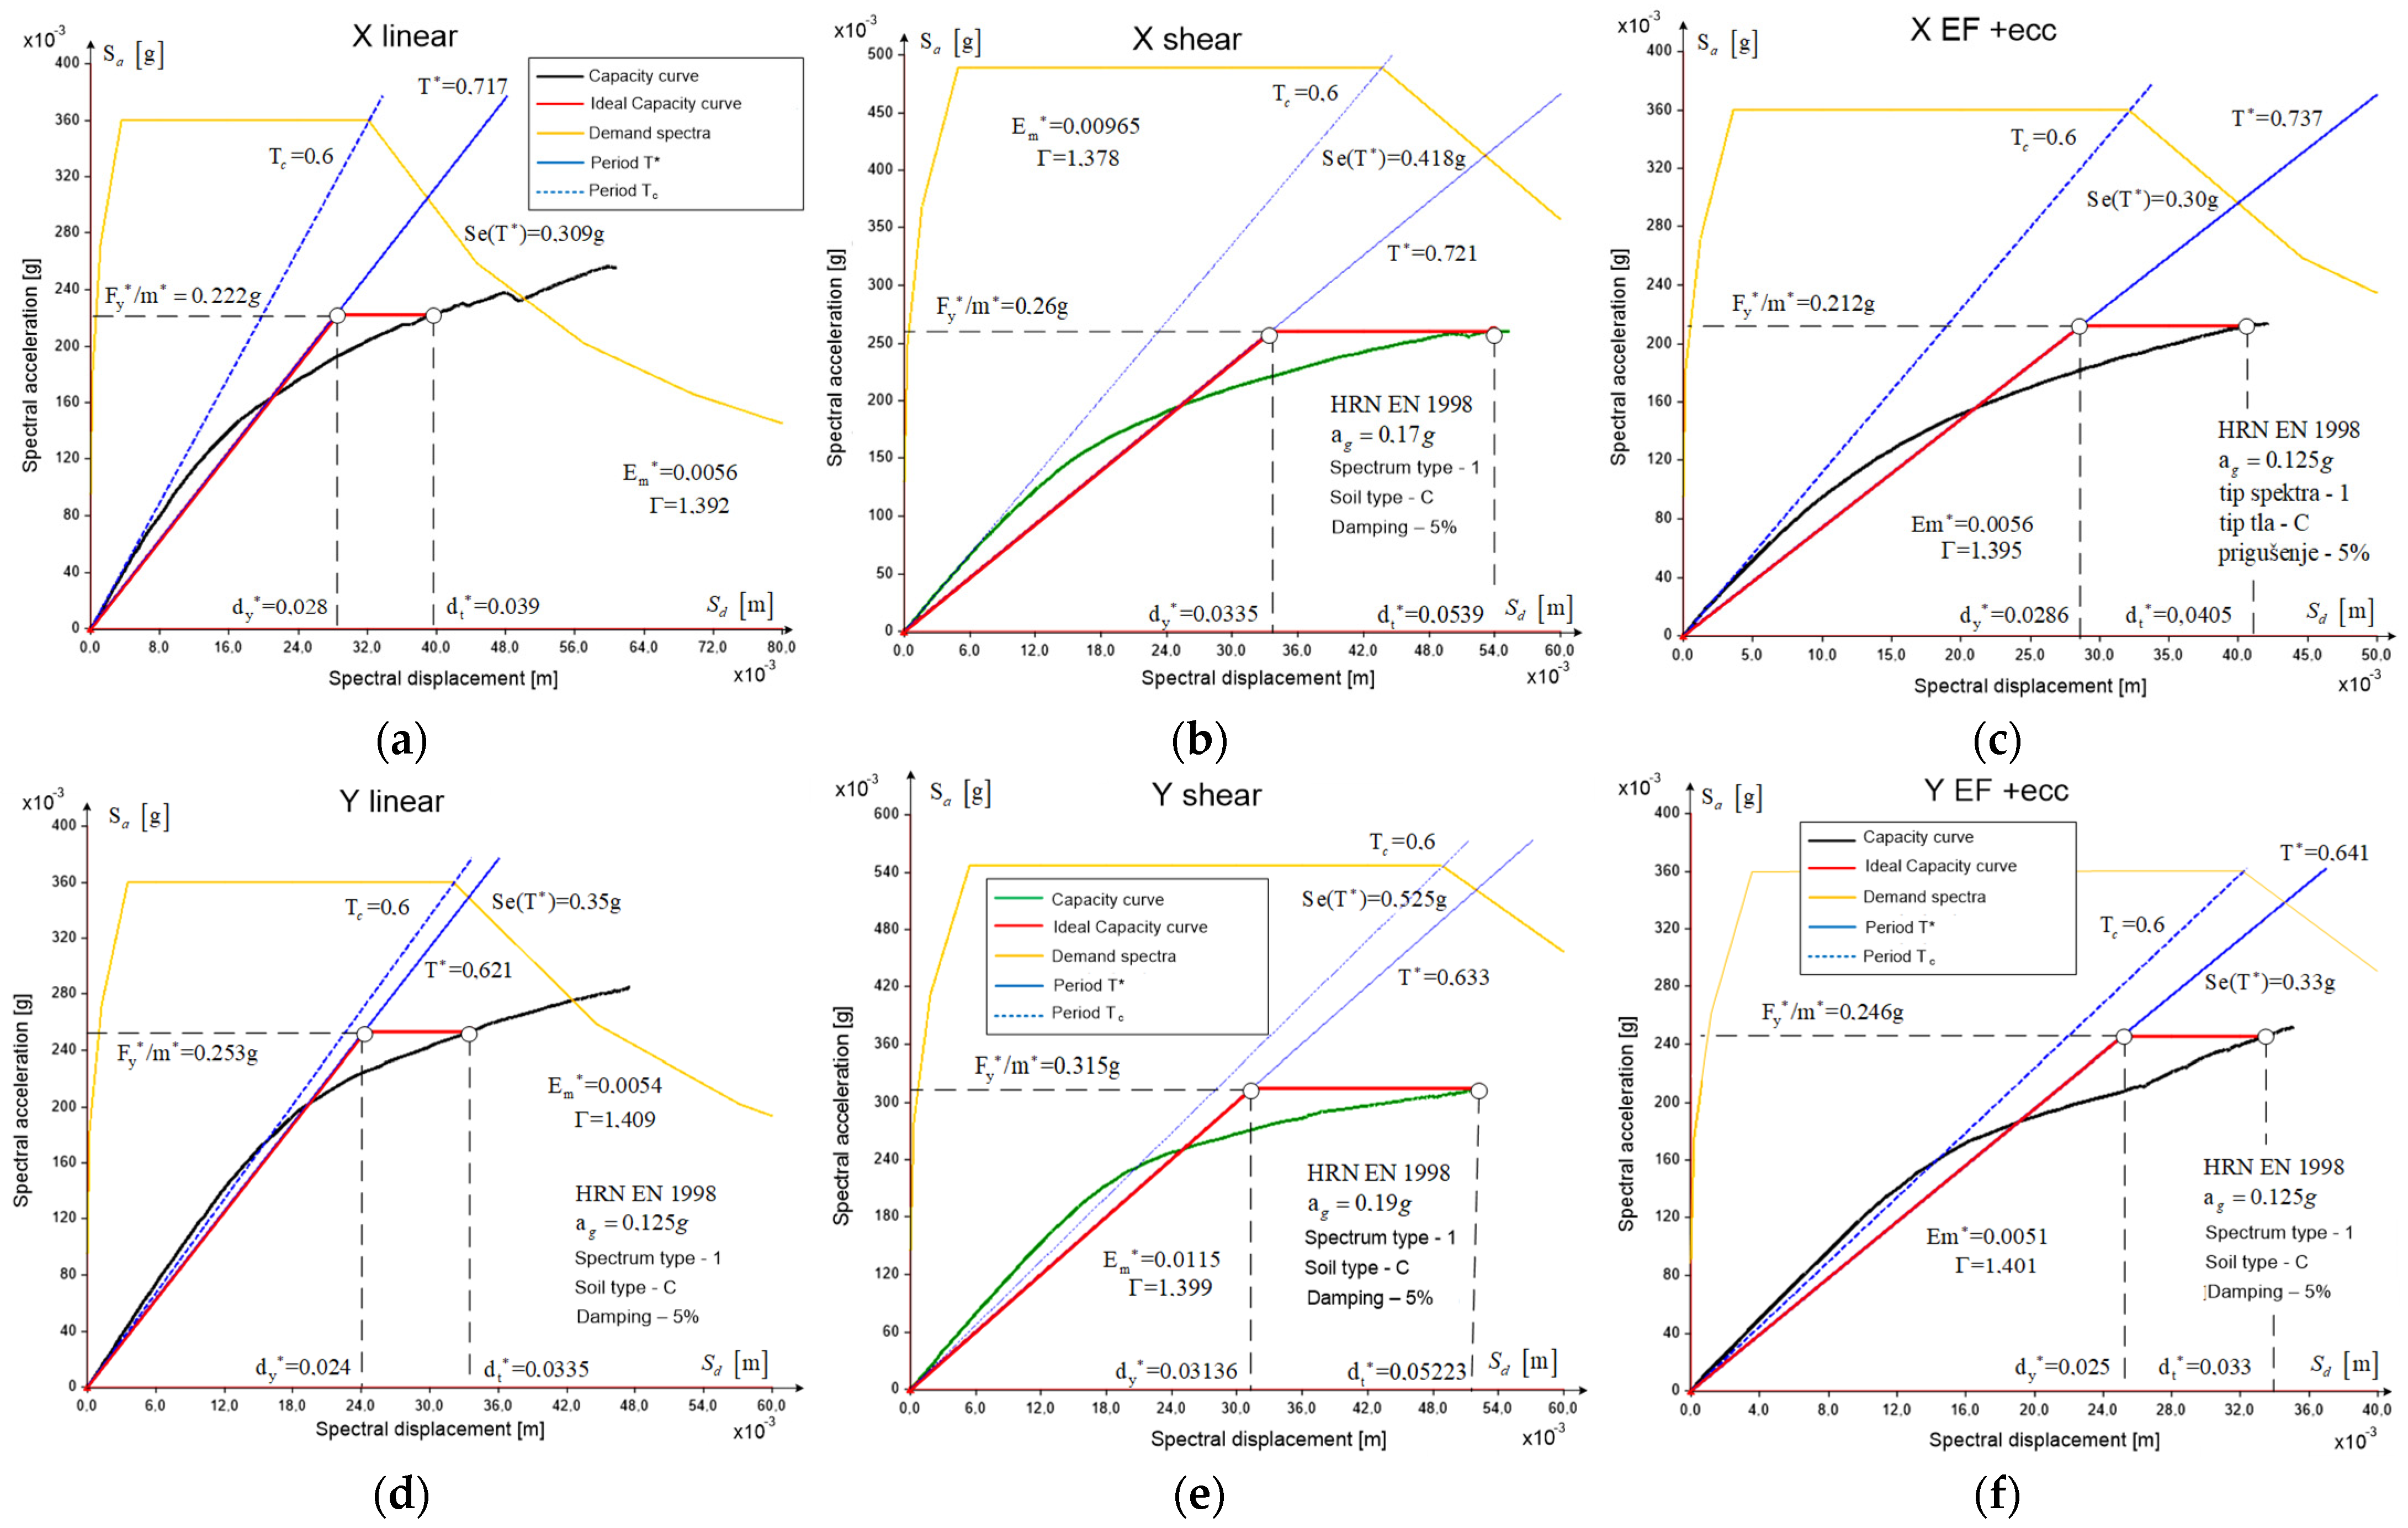
Figure 20a,d show idealized bearing capacity curves of an equivalent SDOF system for a PGA of 0.125 g (r.p. 95 years—level 2) and for linear load distribution without eccentricity. The system’s deformation capacity in both directions is higher than required. The maximum PGA value that would satisfy the demand in this case of load distribution is approximately 0.17 g for the X direction and 0.16 g for the Y direction. It should be noted that this load case is not paramount but is presented only to illustrate the main parameters and coefficients.
Similarly,
Figure 20b,e show an idealized load capacity curve of an equivalent SDOF system for a PGA with 0.17 g in the X direction and 0.19 g in the Y direction for shear load distribution without eccentricity, as well as the load distribution during deformation of the shear building (parabola) also without eccentricity. It can be seen that for both distributions, the building has a similar deformation capacity that satisfies the ground acceleration requirement on the bedrock, of 0.17 g and 0.19 g, respectively, which is approximately equivalent to the earthquake return period of 225 years.
The capacity curves previously observed were for lateral force without eccentricity applied. When eccentricity is considered, the building capacity decreases considerably, as shown in the following illustration.
Figure 20c,f show the idealized capacity curve of an equivalent system for a ground acceleration on the base rock of 0.125 g for the X and Y directions and for a distribution of load over the height of the building using the lateral force method with a 5% eccentricity of the building width. The system deformation capacity can be concluded to be approximately equal to the required capacity. The maximum ground acceleration on the bedrock that fulfils the displacement requirement is close to 0.125 g, and this load case is critical. The system deformation capacity can be concluded to be close to the requirements, and we can surmise that there are no load-bearing reserves for horizontal actions.
5.9. Out-of-Plane Mechanisms (OOPs)
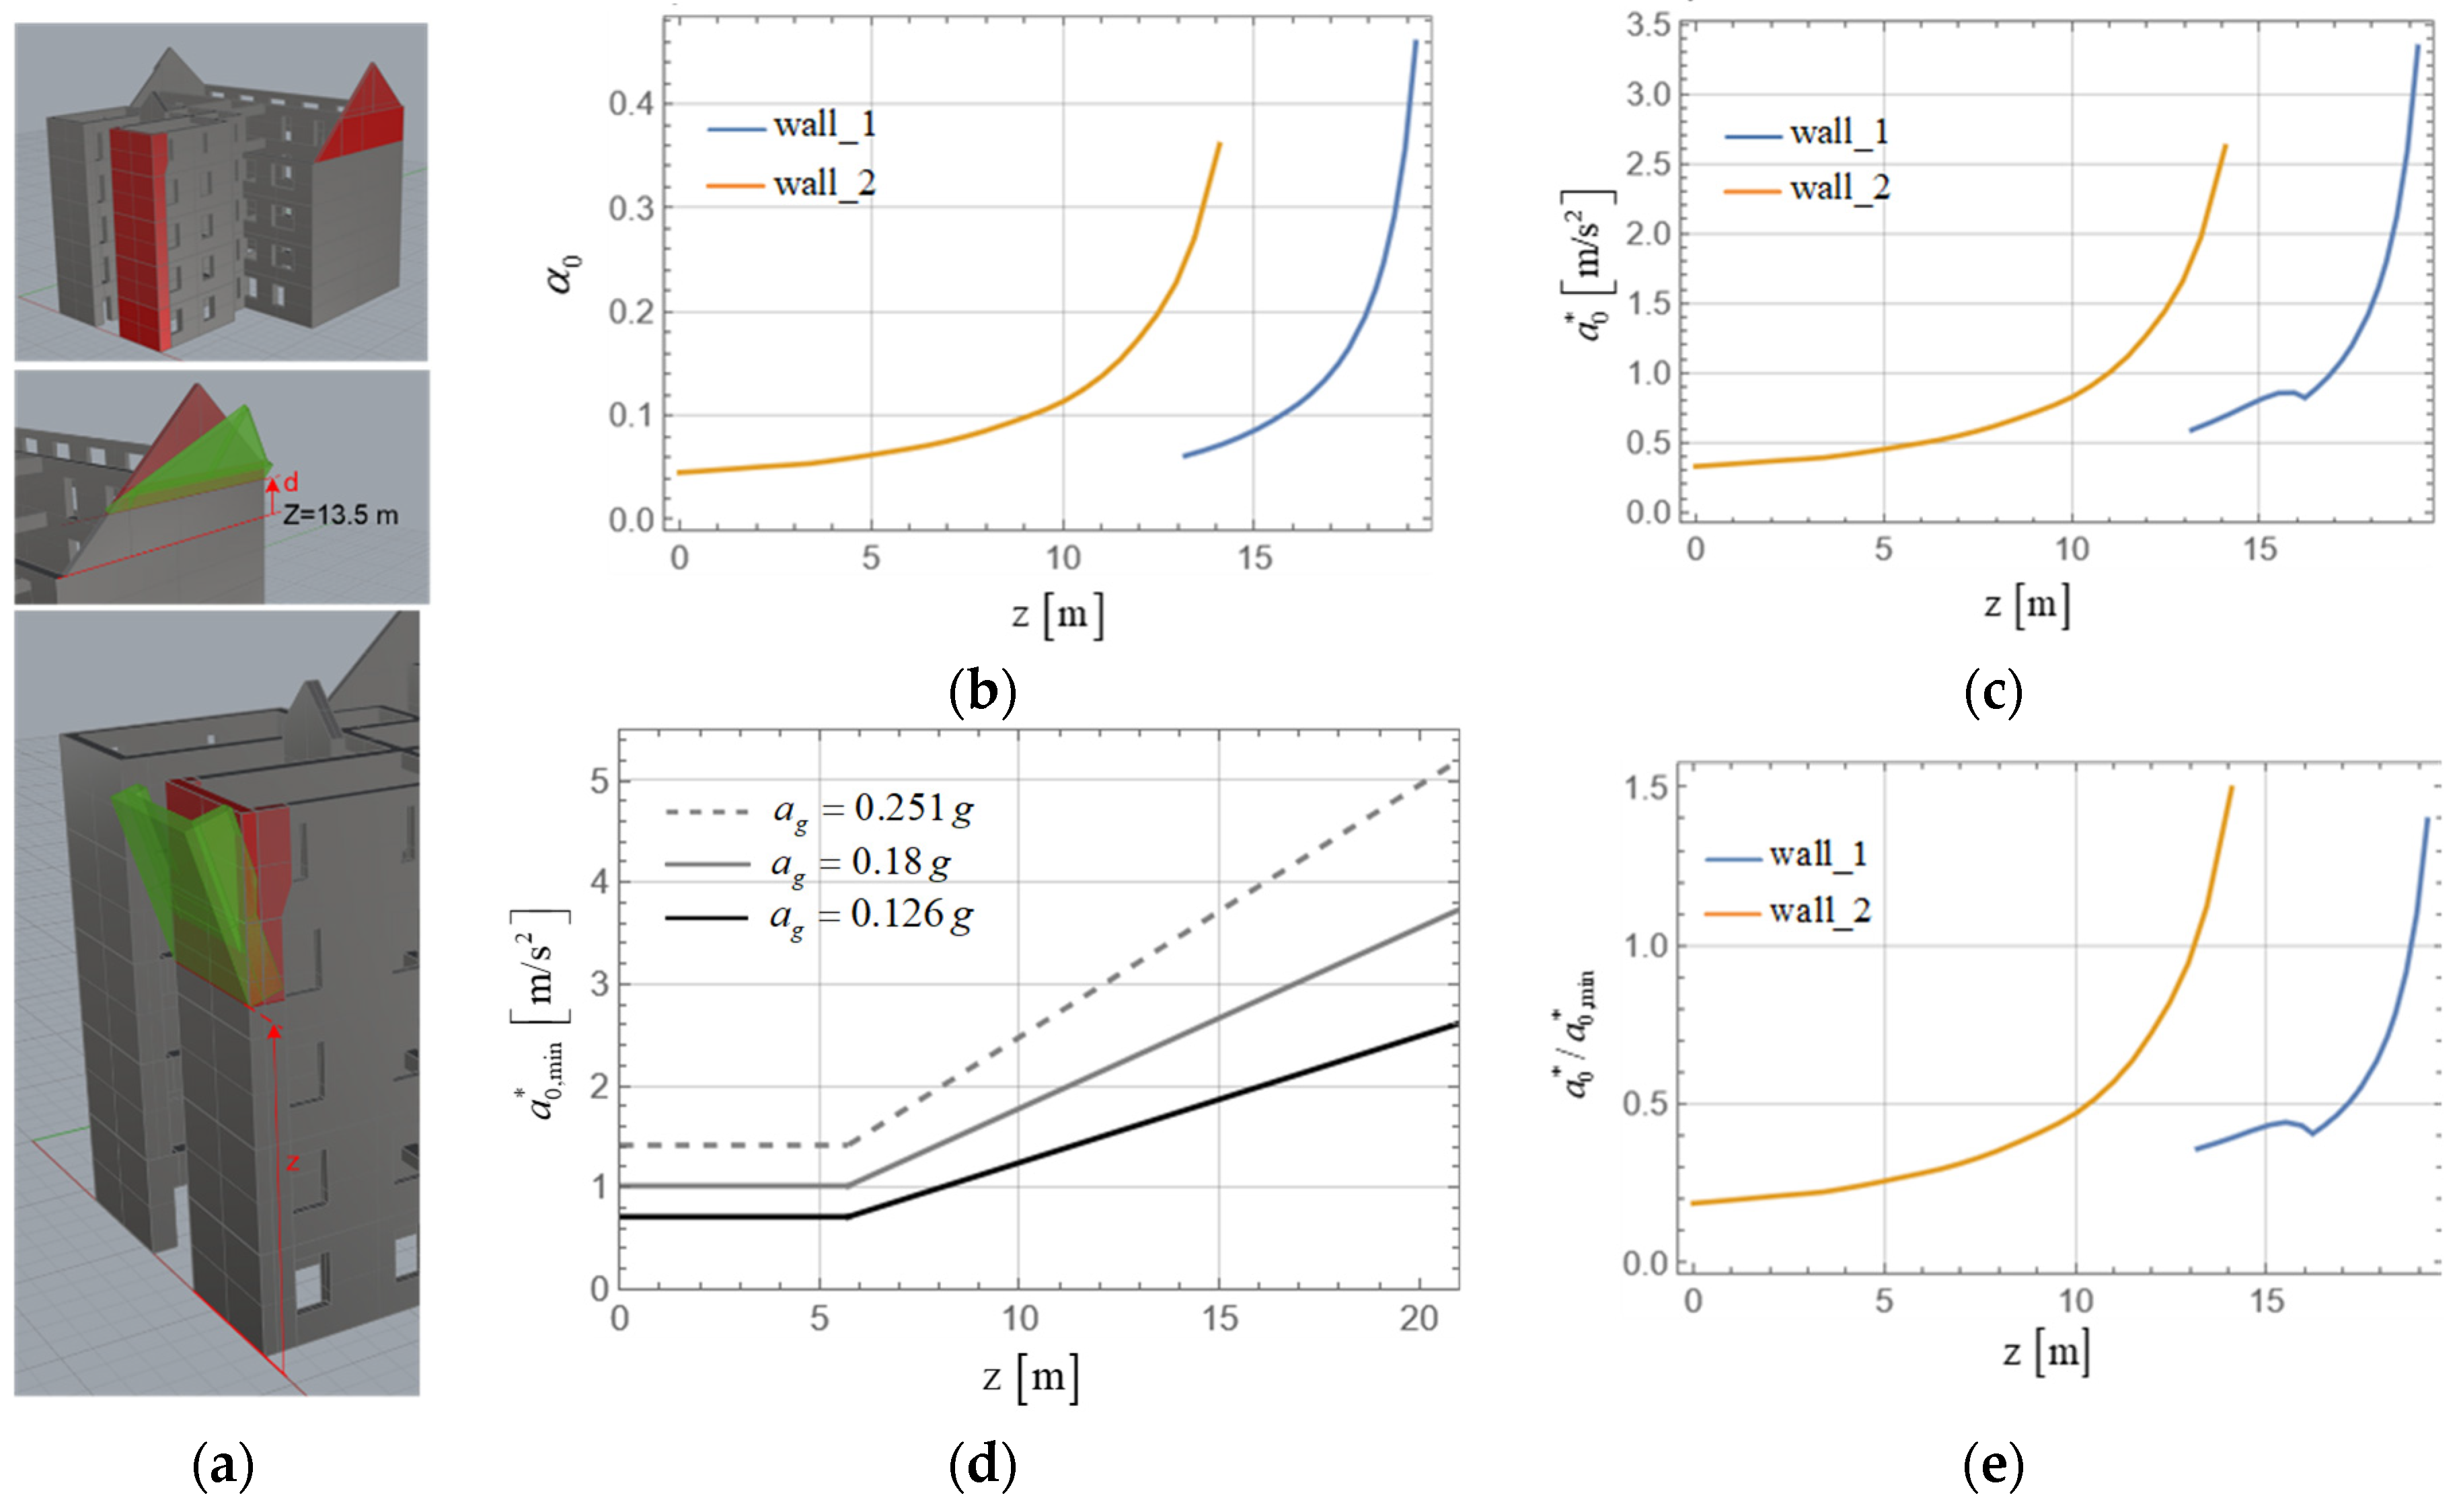
This kind of building typology has a high seismic vulnerability to out-of-plane failure of walls, i.e., partial mechanisms that are initiated by perpendicular seismic actions. Poor connections of the roof and floor structures and lack of horizontal and vertical constraining elements, as well as relatively low vertical loading, significantly contribute to the development of a kinematic chain. Since a finite element model is unable to represent this kind of failure mode, it was accounted for through an adaptation of the linear kinematic method assuming the formation of SDOF rigid block local mechanisms. The mechanism activation coefficient α
0 was determined through the application of the virtual work method and by determining effective mass ratio e* of the equivalent SDOF system. The corresponding spectral acceleration that activates the mechanism is given by
, where Fc is the confidence factor equal to 1.35 for the rigid block assumption. For the subject building, local mechanisms selected for the OOP analysis are shown in
Figure 21a and
Figure 22a. The first wall (wall_1) is the south gable wall, selected due to its slenderness and because on the portion of the gable, it has no connection with perpendicular elements. The other is the west courtyard wall of the annex (wall_2), selected because of presence of the near and large number of openings on the side walls and, similarly to the gable wall, because it is loaded only by its own weight (timber joists oriented parallel to the wall) and because prior global analysis showed that this wall could be significantly damaged by seismic actions. The main presumption for this mechanism is the failure of spandrels on the side walls.
For these two walls shown in
Figure 21a, the position of the line hinge was considered to be a variable parameter. The results for the activation coefficient and corresponding spectral acceleration are given in
Figure 21b,c. As the position of the line hinge increased over the height of the building, the volume of each block decreased and, as a consequence, the activation factor increased, manifesting the ratio of the thickness and height, i.e., elements with higher slenderness had a lower activation factor.
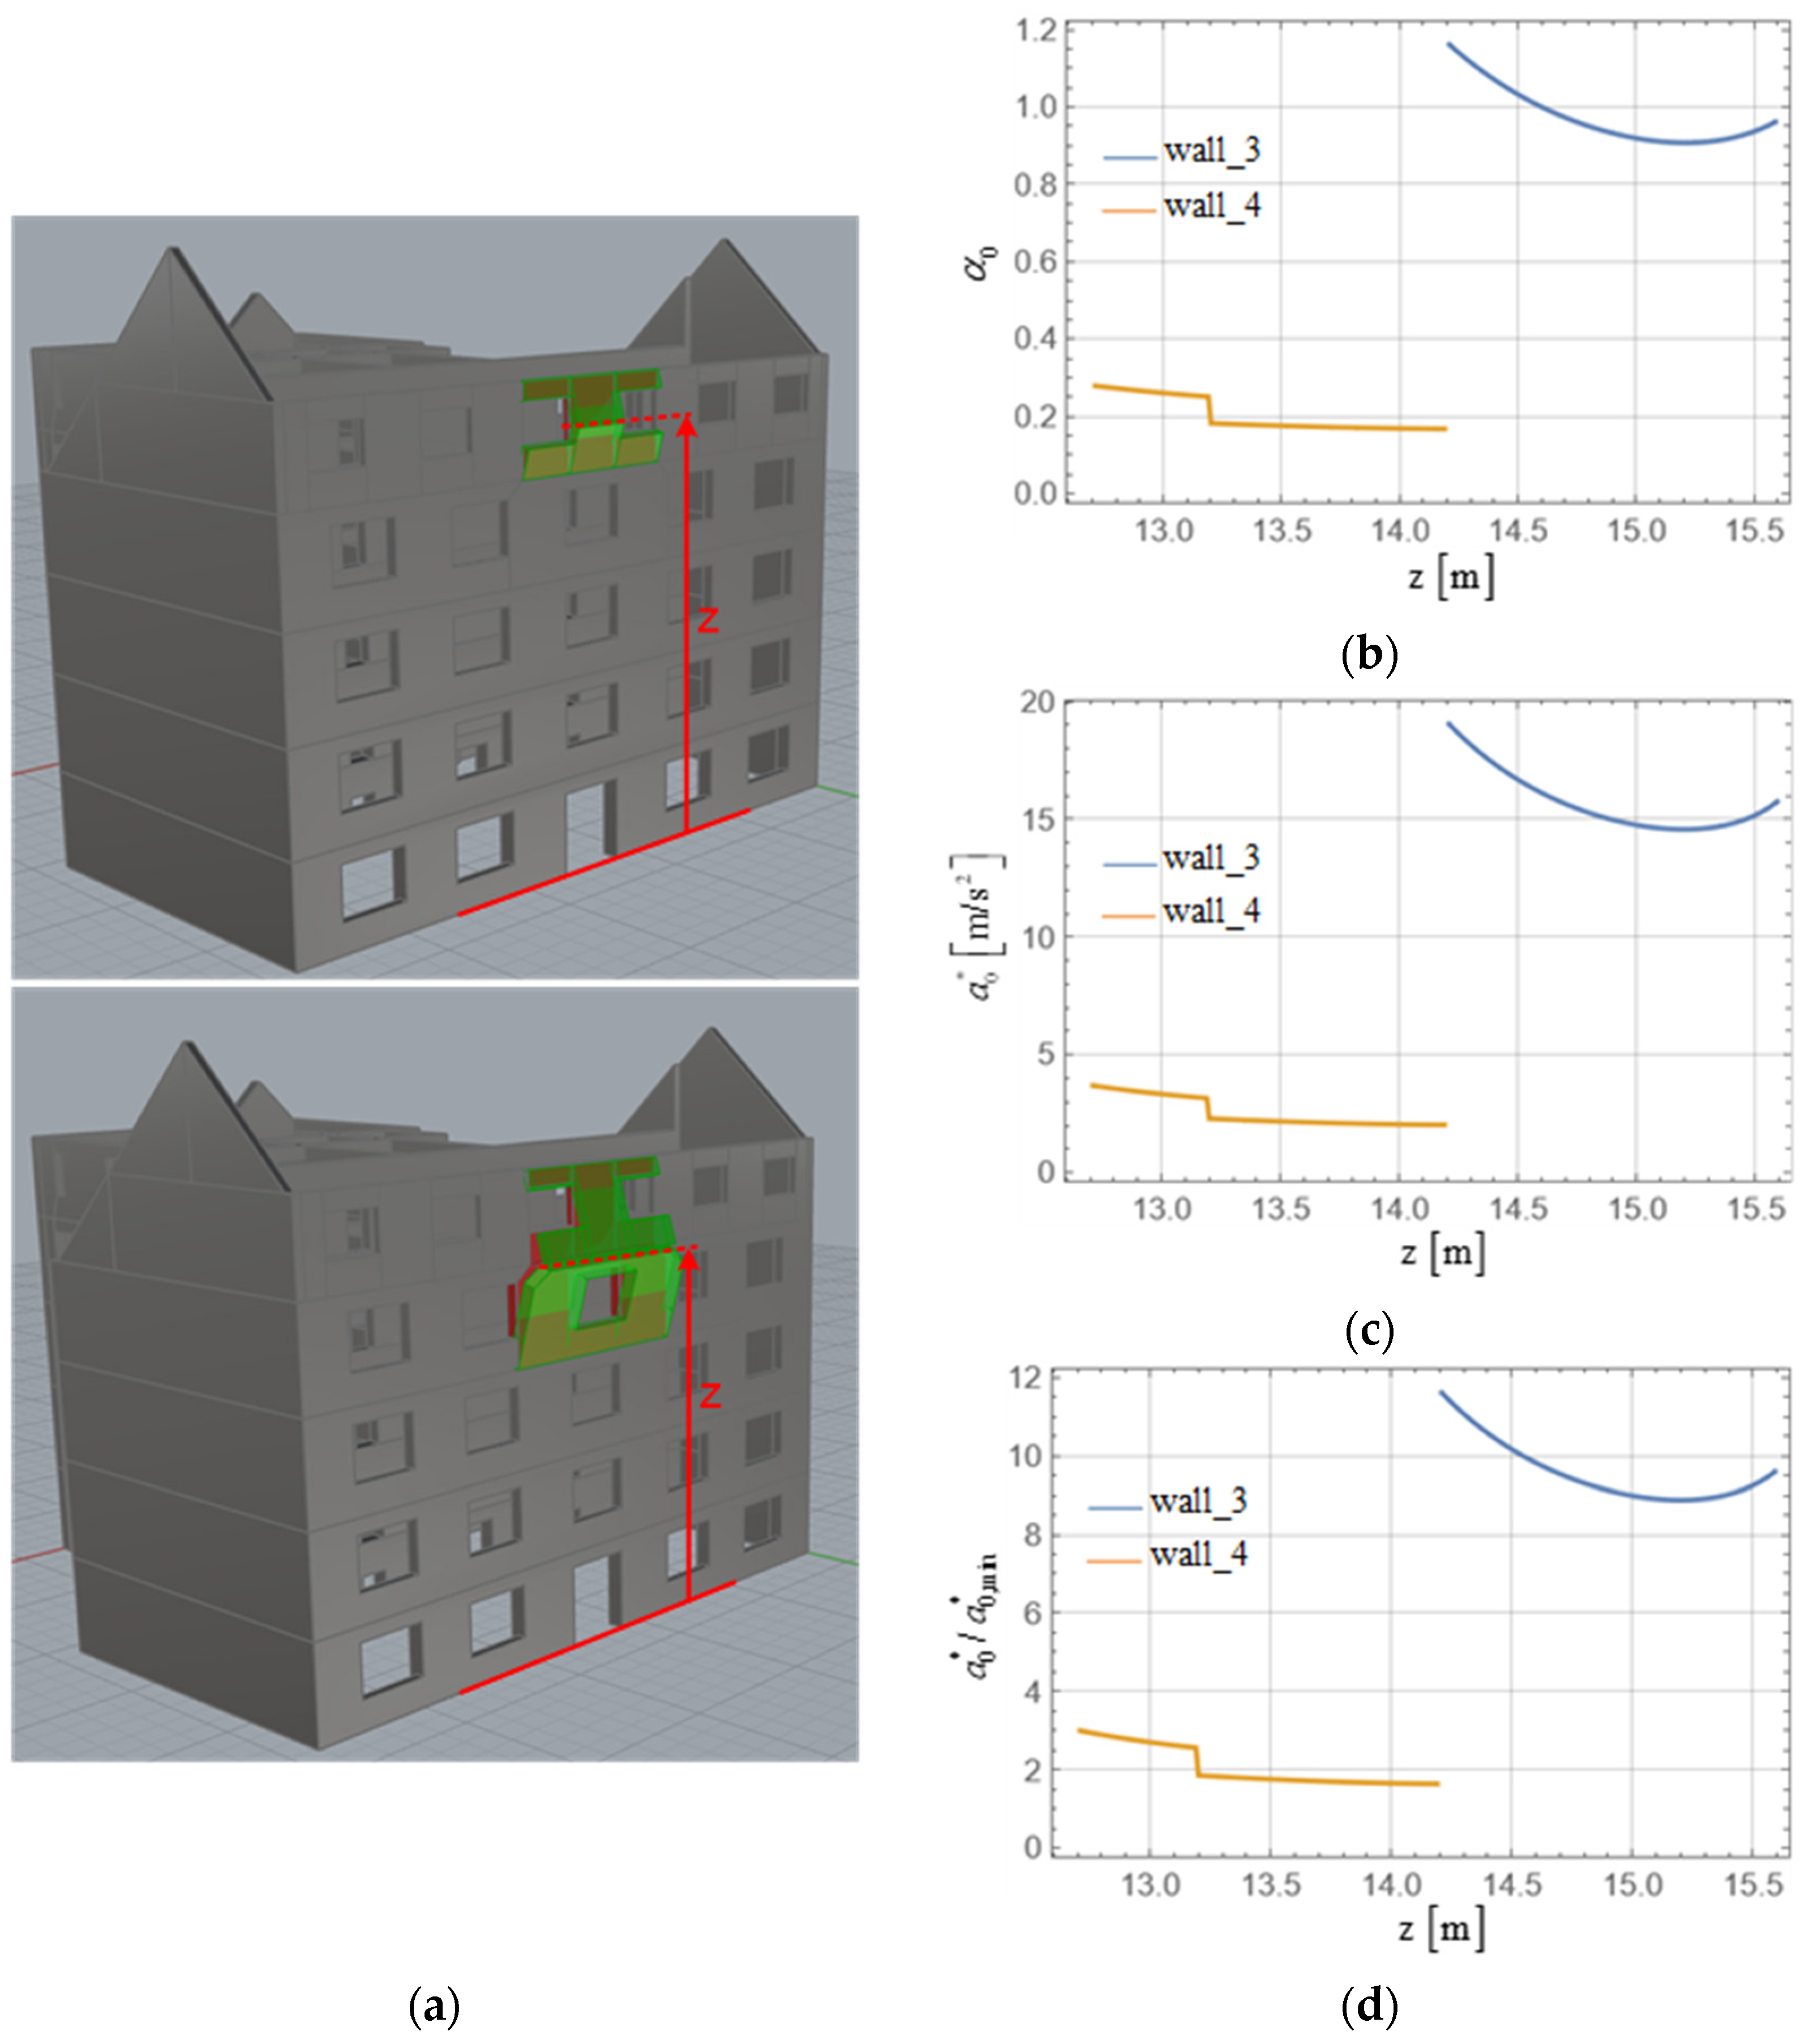
In addition, for the type of mechanism that considers the formation of an internal line hinge and the formation of a kinematic chain, two cases of façade walls were considered. It is worth noting that for these cases, a relatively good connection between floor structures and walls was assumed. The vertical position of the inner line hinge is assumed to be a variable parameter. For wall_3, it was assumed to form over the height of the pier and, for wall_4, it was assumed to form between the openings of the lower and upper floors. The results in
Figure 22 show that the one-story mechanism (wall_3) had a high activation requirement regardless of the position of the internal line hinge formation. However, if the geometry of the local mechanism included two stories (wall_4), the activation coefficient decreased considerably. Moreover, in this case, the sudden drop in the activation coefficient and spectral acceleration observed for the formation of the internal hinges at 13.2 m was a consequence of the change in wall thickness from 45 cm (lower story) to 30 cm (upper story), which was taken into account in the numerical calculation.
In order to compare this to seismic action, the demand
was used, where the participation factor of the fundamental mode approximated by the number of stories is
,
z is the height of the formation of the line hinge,
H is building height, and
q is a factor with the value 2. The corresponding minimum values are plotted for different return periods in
Figure 21d. When comparing demand values with those obtained in the analysis, it was evident that for the return periods of 475 and 225 years, it does not satisfy requirements for all considered mechanisms except for wall_3. However, it should be mentioned that the formation of the line hinge of wall 2 below z = 10 m is unlikely because this mechanism assumes the formation of cracks on all spandrels of the orthogonal wall that will contribute to the separation of the considered wall. Furthermore, for the 95-year return period, the activation demand was satisfied in the case of a line hinge forming above the height of 13 m for the west courtyard wall (wall_2), and for gable (wall_1) above approximately z = 18.5 m. Nevertheless, it is worth mentioning that this analysis considered only the activation of the mechanism and not the eventual overturning of walls. Furthermore, this criterion is in most cases conservative, which is common of linear methods. Although the position of the line hinge of the presumed mechanisms shifted toward higher floors and the value of the activation acceleration increased, which was favorable, the walls of higher floors were still more prone to out-of-plane failure. Elements of the higher floors tended to be subjected to higher values of floor acceleration and generally had fewer connections, which constrained the mechanism to some extent, or like gable wall_1, they had no constraint at all. In the case of the two-story bending mechanism (wall_4), our investigation of the 95-year return period of seismic action returned an acceptable degree of safety. However, the formation of this kind of mechanism is highly dependent on adequate constraint at the top of the mechanism.
6. Discussion
The main results of our analysis will be presented and a critical review of certain methods will be given in this section. Some ambiguities and problems arising from the application of simpler methods will be pointed out and the reasons will be explained.
Our analysis using the response spectrum method, which is commonly used for the design of new structures, resulted in a base shear force value of 15% of the weight for the X direction and 16% of the weight for the Y direction (with an importance factor of 1.0 and a behavior factor of 1.5) for a return period of 95 years. Such a level of lateral forces resulted in significant local exceedance of the load-bearing capacity, even with the redistribution of internal forces. In our analysis with linear methods, due to their shortcomings, stress concentrations occurred regularly, so it often happened that short and slender elements were considerably overloaded. Such cases should be well analyzed because, strictly speaking, the resistance of a building is determined by the resistance of the critical primary elements. This requires professional engineering judgment and experience in analyzing the condition of existing buildings, as well as experience in numerical modeling, since there are often stress concentrations and unrealistically large internal forces in the elements due to inadequate discretization in the model and poor conditionality of the model. Therefore, it is important to consider which element failures affect structural stability and the capacity of surrounding load-bearing elements, and how much the load-bearing capacity is exceeded. If it is found that the force exceedance is relatively small and there are adjacent walls capable of resisting forces after the failure of the critical element, this type of isolated element can be ignored with caution. Therefore, it is very important to take into account the main disadvantage of linear calculations, namely that the distribution of forces is decided according to the stiffness that in reality changes during the dynamic response, and that ductility is not taken into account. Finally, the SD limit state of the building is determined by the critical elements on the third floor, which in this study, was only 43% of the demand for ag = 0.125 g. The SD limit state of critical elements on the first and second floors occurred at 58%, while in the basement and on the ground floor, it was at 76% of the ground acceleration for a return period of 95 years.
An analysis of the building seismic performance using a nonlinear pushover method was carried out. Linear lateral force distribution proved to be the most relevant. All analyses showed a regular occurrence of exceeding the SD limit state of spandrels firstly. However, it is worth noting that the load capacity curves for spandrels have not been sufficiently studied and are often very conservative. Although failure of several spandrels will not cause partial structural collapse, especially if rigid or partially rigid diaphragms are ensured, they should be strengthened. Otherwise, the failure of the spandrels can lead to partial failure of the floor structures. The assumption is that the spandrels are secondary elements that do not compromise the overall stability of the structure. In the +X direction, the first pier failure occurred at the third floor, and it is very common for pier failures to occur at the higher floors of a building as a result of a low axial force that significantly reduces the load-bearing capacity of the elements. It is also worth mentioning that this type of building is constructed with a reduction in wall thickness at higher floors. Therefore, special attention should be paid to the higher floors of the building. Meanwhile, the −X direction showed that the failure mechanism was initiated by the damage of the piers at the first and second floors of the western courtyard wall, as a consequence of torsional effects caused by the asymmetry of the building plan and the eccentricity of the lateral force, but also by the low vertical load and the relatively high stiffness of these elements. The pushover analysis for the Y direction showed that, in addition to the spandrel failure already mentioned, the piers on the first and third floors of outermost south wall and the staircase wall were critical. Limit state control is carried out at the level of the whole structure and at the level of the element. If an element fails before the global load-bearing reserves are utilized, that element should be strengthened to ensure sufficient deformation capacity. Depending on the importance of the element for structural stability, it is possible to declare this element as secondary, which allows for an increase in the deformation capacity by up to 0.6% of the wall height. If we want to exploit the global load capacity reserves according to the load capacity curve of the building, intervention and strengthening of the critical elements in the higher floors of the building need to be ensured.
Relevant analyses were also conducted in comparison with the load-bearing capacity and building deformation requirement, which were achieved by reducing the system to an SDOF equivalent system carried out according to the N2 method. Only comparisons for a 95-year return period of seismic action were considered since it is the mandatory minimum according to CTRBS. The cases of load distribution without eccentricity showed that in both directions, the building had same load-bearing reserves, and the maximum PGA ranged from 0.17 g to 0.19 g, approximately corresponding to the 225-year return period of seismic action and, therefore, almost sufficing to meet the requirement of Level 3 of CTRBS. However, when the eccentricity of the lateral force was taken into account, the PGA dropped to approximately 0.125 g, scarcely satisfying the CTRBS requirement for Level 2 of seismic resistance.
The possibility of activation of out-of-plane failure was also considered when performing a parametric analysis of the local mechanisms using the linear kinematic analysis method. The analysis carried out for the west courtyard wall showed the possible activation of the mechanism if the linear hinge formed below the third floor level when considering seismic action for a 95-year return period. By taking into account the damage patterns identified by the pushover analysis on the structural elements, especially on the piers and spandrels on the side walls, the possibility of the linear hinge formation and the activation of the mechanism between the first and third levels was found to be probable. Therefore, it is extremely important to draw special attention to strengthening connections, especially in the area of the lintels and parapets on the side walls. In addition, our analysis of the gable wall showed that it can be particularly critical for out-of-plane failure because it is partially cantilevered. It has low vertical loading (only self-weight), which has a stabilizing effect, and insufficient connections with perpendicular elements. While in the case of the west wall, the initiation of the overturning process depends on the damage of the joints, for this wall, it is very likely even with a very low intensity of seismic action. Finally, the numerical analysis of the cases in which a kinematic two-body chain was formed showed that this mechanism should be the preferred one, but it requires that adequate connections with the floor structures are provided on each floor.


 ,
, 


