Article

Analysis on Flexural Performance of Prestressed Steel-Reinforced UHPC Beams

1
School of Architecture and Engineering, Yangzhou Polytechnic Institute, Yangzhou 225127, China
2
College of Civil Science and Engineering, Yangzhou University, Yangzhou 225127, China
3
The Third Engineering Co., Ltd. of CCCC Fourth Harbor Engineering Co., Ltd., Zhanjiang 524005, China
*
Authors to whom correspondence should be addressed.
Buildings 2024, 14(12), 4029; https://doi.org/10.3390/buildings14124029
Submission received: 20 November 2024 / Revised: 13 December 2024 / Accepted: 16 December 2024 / Published: 18 December 2024
(This article belongs to the Section Building Structures)

Abstract

The flexural performance of prestressed steel-reinforced ultra-high-performance concrete (UHPC) beams was investigated through finite element (FE) modeling and nonlinear numerical analysis. Two FE models were established for prestressed steel-reinforced concrete beams and prestressed UHPC beams, respectively, and the accuracy was validated by comparing with the experimental results. On this basis, a comprehensive analysis of load–deflection behavior, load–strain relationships, and failure modes was conducted under varying parameters, including reinforcement ratio, prestress level, steel web thickness, and steel flange thickness. The results indicate that an increase in reinforcement ratio from 1.17% to 1.90% enhanced the ultimate load by 12.05%, while increasing the prestress level from 0.61 to 0.76 improved the cracking load by 114.88% and the ultimate load by 53.73%. Moreover, the beams exhibited superior ductility and cracking resistance compared to conventional concrete structures. A formula for predicting the flexural capacity of prestressed steel-reinforced UHPC beams was derived, showing an average error of less than 3% when compared with FE simulations. This formula provides a reliable basis for the structural design and optimization of high-performance composite beams in engineering practice.

1. Introduction

With the acceleration of urbanization, structural engineering is increasingly focusing on high-performance structures that emphasize sustainability, disaster resilience, and durability [1]. Steel–concrete composite structures, known for their excellent load-bearing capacity and seismic performance, are widely used in engineering applications [2,3]. However, ordinary concrete has limitations such as poor tensile strength, low cracking load, and inadequate durability. These issues often lead to significant cracking in steel–concrete composite structures before they reach their intended service life, hindering the sustainable development of modern structural engineering.
Ultra-high-performance concrete (UHPC) offers superior tensile strength, compressive strength, and durability [4,5,6]. Prestressing, by introducing pre-applied stress, prevents or delays cracking under normal service conditions and enhances the mechanical performance of concrete beams [7,8]. To meet the demand for high performance and sustainability, the ordinary concrete in steel-concrete composite structures is replaced with UHPC. The composite structure is then integrated with prestressing techniques to develop a prestressed steel-reinforced UHPC structure. This approach resolves the low cracking load and poor durability issues of ordinary concrete, reduces component cross-sections, and improves load-bearing capacity.
However, research on the prestressed steel-reinforced UHPC beams is currently very limited. To address this, the finite element (FE) model based on existing experimental research on prestressed concrete beams was built and validates its accuracy. On this basis, a nonlinear analysis of the flexural performance of prestressed steel–UHPC beams is conducted.
Plenty of research has been carried out on steel-reinforced beams. Hou et al. [9] compared the performance of steel-plate-reinforced concrete (SPRC) beams under cyclic load, confirming that SPRC coupling beams possess higher bearing capacity and larger plastic deformation. Xu et al. [10] proposed a novel steel–concrete composite beam that uses steel fibers as a substitute for the steel reinforcement cage. They also developed a formula for calculating the flexural capacity of such beams. Chen et al. [11] studied the shear performance of steel–concrete beams and found that flange thickness would greatly affect the shear strength. Weng et al. [12] found that obvious horizontal cracks appeared at the interface between the steel flange and concrete and concluded that the ratio of flange width to thickness had a major influence on shear splitting failure. Yao et al. [13] experimentally studied the shear performance of ultra-high-strength prestressed steel–concrete beams and found it had higher residual shear capacity and post-cracking stiffness. Compared with normal concrete beams, steel concrete beams have a great increase in flexural or shear capacity.
The research on UHPC applied to beams has become more and more mature. Yang et al. [14] found that UHPC effectively resisted cracking and showed good ductility. It performed better if steel fibers were arranged at the bottom of the beam. Singh et al. [15] found that steel fibers effectively resist the expansion of cracks and improve the bearing capacity even after the reinforcement has yielded. Wang et al. [16] found through experiments that the combination of high-strength steel reinforcement and UHPC can more effectively enhance ultimate load capacity, deformation capacity, and ductility. Dong et al. [17] conducted flexural performance tests on UHPC beams cast with ultra-fine stainless-steel wire (SSW) reinforcement. The results demonstrated that SSW effectively enhances the flexural toughness of UHPC beams. Yoo et al. [18] compared structural performance of ultra-high-performance concrete beams with different fibers and found the increase in the length of smooth steel fibers and the use of twisted steel fibers led to improvements in post-peak response and ductility. Cho et al. [19] studied the influence of whether steel fibers were added or not on the shear performance of large-size concrete beams, finding that the shear strength and ductility with steel fibers was greatly improved. The above research indicates that UHPC instead of normal concrete not only improves the bearing capacity of structures but also effectively improves the cracking resistance and deformation performance.
Currently, extensive research has been conducted on prestressed components, yielding significant findings. Fu et al. [20] compared seven prestressed steel-reinforced concrete beams and six beams without prestressed tendons, showing that the former improved the crack resistance performance in addition to the increase in flexural capacity. Fang et al. [21] proposed a numerical analysis model for the moment–curvature relationship of prestressed UHPC beams and developed a flexural design method for the cross-sections of such beams. Zhan et al. [22] found that the cracking load could be greatly increased by applying prestressed tendons to prestressed concrete-filled steel tube beams. Li et al. [23] studied precast prestressed lightweight aggregate concrete–conventional concrete composite beams and found that they performed well in cracking load, dead weight, and plasticity. Li et al. [24] developed calculation formulas for the flexural capacity and maximum crack width of unbonded prestressed basalt fiber recycled concrete beams. The above studies fully prove that the application of prestress greatly increases the cracking load of girder construction and improves the cracking resistance performance, which has a very important significance for the durability of structures.
Although previous research has examined UHPC beams and prestressed steel-reinforced beams separately, studies on combining UHPC, steel, and prestressing are still limited. There is little exploration of the integrated benefits of prestressed steel-reinforced UHPC beams. This study addresses this gap by investigating the bending performance of prestressed steel–UHPC beams. By combining these high-performance materials, structural design is optimized, and both load-bearing capacity and durability are significantly improved.
To achieve this, nine prestressed steel-reinforced UHPC beams were designed. Four-point bending simulations were conducted using ABAQUS software (2016, University of California, Berkeley, CA, USA). The effects of reinforcement ratio, prestress level, web thickness, and flange thickness on load-bearing capacity will be analyzed. Finally, a formula for predicting flexural load-bearing capacity was developed.

2. Establishment of Finite Element Model

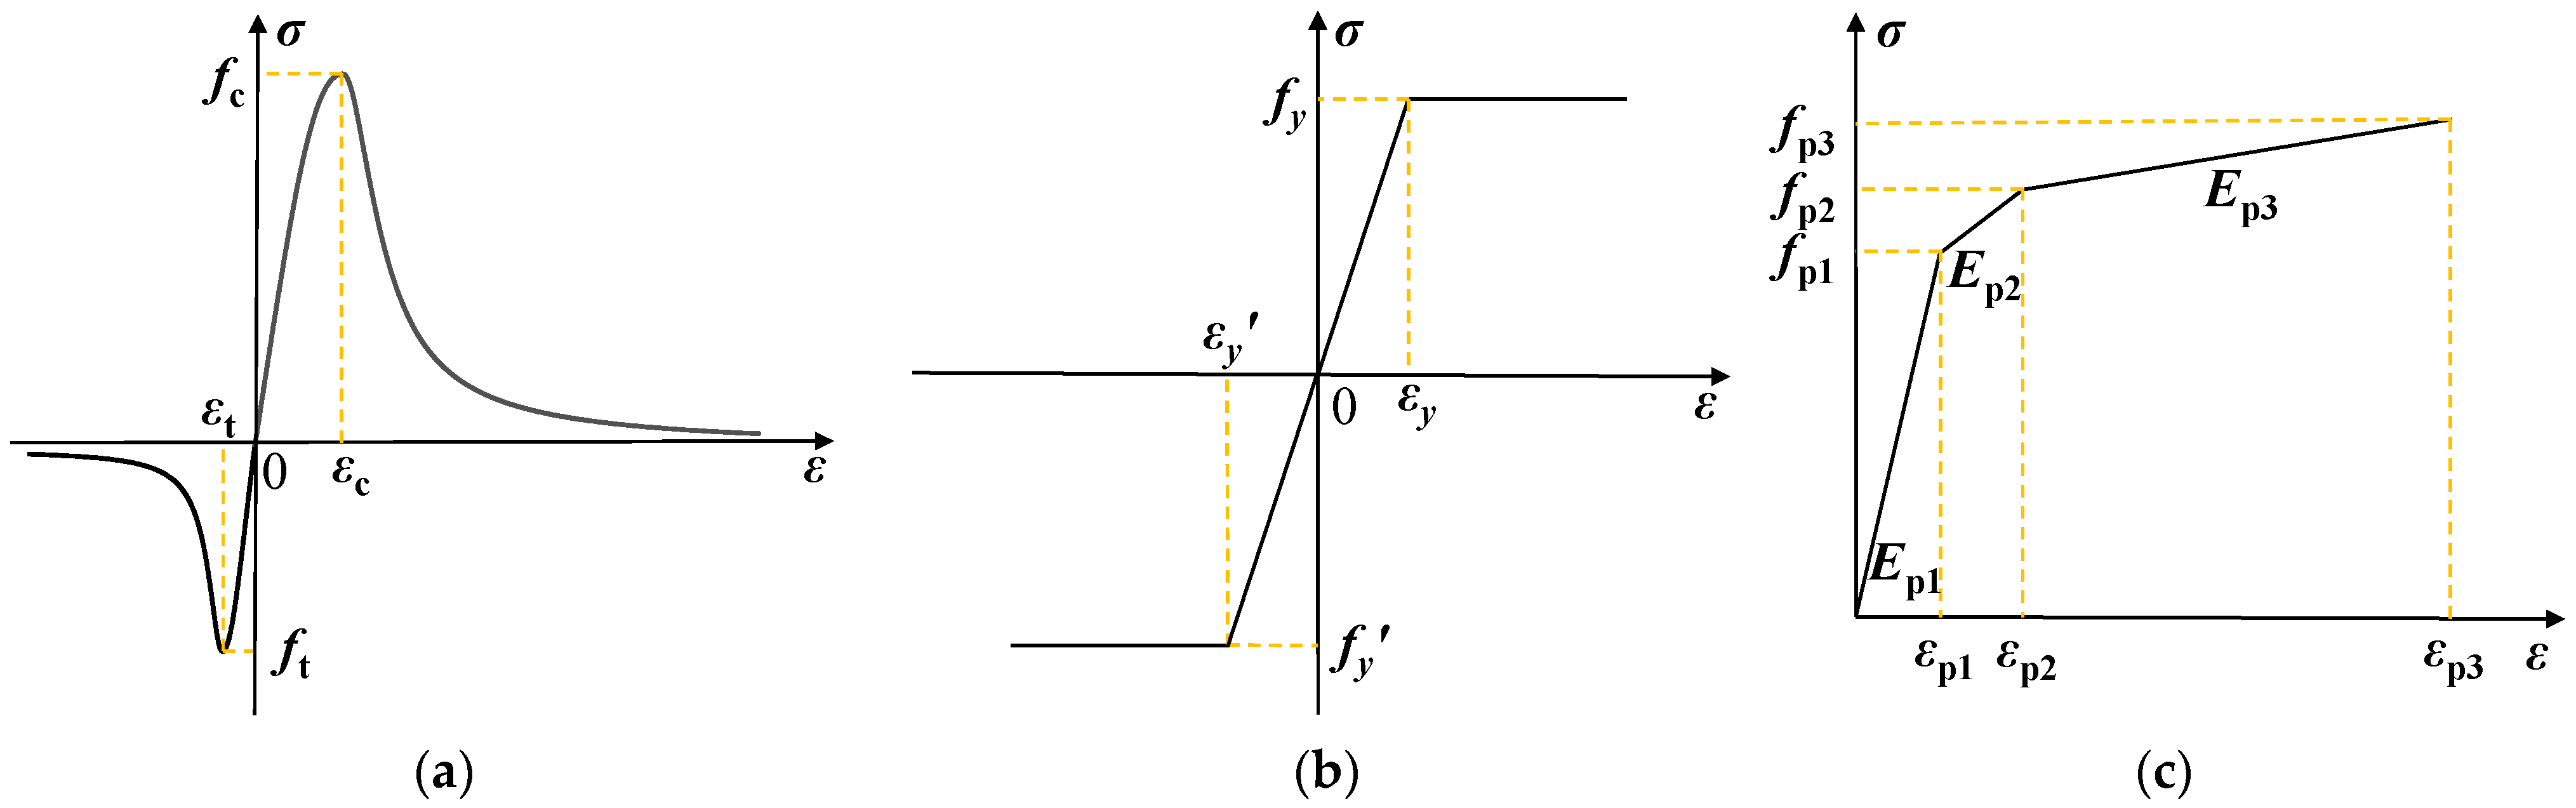
2.1. Constitutive Relationship of Materials
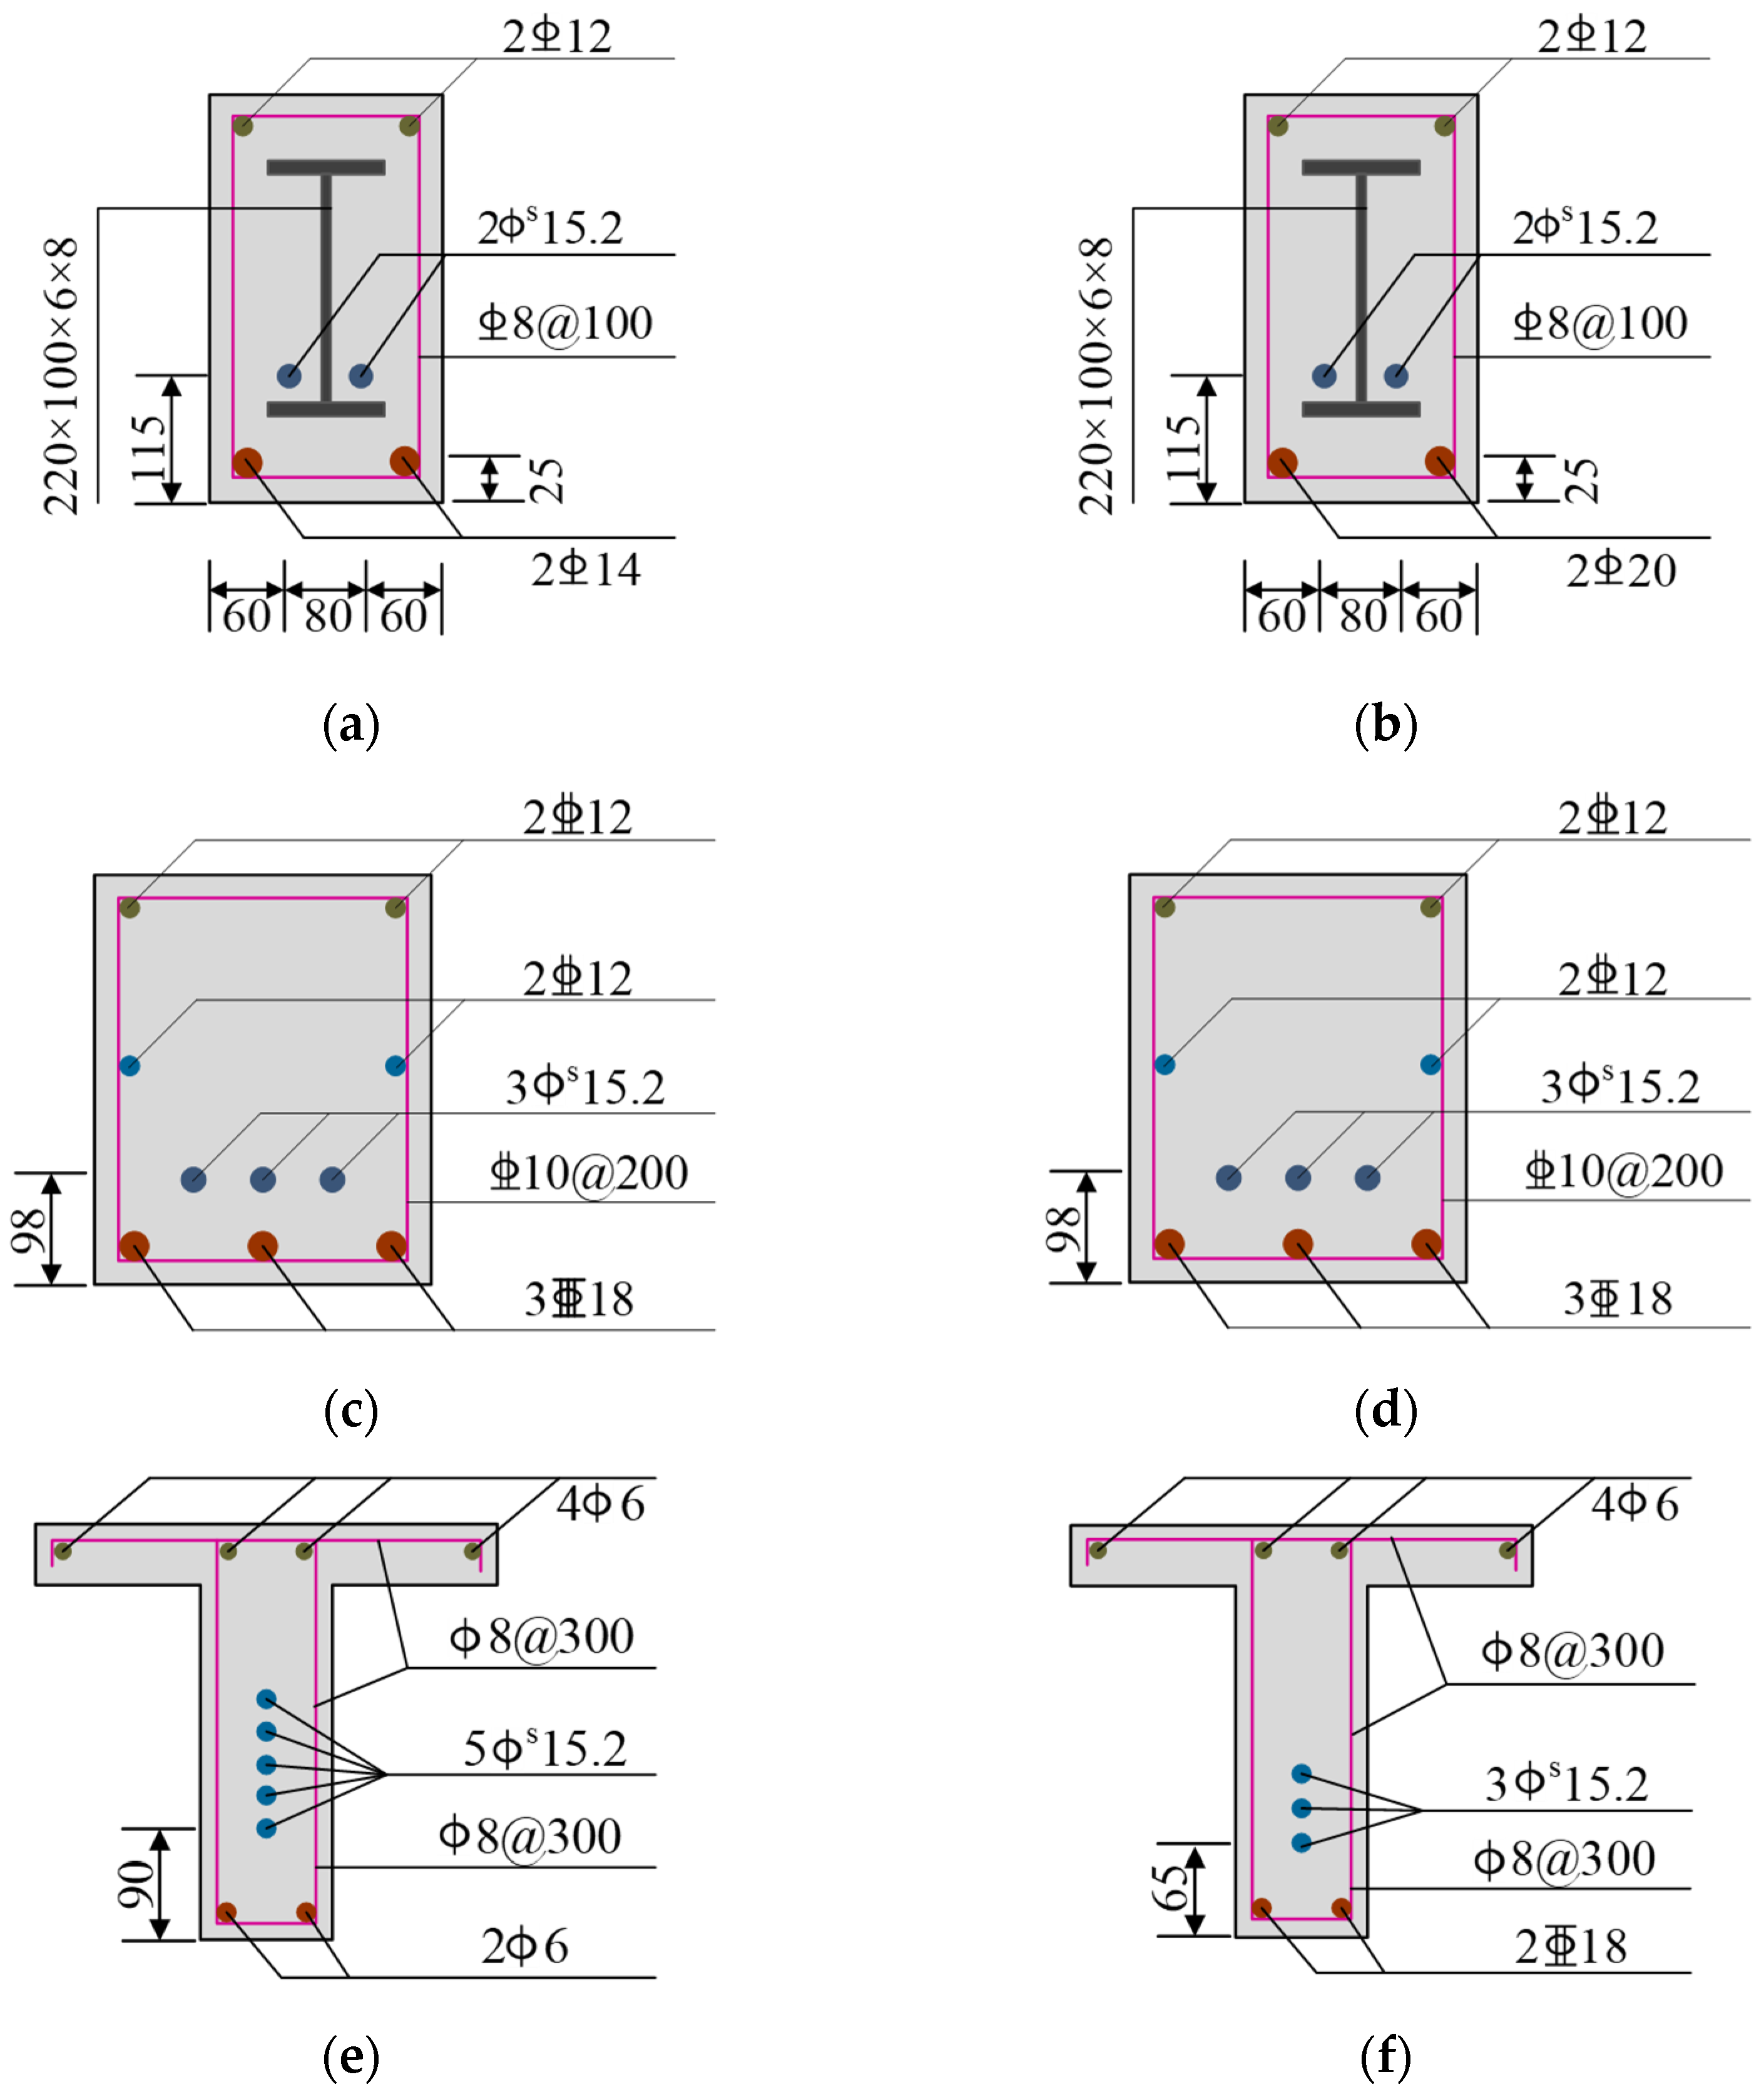
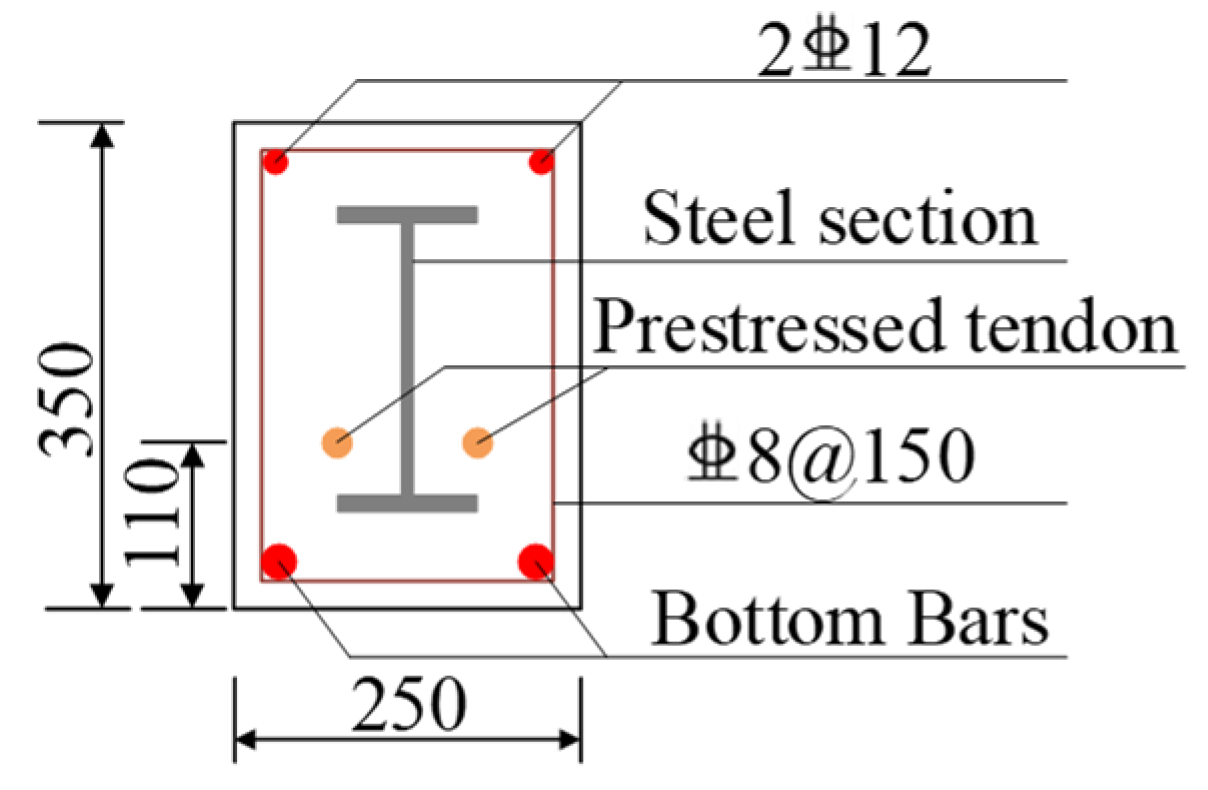
The stress–strain curves for UHPC, reinforcement, steel section, and prestressed tendon are illustrated in Figure 1. The two-parameter constitutive model proposed by Guo [25] and the uniaxial stress–strain curve equation proposed by Zheng [26] were selected as the compressive and tensile constitutive relationship of normal concrete and UHPC, respectively. The stress–strain curve expressions of normal concrete and UHPC were shown in Equations (1)–(2) and (3)–(4), respectively, where σc and σt are the prism compressive and tensile stress of concrete, fc and ft are the uniaxial compressive and tensile strength of concrete, and εc and εt are the compressive and tensile peak strain of concrete corresponding to fc and ft, respectively.
σ c f c = 2 ε / ε c ε / ε c 2                                                                                                                 ε < ε c ε / ε c 2 ( ε / ε c 1 ) 2 + ε / ε c                                                                                                     ε ε c
σ t f t = 1.2 ε / ε t 0.2 ε / ε t 6                                                                                       ε < ε t ε / ε t 0.312 ( ε / ε t 1 ) 1.7 + ε / ε t                                                                                 ε ε t
σ c f c = 1.55 ε / ε c 1.20 ( ε / ε c ) 4 + 0.65 ε / ε c 5       0 ε / ε c < 1 ε / ε c 6 ( ε / ε c 1 ) 2 + ε / ε c                                                                         ε / ε c 1
σ t f t = 1.17 ε / ε t + 0.65 ( ε / ε t ) 2 0.83 ε / ε t 3       0 ε / ε t < 1 ε / ε t 5.5 ( ε / ε t 1 ) 2.2 + ε / ε t                                                               ε / ε t 1
In order to simulate the cracking form of concrete, the concrete damaged plasticity (CDP) model in ABAQUS is adopted. This model reflects the stiffness degradation and other related properties of concrete under load through the damage parameter d [27]. In this model, the damage of concrete should be considered only after the stress reaches the peak value. The calculation formula for the damage parameter d is expressed in Equations (5) and (6).
d = 1 σ t / f t                   ε / ε t 1
d = 1 σ c / f c                 ε / ε c 1
The remaining material parameters of UHPC were assigned as follows: the flow potential offset ζ was set to 0.1; the viscosity coefficient μ was set to 0.001; the dilation angle ψ was set to 30°; the ratio of biaxial compressive strength to uniaxial compressive strength σb0/σc0 was set to 1.16; and the constant stress ratio between the tensile and compressive meridians Kc was set to 2/3.
The ideal elastic–plastic model was adopted for reinforcement steel and steel section, which means the uniaxial stress–strain curve is linear before reaching the yield strength and turns to the plastic stage after yielding, at which time the stress remains unchanged with the strain increasing, showing ideal plasticity. The expressions of steel bars and steel section were shown in Equations (7) and (8), respectively, where Es and Ea are the elastic modulus of the steel bars and steel section, εs and εa are the yield strain of those.
σ s = E s ε             0 ε ε s f y                         ε ε s
σ s = E a ε             0 ε ε a f a                         ε ε a
The trilinear model was adopted for prestressed tendons [28], whose stress–strain relationship expression was shown in Equation (9). Here, Ep1, Ep2, and Ep3 are the elastic modulus in the proportional stage, non-proportional stage, and yield stage of prestressed tendons, fp1, fp2, and fp3 are the stress of the proportional limit point, yield point, and limit point, and εp1, εp2, and εp3 are the strain corresponding to the above three nodes, respectively.
σ p = E p 1 ε p                                                           ε p < ε p 1 f p 1 + E p 1 ( ε p ε p 1 )               ε p 1 ε p ε p 2 f p 2 + E p 2 ( ε p ε p 2 )               ε p 2 ε p ε p 3

2.2. Model Design

As shown in Figure 2, the FE model of the prestressed steel-reinforced UHPC beam was established. The UHPC and rigid pads were modeled using eight-node reduced-integration solid elements (C3D8R), while the reinforcement bars, steel sections, and prestressing tendons were modeled using two-node 3D truss elements (T3D2). Since the bond–slip effects between materials were neglected, all steel components were embedded within the UHPC using the embedded region constraint. The upper surface of rigid plates was coupled with the loading points, and the lower surface was tied with the beam. In order to prevent the concrete on both sides from being damaged due to excessive stress when the prestressed tendons were stretched, a steel plate was placed on each side of the beam to bear part of the stress, and the interaction between the plate and concrete was bound by tie technology. Moreover, the unit length of UHPC, steel bars, steel section, and prestressed tendons were all 25 mm.

2.3. Application of Prestress

The application of prestress in ABAQUS can be simulated using various methods, including the rebar element single method, MPC method, rebar layer method, and the cooling method [29]. In this model, the cooling method is employed. This approach first assigns an initial temperature state to the prestressing tendons and then applies a specified temperature drop during the simulation. Due to the material’s thermal expansion coefficient, the temperature decrease causes the material to contract. However, under the imposed constraints, the material cannot freely contract, thereby inducing tensile stress in the prestressing tendons, equivalent to the actual tensioning of prestressing tendons. In the ABAQUS loading module, a predefined field is applied to the prestressing tendons. The cross-sectional variation is set using a regional constant, which represents the temperature difference. The temperature drop is calculated using Equation (10), where ΔT denotes the temperature drop, σ is the initial prestress value, Ep is the elastic modulus of the prestressing tendons, and α is the thermal expansion coefficient of the prestressing tendons, taken as 1.0 × 10⁻5.
The cooling value is calculated using Equation (10), where ΔT denotes the cooling value, σ represents the initial prestress, Ep is the elastic modulus of the prestressing tendons, and α is the linear expansion coefficient of the tendons, taken as 1.0 × 10⁻5. An initial temperature of 0 °C was set, and the cooling method was applied to induce an initial tensile stress of 1000 N/mm2 in the prestressing tendons. Based on Equation (10), the cooling value was determined to be 500 °C.
ΔT = σ/αEp

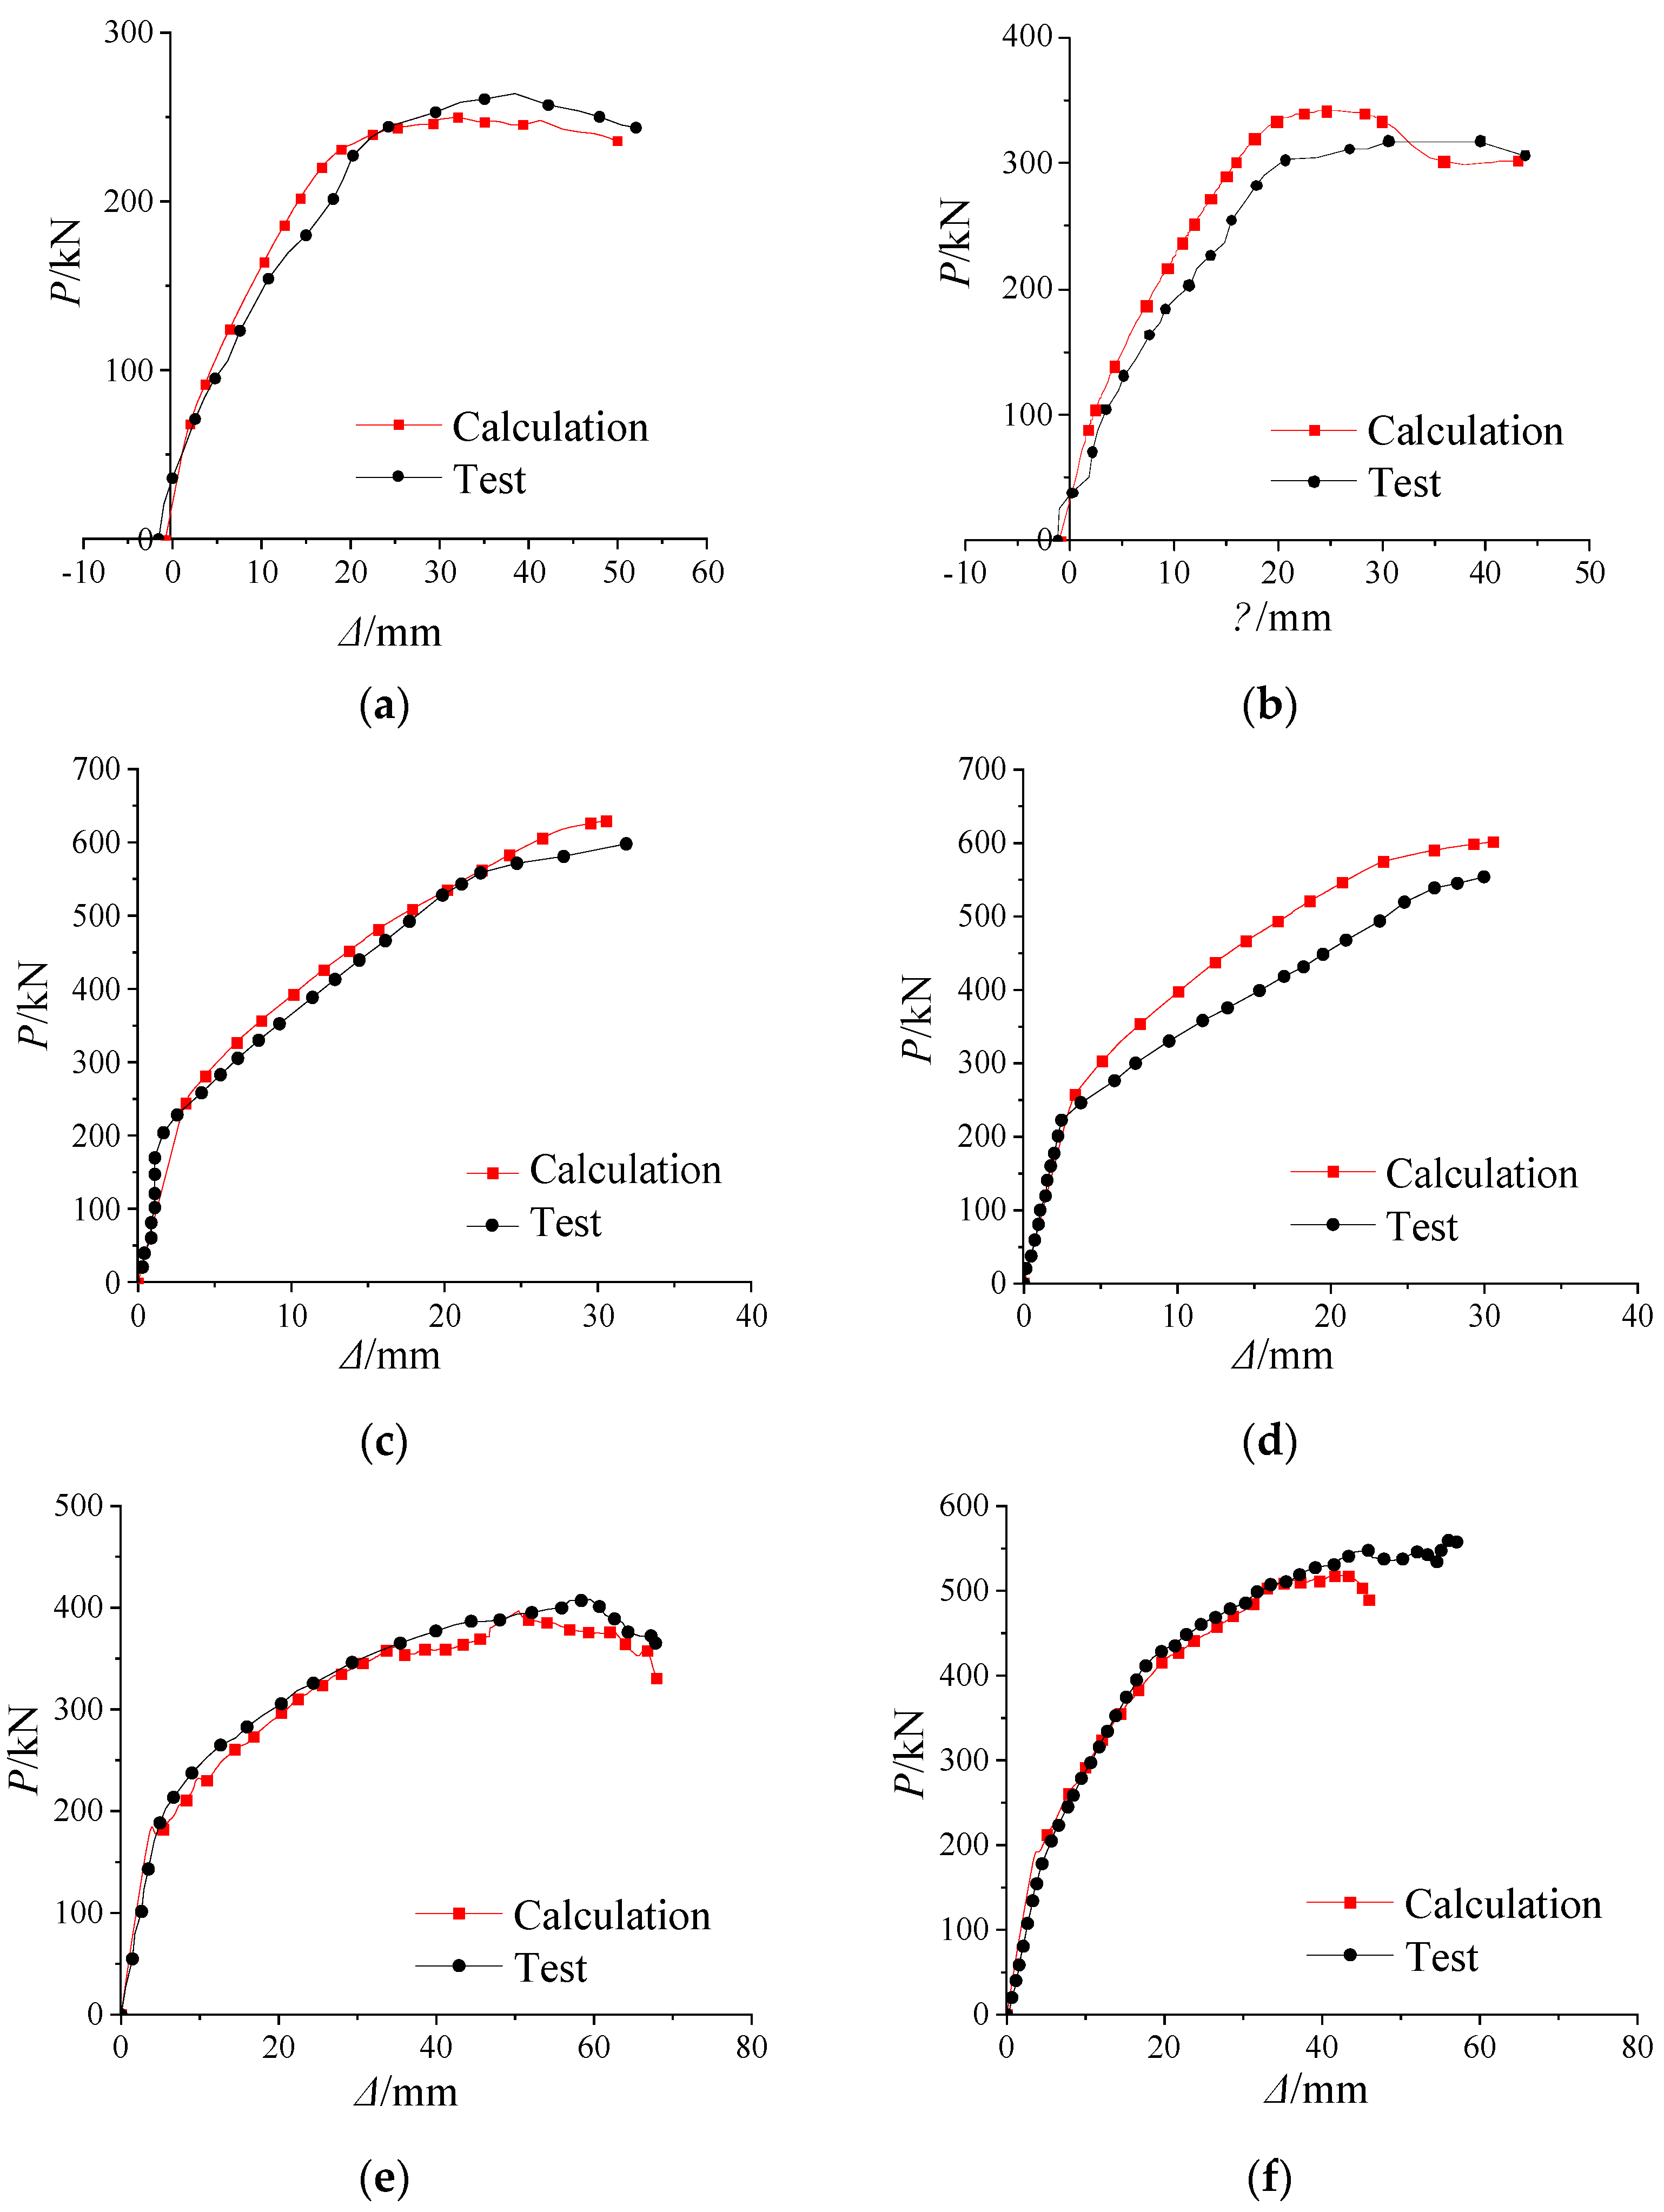
3. Validation of the Developed Model for Prestress Concrete Beams

The experimental results in three related literatures were validated by nonlinear simulation analysis. Fu [20] designed a total of 13 test beams, 7 of which were prestressed steel-reinforced concrete beams, numbered PSRCB-1 ~ PSRCB-7. The dimensions of the specimens were as follows: 200 mm × 350 mm cross-section, 4000 mm total length, 3800 mm clear span, 1200 mm pure bending segment, and 1300 shear span. The size of built-in steel section was 200 mm × 100 mm × 5.5 mm × 8 mm, whose yield strength fa was 305 N/mm2. Two 1860-grade low-relaxation prestressed tendons with a diameter of 15.2 mm were symmetrically arranged.
Chen [30] designed six partially prestressed beams with a high-strength steel bar, three of which were bonded prestressed beams, numbered YL-1~YL-3. The total length was set as 5100 mm, the clear span was 4800 mm, and the cross-section was 400 mm × 500 mm. Two HRB400-grade steel bars with a diameter of 14 mm were configured for the standing ribs and waist ribs, and HRB400-grade steel bars with a diameter of 10 mm were configured for the stirrups. Three 1860-grade low-relaxation prestressed tendons with a diameter of 15.2 mm were arranged symmetrically. The length of the constant bending moment region and shear span were all designed to be 1600 mm.
Xu [31] designed a total of six prestressed UHPC T-shaped beams, numbered PB-1 ~ PB-6. The total length was 3500 mm, the clear span was 3300 mm, and the size of the web was 120 mm × 300 mm. Three or five 1860-grade low-relaxation prestressed tendons with a diameter of 15.2 mm were arranged on the lower side of the web. The length of the constant bending moment region and shear span were set as 1000 mm and 1150 mm, respectively.
As to all the above three tests, a four-point symmetric loading scheme was selected, and the cross-section configuration diagram is shown in Figure 3. Information such as the strength and elastic modulus of concrete, the size and strength of tensile reinforcement, and effective prestress can be found in Table 1. In addition, the elastic modulus of reinforcement and steel section was 2.0 × 10⁵ N/mm2, and that of prestressed reinforcement was 1.95 × 10⁵ N/mm2 according to relevant specifications [32].
Figure 4 presents a comparison between the experimental and calculated load–deflection (P-Δ) curves for the six specimens. Two curves were in great agreement, including key points such as initial stiffness and ultimate load et al. The comparison of peak loads between test results and simulations is shown in Table 2. Put and PuFE represent the test peak load and the simulated peak load, respectively. The Put/PuFE ranged from 0.92 to 1.06, with an average value of 0.988, a standard deviation of 0.063, and a coefficient of variation of 0.064. These results indicate that the established model has a reasonable degree of reliability, providing a solid foundation for subsequent parametric analyses.

4. Nonlinear Analysis of Prestressed Steel-Reinforced UHPC Beams

Based on the above calculation and analysis, a total of 10 specimens were designed, 9 of which were prestressed steel-reinforced UHPC beams, as shown in Figure 5. For all the beams, the total length was 2500 mm, the cross-section was 200 mm × 350 mm, the length of the shear span was 800 mm, and the length of the pure bending segment was 600 mm. The inner steel section was arranged in the center. Bars with diameters of 12 mm and 8 mm were chosen as the upper bars and stirrups, respectively. To ensure the sufficient shear capacity of the beam, the stirrup spacing was set to 80 mm in the bending shear region and 150 mm in the pure bending region. Detailed information such as the size of steel section, bottom bars, and prestressed tendons can be found in Table 3. The four-point symmetric loading scheme was selected as the loading mode.
The prestressing tendons used in the model were 1860-grade low-relaxation steel strands. In ABAQUS, the initial temperature is set to 0 °C, and the cooling method was utilized to apply an initial tensile stress of 1000 N/mm2 to the prestressing tendons. According to Equation (10), the calculated temperature drop is 500 °C. The strength of all materials was taken as the standard value. For steel bars, the yielding strength fy and elastic modulus Es of steel bars were 400 MPa and 2.0 × 10⁵ MPa; for UHPC, the compressive strength fc, tensile strength ft, and Poisson’s ratio μ of UHPC were 105.6 MPa, 10.64 MPa, and 0.2, respectively; the yielding strength fa and elastic modulus Ea of steel sections were 235 MPa and 2.0 × 10⁵ MPa, respectively.

4.1. Calculated Results and Analysis

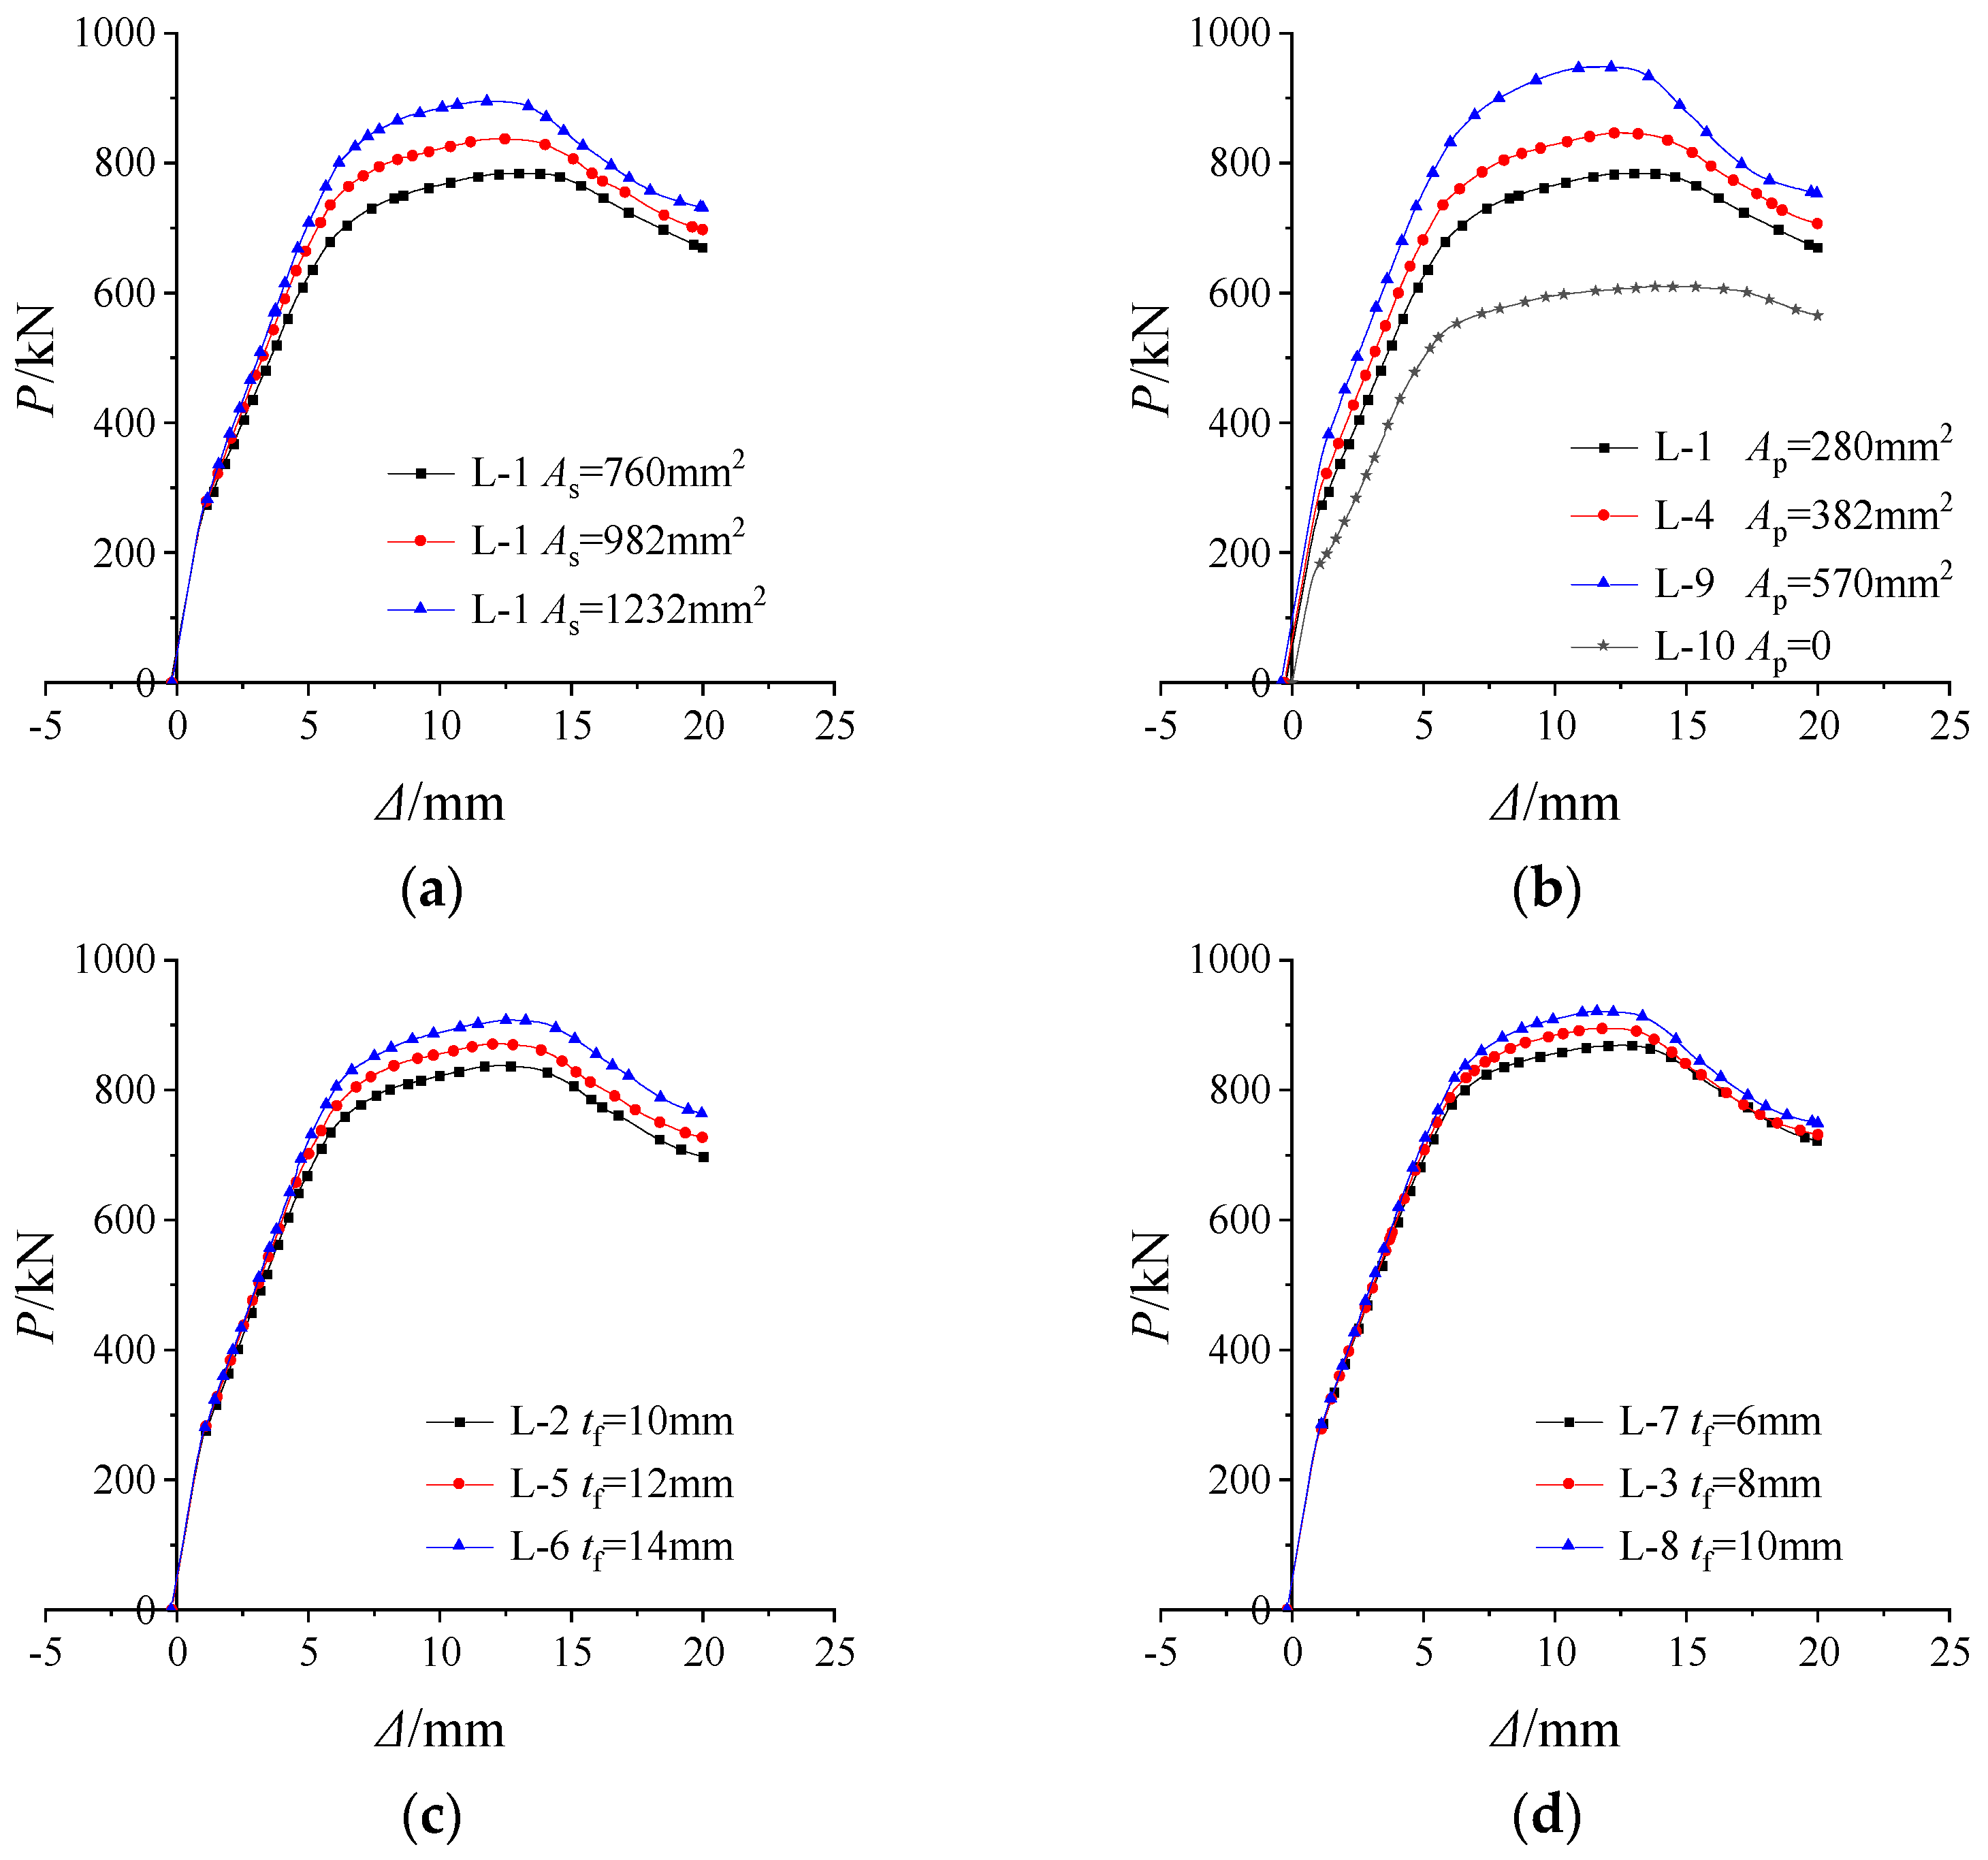
4.1.1. Load–Deflection Curves

According to the calculation of the FE models, the load–deflection curves of 10 beams shown in Figure 6 were obtained. The initial cracking load Pcr, the bottom flange yielding load Py1, the bottom bar yielding load Py2, and the ultimate load Pu are marked in the figure. The value of Pcr was determined by the occurrence of tensile damage in the specimens, while Py1 and Py2 were determined by the equivalent yield strain in the lower flange of the steel section and the tensile reinforcement, respectively. Due to the prestress applied before the vertical load, a slight anti-arching phenomenon occurred with negative deflection. The whole loading process can be roughly divided into elastic stage, elastoplastic stage, and plastic stage.
The steel section dimensions and prestressing levels of specimens L-1, L-2, and L-3 are identical, while the reinforcement ratios are 1.17%, 1.51%, and 1.90%, respectively. Compared with L-1, according to Figure 7a, the ultimate load of L-2 and L-3 increased by 5.20% and 12.05%, respectively. The bottom bar yielding load and steel section yielding load also increased with the increase in reinforcement ratio, but the cracking load did not change a lot.
The prestress level can be calculated according to Equation (11) [33]. Here, Ap, Aaf, and As are the areas of the prestressed tendon, bottom flange, and bottom bar, and fp, faf, and fy are the yield strength of the above three. Specimens L-10, L-1, L-4, and L-9 had the same steel section and reinforcement ratios but different prestress levels, which were 0, 0.35, 0.42, and 0.52, respectively. Compared with L-10, which has no prestressed tendons, according to Figure 7b, the cracking load of L-1, L-4, and L-9 increased by 48.08%, 74.64%, and 114.88%, and the ultimate load increased by 27.79%, 36.69%, and 53.73%, revealing that the addition of prestress greatly improve the cracking load and ultimate load, and it is of great significance to the durability and bearing capacity of the structure. The bottom bar yielding load and steel section yielding load also increased a lot with the increase in prestressing level.
λ = A p f p A p f p + A af f af + A s f y
Specimens L-2, L-5, and L-6 had the same reinforcement ratio and prestress level but different flange thicknesses, which were 10 mm, 12 mm, and 14 mm, respectively. Compared with L-2, according to Figure 7c, the ultimate load of L-5 and L-6 increased by 4.03% and 9.67%, respectively. The bottom bar yielding load and steel section yielding load also increased with the increase in reinforcement ratio, but the cracking load did not change a lot.
Specimens L-3, L-7, and L-8 had the same reinforcement ratio and prestress level but different in web thicknesses, which were 8 mm, 6 mm, and 10 mm, respectively. Compared with L-7, according to Figure 7d, the ultimate load of L-3 and L-8 increased by 3.26% and 6.47%, respectively. The influence of web thickness on ultimate load was not obvious, and it is not a wise decision to improve the ultimate load by increasing the web thickness in practical engineering practice. The bottom bar yielding load and steel section yielding load also increased with the increase in reinforcement ratio, but the cracking load did not change much.
The comparison reveals that the load–deflection curve is more sensitive to changes in the flange thickness of the steel section and the level of prestress, while variations in the web thickness of the steel section have a relatively weaker impact on the load–deflection curve. Additionally, it is observed that the reinforcement ratio, steel web thickness, and steel flange thickness had little effect on the initial stiffness. In contrast, an increase in prestress level effectively enhanced the initial stiffness.
In the plastic stage, the load increased gradually with mid-span displacement and decreased slowly after reaching the peak load. This behavior demonstrates that such beams exhibit good ductility and a strong capacity for inelastic deformation.

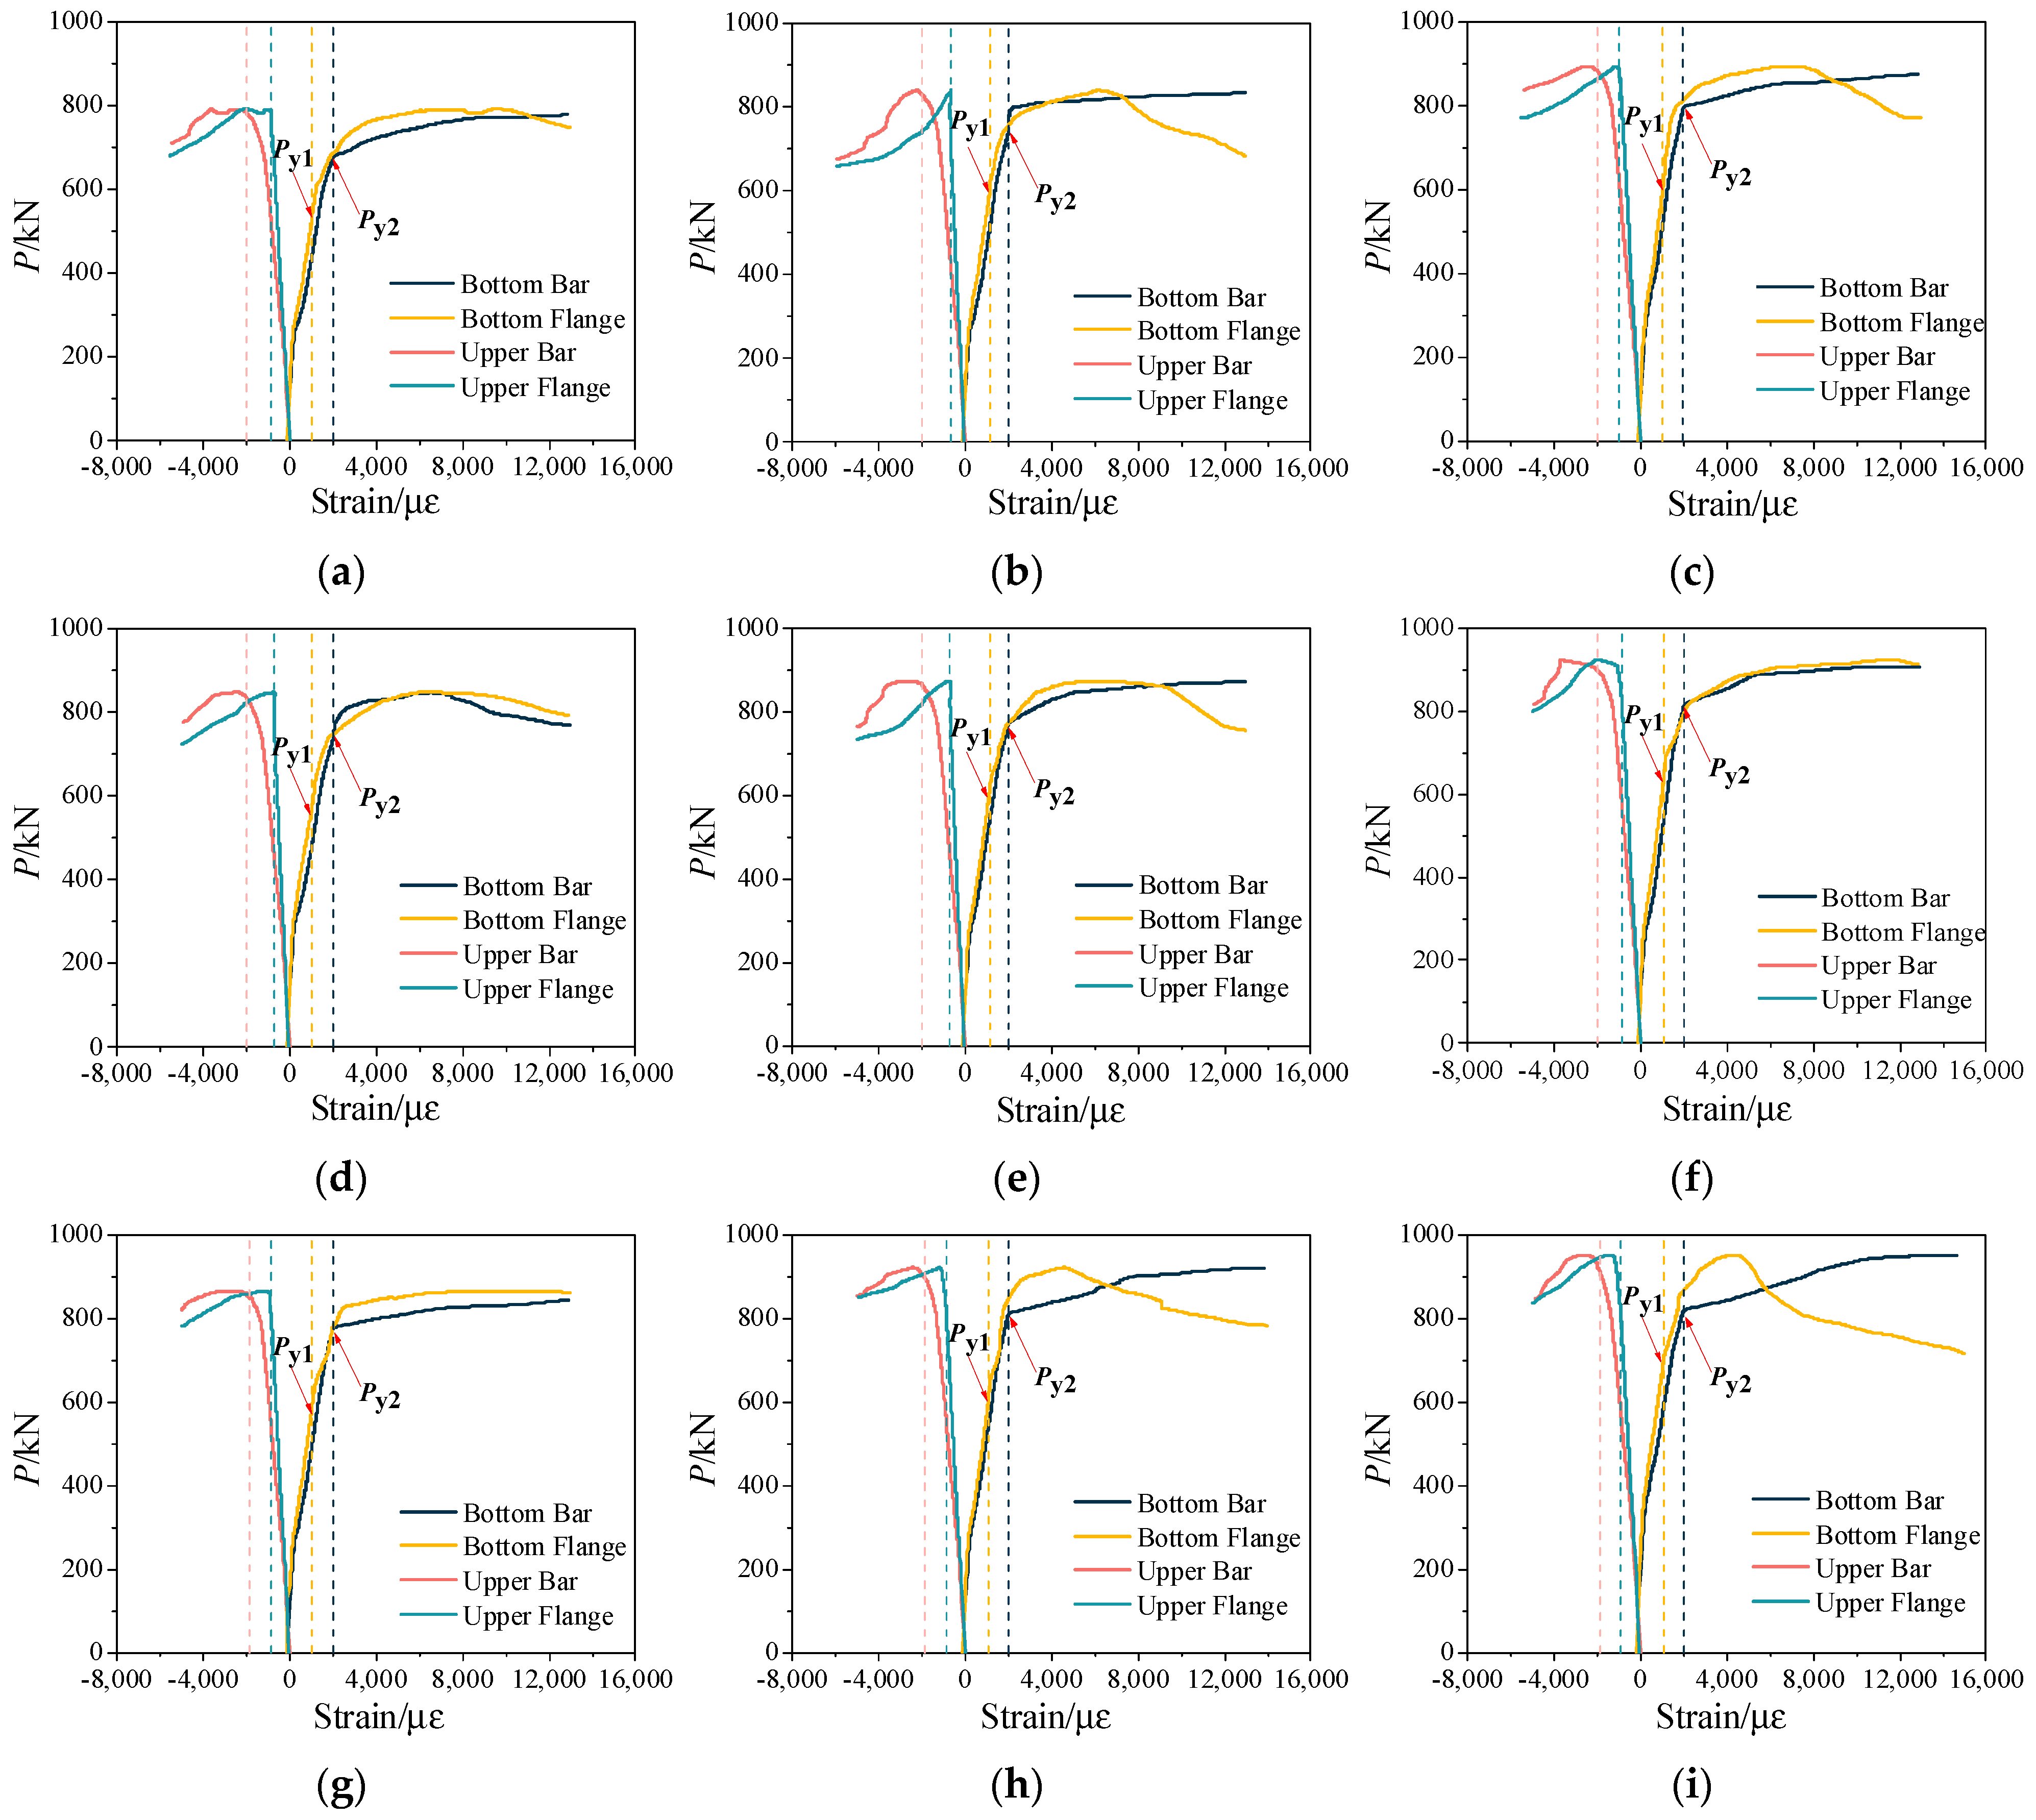
4.1.2. Load–Strain Curve

Figure 8 shows the load–strain curves of the upper bars, bottom bars, upper flanges, and bottom flanges with the yield moments marked. The curves of bottom bars and flanges rose rapidly before yielding, while a small increase in load led to a rapid increase in strain after yielding. The strain of the bottom bars had a sudden change at the moment of concrete cracking, which is due to the sudden application of the transverse tensile stress originally born by concrete to the bottom bars. The upper bars and upper flanges were subjected to compressive stress, and the curve variation trend was similar to that of the bottom bars and flanges, but the strain variable under the same load condition was smaller and the curve of the ascending section was steeper.

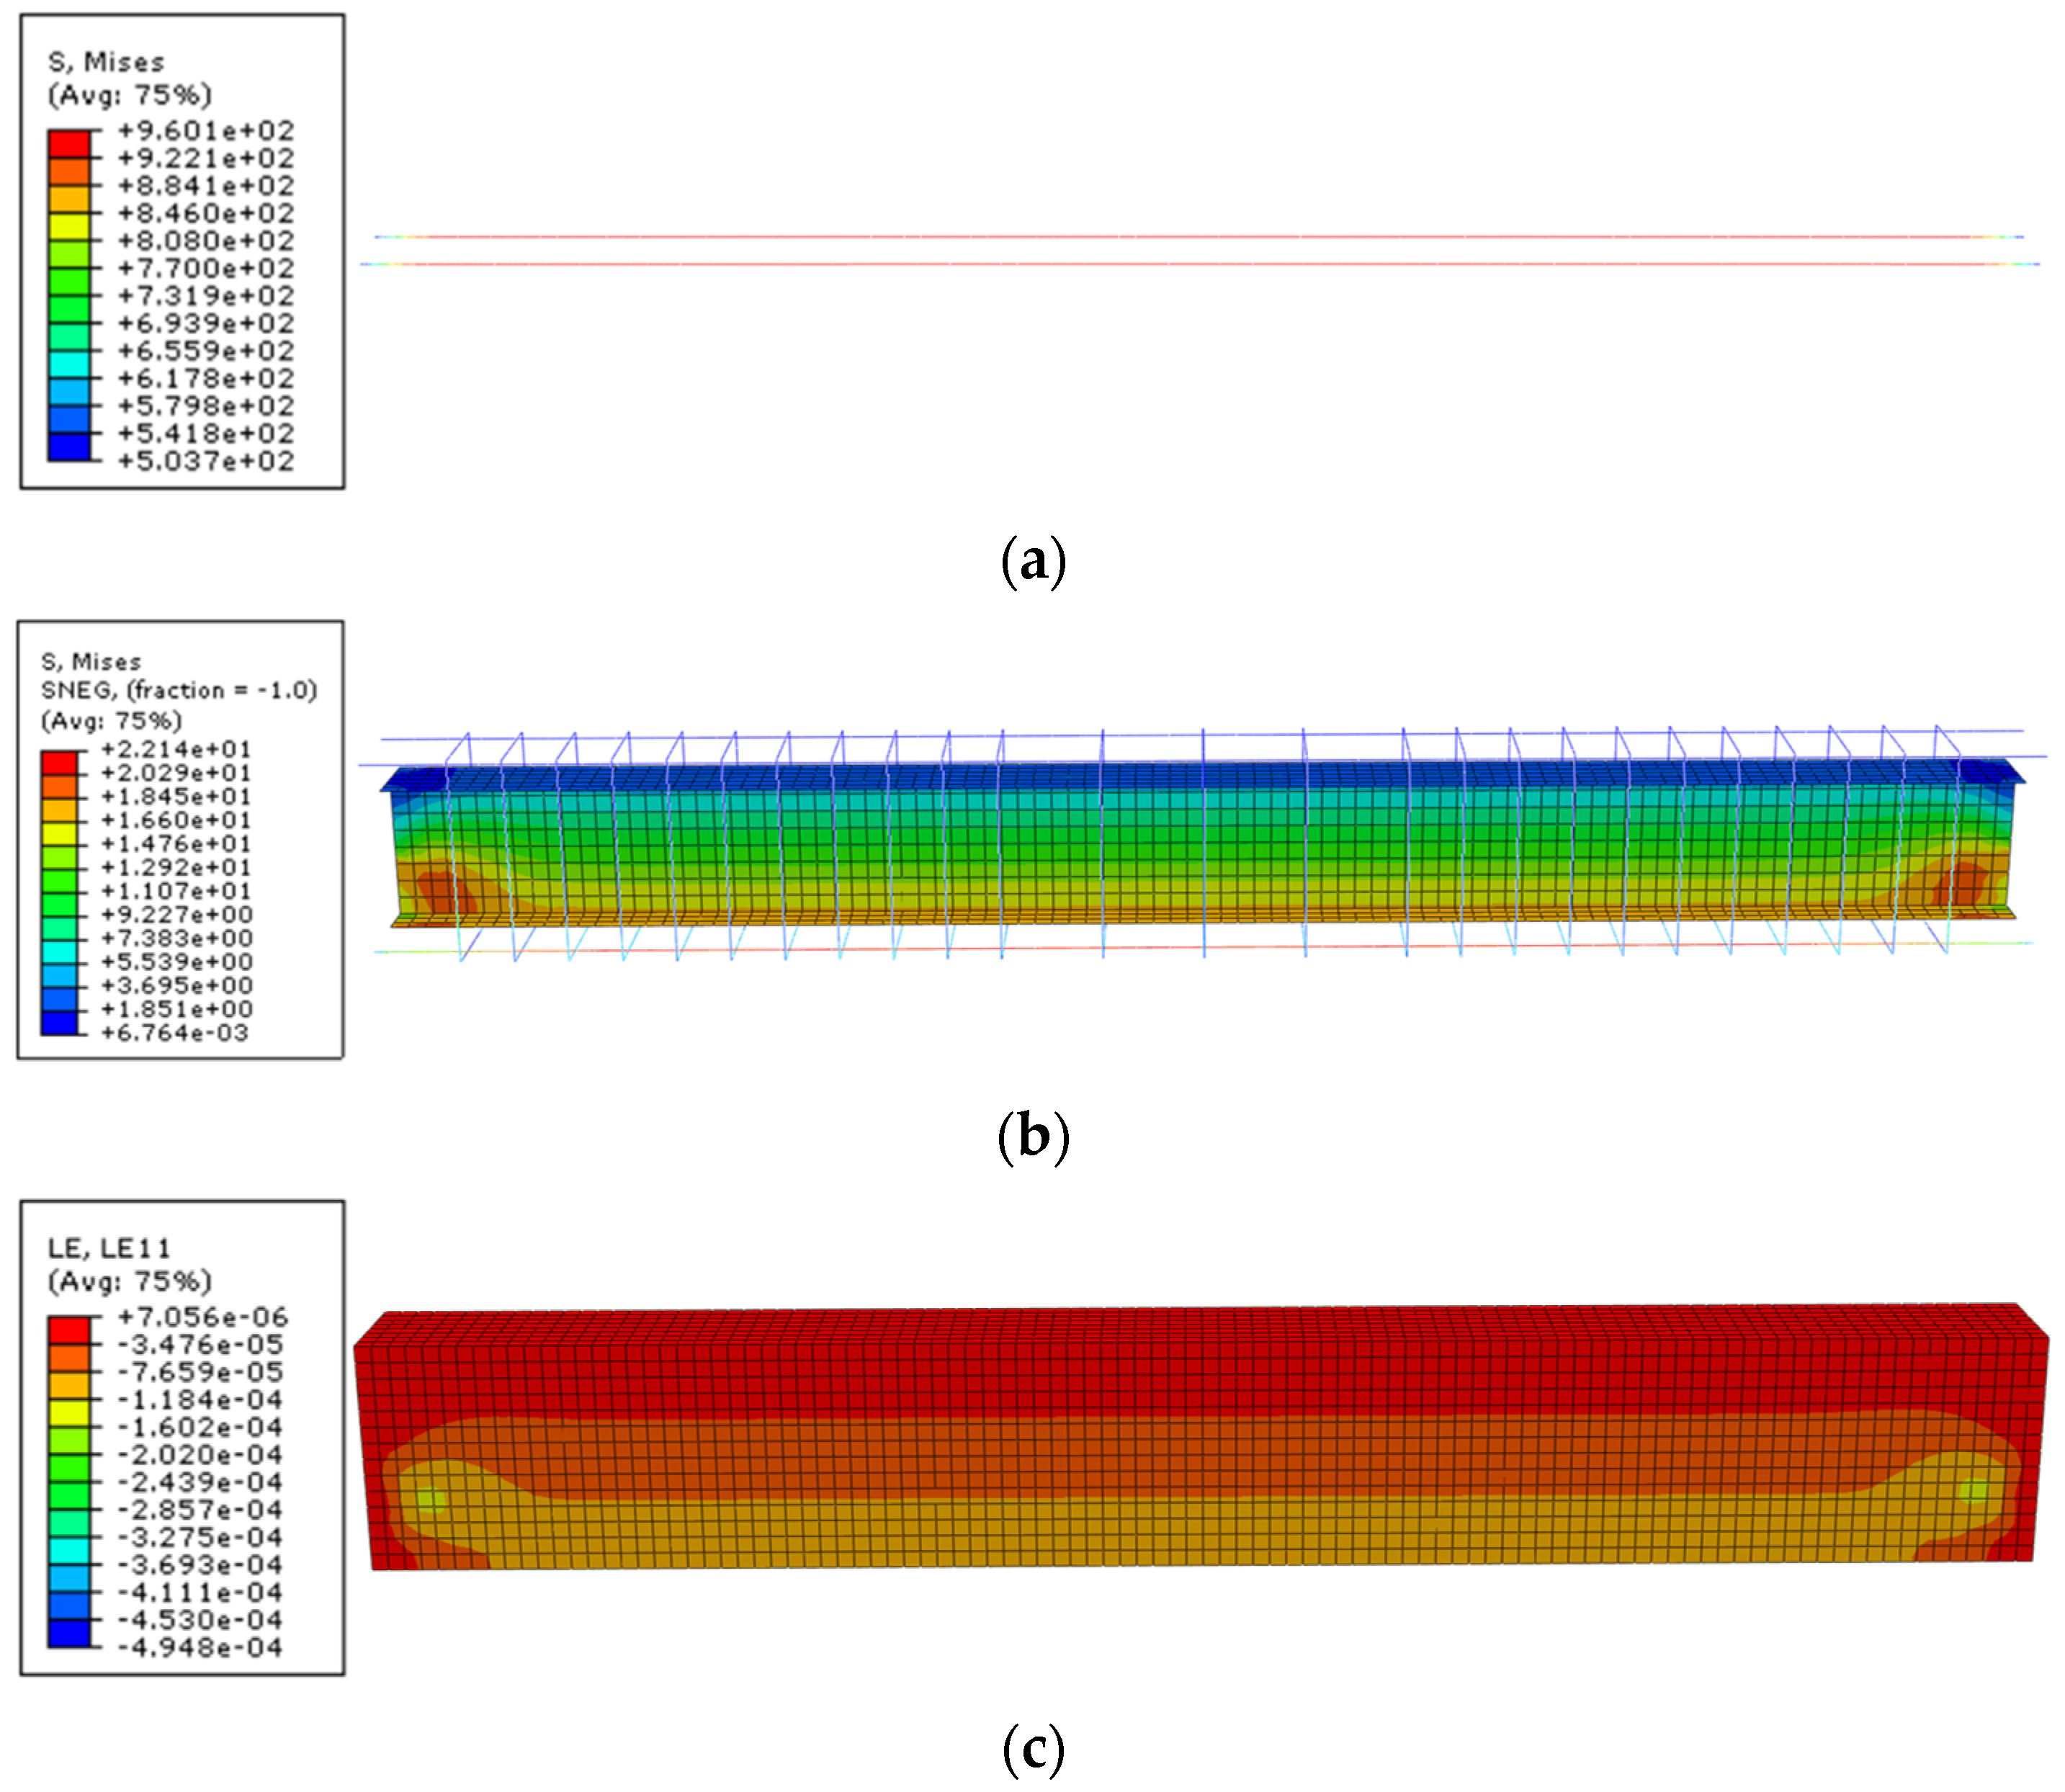
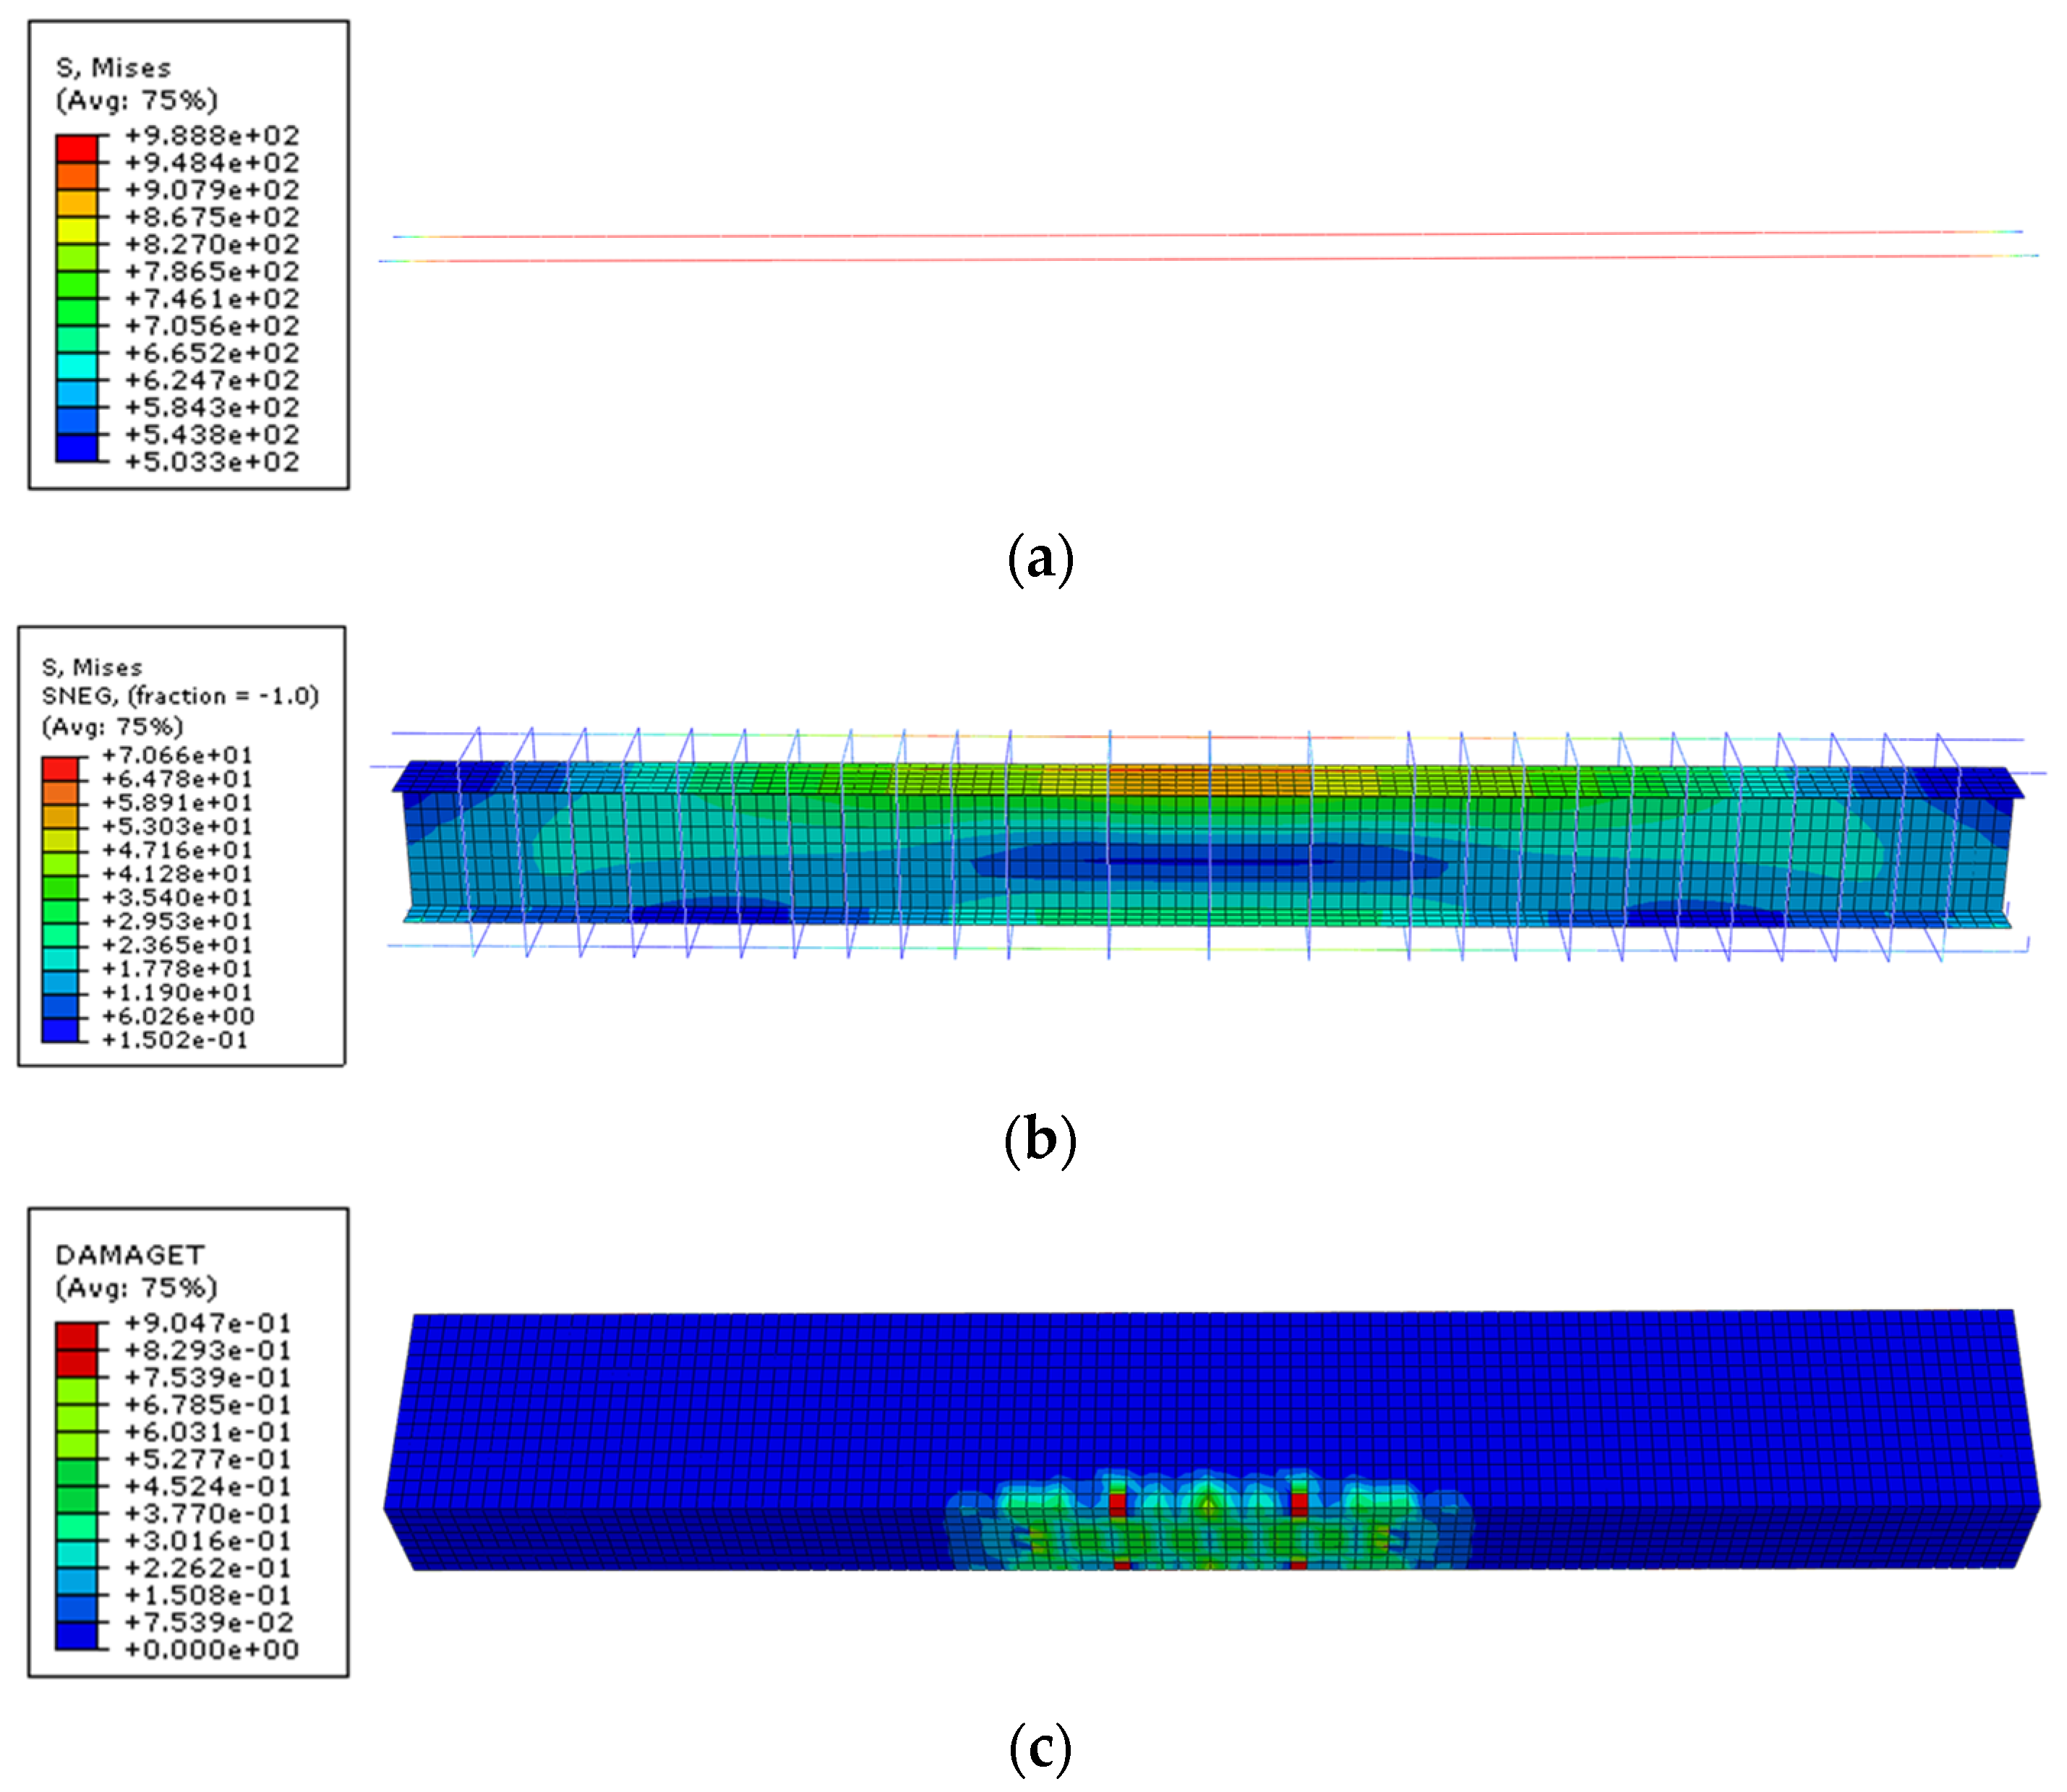
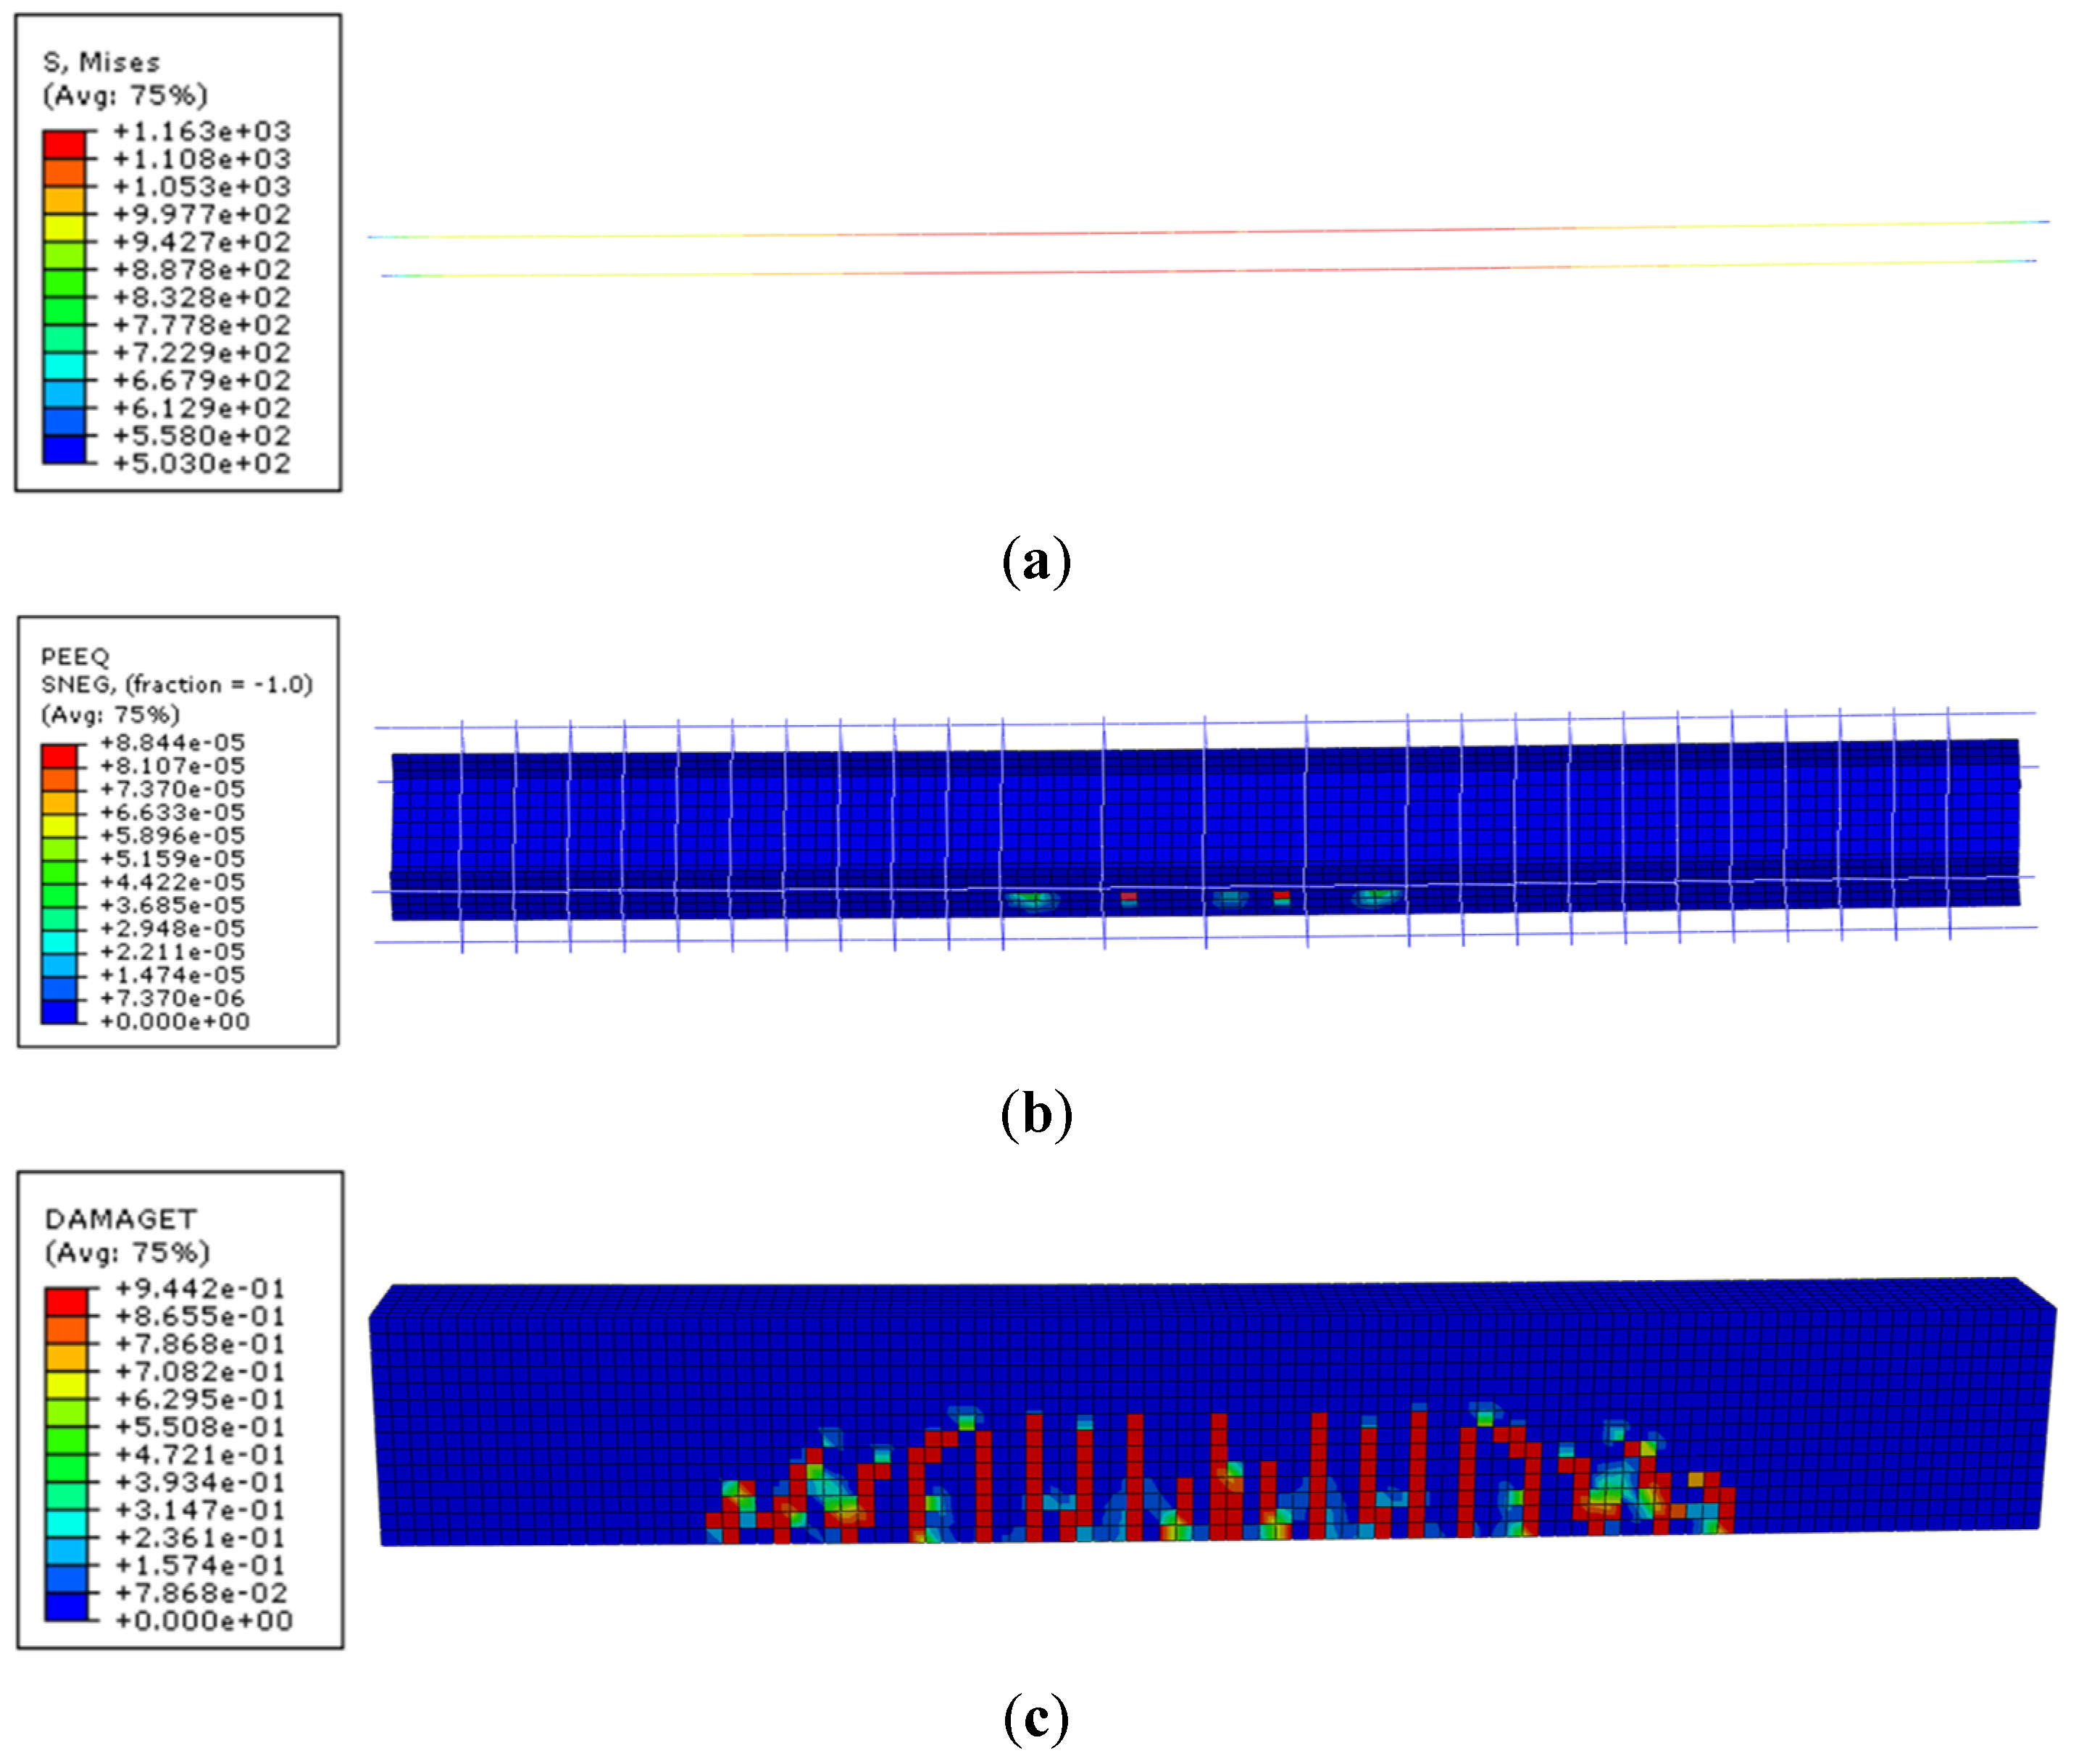
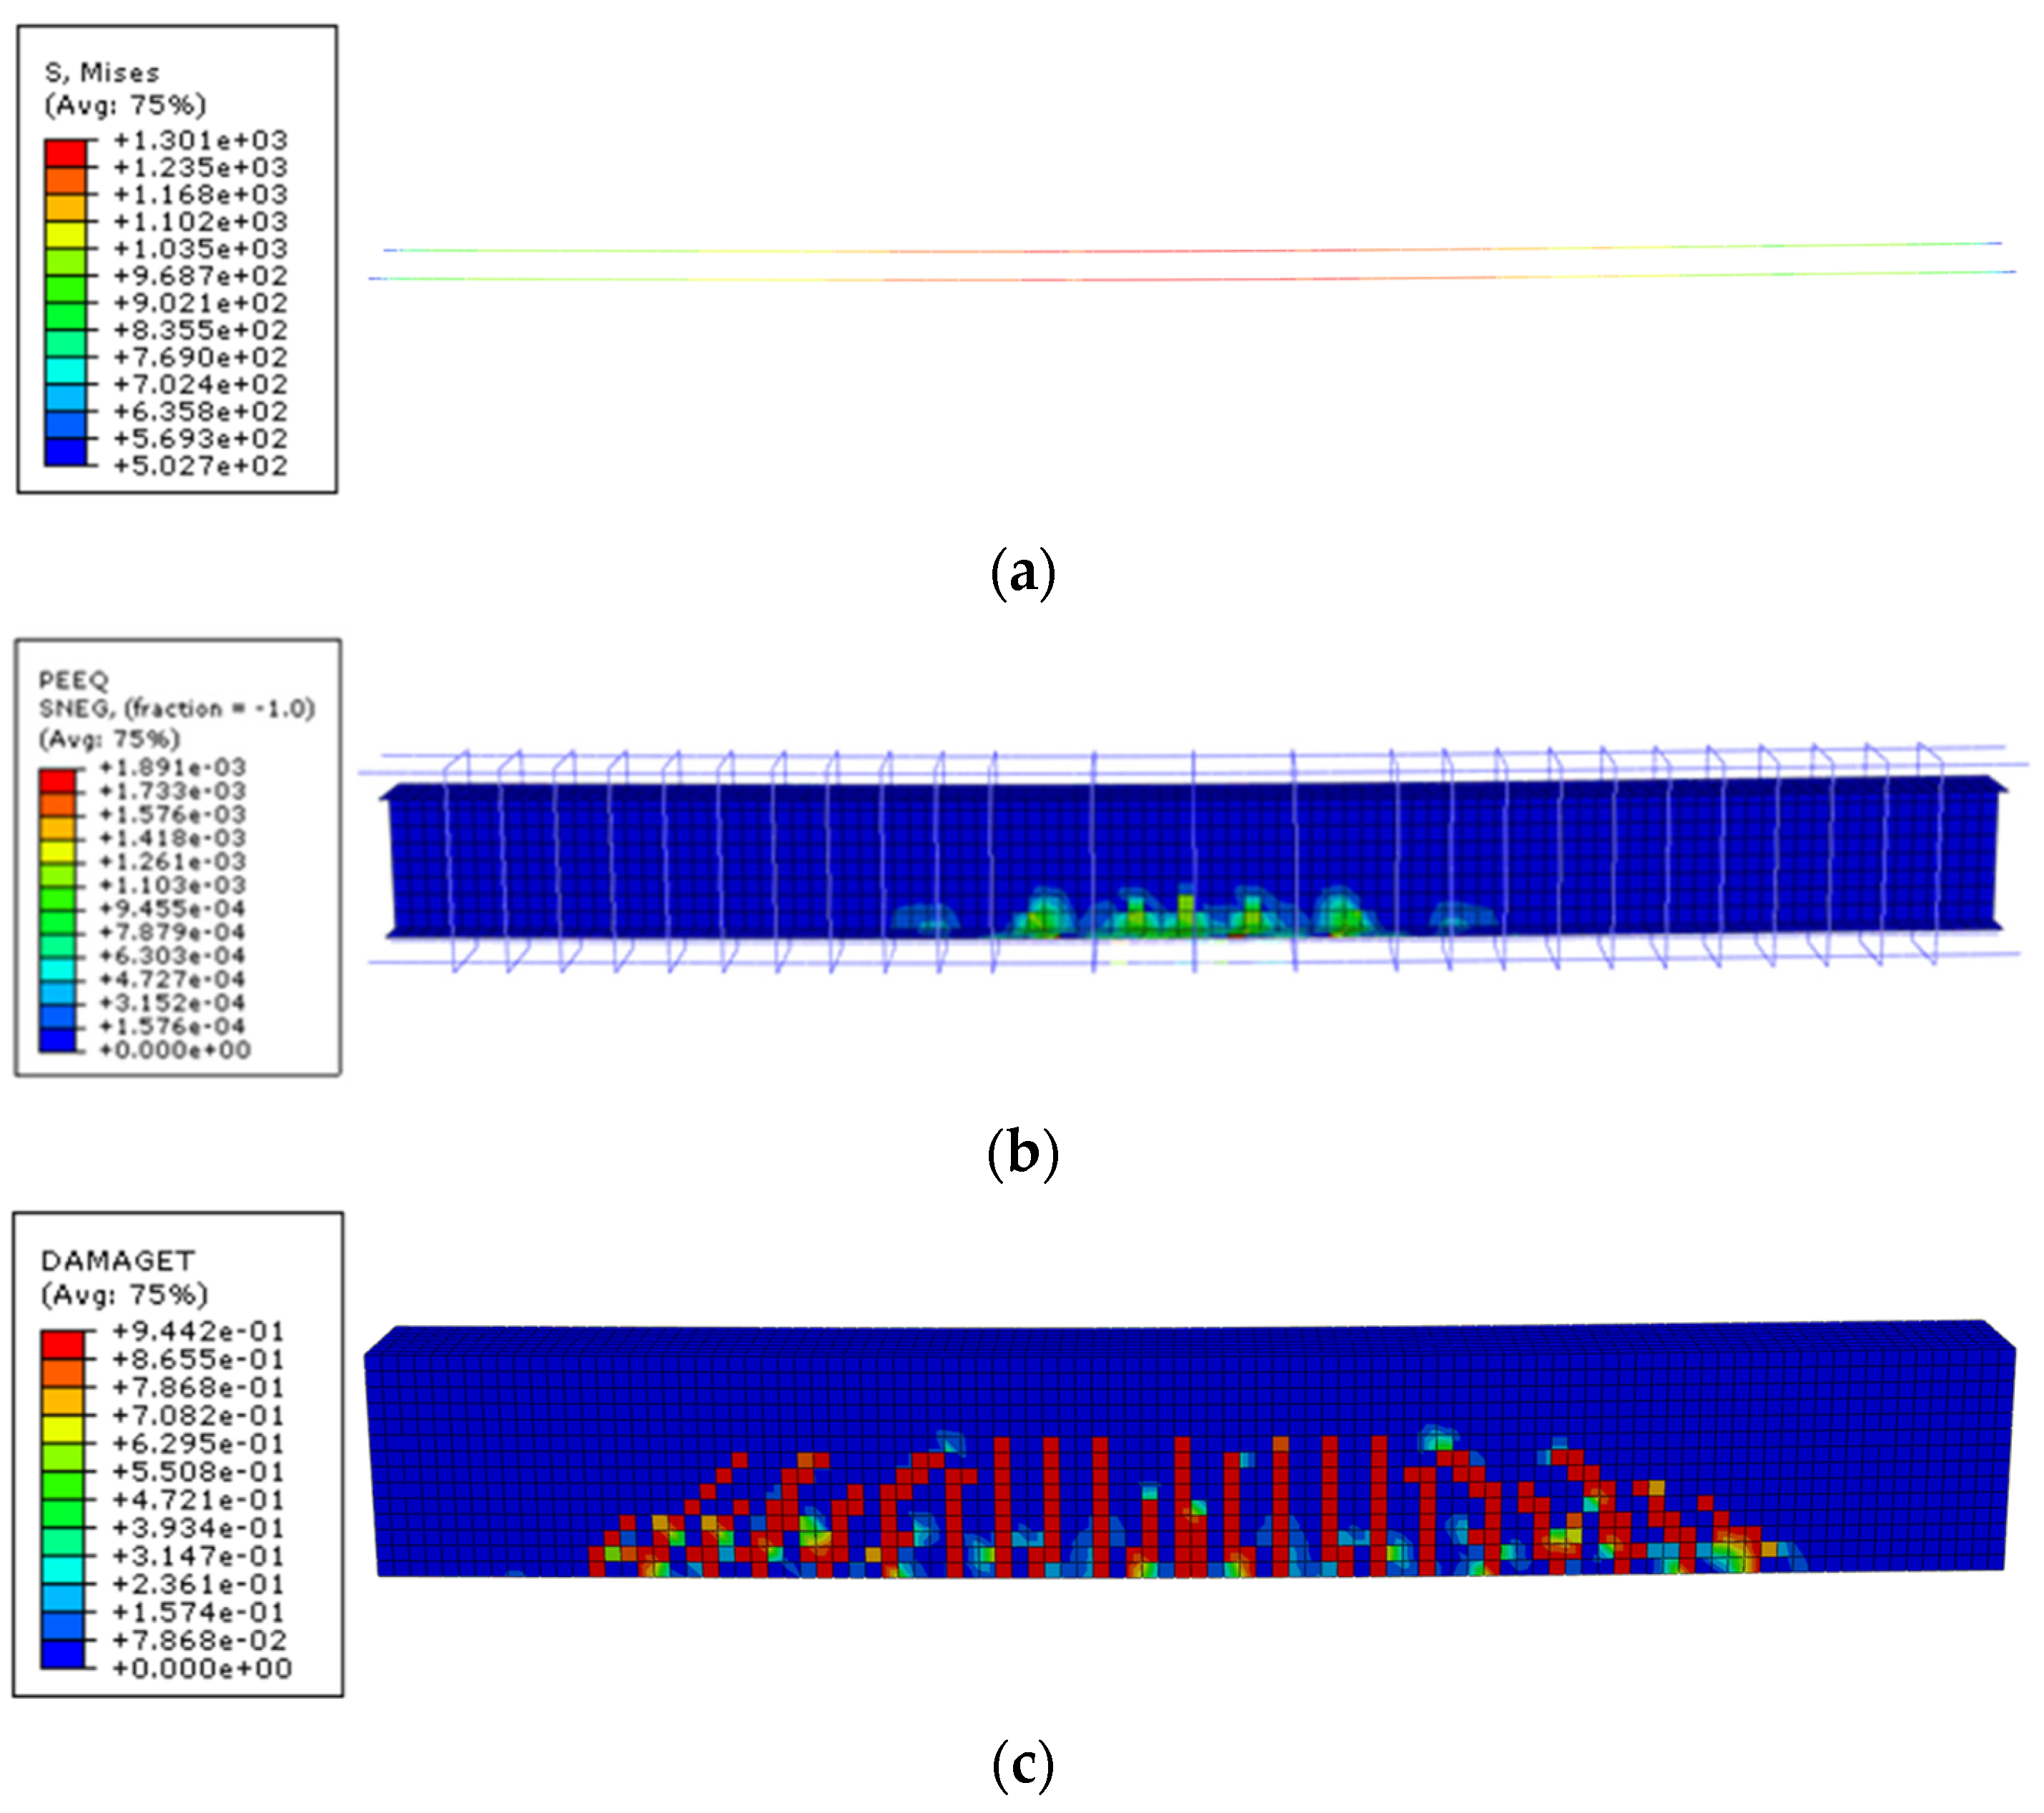
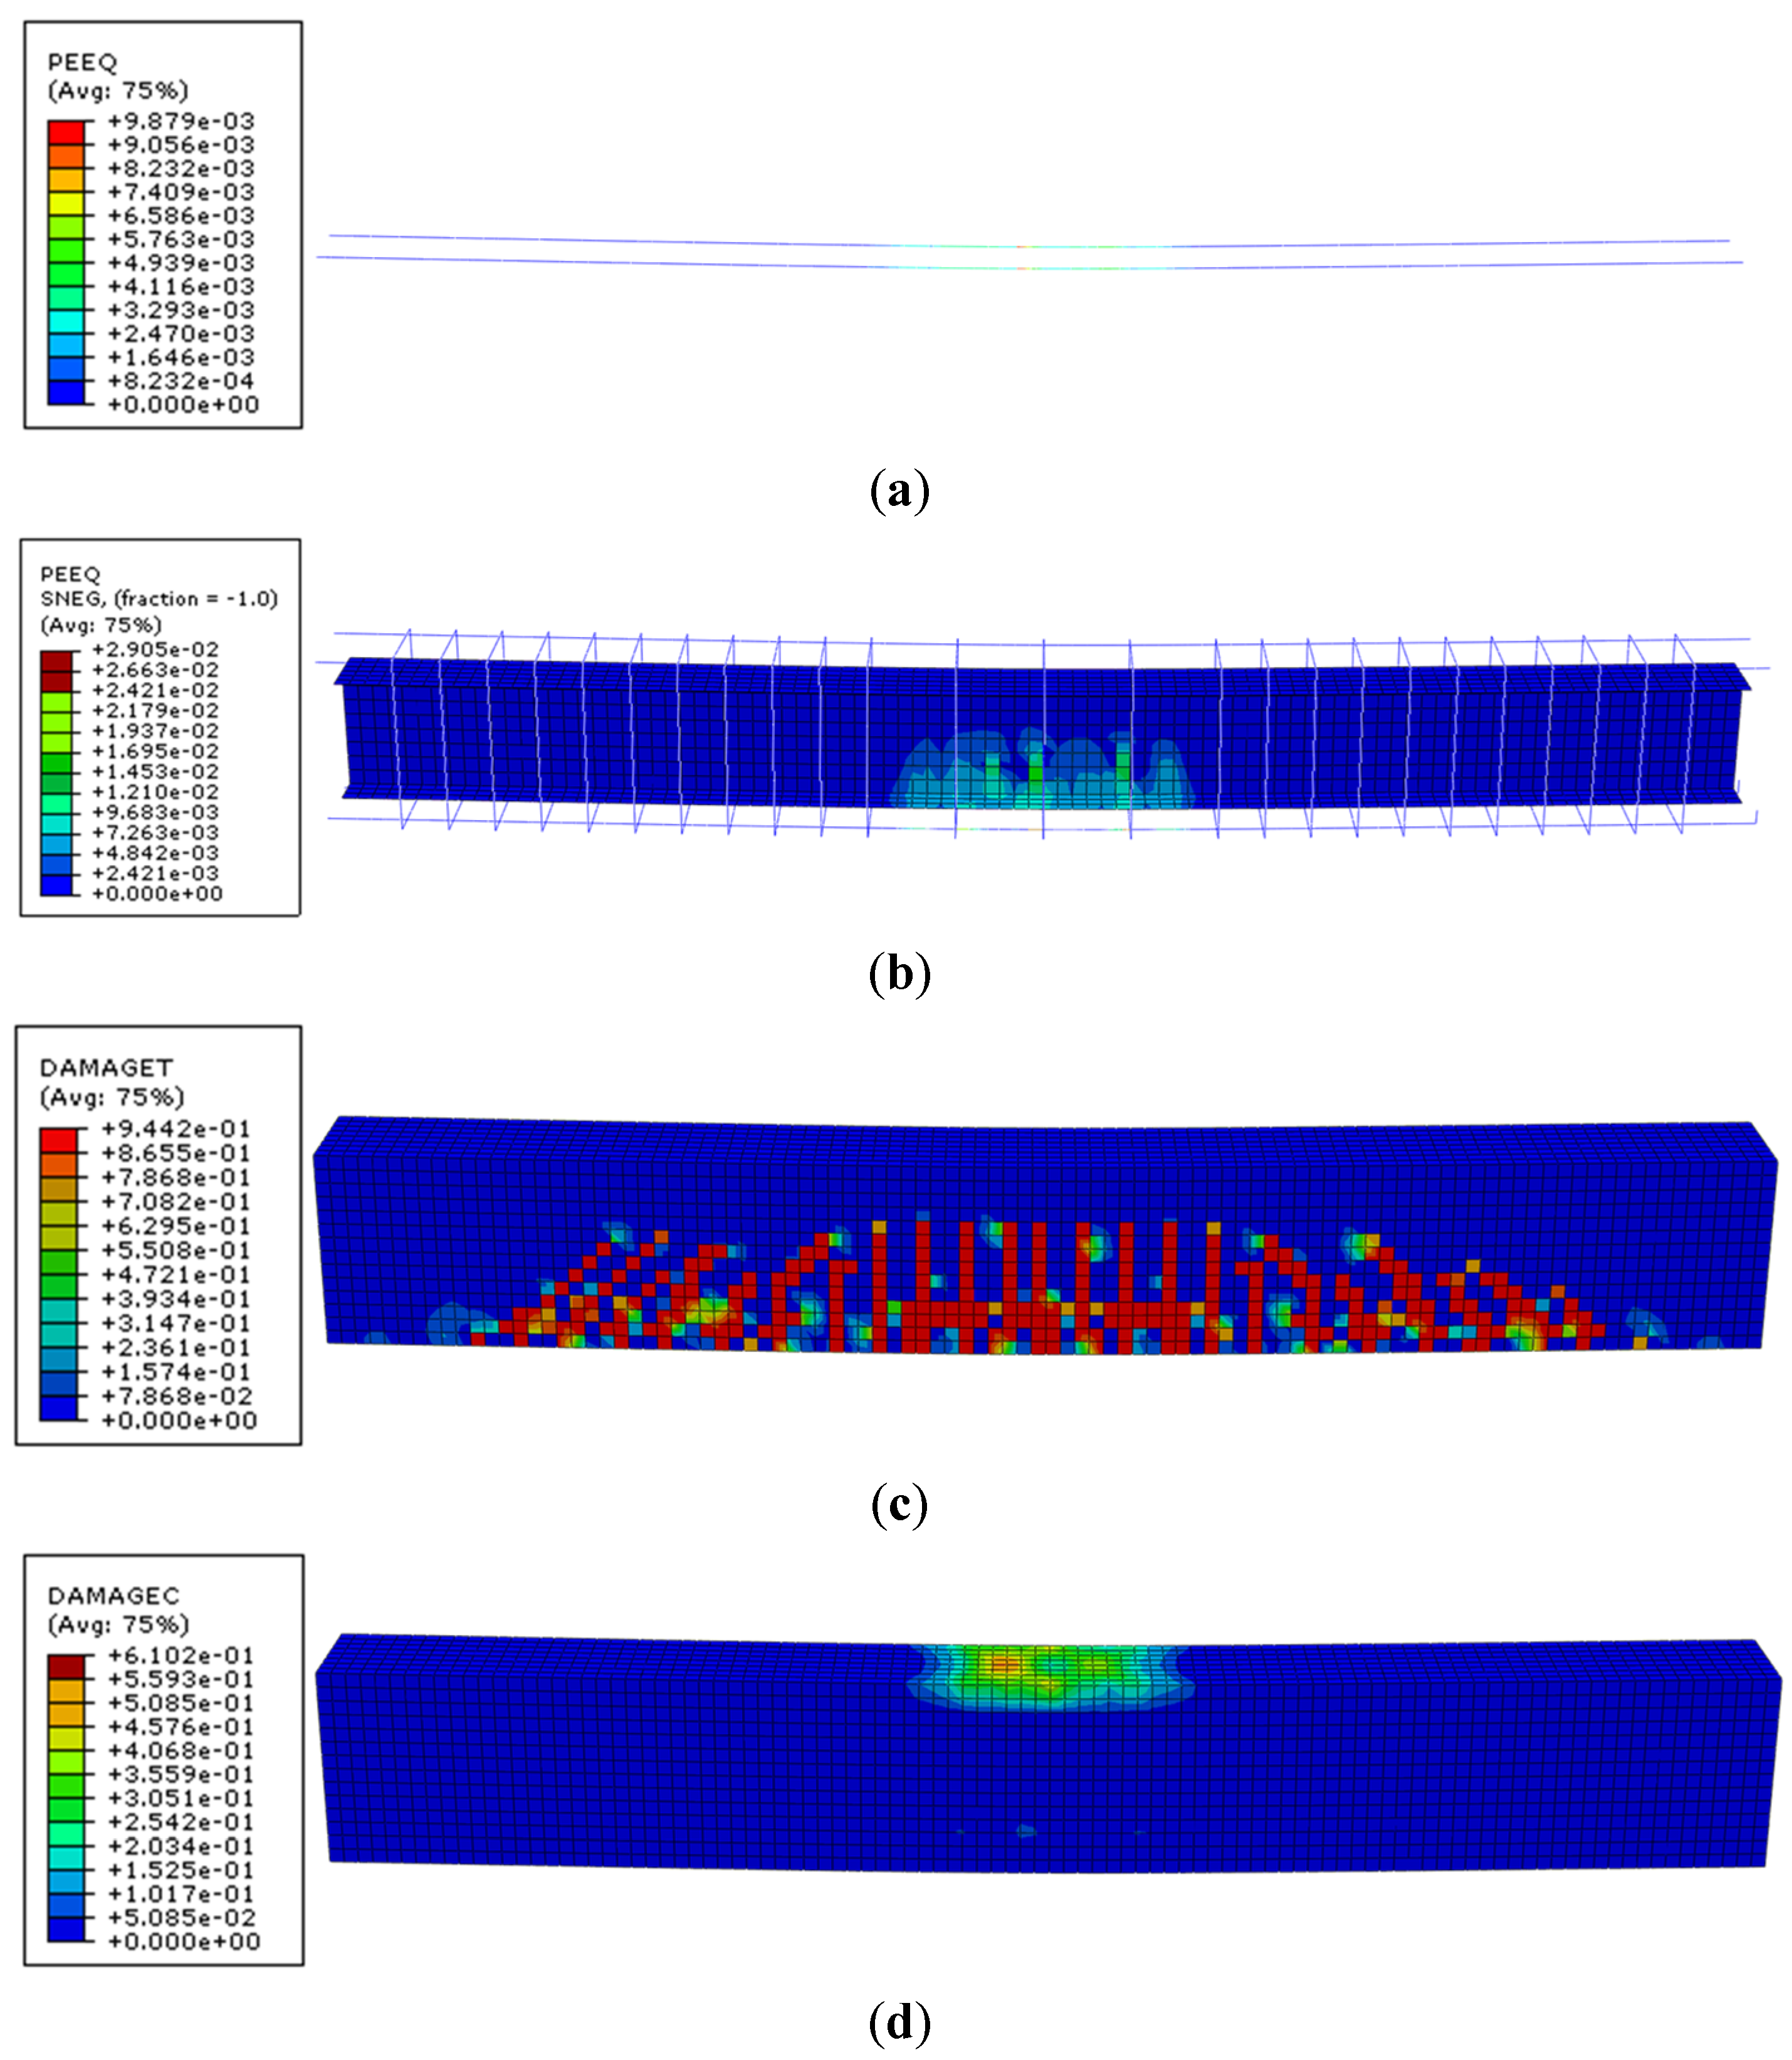
4.1.3. Analysis of the Whole Loading Process

In the FE simulations conducted in this study, all specimens exhibited a failure mode characterized by bending failure. Figure 9 shows a typical P-Δ curve of prestressed steel-reinforced UHPC beams, with initial deflection Δ in the middle span before loading, and the initial cracking of UHPC, bottom flanges yielding, bottom bars yielding, and ultimate failure one after another with the load increasing. The cracking load Pcr, the bottom flange yielding load Py1, and the bottom bar yielding load Py2 were about 0.29~39 Pu, 0.68 Pu, and 0.88 Pu, respectively. Specimen L-5 was chosen as a typical case to illustrate the entire loading process of such beams.
Application of Prestress
Figure 10a shows the stress distribution of the prestressed tendons after applying the stress and before loading. The stress reached the expected 960 N/mm2 except for small areas at both ends, slightly smaller than 1000 N/mm2. Considering the prestress loss, this value indicated that the initial prestress can be well simulated. The reinforcement cage, steel section, and UHPC were also influenced, which is reflected in Figure 10b,c. As can be seen, the stress of the steel section and the strain of UHPC were slightly larger in the area where the two ends of the prestressed tendons were located due to the concentration of stress, and the rest of the areas had extremely small stress or strain distribution.
Initial Cracking
Figure 11a shows the stress distribution of the prestressed tendons at this moment, which was similar to the state before loading except for the slight increase in number. Figure 11b gives the stress distribution of the reinforcement cage and steel section. The bottom bar, flange, and web showed tensile stress, and the upper bar, flange, and web showed compressive stress, but none of them yielded.
The distribution of cracks is reflected by the tensile damage of the concrete, and the cracks in UHPC at this moment are shown in Figure 11c. As to UHPC, cracks were regarded when the tensile strain increased to 7.5 × 10⁻⁴. When the load reached 253.65 kN, the concrete at the bottom of the pure bending segment was damaged, with the height of the concrete cracks reaching about 20 mm.
Steel Section Yielding
It can be seen from Figure 12a that the stress of the prestressed tendons in the middle span was greater than it was before the load was applied and gradually decreased towards both ends. When the load reached 603.96 kN, the bottom flange in the middle span yielded. Figure 12b shows the equivalent plastic strain of the reinforcement cage and steel section, and the bottom bars did not yield at this time. As can be found from Figure 12c, cracks developed greatly compared with those of initial cracking. A number of vertical cracks appeared evenly in the pure bending segment whose height was about 200 mm. Three diagonal cracks appeared in the shear span on both sides.
Bottom Bar Yielding
It is not difficult to see from Figure 13a that the stress in the middle span further increased, and the stress distribution was similar to the moment when the bottom flange yielded. When the load reached 766.68 kN, the bottom bars in the middle span yielded. Meanwhile, the yield range of the flange increased and developed towards the web, as is shown in Figure 13b, and part of the web yielded with the maximum height of about 70 mm. Figure 13c shows that the number of cracks in the pure bending segment did not increase but developed upwards by about 25 mm. A diagonal crack was added in the shear span on both sides, and the original diagonal crack developed upwards.
Crushing
It can be found from Figure 14a that the stress in the prestressing tendons had decreased to 987.9 MPa. This reduction occurred because the concrete had failed. As a result, the effective height of the cross-section was significantly reduced. The flexural stiffness of the section also decreased markedly. Additionally, the compression zone was damaged. The UHPC ceased to function. Consequently, the overall structure approached a plastic state, which further reduced the stress in the prestressing tendons.
It is not difficult to find from Figure 14b that the bottom bars and bottom flange in the pure bending segment completely yielded, and the yield range of the web was further expanded, up to about 65% of the web height. Compared with Figure 14b,c, the tensile failure further developed, and the crack height developed about 25 mm upward. The number of diagonal cracks in the shear span section increased and developed upward. Figure 14d shows the distribution of compression damage. It can be seen that the UHPC in the upper part of the pure bending segment was slightly crushed at this time.

5. Calculation Method for the Flexural Capacity of the Cross-Section

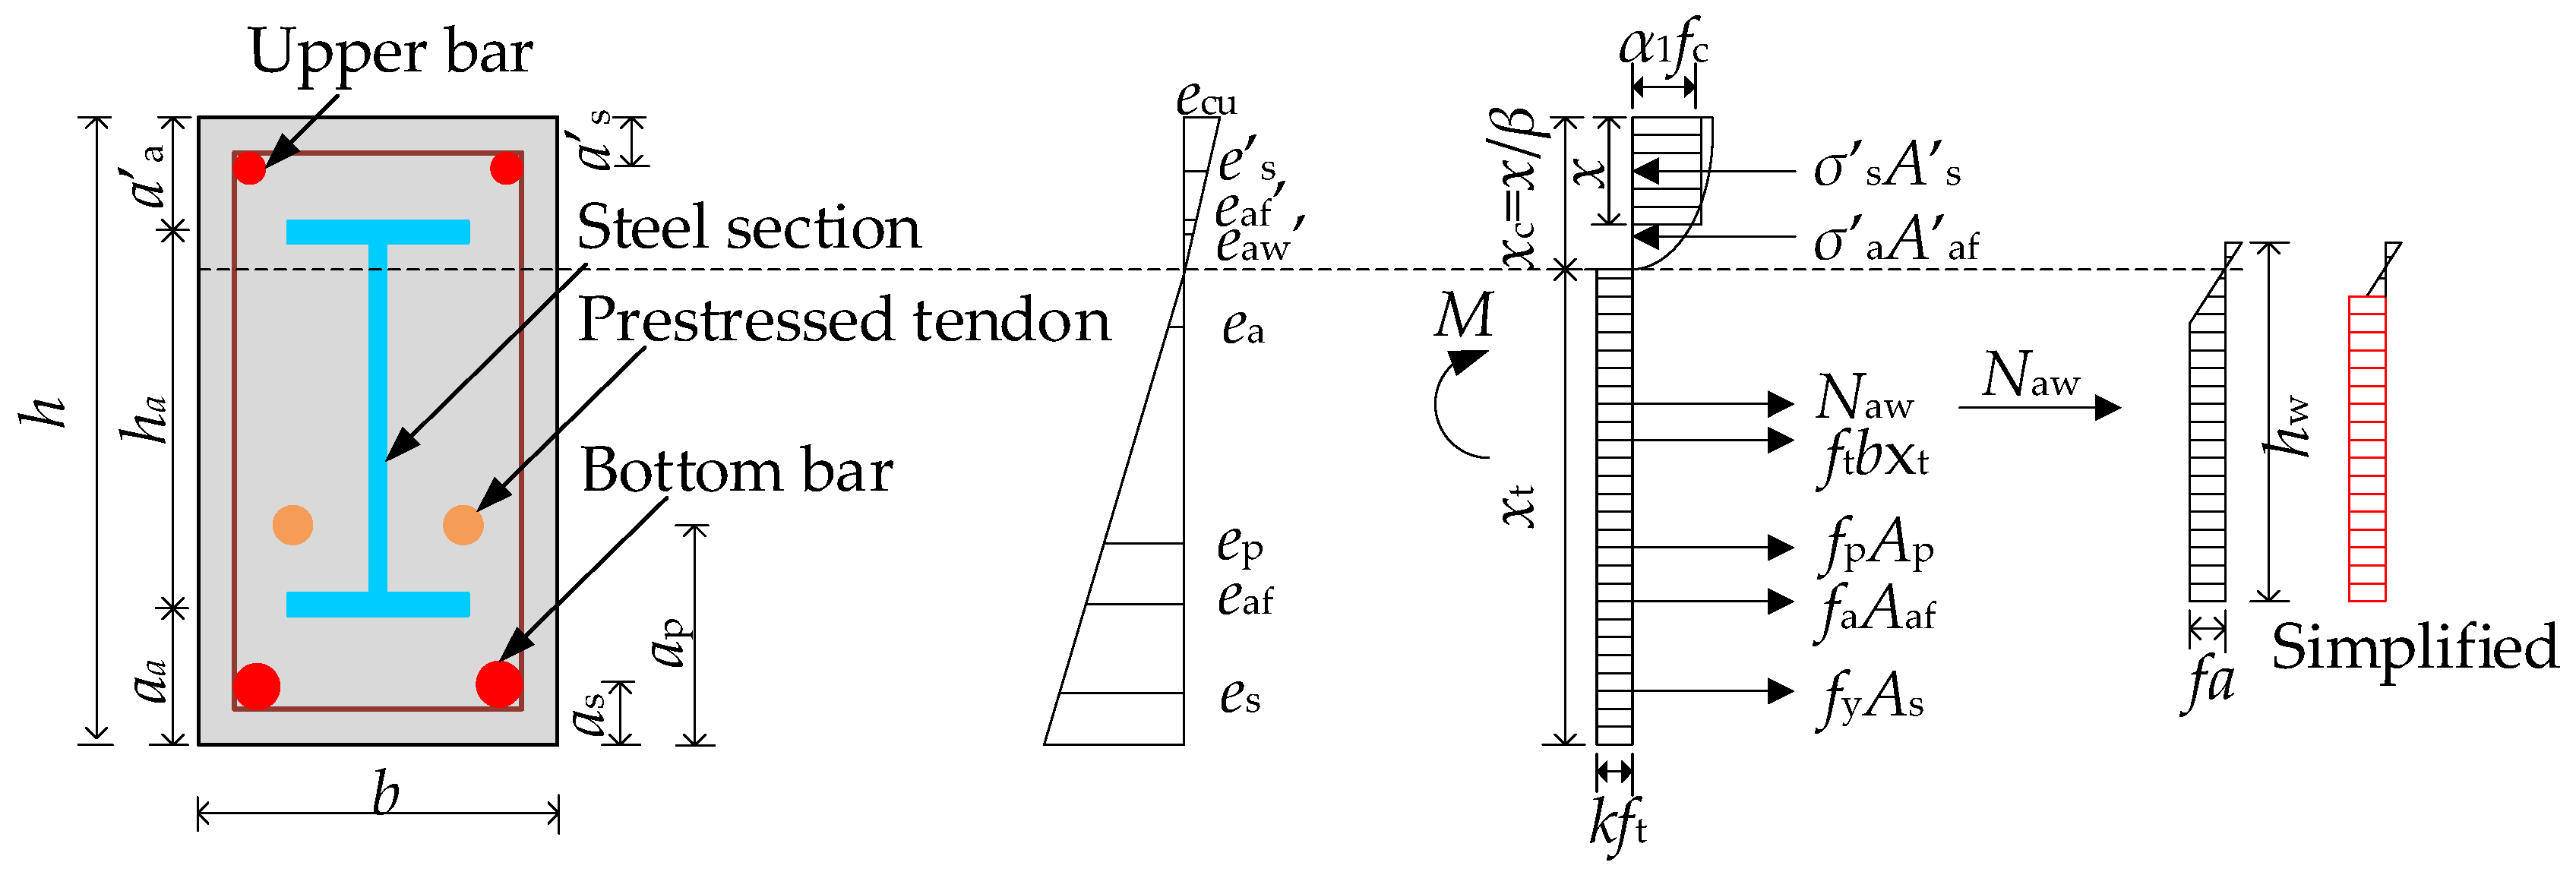
5.1. Fundamental Principles

The flexural capacity of a normal section is determined based on these conditions: (1) the plane section assumption holds; (2) there is ideal bonding between the UHPC, steel sections, reinforcement bars, and prestressed tendons; (3) the tensile strength of the UHPC is taken into account.

5.2. Calculation Method

Figure 15 shows the schematic diagram for calculating the flexural capacity of prestressed steel-reinforced UHPC beams. To enhance computational efficiency, the tensile and compressive stress distributions of UHPC were simplified into rectangular regions. In this case, stress was distributed reasonably, and the properties of each material were given full play. Based on the equilibrium of forces and bending moments, Equations (12)–(15) were obtained, where As′, As, Aaf′, Aaf, and Ap are area of upper bar, bottom bar, upper flange, bottom flange, and prestressed tendons, respectively. as′, as, aa′, aa, and ap are the distance from the center of upper bar, bottom bar, upper flange, bottom flange, and prestressed tendons to the nearest upper or bottom edge of the specimen, respectively. b and h are the width and height of the specimen. tw and tf are the thickness of the web and flange, and hw is the height of web. xt and xc are the depths of the tensile zone and compressive zone. α1 represents the ratio of the equivalent compressive strength of UHPC to its axial compressive strength, and it was set to 0.93 [34]. β and k are the equivalent coefficients for the tensile and compressive rectangular stress regions of UHPC, with values of 0.76 and 0.25, respectively [30,34].
α 1 f c bx + σ s A s + σ a A af = f y A s + f a A af + f p A p + k f t b x t + N aw
M = f y A s h a s x / β + f a A af h a a x / β + σ a A af x / β a a + M aw + f p A p h a p x / β + σ s A s ( x / β a s ) + α 1 f c bx x / β x / 2 + 0.5 kf t b x t 2
Here:
N aw = h w 2 ( x / β a a t f / 2 ) t w f a
M aw = h w 2 ( x / β a a t f / 2 ) t w f a h w / 2

5.3. Calculation Results

The different values of k will affect the calculation result, and 0.25 was provided by Zheng et al. [26]. Table 4 shows the calculated ultimate load PuFE by FE analysis and predicted ultimate loads PuP when 0.25 was taken. The mean value of PuP/PuFE was 1.000, with a mean square deviation of 0.014 and a coefficient of variation of 0.014. It can be seen that PuP was generally slightly smaller than PuFE, which was safe and suitable for engineering design.

6. Discussion

In the simulations conducted in this study, only the effects of static loading on prestressed steel-reinforced UHPC beams were considered. Long-term effects such as creep and shrinkage were not included. These factors have a significant impact on the long-term performance of prestressed beams. They are particularly important for deflection, load-bearing capacity, and overall structural integrity. Although UHPC offers high strength and durability, these long-term effects must be fully addressed during the design process. This ensures the stability and long-term usability of the beams.
Additionally, a comparison of cost-effectiveness and durability was made between prestressed steel-reinforced UHPC beams and traditional reinforced concrete beams. Prestressed steel-reinforced UHPC beams involve the use of UHPC, steel sections, and prestressing technology. As a result, their initial costs are higher. However, they provide significant advantages in durability and long-term maintenance. UHPC exhibits excellent performance, especially in harsh environments. This reduces repair and maintenance needs and offsets the high initial costs. Thus, it is particularly suitable for projects requiring a long service life. In contrast, traditional reinforced concrete beams have lower initial costs. However, their durability is poor, making them prone to corrosion and cracking. As a result, they may have higher long-term maintenance costs.
Finally, this study is based on experimental data from existing literature. A finite element model was developed and validated for further nonlinear parametric analysis. The results are reliable to a certain extent. However, additional experimental studies are needed to confirm these findings.

7. Conclusions

After validating the reliability of the FE model for prestressed steel-reinforced concrete beams, an FE model for prestressed steel-reinforced UHPC beams was developed. Comprehensive flexural capacity analysis was performed, leading to the following conclusions:
(1)
The developed FE models accurately simulate the flexural behavior and ultimate bearing capacity of prestressed concrete beams, as confirmed by comparisons with experimental results. The average ratio of predicted to experimentally measured ultimate load Pu was 1.000, with a mean square deviation of 0.014 and a coefficient of variation of 0.014, indicating the high reliability of the FE models in predicting structural responses.
(2)
The flexural performance of prestressed steel-reinforced UHPC beams is significantly influenced by design parameters such as reinforcement ratio, prestressing level, web thickness, and flange thickness. When the reinforcement ratio increased from 1.17% to 1.90%, the ultimate load increased by 12.05%, while increasing the prestress level from 0.61 to 0.76 resulted in a 53.73% increase in ultimate load. Similarly, the flange thickness variations led to an increase in ultimate load of up to 9.67%, demonstrating that prestress and geometric parameters play a vital role in optimizing flexural capacity.
(3)
Prestressed steel-reinforced UHPC beams exhibit high stiffness, excellent ductility, and significant resistance to cracking. The addition of prestress increased the initial cracking load by 114.88% compared to non-prestressed beams, indicating substantial enhancement in the early-stage stiffness and durability. The beams maintained high load-bearing capacity in the plastic stage, achieving a maximum ultimate load of 967.98 kN, with good ductility and strong inelastic deformation capacity.
(4)
A predictive formula for the flexural capacity of prestressed steel-reinforced UHPC beams is proposed, with the tensile strength equivalent coefficient k recommended as 0.25. The calculated results show strong agreement with the FE simulations, with an average deviation of less than 3% between the predicted and simulated ultimate loads, indicating that the derived formulas are reliable for practical engineering applications.

Author Contributions

Conceptualization, Y.Z. (Ye Zhu); data curation, Y.Z. (Ye Zhu); funding acquisition, K.W.; investigation, T.S.; methodology, T.S.; software, T.S. and Z.Z.; validation, Z.Z.; visualization, K.W.; writing—original draft, Z.Z.; writing—review and editing, Y.Z. (Yanzhu Zhu). All authors have read and agreed to the published version of the manuscript.

Funding

The authors gratefully acknowledge the support provided by the National Natural Science Foundation of China (51878589), Yangzhou University graduate research and practice innovation program (KYCX23-3541), the Science and Technology Planning Project of Yangzhou City (YZ2024223), and the Open Fund of Key Lab of Structures Dynamic Behavior and Control of the Ministry of Education by the Harbin Institute of Technology (HITCE202105).

Data Availability Statement

The original contributions presented in this study are included in the article. Further inquiries can be directed to the corresponding authors.

Conflicts of Interest

Author Tianyu Shi was employed by the company The Third Engineering Co., Ltd. of CCCC Fourth Harbor Engineering Co., Ltd. The remaining authors declare that the research was conducted in the absence of any commercial or financial relationships that could be construed as a potential conflict of interest.

References

  1. Carmo, R.N.F.; Júlio, E. New trends for reinforced concrete structures: Some results of exploratory studies. Infrastructures 2017, 2, 17. [Google Scholar] [CrossRef]
  2. Reddy, C.D.; Rajkumar, R.; Umamaheswari, N. Behavior of composite rectangular RC beams encased with steel I-section under flexure. AIP Conf. Proc. 2022, 2460, 020017. [Google Scholar]
  3. Tuma, N.H.; Aziz, M.R. Flexural performance of composite ultra-high-performance concrete-encased steel hollow beams. Civ. Eng. J. 2019, 5, 1289–1304. [Google Scholar] [CrossRef]
  4. Musha, H.; Ohkuma, H.; Kitamura, T. Innovative UFC structures in Japan. In Proceedings of the International Symposium on Ultra-High Performance Fibre-Reinforced Concrete, Marseille, France, 1–3 October 2013; pp. 17–26. [Google Scholar]
  5. Yoo, D.Y.; Yoon, Y.S. A review on structural behavior, design, and application of ultra-high-performance fiber-reinforced concrete. Int. J. Concr. Struct. Mater. 2016, 10, 125–142. [Google Scholar] [CrossRef]
  6. Fayed, S.; Madenci, E.; Özkiliç, Y.O.; Basha, A. The flexural behaviour of multi-layered steel fiber reinforced or ultra-high performance-normal concrete composite ground slabs. J. Build. Eng. 2024, 95, 109901. [Google Scholar] [CrossRef]
  7. Lakavath, C.; Prakash, S.S.; Dirar, S. Experimental and numerical studies on shear behaviour of macro-synthetic fibre reinforced prestressed concrete beams. Constr. Build. Mater. 2021, 291, 123313. [Google Scholar] [CrossRef]
  8. Kueres, S.; Will, N.; Hegger, J. Shear strength of prestressed FRP reinforced concrete beams with shear reinforcement. Eng. Struct. 2020, 206, 110088. [Google Scholar] [CrossRef]
  9. Hou, W.; Lin, G.; Chen, B.; Guo, Z. Cyclic behavior and analysis of steel plate reinforced concrete coupling beams with a span-to-depth ratio of 2.5. Soil Dyn. Earthq. Eng. 2021, 148, 106817. [Google Scholar] [CrossRef]
  10. Xu, C.; Cao, P.Z.; Wu, K.; Lin, S.-Q.; Yang, D.G. Experimental investigation of the behavior composite steel-concrete composite beams containing different amounts of steel fibres and conventional reinforcement. Constr. Build. Mater. 2019, 202, 23–36. [Google Scholar] [CrossRef]
  11. Chen, C.; Lin, K.; Chen, Y. Behavior and shear strength of steel shape reinforced concrete deep beams. Eng. Struct. 2018, 175, 425–435. [Google Scholar] [CrossRef]
  12. Weng, C.; Yen, S.; Jiang, M. Experimental Study on Shear Splitting Failure of Full-Scale Composite Concrete Encased Steel Beams. J. Struct. Eng. 2002, 128, 1186–1194. [Google Scholar] [CrossRef]
  13. Yao, D.; Jia, J.; Wu, F.; Yu, F. Shear performance of prestressed ultra high strength concrete encased steel beams. Constr. Build. Mater. 2014, 52, 194–201. [Google Scholar] [CrossRef]
  14. Yang, I.H.; Joh, C.; Kim, B.S. Structural behavior of ultra high performance concrete beams subjected to bending. Eng. Struct. 2010, 32, 3478–3487. [Google Scholar] [CrossRef]
  15. Singh, M.; Sheikh, A.H.; Ali, M.M.; Visintin, P.; Griffith, M.C. Experimental and numerical study of the flexural behaviour of ultra-high performance fibre reinforced concrete beams. Constr. Build. Mater. 2017, 138, 12–25. [Google Scholar] [CrossRef]
  16. Wang, J.Y.; Gu, J.B.; Liu, C.; Huang, Y.H.; Xiao, R.C.; Ma, B. Flexural behavior of ultra high performance concrete beams reinforced with high strength steel. Struct. Eng. Mech. Int’l J. 2022, 81, 539–550. [Google Scholar]
  17. Dong, S.; Zhou, D.; Ashour, A.; Han, B.; Ou, J. Flexural toughness and calculation model of super-fine stainless wire reinforced reactive powder concrete. Cem. Concr. Compos. 2019, 104, 103367. [Google Scholar] [CrossRef]
  18. Yoo, D.; Yoon, Y. Structural performance of ultra-high-performance concrete beams with different steel fibers. Eng. Struct. 2015, 102, 409–423. [Google Scholar] [CrossRef]
  19. Cho, J.S.; Lundy, J.; Chao, S.H. Shear strength of steel fiber reinforced prestressed concrete beams. In Proceedings of the Structures Congress 2009, Don’t Mess with Structural Engineers: Expanding Our Role, Austin, TX, USA, 30 April–2 May 2009; pp. 1–9. [Google Scholar]
  20. Fu, C.; Li, Y.; Liang, S. Experimental study on flexural behavior of prestressed steel reinforced concrete simply supported beams. J. Build. Struct. 2007, 28, 62–73. (In Chinese) [Google Scholar]
  21. Fang, Z.; Tian, X.; Peng, F. Flexural strength of prestressed Ultra-High-Performance concrete beams. Eng. Struct. 2023, 279, 115612. [Google Scholar] [CrossRef]
  22. Zhan, Y.; Zhao, R.; Ma, Z.J.; Xu, T.; Song, R. Behavior of prestressed concrete-filled steel tube (CFST) beam. Eng. Struct. 2016, 122, 144–155. [Google Scholar] [CrossRef]
  23. Li, S.; Chen, W.; Zhang, Y. Flexural behavior of precast, prestressed, lightweight aggregate concrete-conventional concrete composite beams. Constr. Build. Mater. 2021, 274, 121926. [Google Scholar] [CrossRef]
  24. Li, S.; Zhang, Y.; Chen, W. Bending performance of unbonded prestressed basalt fiber recycled concrete beams. Eng. Struct. 2020, 221, 110937. [Google Scholar] [CrossRef]
  25. Guo, Z. Strength and Deformation of Concrete-Experimental Basis and Constitutive Relation; Tsinghua University Publishing House: Beijing, China, 1997. (In Chinese) [Google Scholar]
  26. Zheng, W.; Li, L.; Lu, S. Experimental study on mechanical behavior of normal section of reinforced powder concrete simply supported beam. J. Build. Struct. 2011, 32, 125–134. (In Chinese) [Google Scholar]
  27. Yu, T.; Teng, J.G.; Wong, Y.L.; Dong, S.L. Finite element modeling of confined concrete-II: Plastic-damage model. Eng. Struct. 2010, 32, 680–691. [Google Scholar] [CrossRef]
  28. Ji, J.; Zhang, H.; Jiang, L.; Zhang, Y.; Yuan, Z.; Zhang, Z.; Chu, X.; Li, B. Seismic Behaviors of Novel Steel-Reinforced Concrete Composite Frames Prestressed with Bonding Tendons. Buildings 2023, 13, 2124. [Google Scholar] [CrossRef]
  29. Aksoylu, C.; Özkılıç, Y.O.; Çeledir, E.; Başaran, B.; Arslan, M.H. Experimental and numerical investigation of bending performance of prestressed purlins having different longitudinal web opening. Structures 2024, 60, 105839. [Google Scholar] [CrossRef]
  30. Chen, X. Study on Flexural Behavior and Finite Element Simulation of Partially Prestressed Concrete Beams with High-Strength Steel Bars. Master’s Thesis, Hebei University of Technology, Tianjin, China, 2018. (In Chinese). [Google Scholar]
  31. Xu, H. Study on Mechanical Properties of HRB500 Reinforced Prestressed Ultra-High Performance Concrete Beams. Ph.D. Thesis, Beijing University of Technology, Beijing, China, 2015. (In Chinese). [Google Scholar]
  32. JGJ 138-2016.2016; Code for Design of Composite Structures. China Architecture & Building Press: Beijing, China, 2016. (In Chinese)
  33. JTG/T 3650-2020; Technical Specifications for Construction of Highway Bridges and Culverts. Ministry of Transport of the People’s Republic of China: Beijing, China, 2020. (In Chinese)
  34. DBJ 43/T 325-2017; Technical Specification for Reactive Powder Concrete Structures. China Architecture & Building Press: Beijing, China, 2017. (In Chinese)
Figure 1. Constitutive relationship of materials: (a) UHPC; (b) reinforcement and steel section; (c) prestressed tendon.
Buildings 14 04029 g001
Figure 2. FE model of prestressed steel-reinforced UHPC beams.
Buildings 14 04029 g002
Figure 3. Cross-section configuration diagram: (a) PSRCB-1; (b) PSRCB-4; (c) YL-1; (d) YL-2; (e) PB-1; (f) PB-3.
Buildings 14 04029 g003
Figure 4. Comparisons between the experimental and calculated P-Δ curves: (a) PSRCB-1; (b) PSRCB-4; (c) YL-1; (d) YL-2; (e) PB-1; (f) PB-3.
Buildings 14 04029 g004
Figure 5. Configuration of the prestressed steel-reinforced UHPC beams.
Buildings 14 04029 g005
Figure 6. Load–deflection curves: (a) L-1; (b) L-2; (c) L-3; (d) L-4; (e) L-5; (f) L-6; (g) L-7; (h) L-8; (i) L-9; (j) L-10.
Buildings 14 04029 g006
Figure 7. Comparison of load–deflection curves: (a) reinforcement ratio; (b) prestressing level; (c) flange thickness; (d) web thickness.
Buildings 14 04029 g007
Figure 8. Load–strain curve: (a) L-1; (b) L-2; (c) L-3; (d) L-4; I L-5; (f) L-6; (g) L-7; (h) L-8; (i) L-9.
Buildings 14 04029 g008
Figure 9. Typical load–deflection curve.
Buildings 14 04029 g009
Figure 10. Application of prestress: (a) stress of prestressed tendons; (b) stress of reinforcement cage and steel section; (c) strain of UHPC.
Buildings 14 04029 g010
Figure 11. Crack point: (a) stress of prestressed tendons; (b) stress of reinforcement cage and steel section; (c) tensile damage of UHPC.
Buildings 14 04029 g011
Figure 12. Bottom flange yield point: (a) stress of prestressed tendons; (b) equivalent plastic strain of reinforcement cage and steel section; (c) tensile damage of UHPC.
Buildings 14 04029 g012
Figure 13. Bottom bar yield point: (a) stress of prestressed tendons; (b) equivalent plastic strain of reinforcement cage and steel section; (c) tensile damage of UHPC.
Buildings 14 04029 g013
Figure 14. Crushing point: (a) stress of prestressed tendons; (b) equivalent plastic strain of reinforcement cage and steel section; (c) tensile damage of UHPC; (d) compressive damage of UHPC.
Buildings 14 04029 g014
Figure 15. Stress distribution of prestressed reinforced reactive powder concrete beams at ultimate load.
Buildings 14 04029 g015
Table 1. Parameter design of test beams.
SpecimenConcrete Strength
/N·mm−2
Elastic Modulus of Concrete/MPaBottom BarsStrength of Bottom Bars
/N·mm−2
Effective Strength/kN
PSRCB-150.603.51 × 1042Buildings 14 04029 i00114365.0139.81
PSRCB-450.603.51 × 1042Buildings 14 04029 i00220365.0130.89
YL-154.263.53 × 1043Buildings 14 04029 i00318654.3151.51
YL-254.263.53 × 1043Buildings 14 04029 i00418551.3156.97
PB-1128.004.82 × 1042Buildings 14 04029 i0056245.282.97
PB-3134.004.90 × 1042Buildings 14 04029 i00618536.085.91
Table 2. Comparison of peak load between test and simulation.
NumberPut/kNPuFE/kNPut/PuFE
PSRB-1265.51249.931.06
PSRB-4311.51341.550.91
YL-1598.11629.300.95
YL-2553.76601.370.92
PB-1408.22390.981.04
PB-3545.87518.201.05
Table 3. Parameter design of the specimens.
SpecimenSize of Steel Section
(H × B × tw × tf)
Bottom BarsPrestressed Tendon
L-1220 × 100 × 8 × 102Buildings 14 04029 i007222Buildings 14 04029 i008s15.2
L-2220 × 100 × 8 × 102Buildings 14 04029 i009252Buildings 14 04029 i010s15.2
L-3220 × 100 × 8 × 102Buildings 14 04029 i011282Buildings 14 04029 i012s15.2
L-4220 × 100 × 8 × 102Buildings 14 04029 i013222Buildings 14 04029 i014s17.8
L-5220 × 100 × 8 × 122Buildings 14 04029 i015252Buildings 14 04029 i016s15.2
L-6220 × 100 × 8 × 142Buildings 14 04029 i017252Buildings 14 04029 i018s15.2
L-7220 × 100 × 6 × 102Buildings 14 04029 i019282Buildings 14 04029 i020s15.2
L-8220 × 100 × 10 × 102Buildings 14 04029 i021282Buildings 14 04029 i022s15.2
L-9220 × 100 × 8 × 102Buildings 14 04029 i023222Buildings 14 04029 i024s21.6
L-10220 × 100 × 8 × 102Buildings 14 04029 i025220
Table 4. Comparison between predicted and calculated flexural capacity.
SpecimenPuP/kNPuFE/kNPuP/PuFE
L-1784.10784.550.999
L-2838.85837.711.001
L-3899.50895.141.005
L-4850.00846.671.004
L-5861.38871.370.989
L-6883.78908.110.973
L-7879.85869.181.012
L-8917.55921.200.996
L-9967.98948.201.021
Disclaimer/Publisher’s Note: The statements, opinions and data contained in all publications are solely those of the individual author(s) and contributor(s) and not of MDPI and/or the editor(s). MDPI and/or the editor(s) disclaim responsibility for any injury to people or property resulting from any ideas, methods, instructions or products referred to in the content.

