1. Background
The challenges posed by climate change have become a focal point in scientific [
1], economic [
2], and policy [
3] discussions worldwide. Among these challenges, the increasing severity and frequency of heat waves represent significant threats to urban [
4] and residential environments [
5]. The global temperature rise, driven by escalating greenhouse gas emissions, intensifies these extreme weather events, making them more frequent and prolonged [
6]. The necessity for thermal comfort drives a corresponding reliance on active cooling technologies in residential settings [
7]. Such technologies have become indispensable for maintaining indoor comfort, especially as living standards and expectations continue to rise, leading to a deeper dependence on energy resources [
8].
Active cooling systems, while essential, significantly contribute to energy consumption [
9]. Traditional assessments of building energy performance typically emphasize long-term energy analysis, often using data from typical meteorological years [
10] that reflect the average climate conditions [
11]. This approach provides a reliable overview of energy consumption under average conditions and captures high-probability, low-impact events [
12]. However, these models do not sufficiently account for the consequences of extreme weather events that are low-probability yet high-impact [
13]. These short-term events can lead to disproportionately high energy consumption peaks, stressing energy grids and exacerbating infrastructure vulnerabilities [
14]. The ability to accurately assess and plan for these energy peaks is crucial [
15], as power outages during heat waves can directly threaten human life, especially among vulnerable populations such as the elderly and those with pre-existing health conditions [
16]. In southern regions, where climates are hot and humid, such events can result in severe impacts on residential energy use. For instance, sudden spikes in temperature and humidity during short-term heat waves can lead to dramatic increases in cooling loads, posing challenges for both energy suppliers and consumers [
17].
In southern regions, heat waves frequently exemplify low-probability, high-impact events that place intense pressure on cooling energy systems [
18]. The combination of high temperatures and persistent humidity in hot-humid cities magnifies the demand for air conditioning, pushing energy consumption to critical levels during these periods [
19]. This situation results in a heightened burden on electricity infrastructure, raising concerns about power reliability, grid failures, and economic impacts on residents [
20]. When the electricity demand surpasses supply, the risk of blackouts increases, posing a significant risk to public health and safety [
21]. Prolonged power outages during extreme heat can have fatal consequences, as people are left without cooling options, leading to heat stress and heat-related illnesses [
22]. Additionally, climate change has been linked to an increase in the frequency and intensity of these heat waves, leading to prolonged periods of high temperatures [
23]. A heat wave, defined as an extended period of excessively high temperatures that may coincide with high humidity, has significant effects on health, economic productivity, and energy infrastructure [
24]. Previous studies have demonstrated that heat waves are associated with spikes in building energy consumption, leading to a cascading series of challenges in energy supply and grid stability [
25]. This body of work highlights the necessity for adaptive measures to mitigate energy spikes during such extreme conditions to safeguard lives and prevent widespread disruption.
The Urban Heat Island (UHI) effect further exacerbates the impacts of heat waves, resulting in additional strain on the cooling energy demand [
26]. The UHI phenomenon arises from the modification of natural land surfaces and the accumulation of heat in built environments [
27], which leads to elevated nighttime temperatures and reduced thermal relief. This intensification of heat contributes to an increased demand for air conditioning and longer operating hours for cooling systems during heat waves [
28]. The compounding impact of UHI has been well documented, with studies indicating that urban areas can experience temperatures several degrees higher than surrounding rural areas, thus amplifying energy use and affecting overall building performance [
29]. In the built environment, numerous investigations have shown that ignoring the influence of the UHI in energy modeling can lead to underestimations of cooling loads during heat waves [
30]. This underestimation can hinder the ability of planners and policymakers to develop strategies for peak energy management, potentially leading to power shortages that endanger public health. The presence of UHI emphasizes the need to consider urban-specific conditions when evaluating energy consumption and resilience strategies for residential buildings.
To accurately assess the impacts of urban microclimates, the concept of Local Climate Zones (LCZs) has gained traction [
31]. LCZs provide a systematic approach to classifying urban and peri-urban areas based on surface characteristics, land cover, and human activity patterns [
32]. These zones help delineate the thermal behavior of different urban configurations and their unique interactions with climate phenomena, such as heat waves [
33]. The application of LCZs in building energy studies enables researchers to create more localized and detailed energy consumption models [
34]. Recent studies using LCZs have shown that accounting for local urban characteristics can reveal significant differences in urban climates, particularly during periods of extreme heat [
35]. Such insights can inform better energy planning and management [
36], reducing the risk of power shortages and protecting public safety during heat events.
To further elucidate the interplay between urban morphology and thermal conditions,
Table 1 highlights the distinct characteristics and strong interrelation between UHI and LCZ. While UHI describes the overall temperature difference between urban and rural areas, LCZ provides a detailed spatial framework for understanding the heterogeneity of urban climates. This framework is essential for accurately modelling, predicting, and mitigating UHI effects at a local scale. The LCZ classification system enables detailed microclimatic analysis by categorizing urban areas into distinct zones according to their physical and functional attributes. This granularity is crucial for effective urban planning and design interventions aimed at minimizing UHI and creating more thermally comfortable and sustainable urban environments. By understanding how different LCZs contribute to or mitigate UHI, urban planners can make informed decisions regarding land use, building design, and green infrastructure implementation.
In this study, we employ the LCZ classification to categorize urban areas based on their morphological and land surface properties. This approach enables a more detailed understanding of how varying urban forms and densities influence the cooling energy demand, particularly during heat waves. By combining LCZ with the Urban Weather Generator (UWG) model, this study simulates localized UHI effects and provides more accurate building energy predictions, accounting for variations in microclimates across different urban zones.
This study aims to build on this foundation by exploring the interplay between heat waves, UHI effects, and cooling energy demands in residential buildings, particularly in hot-humid cities. Unlike some existing studies that focus on broader or long-term energy consumption trends, this research takes a more nuanced approach, acknowledging the potential of short-term, high-impact events to disrupt energy systems and urban life. We recognize that our investigation contributes incrementally to a deeper understanding of how urban environments influence energy needs under the strain of extreme weather conditions. By incorporating LCZs into our analysis, we seek to provide a localized perspective that underscores the significance of urban microclimate variations on cooling energy challenges. Our findings are intended to offer insights that support policymakers, urban planners, and energy stakeholders in developing targeted strategies to mitigate the impacts of heat waves and ensure that energy systems remain resilient, ultimately safeguarding public health and safety.
2. Methodology
2.1. Climate Characteristic of the Study Site
This research is set in Guangzhou, the capital of Guangdong Province in southern China. Guangzhou’s climate and urban structure make it an ideal location for studying cooling energy challenges during heat waves. The city is situated in a subtropical monsoon climate zone, characterized by hot, humid summers and mild winters. Its summers are marked by high temperatures often exceeding 30 °C, combined with a persistently high humidity. These conditions lead to significant demands for cooling energy, particularly during heat waves when temperatures and humidity levels spike. The city’s UHI effect further amplifies these challenges by increasing nighttime temperatures and prolonging heat stress [
37].
The dense urban fabric of Guangzhou, with its extensive built-up areas and limited green spaces, contributes to the UHI effect, making it critical to consider these factors when assessing energy consumption. This combination of climatic and urban conditions positions Guangzhou as a representative case for examining the impacts of extreme weather on cooling energy needs, as well as the effectiveness of the urban planning and energy management strategies tailored to hot-humid environments.
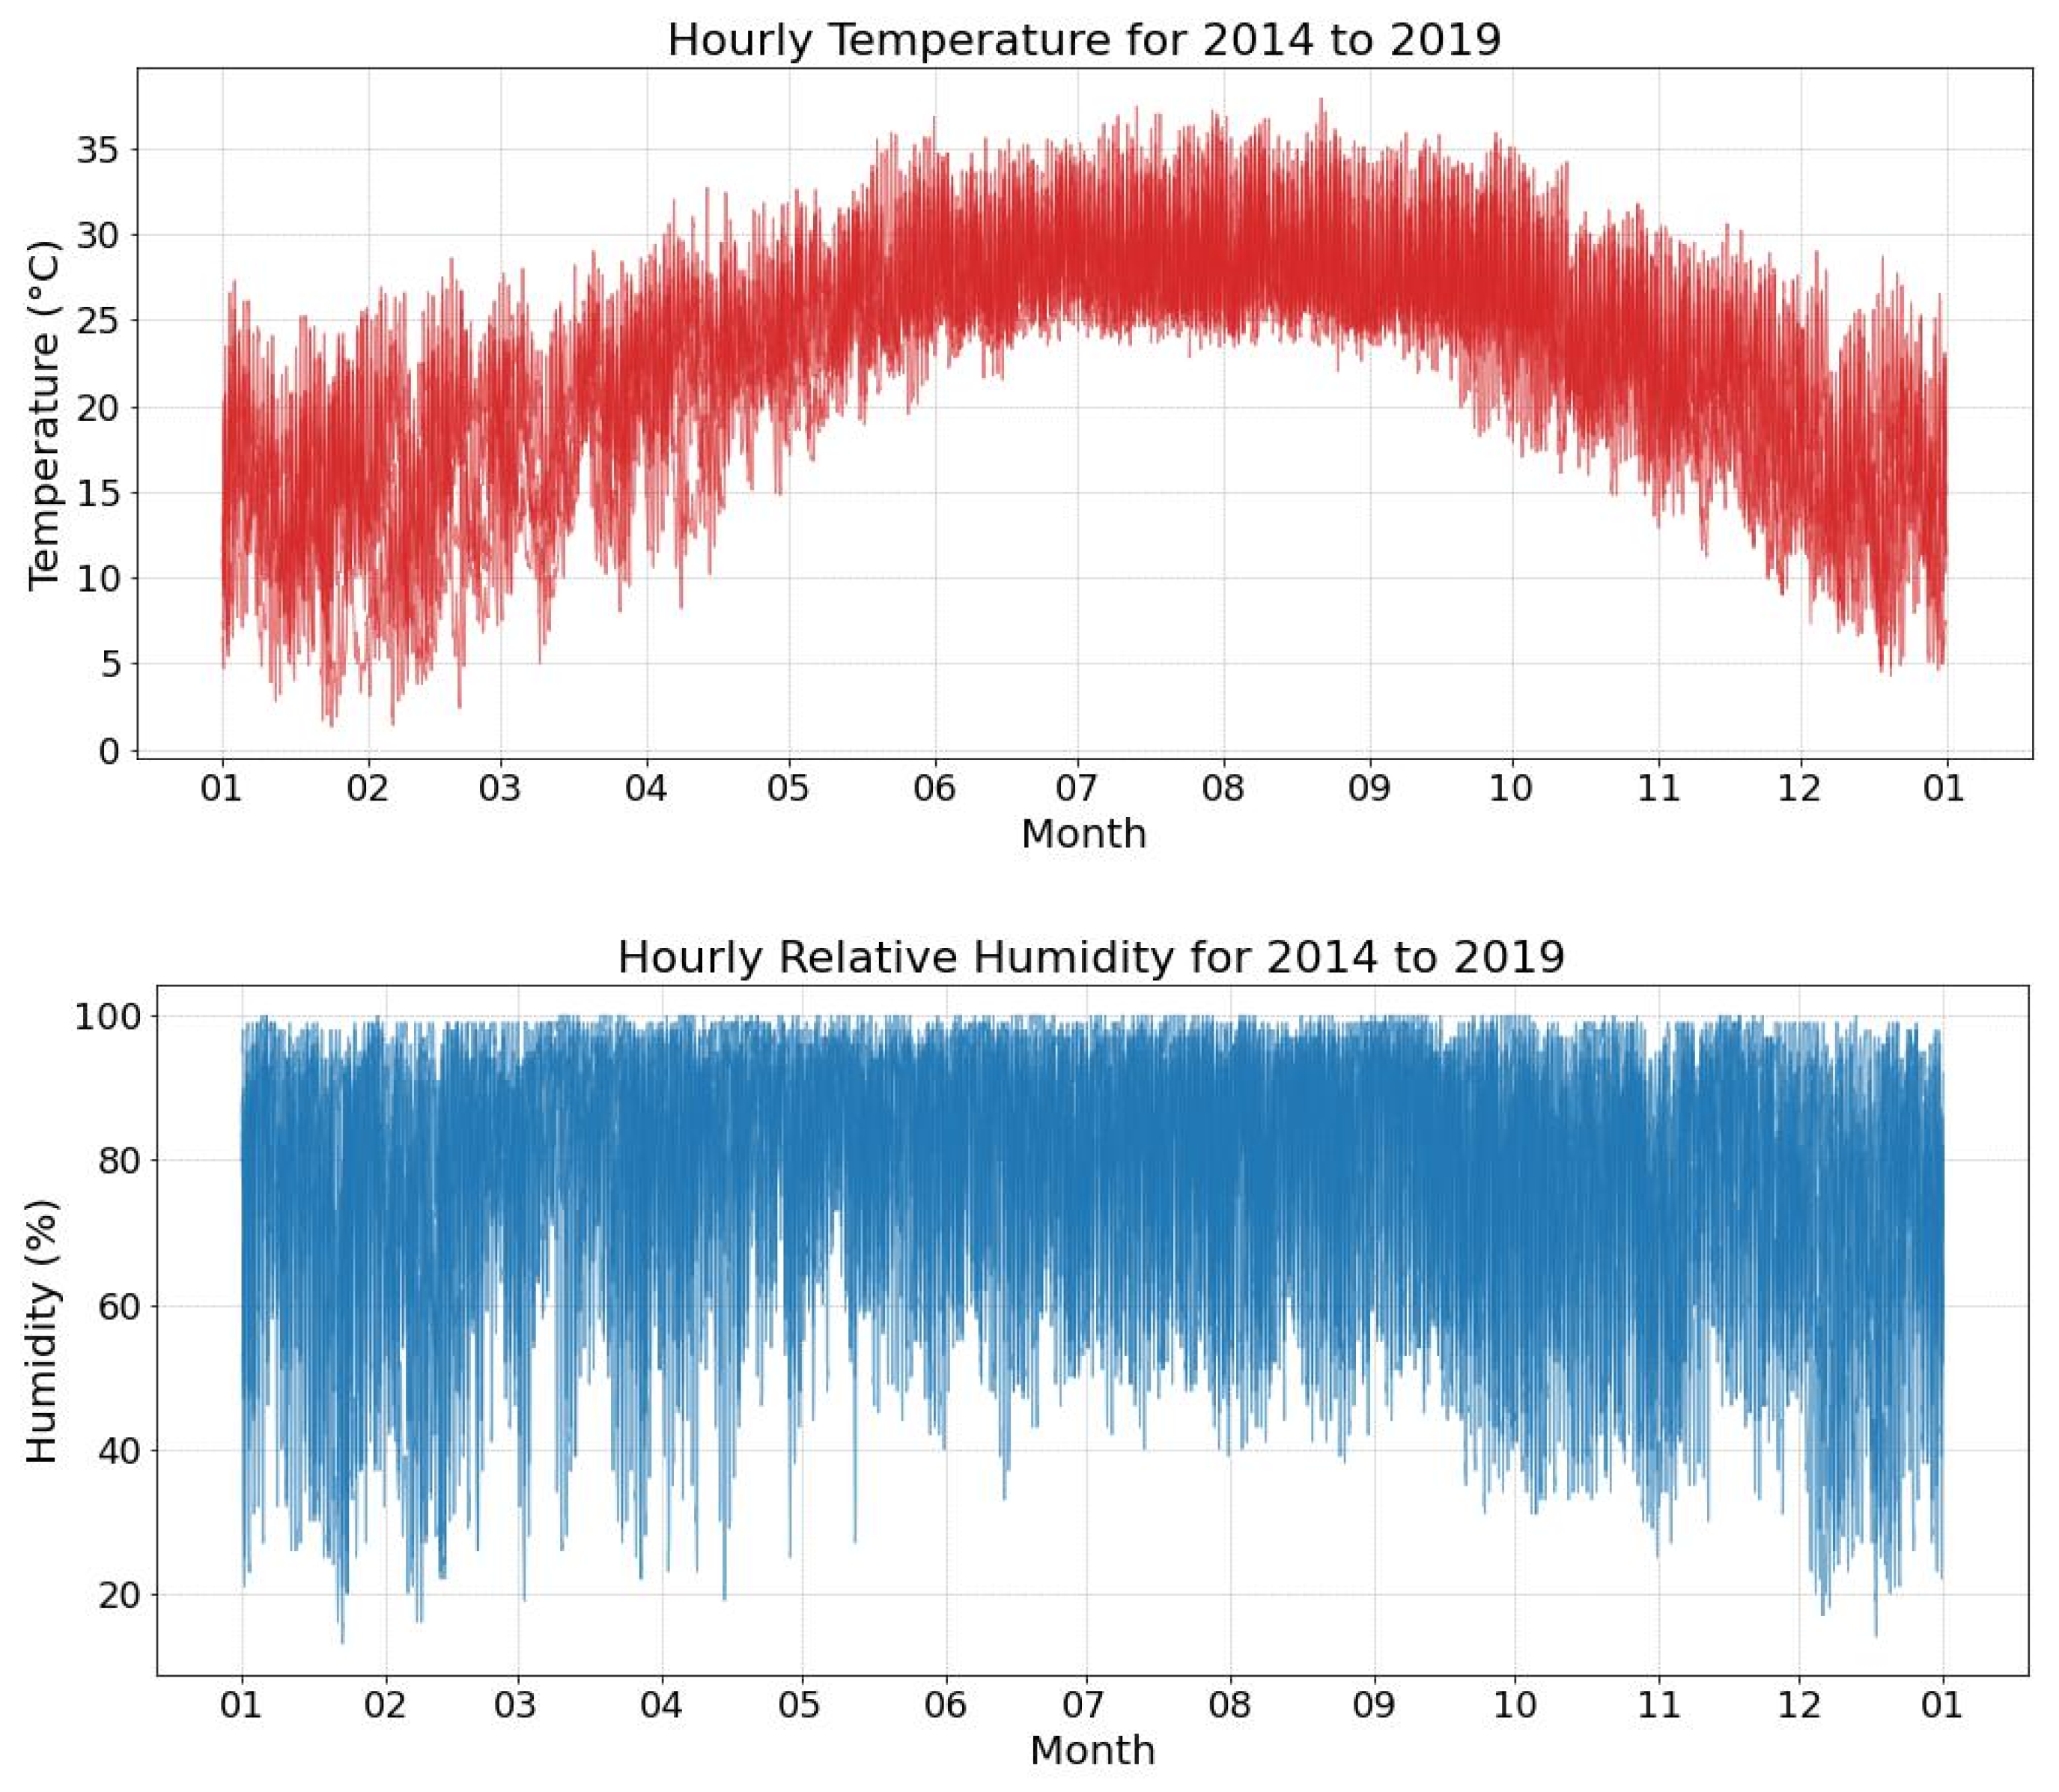
The analysis in this research covers the period from 2014 to 2019, a timeframe chosen to provide a comprehensive overview of the recent climatic conditions in Guangzhou. During these six years, the city exhibited distinct temperature and humidity patterns, as illustrated by the data visualizations. During this period, the measured meteorological data from the Guangzhou suburban meteorological stations were used as UWG calculation boundary conditions to simulate the UHI in Guangzhou.
Figure 1 shows the hourly temperature data and the relative humidity from the suburban weather station over 2014 to 2019. The temperature data exhibit a pronounced seasonal pattern, with peak temperatures occurring during the summer months (June to September), often exceeding 30 °C. This pattern is consistent with Guangzhou’s subtropical monsoon climate, where hot and humid summers are a defining characteristic. In contrast, winter temperatures (December to February) are significantly lower, typically ranging between 10 °C and 20 °C, reflecting the mild nature of winters in this region.
The figure also highlights the consistently high humidity levels throughout the year in Guangzhou. Relative humidity frequently approaches or even reaches 100%, particularly during the spring and summer months, creating hot and humid conditions that can significantly impact human comfort and increase the energy demand for cooling. This high humidity level persists even during the relatively drier winter months, often remaining above 60%. The combination of high temperatures and high humidity creates a challenging thermal environment in Guangzhou, with significant implications for human comfort, energy consumption, and overall urban livability.
2.2. Heat Wave Definition Method
This study focuses on events characterized by prolonged high temperatures, as accurate meteorological data is essential for assessing the energy demand of Guangzhou’s residential sector during extreme weather. Researchers worldwide have developed various heat wave identification criteria tailored to local climates [
38]. In China, the China Meteorological Administration defines a heat wave as a period of at least three consecutive days with daily maximum temperatures over 35 °C. However, this broad definition may not fully capture the diverse climatic conditions across the country, particularly in regions like Guangzhou where heat waves can have more significant impacts on the energy demand and public health. In cities with milder climates, a high temperature of 35 °C may be considered extremely hot, while in tropical or subtropical regions like Guangzhou, 35 °C is a common high temperature and may not accurately reflect the severity of extreme weather events. Furthermore, because the absolute temperature threshold does not take into account the regional adaptability and historical temperature distribution, it may fail to accurately identify high-temperature events that have a significant impact on certain cities, especially those in tropical and subtropical regions.
To address this limitation, Yang et al. proposed a more refined definition based on mortality data from 31 megacities [
39]. Their definition considers a heat wave to be at least three consecutive days with maximum daily temperatures at or above the 92.5th percentile, offering a more precise measure of extreme heat events. This approach better accounts for the actual health impacts of extreme weather, as it reflects the severity of heat waves in different urban contexts, such as Guangzhou’s subtropical climate, where high temperatures can be sustained for extended periods.
2.3. Urban Climate Simulation
To model and assess urban climate impacts on energy demand, this study employs the UWG. The UWG is a sophisticated simulation tool developed by Bueno et al. [
40], designed to predict localized urban climate conditions, particularly the UHI effect, which influences building energy performance. The model consists of four coupled modules: a rural station model, a vertical diffusion model, an urban boundary layer model, and an urban canopy-building energy model. It integrates physical and empirical models to simulate the interactions between urban surfaces and the atmosphere, providing refined weather data that reflects urban-specific modifications. By exchanging boundary information between its modules, the UWG generates reliable energy and environmental data with reasonable computational efficiency.
The fundamental principle of the UWG lies in its ability to modify baseline rural weather data to produce a detailed urban climate profile. This process begins by inputting standard meteorological data, such as temperature, humidity, wind speed, and solar radiation, from a nearby rural or standard weather station. The UWG then overlays these data with parameters that characterize the urban landscape, including building density, surface albedo, green space ratio, and the thermal properties of construction materials.
Additionally, the UWG can be tailored to reflect the specific characteristics of different Local Climate Zones (LCZs). By incorporating LCZ data, the tool adjusts its simulations based on the unique physical and morphological features of each zone, such as building type, land cover, and surface properties. The model can output distinct meteorological parameters for different LCZs, allowing for the calculation of localized climate conditions and their effects on building energy performance. For example, urban zones with high building density and low vegetation, typical of LCZs like 2.1 (compact mid-rise and high-rise buildings), will experience more intense UHI effects, which can be quantified through the UWG’s simulation capabilities. This approach enables the model to simulate temperature, humidity, and wind patterns specific to each LCZ, providing highly localized and accurate weather data.
By simulating these interactions, the UWG calculates the heat retention and release properties of urban areas, which are influenced by factors like building geometry, anthropogenic heat emissions, and surface material characteristics. This approach allows the model to predict how urban environments absorb and release heat, leading to variations in local temperature and humidity. The UWG generates hourly weather data specific to urban areas, providing an accurate representation of how the Urban Heat Island (UHI) effect influences local microclimates. The accuracy of the UWG in simulating urban climates has been validated in regions with diverse climatic conditions, including Toulouse, France [
41]; Abu Dhabi, United Arab Emirates [
42]; Beijing, China [
43]; and Guangzhou, China [
44], which is the focus of this study.
2.4. LCZ Type and the Corresponding Urban Parameters
According to a previous study [
45] based on the World Urban Database and Access Portal Tools (WUDAPT) methodology [
46], Guangzhou is classified into 11 LCZs. The grid scale for each LCZ is 400 m × 400 m. In this study, LCZ 1, LCZ 2, LCZ 3, LCZ 4, LCZ 1.8, LCZ 2.1, and LCZ 3.1 were selected as the focus areas, as they collectively account for more than 90% of the central urban area and contain the majority of the residential buildings in Guangzhou. These LCZs represent a range of urban forms and land cover characteristics. LCZ 1 (compact high-rise) and LCZ 2 (compact mid-rise) are characterized by densely built areas with minimal vegetation, typically forming the city center. LCZ 3 (compact low-rise) and LCZ 4 (open high-rise) represent areas with moderately reduced building density or taller structures with increased spacing. LCZ 1.8 (compact high-rise with large low-rise) describes areas dominated by tall buildings with an average building height of 25.9 m, interspersed with large low-rise structures. LCZ 2.1 (compact mid-rise with compact high-rise) features mid-rise buildings (average height 28.4 m) closely integrated with compact high-rise structures. LCZ 3.1 (compact low-rise with compact high-rise) reflects a scenario of low-rise buildings (average height 24.4 m) interspersed with compact high-rise structures.
The urban parameters for these LCZs were determined based on a study by Xu et al. [
47]. By incorporating observed meteorological data specific to the study area of Guangzhou, Xu et al. rigorously validated the simulation of the urban climate under these LCZs using the UWG. The simulated results demonstrated a strong agreement with in-situ measurements. Consequently, the UWG can be considered a reliable tool for quantifying Urban Heat Island effects for these LCZs in Guangzhou. The calculation of urban parameters incorporates factors such as average building height, building density, tree cover ratio, shrub and grass cover ratio, water body coverage, wall area ratio, sky view factor, aspect ratio, floor area ratio, and the peak anthropogenic heat from traffic. The detailed urban parameters of the selected LCZs can be referenced from the study by Xu et al. [
47].
Table 2 provides visual images of these LCZs.
2.5. Residential Unit and Building Performance Simulation
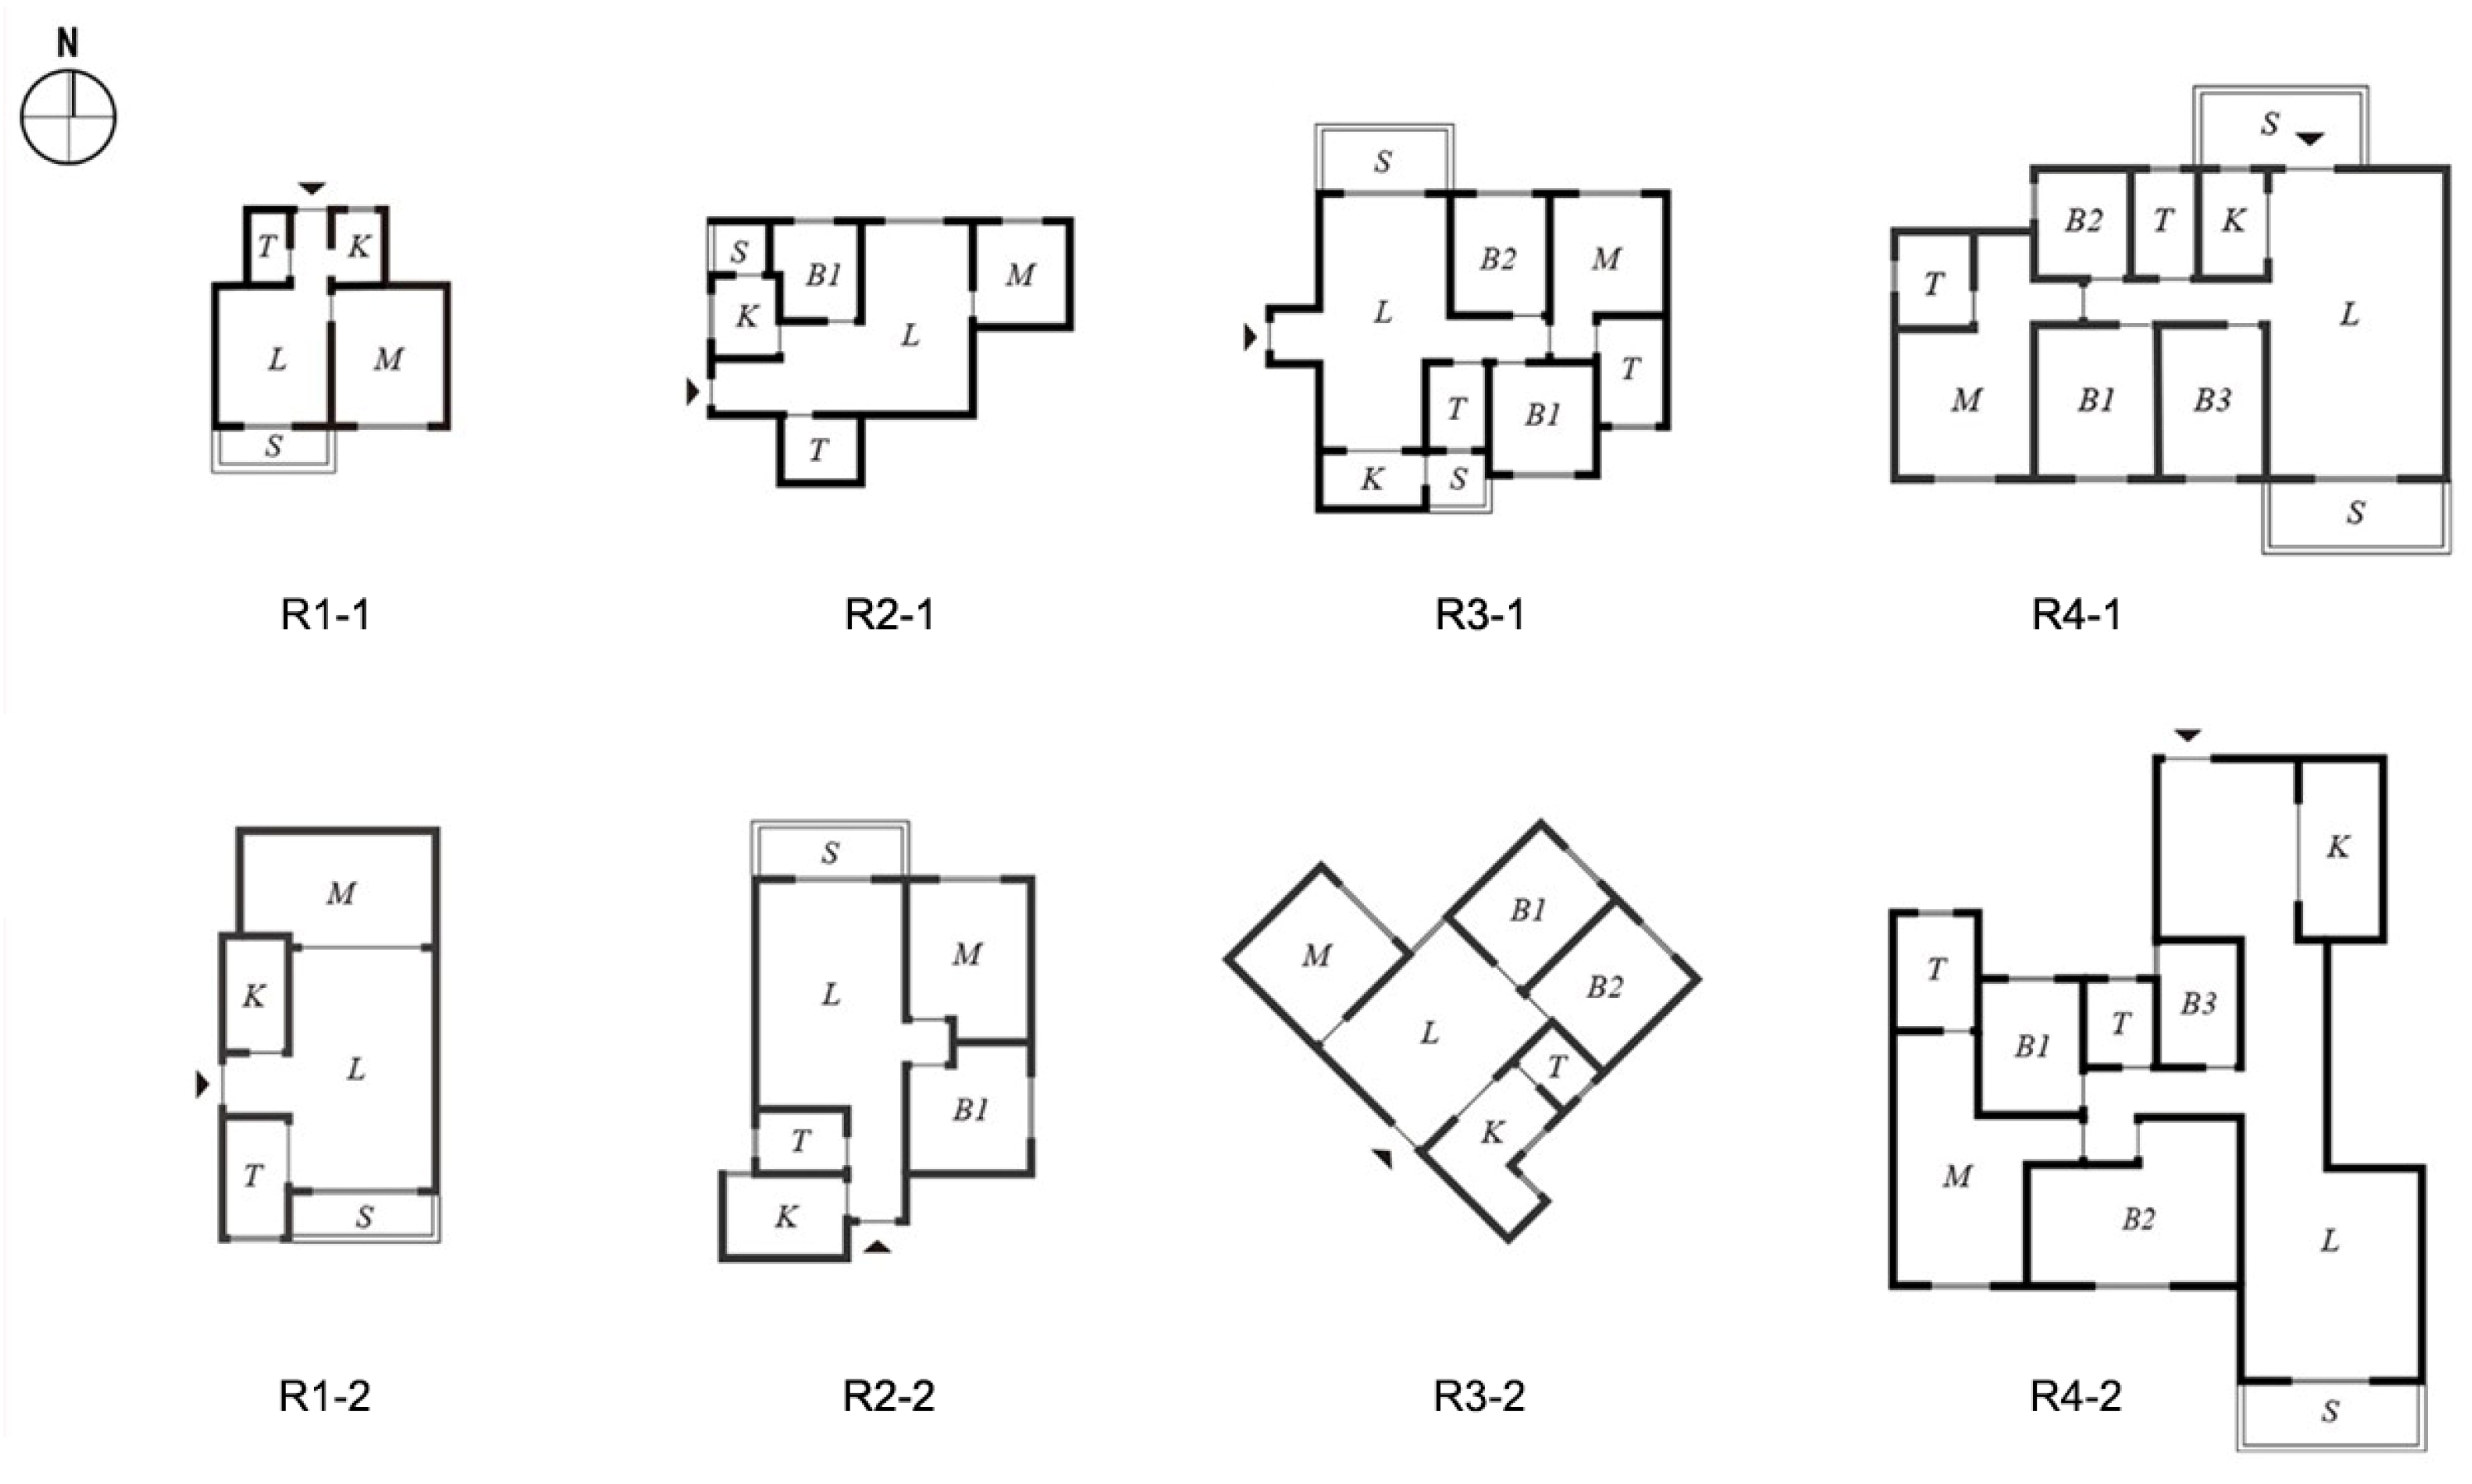
Local residential units typically consist of no more than four rooms. Consequently, we focused on investigating the cooling demands of one-bedroom, two-bedroom, three-bedroom, and four-bedroom residential units during heat wave periods. To explore the impact of residential unit typology, we selected two typical floor plans for each bedroom category. The floor plans and their corresponding numbers are shown in
Figure 2. The selected floor plans within the same bedroom category exhibited distinct spatial characteristics. For instance, compared to R1-1, R1-2 had a deeper spatial extent in the east-west direction. The two three-bedroom apartment plans have different orientations for their living rooms and bedrooms.
The building envelope plays a significant role in air conditioning energy consumption. To ensure the accuracy and relevance of the analysis, we considered the variations in envelope performance across different construction periods: pre-1980, 1981–2000, and 2001–2020. The thermal performance of building envelopes has notably improved over time due to the advancements in construction materials and techniques, such as the use of higher insulation materials and improved glazing systems. For instance, buildings constructed after 2000 typically exhibit lower U-values and higher airtightness compared to those built before 1980 in terms of thermal performance. The specific thermal performance values, which are based on existing studies and field measurements, are detailed in
Table 3. In the simulation, the air conditioning setpoint temperature was fixed at 26 °C to maintain consistent conditions across scenarios. Lighting and equipment loads were set to 6 W/m
2 and 10 W/m
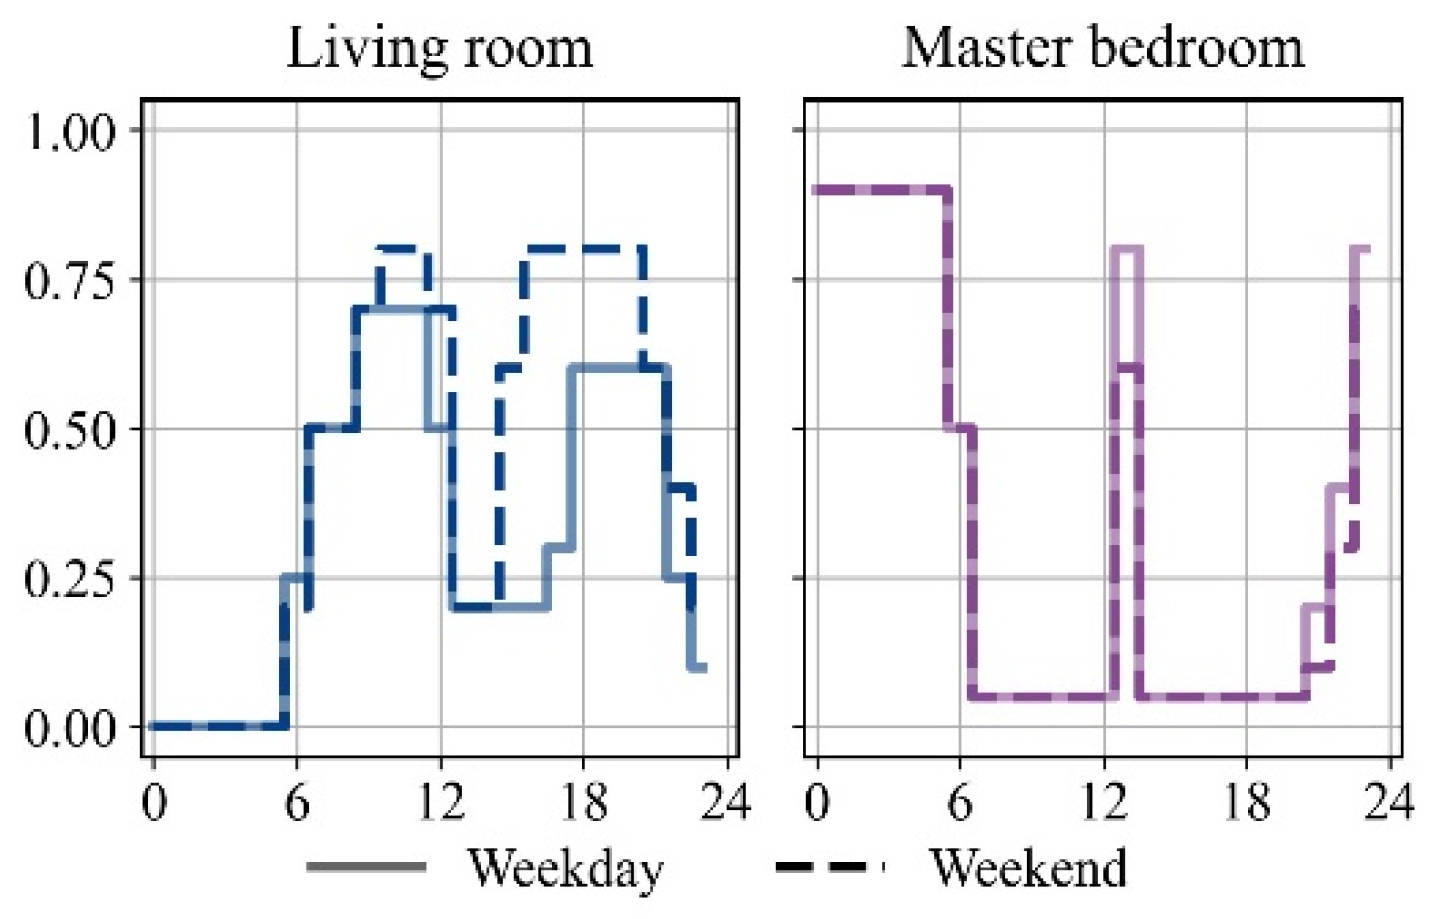
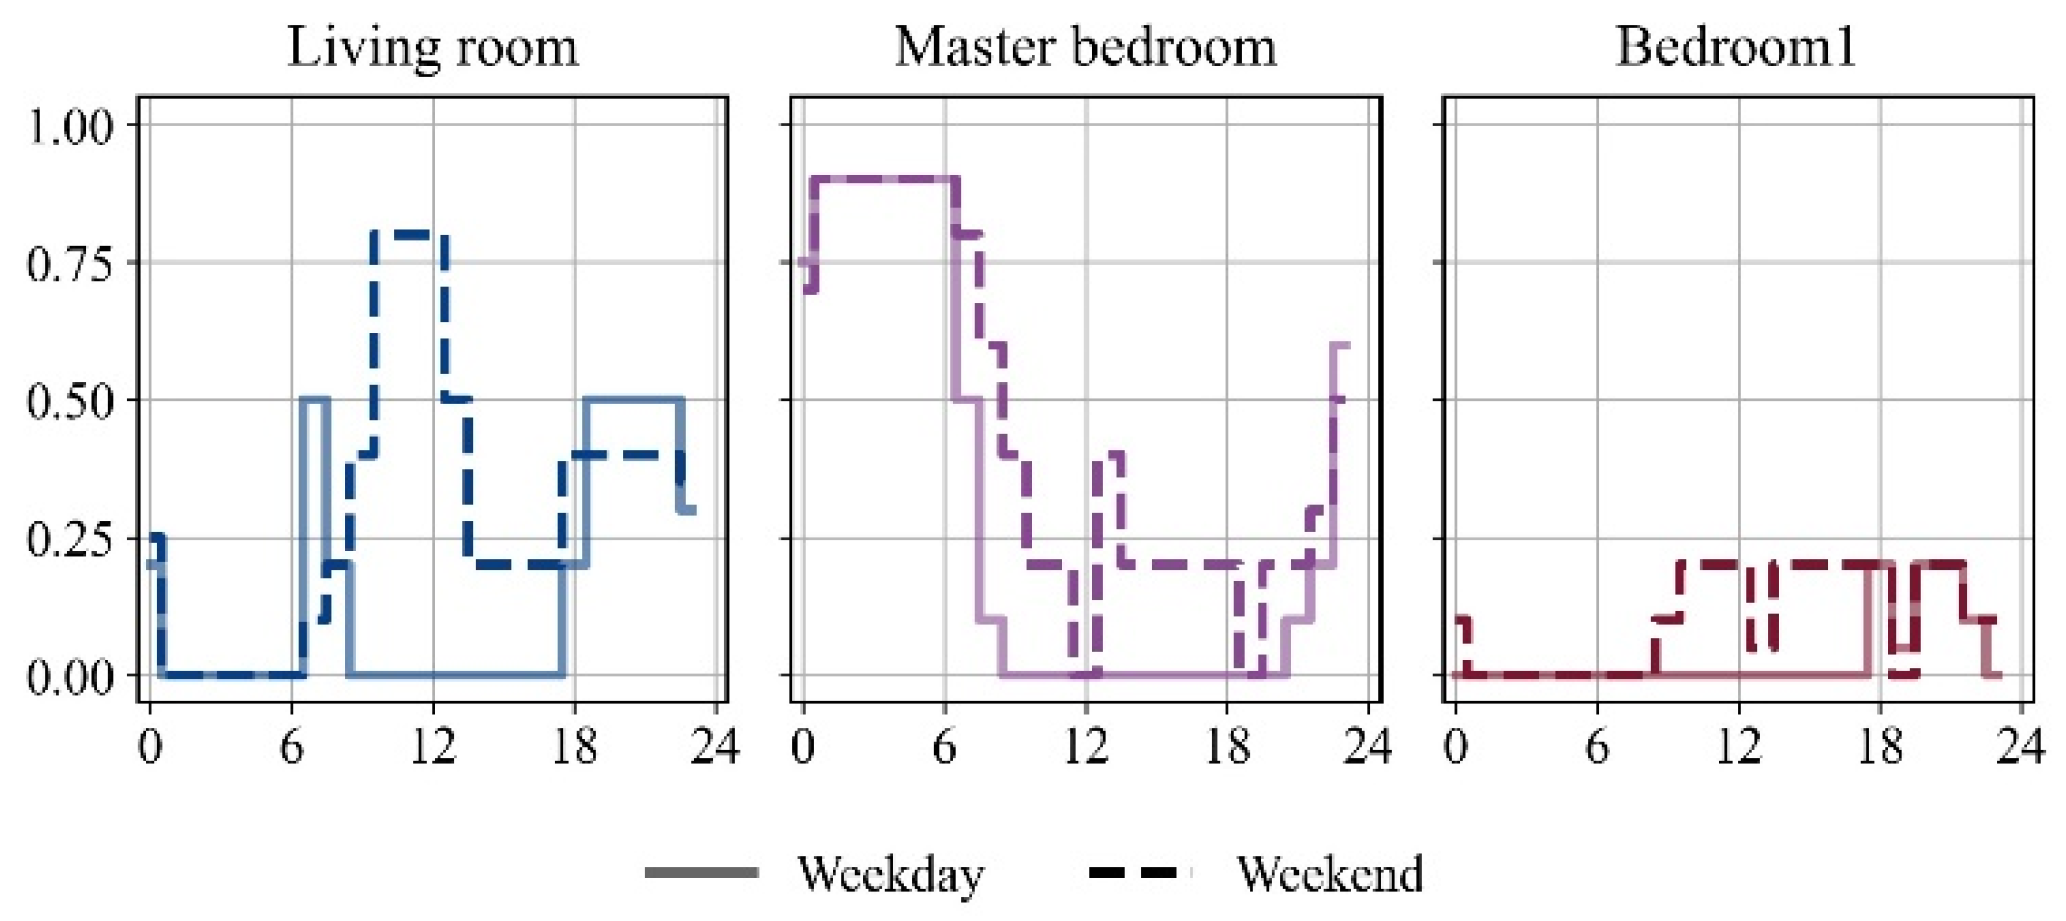
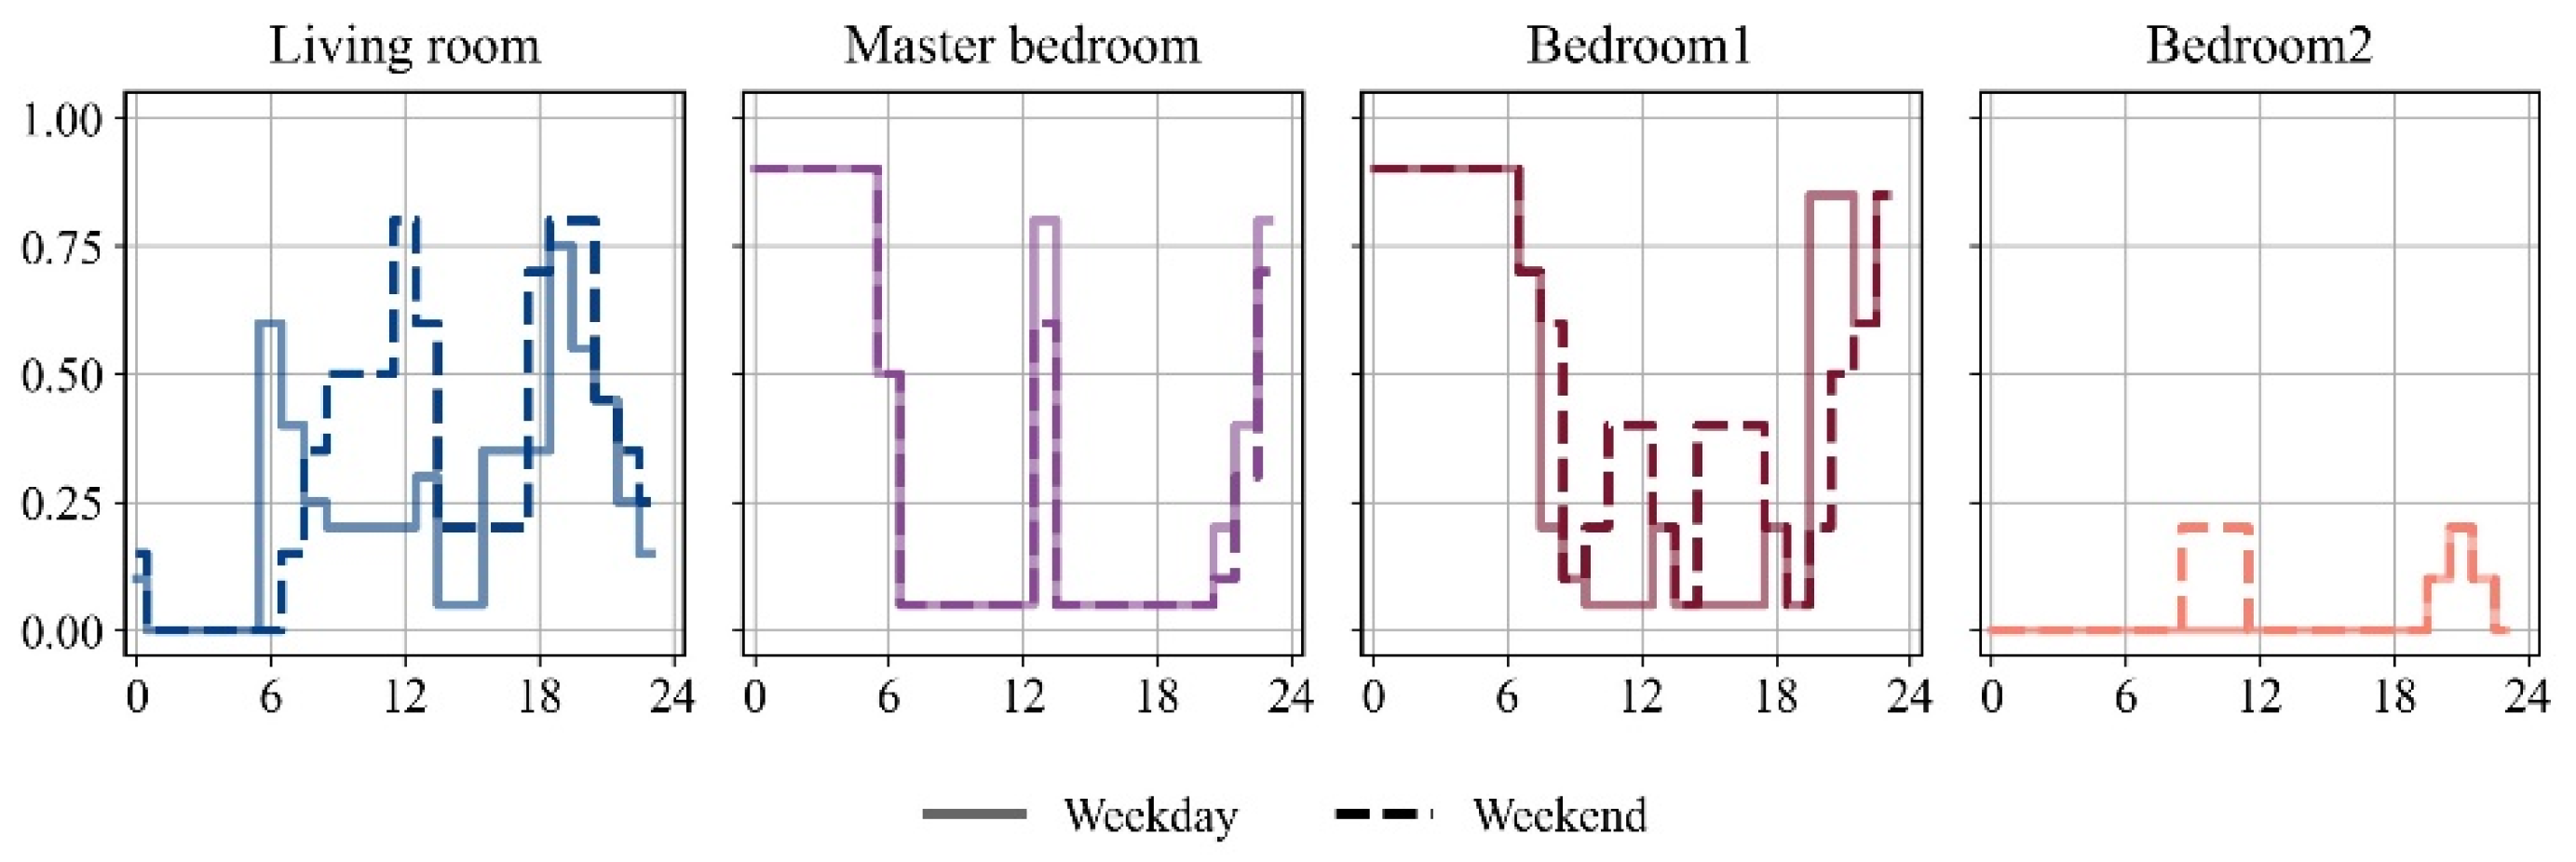
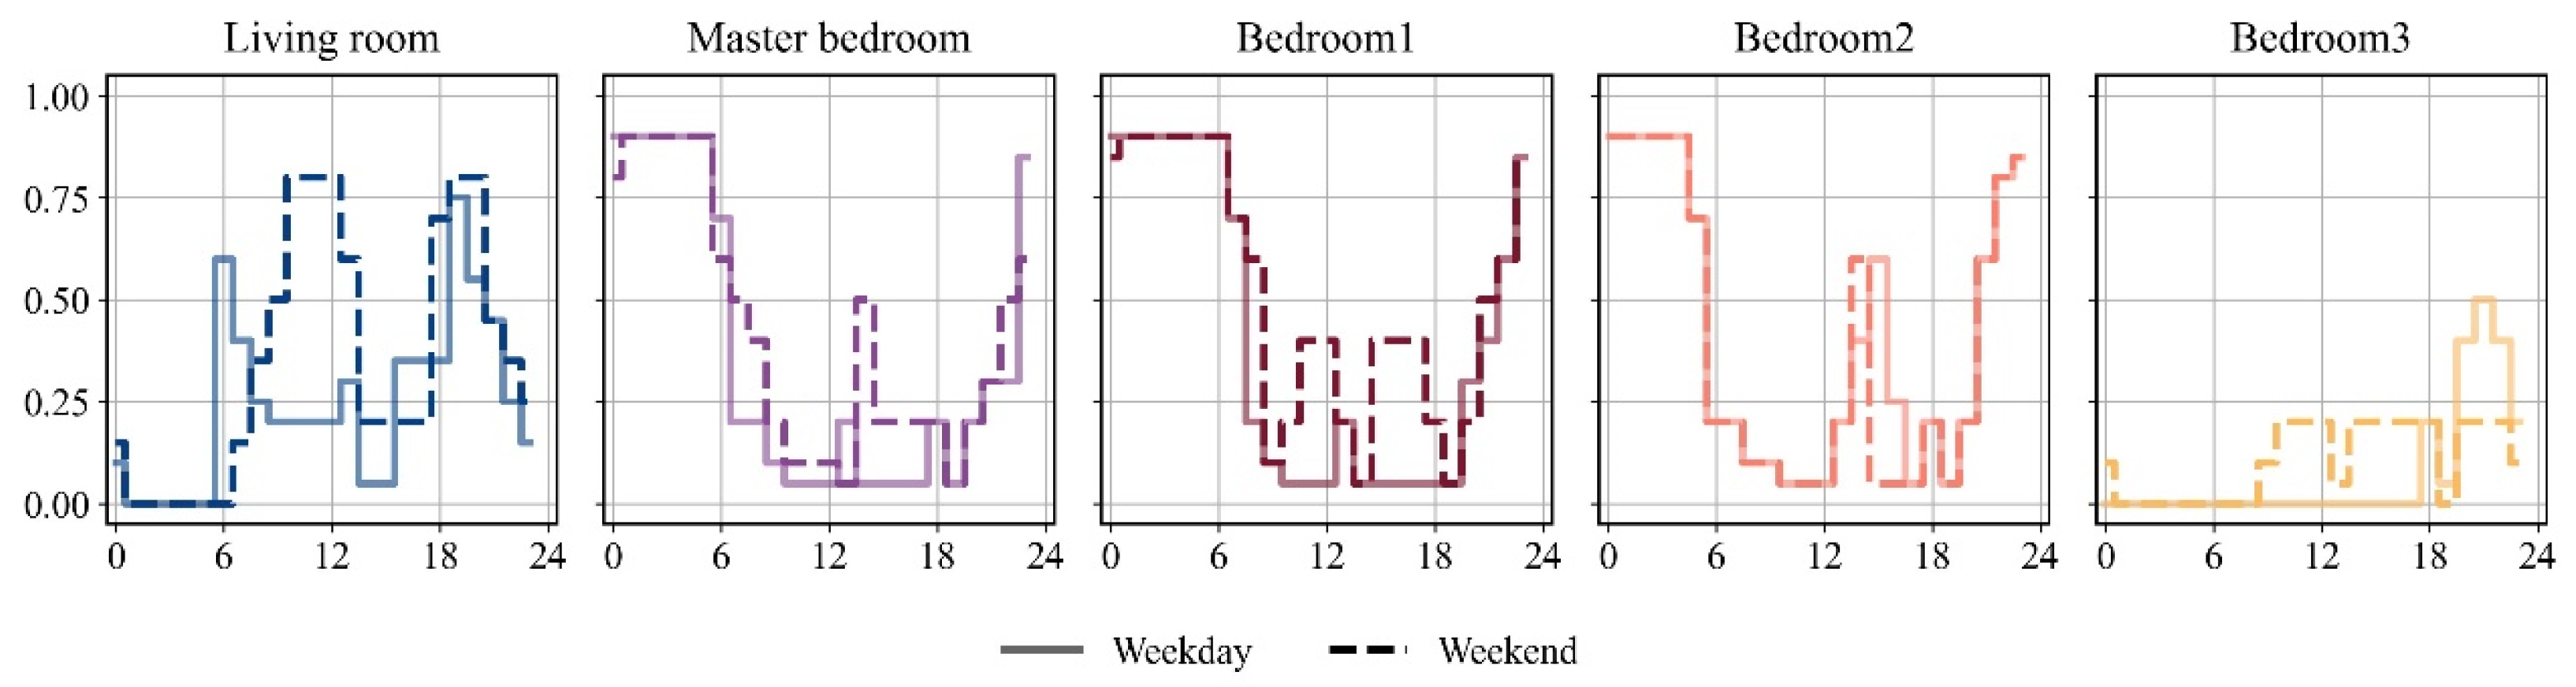
2, respectively, reflecting average residential usage patterns documented in regional energy surveys. Justifications for these loads are based on typical residential lighting systems using energy-efficient fixtures and standard equipment energy ratings. Detailed occupancy schedules for each floor plan, which consider typical activity patterns, are provided in
Appendix A.
The entire modeling process was conducted using the visual programming platform Grasshopper, within Rhino. Ladybug Tools (version 1.8) were employed to interface with EnergyPlus (version 23.0), a reliable building performance simulation engine, for calculating the building energy demand. The weather file used by EnergyPlus was in an ‘.epw’ format. Meteorological data from suburban weather stations were processed and converted into urban weather data using the UWG tool (version 4.2), which was then written into an ‘.epw’ file for batch processing of the building performance simulations.
3. Results
3.1. Heat Wave Date and the Outdoor Temperature Considering the UHI
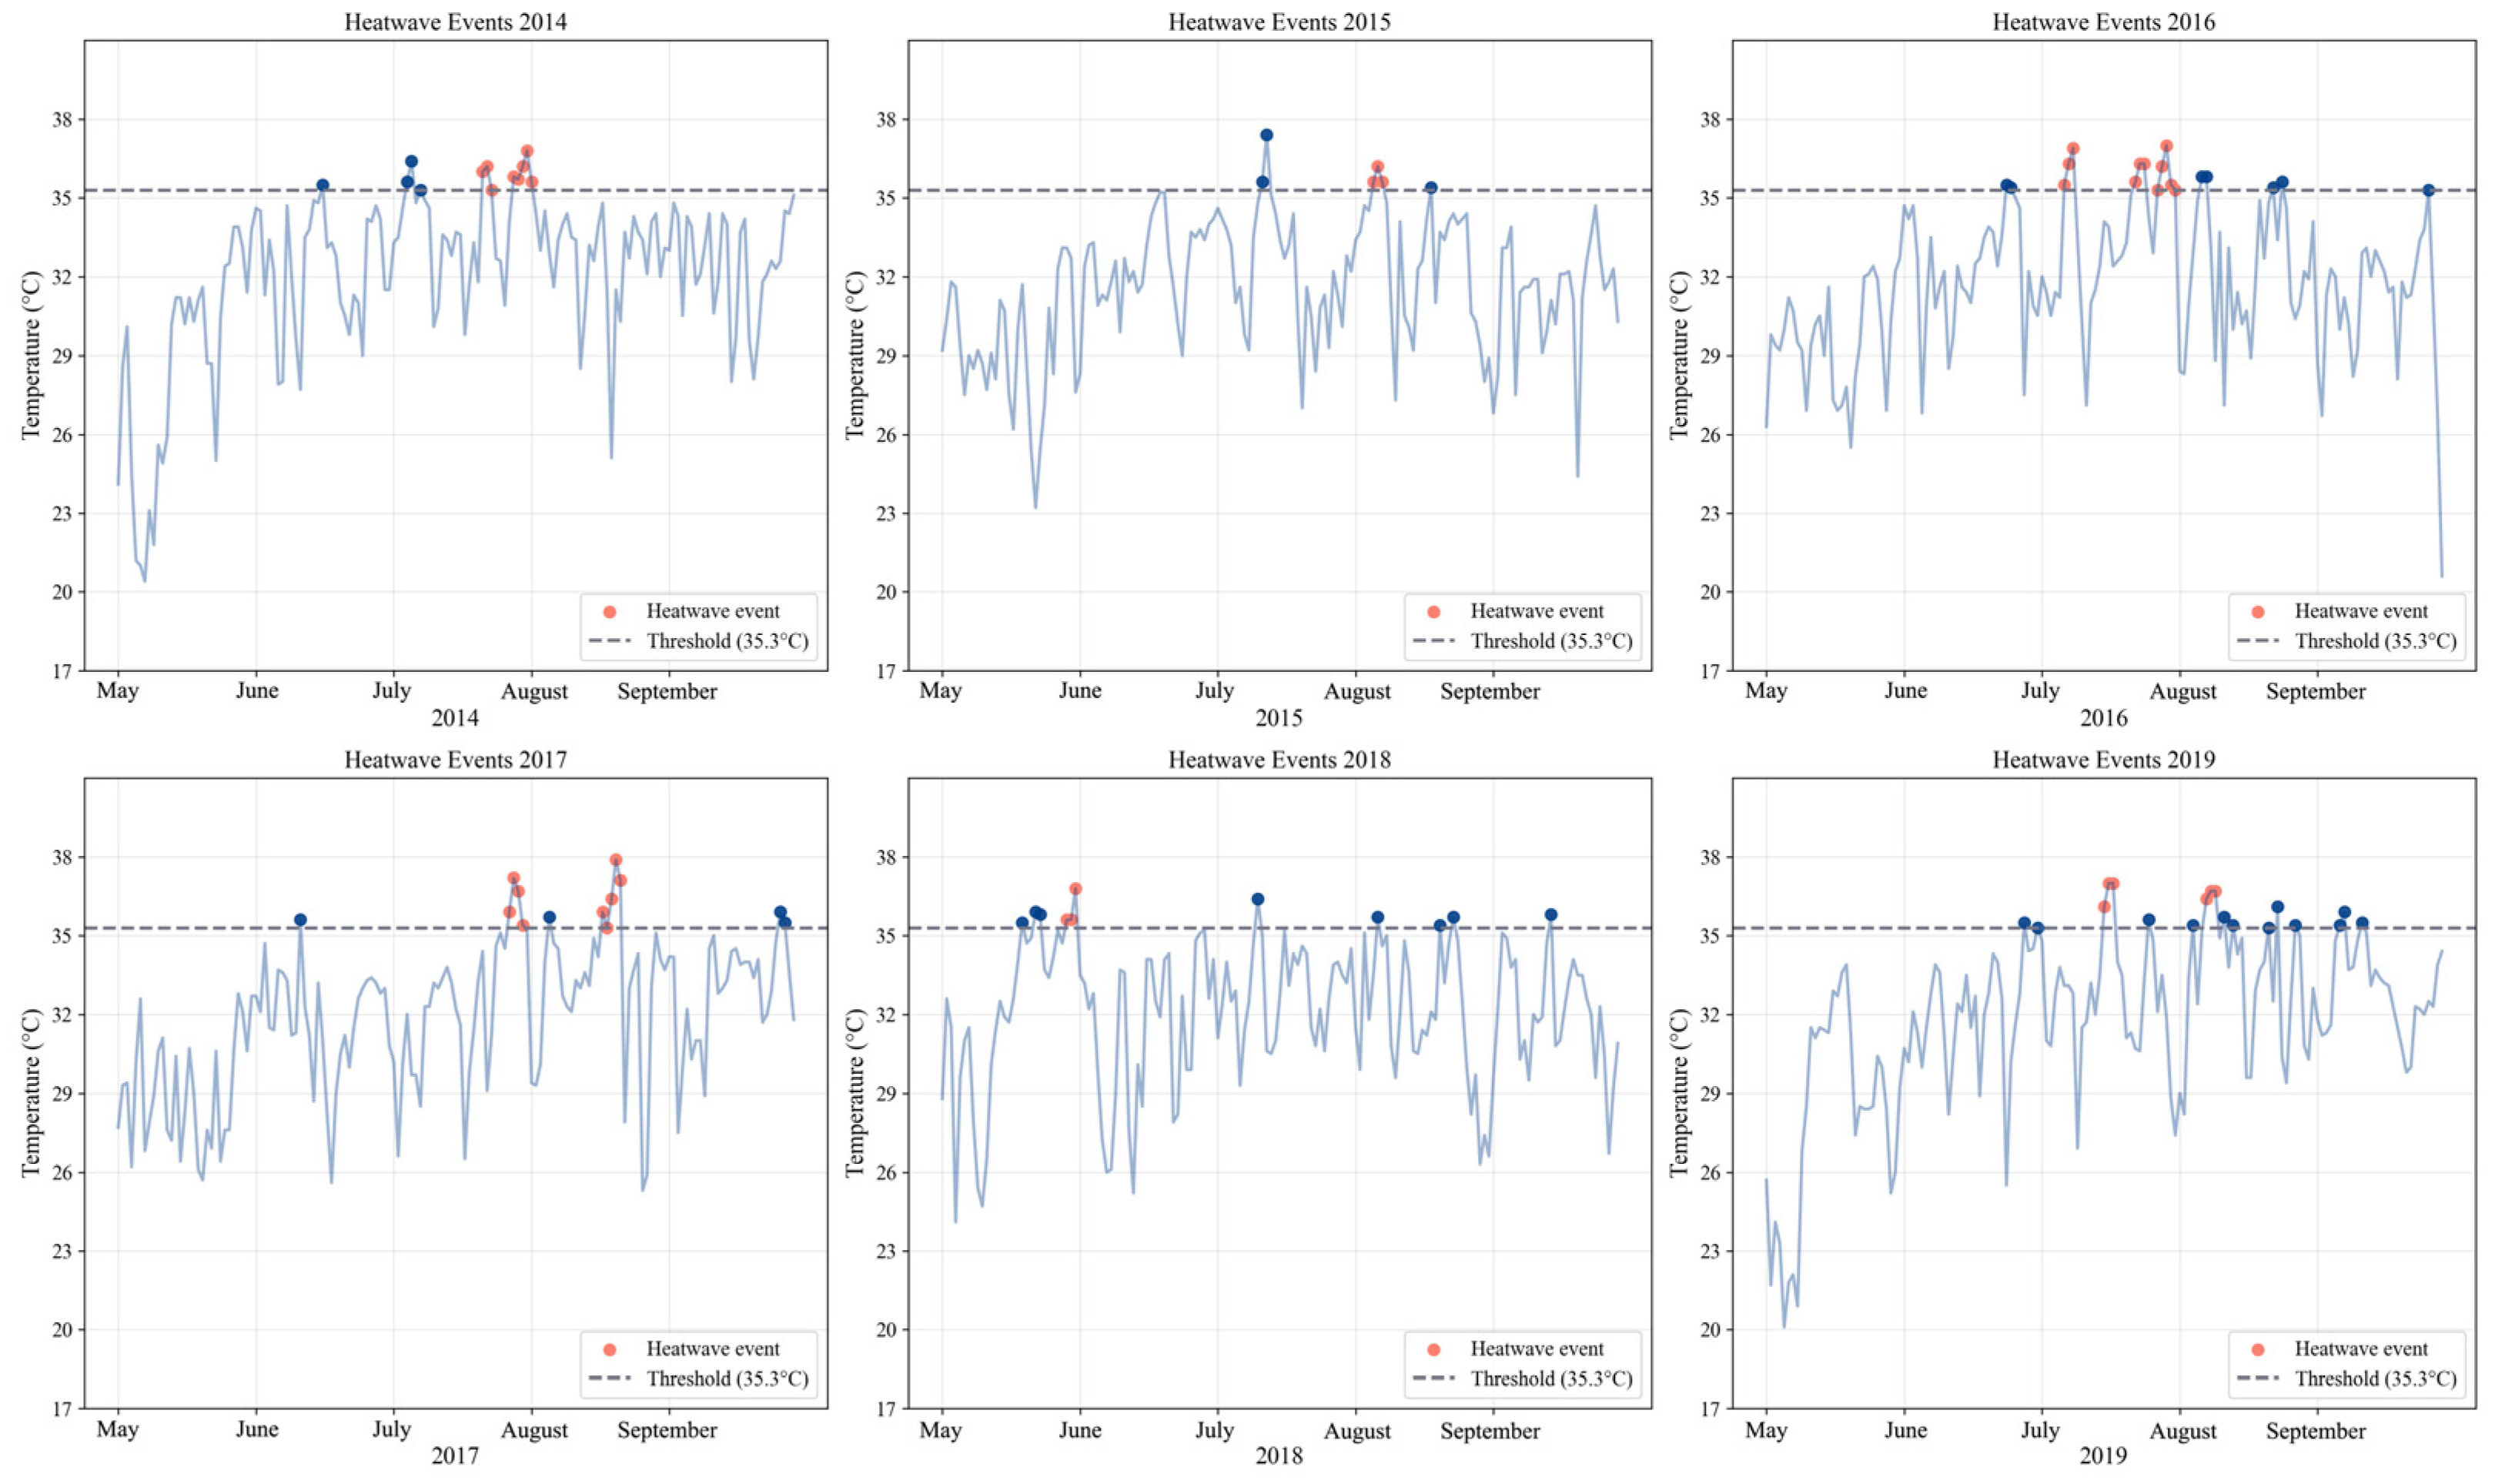
Based on the analysis on the maximum daily temperature in
Figure 3, between 2014 and 2019, a total of 11 heat wave events were detected. The specific start and end dates are provided in
Table 4 below. In the table, the heat wave duration (HWD) and heat wave intensity (HWI) are used to describe the number of consecutive days of the heat wave and its intensity, respectively. HWI is defined as the sum of the daily maximum temperatures during the heat wave. The most severe heat wave event for each year was selected for subsequent building performance simulations, and these entries are highlighted in bold in the table. The most intense heat wave events occurred in 2014 and 2017, with HWI values of 180.1 °C and 182.6 °C, respectively.
Additionally, most heat waves occurred in July and August, consistent with the peak summer season in Guangzhou. The comparison of years reveals variability in both the frequency and intensity of heat waves. For example, while 2014 and 2017 recorded the most intense heat waves, 2016 and 2018 experienced fewer and less severe events. This figure also demonstrates the daily temperature fluctuations during heat waves, with maximum temperatures frequently exceeding the 35 °C threshold. Such patterns emphasize the significant impact of heat waves on cooling energy demands in the residential sector, particularly in subtropical regions like Guangzhou. The detailed identification of heat wave events enables a more precise evaluation of their implications for urban energy consumption and public health.
Table 5 shows the average outdoor temperatures in suburban and urban areas during heat waves. An observation from the table is the relatively stable pattern of UHI intensity across the years, with urban areas consistently showing elevated temperatures compared to suburban areas. The temperature difference is typically around 2 °C, and can exceed 3 °C in some cases. For example, during the heat wave in 2017, the average temperature at the suburban weather station was 29.9 °C, while the temperatures in LCZ 3 and LCZ 21 reached 33.3 °C, a difference of 3.4 °C. This temperature variation cannot be overlooked when assessing urban environments and building energy consumption.
The intensity of the Urban Heat Island effect varies across different LCZs. LCZ 2.1 exhibits the most severe UHI effect, with the highest average temperature among all zones. In contrast, LCZ 1 and LCZ 1.8 experience relatively mild heat island effects, with the lowest average temperatures. The temperature difference between these areas and LCZ 2.1 can exceed 0.5 °C. These findings reinforce the importance of incorporating LCZ classification into urban climate studies, as it enables a nuanced understanding of how urban design influences temperature patterns.
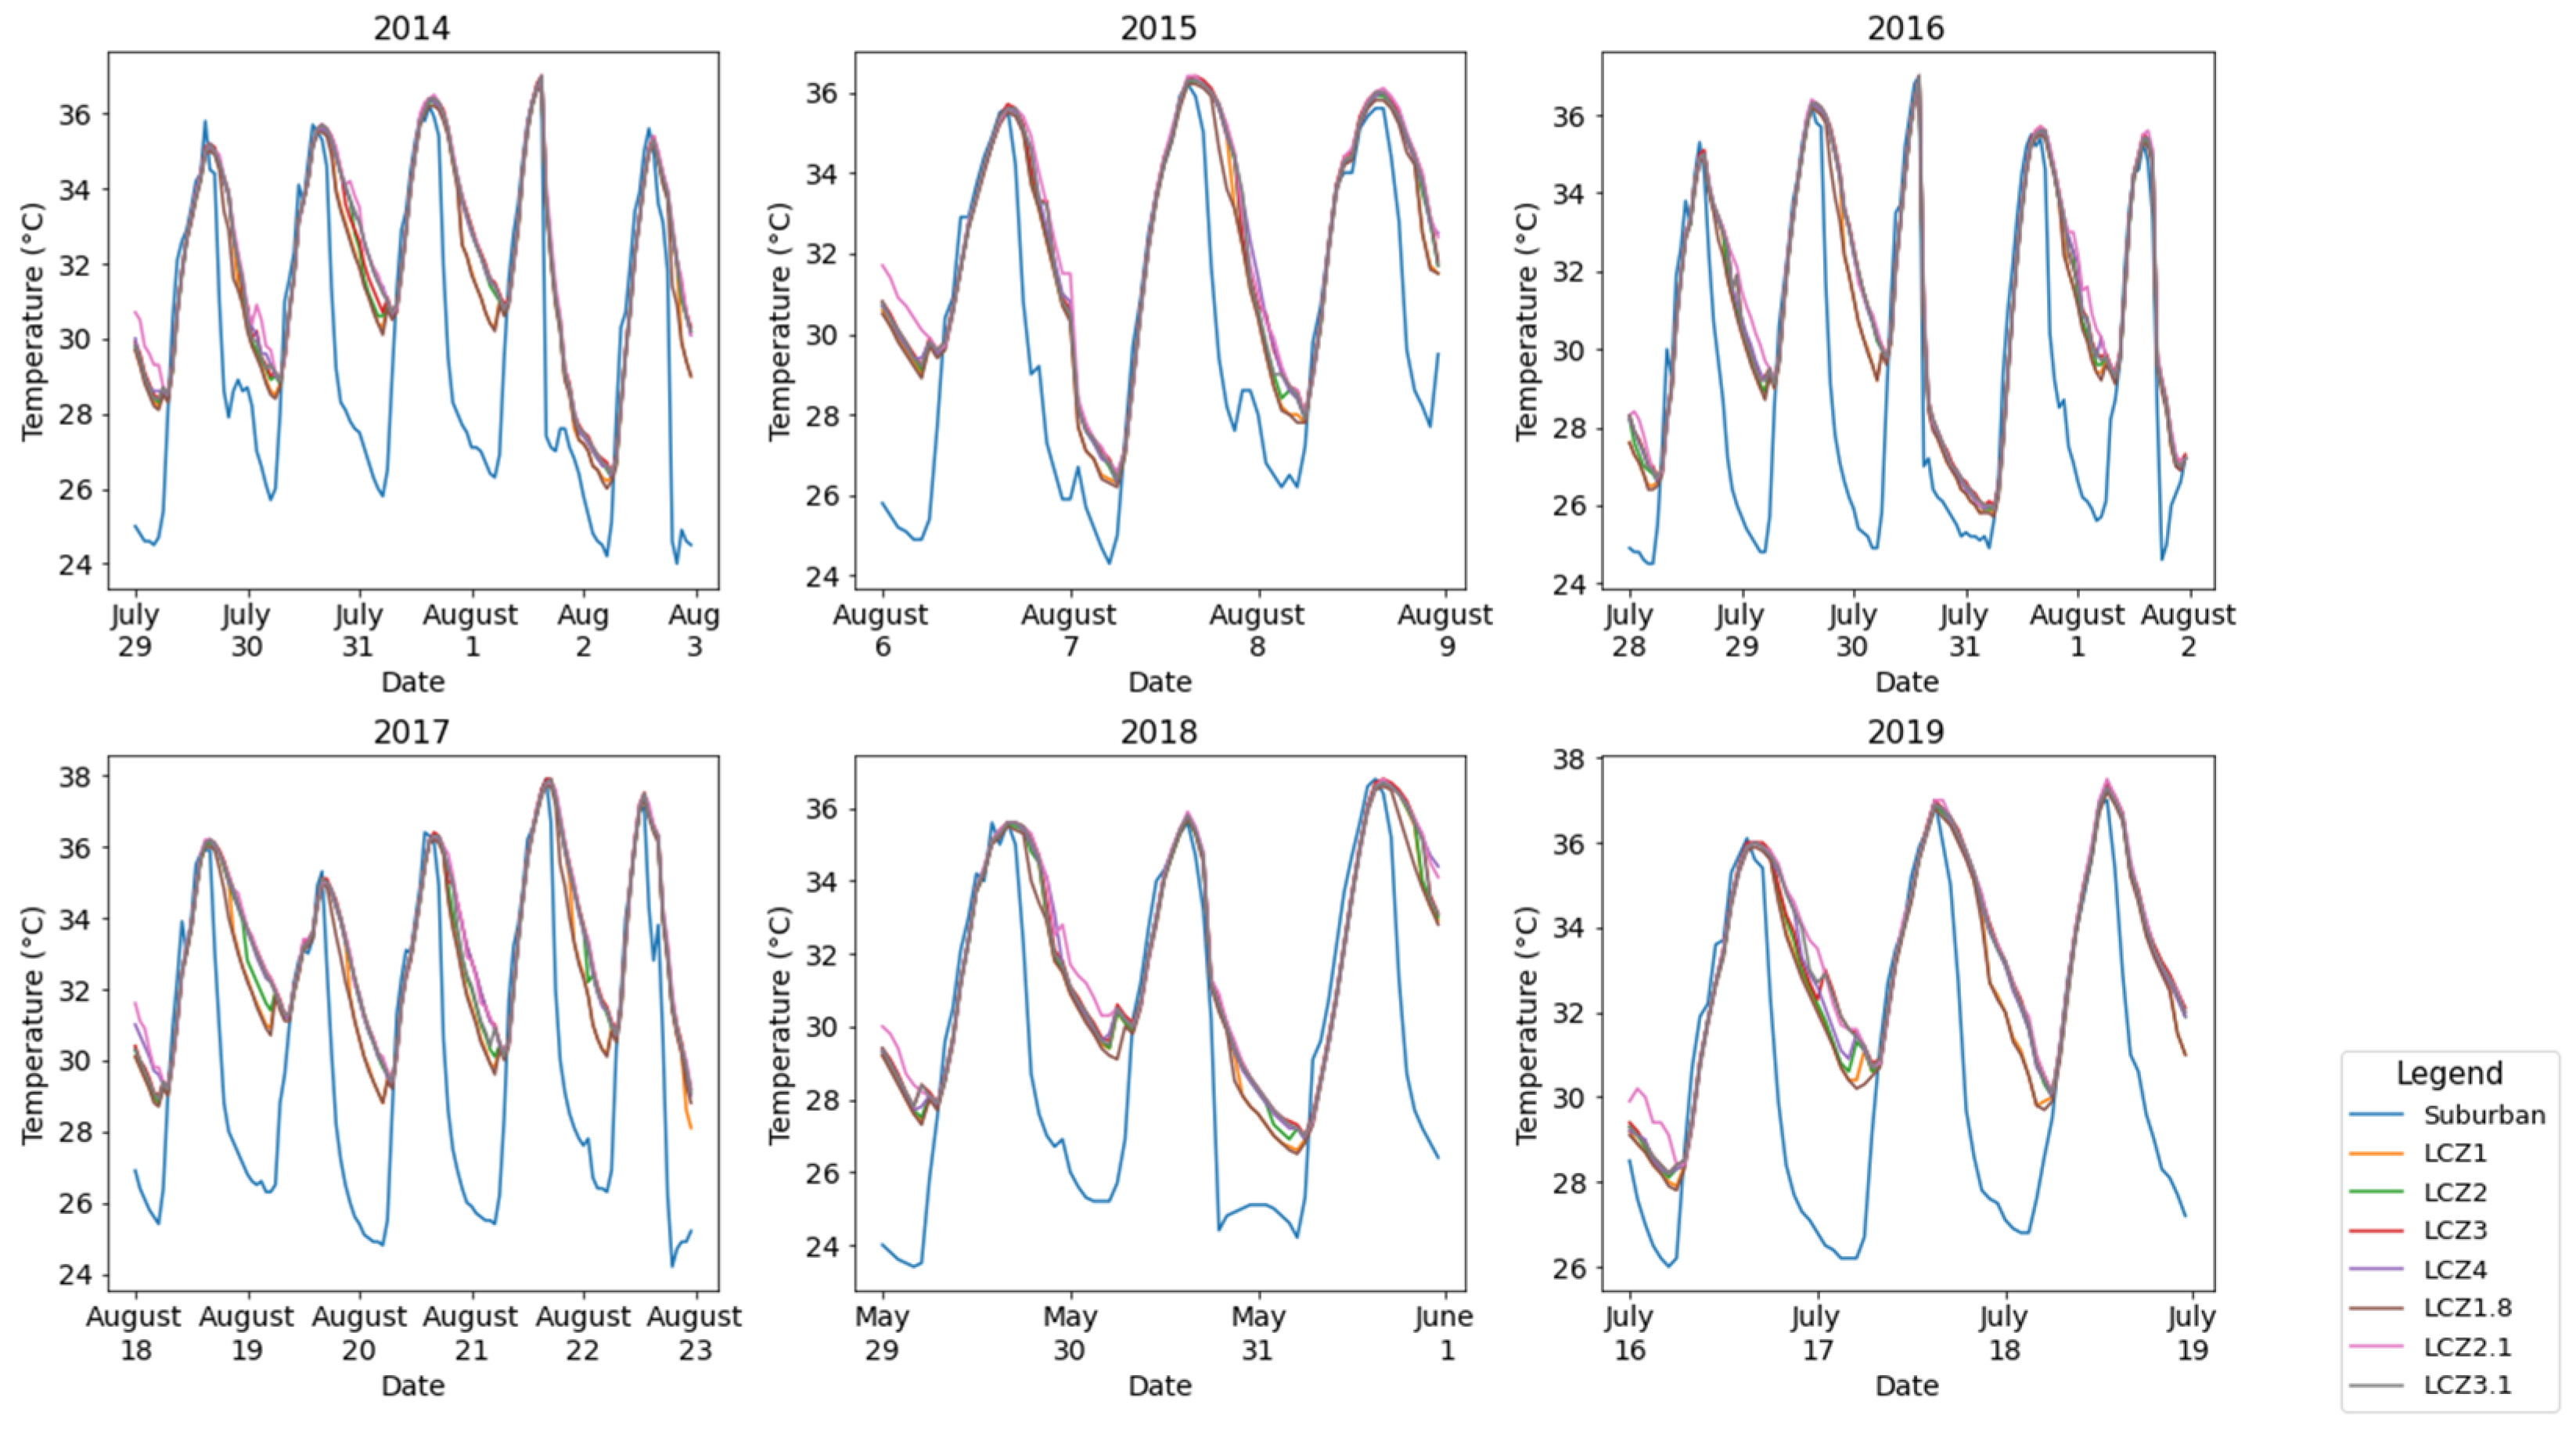
Figure 4 compares the hourly temperatures during the heat wave between the suburban weather station and various LCZs. The daily temperature fluctuates periodically. A notable feature is the heightened UHI effect during the nighttime. In suburban areas, temperatures drop rapidly in the afternoon, while in LCZs, the cooling process is delayed, resulting in nighttime temperatures up to 5 °C higher. This difference highlights the importance of considering the UHI effect in urban energy assessments, particularly for residential buildings, which see their peak usage at night. Using suburban weather data alone may significantly underestimate the nighttime energy demand in urban areas. The variability among LCZs further underscores the need for localized weather data to accurately evaluate cooling energy consumption during heat waves.
3.2. The Cooling Demand of the Residential Building During a Heat Wave
In general, two types of indicators in building energy consumption are important to consider: those that depict the average energy demand and those that represent the peak energy demand.
Figure 5 shows both the average and peak cooling demand of residential units during heat waves with UHI effects. The variation trends of the average hourly cooling demand and peak hourly cooling demand are similar.
However, significant differences are observed among residential units with similar numbers of rooms. For instance, the cooling demands of R1-2 and R4-1 are substantially higher than those of R1-1 and R4-2, respectively. Even for the same residential unit, uncertainties in climate conditions, envelope thermal performance, and the UHI effect can lead to considerable variations in the cooling demand. For example, the upper and lower limits of the average hourly cooling demand for R2-1 are about 0.62 kWh and 0.25 kWh, respectively, while the peak average hourly cooling demand for the same unit ranges from 1.1 kWh to 0.4 kWh. The upper limits are more than twice as high as the lower limits. Significant variations are also observed in the cooling demand of R4-1 and R4-2.
The differences in cooling demand variations across residential units are striking. In some units, the cooling demand is more sensitive to uncertainty factors. For example, for units with two rooms, the variation in cooling demand is smaller in R2-2 than in R2-1. In both units, the lower limit and lower quartile are very similar. However, the median, upper quartile, and upper limit of R2-1 are significantly higher than those of R2-2. Additionally, it appears that the impact of floor plan characteristics is not always the same on the average and peak hourly cooling demand. While the average hourly cooling demand of R3-1 is slightly higher than that of R2-2, the situation is reversed when considering the peak hourly cooling demand.
Overall, the results highlight the importance of considering floor plan characteristics when evaluating the cooling demand of residential buildings in order to obtain accurate predictions.
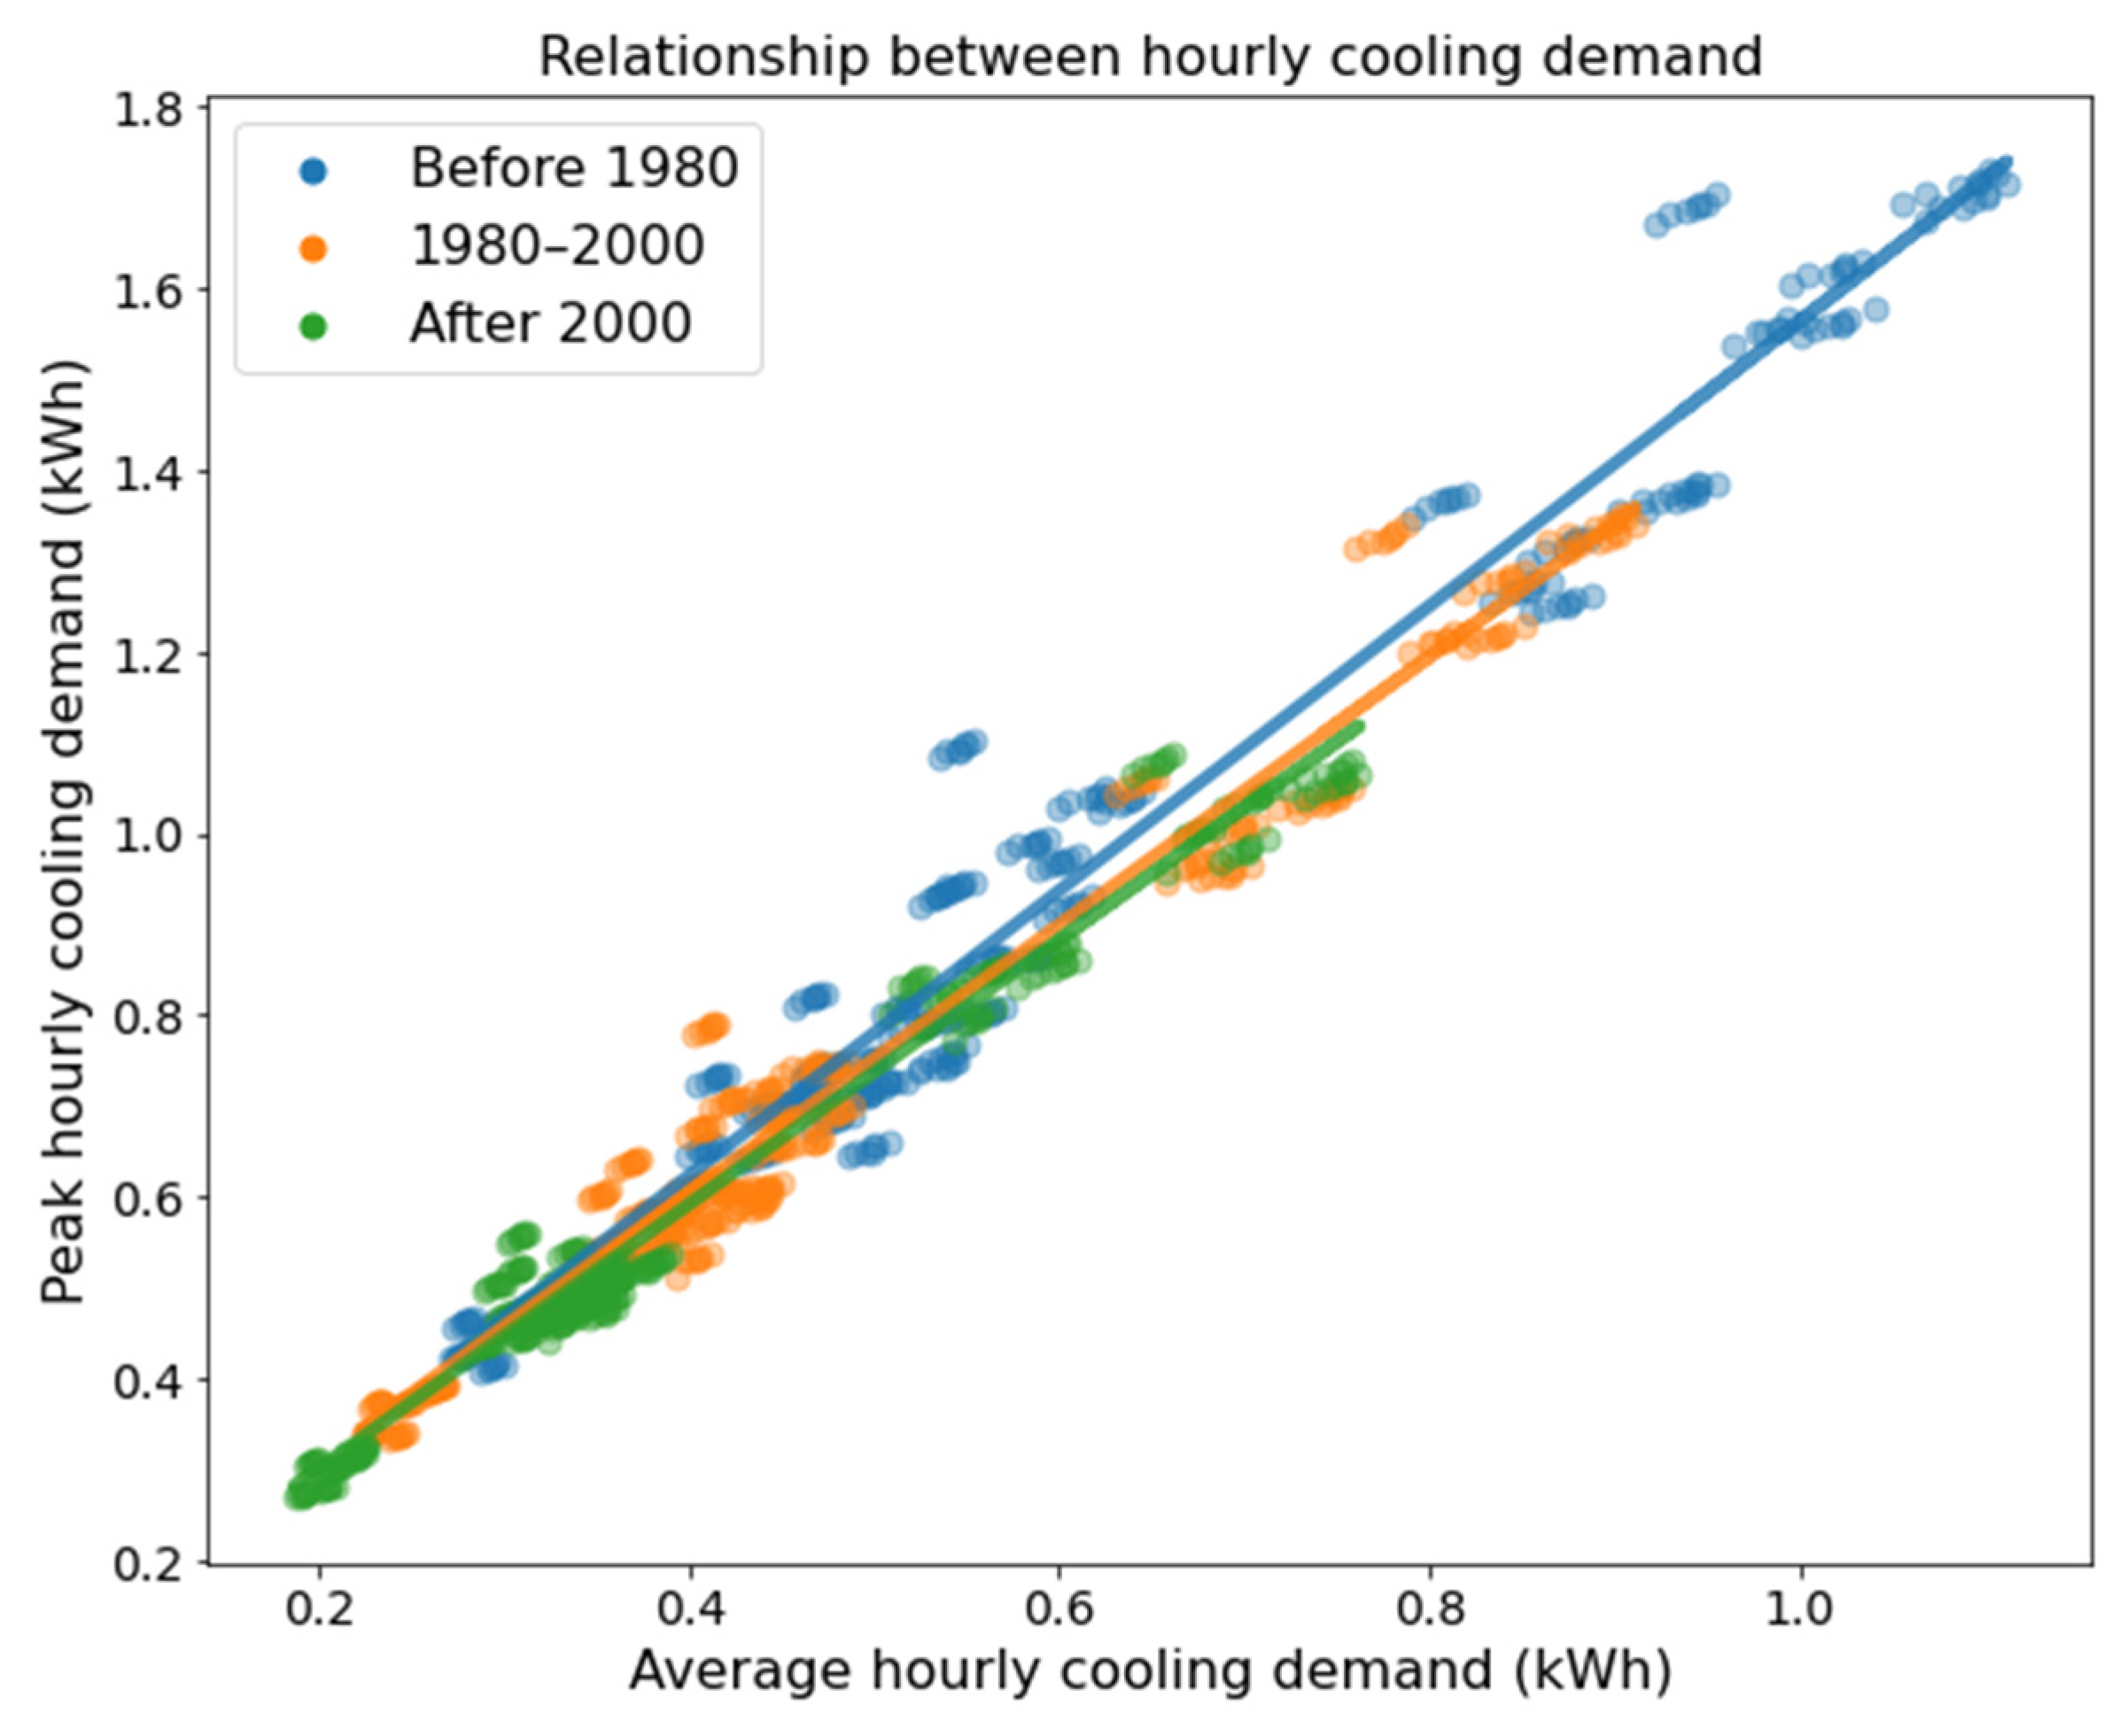
To analyze the impact of envelope thermal performance on the variation trends of the cooling demand, the relationship between the average hourly cooling demand and peak hourly cooling demand is illustrated in
Figure 6. Each point on the graph represents a residential unit’s record during a specific heat wave. Buildings constructed within the same period, and thus with a similar thermal performance of the building envelope, are grouped together for comparison.
As the thermal performance of the envelope improves, both the cooling demand and its variation significantly decrease. This indicates that enhancing the thermal performance of the building envelope not only reduces energy consumption but also increases the stability of the cooling demand. By comparing the slopes of the fitted lines, it becomes evident that the steepest slope occurs when the thermal performance is the lowest. This suggests that the peak cooling demand is more sensitive to changes in envelope thermal performance than the average cooling demand.
Furthermore, the clustering of data points for buildings constructed after 2000 demonstrates a tighter relationship, indicating improved thermal efficiency and better alignment between cooling demand components. Conversely, older buildings exhibit greater dispersion, suggesting inconsistencies in energy performance and heightened reliance on peak energy loads. These results underscore the necessity of prioritizing envelope retrofits in aging residential communities to reduce energy demand variability and ensure a reliable energy supply during extreme heat events.
3.3. UHI Effects on the Residential Building Cooling Demand
Figure 7 presents the relative error in the average and peak hourly cooling demand. For the average cooling demand, the underestimation ranges from 0.14 to 0.22 when UHI effects are ignored. LCZ 2.1, which consists of compact mid-rise and high-rise buildings, experiences the most intense UHI effect. As a result, the cooling demand for all types of residential units in this zone is more than 20% higher compared to results based on suburban weather data. LCZ 1.8, which has the mildest UHI effect, still shows a relative error of 0.14 or higher. Among the residential units, R2-0 is the most affected by the urban climate, as its cooling demand increases the most when UHI effects are considered. Even in LCZ 1.8, the relative error for the cooling demand remains above 0.17.
For the peak hourly cooling load, the relative errors are less significant. Since the highest temperatures and peak cooling loads occur during the daytime, and the UHI effect is more pronounced at night, the daytime cooling demand is less influenced by UHI. However, unit R3-1 shows the highest sensitivity, with relative errors ranging from 0.08 to 0.12. These findings indicate that while the average cooling demand is significantly underestimated without accounting for UHI effects, the impact on peak demand is more variable and depends on the residential unit and LCZ characteristics. This emphasizes the necessity of incorporating UHI effects in energy simulations.
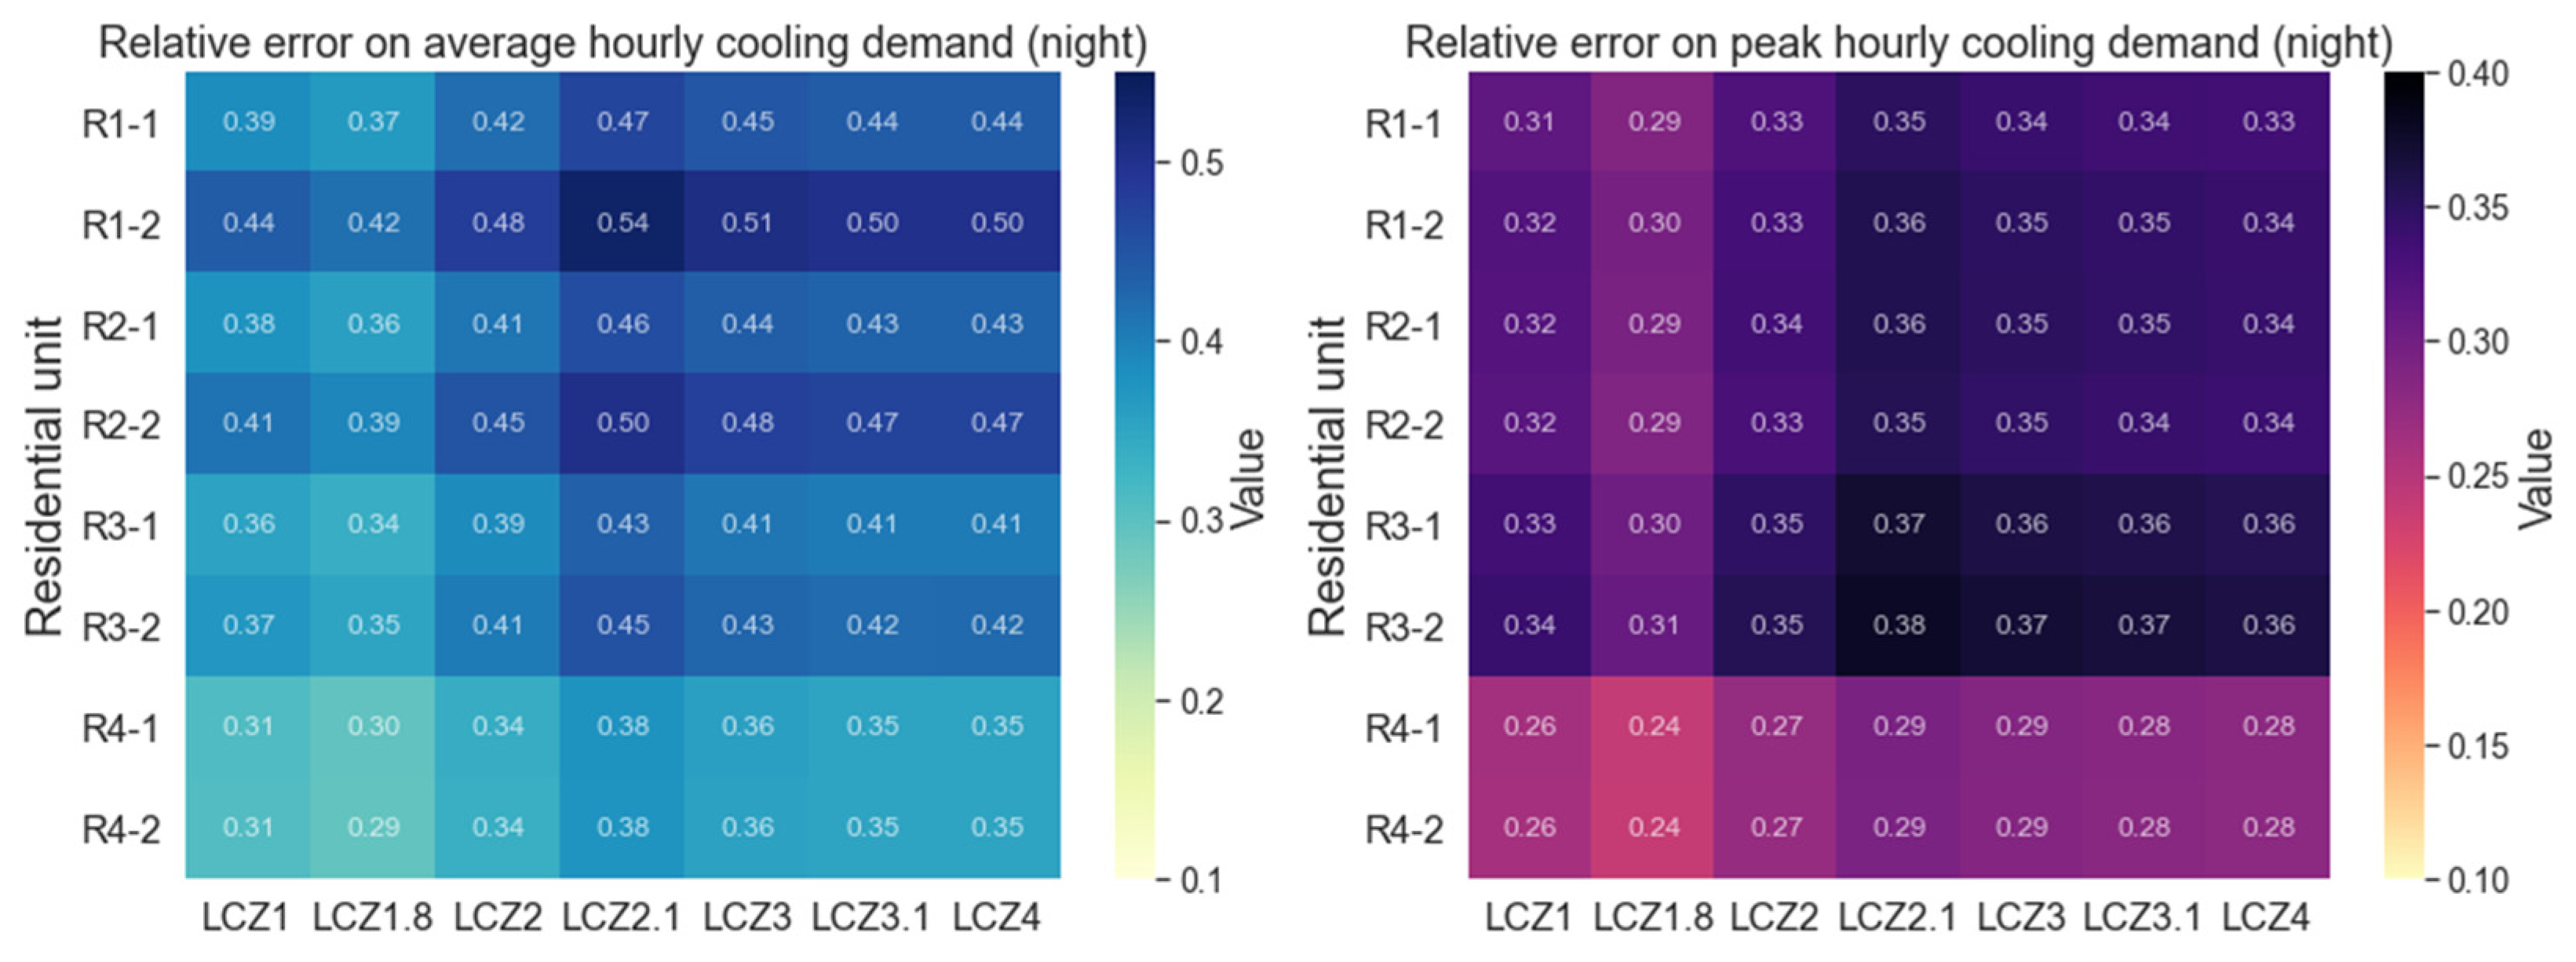
Considering the tremendous impact of UHI at night, it is necessary to explore how much influence UHI has on the residential cooling demand during nighttime. Therefore, hourly cooling demands between 7 p.m. and 7 a.m. are extracted to analyze the relative error without considering the UHI effect.
Figure 8 gives both the average and peak relative error results on the hourly cooling demand.
When considering only the nighttime period, the impact of the UHI effect on the residential cooling demand is substantial. Even in the LCZ 1.8 area, where the UHI effect is relatively weak, neglecting the UHI effect results in a relative error of 0.29 at a minimum. In LCZ 2.1, where the UHI effect is strongest, the cooling demand for apartment types R1-2, R2-2, and R3-2 is higher by 0.54, 0.50, and 0.45, respectively, compared to values obtained using suburban meteorological data. The relative error varies significantly across different apartment types within the same LCZ, especially in areas with high UHI intensity. For example, in LCZ 2.1, the relative error difference between apartment types R1-2 and R4-2 reaches 0.16, highlighting the sensitivity of the energy demand to both building design and location within the urban environment. In other LCZs, the smallest relative error difference between these two apartments is 0.13, observed in LCZ 1.8. This underscores the necessity of considering the uncertainty of building characteristics when assessing residential energy consumption in specific regions.
The relative error in the nighttime peak cooling demand is similarly significant, though slightly lower in value compared to the average cooling demand. The urban residential nighttime peak cooling demand is 1.24 to 1.38 times higher than that of suburban residences. The three-bedroom apartment type shows the highest relative error, ranging from 0.30 to 0.38. LCZ 2.1 remains the area with the highest relative error. Apart from LCZ 1 and LCZ 1.8, the relative error in other LCZs is relatively close to that of LCZ 2.1. These results suggest that the nighttime energy demand in urban areas is strongly influenced by UHI intensity, reinforcing the need for urban-specific meteorological datasets in energy models. In summary, the use of standard meteorological data derived from the dataset collected by suburban weather stations, such as TMY, tends to significantly underestimate both the total residential cooling energy consumption and peak energy demand during the nighttime in urban environments in hot and humid regions.
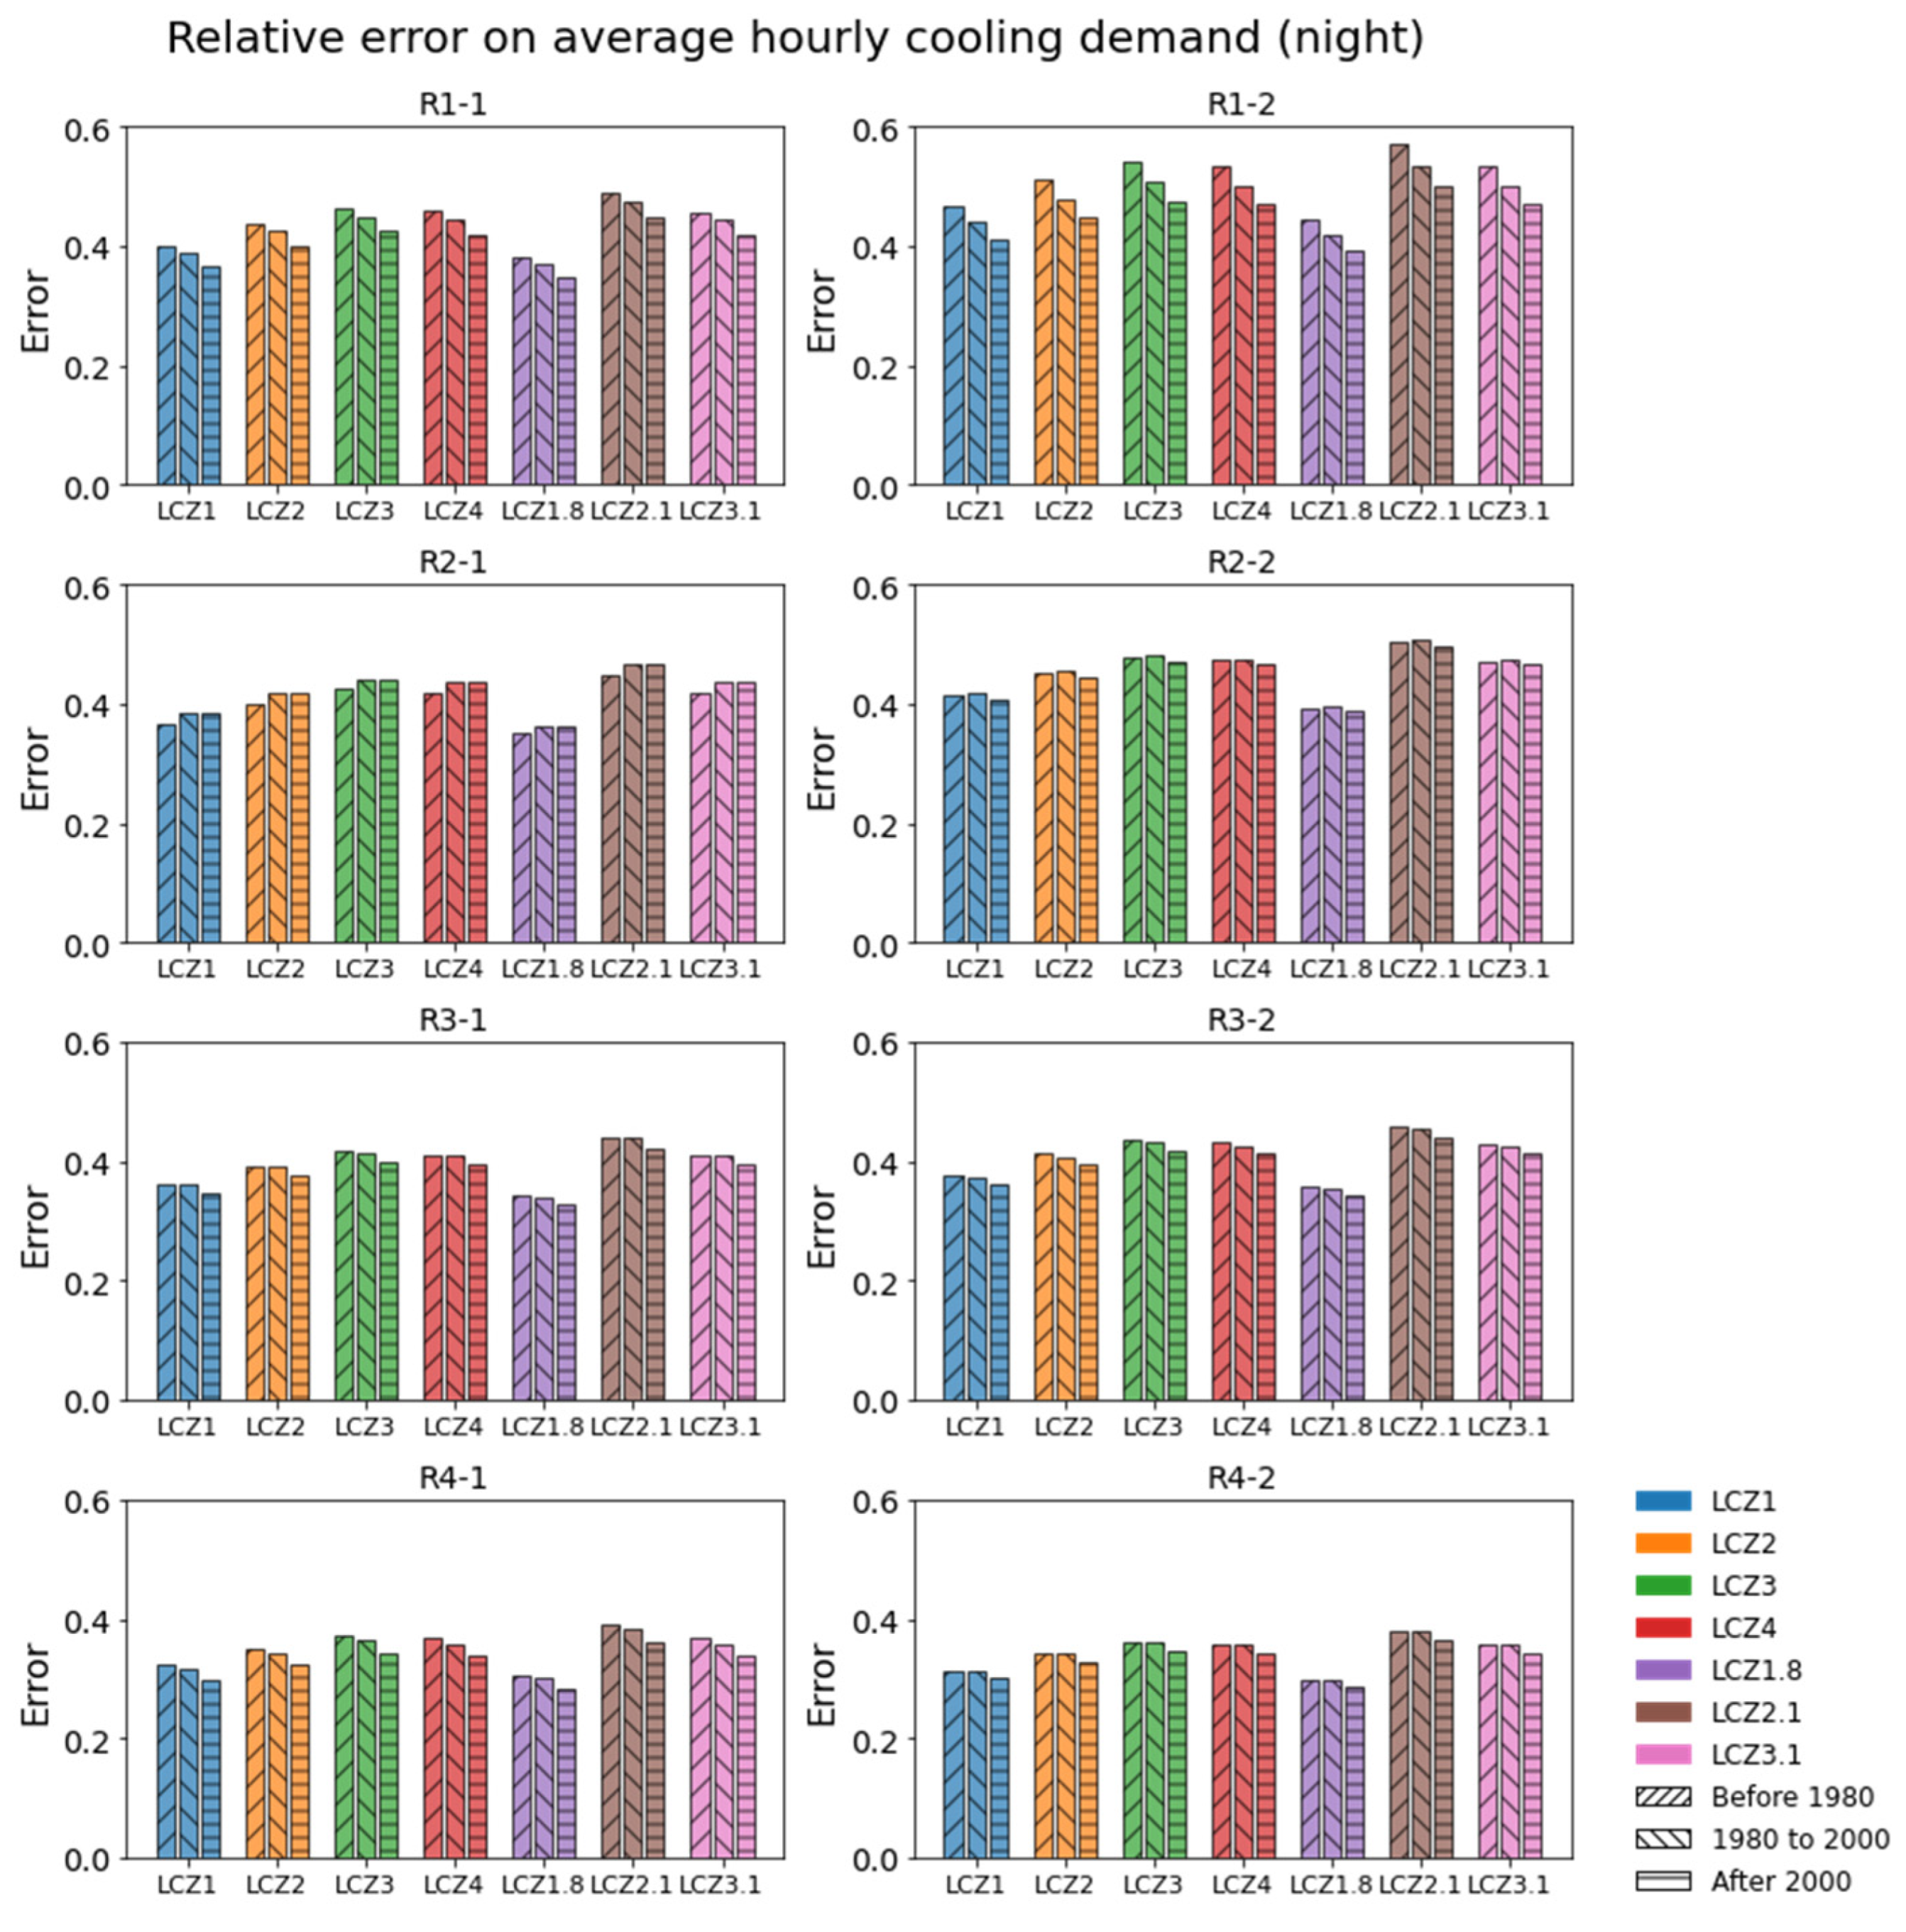
The impact of different thermal performances of building envelopes on the relative error in the nighttime cooling demand when ignoring the UHI effect has been analyzed.
Figure 9 and
Figure 10 illustrate the influence of various envelope thermal properties on the relative error in both average and peak nighttime cooling demand, respectively. For apartment types R1-1, R1-2, R3-1, R3-2, R4-1, and R4-2, as the thermal performance of the building envelope improves, the relative error in the cooling demand estimation caused by neglecting the UHI effect gradually decreases. This trend is particularly pronounced in the R1-1 and R1-2 apartment types. In the R2-2 apartment type, the relative error remains relatively consistent across different envelope thermal properties. However, in the R2-1 apartment type, increasing the thermal performance of the envelope leads to a slight increase in the relative error.
In terms of the relative error in the peak cooling demand, the overall trend mirrors that of the average cooling demand. While the numerical values of the relative error in the peak cooling demand are typically lower than those for the average cooling demand, the differences between them can be more pronounced. For example, the relative error for the peak cooling demand in R3-2 shows a marked decline for buildings constructed after 2000, while the corresponding average cooling demand remains nearly unchanged. Similarly, in the case R4-2, the relative error in the average cooling demand due to ignoring the UHI effect is almost identical for buildings constructed before 1980 and those built between 1980 and 2000. However, for the peak cooling demand, a noticeable discrepancy exists. These findings suggest that while improvements in envelope thermal performance can mitigate the underestimation of the cooling demand caused by ignoring UHI effects, they may not equally affect the average and peak cooling demand predictions. Overall, although the impact of building types varies, the findings highlight the vulnerability of residential buildings with poor envelope thermal performance in the cooling demand estimation.
4. Discussion
Building performance simulations, particularly those assessing the energy demand, are essential tools for understanding how buildings interact with their environment under varying climatic conditions [
48]. However, one critical factor often overlooked in such simulations is the integration of accurate localized meteorological data. This is especially important in hot-humid regions, where the dynamic interplay between climate, urban morphology, and building performance can significantly influence energy consumption patterns [
49]. Traditional simulation methods typically rely on generalized or average weather data, which fail to capture the spatial and temporal variability of climate factors, such as UHI effects. This effect is particularly pronounced in hot-humid climates, where the excessive heat accumulates during the day and continues to increase the cooling demands into the night. By incorporating site-specific, high-resolution meteorological data into building performance models, simulations can more accurately reflect real-world energy use, improving the reliability of energy consumption predictions and informing more effective energy management strategies.
The integration of localized climatic data is not only critical for more realistic building simulations, but also for the development of effective climate change mitigation strategies. In densely populated regions, particularly those affected by Urban Heat Islands, the elevated outdoor temperatures—especially during heat waves or at night—exacerbate cooling demands and place significant strain on the energy grid. In these areas, accurate modeling that accounts for localized UHI effects is crucial to predict energy consumption patterns more accurately. Without incorporating these variations, energy system designs and forecasts risk underestimating the actual demand, leading to an overestimated grid capacity and poorly planned energy systems. Therefore, integrating high-resolution meteorological data into building performance models enhances the accuracy of energy demand forecasts and helps optimize cooling system designs, energy use strategies, and grid management.
Accurately assessing nighttime energy consumption, particularly in hot-humid regions, is crucial for designing resilient urban energy systems. During heat waves or prolonged high-temperature periods, UHI-induced increases in nighttime temperatures [
50] significantly impact residential buildings, which are particularly vulnerable to the rising cooling demands after sunset. This study identifies several key factors influencing nighttime energy consumption, including the thermal performance of building envelopes, indoor heat loads, occupancy rates, and variations in urban form and vegetation cover across LCZs. Notably, residential buildings experience their highest occupancy rates during nighttime, as most individuals return home after their daytime activities. This concentrated occupancy further intensifies the cooling energy demands and exacerbates the bias in energy consumption estimates when UHI effects are not accounted for.
Additionally, under air-conditioning operation, the typically higher outdoor temperatures compared to indoor settings create a significant thermal gradient across the building envelope. Poor envelope thermal performance, characterized by low insulation and high thermal transmittance, leads to increased heat transfer from the outdoors to the indoors. As a result, air conditioning systems must consume more energy to transport this excess heat out of the building to maintain indoor thermal comfort. Buildings with poor envelope performance or high internal heat loads are thus particularly sensitive to UHI effects, aggravating the nighttime cooling demands. The spatial distribution of LCZs demonstrates that densely built areas with limited vegetation contribute to higher nighttime temperatures, further driving cooling energy needs. Traditional models that rely on generalized suburban meteorological data fail to account for these factors, often leading to significant underestimations of the actual energy consumption. This underestimation can have far-reaching consequences, particularly when designing grid systems and peak load strategies. As energy demands increase, it is vital to accurately predict nighttime cooling needs to ensure sufficient grid capacity and avoid overloading [
51]. Moreover, precise predictions of nighttime energy consumption can enable the development of flexible energy use strategies, such as demand response systems, that help alleviate peak loads and reduce strain on urban power grids.
Although the LCZ classification provides a robust framework for understanding urban climates, we recognize that variations in LCZ methods and data accuracy can influence predictions of the energy demand, particularly in rapidly evolving urban environments. In regions experiencing significant urbanization or land-use changes, the characteristics of LCZs may shift over time, potentially reducing the precision of simulations. To address this, we acknowledge the need for periodic updates to LCZ data in such dynamic areas to maintain the accuracy of our simulations. Despite these challenges, the integration of LCZs with the UWG model remains a valuable tool for capturing localized climate effects and their impact on the energy demand. While the accuracy of LCZ-based simulations is influenced by the quality of input data, the UWG model has been extensively validated in a variety of regions, including Guangzhou. However, uncertainties in the input data, such as variations in land cover and urban morphology, can introduce some variability in the result.
While this study offers valuable insights into the impact of UHI on the residential cooling demand, several limitations must be acknowledged. One primary limitation is the relatively narrow scope of LCZs used, which may not fully capture the wide diversity of urban environments across different regions, particularly in hot-humid areas. Future research should expand the LCZ classifications to encompass a broader range of urban settings, including those affected by varying degrees of UHI, and incorporate more diverse datasets that also consider other environmental factors such as noise and air quality. Additionally, while the study emphasizes the importance of thermal envelope performance in mitigating cooling demands, future work could explore passive cooling strategies and alternative building materials designed to reduce UHI effects.
Furthermore, the growing availability of big data and advancements in artificial intelligence (AI) present opportunities to enhance cooling energy consumption forecasting models. AI-based techniques, such as machine learning and neural networks, could be employed to analyze large-scale datasets and identify complex patterns in energy consumption influenced by UHI, building design, and occupant behavior. Future research could focus on integrating these technologies with LCZ-based models to improve predictive accuracy and provide actionable insights for urban planners and policymakers.
Another limitation is the lack of formal sensitivity analysis or statistical modeling to quantify the relative influence of uncertainties in climatic conditions, building envelope performance, building orientation, surrounding environment, and UHI effects. These uncertainties can significantly affect the variability in the cooling demand, but without a detailed analytical framework, the precise impact of each factor remains unclear. Future research could address this gap by incorporating sensitivity analyses or modeling approaches, such as Monte Carlo simulations or uncertainty propagation methods, to better understand the relative contribution of these factors to cooling demand variations. Furthermore, further research could investigate how socio-economic factors intersect with energy consumption patterns, providing a more comprehensive understanding of how energy efficiency, UHI, and urban vulnerability relate in specific urban contexts.
Directly related to the practical application of these findings in urban planning is the challenge of data availability, particularly the scarcity of high-resolution meteorological data in many hot-humid regions. To facilitate implementation despite these challenges, we propose several strategies: utilizing downscaling or interpolation techniques for generating finer-scale meteorological data; integrating our approach with existing urban climate models like UWG; investing in local monitoring networks and accessible databases; and developing simplified UHI assessment tools for planners. Future research should also focus on developing specific policy guidance, such as evaluating the cost-effectiveness of UHI mitigation strategies for urban planners.


