Article

Evaluation of Phase Change Materials for Pre-Cooling of Supply Air into Air Conditioning Systems in Extremely Hot Climates

1
Electrical and Communication Engineering Department, United Arab Emirates University, Al Ain P.O. Box 15551, United Arab Emirates
2
Architectural Engineering Department, United Arab Emirates University, Al Ain P.O. Box 15551, United Arab Emirates
*
Author to whom correspondence should be addressed.
Buildings 2024, 14(1), 95; https://doi.org/10.3390/buildings14010095
Submission received: 7 November 2023 / Revised: 20 December 2023 / Accepted: 28 December 2023 / Published: 29 December 2023
(This article belongs to the Special Issue Building Energy-Saving Technology—2nd Edition)

Abstract

:
This research investigates the use of phase change materials (PCMs) in thermal energy storage (TES) unit-based cooling systems to increase the efficiency of air conditioners (ACs) by reducing the air inlet temperature. This study aims to evaluate different configurations of PCM enclosures, and different PCMs (paraffin and salt hydrate), by changing the speed of inlet air to achieve heat reduction of inlet air. The study includes experimental and simulation investigations. Every configuration simulates the hot-season atmospheric conditions of the UAE. A duct containing enclosures of paraffin RT-31 and salt hydrate (calcium chloride hexahydrate) was used for the simulation study using ANSYS/Fluent. A conjugate heat transfer model employing an enthalpy-based formulation is developed to predict the optimized PCM number of series and optimum airflow rate. Four designs of the AC duct were modelled and evaluated that contained one to four series of PCM containers subjected to different levels of supplied air velocities ranging from 1 m/s–4 m/s. The simulation study revealed that employing four series (Design 4) of PCM enclosures at a low air velocity of 1 m/s enhanced the pre-cooling performance and reduced the outlet air temperature to 33 °C, yielding a temperature drop up to 13 °C. The performance of salt hydrate (calcium chloride hexahydrate) was observed to be better than paraffin (RT-31) in terms of the cooling effect. Characterization of paraffin wax (RT-31) and salt hydrate was performed to establish the thermophysical properties. The experimental setup based on a duct with integrated PCM enclosures was studied. The experiment was repeated for three days as the repeatability test incorporating RT-31 as the PCM and a 3 °C maximum temperature drop was observed. The drop in the outlet air temperature of the duct system quantifies the cooling effect. Net heat reduction was around 16%.

1. Introduction

A massive CO2 emission of 37 gigatons was reported by the IEA for the year 2019. A similar emission was reported in the year 2020. These emissions highlight the need to find innovative solutions to reduce CO2 emissions and mitigate climate change. Gagliano et al. [1] projected that the total cooled floor area in European countries would reach 2 billion square meters in 2020, up from 1000 million square meters in 2012. This would require more than 100 terawatt-hours (TWh) of energy per year for building cooling alone. The building sector in Europe is a major energy consumer (40% of total energy) and emitter of greenhouse gases. The demand for cooling in buildings is increasing due to rising expectations for indoor thermal comfort levels due to the rise in global temperature. Accounting for an average of 40% of energy use, air conditioners are the single largest consumer of energy in buildings. As a result, reducing global energy consumption may be accomplished with even a small increase in AC performance.
A recent critical review of the strategies needed to achieve zero-energy buildings found that both passive and active strategies are important [2]. The review recommended the use of energy storage, among other solutions. TES can be considered a key technology for promoting the more efficient use of renewable energy sources, which are one of the solutions to reducing cooling load [3]. TES systems can be classified into three types: sensible, latent, and thermochemical. Latent thermal energy storage (LTES) systems, which use PCMs, have several advantages over other types of TES systems (e.g., sensible heat storage). PCMs possess a considerably higher latent heat of fusion than the majority of materials that possess a sensible heat capacity [4]. As a result, LTES systems can store a greater amount of energy in a smaller volume. PCMs can store and transfer heat, making them a promising solution for reducing the gap between energy demand and supply.
PCMs are novel latent heat-based thermal energy storage materials that absorb and release significantly large amounts of thermal energy compared with sensible heat-based energy storage materials that do not undergo a phase change while absorbing thermal energy. The PCMs predominantly employed are solid–liquid based on the phase change mechanism. The solid–liquid PCMs are broadly categorized into paraffin, salt hydrates, eutectic mixtures, and chemical compound allotropes from a materials point of view. Most paraffin and salt hydrates belong to the solid–liquid PCM category. In the current application, paraffin-based and salt hydrate-based solid–liquid phase change materials are deployed owing to their superior thermo-physical properties and abundant cost-effective availability [5].
TES applications using PCMs can be classified into passive and active cooling technologies. Passive cooling technologies rely on the natural heat transfer mechanisms of conduction, convection, and radiation to store and release heat [6]. Active cooling technologies use pumps, fans, or other devices to move heat around, which can make them more efficient but also more complex and expensive. PCMs are used as the thermal mass in passive cooling, which helps to reduce the heat load on air conditioning (AC) systems. In general, PCMs are incorporated within a building’s ceilings, walls, or floors, or they are incorporated in air handlers or heat exchanger units [7,8,9]. The need for air conditioning can be reduced by using PCMs, which absorb heat during the day and release it at night, keeping the building cooler during the day. The incorporation of PCMs in passive cooling and heating systems has been demonstrated to enhance thermal comfort and lower energy demands in buildings, as evidenced by several studies. The night ventilation efficiency of a building was studied numerically by Stritih et al. [10] utilizing a PCM storage chamber located on the roof. Power usage decreased by 14% to 87%, while temperatures dropped by 3 °C. Liu et al. [11] conducted a numerical evaluation to determine the optimal geometries and phase change material (PCM) types for enhancing the thermal efficiency of an air-to-PCM heat exchanger in a ventilation system.
When PCMs are integrated into a thermal management system, the temperature of a room or piece of equipment can be actively controlled by absorbing and releasing heat. The transfer of heat between the PCM and air or fluid for cooling typically involves a heat exchanger or similar device. PCMs are used in traditional HVAC systems, such as air conditioners and heat exchangers, because of their ability to store thermal energy [12,13,14]. The study conducted by Akbari et al. [15] aimed to explore the thermodynamic and economical optimization of an AC unit using several PCMs. Their findings indicate that a higher air temperature difference across the PCM leads to an increased coefficient of performance (COP) and exergy efficiency. Said et al. [16] found that a PCM-based TES improved the performance of an AC unit in both computational and numerical studies. The PCM plates were connected to the AC unit’s condenser and reduced the temperature of the surrounding air together. Nagano et al. [17] investigated the use of a PCM in a floor AC system to improve the building’s thermal energy performance. Their calculations showed that nighttime energy storage could provide cooling for 89% of the building. Hoseini et al. [18] investigated the effects of two hybrid TES systems (ice and PCM) on an air conditioning (AC) system. They found that the PCM and ice TES systems reduced power consumption by 7.58% and 4.59%, respectively, compared with the basic system. Vakilaltojjar and Saman [19] developed three models to assess the impacts of the PCM flat slab thickness and air gaps between slabs on the performance of LTES systems for integration with air conditioning systems. Their results showed that the smallest air gap resulted in the best performance. Mosaffa et al. [20] conducted a detailed exergy analysis of a cooling system that uses LTES and vapor refrigeration. They showed that the irreversibility in the LTES unit is a significant contributor to the total exergy destruction rate. Mosaffa and Farshi [21] conducted energy and cost-benefit analyses of a similar system using SP25, RT27, and S27 PCM types. The results showed that SP25, RT27, and S27 achieved the highest coefficient of performance (COP), exergy efficiency, and lowest overall cost rate, respectively.
A simulation-based analysis was conducted to investigate the primary energy consumption of a new HVAC system for various thermal plant configurations. The system uses a single hydronic circuit for both heating and cooling. Four configurations were considered: district heating and cooling networks, reversible air-to-water heat pumps, and free cooling devices. The results showed that energy consumption could be reduced by up to 67% per year by adding free cooling devices, such as a PCM-based heat exchanger [22]. Hai et al. [23] performed a simulation-based study of a tube structure TES consisting of CaCl2·6H2O to improve the efficiency of AC and found that incorporating PCM cylinders into an AC unit could increase the cooling capacity by up to 34% during the warmest months. Farah et al. [24] investigated the impact of adding an LTES system to an air source heat pump (ASHP) on cooling efficiency. They found that installing an LTES system increases the ASHP’s cooling capacity and reduces its electricity consumption at the same time. Nie et al. experimentally and economically evaluated the performance of an integrated system consisting of an LTES and a standard air conditioner, where the conditioned air passes through the LTES before being released into the room. They found that the integrated system reduced electrical costs by 17.8% [25].
Based on a comprehensive analysis of the existing literature and the authors’ thorough investigation, the existing body of literature mostly focuses on the development of free cooling systems using PCMs. Comparatively fewer studies focus on improving the efficiency of air conditioners (ACs) using PCMs, and few have investigated the effects of placing a TES unit at different locations of the refrigeration cycle’s elements, such as the condenser. Furthermore, research on the melting and solidification of phase change materials (PCMs) in hot and desert climates is limited, and the importance of selecting the right PCM for cooling applications in such climates, considering the temperature variations, has not been fully addressed. Therefore, this study aims to design and evaluate a novel air pre-cooling system using PCMs integrated into the AC duct system, specifically to provide cooler air to the evaporator. The criteria for selecting PCMs, which are essential for reliable and efficient thermal energy storage, exclude many options suitable for higher ranges of temperature. Paraffin and salt hydrates are recommended as the preferred choices due to advantageous properties, including a higher TES capacity and a suitable melting range. During the daytime, the TES unit is exposed to the outside hot air, which drops the air temperature and then routes it to the evaporator. This design is used to evaluate the effects of air inlet speed, the number of PCM columns placed in the AC duct, air outlet temperature, PCM melting and solidification rates, and power savings. Additionally, the performance of the proposed configuration is compared using different PCMs, such as RT31 and CaCl2·6H2O. A comprehensive mathematical model of the physical system is developed and then solved with ANSYS software (Version 20, Computer software company, Cecil Township, PA, USA, 2015). To enhance the credibility of the numerical solution, furthermore, an experimental repetition test is conducted using a PCM block-type container design.

2. Experimental Analysis

2.1. Phase Change Material (PCM) Selection and Characterization

The proposed air pre-cooling units reduce energy consumption and improve thermal comfort using PCMs to stabilize indoor temperature fluctuations. To achieve the desired objectives, the selection of PCM and design of a thermal energy storage system considers the ambient temperature, humidity levels, air speed velocity, and conditioning load of specified residential buildings carefully. These factors must be balanced to maintain consistent indoor air temperature values and long-term thermal comfort, while also reducing energy use. United Arab Emirates (UAE) has one of the hottest and most humid climates in the world. According to weather data from a climate consultant [16], Al Ain’s summer daytime temperatures range from 35 °C to 50 °C. Summer temperatures are highest from May to August, peaking at 49 °C in June with an average of 45 °C. Summer nighttime temperatures average 34 °C in June. Winter temperatures range from 14 °C to 27 °C. A weather analysis provides insights that PCMs intended to be used for high-temperature ranges do not exhibit effectiveness for thermal energy storage purposes in Al Ain. Consequently, we opted for a PCM characterized by a melting point within the range of 27–33 °C. This choice adheres to the necessity of upholding a temperature marginally higher than the prevailing ambient air temperature during the morning period.
To determine the thermal properties of PCM (RT 31), manufactured by Rubitherm in Germany, we used a technique called differential scanning calorimetry (DSC). For this purpose, we utilized the DSC-Q200 instrument. We measured the latent heat of fusion, liquidus and solidus temperatures, and the temperature at which the material shows appreciable solidification. We then compared these measurements to the characteristics of the material provided. The DSC curve revealed that RT 31 is a paraffin wax with a solidus temperature of 34.2 °C, a melting point of 32.5 °C, and a latent heat of fusion of 158 KJ/kg [26]. The article investigates a novel concept of placing the PCM containers inside the air supply duct of the AC unit to supply pre-cooled air to the evaporator. The TES design is easy to integrate into AC ducts for both air-based ACs and chilled water-based ACs. The objective of this article is to study the cooling effect produced by the PCM while it is melting due to outdoor solar radiation and the ambient temperature.

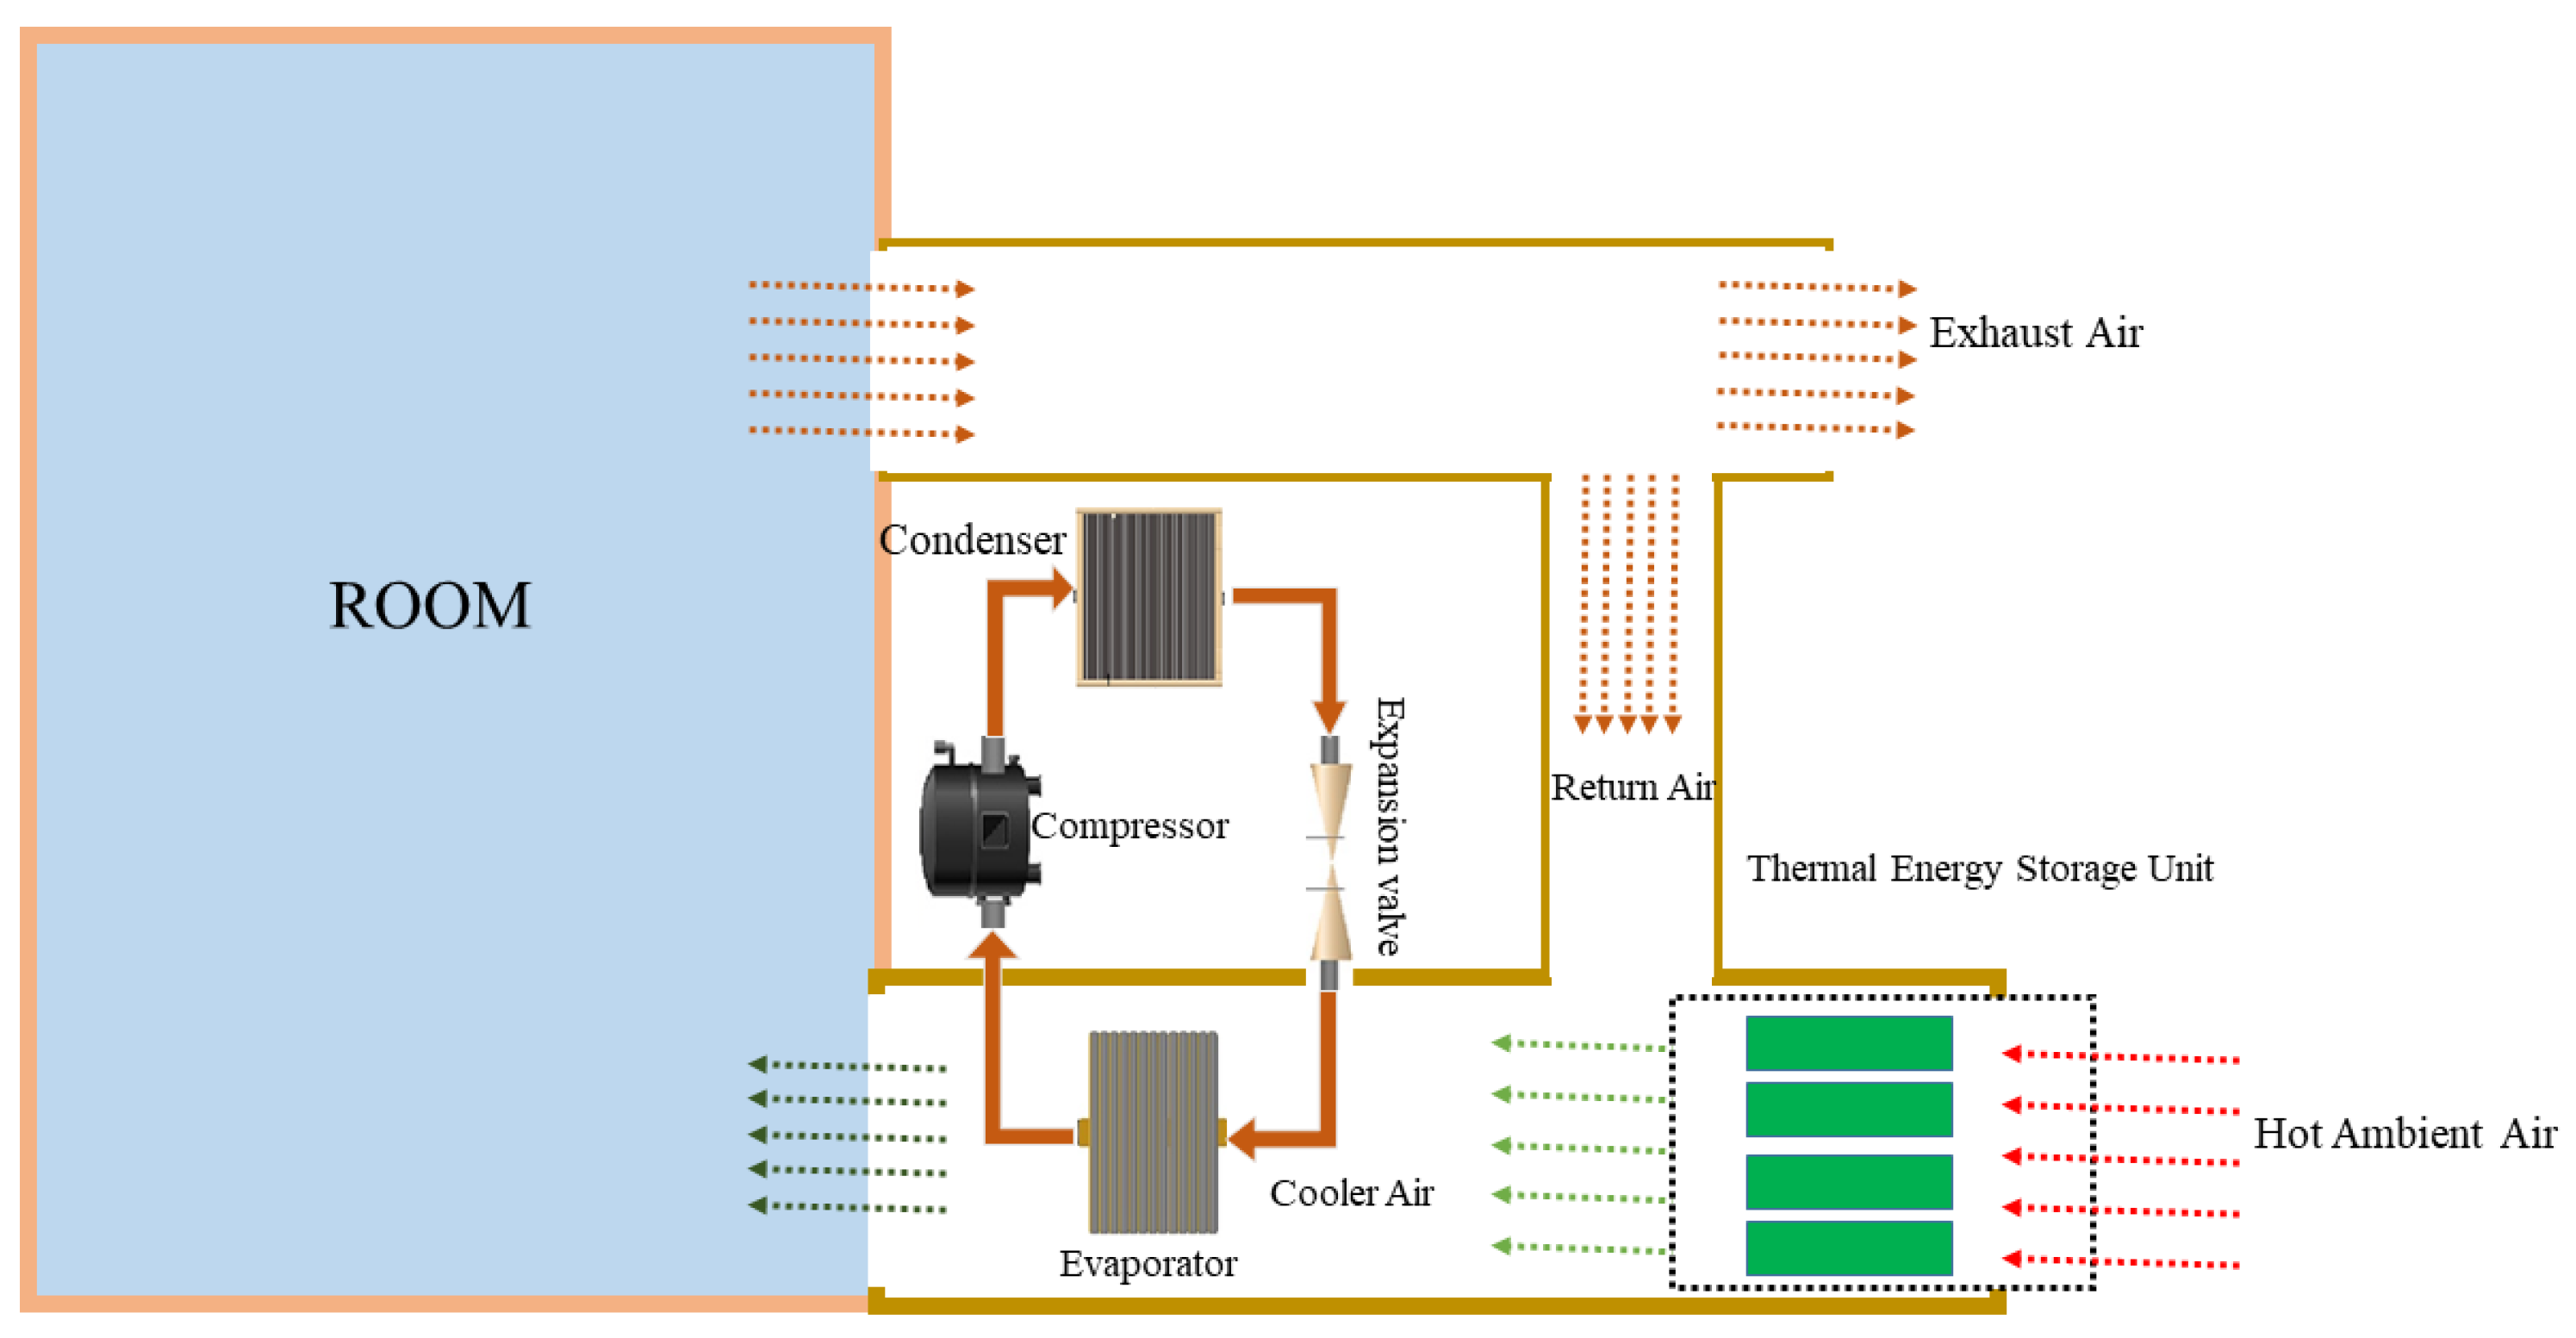
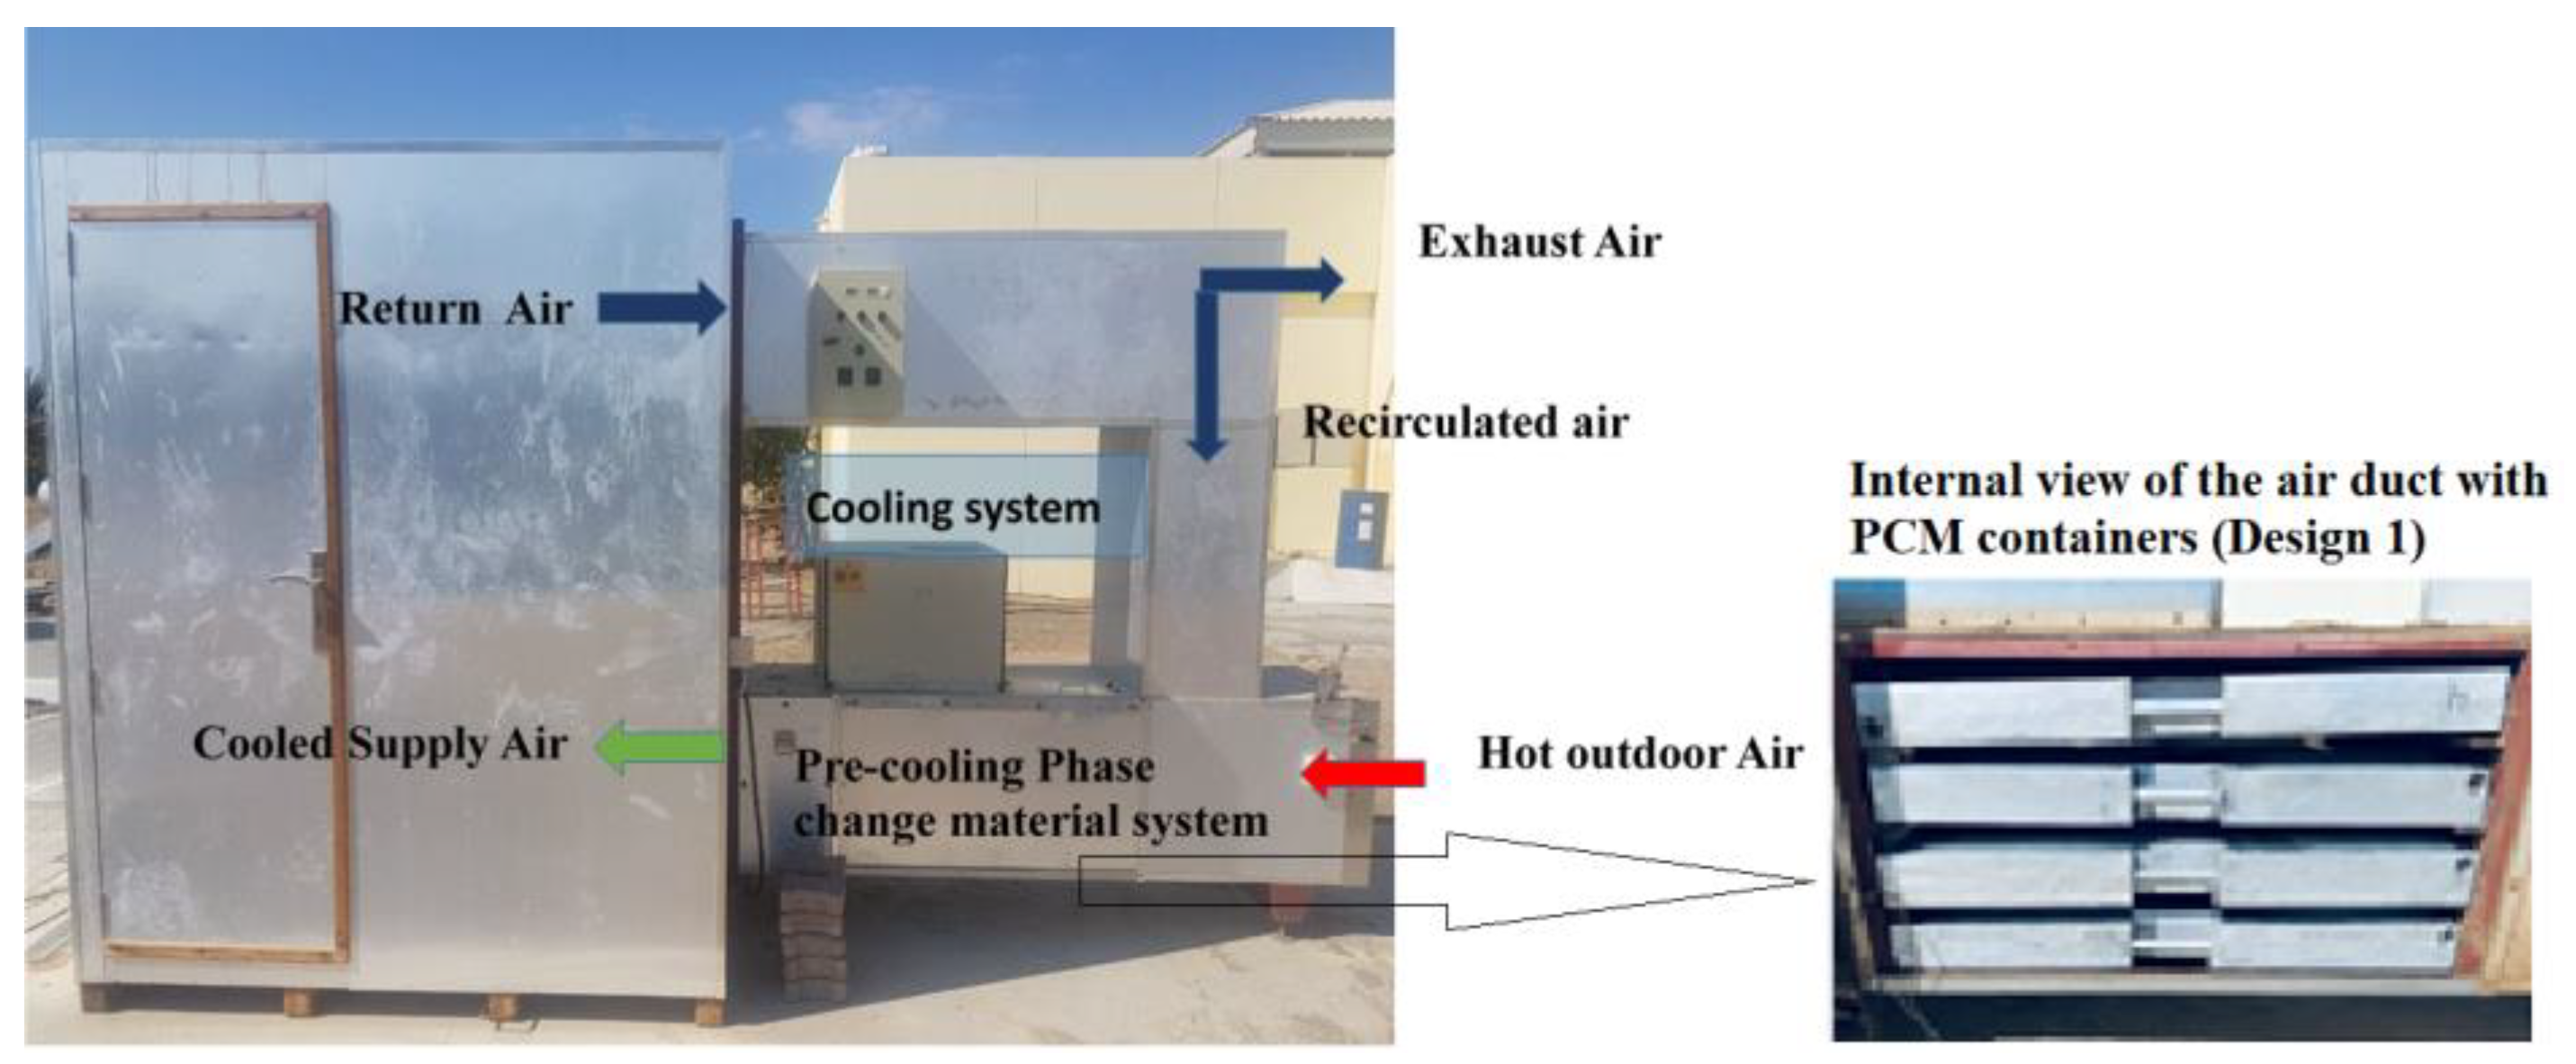
2.2. Experimental System

An experimental setup was designed to study the performance of a PCM-based air precooling system. The heat load and system efficiency were calculated using a typical one-story structure of the size 20 × 20 × 3 m3 in Al Ain (UAE). It is important to understand the crucial characteristics and systems within a building. The building has a total floor area of 300 square meters, making it a moderately sized structure. It features windows that cover 10% of the gross wall area. These windows are constructed with 6 mm single, green-tinted glazing, potentially providing benefits such as reduced glare and controlled solar heat gain. Notably, the external walls and roof of the building have a solar absorbance of 0.50. The building is designed for an occupancy density of 6 people, which may have implications for space planning and HVAC requirements. Additionally, the lighting power density in the building is 4.5 watts per square meter (W/m2), suggesting the electrical power used for lighting. Lastly, the equipment power density is 7 W/m2, providing information about the electrical power consumption of equipment and appliances within the building. These details are vital for understanding the building’s design, energy efficiency, and potential environmental impact. The explained characteristics are listed in Table 1.
The equation below was used to calculate heat losses over three days by contrasting the average interior temperatures obtained with and without the use of PCM-based systems.
Q i n n e r = h c × A × ( T s T i )
The inner surface temperature T s , the ambient air temperature T i , and the convective heat transfer coefficient h c are related by the following Equation (2). Assuming free cooling and applying the wind speed v w for UAE [16], we obtain that the h c value at the inner surface facing inside is 6.5 W/m2 °C.
h c = 3.3   v w + 6.5

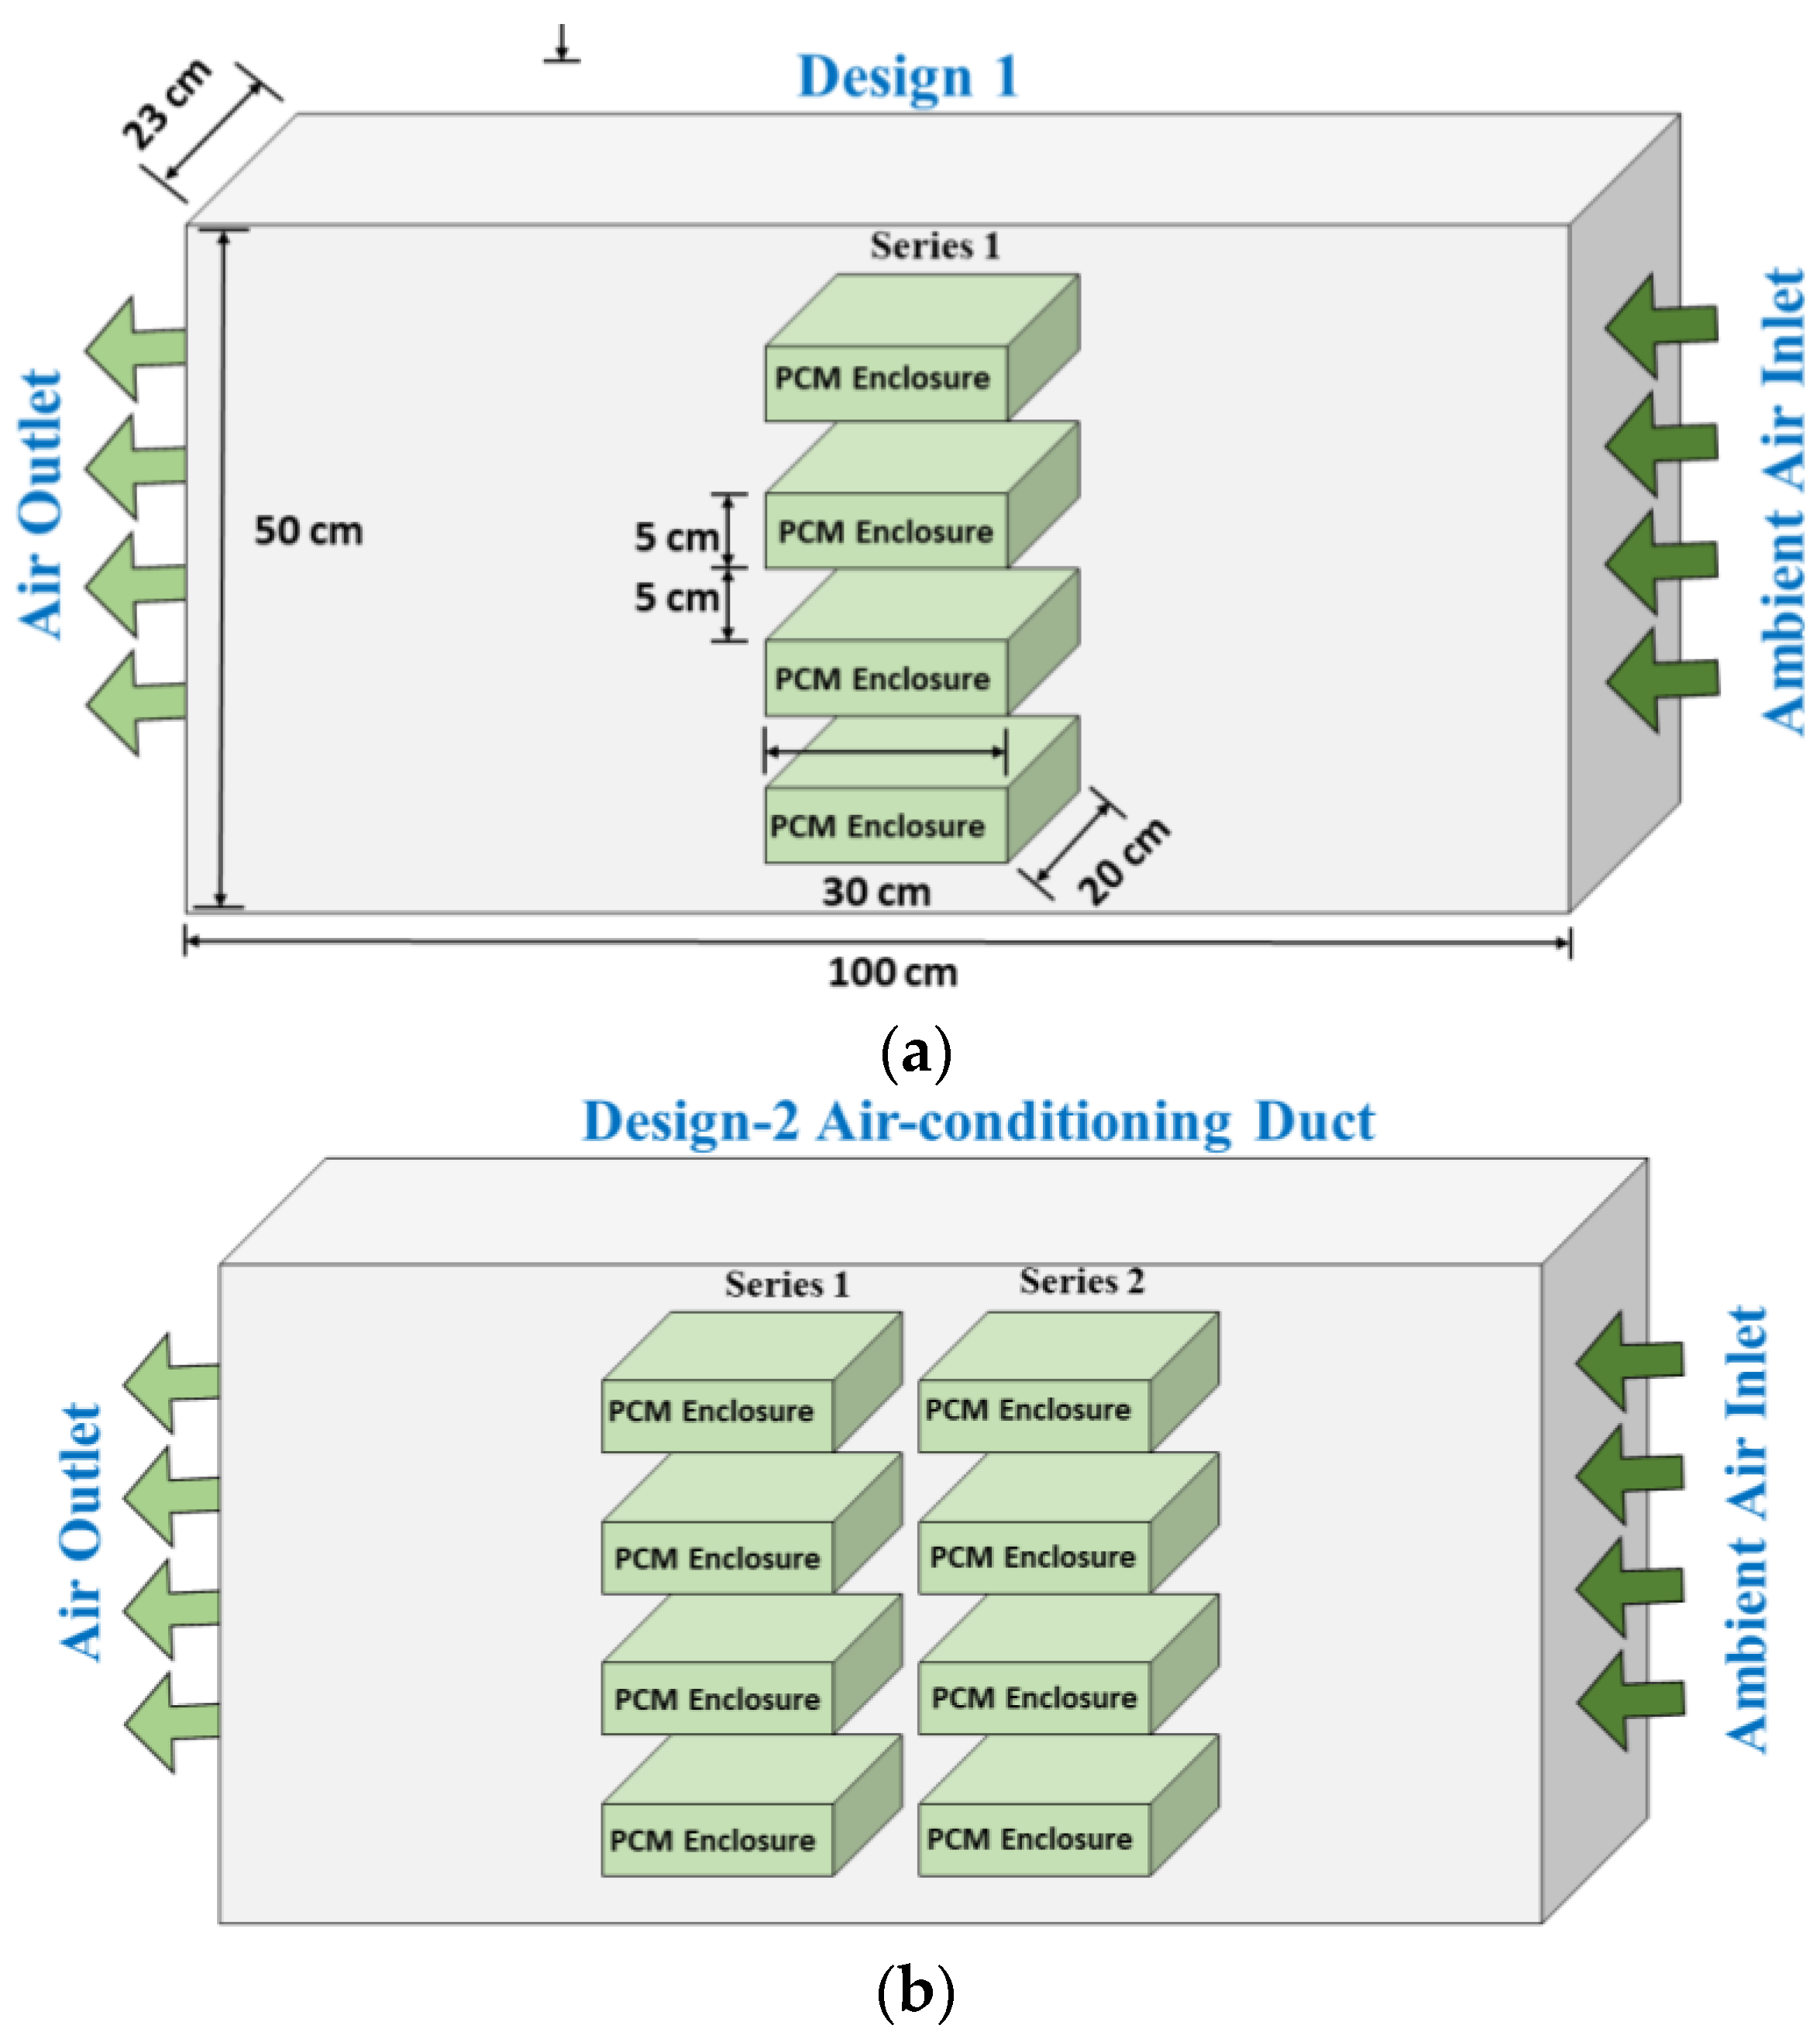
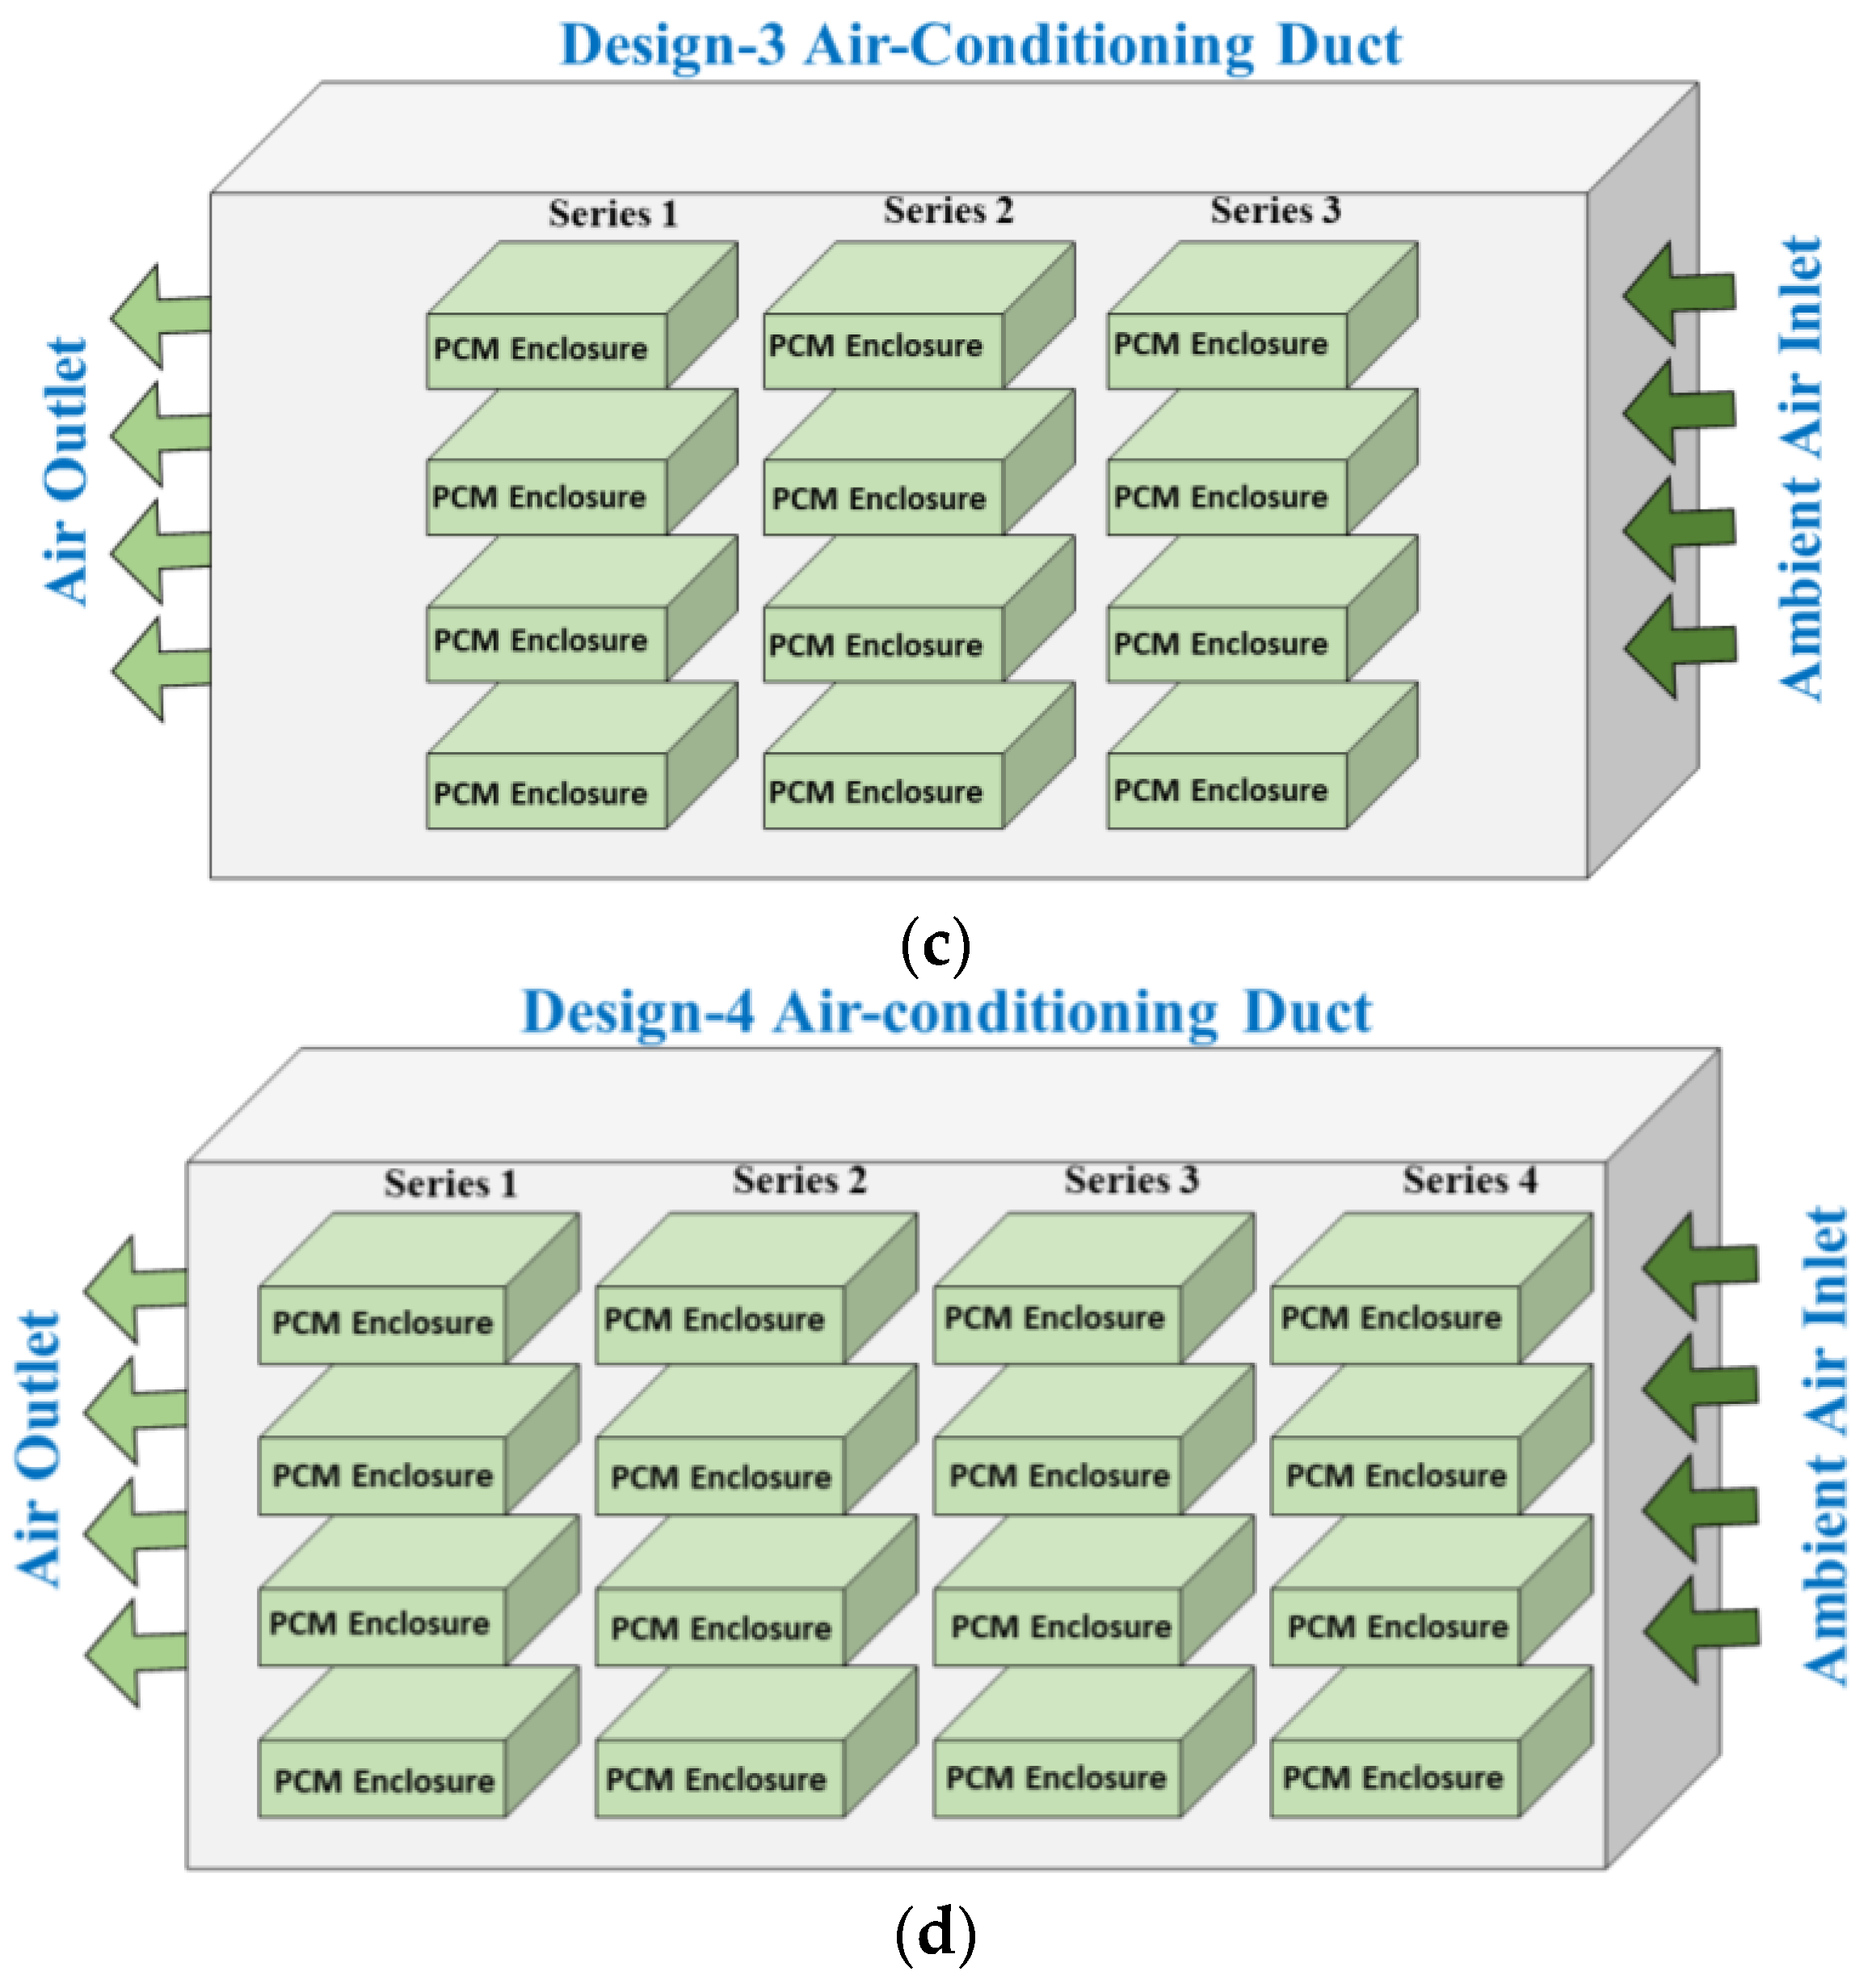
2.3. PCM-Based TES Unit

For designing the PCM-based TES, a test chamber was built that replicates a standard building’s air conditioning duct system. The chamber measures 45 cm × 90 cm × 20 cm. During testing, the AC duct system was exposed to varying air velocities supplied by an air pump. Metallic PCM containers (5 cm × 30 cm × 20 cm) were fabricated using a 4 mm thick sheet of aluminum alloy (1050A), and every PCM container was filled with 2.7 kg of PCM (RT-31). The solid PCM was placed within four PCM enclosures that were positioned vertically inside the duct with a 5 cm space between them. Figure 1 shows a schematic diagram of the system. Multiple calibrated T-type copper–constantan thermocouples were placed at different positions across the air duct system and inside the PCM. The sensors were connected to a data logger (National Instruments-NI, Compact-Rio) to store and retrieve the data. The PCM was filled as a liquid in the containers and subsequently cooled until it was completely solidified. The solidified PCM left a 7 cm free space on top of the container, which was intended to accommodate volume expansion during PCM melting. The efficiency of the system depends on the reduction in temperature of the inlet air. Therefore, the effects of two parameters are being studied: airspeed and the number of PCM slabs in the air duct of a split air conditioning system with an efficiency ratio (EER) of 8. Figure 1 shows a schematic diagram of the experimental setup and Figure 2 shows the experimental setup.

3. Numerical Modeling

Four 2D mathematical, finite-volume, heat transfer models of four designs containing 1, 2, 3, and 4 series of PCM enclosures embedded in an air duct are developed in ANSYS Fluent, including air and PCM as heat exchange media, as illustrated in Figure 3. The system design involves a comparative study between two phase change materials (PCMs): paraffin (RT-31) and salt-hydrate (CaCl2·6H2O). The behavior of the two PCMs under different inlet air velocities, ranging from 1 m/s to 4 m/s, were studied using ambient air conditions of a hot climate. The air and PCM both are characterized as unsteady and incompressible fluids since no pressure-induced volume changes are expected in the computational domain with melt flow. Figure 3a–d show the models of AC ducts with 1, 2, 3, and 4 series of PCMs, respectively. The PCM volume of each enclosure was kept the same as shown in Figure 3a–d.
Differential Equation (3) governs the transient heat transfer in two dimensions [27]. Heat flux ( q ) , representing incident irradiance, is applied as a boundary condition at the PV surface.
ρ c 𝜕 T 𝜕 t [ 𝜕 𝜕 x i ( k i j 𝜕 T 𝜕 x j ) ] = 0  
where ρ is density, c is heat capacity, k is thermal conductivity, T is temperature, t is time and x i , and x j are unit vectors. Equation (3) accounts for conduction in the domain ignoring boundary heat losses. The heat losses (convection and radiation) are imposed at the boundary as given in Equations (4) and (5):
Z c = h c A ( T T a m b )
Z r = σ ε A ( T 4 T 4 )
Z c and Z r are convective and radiative heat losses, h c is the convective heat loss coefficient, A is the PV area, ε is PV emissivity, σ is the Stefan–Boltzman constant, T a m b is ambient temperature, and T is the sky temperature. The unified governing heat transfer equation imposing heat losses yields Equation (6).
ρ c 𝜕 T 𝜕 t [ 𝜕 𝜕 x i ( k i j 𝜕 T 𝜕 x j ) ] + Z c + Z r = 0
The weak formulation is generated by multiplying the test function δ T and integrating it over the domain, resulting in Equation (7):
Ω δ T ρ c 𝜕 T 𝜕 t 𝜕 Ω 1 Ω δ T [ 𝜕 𝜕 X i ( k i j 𝜕 T 𝜕 X j ) ] 𝜕 Ω 2 + Γ σ δ T ( z c + z r ) 𝜕 A = 0 3
The weak formulation is simplified by applying the Green–Gauss and divergence theorem in part 2 of Equation (8), resulting in Equation (10):
Ω δ T ρ c 𝜕 T 𝜕 t 𝜕 Ω + 1 Ω [ k 11 𝜕 δ T 𝜕 X 1 ( 𝜕 T 𝜕 X 1 ) + k 22 𝜕 δ T 𝜕 X 2 ( 𝜕 T 𝜕 X 2 ) ] 2 + Γ δ T ( z c + z r ) 𝜕 A 3 = 0
The energy balance is retained in the weak formulation for 2 D transient differential heat diffusion given in Equation (9).
M T ˙ + K T q ˆ + ( H + R ) T = 0
where T ˙ is the time derivative of temperature, q ˆ is the irradiance or boundary flux matrix, and M , K , H and R are the mass, conductivity, convection, and radiation matrices, respectively. The temporal discretization of the domain is carried out using the Crank–Nicholson method [28,29]. The heat storage during a phase change is simulated by applying the effective heat capacity method [30] given in Equation (10):
c p , e = c 0 + L T s T l   if   T s T T l   or   else   c p , e = c 0

Initial and Boundary Conditions

At t = 0, both the liquid and solid phases of the PCM were assumed to be motionless. The boundary was considered with a no-slip assumption for the wall boundaries of the PCM. The outer wall of the AC duct was taken as adiabatic. The inlet air was considered at atmospheric pressure. The initial condition of the temperature was considered at 25 °C. Table 2 shows the thermal and physical properties of the used materials in the study.
The finite volume method using ANSYS/Fluent was employed to solve the equations of continuity, energy, and momentum, while melting/solidification and energy models were used to simulate heat transfer and phase transition. Smaller effects, such as the expansion or contraction of the PCM after a phase shift, natural convection inside the molten PCM, and the floating or sinking of solid dendrites within the molten PCM due to buoyancy, are not considered in the model. External ambient conditions are added to the input heat flow boundary.
In the ANSYS/Fluent numerical simulations, a meticulous approach was taken to ensure both accuracy and efficiency, extending also to the meshing strategy. The computational domain was discretized into a finely structured mesh, with a total of 25 divisions in each spatial direction. This mesh refinement was chosen to strike a balance between capturing the intricacies of the geometry and minimizing computational costs. The convergence criteria were set at a maximum residual of 0.001 for continuity and velocities in the x, y, and z directions, guaranteeing a robust convergence of the solution. For thermal considerations, the energy residual was maintained at an exceptionally low threshold of 0.000001. The simulations advanced in time with a discrete time step of 10 s. These carefully chosen numerical parameters collectively ensure the reliability of the results, providing a solid foundation for the analysis by striking a judicious balance between mesh resolution and computational efficiency in the ANSYS/Fluent simulations. HP Z840 workstation Core i-7 (20 cores) (sourced from HP and made in China) was used for simulations. Each case used 4 cores and 2 days for the completion of the simulation.

4. Results and Discussion

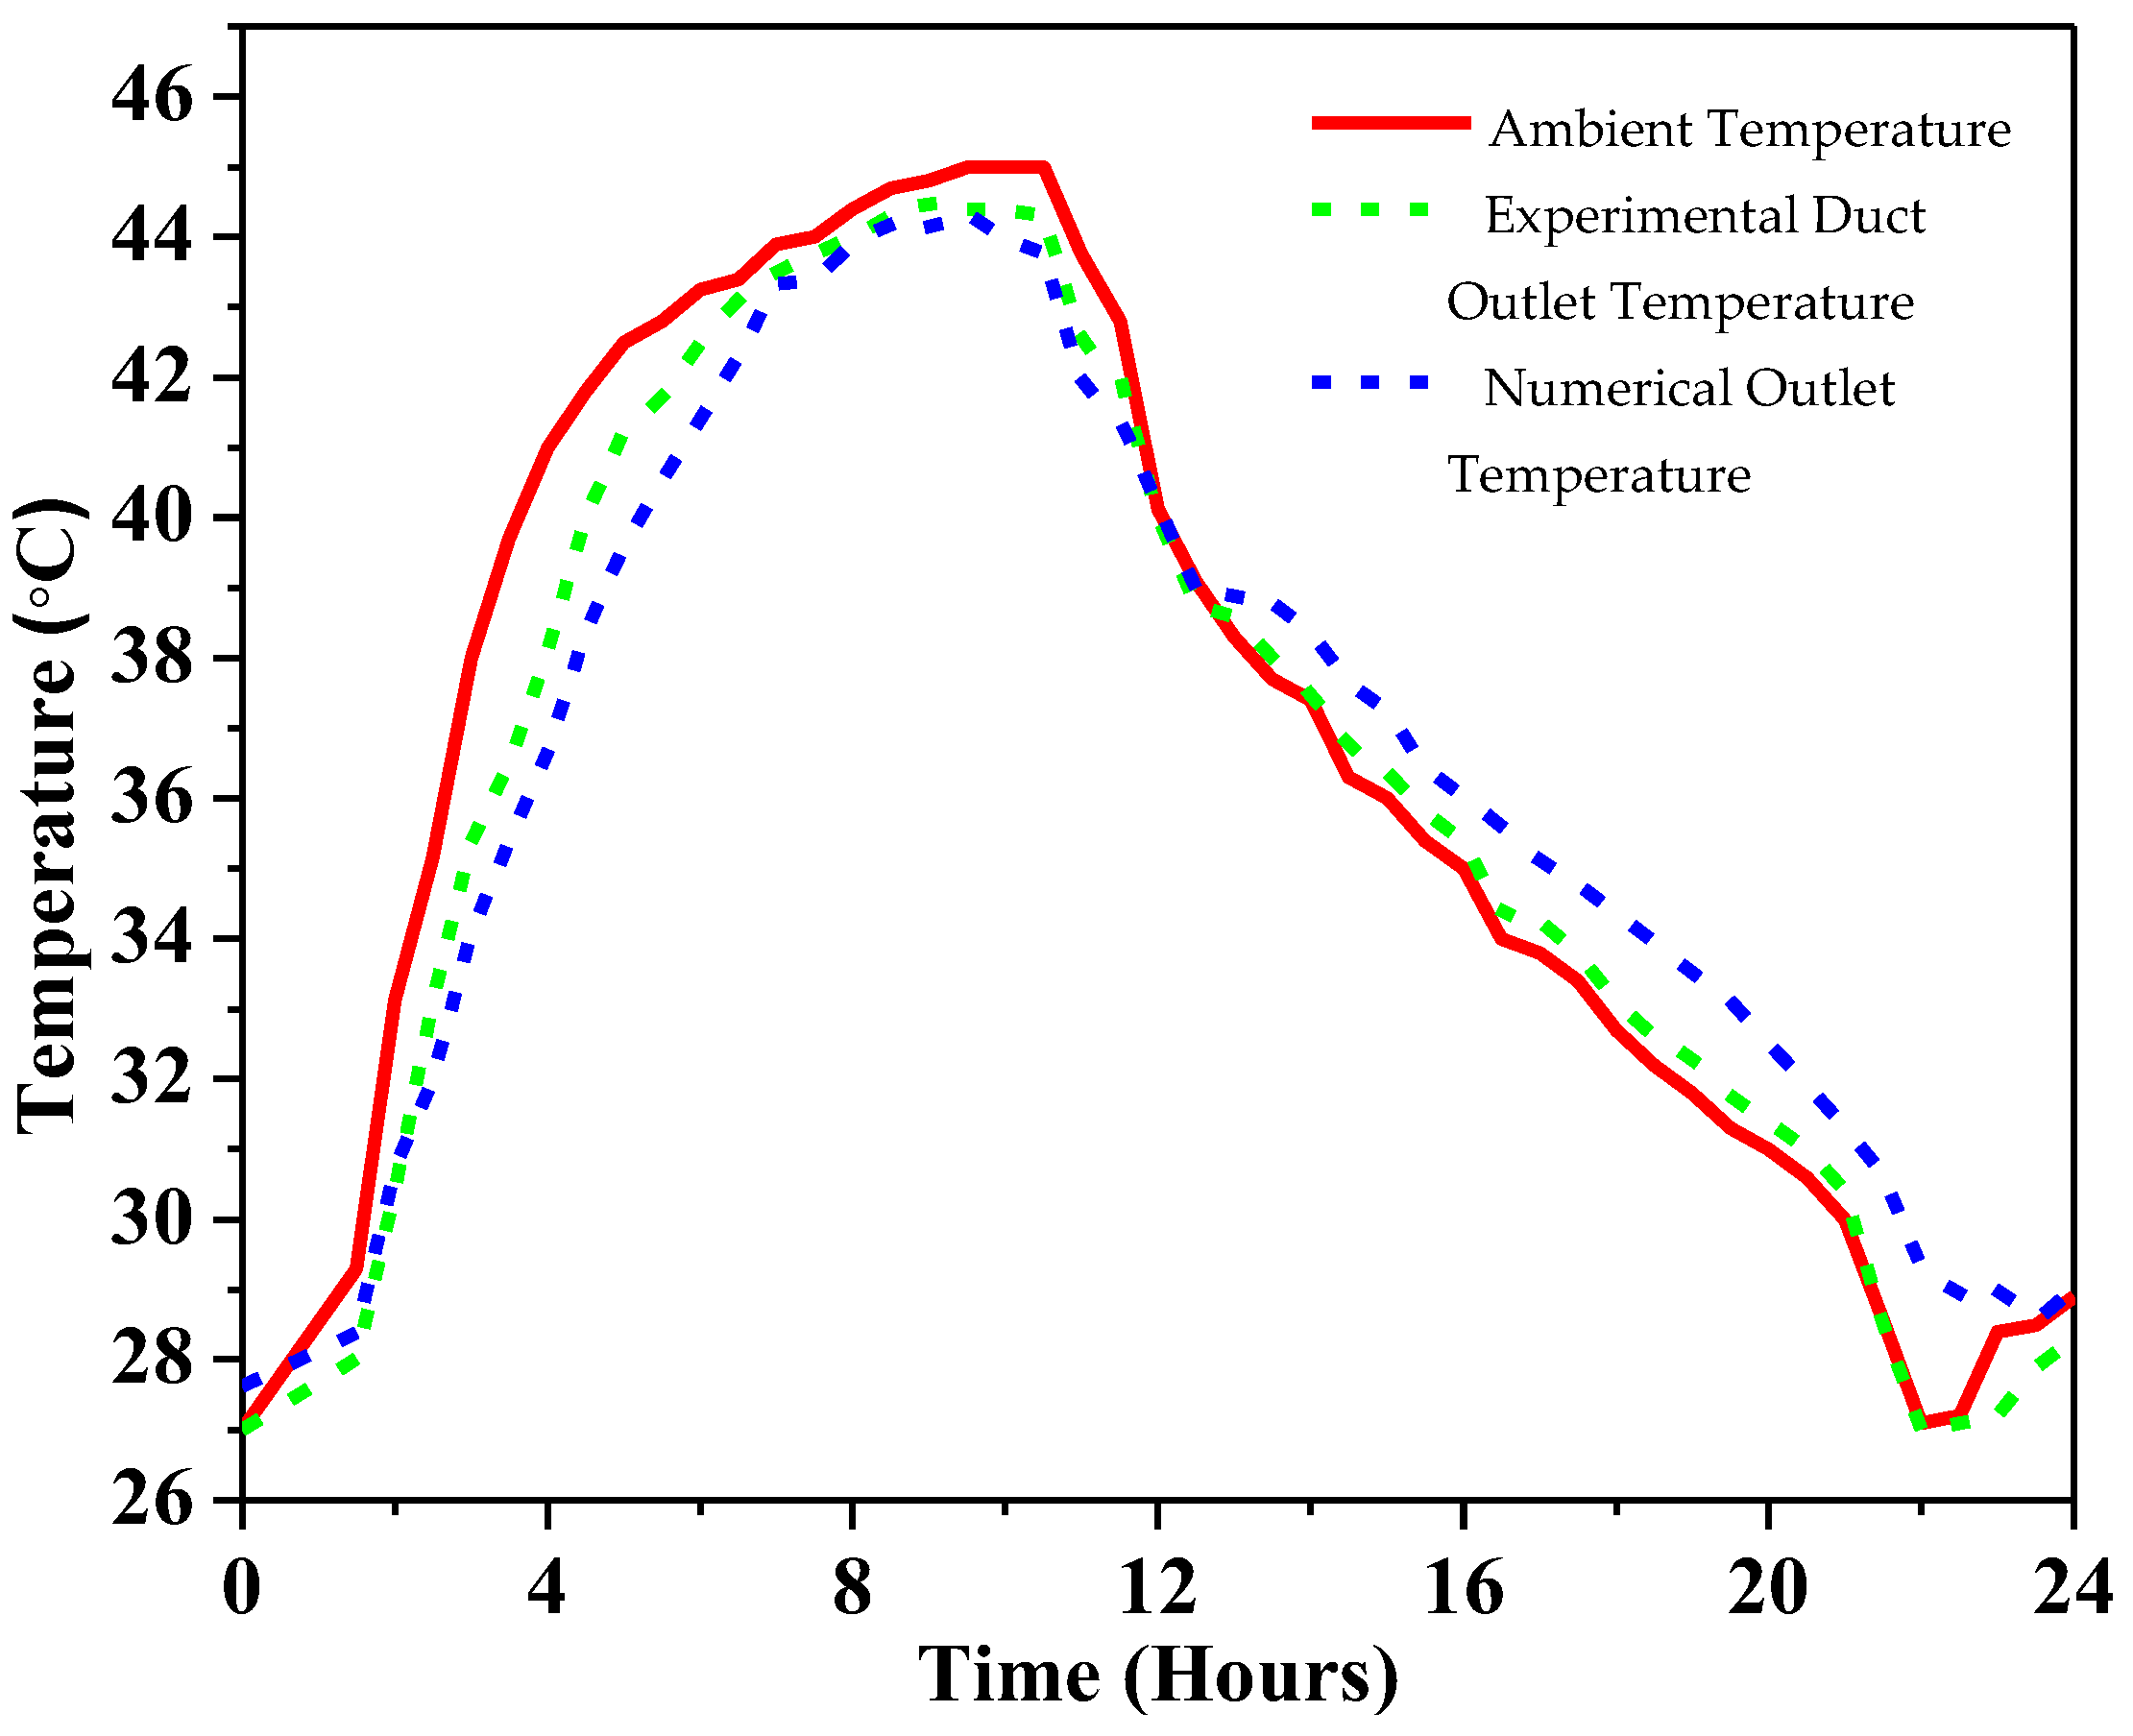
4.1. Experimental Validation

Figure 4 shows the experiment conducted on Design 1 at an air speed of 4 m/s for RT-31, where inlet air temperature (from 7 a.m. to 7 a.m.) subjected to the AC duct system started at 27 °C and rose as the solar radiation increased, reaching the maximum temperature of 45 °C at noon time (1–3) p.m. in 8 h. The inclusion of PCM as the latent heat storage system in the AC duct system cools the outlet air temperature and reduces the peak air temperature, achieving a temperature drop of 4 °C as the maximum and 1 °C as the average. The experimental findings effectively corroborate the simulation results, which are particularly evident 11 h into the study when the ambient air temperature begins to drop. Notably, the outlet air temperature surpasses that of the ambient air, initiating a phase where the PCM starts to transfer its stored thermal energy to the surrounding air. This process continues and becomes particularly pronounced after 12 h. This insightful observation sheds light on a critical juncture—the point at which the PCM, having absorbed heat during the warmer period, now serves as a heat source, warming the ambient air. This knowledge offers a valuable perspective on determining an opportune cutoff point in the system operation. Strategically, this signifies the juncture where directing only ambient air through the evaporator, while concurrently allowing the PCM to cool for the next cycle, becomes advantageous. This innovative approach has the potential to enhance the efficiency of the air conditioning system, particularly during peak hours, by leveraging the PCM’s thermal properties to optimize the cooling process. The synchronization of the system’s operation with ambient temperature fluctuations presents an intriguing avenue for improving overall energy efficiency and performance.
It is noted that the PCM will cool the air and it will result in a lower temperature of the pre-cooled air compared with the ambient air as long as the PCM is melting and its temperature is below the ambient temperature. Once the PCM is completely melted by 13:00, a reverse trend is seen as the pre-cooled air that gets out of the PCM is warmer than the ambient air, which is in complete compliance with the heat transfer mechanism of the flow of heat according to the temperature gradient.

4.2. Numerical Results

The present work provides a study assessing the performance of a thermal energy storage system comprised of four different designs placed within an air conditioning (AC) duct. This evaluation involved monitoring key parameters, such as the outlet temperature, PCM average temperature, and melting fraction at varying inlet air speeds (1 m/s, 2 m/s, 3 m/s, and 4 m/s), with the inlet air temperature set to the average highest daytime temperature of 45 °C. The realistic transient summertime temperature was incorporated as input to the model and, accordingly, the results are predicted for one day. The one-day simulation results are compared with the experiment and accordingly are presented to validate the model. The validated model is used to predict off-normal conditions and is presented accordingly. The idea here was to generalize the results that can apply to a wide range of input conditions, not a specific weather condition or climate.

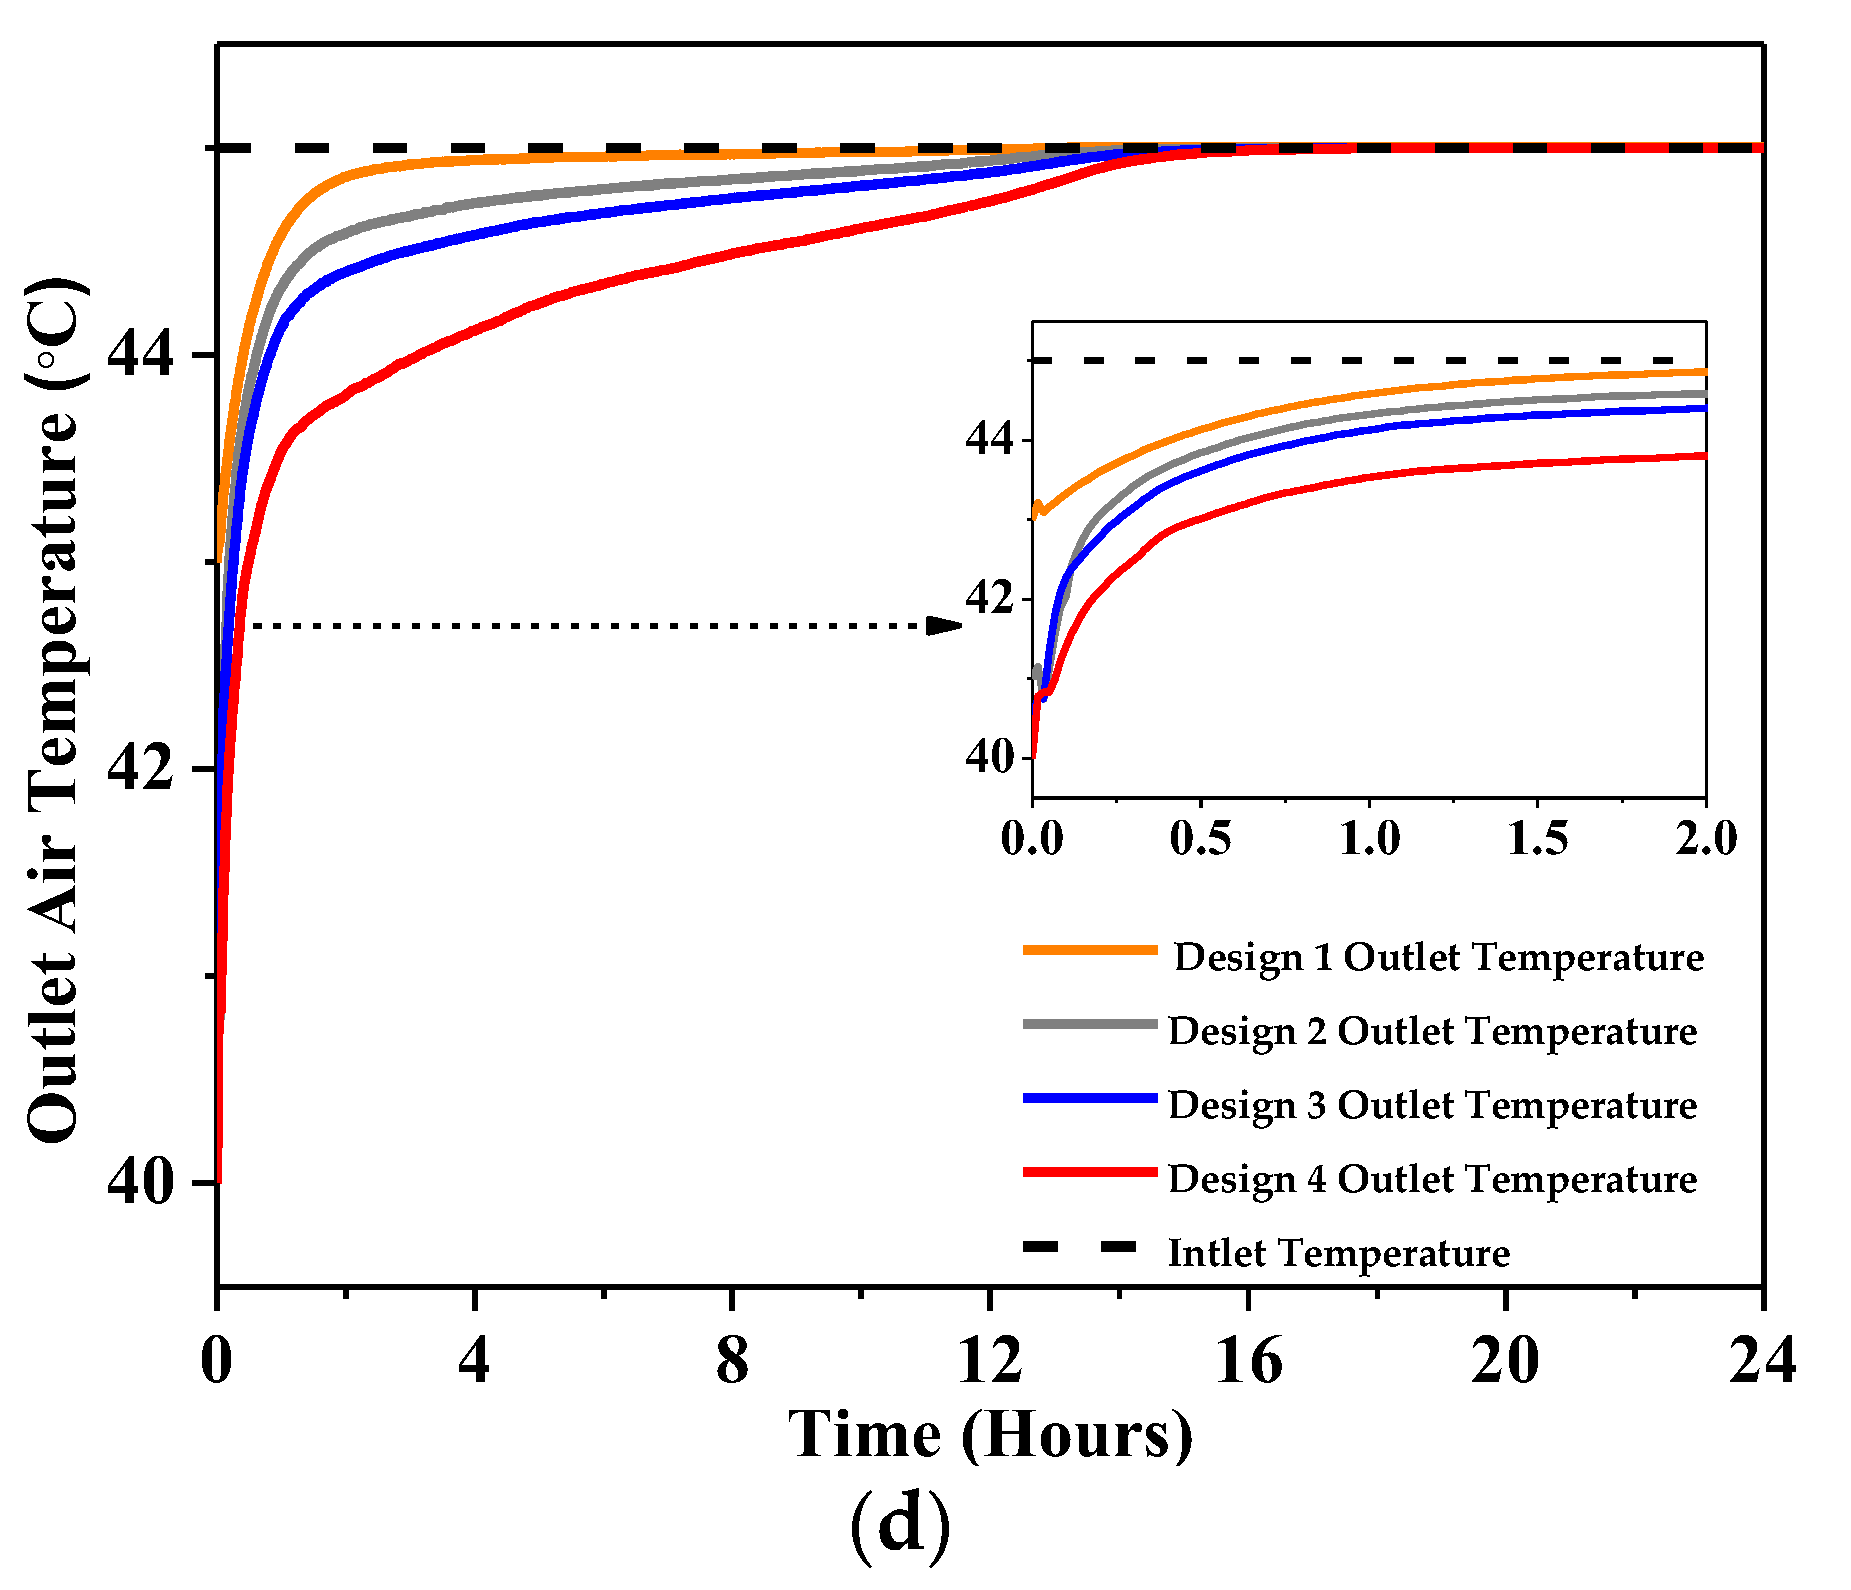
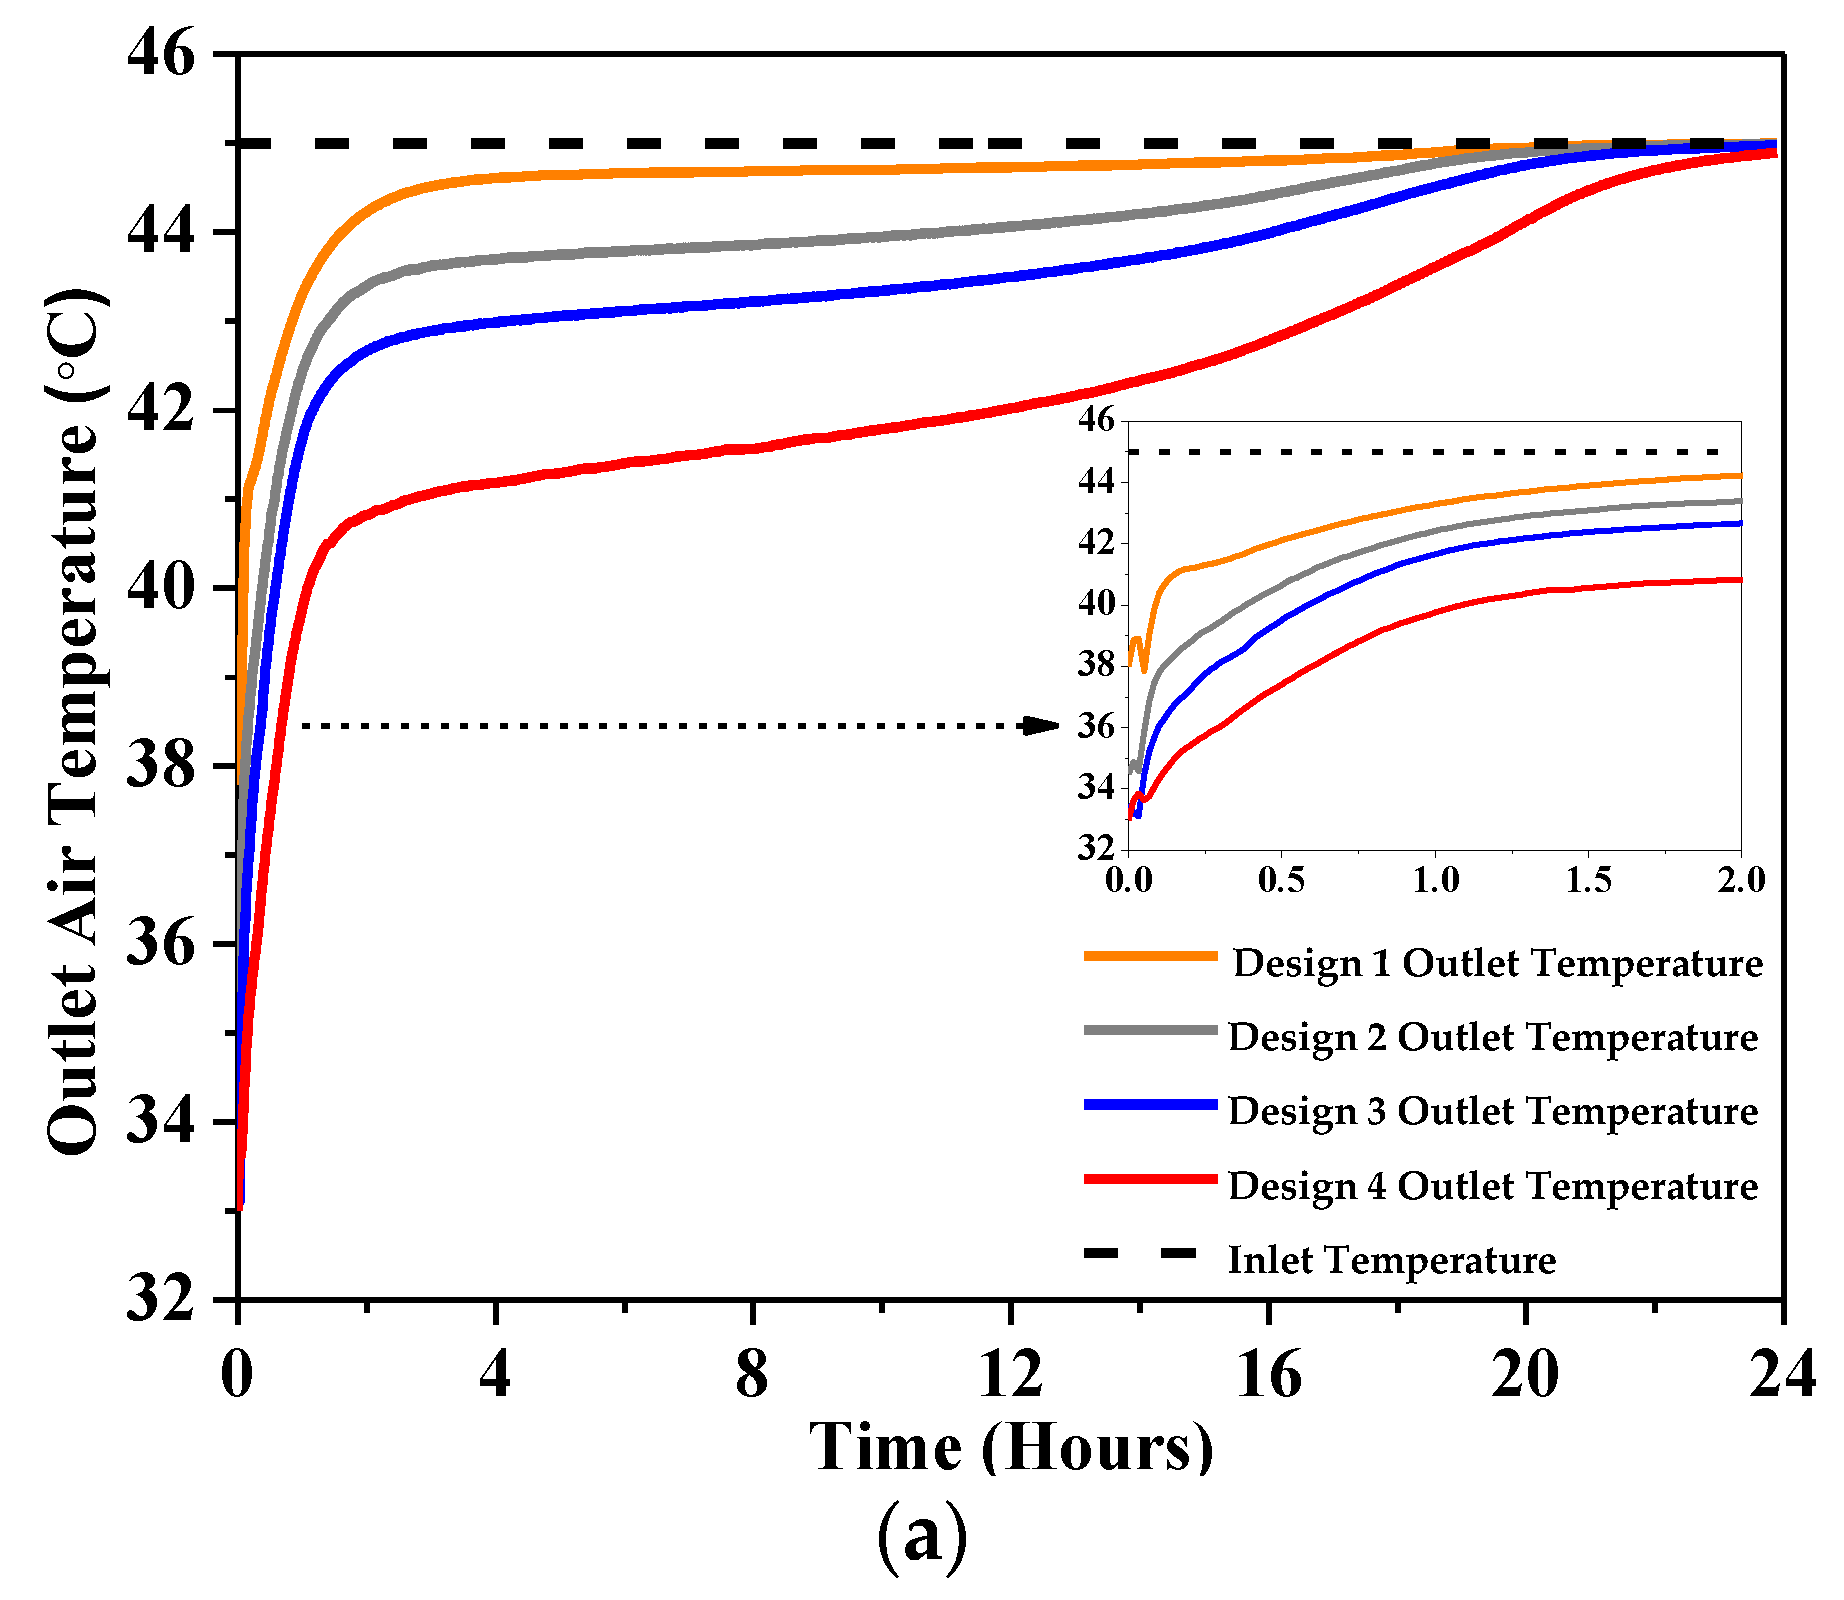
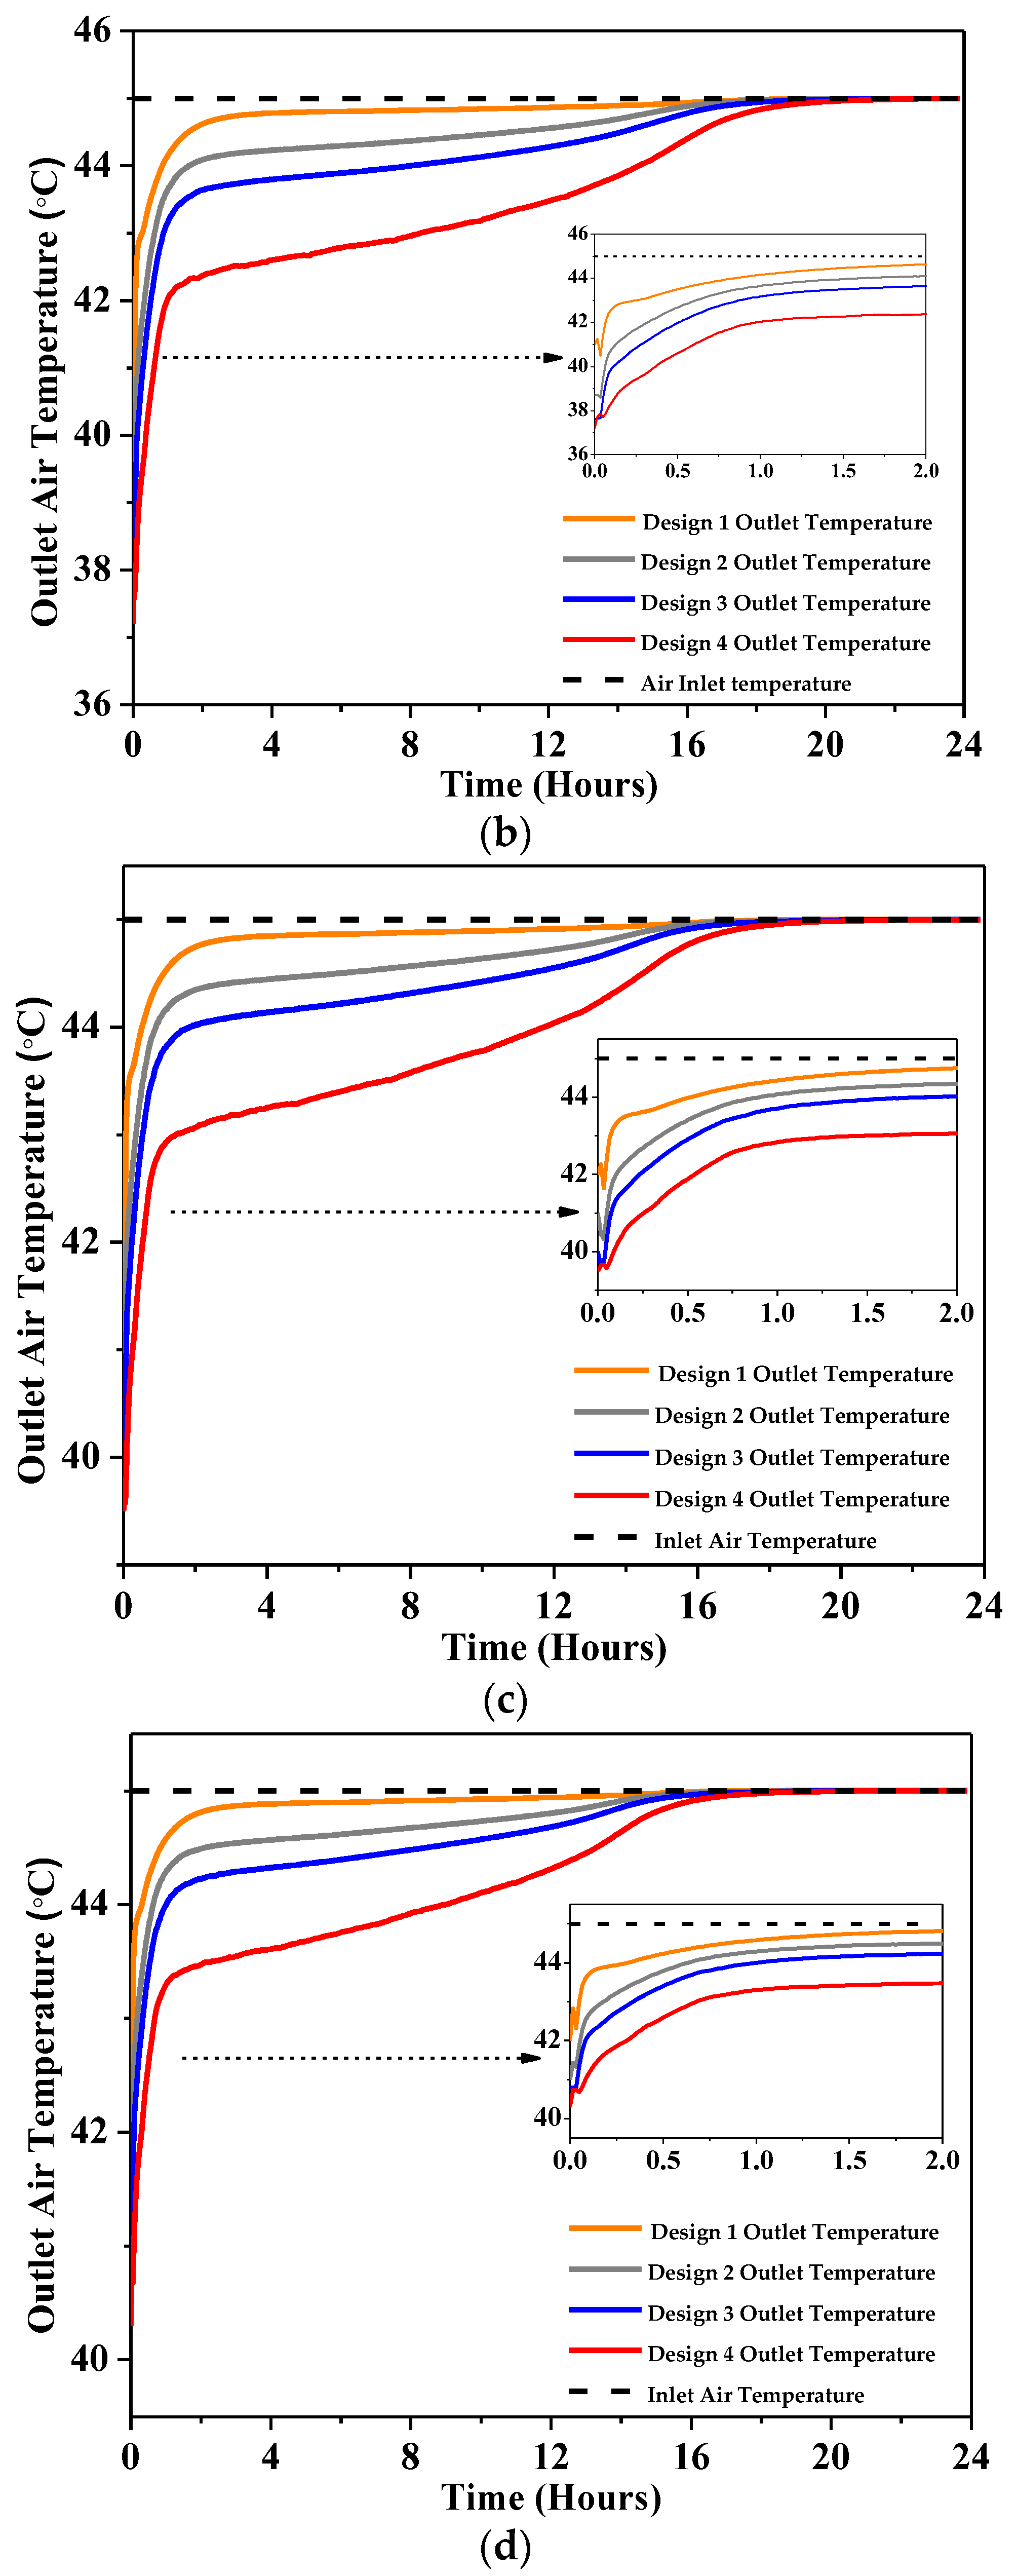
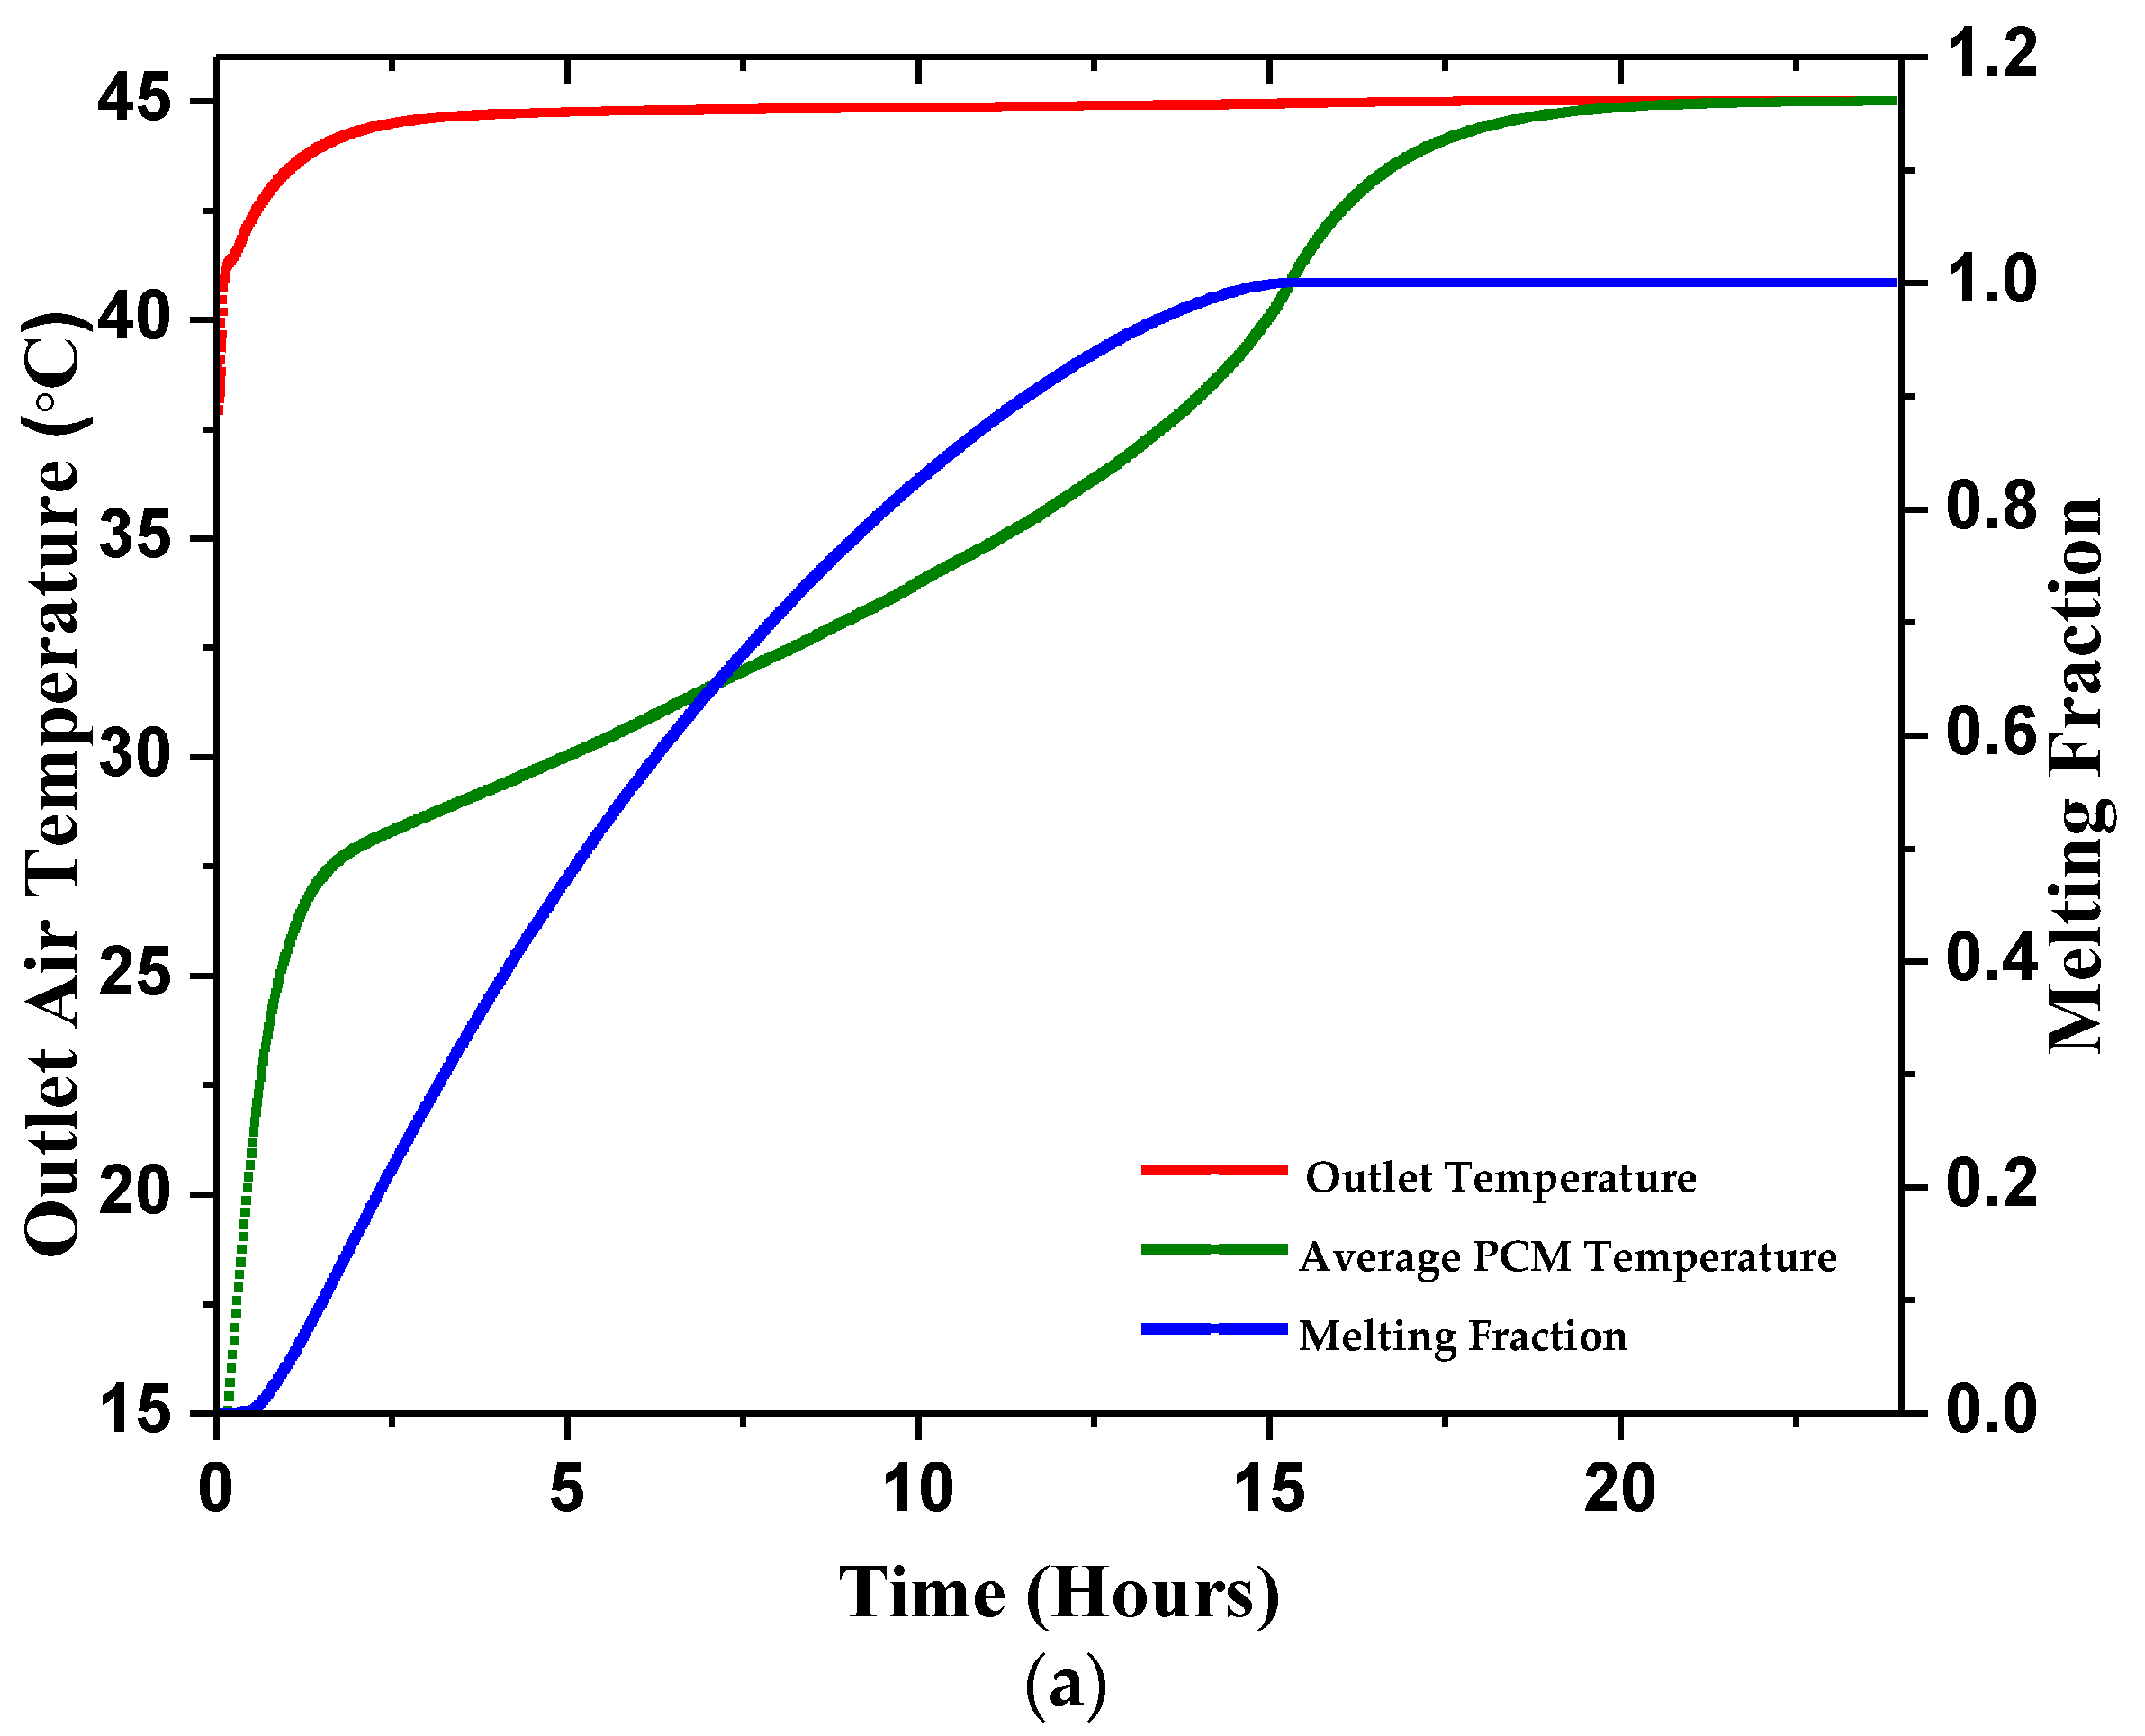
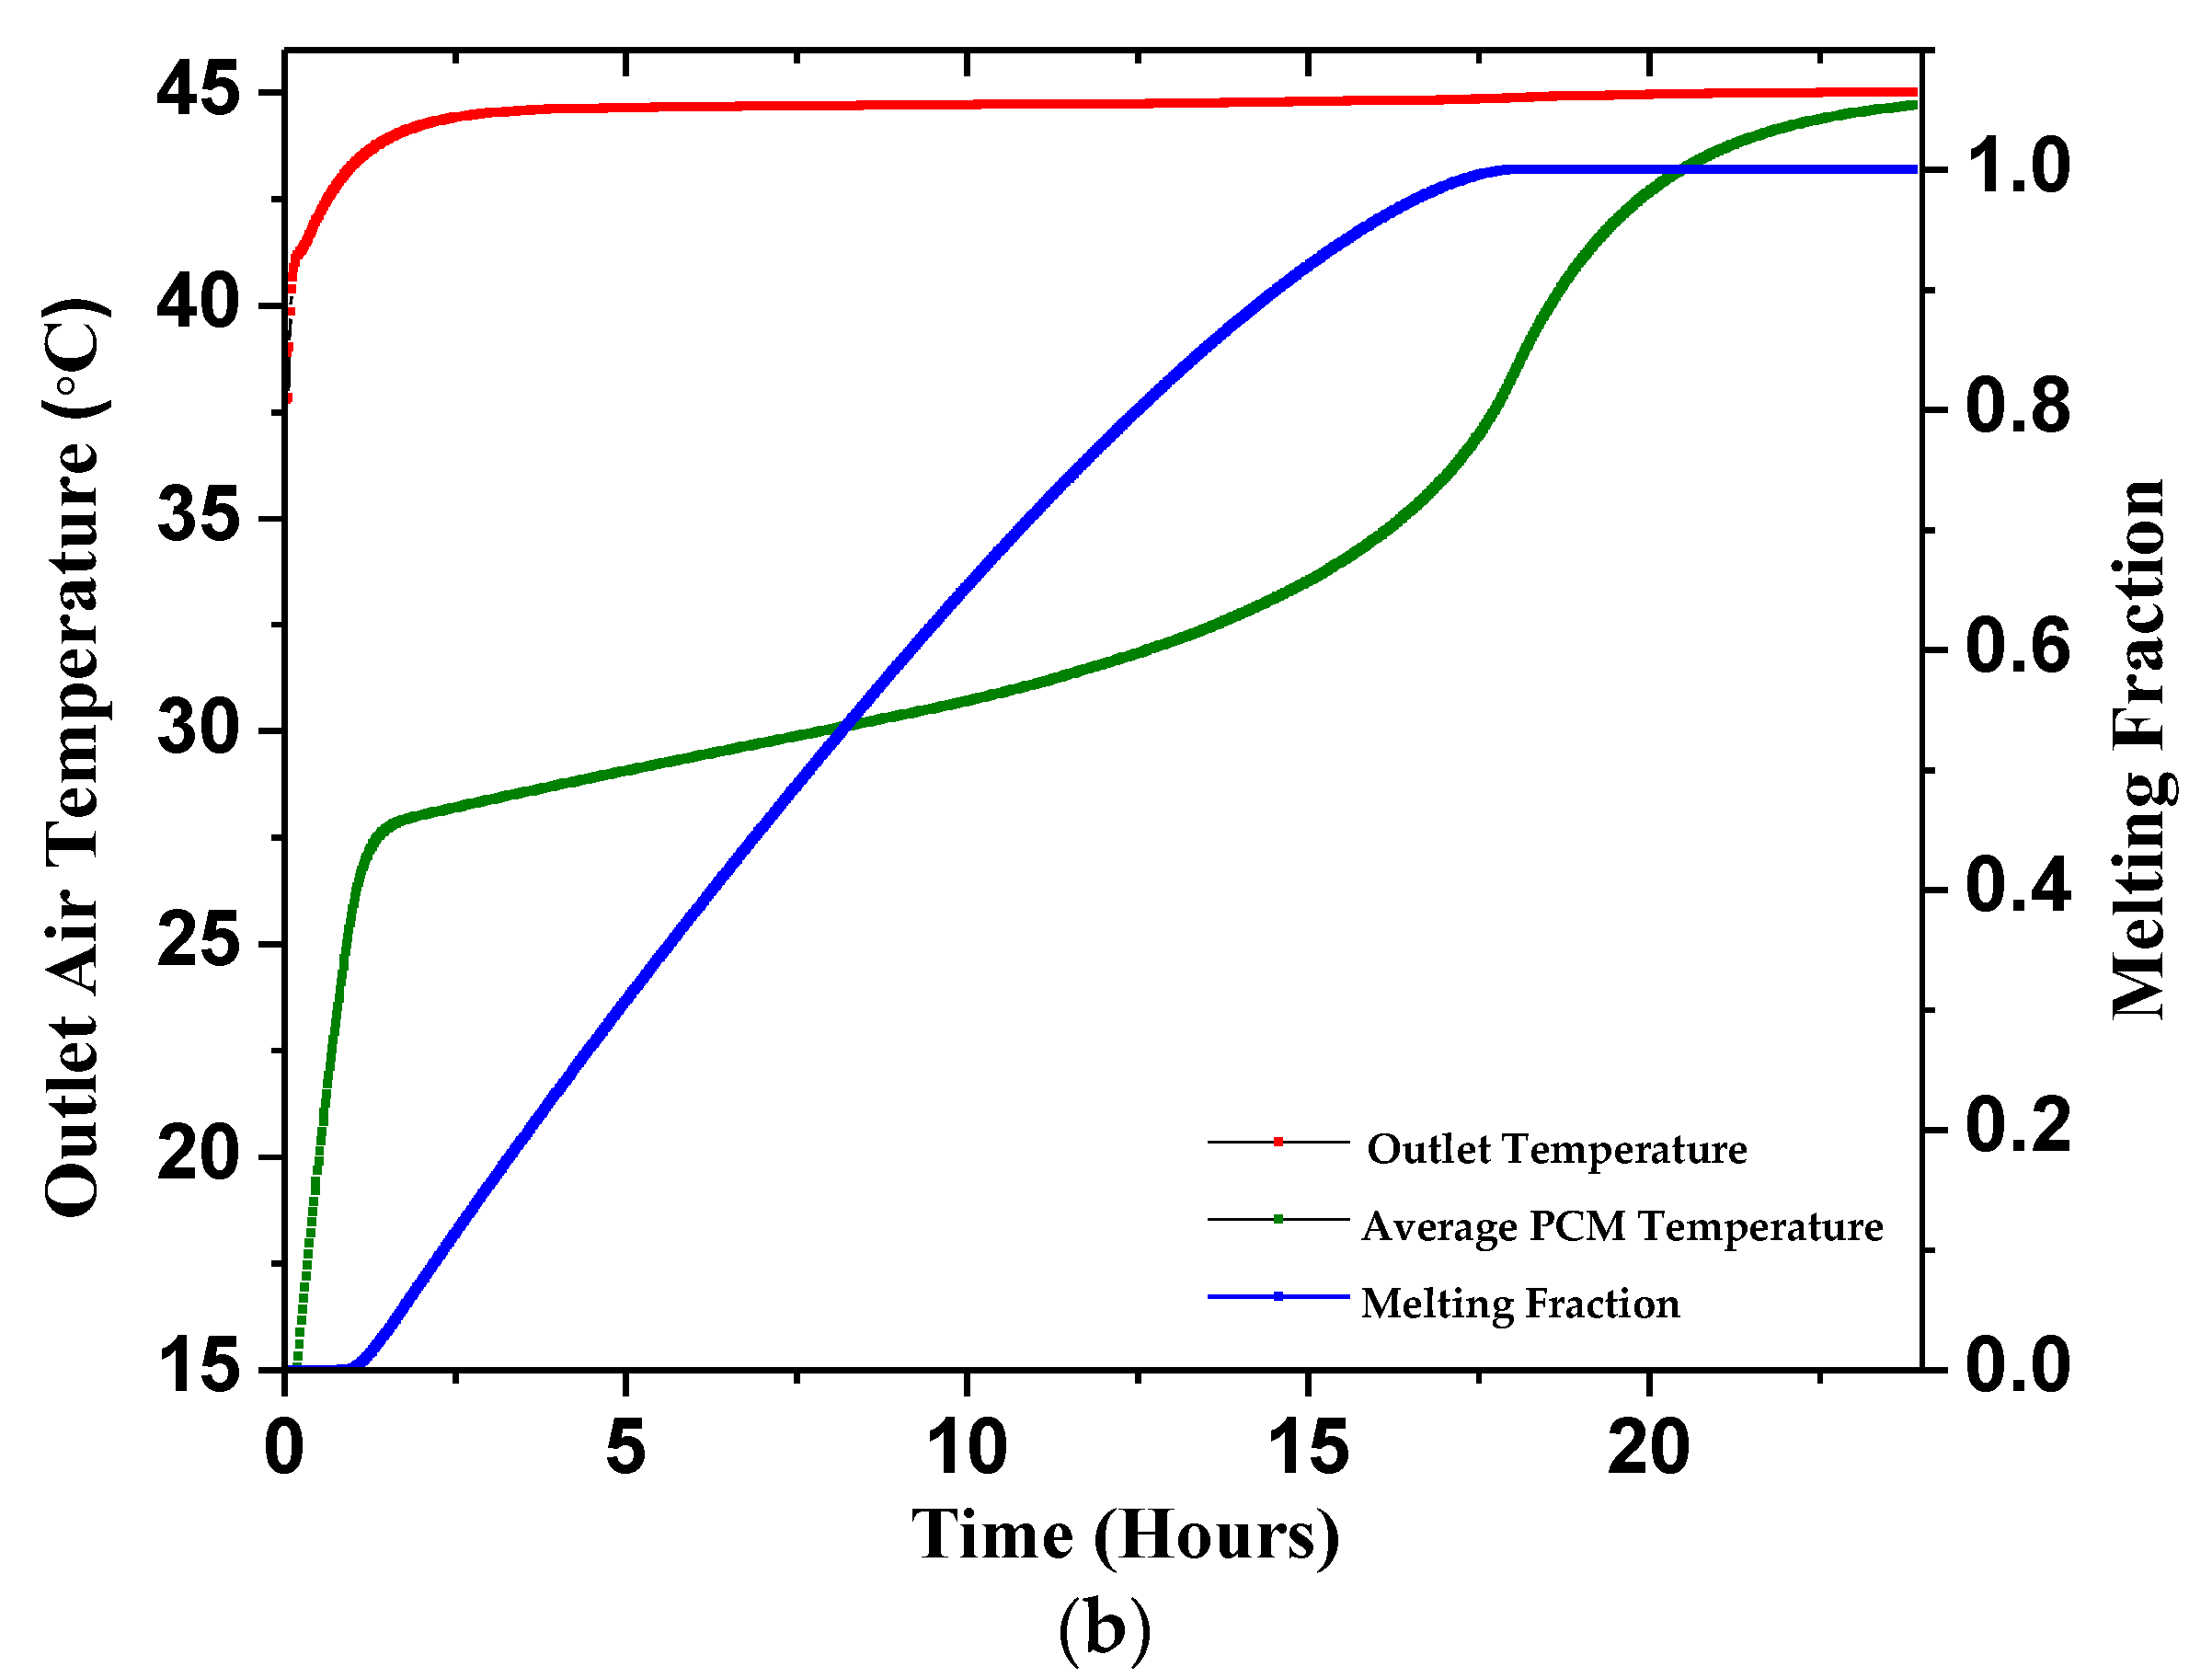
4.2.1. Outlet Temperature

Figure 5a–d show the 24 h assessment of air outlet temperature using RT-31 as the PCM. Figure 5a shows the effects of 1 m/s air on Designs 1, 2, 3, and 4. Using PCM enclosures in the duct system, the outlet air temperature is reduced below the input temperature, with a temperature drop of about 7 °C for Design 1, 10 °C for Design 2, 12 °C for Design 3, and 12.2 °C for Design 4. The drop in air temperature is attributed to the heat transfer to the cooled PCM, which absorbs the passing air heat and exhibits a solid–liquid phase transition. The PCM kept absorbing thermal energy at a nearly constant temperature until it completely melted and started to heat up sensibly, thus reducing the heat transfer from hot outside air to the PCM. The heated PCM eventually reached a steady state with the ambient temperature in approximately 12.5 h for Design 1, 15 h for Design 2, 16.5 h for Design 3, and 18 h for Design 4. It can be noted that the PCM reached 40 °C in 12 min, 54 min, 57 min, and 1.5 h in the case of Design 1, Design 2, Design 3, and Design 4, respectively. Since the inlet air temperature remained around 45 °C at the peak daytime for 2 to 3 h, hence the proposed designs can provide a considerable drop in temperature and a resulting reduction in the cooling load, leading to an improved COP of AC, reducing the installed capacity, and saving energy. Figure 5b shows the impact of increasing the air speed to 2 m/s at a constant inlet air temperature of 45 °C subjected to Designs 1, 2, 3, and 4. The peak air temperature dropped to a maximum of 4 °C for Design 1, 7 °C for Design 2, and 8 °C for Design 3 and Design 4. In Figure 5c, all four designs are subjected to 3 m/s, thereby achieving the peak inlet air temperature drop of 6.5 °C at the most with Design 4 and 3 °C at the least with Design 1. In Figure 5d, all four designs are exposed to an air inlet velocity of 4 m/s, with the highest temperature drops thereby showing a 5 °C drop in peak air temperature at most with Design 4 and 2.5 °C at least with Design 1. As the effective duration of heat transfer decreases with increases in velocity, the temperature drop observed at the outlet air reduces.
The numerical scheme is tested by replacing the paraffin-based PCM (RT-31) with a salt hydrate PCM (CaCl2·6H2O) to evaluate the impact of the PCM on the performance of the proposed air pre-cooling system.
Results are presented in Figure 6a–d. Figure 6a shows that Design 1 observed the lowest drop of 7 °C in the peak air temperature while Design 4 observed the highest drop of 12 °C in the peak air temperature. Design 1 maintained an outlet air temperature below 40 °C for 12 min, while Design 4 maintained an air temperature below 40 °C for 1.4 h. Figure 6b–d, show lesser air temperature drops when the airspeed is increased to 2 m/s, 3 m/s, and 4 m/s, respectively.
The transient outlet air temperature in all cases is lower than the average steady-state ambient air acting as inlet air. The difference is huge in the beginning as the PCM significantly cools the air for the first 1–2 h due to initial PCM cooling by a sensible mechanism, while the difference starts rapidly dropping with time, indicating sensible heating of the PCM. At the advent of the PMC melting point, the PCM starts melting and the temperature of the outlet air stabilizes for 4–5 h due to latent heat absorption by the PCM at near isothermal conditions representative of a steady outlet air temperature. After 7 h in most cases, the PCM completes its phase change and starts absorbing sensible heat, which again increases the gradient of the temperature rise of the outlet air.
The temperature rise happened initially with a higher gradient due to sensible heating of the PCM in the solid state. At the phase change, the gradient of the temperature rise is reduced and kept lower until the PCM has fully melted, after 12 h in most cases. After the PCM had melted completely, the gradient started to pick up again due to sensible heating of the PCM in liquid form and finally stabilized due to thermal equilibrium with the outdoor air temperature.

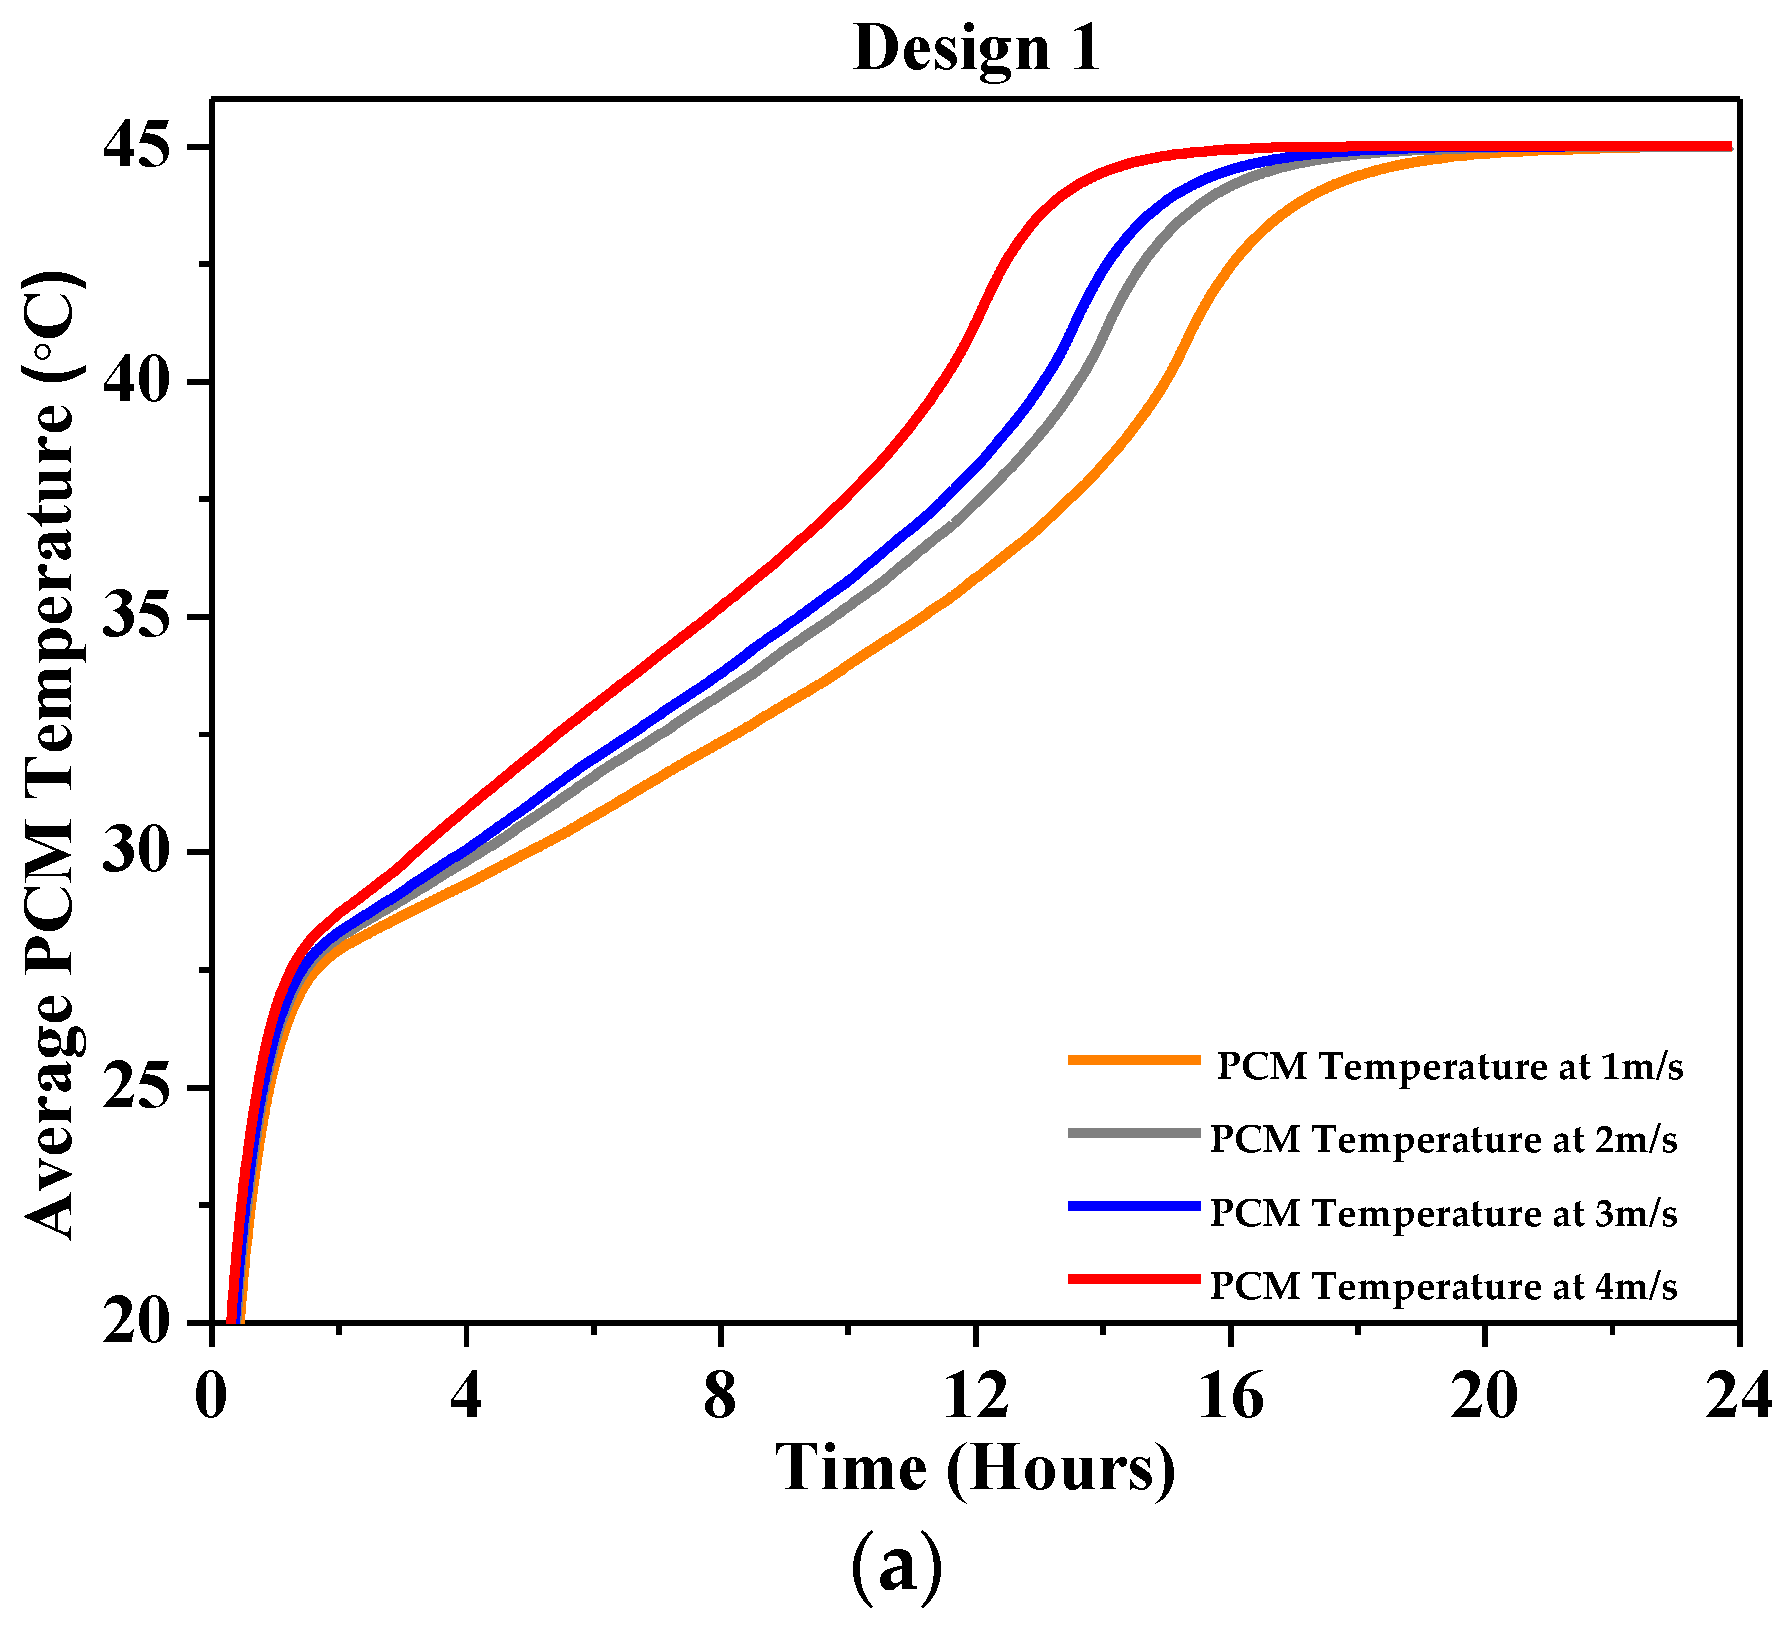
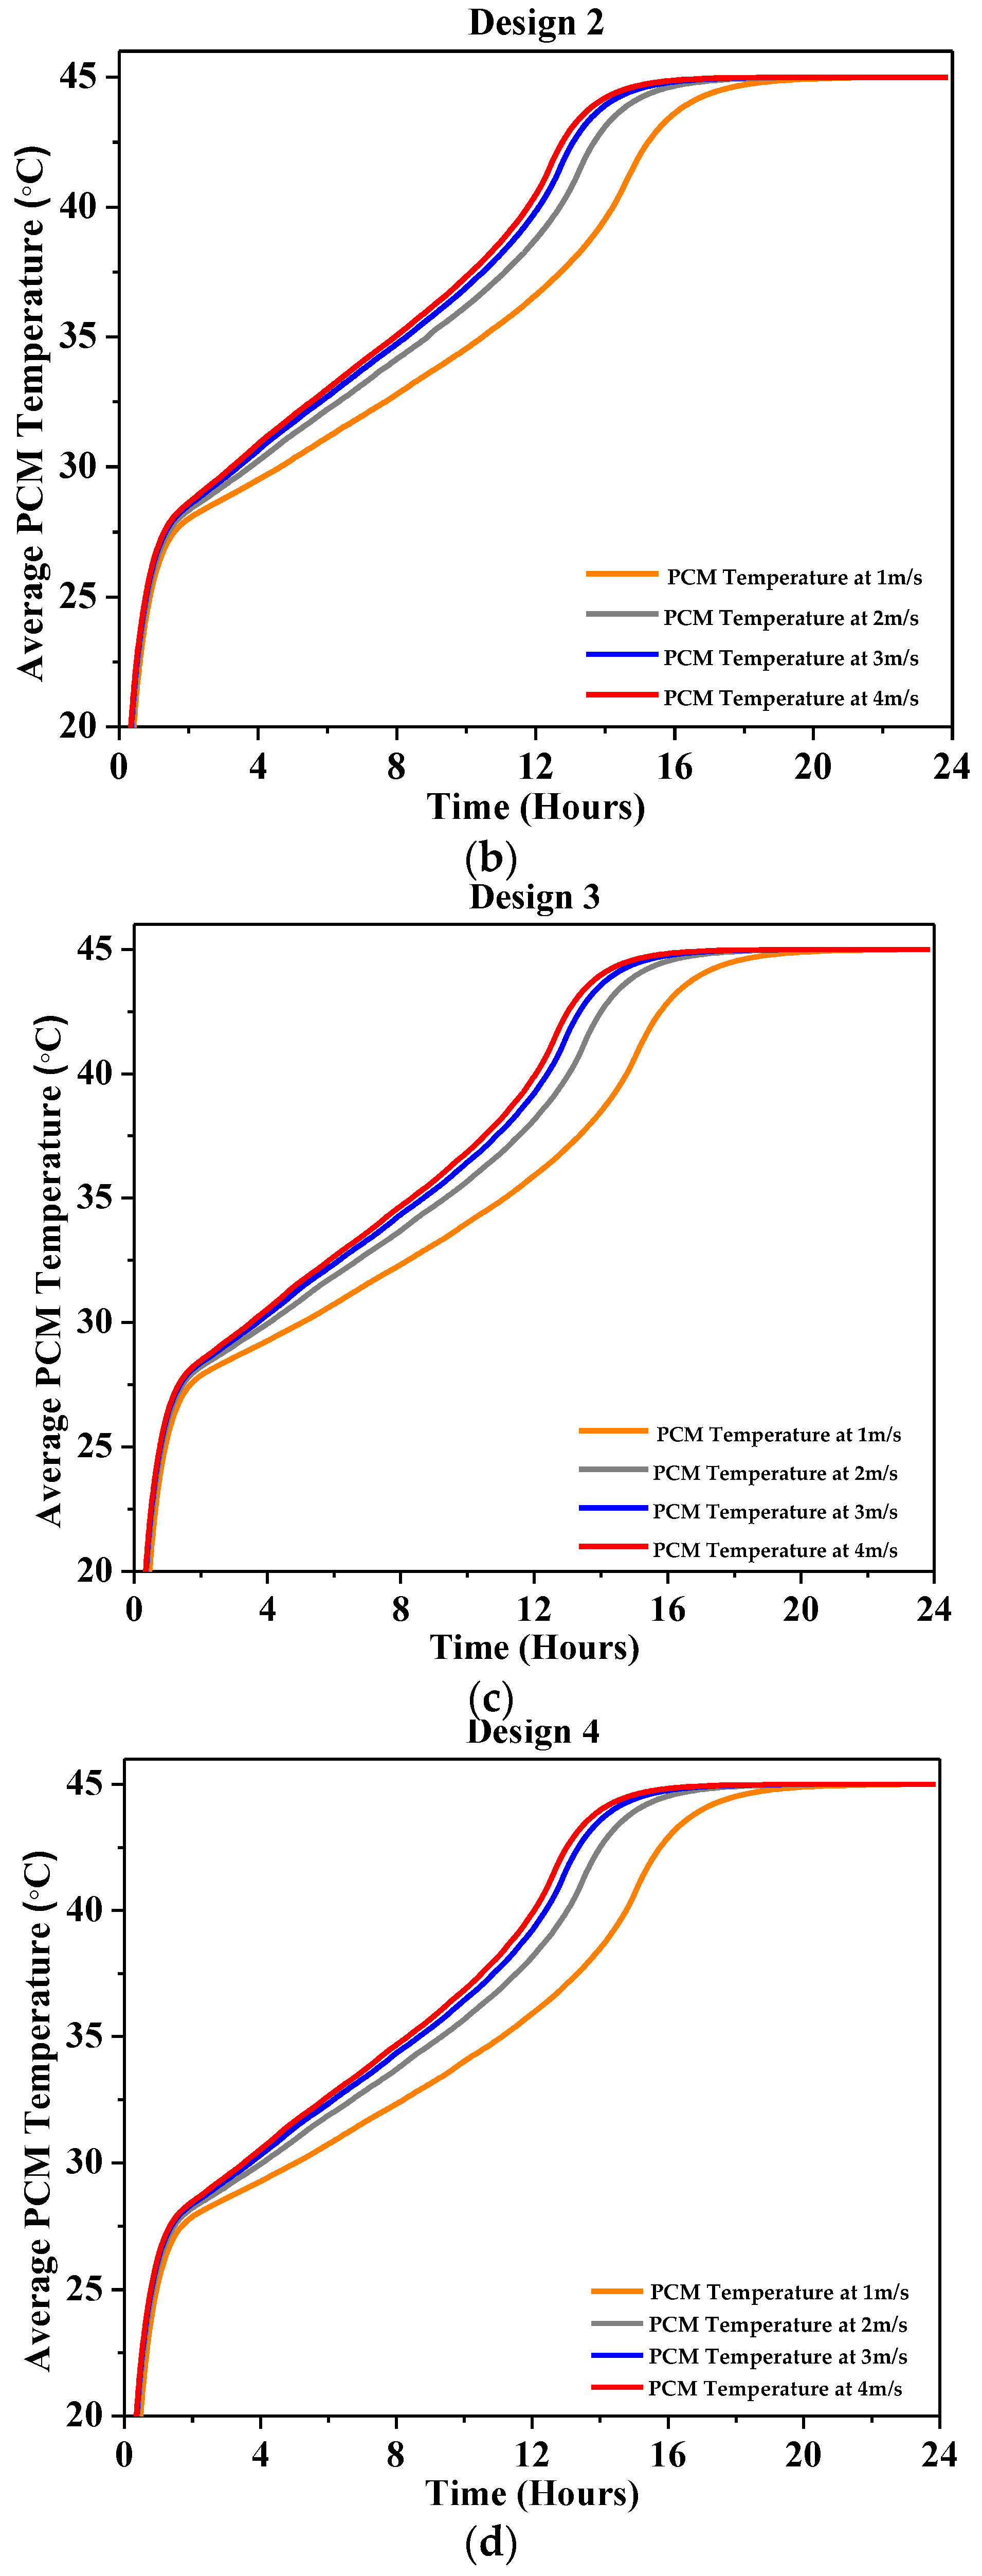
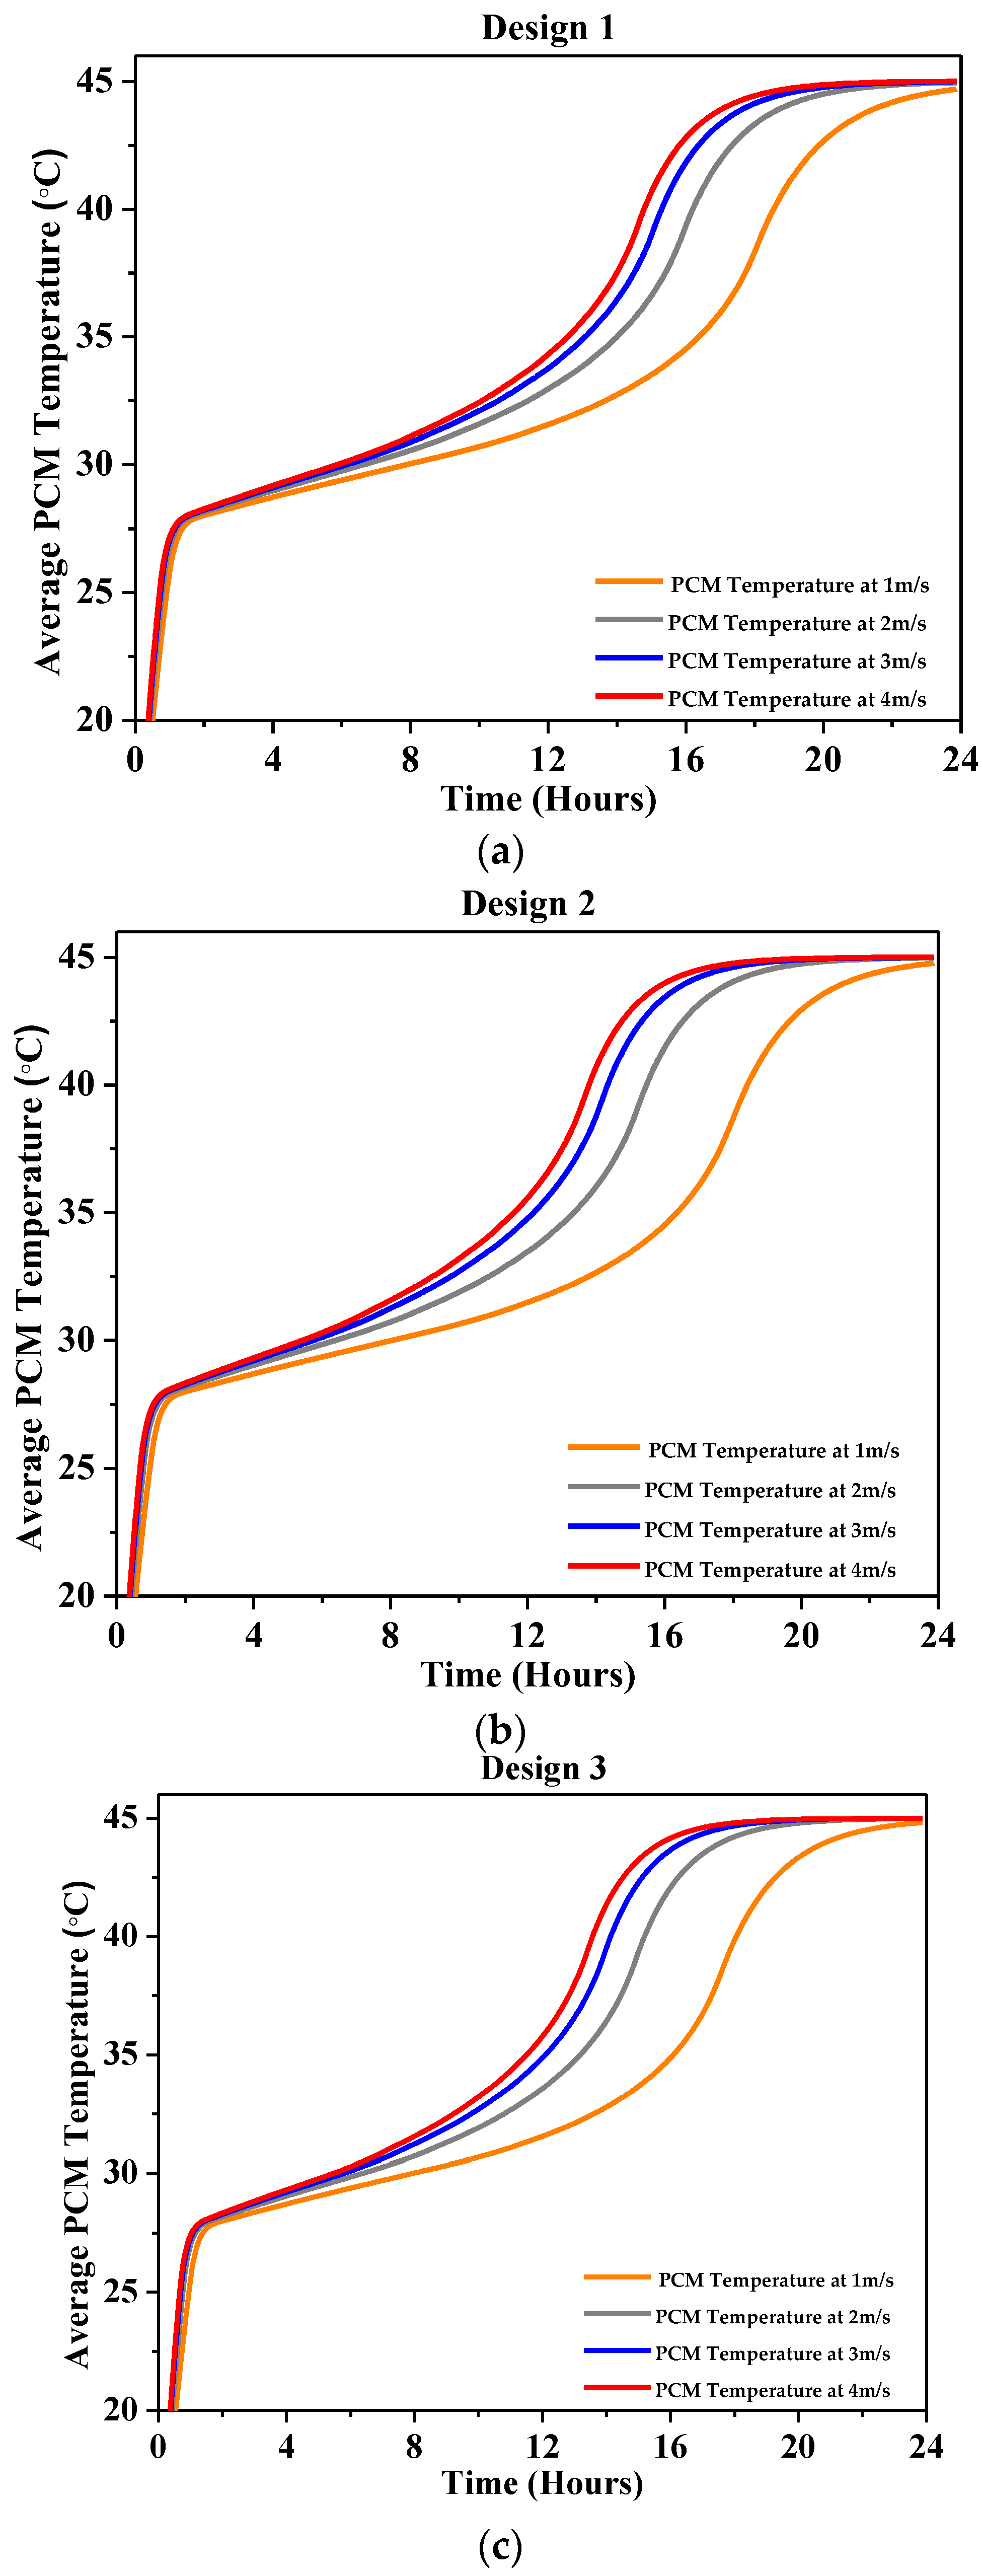
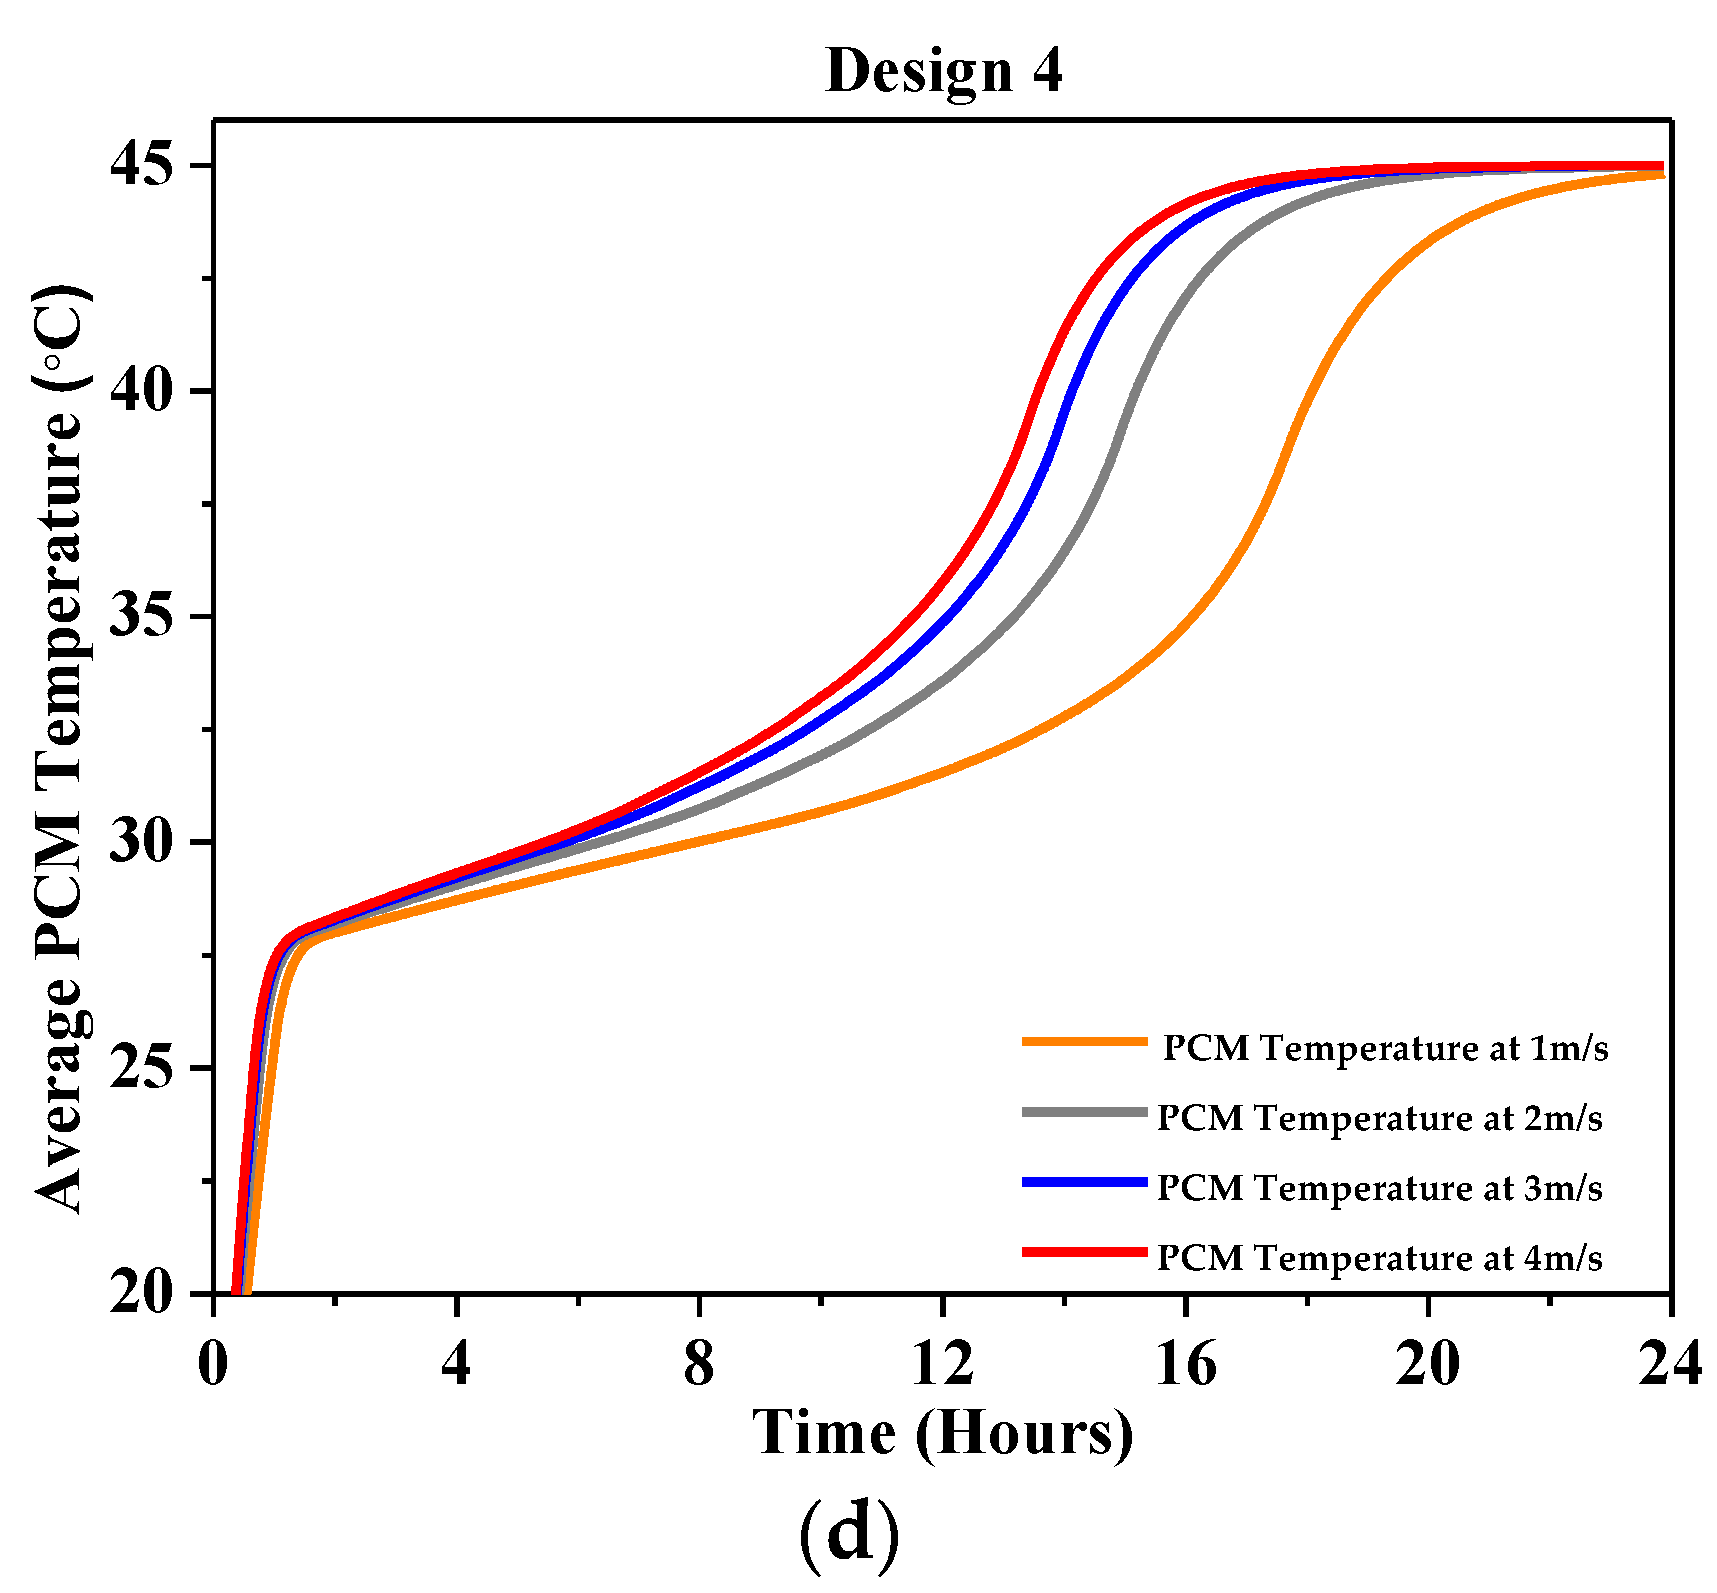
4.2.2. Average PCM Temperature

Figure 7a–d and Figure 8a–d show the average PCM temperatures for Designs 1, 2, 3, and 4 of RT-31 and CaCl2·6H2O at different velocities (1 m/s, 2 m/s, 3 m/s, and 4 m/s). In Figure 7a, it can be observed that sensible heating occurs in the PCM temperature range of 20 °C–27 °C for a very short time followed by the latent heat absorption, as reflected by a lower temperature gradient from PCM temperature of 33 °C to 45 °C. The delayed temperature gradient helps maintain the PCM temperature substantially below the ambient temperature for several hours and helps transfer heat from inlet air to the PCM, thereby producing cooled air at the outlet. A similar trend is observed with a lesser temperature drop when increasing the air velocity to 2 m/s, 3 m/s, and 4 m/s, as shown in Figure 7b–d. As the airspeed increases, the PCM takes less time to reach the reference temperature due to a greater enhanced convective heat transfer coefficient between the air and the PCM.
In the case of CaCl2·6H2O shown in Figure 8a–d, it can be observed that sensible heat storage prevails in the PCM from 20 °C to 27.7 °C, while the latent heat storage dominates from 27.7 °C to 32.5 °C. After complete PCM melting, sensible heat storage takes over from 32.5 °C to 45 °C. As the air velocity increases, the PCM temperature gradient becomes larger and the PCM tends to reach the reference temperature in a shorter time duration as compared to the low velocity.
As shown in Table 2, CaCl2·6H2O possesses a higher latent heat of fusion, density, heat capacity, and thermal conductivity than RT-31; hence, the cooling effect of CaCl2·6H2O is higher than the RT-31, as it produces a higher net cooling effect on the incoming air that is reflected by the lower temperature gradient in Figure 8a–d.

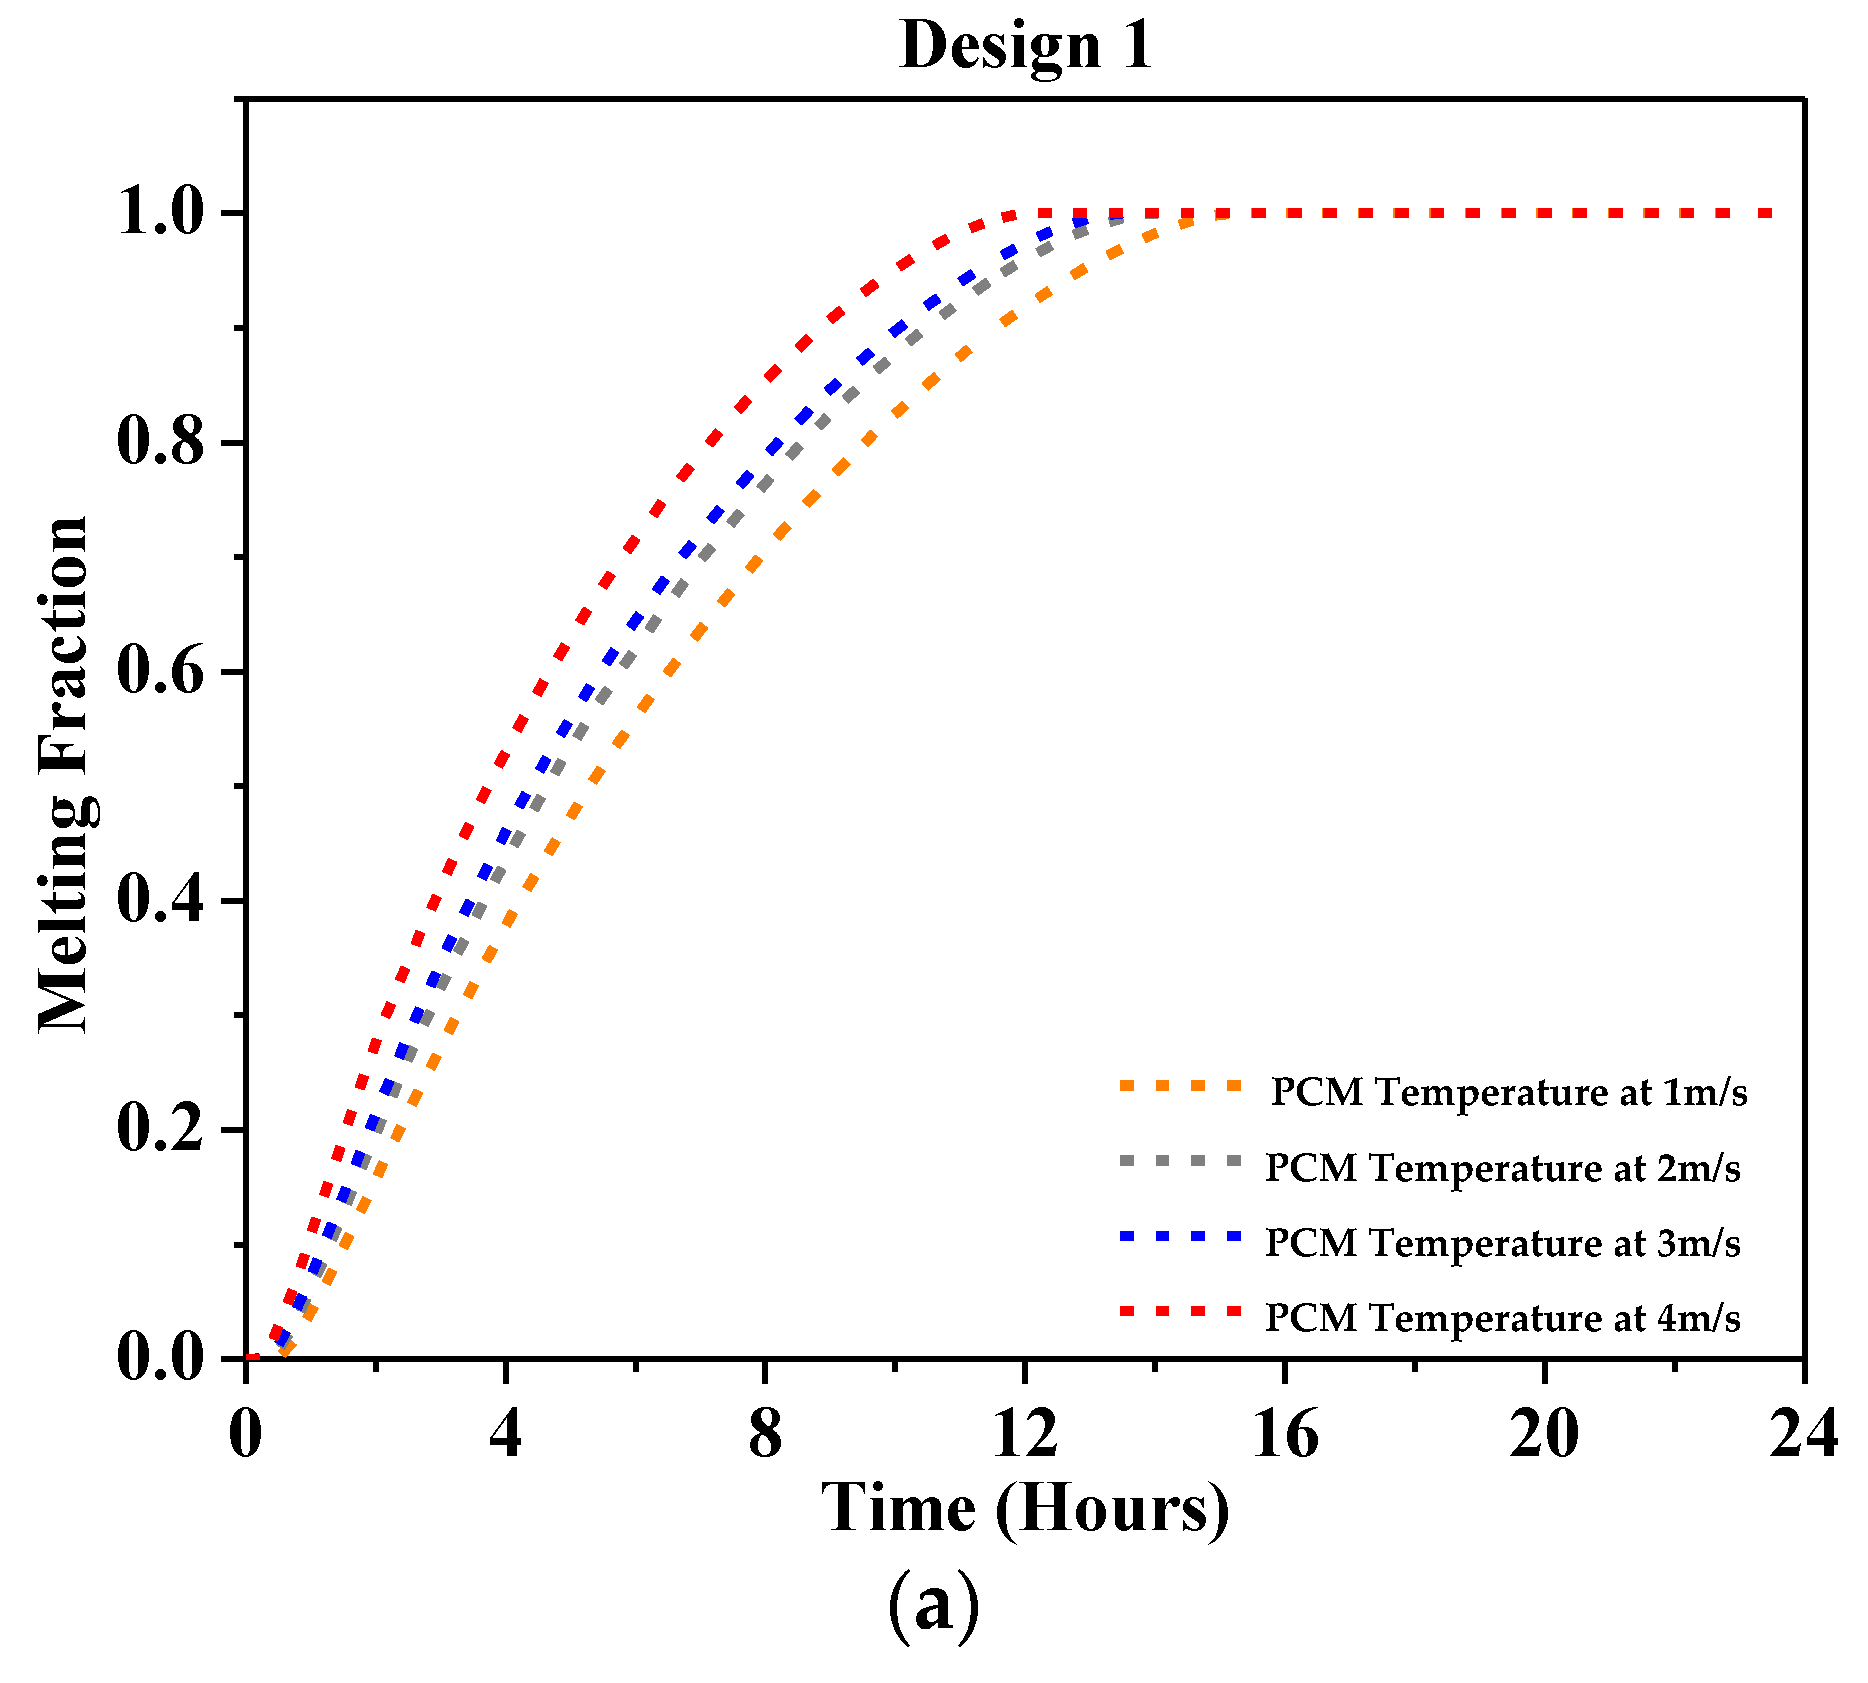
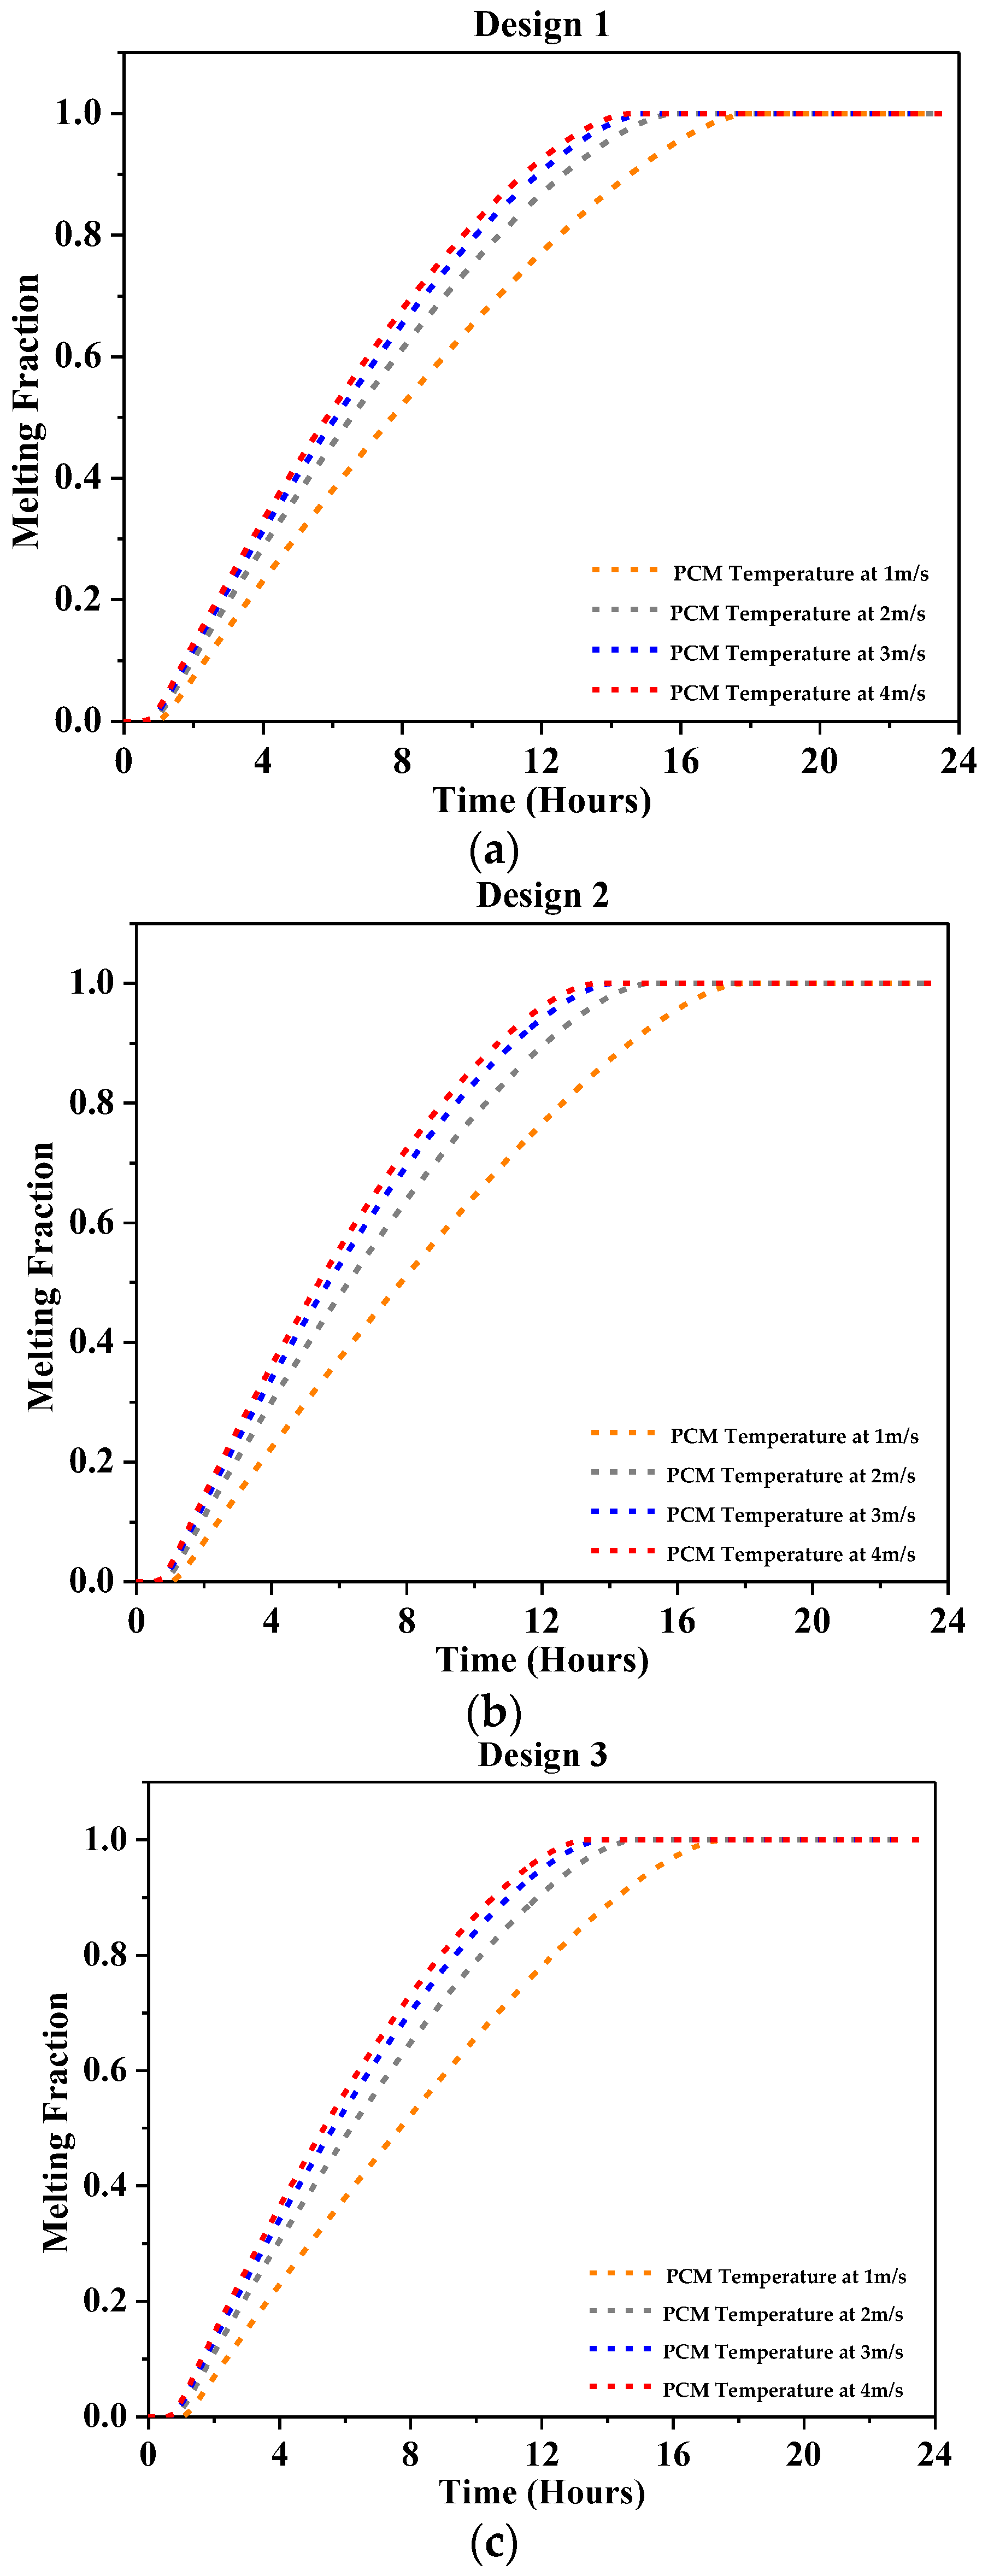
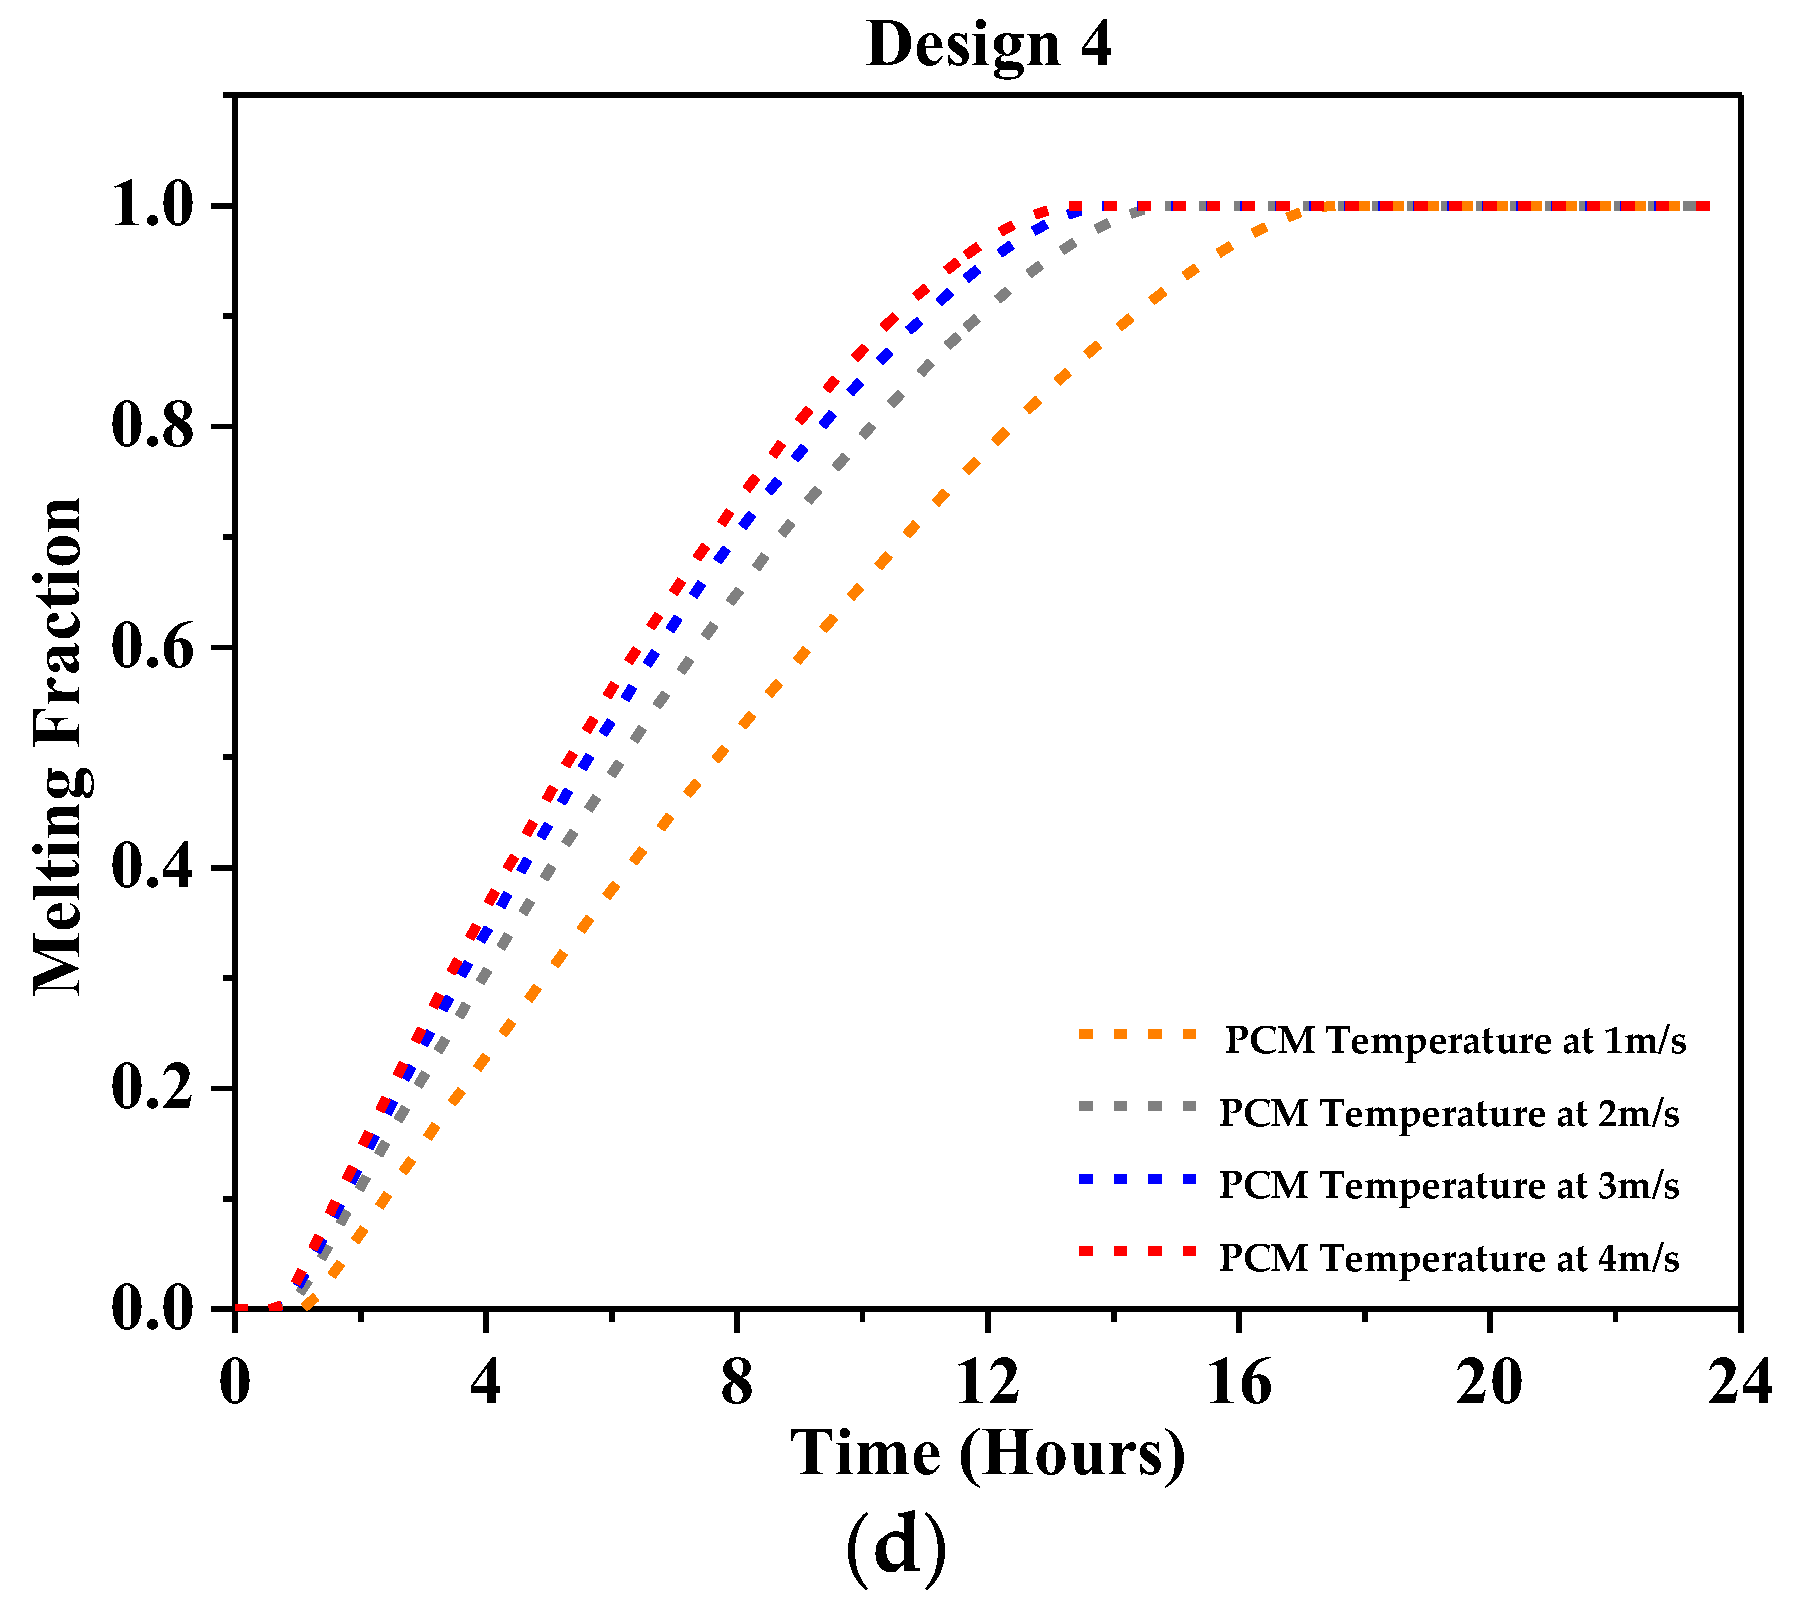
4.2.3. Melting Fraction

During the daytime, the hot outside air routes through the duct containing the PCM to be pre-cooled before entering the evaporator. The effects of PCM containment designs, air speed, and outside air temperature on the PCM melting rate are presented in Figure 9a–d for RT-31 and Figure 9 for CaCl2·6H2O and show the time-based average of the PCM melting fraction during the melting process. The air with an inlet temperature of 45 °C is subjected to Designs 1, 2, 3, and 4 with variable inlet velocities of 1 m/s, 2 m/s, 3 m/s, and 4 m/s. As the air velocity increases, the volume of air flowing over the PCM containers also increases, and hence the heat transfer is increased. Therefore, at an air velocity of 1 m/s, the PCM takes more time to completely melt compared with the air velocity of 4 m/s. Figure 10a–d show the melting fraction of CaCl2·6H2O. The heat transfer is greater compared with RT-31; hence, the temperature drop is greater. Hence, it takes more time to melt than RT-31.

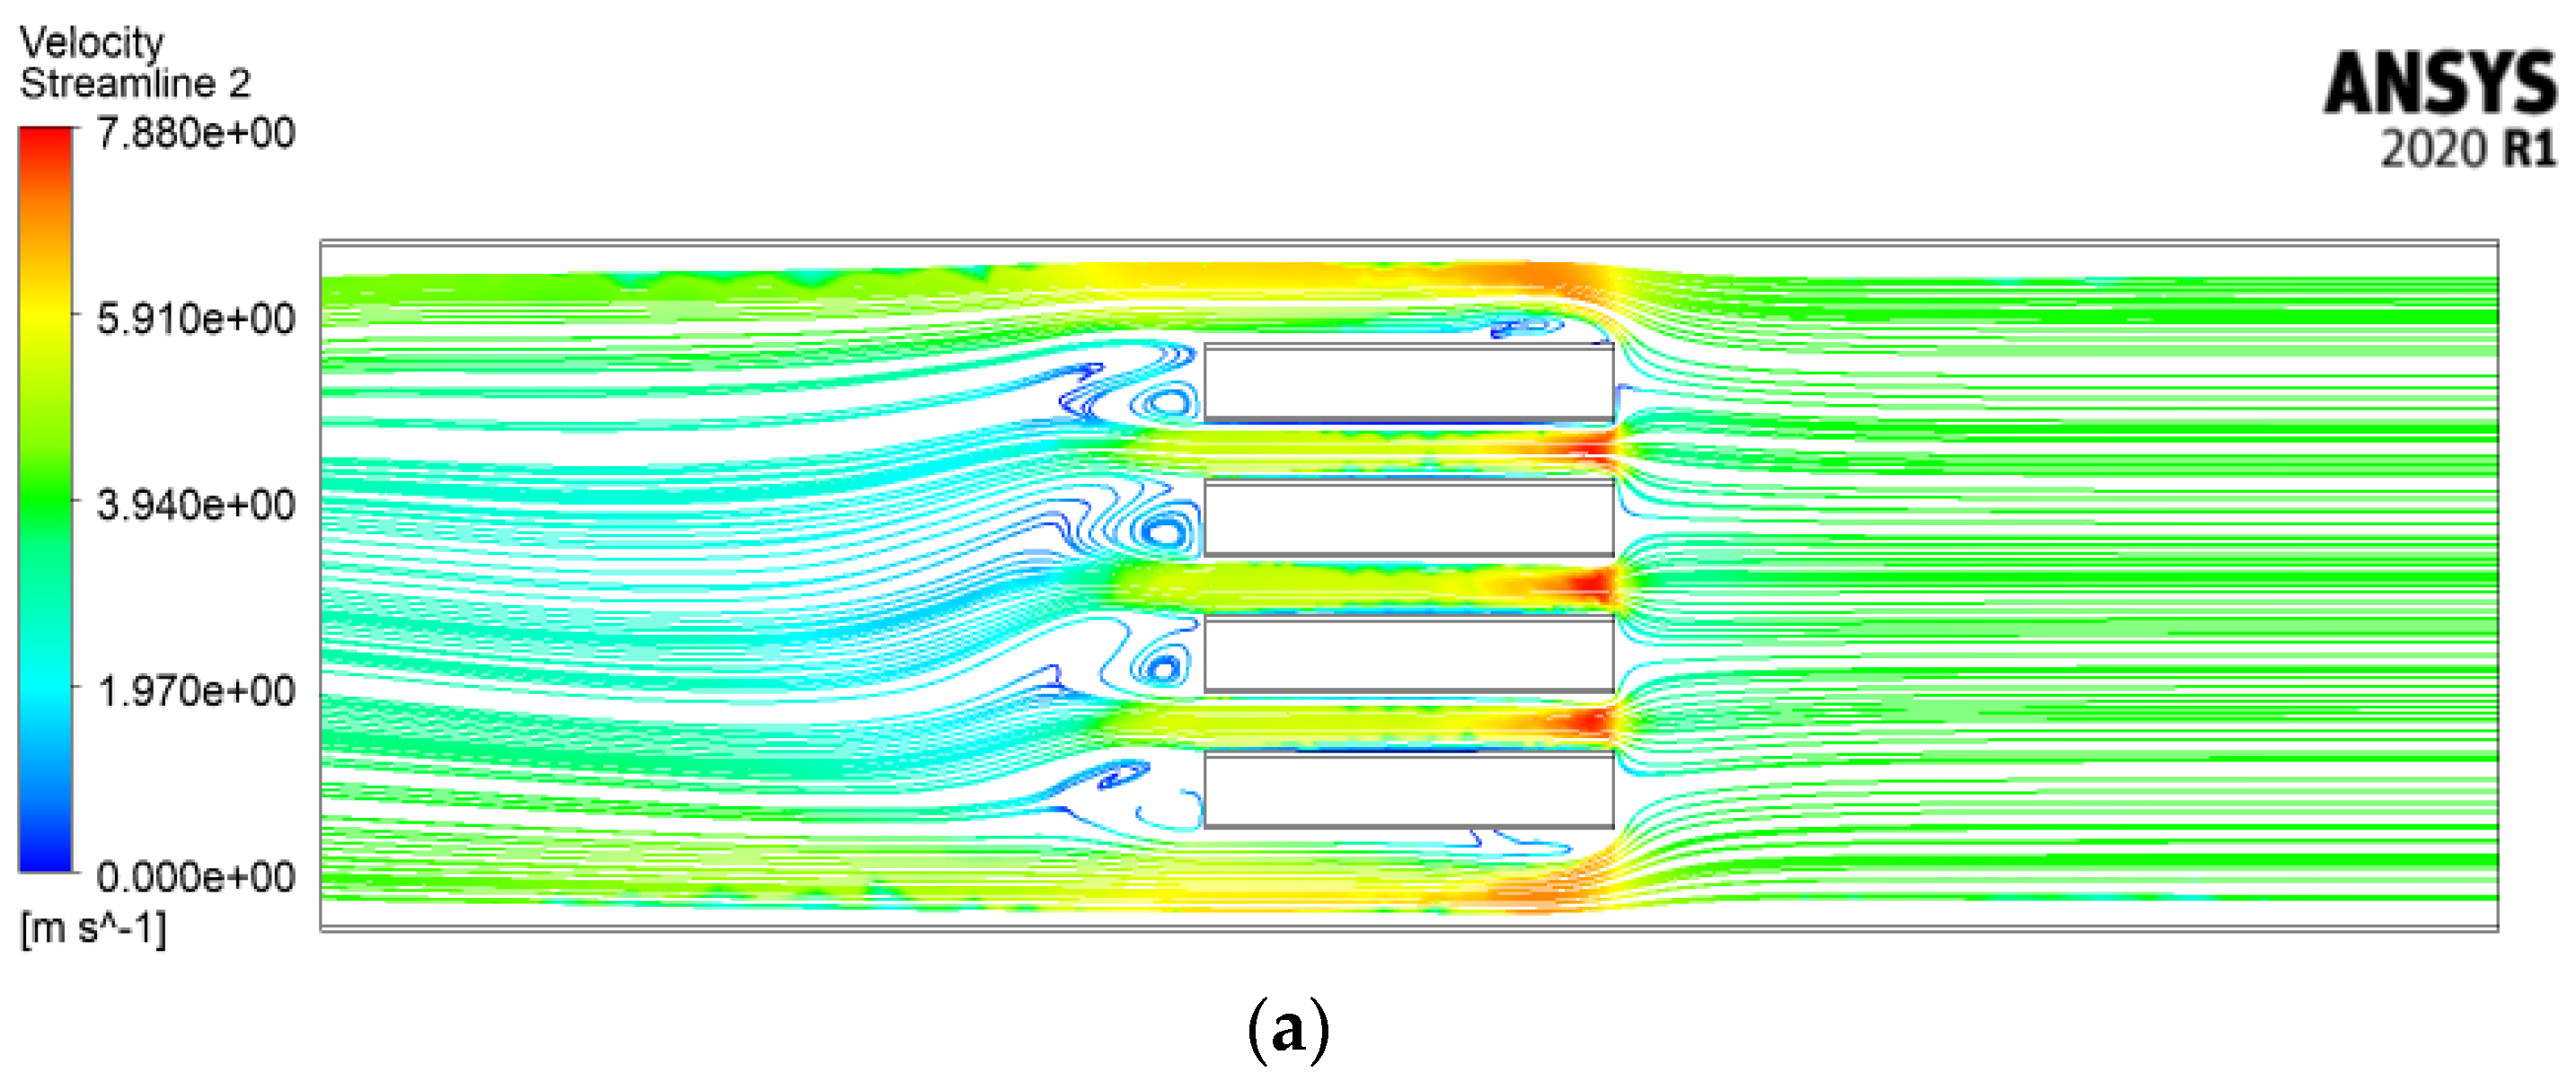
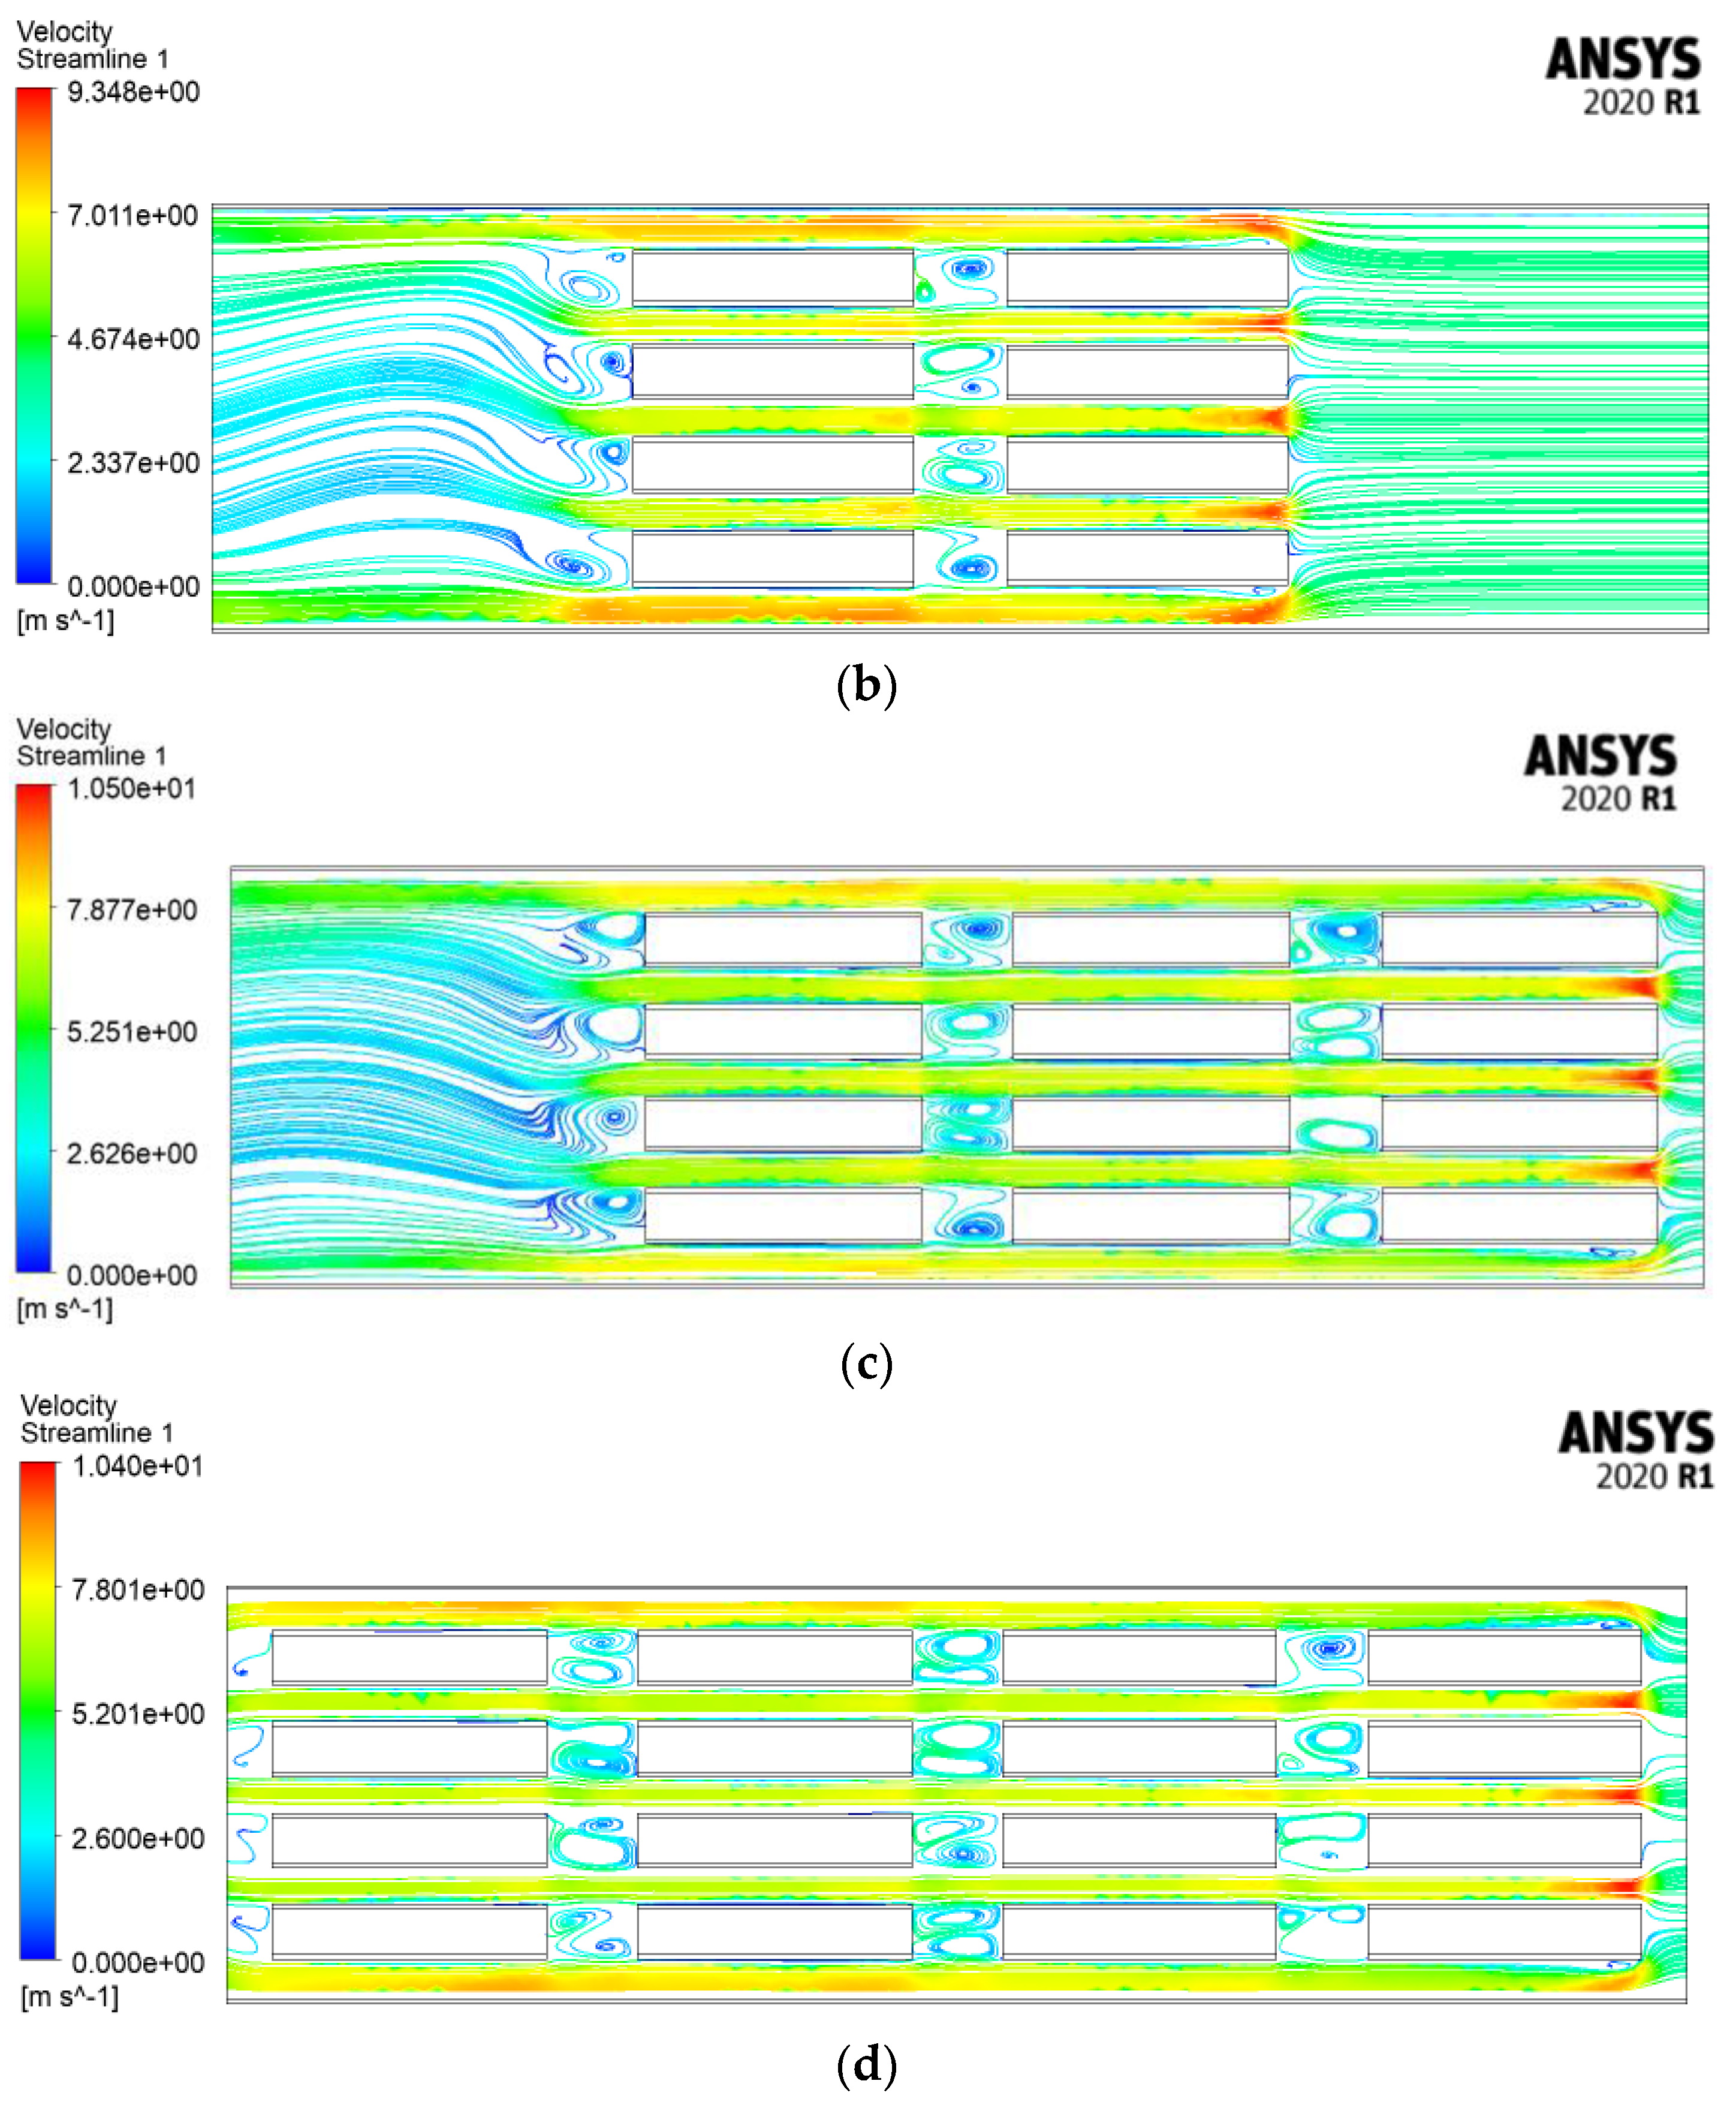
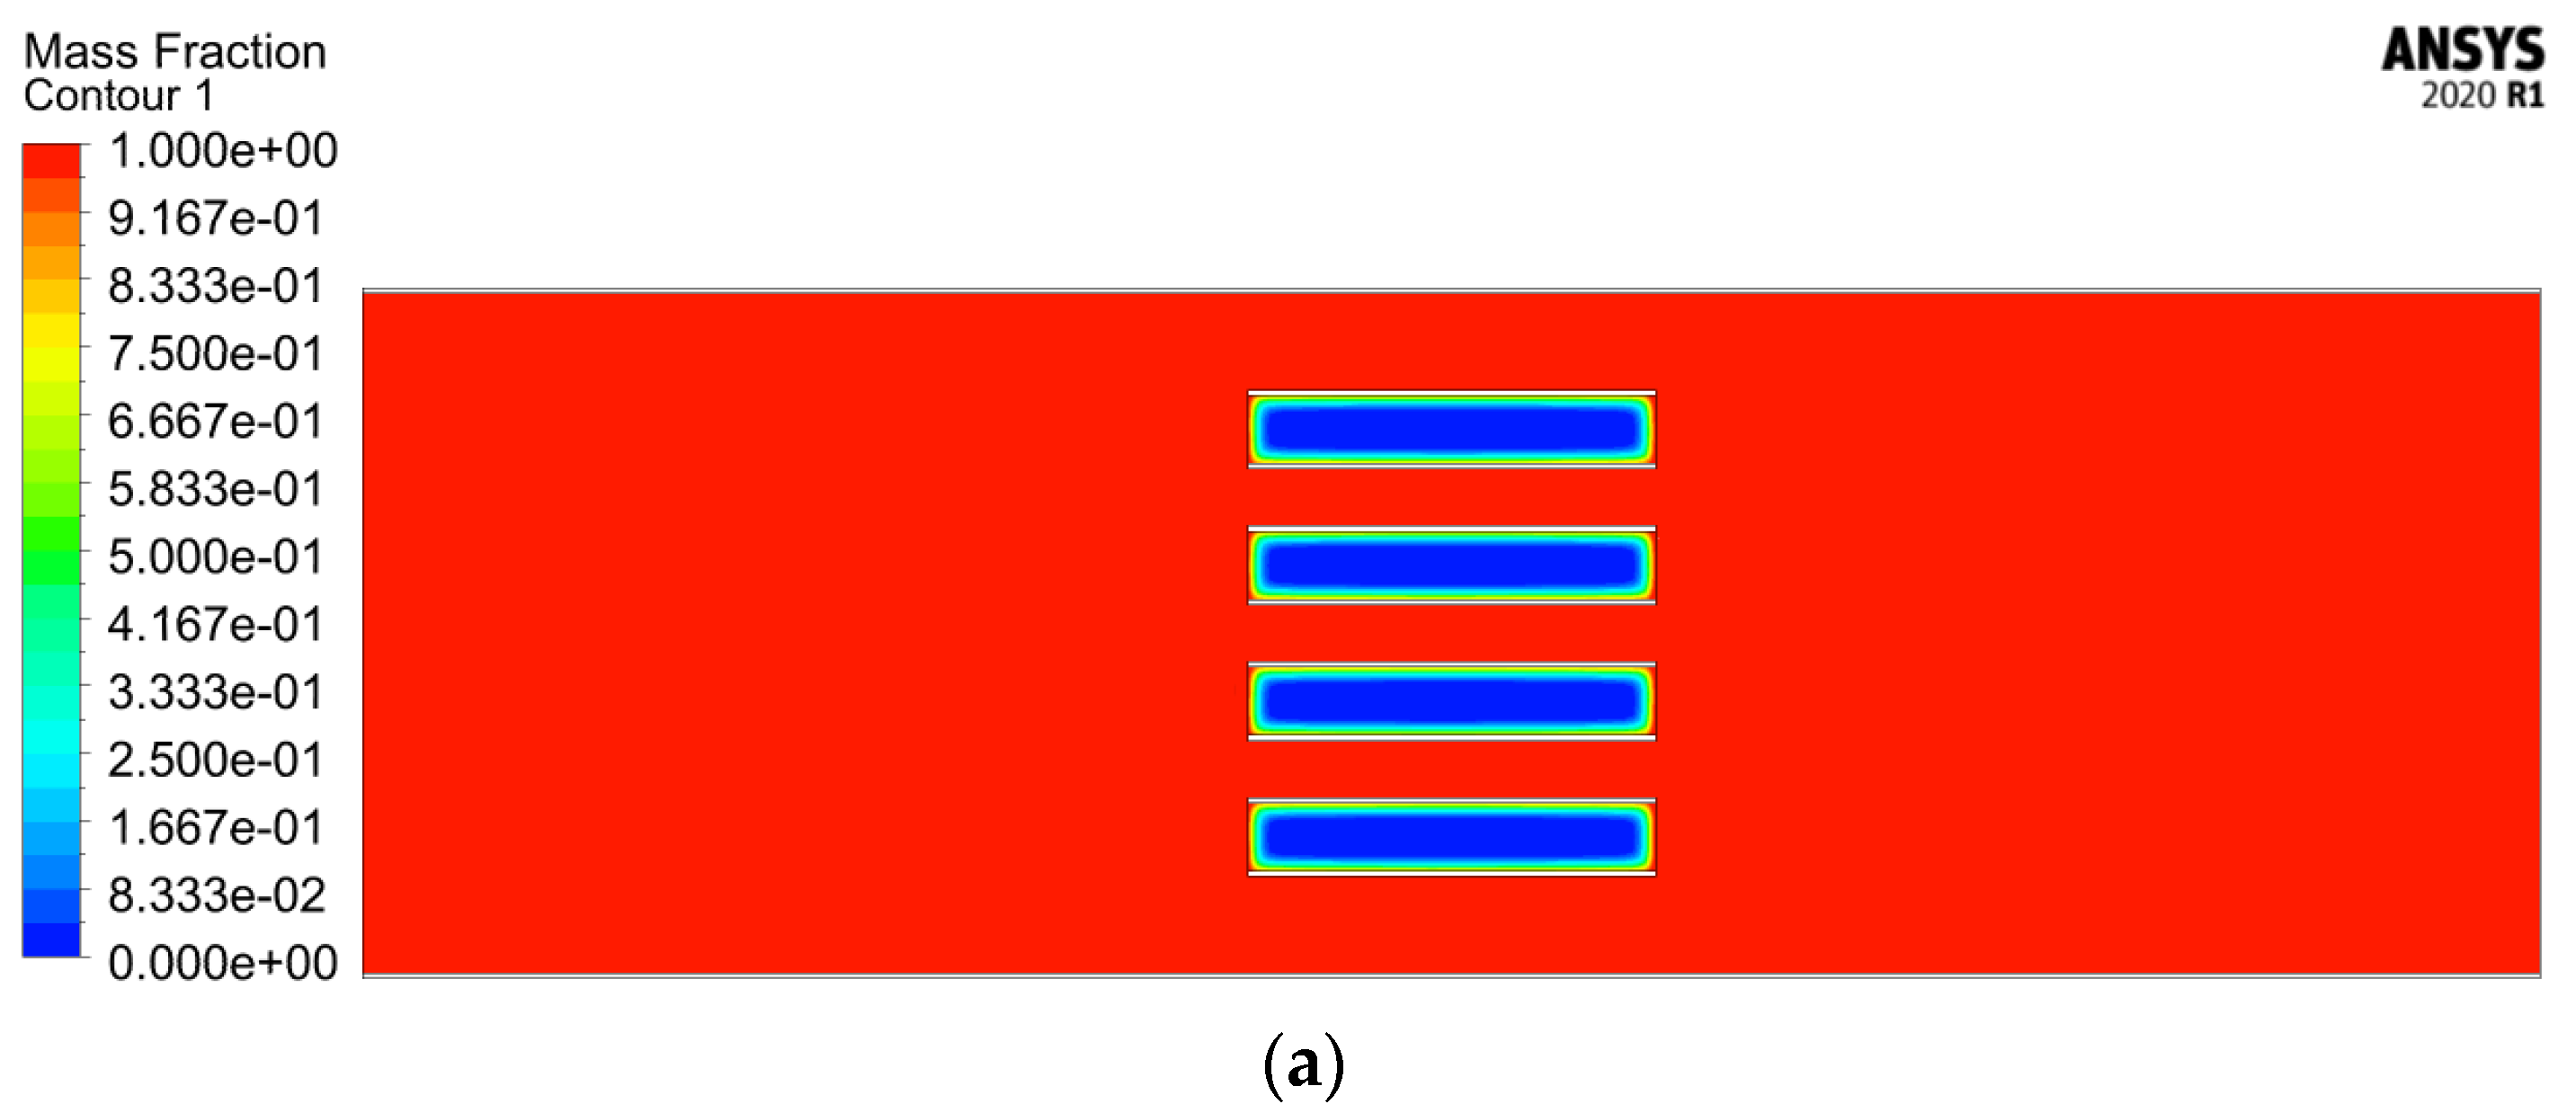
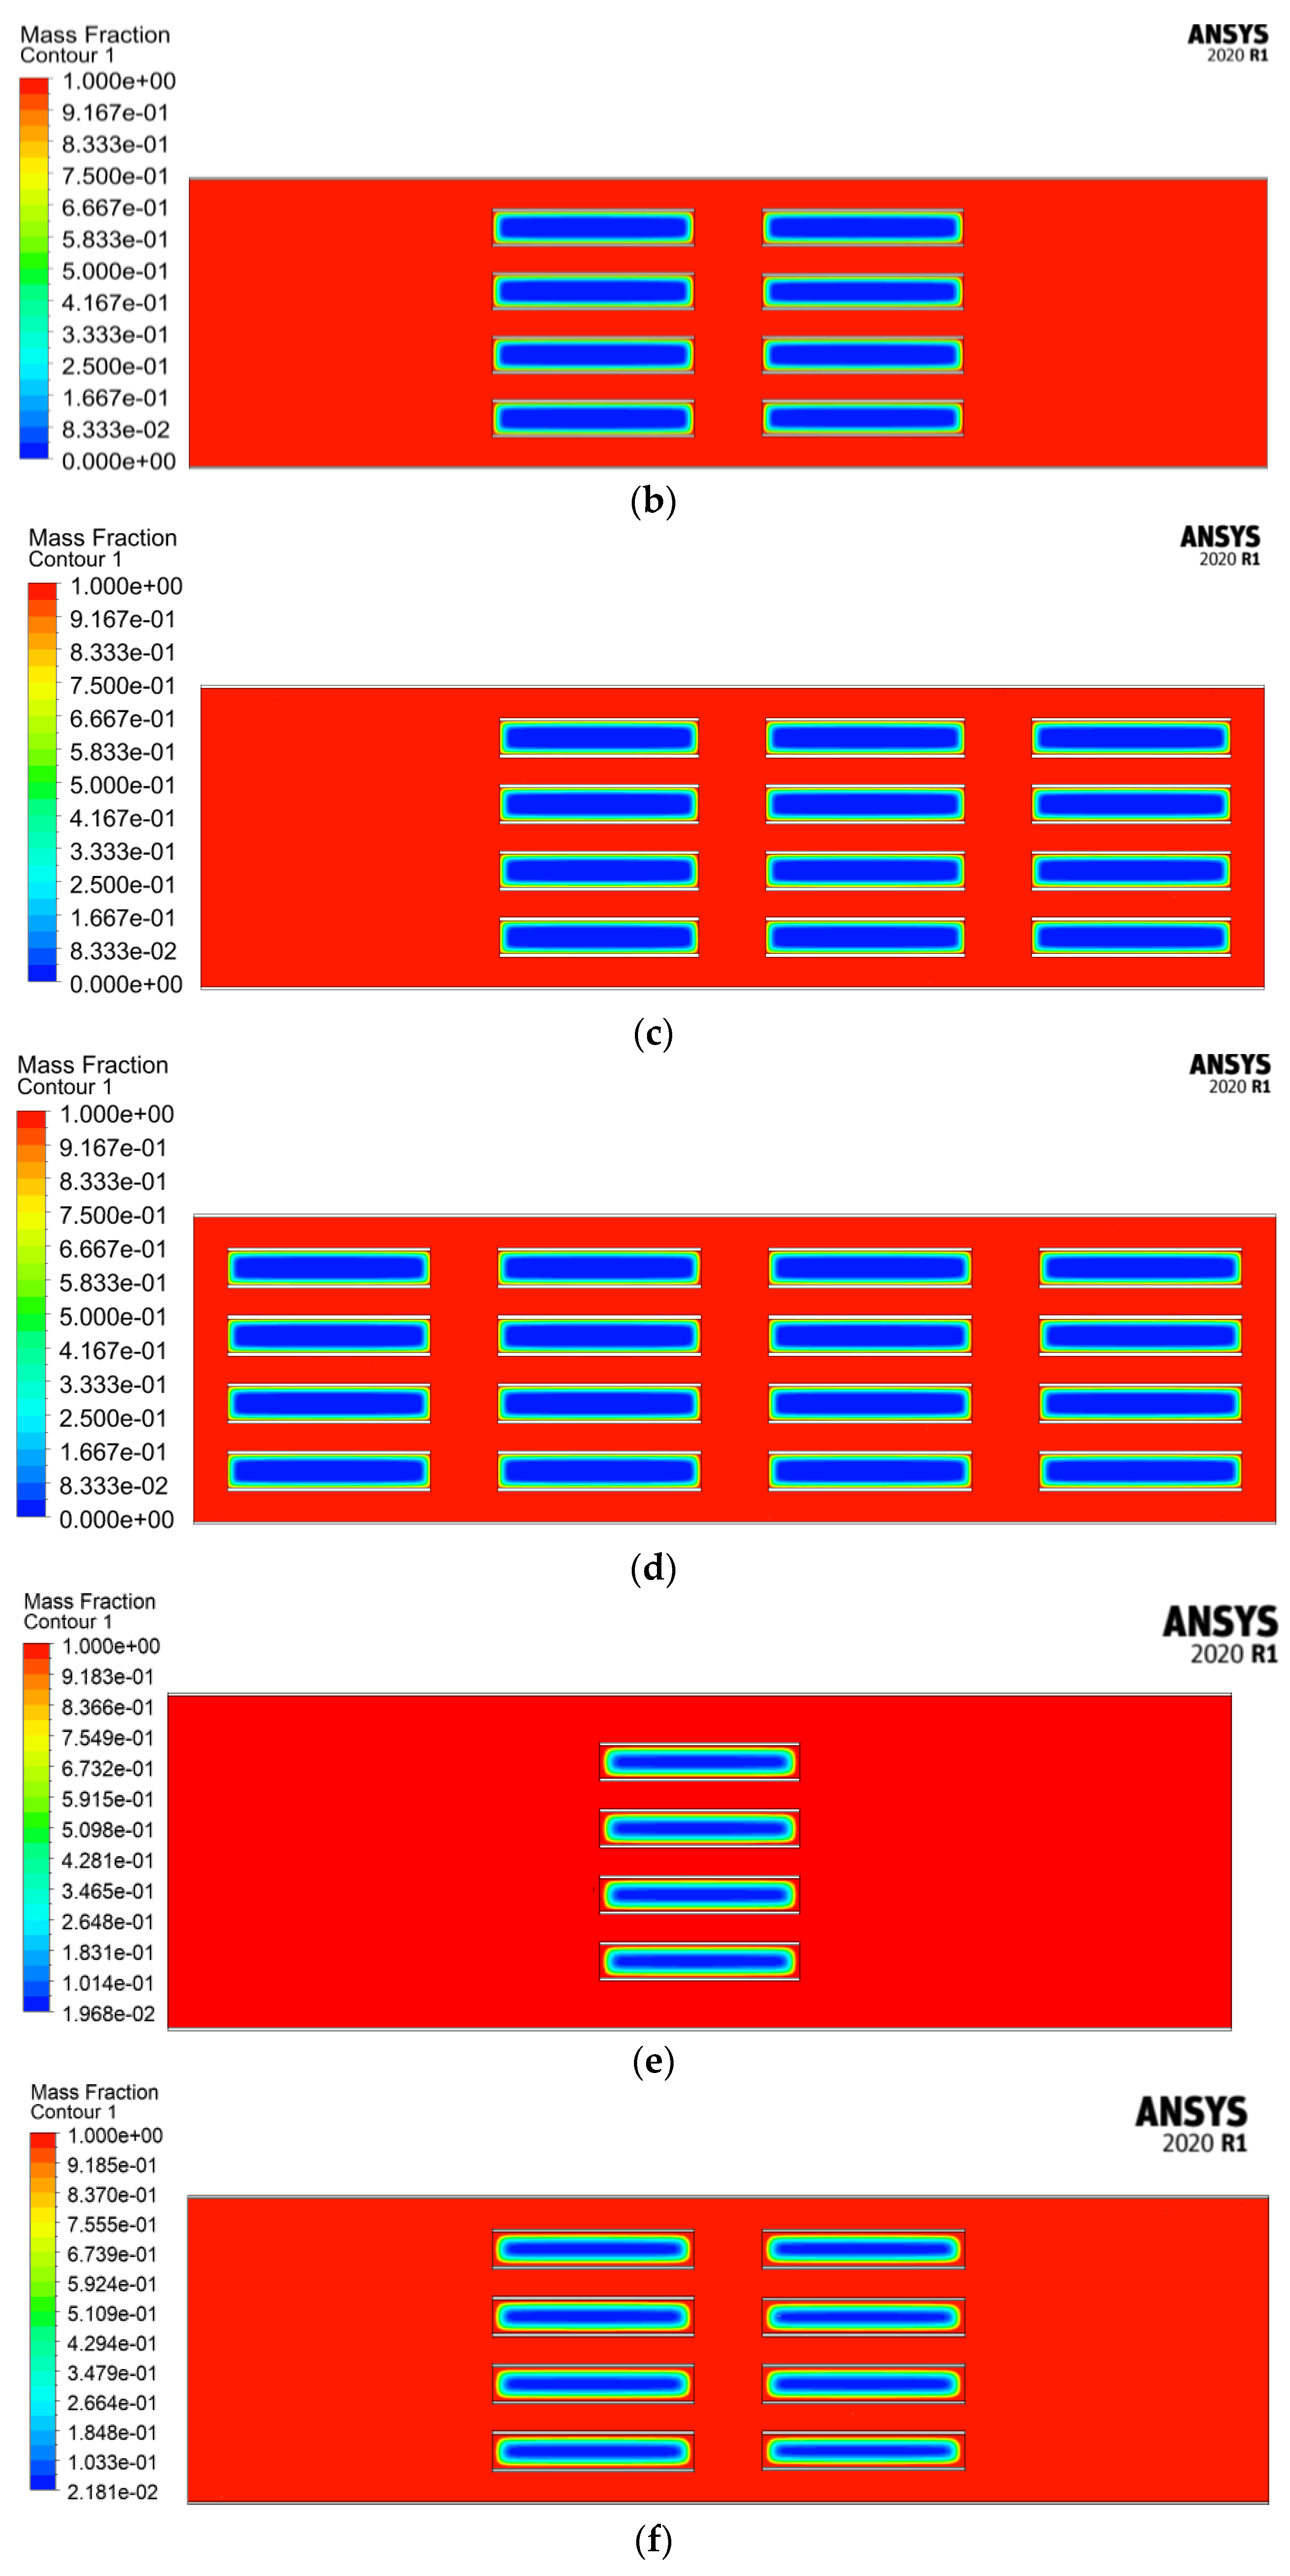
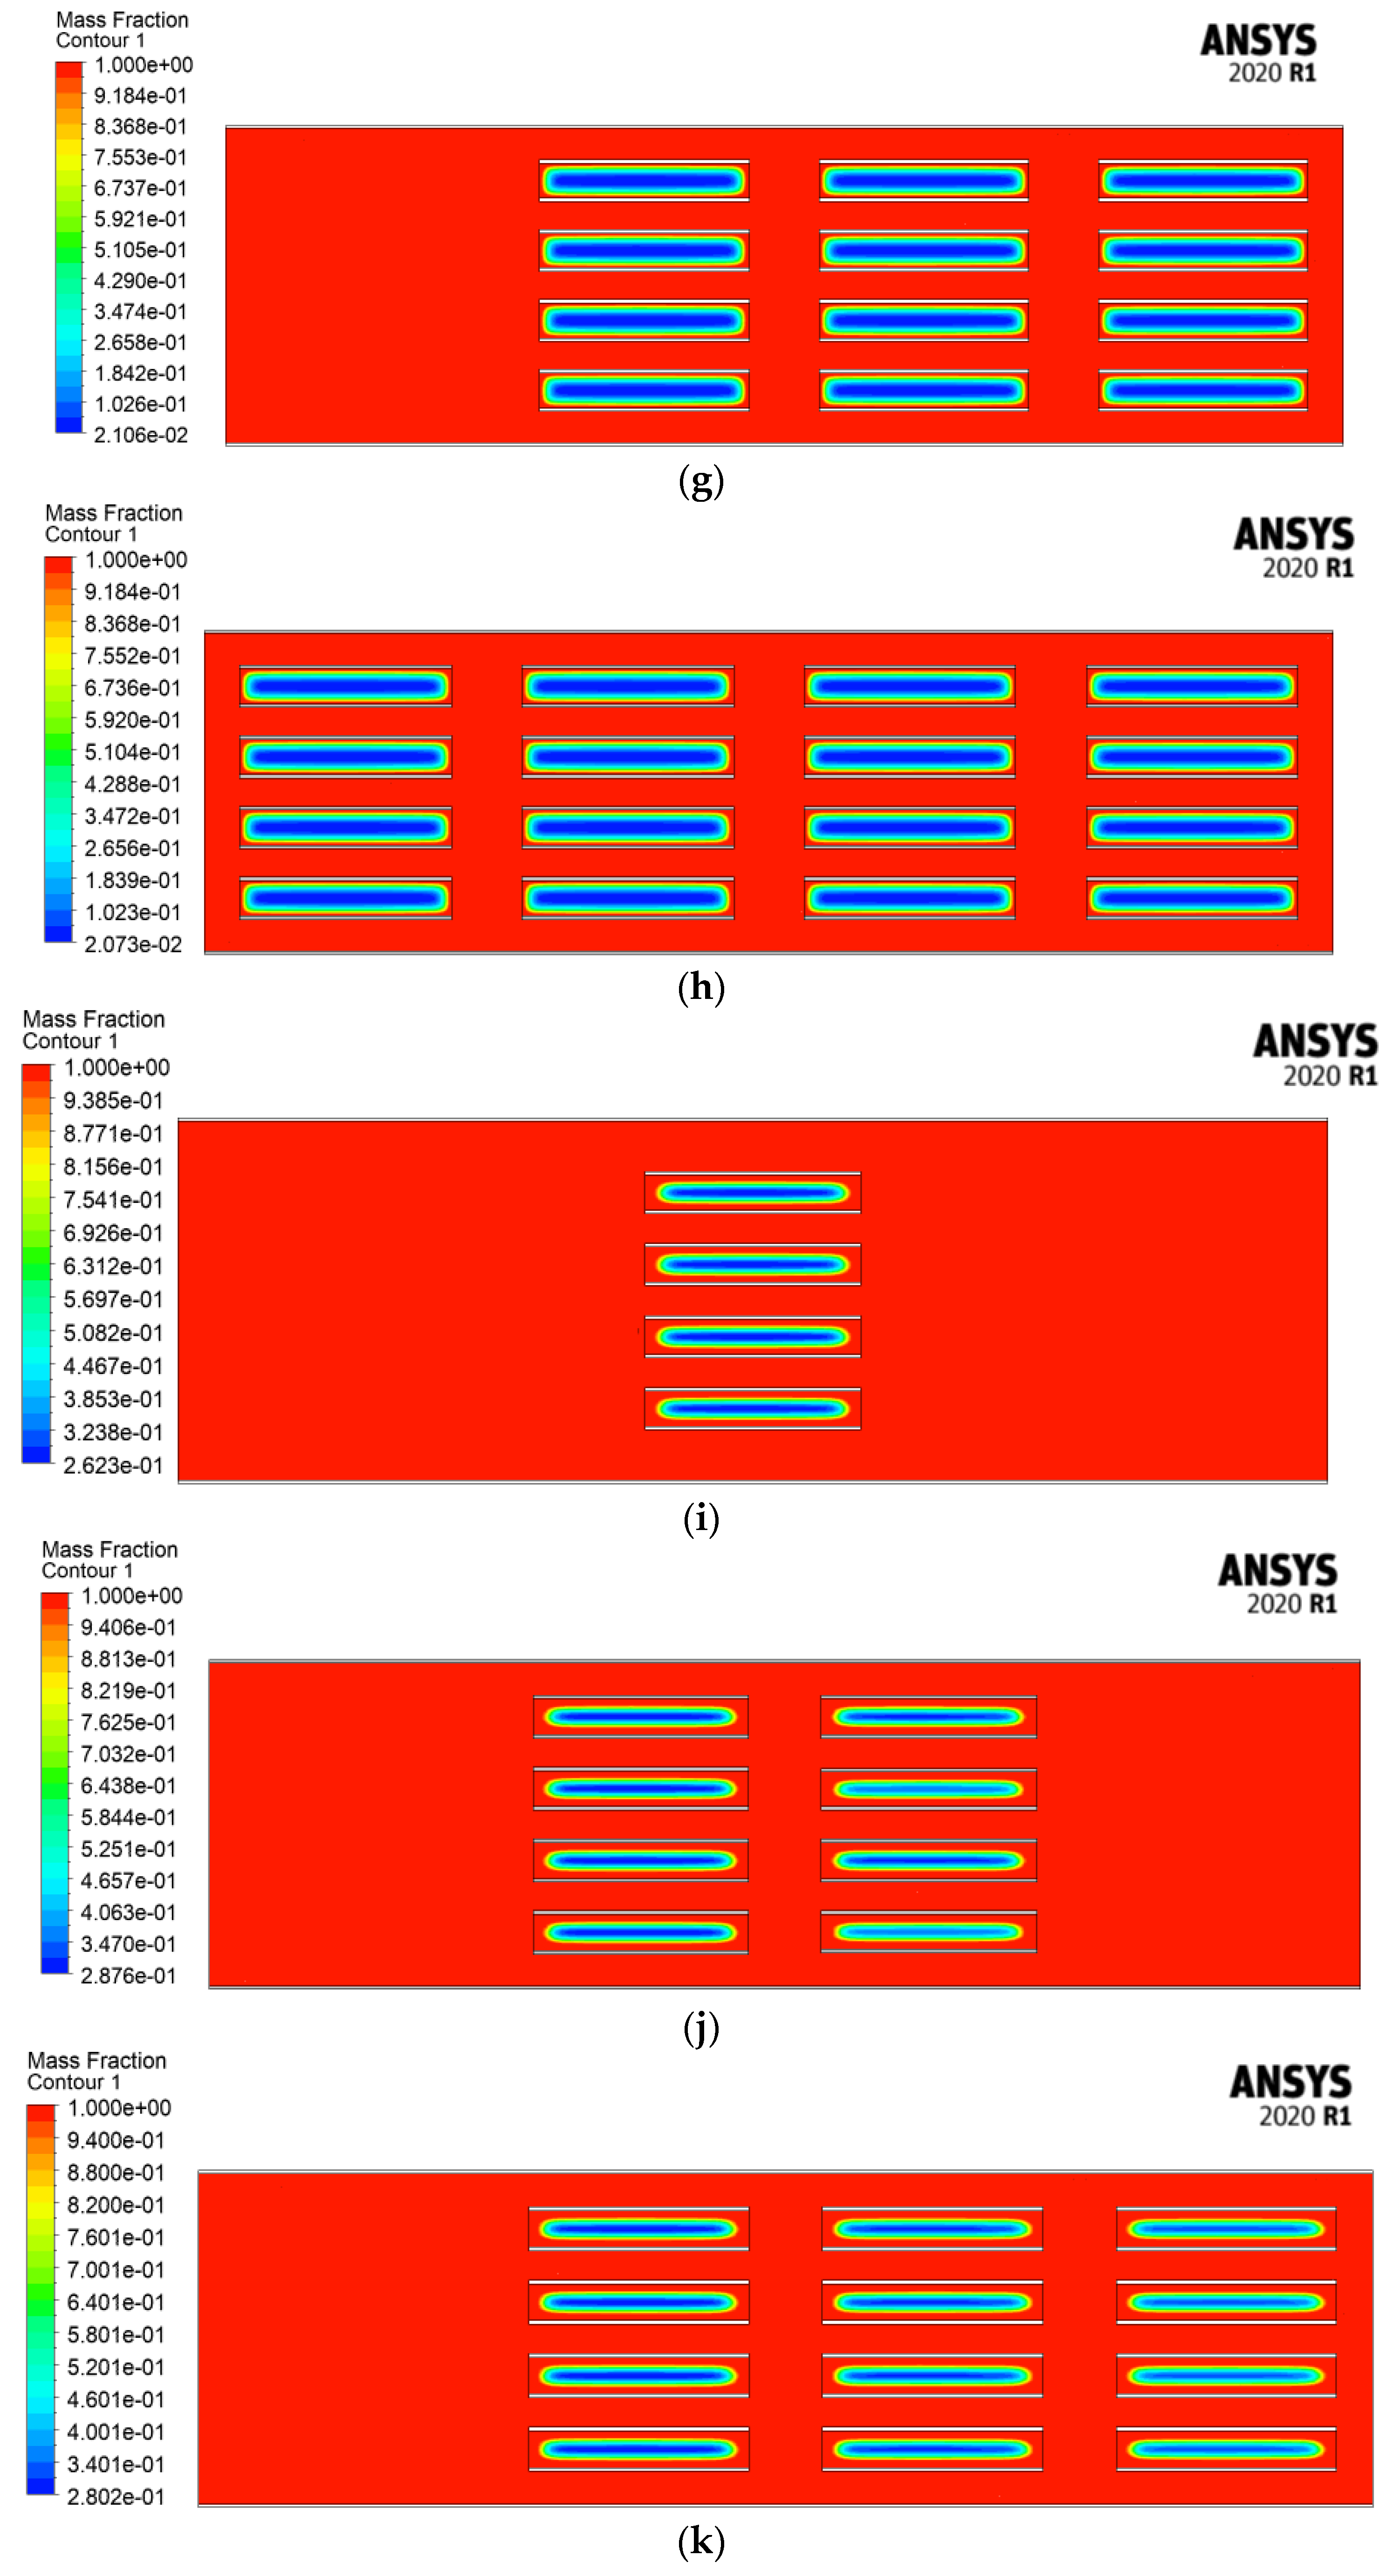
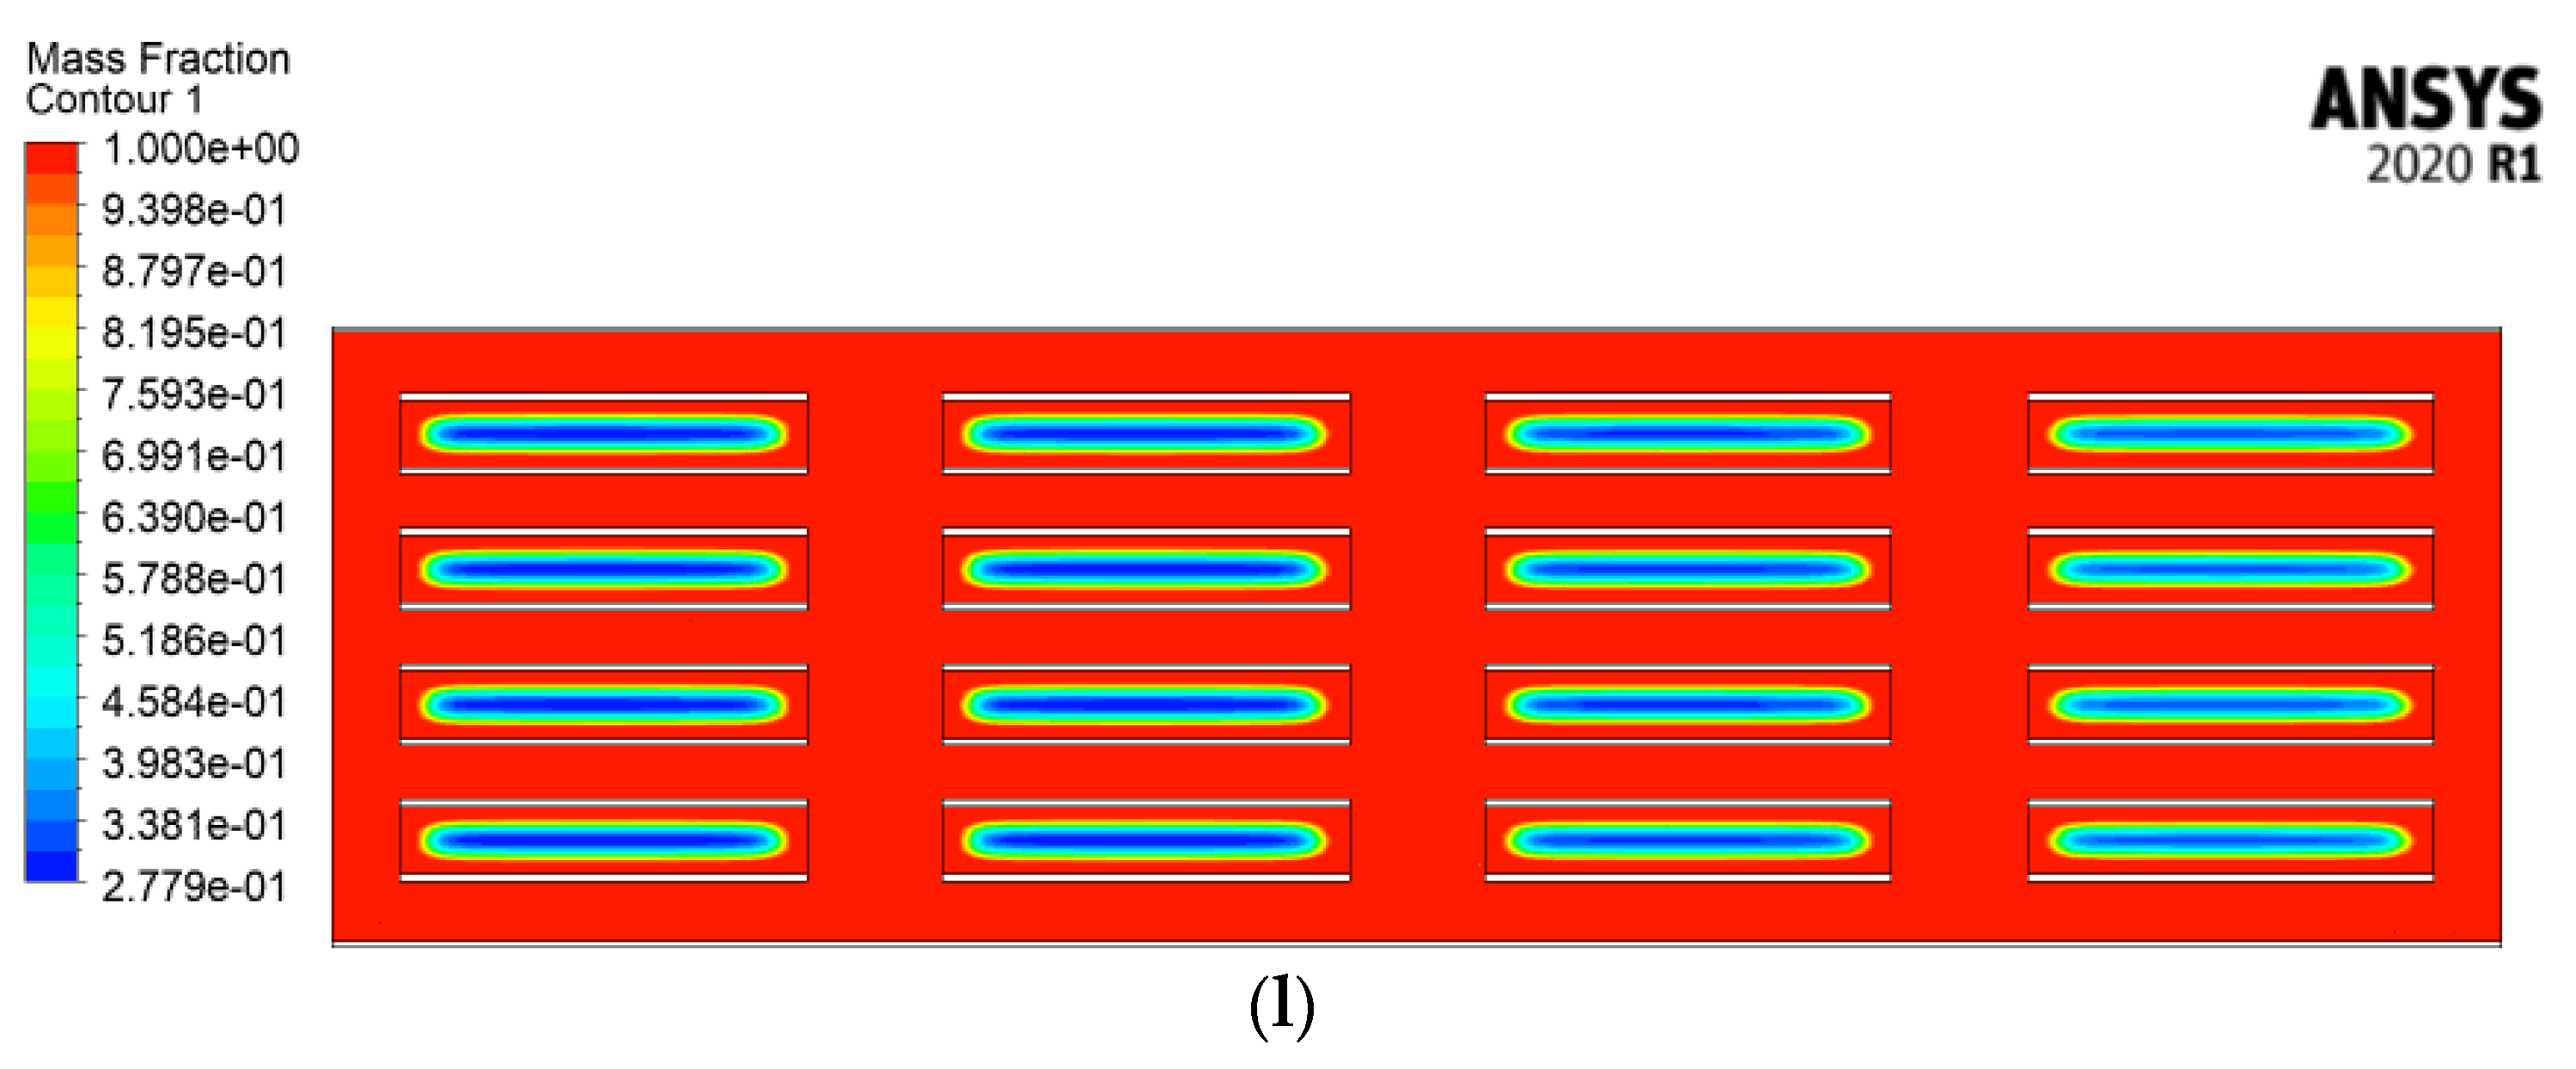
4.2.4. Velocity Streamlines and Melting Fraction Contours

Figure 11a–d capture a detailed analysis of velocity streamlines at a velocity of 4 m/s for Designs 1, 2, 3, and 4, showcasing a duct that incorporates PCM containers. The visualization offers a nuanced depiction of fluid dynamics within the system, providing valuable insights into the interaction between the flowing fluid and the PCM containers. The color-coded streamlines vividly represent the distribution of velocities, aiding in the identification of regions with varying flow intensities. Notably, the impact of the PCM containers on the velocity field is discernible, underlining its influence on heat transfer processes. Through the observed streamlines, distinct flow patterns, such as recirculation zones and vortex formations, become apparent, contributing to a comprehensive understanding of the system’s behavior. Additionally, it is noted that the vortex formation perpendicular to the flow can affect the fan power requirements, which eventually may increase energy consumption to keep the flow for indoor comfort. The extent of the impact will be explored in the future to maintain indoor comfort.
Figure 12a–l shows the melting fraction contours for Designs 1, 2, 3, and 4 (RT-31) at a fluid velocity of 4 m/s after 2 h, 4 h, and 8 h durations and provides a detailed and insightful analysis of the dynamic phase change phenomena within the system. The contour plot not only captures the temporal evolution of the melting process but also offers a spatial representation of melting fraction variations across the designated region of interest.
Figure 13a,b present a comprehensive overview of Design 1’s performance with two distinct phase change materials: RT-31 and CaCl2·6H2O. The plotted data includes the outlet temperature, average PCM temperature, and melting fraction, providing critical insights into the system’s behavior during the phase transition. Notably, a compelling observation emerges from the graphical representation—a correlation between the maximum melting fraction and the ending of the phase transition region, coinciding with a minimum in the outlet temperature drop.
The increased amount of PCM in subsequent cases generally kept the PCM temperature lower for several hours, which represents the impact of an increased mass leading to increased energy absorption that impacts the outlet air temperature and is almost in line with the increased amount in the order of 2, 3, and 4 in the 2nd, 3rd, and 4th cases. The additional compound impact of an increased stay time and reduced velocity in the case of Design 4 might have contributed as a compound impact and produced a more visible temperature drop.
Figure 14 shows the Reynolds number of the duct with the variation in air inlet velocities. The Reynolds numbers associated with varying inlet velocities (1 m/s, 2 m/s, 3 m/s, and 4 m/s) play a crucial role in characterizing the flow regime within the system. As the inlet velocity increases, the Reynolds number, a dimensionless parameter representing the ratio of inertial forces to viscous forces, demonstrates a proportional rise. The Reynolds numbers for the specified velocities are 2255, 4510, 6765, and 9020, respectively. The observed trend indicates a transition from laminar to turbulent flow as the Reynolds number increases. At lower velocities, such as 1 m/s, the flow is more likely to exhibit laminar characteristics due to the dominance of viscous forces. As the inlet velocity escalates, the Reynolds number surpasses a critical threshold, marking the onset of turbulent flow. In the context of fluid dynamics, this transition is associated with increased mixing, enhanced heat transfer, and altered flow patterns within the system.

5. Conclusions

In conclusion, this study presents a comprehensive examination of a PCM-based air pre-cooling system in the context of the hot climate of the UAE. The experiment showed that adding a PCM to the air conditioning duct system pre-cools the air flowing through the duct system through latent heat absorbed by the melting PCM.
The performance of the AC duct system is investigated through numerical simulations when the unit evaporator is coupled with the TES system. The PCM, which is solidified during the night, serves to cool the inlet air entering the evaporator during the day. The study was conducted for two PCMs, RT-31 and CaCl2.6H2O, with four duct designs subjected to different air velocities of 1 m/s, 2 m/s, 3 m/s, and 4 m/s, with a focus on the outlet temperature, average PCM temperature, and melting fraction. Experimentally, the study was conducted on an RT-31-based PCM with a single series of the PCM (Design 1) at 4 m/s. Numerical results showed that a maximum temperature drop of 13 °C was achieved using Design 4 at 1 m/s with both PCMs. However, CaCl2·H2O showed more of a cooling effect compared to RT-31. It kept a low outlet temperature for more time compared to RT-31.
  • At 1 m/s, a significant outlet air temperature drop was reported, about 7 °C for Design 1, 10 °C for Design 2, 12 °C for Design 3, and 12.2 °C for Design 4 using RT-31.
  • At 2 m/s, the peak air temperature dropped by a maximum of 4 °C for Design 1, 7 °C for Design 2, and 8 °C for Design 3 and Design 4, as reported using RT-31.
  • At 3 m/s, the peak outlet temperature dropped by 6.5 °C at most with Design 4 and 3 °C at least with Design 1 as reported using RT-31.
  • At 4 m/s, the highest temperature drop showed a 5 °C drop in peak air temperature at most with Design 4 and 2.5 °C at least with Design 1 was reported using RT-31.
  • Similar highest temperature drop trends were reported using CaCl2·6H2O compared to paraffin, which was able to sustain the temperature drop for more time.
The results indicate that employing PCM-based thermal energy storage within the air duct system effectively reduces the air temperature, resulting in potential energy savings and improved air conditioning system efficiency, especially during peak hours. The simulation results were validated experimentally, showcasing a considerable agreement between the simulated and experimental air temperature drop. Overall, this research underscores the promise of PCM-based air precooling systems as an effective means of enhancing cooling system performance and reducing energy efficiency in hot climates.

Author Contributions

Conceptualization, M.H. and A.H.; methodology, M.H., A.H., U.M. and M.L.; software, U.M. and A.H.; validation, U.M., A.H. and M.H.; formal analysis, U.M.; investigation, A.H., M.H. and U.M.; resources, M.H.; writing—original draft preparation, U.M.; writing—review and editing, A.H., M.H. and M.L.; visualization, A.H. and M.H.; supervision, M.H. and A.H.; project administration, M.H.; funding acquisition, M.H. All authors have read and agreed to the published version of the manuscript.

Funding

This article is related to a research project funded by the UAE University (12N091), entitled “Air Pre-Cooling through Phase Change Material Integrated into Chiller Water Cooling System to Reduce Peak Air-Conditioning Demand: Case Study of UAEU”.

Data Availability Statement

The data presented in this study are available on request from the corresponding author. The data are not publicly available due to privacy.

Acknowledgments

The authors would like to express their appreciation to the Research Office at UAEU and the College of Engineering for their support.

Conflicts of Interest

The authors declare no conflict of interest.

References

  1. Gagliano, A.; Patania, F.; Nocera, F.; Ferlito, A.; Galesi, A. Thermal performance of ventilated roofs during the summer period. Energy Build. 2012, 49, 611–618. [Google Scholar] [CrossRef]
  2. Cabeza, L.F.; Chàfer, M. Technological options and strategies towards zero energy buildings contributing to climate change mitigation: A systematic review. Energy Build. 2020, 219, 110009. [Google Scholar] [CrossRef]
  3. Masood, U.; Haggag, M.; Hassan, A.; Laghari, M. A Review of Phase Change Materials as a Heat Storage Medium for Cooling Applications in the Built Environment. Buildings 2023, 13, 1595. [Google Scholar] [CrossRef]
  4. Hasan, A.; Al-Sallal, K.A.; Alnoman, H.; Rashid, Y.; Abdelbaqi, S. Effect of phase change materials (PCMs) integrated into a concrete block on heat gain prevention in a hot climate. Sustainability 2016, 8, 1009. [Google Scholar] [CrossRef]
  5. Velmurugan, K.; Kumarasamy, S.; Wongwuttanasatian, T.; Seithtanabutara, V. Review of PCM types and suggestions for an applicable cascaded PCM for passive PV module cooling under tropical climate conditions. J. Clean. Prod. 2021, 293, 126065. [Google Scholar] [CrossRef]
  6. Hasan, A.; Hejase, H.; Abdelbaqi, S.; Assi, A.; Hamdan, M.O. Comparative effectiveness of different phase change materials to improve cooling performance of heat sinks for electronic devices. Appl. Sci. 2016, 6, 226. [Google Scholar] [CrossRef]
  7. Vanaga, R.; Blumberga, A.; Freimanis, R.; Mols, T.; Blumberga, D. Solar facade module for nearly zero energy building. Energy 2018, 157, 1025–1034. [Google Scholar] [CrossRef]
  8. Cabeza, L.F.; Castellón, C.; Nogués, M.; Medrano, M.; Leppers, R.; Zubillaga, O. Use of microencapsulated PCM in concrete walls for energy savings. Energy Build. 2007, 39, 113–119. [Google Scholar] [CrossRef]
  9. Experimental Investigation of PCM Transient Performance in Free Cooling of the Fresh Air of Air Conditioning Systems-ScienceDirect. Available online: https://www.sciencedirect.com/science/article/pii/S2352710219316882?casa_token=g7ablpICE6gAAAAA:6Nrl-B3yqM1LoHvOHoUDVfu-YJ5T1EBy_NIgMqWZqZY-rCHtQZkx_PhEyTcnPJ353bYXgTu6gC8z (accessed on 17 September 2023).
  10. Energy Saving in Building with PCM Cold Storage-Stritih-2007-International Journal of Energy Research-Wiley Online Library. Available online: https://onlinelibrary.wiley.com/doi/10.1002/er.1318 (accessed on 17 September 2023).
  11. Liu, S.; Iten, M.; Shukla, A. Numerical study on the performance of an air—Multiple PCMs unit for free cooling and ventilation. Energy Build. 2017, 151, 520–533. [Google Scholar] [CrossRef]
  12. Gado, M.G.; Hassan, H. Energy-saving potential of compression heat pump using thermal energy storage of phase change materials for cooling and heating applications. Energy 2023, 263, 126046. [Google Scholar] [CrossRef]
  13. Chaiyat, N.; Kiatsiriroat, T. Energy reduction of building air-conditioner with phase change material in Thailand. Case Stud. Therm. Eng. 2014, 4, 175–186. [Google Scholar] [CrossRef]
  14. Huang, B.; Zheng, Z.; Lu, G.; Zhai, X. Design and experimental investigation of a PCM based cooling storage unit for emergency cooling in data center. Energy Build. 2022, 259, 111871. [Google Scholar] [CrossRef]
  15. Akbari, A.D.; Talati, F.; Mahmoudi, S.M.S. New solution method for latent energy storage and thermoeconomic optimization for an air conditioning system. Int. J. Refrig. 2020, 109, 12–24. [Google Scholar] [CrossRef]
  16. Said, M.A.; Hassan, H. Parametric study on the effect of using cold thermal storage energy of phase change material on the performance of air-conditioning unit. Appl. Energy 2018, 230, 1380–1402. [Google Scholar] [CrossRef]
  17. Nagano, K.; Takeda, S.; Mochida, T.; Shimakura, K.; Nakamura, T. Study of a floor supply air conditioning system using granular phase change material to augment building mass thermal storage—Heat response in small scale experiments. Energy Build. 2006, 38, 436–446. [Google Scholar] [CrossRef]
  18. A Comparative Study on PCM and Ice Thermal Energy Storage Tank for Air-Conditioning Systems in Office Buildings-ScienceDirect. Available online: https://www.sciencedirect.com/science/article/abs/pii/S1359431115013551?via%3Dihub (accessed on 17 September 2023).
  19. Vakilaltojjar, S.M.; Saman, W. Analysis and modelling of a phase change storage system for air conditioning applications. Appl. Therm. Eng. 2001, 21, 249–263. [Google Scholar] [CrossRef]
  20. Mosaffa, A.H.; Farshi, L.G.; Ferreira, C.A.I.; Rosen, M.A. Advanced exergy analysis of an air conditioning system incorporating thermal energy storage. Energy 2014, 77, 945–952. [Google Scholar] [CrossRef]
  21. Mosaffa, A.H.; Farshi, L.G. Exergoeconomic and environmental analyses of an air conditioning system using thermal energy storage. Appl. Energy 2016, 162, 515–526. [Google Scholar] [CrossRef]
  22. Maccarini, A.; Hultmark, G.; Bergsøe, N.C.; Afshari, A. Free cooling potential of a PCM-based heat exchanger coupled with a novel HVAC system for simultaneous heating and cooling of buildings. Sustain. Cities Soc. 2018, 42, 384–395. [Google Scholar] [CrossRef]
  23. Hai, T.; Sajadi, S.M.; Zain, J.M.; El-Shafay, A.S.; Sharifpur, M. The effect of using tubes filled with phase change materials in the air conditioning system of a residential building. J. Build. Eng. 2022, 49, 104079. [Google Scholar] [CrossRef]
  24. Farah, S.; Liu, M.; Saman, W. Numerical investigation of phase change material thermal storage for space cooling. Appl. Energy 2019, 239, 526–535. [Google Scholar] [CrossRef]
  25. Nie, B.; She, X.; Du, Z.; Xie, C.; Li, Y.; He, Z.; Ding, Y. System performance and economic assessment of a thermal energy storage based air-conditioning unit for transport applications. Appl. Energy 2019, 251, 113254. [Google Scholar] [CrossRef]
  26. Hasan, A.; McCormack, S.J.; Huang, M.J.; Norton, B. Characterization of phase change materials for thermal control of photovoltaics using Differential Scanning Calorimetry and Temperature History Method. Energy Convers. Manag. 2014, 81, 322–329. [Google Scholar] [CrossRef]
  27. Lewis, R.W.; Morgan, K.; Thomas, J.R.; Seetharamu, I.N. The Finite Element Method in Heat Transfer Analysis; John Wiley & Sons: Hoboken, NJ, USA, 1999. [Google Scholar]
  28. Reese, T.G.; Heid, O.; Weisskoff, R.M.; Wedeen, V.J. Reduction of eddy-current-induced distortion in diffusion MRI using a twice-refocused spin echo. Magn. Reson. Med. Off. J. Int. Soc. Magn. Reson. Med. 2003, 49, 177–182. [Google Scholar] [CrossRef]
  29. Bang, D.; Lee, J.H.; Lee, E.S.; Lee, S.; Choi, J.S.; Kim, Y.K.; Cho, B.K.; Koh, J.K.; Won, Y.H.; Kim, N.I.; et al. Epidemiologic and clinical survey of Behcet’s disease in Korea: The first multicenter study. J. Korean Med. Sci. 2001, 16, 615–618. [Google Scholar] [CrossRef]
  30. Lamberg, P.; Lehtiniemi, R.; Henell, A.M. Numerical and experimental investigation of melting and freezing processes in phase change material storage. Int. J. Therm. Sci. 2004, 43, 277–287. [Google Scholar] [CrossRef]
Figure 1. Schematic diagram of employing TES in an air conditioning duct.
Buildings 14 00095 g001
Figure 2. Experimental setup of employing a PCM into an AC duct.
Buildings 14 00095 g002
Figure 3. (a) Model of an AC duct with 1 series of the PCM (Design 1); (b) model of an AC duct with 2 series of the PCM (Design 2); (c) model of an AC duct with 3 series of the PCM (Design 3); and (d) model of an AC duct with 4 series of the PCM (Design 4).
Buildings 14 00095 g003aBuildings 14 00095 g003b
Figure 4. Experimental and numerical results of the outlet temperature of the duct containing RT-31 in Design 1 at 4 m/s under ambient temperature.
Buildings 14 00095 g004
Figure 5. (a) Outlet air temperatures of Designs 1, 2, 3, and 4 with RT-31 at an air inlet velocity of 1 m/s. (b) Outlet air temperatures of Designs 1, 2, 3, and 4 with RT-31 at an air inlet velocity of 2 m/s. (c) Outlet air temperatures of Designs 1, 2, 3, and 4 with RT-31 at an air inlet velocity of 3 m/s. (d) Outlet air temperatures of Designs 1, 2, 3, and 4 with RT-31 at an air inlet velocity of 4 m/s.
Buildings 14 00095 g005aBuildings 14 00095 g005b
Figure 6. (a) Outlet air temperatures of Designs 1, 2, 3, and 4 with CaCl2·6H2O at an air inlet velocity of 1 m/s. (b) Outlet air temperatures of Designs 1, 2, 3, and 4 with CaCl2·6H2O at an air inlet velocity of 2 m/s. (c) Outlet air temperatures of Designs 1, 2, 3, and 4 with CaCl2·6H2O at an air inlet velocity of 3 m/s. (d) Outlet air temperatures of Designs 1, 2, 3, and 4 with CaCl2·6H2O at an air inlet velocity of 4 m/s.
Buildings 14 00095 g006aBuildings 14 00095 g006b
Figure 7. (a) Average temperature of RT-31 (Design 1) at air inlet velocities of 1 m/s, 2 m/s, 3 m/s, and 4 m/s. (b) Average temperature of RT-31 (Design 2) at air inlet velocities of 1 m/s, 2 m/s, 3 m/s, and 4 m/s. (c) Average temperature of RT-31 (Design 3) at air inlet velocities of 1 m/s, 2 m/s, 3 m/s, and 4 m/s. (d) Average temperature of RT-31 (Design 4) at air inlet velocities of 1 m/s, 2 m/s, 3 m/s, and 4 m/s.
Buildings 14 00095 g007aBuildings 14 00095 g007b
Figure 8. (a) Average temperature of CaCl2·6H2O (Design 1) at air inlet velocities of 1 m/s, 2 m/s, 3 m/s, and 4 m/s. (b) Average temperature of CaCl2·6H2O (Design 2) at air inlet velocities of 1 m/s, 2 m/s, 3 m/s, and 4 m/s. (c) Average temperature of CaCl2·6H2O (Design 3) at air inlet velocities of 1 m/s, 2 m/s, 3 m/s, and 4 m/s. (d) Average temperature of CaCl2·6H2O (Design 4) at air inlet velocities of 1 m/s, 2 m/s, 3 m/s, and 4 m/s.
Buildings 14 00095 g008aBuildings 14 00095 g008b
Figure 9. (a) Average melting fraction of RT-31 (Design 1) at air inlet velocities of 1 m/s, 2 m/s, 3 m/s, and 4 m/s. (b) Average melting fraction of RT-31 (Design 2) at air inlet velocities of 1 m/s, 2 m/s, 3 m/s, and 4 m/s. (c) Average melting fraction of RT-31 (Design 3) at air inlet velocities of 1 m/s, 2 m/s, 3 m/s, and 4 m/s. (d) Average melting fraction of RT-31 (Design 4) at air inlet velocities of 1 m/s, 2 m/s, 3 m/s, and 4 m/s.
Buildings 14 00095 g009aBuildings 14 00095 g009b
Figure 10. (a) Average melting fraction of CaCl2·6H2O (Design 1) at air inlet velocities of 1 m/s, 2 m/s, 3 m/s, and 4 m/s. (b) Average melting fraction of CaCl2·6H2O (Design 2) at air inlet velocities of 1 m/s, 2 m/s, 3 m/s, and 4 m/s. (c) Average melting fraction of CaCl2·6H2O (Design 4) at air inlet velocities of 1 m/s, 2 m/s, 3 m/s, and 4 m/s. (d) Average melting fraction of CaCl2·6H2O (Design 4) at air inlet velocities of 1 m/s, 2 m/s, 3 m/s, and 4 m/s.
Buildings 14 00095 g010aBuildings 14 00095 g010b
Figure 11. (a) Velocity streamlines at 4 m/s for Design 1. (b) Velocity streamlines at 4 m/s for Design 2. (c) Velocity streamlines at 4 m/s for Design 3. (d) Velocity streamlines at 4 m/s for Design 4.
Buildings 14 00095 g011aBuildings 14 00095 g011b
Figure 12. (a) Contours of the melting fraction for Design 1 (RT-31) at 4 m/s after 2 h. (b) Contours of the melting fraction for Design 2 (RT-31) at 4 m/s after 2 h. (c) Contours of the melting fraction for Design 3 (RT-31) at 4 m/s after 2 h. (d) Contours of the melting fraction for Design 4 (RT-31) at 4 m/s after 2 h. (e) Contours of the melting fraction for Design 1 (RT-31) at 4 m/s after 4 h. (f) Contours of the melting fraction for Design 2 (RT-31) at 4 m/s after 4 h. (g) Contours of the melting fraction for Design 3 (RT-31) at 4 m/s after 4 h. (h) Contours of the melting fraction for Design 4 (RT-31) at 4 m/s after 4 h. (i) Contours of the melting fraction for Design 1 (RT-31) at 4 m/s after 8 h. (j) Contours of the melting fraction for Design 2 (RT-31) at 4 m/s after 8 h. (k) Contours of the melting fraction for Design 3 (RT-31) at 4 m/s after 8 h. (l) Contours of the melting fraction for Design 4 (RT-31) at 4 m/s after 8 h.
Buildings 14 00095 g012aBuildings 14 00095 g012bBuildings 14 00095 g012cBuildings 14 00095 g012d
Figure 13. (a) Outlet air temperature, melting fraction, and PCM average temperature for Design 1 using RT-31 at 1 m/s. (b) Outlet air temperature, melting fraction, and PCM average temperature for Design 1 using CaCl2·6H2O at 1 m/s.
Buildings 14 00095 g013aBuildings 14 00095 g013b
Figure 14. Reynolds number variations with the variation of inlet air velocities.
Buildings 14 00095 g014
Table 1. Type of system and building characteristics.
CharacteristicsDescription
Area of the window10% of the gross wall area—uniformly distributed
Area of the floor300 m2
Solar absorbance value0.50 for the external walls and roof
Window6 mm single green-tinted glazing
Occupancy density6 people
Equip. power density 7 W/m2
Lighting power density4.5 W/m2
Table 2. Properties of the material used in the simulation and experimental study.
PropertyRT-31CaCl2·6H2OAluminumAir
Melting temperature range (°C)27–3327.7–32.5660-
Latent heat of fusion (kJ kg−1)158187--
Specific heat (kJ kg−1 K−1)21.4 (solid), 2.2 (liquid)8.71.007
Density (kg m−3)9001710 (solid), 1530 (liquid)27101.14
Thermal conductivity (W m−1 K−1)0.21.09 (solid), 0.53 (liquid)2370.028
Velocity (m s−1) --1, 2, 3, 4 m/s
Disclaimer/Publisher’s Note: The statements, opinions and data contained in all publications are solely those of the individual author(s) and contributor(s) and not of MDPI and/or the editor(s). MDPI and/or the editor(s) disclaim responsibility for any injury to people or property resulting from any ideas, methods, instructions or products referred to in the content.

