Abstract
Source location identification methods are typically applied to steady-state conditions under pure indoor or outdoor environments, but under time-varying wind conditions and coupled indoor and outdoor environments, the applicability is not clear. In this study, we proposed an improved adjoint probability method to identify the pollutant source location with time-varying inflows in street canyons and used scaled outdoor experiment data to verify the accuracy. The change in inflow velocity will affect the airflow structure inside the street canyons. Outdoor wind with a lower temperature will exchange heat with the air with a higher temperature inside the street canyon, taking away part of the heat and reducing the heat of the air inside the street canyons. Moreover, the room opening will produce some air disturbance, which is conducive to the heat exchange between the air near the opening and the outdoor wind. Furthermore, the fluctuations of the upper wind will influence the diffusion of the tracer gas. We conducted three cases to verify the accuracy of the source identification method. The results showed that the conditioned adjoint location probability (CALP) of each case was 0.06, 0.32, and 0.28. It implies that with limited pollutant information, the improved adjoint probability method can successfully identify the source location in the dynamic wind environments under coupled indoor and outdoor conditions.
1. Introduction
Urban street canyons, often used for daily activities, are typical urban microclimate environments [1]. The dynamic and thermal properties of street canyons affect the microclimate environment within the urban canopy, making them a crucial area of research in urban ventilation and pollutant dispersion [2]. The indoor and outdoor airflows in the urban microclimate environment are closely related and interact with each other under natural ventilation, which is a common ventilation method used in urban residential areas [3,4]. It may increase the exposure risk of urban residents to fine particulate pollutants, such as aerosols [5,6]. To prevent the spread of contaminants or viruses in urban street canyons, it is essential to comprehend the dynamic characteristics of airborne transmission and locate sources in coupled indoor and outdoor environments.
Many previous studies have investigated the flow regime and pollutant dispersion in urban street canyons, including in situ measurements, wind tunnel experiments, computational fluid dynamics (CFD) simulations, and scaled outdoor experiments. Data monitoring and in situ experiments in urban environments are important for understanding the characteristics of temperature and airflow within and above urban environments. These experiments can provide data from realistic atmospheric conditions (e.g., dynamic velocities and heterogeneous temperature distributions of building facades). Nakamura and Oke [7] studied the wind and temperature characteristics in an east–west street canyon under various stability conditions. They observed an approximately linear correlation between wind velocity above and inside a street canyon. Santamouris et al. [8] investigated airflow patterns and temperature distribution in a deep street canyon under hot weather conditions. According to their observations, the airflow in the canyon was characterized by either one main vortex or a double vortex when the ambient wind blew vertically toward the street. Eliasson et al. [9] conducted long-term measurements within an urban canyon and observed a high degree of vertical mixing within the canyon. Niachou et al. [10] assessed the wind speed, air temperature, and surface temperature inside an urban street canyon under hot summer weather conditions. They observed that airflow patterns in street canyons were primarily affected by ground thermal conditions. The results of these studies imply that in street canyons, the airflow fluctuated continuously but was not as large as that shown in the numerical simulations [11,12].
In addition to in situ measurements, numerous studies have used numerical simulations to investigate the transmission characteristics of pollutants and viruses in urban street canyons [13,14,15,16,17]. Yang et al. [18] used a steady Reynold-averaged Navier–Stokes (RANS) model to simulate the effects of outdoor pollutants on indoor air quality and the characteristics of outdoor pollutant dispersion in street canyons. They observed that airflow from upstream buildings alters the flow field with windows in street canyons and the distribution of pollutants from downstream buildings. Fan et al. [19] adopted the steady-state standard k–ε model to simulate the influence of aerosol transmission distance on residents’ health in street canyons. The results of the study revealed that aerosol transmission over short distances poses a health risk to the residents of street canyons. Hang et al. [20] investigated the effect of wind speed on ventilation performance and pollutant concentration in street canyons. They observed that low wind speeds change ventilation performance and pollutant concentrations in street canyons. The results of these studies indicated that pollutant dispersion routes are influenced by changes in the airflow field in street canyons.
More recently, scaled outdoor experiments, an effective alternative, have gained popularity for investigating airflow fields [21], pollutant dispersion [22], urban ventilation [23], and thermal conditions [24,25,26] in urban environments. In our previous studies [27,28], we conducted scaled outdoor experiments in two-dimensional street canyons to investigate airflow fields and pollutant dispersion problems. In this experiment, we investigated the ventilation effectiveness and pollutant dispersion among rooms in street canyons.
Most previous studies have considered or simplified the urban boundary layer airflow as a time-independent flow combined with turbulence. However, actual urban airflow is frequently gusty, with time-varying wind speeds and directions [29,30]. Studies have revealed that varying inflow wind speeds and directions can considerably affect the characteristics of airflow and pollution dispersion [31,32], which cannot be ignored. Zhang et al. [31] compared the impact of a time series of incoming winds (time-scale of 1 min) and a constant inflow velocity on the airflow fields and pollutant dispersion. They observed that the airflow circulation inside the street canyon was interrupted by time-varying inflows, which dramatically increased the dispersion efficiency of pollutants. Wang et al. [33] adopted a periodic sinusoidal fluctuating wind as the inlet flow to investigate the effect of a dynamic airflow field on the ventilation and pollutant dispersion characteristics of street canyons. According to their findings, an airflow field with periodic sinusoidal fluctuations could hasten the decay of pollutant concentrations inside street canyons. More recently, Zhang et al. [2] summarized the effects of time-varying wind conditions on airflow and pollutant dispersion in street canyons. They indicated that dynamic inflow is an essential factor that influences the airflow structure and pollutant dispersion characteristics inside urban street canyons.
Prior research has suggested that time-varying inflows lead to more complicated airflow and pollutant dispersion fields in urban street canyons compared to constant inflows. However, these studies primarily focused on pure outdoor environments, overlooking the prevalence of indoor and outdoor environments in urban settings. Therefore, it is crucial to extend this investigation to include such hybrid environments.
For airborne transmitted viruses, identifying a certain source location or infection point in a street canyon environment is crucial. Liu and Zhai [34] summarized the methods to locate pollutant sources into three categories: forward, backward, and probability methods. Among these methods, when information about the pollutant source is insufficient, particularly without a likely source site, the probability method is frequently used, which is also suitable for identifying the source location in a built environment [35]. Based on the adjoint method proposed by Neupauer and Wilson [36], Zhai et al. [37] proposed a standard adjoint location probability (SALP) method for locating a dynamic source in an indoor environment. Subsequently, Wang et al. [38] improved the adjoint probability model and identified the indoor source locations under a dynamic airflow field. Chen et al. [39] combined the adjoint probability method with CFD to establish an inverse model of radionuclide diffusion under ventilation conditions to estimate the probability of locating radioactive source leakage. Instead of focusing primarily on pollutant source identification in pure indoor or outdoor environments, few studies have considered pollutant dispersion in coupled indoor and outdoor environments. More recently, our previous study [35] employed the adjoint probability method in inverse CFD modeling to locate a pollutant source with single-sided natural ventilation in an isolated building. We suggested that the inverse modeling method with the adjoint probability method can successfully locate pollutant sources under coupled indoor and outdoor conditions. However, the former study investigated only the time-independent inflow condition. Considering the more complex airflow and pollutant dispersion fields with the time-carrying inflow, the applicability of the inverse CFD simulation should also be tested with the dynamic inflow.
In this study, we intend to develop an improved method for identifying the location of pollutant sources in urban street canyons with time-varying inflow in a coupled indoor and outdoor environment. For this purpose, we conducted a scaled outdoor experiment to determine the actual urban boundary layer airflow and pollutant dispersion in street canyon rooms. We then reconstructed the dynamic airflow and pollutant dispersion fields using unsteady CFD simulations. Finally, we employed the adjoint probability method with inverse CFD simulations to identify pollutant source locations. This research can fill the gap for both the inverse modeling with dynamic wind conditions and source identifications in coupled indoor and outdoor environments. This research can also help to locate the pollutant source in a real urban environment quickly and accurately. The remainder of this paper is organized as follows: Section 2 briefly introduces the scaled outdoor experiment; Section 3 introduces CFD methods with inverse modeling under time-varying inflow; Section 4 validates the CFD simulation with the results of the scaled outdoor experiment; Section 5 presents the results and discussions of the CFD simulations; and Section 6 concludes the study.
2. Scaled Outdoor Experiment
2.1. Description of the Experiment Setup
Scaled outdoor experiments were conducted in idealized two-dimensional (2D) street canyons at Sun Yat-sen University [27,28]. The experiment field was located in the southern area of Guangzhou, China (, ). The experimental field was built on a concrete foundation measuring . As shown in Figure 1a, the entire north–south street canyon field has dimensions of . The street canyon deviates from the northern direction by approximately . Customized as a hollow cuboid, each concrete model had a size of length width height . As shown in Figure 1b, the walls of the concrete model were painted dark grey to resemble typical urban buildings. Four aspect ratios (), and are included in the street canyons. Each aspect ratio contained six rows, with each row containing 24 concrete models.
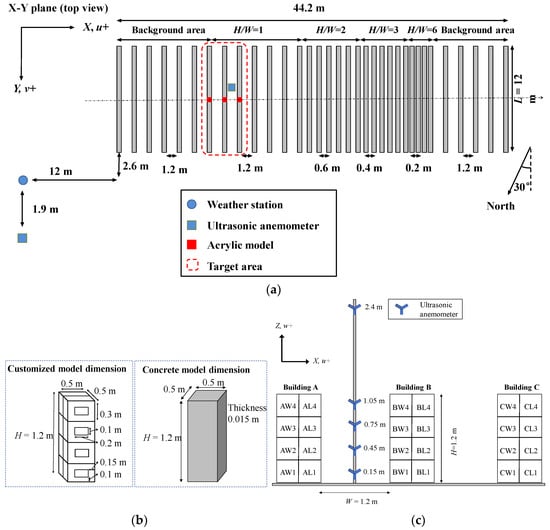
Figure 1.
Descriptions of the experiment setup: (a) schematic view of the experiment field on the X–Y plane and instrument positions; (b) dimensions of the customized and concrete models; (c) schematic view of buildings and rooms in the street canyon.
To simulate the coupled indoor and outdoor environment in the urban street canyon, we customized an acrylic model ( thick) with four floors, and each floor contained two rooms with opposite openings, for a total of eight rooms. The dimensions of the acrylic and concrete models were identical. As shown in Figure 1b, the height and width of each opening were and , respectively. This study selected a street canyon as the main research area, and three acrylic models were positioned in the middle of three consecutive street canyons with a 1:1 aspect ratio. In Figure 1c, and represent the windward and leeward sides of the building model, respectively.
During the experimental period, wind speed was measured using 3D ultrasonic anemometers (Gill WindMaster, Leamington, UK, 1.5%, in the range of 0–50 m/s). The indoor and outdoor air/wall temperature was measured using K-type fine-wire thermocouples (Omega, TT-K-36-SLE, , 1.1 °C or 0.4% in a range of −200–260 °C, Agilent Technologies Inc., Santa Clara, CA, USA). A CO2 sensor (HR International Co., Taiwan, China, ±40 ppm in a range of 400–10,000 ppm) was used to detect CO2 concentrations in the building models. Atmospheric data, such as background air temperature and wind speed, were obtained from an automatic weather station (RainWise Inc., Dover, DE, USA, ±0.25 in the range of −54–74 °C, ±2% in the range of 0–67 m/s, 3° in the range of 0°–360°). Two wind masts were installed in the experimental field, on which several ultrasonic anemometers were installed at different positions, as shown in Figure 2a,b. Figure 2c illustrates the positions of the thermocouples during the experiment. Figure 2c–e show the concentration measurement setup. Each room had a CO2 sensor to measure the indoor concentration. A lengthy tube with a diameter of 8 mm was used to carry the tracer gas (CO2) into the source room from a compressed gas cylinder. To reduce the injection velocity, we inserted a customized plastic ball (diameter of 30 mm) with six uniformly arranged holes (diameter of 5 mm) at the end of the tube close to the room center.
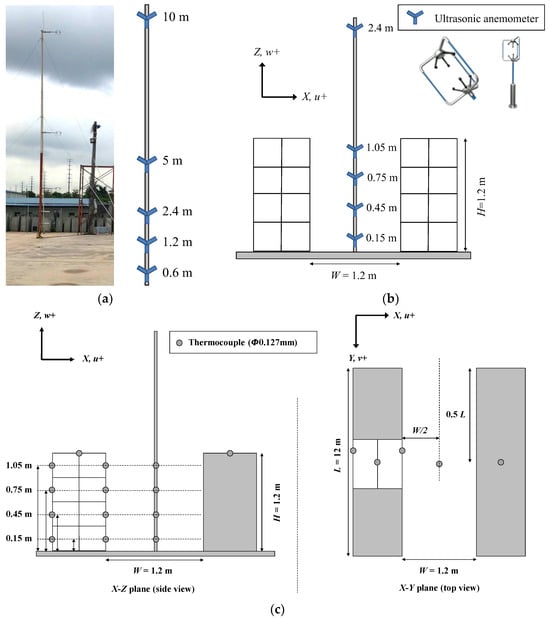
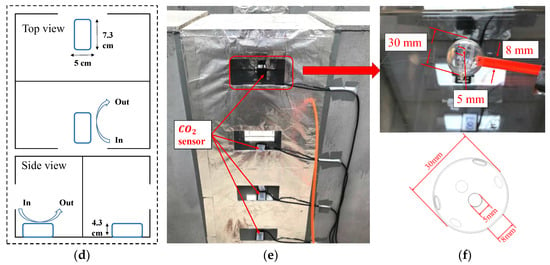
Figure 2.
Setup for the wind masts, ultrasonic anemometer positions, tracer gas release, and concentration measurement: (a) 10 m mast at the side of the experiment field; (b) 2.4 m mast in the middle of the street canyon; (c) positions of the thermocouples; (d) positions of the CO2 sensors in each room; In: inlet of the sensor, Out: outlet of the sensor; (e) measurement setup; (f) customized plastic ball.
In this experiment, each room served as a source room several times. The source gas concentration was . The output values were averaged over one second at a sampling frequency of . The flow rate of the tracer gas was , and it was continuously delivered for approximately 30 min. For the wind speed, wind direction, air and wall temperatures, and concentrations in each room, all instruments were used concurrently. The gas-releasing tube was removed after each test was completed. Before the subsequent test was started, the CO2 concentration in the former source room had to reach background levels. Detailed information can be observed in our previous papers [27,28].
2.2. Experimental Results
During the measurement periods, the wind direction and speed were measured by an automatic weather station, as described in our previous paper [28]. The dominant wind direction was southwest (mostly between ), flowing in a nearly perpendicular direction toward the street canyons. In this study, we primarily considered the variations in the inflow velocities and set the wind direction to normal incidence.
We set the CO2 concentration to more than 10 ppm (excluding the background concentration) as the threshold, considering the accuracy of the CO2 sensor. In this study, we used the data from 10:40:00 to 17:40:00 on 9 June 2019. Table 1 shows the time and concentration of the tracer gas in the monitored room above the threshold, as well as the maximum and final concentrations detected during the entire experimental period.

Table 1.
Concentrations of each room detected with different source rooms (excluding background concentration).
For the thermal information, Table 2 lists the outdoor air temperature, the wall temperature at different heights of the acrylic model, the concrete model building wall temperature, and the roof temperature of both acrylic and concrete models. The thermal conditions were set as boundary conditions in the CFD simulations.

Table 2.
Average temperature of different areas in the street canyons in different periods.
3. CFD Methodology
3.1. CFD Models
Three-dimensional Navier–Stokes equations are solved to simulate the airflow field around a building, which is very complex and varies with time. The continuity and momentum equations are expressed as follows:
where is the velocity vector in direction, is the pressure, is the density, is the molecular viscosity, and is the stain-rate tensor as defined in Equation (3).
The contaminant dispersion equation is used to describe the characteristics of contaminant dispersion in a street canyon environment. The pollutant diffusion equation assumes that no reaction or mass exchange occurs between the ambient air and pollutants during transport and that the flow is stable.
where denotes the time, is the transient concentration, and is the molecular diffusion coefficient. The renormalization group (RNG) model is derived from a rigorous statistical technique, which was proposed by Yakhot et al. [40].
where , , and are model constants, and , where is the scale of strain rate.
3.2. Inverse Identification of Source Location Method in Dynamic Airflow Fields
Our previous research applied the inverse CFD method to steady-state airflow fields [35]. In this study, we primarily investigated the application of inverse CFD modeling to the dynamic airflow fields. Based on the adjoint probability method, the major difference between dynamic and steady-state airflow fields is that the airflow field changes with time. In dynamic airflow fields, the backward time and multiple inverse groups of airflow fields must be considered. In the forward simulation, multiple groups of forward airflow fields ( represents different time points) can be obtained, and the remaining forward process is consistent with the operating process under the steady-state airflow field.
In the inverse simulation process, the velocity field at the last time step of the forward simulation process is initially reversed. The concentration is calculated at the location of the monitoring point to obtain the first concentration field in the reverse time step. Subsequently, all the concentration information in the computational domain is extracted and imported into the reverse velocity field under the penultimate time step in the forward process to continue the calculation. This is performed until the first time step is calculated in the forward process, and the obtained concentration field is the SALP in the dynamic flow field. The remaining processes in the reversal process under a dynamic airflow field are consistent with those under a steady-state airflow field, which can be observed in our previous paper [35]. A flowchart of the specific process used to identify the pollutant sources under dynamic airflow fields is shown in Figure 3a.
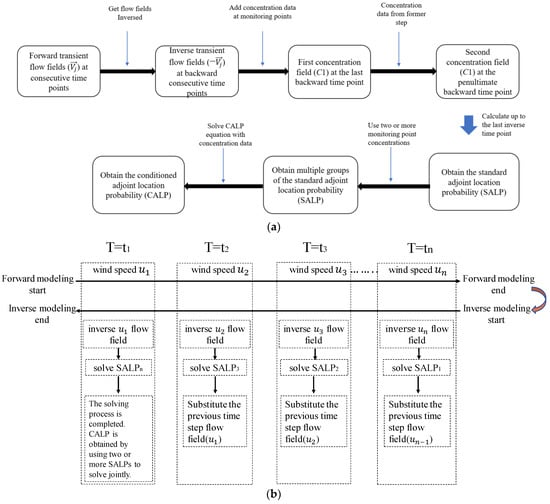
Figure 3.
Illustrations of the source identification method with dynamic wind conditions: (a) flow chart of pollutant source identification under dynamic airflow fields; (b) steps of source identification under dynamic airflow field with a period of .
Figure 3b shows the detailed source identification steps under the dynamic airflow field, which are as follows:
- The unsteady airflow fields at min in the forward simulation are used. In the forward simulation, the airflow field is calculated every 1 min. During min, the airflow fields are simulated 30 times to obtain 30 airflow fields in this period. The start time of the forward simulation is set to . Subsequently, using the 1 min average outdoor wind speed as the inlet boundary condition, the airflow field can be obtained. The final airflow field is obtained after 30 forward simulations at . Subsequently, the forward simulation is completed.
- Probability-based inverse modeling starts from the backward time step and the final airflow field . Release one unit of tracer gas CO2 in the monitored room that exceeds the concentration limit and obtain SALP1 of the final time step .
- The calculation is stopped immediately after the convergence of SALP1 is achieved. The SALP1 values of all the grid nodes in the calculation domain are exported. Subsequently, by inverting the airflow field , airflow field is imported to SALP1 and continuously calculated to obtain SALP2.
- Each SALP is obtained by inverting 30 airflow fields in the forward simulation. The adjoint probability of the final pollution SALPn under a dynamic airflow field is then obtained.
- Finally, the CALP was calculated by combining the SALP with the concentration data from multiple monitoring points.
4. Accuracy of the CFD Simulation
Numerical simulations of the urban two-dimensional street canyon airflow field were performed based on actual outdoor atmospheric conditions obtained from experiments. The results of the numerical simulations are compared with the experimental data to verify the accuracy of the simulations.
4.1. Simulation Setting
To simulate the airflow and pollutant dispersion fields in street canyons, we built a simplified T-shaped computational domain with the upstream, downstream, and height of the computational domain as 3H, where H is the building height (1.2 m), as shown in Figure 4a,b. According to Ai et al. [41], the use of a T-type computational domain can effectively predict airflow fields in street canyons. The T-shaped computational domain significantly reduces the number of grids, which also reduces the time required for the simulation, particularly for unsteady simulations.
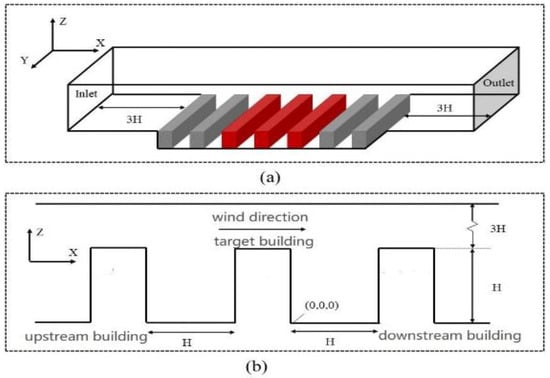
Figure 4.
Model settings of the CFD simulation: (a) overall schematic of the model; (b) enlarged schematic of target buildings in the street canyon.
The dimensions of the building models used in the simulation were established based on a scaled outdoor experiment, as shown in Figure 4a. The simulation areas of this study focused on the target building of the experiment, which had a height-to-width ratio of 1:1 in a street canyon. The buildings marked in red in Figure 4a are Buildings A, B, and C from left to right.
The boundary conditions used in this paper are shown in Table 3. A uniform velocity was used as the inlet velocity boundary condition. Ai et al. [41] verified that the simulation results of the uniform velocity boundary conditions in a T-shaped street canyon model were similar to those of the atmospheric boundary layer under the logarithmic law. This is because the roughness height at the top of the building is much smaller than that above the urban ground, where the buildings themselves are rough elements. Therefore, uniform inflow boundary conditions can be used under these circumstances.

Table 3.
Boundary conditions.
The experimental results showed that the wind speed and direction changed constantly during the experimental period. We selected experimental data from 10:40 a.m. to 5:40 p.m. on 9 June 2019 as the inlet boundary condition. During the experimental period, the wind direction ranged from to , which could be approximated as blowing vertically toward the street canyons. We selected wind speed data monitored by the ultrasonic anemometer at a height of 1.2 m on the 10 m wind mast during this period as the inflow velocity, which was also the height of the building top. It is appropriate to select the wind speed value at the top of the building for the boundary conditions of the inlet velocity in the T-shaped calculation domain [41].
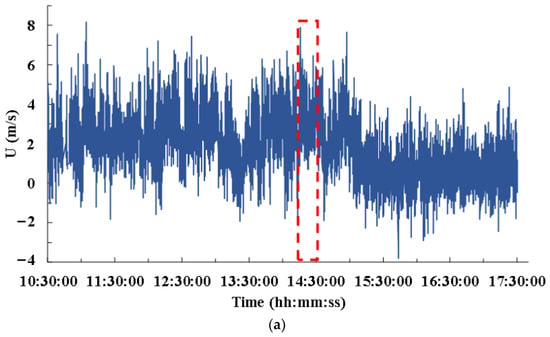
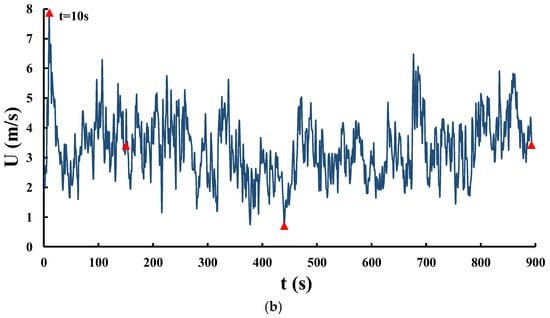
Figure 5.
Wind speed values at 1.2 m from the 10 m wind mast on 9 June 2019; (a) wind speeds from 10:40 a.m. to 5:40 p.m.; (b) enlargement of 900 s wind speed from 14:16:05 to 14:31:05. (Dashed box represents a period of time selected as the inlet velocity boundary condition; Four red triangle represent the wind speed at each of the four time points (t = 10 s, t = 150 s, t = 440 s, t = 900 s).)
During the experimental period, data monitored by the ultrasonic anemometer at 1.2 m on the 10 m wind mast were recorded at . For the inflow boundary conditions, we considered an average wind speed every as a uniform inlet velocity. The processed velocity boundary conditions were written into a user-defined profile in Fluent as the inlet velocity. Figure 5 shows the velocities measured by the ultrasonic anemometer at 1.2 m on the 10 m wind mast during this period.
The model was selected as turbulence model in the numerical simulations, and the formula for inlet turbulence kinetic energy () and turbulence dissipation rate () is expressed as follows [39]:
where is a constant, = 0.09; is the turbulence intensity, ; is turbulence characteristic size, ; is a cross-sectional area of fluid, = 0.6 m; and is wet perimeter length, = 0.9 m.
The surface temperatures of the building models in the numerical simulations were based on the data measured during the experiment. During the experimental period, from 10:40 a.m. to 5:40 p.m., the intensity of solar radiation received by the experimental site varied. Therefore, the average temperature of each building surface during each period, as listed in Table 2, was considered the simulated temperature boundary condition.
4.2. Grid Sensitivity Test
We established scaled urban two-dimensional street canyons of 1:20, which were consistent with the experimental model. To reconstruct the full-scale airflow field, the Reynolds-number-independent similarity criterion was to be satisfied. The Reynolds number based on the building height was 75,600, which was greater than the reference value (Re = 11,000) of Reynolds independence [42].
In this study, the minimum grid sizes of the building model were 0.01, 0.005, and 0.0025 m, as shown in Figure 6a, with total grid numbers of 3.5 million, 5.6 million, and 7.2 million, respectively. A steady airflow field was used for comparison in the grid sensitivity test. A power law was fitted to the experimental data to determine the inlet velocity wind profile. By fitting the wind speed data from 10:00 a.m. to 3:00 p.m. on 9 June 2019, the formula can be expressed as follows [28]:
where is the wind speed at height H (m/s); is the wind speed at the reference height of the street canyons (2.46 m/s); and is the height of the street canyon (1.2 m).
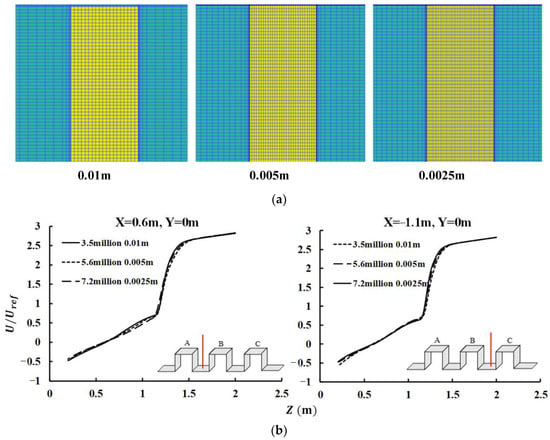
Figure 6.
Sensitivity tests for the CFD simulations: (a) near wall grid sizing of the three systems; (b) sensitivity tests for the three mesh systems at lines X = −1.1 m, Y = 0 m, Z = 0–2 m; X = 0.6 m, Y = 0 m, Z = 0–2 m.
To verify the independence of the grid, we selected two vertical lines (X = −1.1 m, Y = 0 m, Z = 0–2 m and X = 0.6 m, Y = 0 m, Z = 0–2 m) at the center of the target street canyons for comparison with the normalized mean u-velocity (U/Uref). Figure 6b shows a comparison of the dimensionless velocity results of the three grid systems at the center of the street canyons. The speed prediction results of the three grid systems were very similar. Owing to the negligible deviation of the three grid systems, a coarse grid system was selected for the subsequent simulations in this study [35], which reduced the simulation resources for dynamic modeling.
4.3. Model Validation
We used wind speed values from 14:20:00 to 14:43:20 on 9 June 2019 to validate the accuracy of the CFD simulations. Figure 7 shows a comparison of the dimensionless velocity in the X-direction in the street canyon center between the CFD simulation and experimental measurements. The experimental data were obtained from the ultrasonic anemometer measurement values at a height of 1.05 m on a 2.4 m wind mast. Both simulated and experimental speeds underwent intermittent changes over time. A fifteen percent error bar was incorporated into the comparisons between the experiment data and the CFD results. This figure illustrates that the majority of the CFD simulation results fall within the 15% range of the experimental data. Furthermore, the trends of the simulations align with the fluctuating characteristics of outdoor environmental wind speeds.
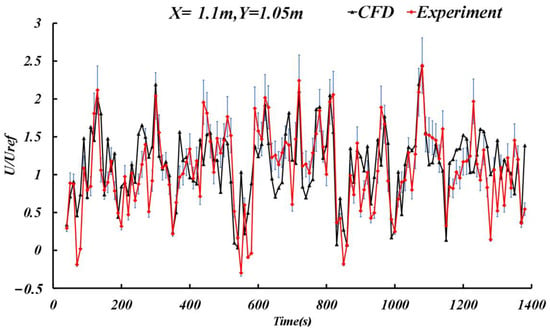
Figure 7.
Comparisons of the dimensionless U velocity of the CFD simulation and experimental measurement (from 14:20:00 to 14:43:20 on 9 June 2019) in the street canyon.
However, the simulated velocities were not identical to the experimentally measured values. These deviations can be attributed to several factors. First, we used the 1 s average value to process the inlet velocity, which may have resulted in differences in wind velocities. Subsequently, the inlet wind profile was based on the experimental data from the 10 m wind mast, whereas the experimental data for comparisons were based on the 2.4 m wind mast. The distance between these two wind masts may have resulted in a 1–2 s delay in the wind speed, which may also have led to deviations in wind velocity results.
Generally, the overall trends of wind velocity in street canyons were similar, and the airflow characteristics, including sudden increases or decreases in velocity values, were reconstructed. Therefore, the simulated velocity field was considered to be in agreement with the velocity field in the actual environment.
5. Results and Discussions
5.1. Airflow Fields
We selected four time points to underline the airflow field inside and above the street canyons, as shown in Figure 5b. The velocities at (14:16:15) and (14:23:25) were the highest and lowest values of the boundary velocity, respectively; the velocities at (14:16:15) and (14:31:05) were the starting and ending values of the boundary velocity, respectively; and the velocities at (14:18:35) were the average values of the boundary velocity.
The influence of the time-varying wind conditions on the airflow fields inside and above the street canyon is shown in Figure 8 for four different time points (). The results indicated that the upper-boundary time-varying wind conditions affected the vortex and shear layers in the street canyon. The airflow movement in the street canyons was stable with a single vortex. This vortex is a typical flow structure in a street canyon in a given direction with a constant wind velocity [43,44]. As indicated in previous studies [45,46], with an unchangeable wind direction under steady and real-time boundary conditions, the basic airflow structures inside and above the street canyon are similar. However, under real-time boundary wind conditions, the airflow structure inside and above street canyons exhibits a highly intermittent process [31]. In this study, this phenomenon occurred in the airflow structures of street canyons under time-varying wind conditions. At the four time points, a horizontal shear layer formed at the top of the street canyon, and a clockwise vortex formed inside the street canyon. The vortex characteristics in the street canyons were different, which were the results of the changing upper wind velocities from to . For , compared with , the upper wind speed increased significantly, and the overshoot of the upper boundary airflow led to the compression of the vortex inside the street canyon. For , compared with , the upper wind speed decreased, and the decay of the upper boundary airflow led to the expansion of the vortex inside the street canyon.
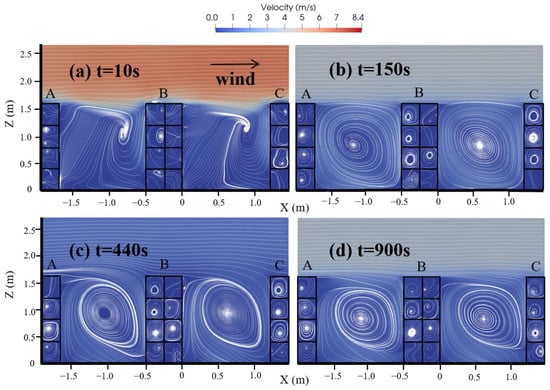
Figure 8.
Velocity contours and vector distributions on the vertical plane () at four time points: (a) t = 10 s, (b) t = 150 s, (c) t = 440 s, (d) t = 900 s.
Moreover, the stability of the vortex structure within the street canyon is noteworthy. The 2D streamlines, as depicted in the streamwise flow profile (XZ-plane), offer a lucid depiction of how the airflow undergoes changes influenced by the street canyon’s structure. The airflow follows a trajectory along the upper boundary of the street canyon, penetrates the interior, makes contact with the building walls and ground, thereby altering its course. The building walls and ground act as impediments to the airflow, resulting in a higher wind speed on the windward side in comparison to the leeward side. This discrepancy in wind speeds contributes to an elevated concentration of pollutants on the leeward side as opposed to the windward side during the dispersion of pollutants within the street canyon.
As shown in Figure 9, the wind speed was different at the vertical line () in the street canyon. Owing to the vortex movement and centrifugal effect, the wind speeds at the bottom and top of the street canyon were much higher than those at the middle height of the street canyon. From to , the four wind speeds exhibited a fluctuating trend with changes in the time-varying wind conditions.
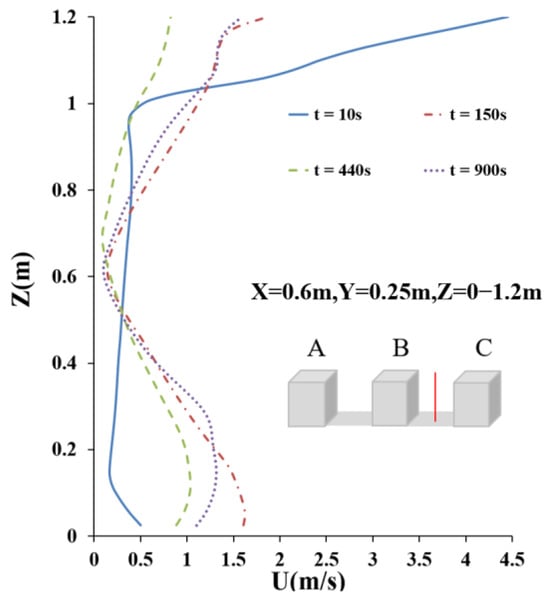
Figure 9.
Velocities of the vertical line () in the street canyons at four time points.
The wind speed at the top of the street canyon was affected by the upper boundary wind conditions. The wind speeds at the bottom and middle parts were affected by both the upper boundary wind conditions and airflow structure in the street canyon. This conclusion was also reached by Zhang et al. [31] and Louka et al. [29], who experimentally determined the flapping of the shear layer. The shear layer at the top of the street canyon affects the vortex of the airflow inside the street canyon, reflecting the flapping of the shear layer.
In this study, the influence of time-varying wind conditions on the airflow field in a street canyon was investigated, and the dynamic wind conditions affected the diffusion of pollutants in the street canyon.
5.2. Temperature Fields
The effect of time-varying wind conditions on the temperature distribution in street canyon models was studied at three different time points (). The velocities at and were the highest and lowest values of the boundary velocity, respectively, and the velocity at was the average value of the boundary velocity. As shown in Figure 10, the leeward room temperature on top of the street canyon (room BL4) was higher than that of the windward room (room BW4), and the temperature on the leeward sidewall of the street canyon was slightly higher than that on the windward side. This may be attributed to the solar direction: the leeward side of the street canyon absorbed more solar energy than the windward side, as described in a scaled outdoor experiment [28]. The internal temperature distribution was analogous to that of the airflow vortex in a street canyon. When the low-temperature incident wind flowed over the street canyon, the incident wind and air in the street canyon underwent a heat exchange process, and the wind removed part of the heat in the street canyon, reducing the air temperature in the street canyon. Similar results were obtained by Li et al. [47], where the air temperature of the street canyon was directly related to the airflow temperature, and a lower wind speed was conducive to heat dispersion in the street canyon. Some studies have also shown that the ambient wind speed can affect the temperature of street canyons, and a decrease in ambient wind speed can result in an increase in temperature [48].
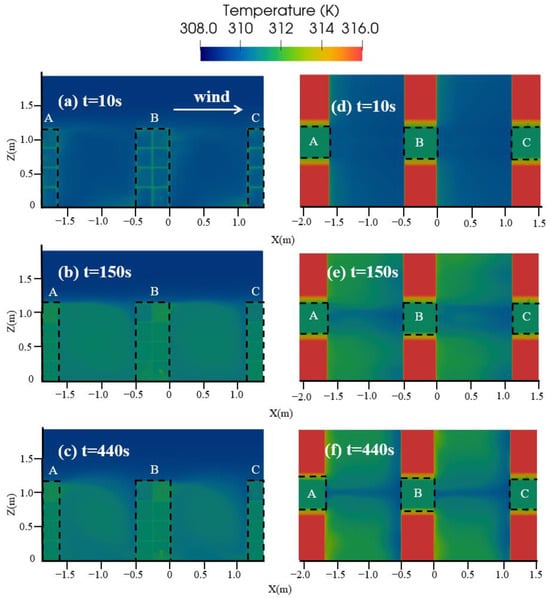
Figure 10.
Temperature distributions on the vertical plane and the horizontal plane at three time points: (a,d) t = 10 s, (b,e) t = 150 s, (c,f) t = 440 s.
We observed that a street canyon room with openings can affect the temperature distribution and that the air temperature in a street canyon room with an opening is lower than that in a room without an opening. Owing to the room opening of street canyons, the low-temperature inlet wind enters each room, generates vortices, and exchanges heat with the air near the building opening, causing airflow disturbance and reducing the temperature. The temperatures at other locations in street canyons without openings are higher than those at the center of street canyons without air heat transfer.
5.3. Pollutant Dispersion inside the Street Canyons under Time-Varying Wind Conditions
5.3.1. Interunit Dispersion on the Leeward Side of Building B
This study investigated the influence of dynamic wind conditions on the dispersion of pollutants in a street canyon and identified the instant pollutant source locations using concentration data from a scaled outdoor experiment. We selected one room as the pollutant source to simulate pollutant dispersion in street canyons under time-varying wind conditions. Room BL1 was set as the source room and released carbon dioxide (CO2) as the tracer gas, whereas the tracer gas concentrations in the other seven rooms (BL2, BL3, BL4, CW1, CW2, CW3, and CW4) were monitored.
In this study, continuous periods (t = 1, 5, 8, 12, and 15 min) were selected to observe concentration changes under time-varying wind conditions. As shown in Figure 11a, at t = 1 min, the CO2 in room BL1 was released for 1 min, and the pollutants were primarily concentrated in the lower part of the room. At t = 5 min, the outdoor wind speed decreased, and the tracer gas entered the upper two rooms. Under the effect of dynamic wind, the tracer gas diffused from the opening of the source room to rooms BL2 and BL3; however, the concentration magnitude levels of these two rooms were much lower than those of the source room. At t = 8 min, the outdoor wind speed was the average wind speed during the entire process, which was slightly higher than that at t = 5 min. Here, the tracer gas concentration accumulated in the source room, and the concentration value was higher than that at t = 1 min. The tracer gas also spread across rooms; after entering BL2 and BL3 rooms successively, the tracer gas spread along the leeward side wall to the top of the street canyon. At t = 12 min, when the wind speed reached its maximum value, the air mass in the street canyons was compressed by the upper airflow, and the diffusion process of the tracer gas to the top of the street canyons was weakened. At t = 15 min, the re-entered tracer gas dispersed in rooms BL2 and BL3 was more evenly dispersed, owing to the dynamic wind effect.
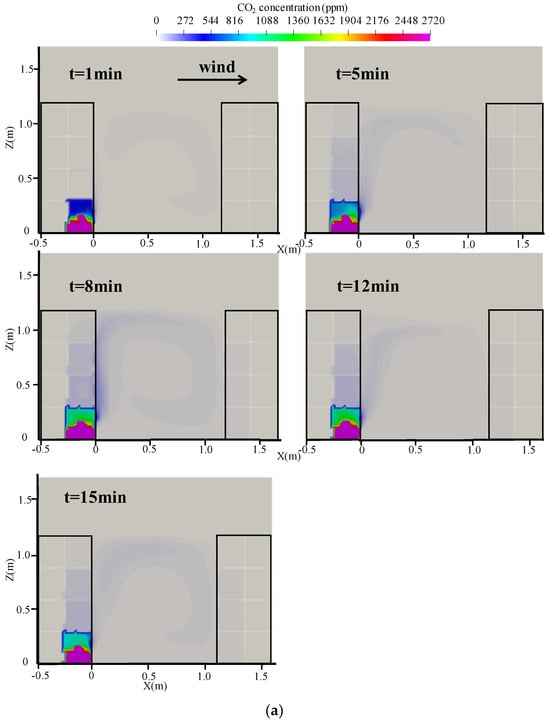
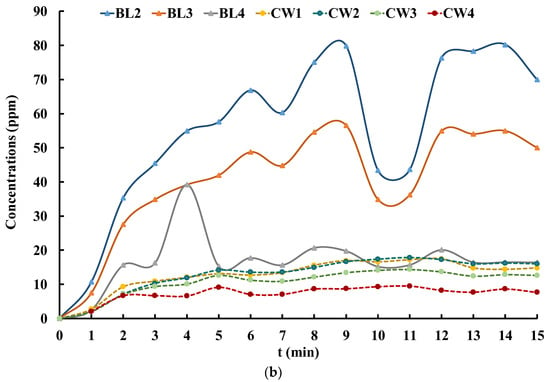
Figure 11.
Concentration dispersions in the street canyon: (a) CO2 dispersion in source room BL1 at five time points; (b) CO2 concentrations of seven monitored rooms during gas releasing process for 15 min.
Figure 11b presents the 60 s averaged value of the CO2 concentrations in the seven monitored rooms, which exhibited a fluctuating trend under the influence of dynamic wind. As shown in Figure 11b, of the seven rooms, BL2 and BL3 had the highest CO2 concentrations. The concentration values of rooms BL2 and BL3 changed dramatically with a similar trend. The concentrations in rooms CW1, CW2, CW3, and CW4 changed steadily. At t = 0 min, the concentrations of BL2 and BL3 increased sharply, peaked at t = 9 min, decreased significantly until t = 11 min, and then increased to higher values after t = 11 min.
5.3.2. Ventilation Rates of Rooms in the Building B
In this study, the ventilation performances of eight rooms in Building B were analyzed using the tracer gas decay method. Assuming there was neither a background concentration nor an indoor tracer gas source, the air exchange per hour (ACH) (h−1) can be calculated using a two-point method [49]:
Figure 12a presents the relationship between the tracer gas concentration and time with an exponential change. The attenuation rates of the tracer gas concentration in rooms BW2 and BW3 were higher than those in the other six rooms within the first 100 s after the tracer gas was released. The rooms on the windward side were directly affected by the wind, which resulted in the tracer gas decay rate of the room on the windward side being higher than that on the leeward side.
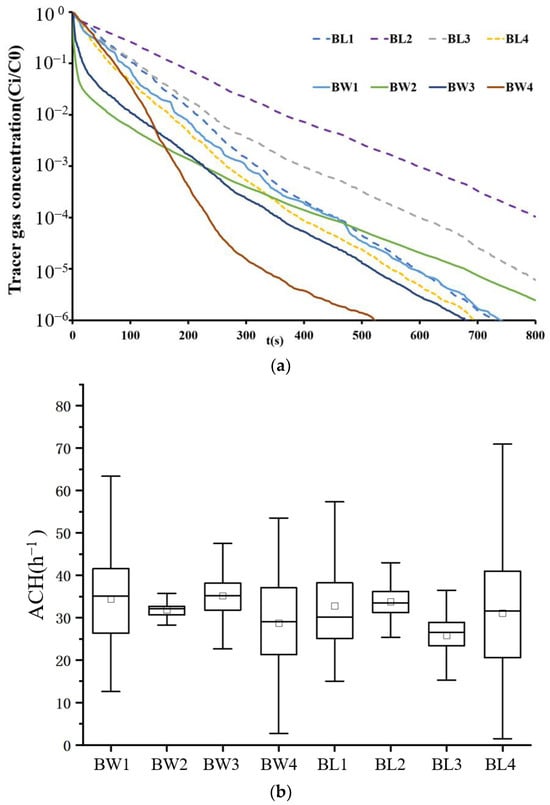
Figure 12.
The results of concentration decays and ventilation rate of each room: (a) relationship between dimensionless tracer gas concentration and time with an exponential change; (b) box charts of ACH values of each room in the street canyon.
Figure 12b shows box charts of the ACH values of the eight rooms in the street canyon. The box edges represent the 25th and 75th percentiles. A line in the box represents the 50th percentile of a data group, and the symbol (□) indicates the mean value of each data group. When the room was on the windward side, the mean ACH of BL2 was slightly higher than those of the other three rooms. Under dynamic wind conditions, the ACH values of BW1 and BW4 fluctuated significantly, whereas the ACH values of BW2 and BW3 remained stable. When the room was located on the leeward side, the ACH values of the four rooms were consistent with those on the windward side. The ACH values of the highest and lowest rooms fluctuated significantly, and the ACH values of the middle room were relatively stable, which differed from the ventilation efficiency calculated using the integral method [50]. The tracer gas decay method can more precisely predict the ventilation distribution in rooms in street canyons under a transient airflow field.
5.4. Results of Pollutant Source Identification
In this study, we selected three cases to apply probability-based inverse modeling to locate source rooms under real atmospheric conditions. The pollutant concentration was set to a limit of 10 ppm; when the pollutant concentration in the monitored room exceeded 10 ppm, an abnormal concentration alarm occurred immediately. Probability-based inverse modeling was then applied to identify the location of the source room in the street canyon building when alarms occurred in more than two rooms.
5.4.1. Case 1: Abnormal Concentration Values in Monitored Rooms BL2, BL3, and CW3
During the period from 14:18 to 14:31 p.m., the monitored rooms BL2, BL3, and CW3 in the street canyon building were alarmed, and the real-time concentration data monitored by the pollutant sensors are shown in Table 4. The highest concentration of pollutants in monitored room BL2 was 39.7 ppm and could still be maintained at the highest concentration at the end of the experimental period. Based on the obtained experimental data, a forward CFD simulation was first developed to obtain the ambient airflow field in street canyons during the period with real atmospheric boundary conditions. Room BL2, the first room to exceed the pollutant limit, was selected to simulate the SALP probability field using the source identification method under the dynamic airflow field proposed in Section 3.2. Similar operations were performed for rooms BL3 and CW3, which subsequently exceeded the pollutant limits, to obtain two sets of SALP probability fields. The final CALP probability field was obtained by solving the three sets of SALP fields jointly with the experimentally measured concentration values exceeding 10 ppm, as shown in Figure 13. The red part of the figure represents the maximum possible location of the pollutant source, and the black circle represents the location of the real pollutant source room in the experiment.

Table 4.
Concentrations of room BL2, BL3, and CW3 over the limit (excluding background concentration, ppm).
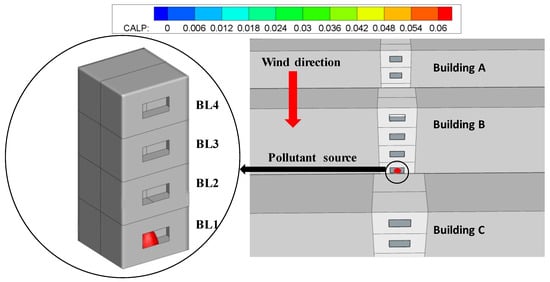
Figure 13.
Predicted location probability of pollution source room BL1.
The figure shows that the maximum possible location of the predicted pollutant source was in the center of room BL1, and the value for the CALP is 0.06. The value of CALP for room BL1 is greater than the other rooms. Compared with the experimental settings, and in this period, the source room was also room BL1. Therefore, when the monitored concentration values in rooms BL2, BL3, and CW3 showed abnormalities, probability-based inverse modeling was initiated immediately to find the source location, which was successfully located in source room BL1. This case also implied that, in a street canyon environment, the pollutant in the room on the lower part of the leeward side has the greatest effect on the other rooms, and it is important to accurately identify the location of the source room.
Note that, from the experimental results in Table 1, five rooms were over the threshold, but in this case, we only used the first three rooms that exceeded the thresholds, which could already successfully locate the source room.
5.4.2. Case 2: Abnormal Concentration Values in Monitored Rooms BL3 and BL4
During the period from 15:12 to 15:19 p.m., monitoring rooms BL3, BL4, and AW3 of the street canyon building were alarmed, and the real-time concentration data monitored by the pollutant sensors are shown in Table 5. The pollutant concentrations in rooms BL3 and BL4 exceeded the limits approximately 1 and 4 min after the beginning of the experiment, respectively. The measured pollutant concentration data from these three rooms were used as inputs for inverse modeling. The forward velocity field was simulated based on the wind speed information obtained from the experiment during this period. Subsequently, the SALP probability fields of monitored rooms BL3 and BL4 could be obtained. The predicted pollutant source locations are shown in Figure 14.

Table 5.
Concentrations of room BL3 and BL4 over the limit (excluding background concentration, ppm).
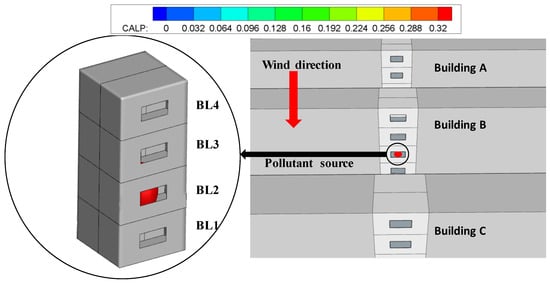
Figure 14.
Predicted location probability of pollution source room BL2.
The figure shows that the predicted pollutant location was at the center of room BL2, and the value for the CALP is 0.32. The value of CALP for room BL2 is greater than the other rooms. For comparison with the experimental settings, the source room was room BL2. Furthermore, the highest concentration value occurred in room BL3, which could be up to 154.6 ppm, one order of magnitude beyond the concentration limit. This value was the maximum concentration detected in the monitored room throughout the experiment. This was sufficient to show that source room BL2 had a significant impact on the upper room.
5.4.3. Case 3: Abnormal Concentration Values in Monitored Rooms BW2 and BW1
During the period from 12:28 to 12:32 p.m., monitoring rooms BW2 and BW1 of the street canyon building were alarmed, and the real-time concentration data monitored by the pollutant sensors are shown in Table 6. Only the two monitored rooms in Case 3 obtained concentration data that exceeded the limit values during the experimental period. The pollutant concentration in room BW2 detected the over-limit value 1 min after the start of the experiment and directly reached 31.4 ppm, up to 88 ppm. Concentrations above the limit in room BW1 were detected after 4 min. Using the concentration data from these two monitored rooms and applying inverse modeling, we predicted that the maximum probability of the source was located on the lower side of room BW3 and the value for the CALP is 0.28, as shown in Figure 15. The value of CALP for room BW3 is greater than the other rooms. The experiment revealed that the source room was set in room BW3 during the period, which indicated the successful application of source identification.

Table 6.
Concentrations of room BW2 and BW1 over the limit (excluding background concentration, ppm).
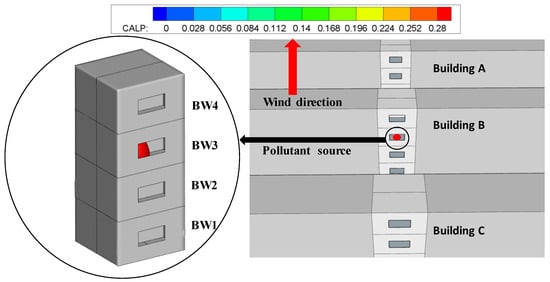
Figure 15.
Probability of predicted location of pollution source room BW3.
6. Conclusions
In this study, an improved adjoint probability method based on CFD was developed to identify pollution source locations in street canyons under dynamic inflow conditions. We used scaled outdoor experimental data as the input conditions to simulate airflow, temperature, and concentration fields with time-varying wind conditions. Three experiments were conducted to verify the accuracy of the proposed source identification method. The following conclusions were drawn from the analysis of this study:
- The change in the boundary wind speed affects the airflow structure inside street canyons. The wind speed at each position in the street canyon fluctuates with changes in the boundary wind speed. Owing to vortex movement and the centrifugal effect, the wind speed at the top and bottom of the street canyons is greater than that in the middle.
- The outdoor wind with a lower temperature exchanges heat with the air at a higher temperature inside the street canyons, thereby removing part of the heat and reducing the heat of the air inside the street canyons. Moreover, the opening of the room produces some air disturbance, which is conducive to heat exchange between the air near the opening and the outdoor wind.
- The fluctuation of the upper wind speed influences the diffusion of the tracer gas, and the ventilation performance of the rooms in the middle of the street canyon is more stable than those in the top and bottom areas.
- We propose an improved adjoint probability method under dynamic wind conditions. Three cases were tested to verify the applicability of this method. The results showed that with limited pollutant information (two or more), all three cases could successfully identify the source location, indicating that this method can be used to locate pollutant sources in street canyons under time-varying inflows in coupled indoor and outdoor conditions.
This study acknowledges certain limitations. The model used in this study is based on a single-sided building with natural ventilation, whereas real-world buildings may have multiple openings. These differences in building types could potentially influence the results of pollutant source identification, an area that will be further explored in future research. Additionally, this study only considered time-varying wind velocities, while wind direction is also a dynamic factor. The impact of dynamic wind directions on source identifications will be considered in future studies.
Author Contributions
Conceptualization, Y.D.; methodology, Y.D.; software, M.H.; validation, M.H.; formal analysis, M.H.; investigation, M.H.; resources, Y.D.; data curation, M.H. and W.T.; writing—original draft preparation, M.H.; writing—review and editing, Y.D. and W.T.; visualization, M.H. and Y.D.; supervision, H.W.; project administration, H.W.; funding acquisition, Y.D. All authors have read and agreed to the published version of the manuscript.
Funding
This study was financially supported by the National Natural Science Foundation of China (No. 52200219), the Shanghai Sailing Program (No. 21YF1430700), and the Chen Guang project (No. 22CGA54), supported by the Shanghai Municipal Education Commission and Shanghai Education Development Foundation.
Data Availability Statement
The data presented in this study are available in the article.
Conflicts of Interest
The authors declare no competing interests relevant to the contents of this paper.
Nomenclature
| Greek symbols | |||
| Turbulent viscous dissipation rate () | |||
| Model constant | |||
| Model constant | |||
| Von Karman constant, 0.41 | |||
| Density () | |||
| molecular viscosity () | |||
| Adjoint probability | |||
| Nomenclature | |||
| Cross-sectional area () | Denotes time | ||
| Constant, 0.09 | turbulence intensity, 4% | ||
| Transient concentration | Velocity component | ||
| Molecular diffusion coefficient () | Empirical coefficient (0.245) | ||
| Pressure (Pa) | Wind velocity at height H (m/s) | ||
| Mixing length, 0.4 m | Reference wind speed (2.46 m/s) | ||
| Turbulent kinetic energy () | Height of the street canyon (1.2 m) | ||
| Scale of strain rate | Standard adjoint location probability | ||
| Stain-rate tensor | Conditioned adjoint location probability | ||
References
- Zhou, Z.; Wang, P.; Deng, J.; Ouyang, C.; Xu, Y.; Jiang, W.; Ma, K. Numerical simulation of street canyon morphology and microclimate in hot summer and cold winter zone. Buildings 2023, 13, 2433. [Google Scholar] [CrossRef]
- Zhang, Y.; Gu, Z.; Yu, C. Impact factors on airflow and pollutant dispersion in urban street canyons and comprehensive simulations: A review. Curr. Pollut. Rep. 2020, 6, 425–439. [Google Scholar] [CrossRef]
- Albuquerque, D.P.; O’Sullivan, P.D.; da Graça, G.C. Effect of window geometry on wind driven single sided ventilation through opening. Energy Build. 2021, 245, 111060. [Google Scholar] [CrossRef]
- Jiang, Z.; Kobayashi, T.; Yamanaka, T.; Sandberg, M.; Choi, N.; Kobayashi, N.; Sano, K.; Toyosawa, K. Wind tunnel experiment of wind-induced single-sided ventilation under generic shelter urban area. Build. Environ. 2023, 242, 110615. [Google Scholar] [CrossRef]
- Mohammadi, M.; Calautit, J.; Owen, J. Inter-room pollutant transmission routes in naturally ventilated street canyon buildings. J. Build. Eng. 2023, 79, 107510. [Google Scholar] [CrossRef]
- Li, Y.; Leung, G.; Tang, J.; Yang, X.; Chao, C.; Lin, J.; Lu, J.; Nielsen, P.; Niu, J.; Qian, H.; et al. Role of ventilation in airborne transmission of infectious agents in the built environment–A multidisciplinary systematic review. Indoor Air 2007, 17, 2–18. [Google Scholar] [CrossRef] [PubMed]
- Nakamura, Y.; Oke, T. Wind, temperature and stability conditions in an east-west oriented urban canyon. Atmos. Environ. 1988, 22, 2691–2700. [Google Scholar] [CrossRef]
- Dascalaki, E.; Santamouris, M.; Argiriou, A.; Helmis, C.; Asimakopoulos, D.N.; Papadopoulos, K.; Soilemes, A. On the combination of air velocity and flow measurements in single sided natural ventilation configurations. Energy Build. 1996, 24, 155–165. [Google Scholar] [CrossRef]
- Eliasson, I.; Offerle, B.; Grimmond, C.S.B.; Lindqvist, S. Wind fields and turbulence statistics in an urban street canyon. Atmos. Environ. 2006, 40, 1–16. [Google Scholar] [CrossRef]
- Niachou, K.; Livada, I.; Santamouris, M. Experimental study of temperature and airflow distribution inside an urban street canyon during hot summer weather conditions. Part II: Airflow analysis. Build. Environ. 2008, 43, 1393–1403. [Google Scholar] [CrossRef]
- Xie, X.; Liu, C.; Leung, D. Impact of building facades and ground heating on wind flow and pollutant transport in street canyons. Atmos. Environ. 2007, 41, 9030–9049. [Google Scholar] [CrossRef]
- Sini, J.; Anquetin, S.; Mestayer, P. Pollutant dispersion and thermal effects in urban street canyons. Atmos. Environ. 1996, 30, 2659–2677. [Google Scholar] [CrossRef]
- Zheng, X.; Montazeri, H.; Blocken, B. Large-eddy simulation of pollutant dispersion in generic urban street canyons: Guidelines for domain size. J. Wind. Eng. Ind. Aerodyn. 2021, 211, 104527. [Google Scholar] [CrossRef]
- Lv, W.; Wu, Y.; Zang, J. A review on the Dispersion and distribution characteristics of pollutants in street canyons and improvement measures. Energies 2021, 14, 6155. [Google Scholar] [CrossRef]
- Hassan, S.; Akter, U.H.; Nag, P.; Molla, M.; Khan, A.; Hasan, F. Large-Eddy Simulation of airflow and pollutant dispersion in a model street canyon intersection of Dhaka city. Atmosphere 2022, 13, 1028. [Google Scholar] [CrossRef]
- Jon, K.S.; Huang, Y.; Sin, C.; Cui, P.; Luo, Y. Influence of wind direction on the ventilation and pollutant dispersion in different 3D street canyon configurations: Numerical simulation and wind-tunnel experiment. Environ. Sci. Pollut. Res. 2022, 30, 31624–31652. [Google Scholar] [CrossRef] [PubMed]
- Chen, G.; Hang, J.; Chen, L.; Lin, Y. Comparison of uniform and non-uniform surface heating effects on in-canyon airflow and ventilation by CFD simulations and scaled outdoor experiments. Build. Environ. 2023, 244, 110744. [Google Scholar] [CrossRef]
- Yang, F.; Kang, Y.; Gao, Y.; Zhong, K. Numerical simulations of the effect of outdoor pollutants on indoor air quality of buildings next to a street canyon. Build. Environ. 2015, 87, 10–22. [Google Scholar] [CrossRef]
- Fan, X.; Zhang, X.; Weerasuriya, A.; Hang, J.; Zeng, L.; Luo, Q.; Li, C.; Chen, Z. Numerical investigation of the effects of environmental conditions, droplet size, and social distancing on droplet transmission in a street canyon. Build. Environ. 2022, 221, 109261. [Google Scholar] [CrossRef]
- Hang, J.; Liang, J.; Wang, X.; Zhang, X.; Wu, L.; Shao, M. Investigation of O3–NOx–VOCs chemistry and pollutant dispersion in street canyons with various aspect ratios by CFD simulations. Build. Environ. 2022, 226, 109667. [Google Scholar] [CrossRef]
- Dallman, A.; Magnusson, S.; Britter, R.; Norford, L.; Entekhabi, D.; Fernando, H. Conditions for thermal circulation in urban street canyons. Build. Environ. 2014, 80, 184–191. [Google Scholar] [CrossRef]
- Yee, E.; Biltoft, C. Concentration fluctuation measurements in a plume dispersing through a regular array of obstacles. Boundary-Layer Meteorol. 2004, 111, 363–415. [Google Scholar] [CrossRef]
- Hang, J.; Chen, G. Experimental study of urban microclimate on scaled street canyons with various aspect ratios. Urban Clim. 2022, 46, 101299. [Google Scholar] [CrossRef]
- Chen, G.; Yang, X.; Yang, H.; Hang, J.; Lin, Y.; Wang, X.; Wang, Q.; Liu, Y. The influence of aspect ratios and solar heating on flow and ventilation in 2D street canyons by scaled outdoor experiments. Build. Environ. 2020, 185, 107159. [Google Scholar] [CrossRef]
- Chen, G.; Wang, D.; Wang, Q.; Li, Y.; Wang, X.; Hang, J.; Gao, P.; Ou, C.; Wang, K. Scaled outdoor experimental studies of urban thermal environment in street canyon models with various aspect ratios and thermal storage. Sci. Total Environ. 2020, 726, 138147. [Google Scholar] [CrossRef] [PubMed]
- Hang, J.; Wang, D.; Zeng, L.; Ren, L.; Shi, Y.; Zhang, X. Scaled outdoor experimental investigation of thermal environment and surface energy balance in deep and shallow street canyons under various sky conditions. Build. Environ. 2022, 225, 109618. [Google Scholar] [CrossRef]
- Dai, Y.; Mak, C.; Hang, J.; Zhang, F.; Ling, H. Scaled outdoor experimental analysis of ventilation and interunit dispersion with wind and buoyancy effects in street canyons. Energy Build. 2022, 255, 111688. [Google Scholar] [CrossRef]
- Dai, Y.; Mak, C.; Zhang, Y.; Cui, D.; Hang, J. Investigation of interunit dispersion in 2D street canyons: A scaled outdoor experiment. Build. Environ. 2020, 171, 106673. [Google Scholar] [CrossRef]
- Louka, P.; Belcher, S.; Harrison, R. Coupling between air flow in streets and the well-developed boundary layer aloft. Atmos. Environ. 2000, 34, 2613–2621. [Google Scholar] [CrossRef]
- Cheng, X.; Zeng, Q.; Hu, F. Characteristics of gusty wind disturbances and turbulent fluctuations in windy atmospheric boundary layer behind cold fronts. J. Geophys. Res. Atmos. 2011, 116, D06101. [Google Scholar] [CrossRef]
- Zhang, Y.; Gu, Z.; Cheng, Y.; Lee, S. Effect of real-time boundary wind conditions on the air flow and pollutant dispersion in an urban street canyon—Large eddy simulations. Atmos. Environ. 2011, 45, 3352–3359. [Google Scholar] [CrossRef]
- Duan, G.; Ngan, K. Effects of Time-Dependent Inflow Perturbations on Turbulent Flow in a Street Canyon. Boundary-Layer Meteorol. 2018, 167, 257–284. [Google Scholar] [CrossRef]
- Wang, H.; Wang, Q.; Yang, X.; Chen, T.; Lam, C.; Zhang, M.; Hang, J. Steady and unsteady turbulent flows and pollutant dispersion in 2D street canyons with novel boundary conditions and various Re numbers. Urban Clim. 2021, 39, 100973. [Google Scholar] [CrossRef]
- Liu, X.; Zhai, Z. Inverse modeling methods for indoor airborne pollutant tracking: Literature review and fundamentals. Indoor Air 2007, 17, 419–438. [Google Scholar] [CrossRef]
- Dai, Y.; Zhang, F.; Wang, H. Identification of source location in a single-sided building with natural ventilation: Case of interunit pollutant dispersion. J. Build. Eng. 2023, 68, 106049. [Google Scholar] [CrossRef]
- Neupauer, R.; Wilson, J. Adjoint method for obtaining backward-in-time location and travel time probabilities of a conservative groundwater contaminant. Water Resour. Res. 1999, 35, 3389–3398. [Google Scholar] [CrossRef]
- Zhai, Z.; Liu, X.; Wang, H.; Li, Y.; Liu, J. Experimental verification of tracking algorithm for dynamically-releasing single indoor contaminant. Build. Simul. 2012, 5, 5–14. [Google Scholar] [CrossRef] [PubMed]
- Wang, H.; Lu, S.; Cheng, J.; Zhai, Z. Inverse modeling of indoor instantaneous airborne contaminant source location with adjoint probability-based method under dynamic airflow field. Build. Environ. 2017, 117, 178–190. [Google Scholar] [CrossRef]
- Chen, L.; Chen, W.; Lin, J.; Chen, C.; Luo, Y.; Tao, L. Inverse model investigation of radionuclide dispersion in a ventilated room based on the adjoint probability method. Ann. Nucl. Energy 2022, 169, 108929. [Google Scholar] [CrossRef]
- Yakhot, V.; Orszag, S. Renormalization-Group analysis of turbulence physical review letters. J. Sci. Comput. 1986, 57, 1722. [Google Scholar]
- Ai, Z.; Mak, C. CFD simulation of flow in a long street canyon under a perpendicular wind direction: Evaluation of three computational settings. Build. Environ. 2017, 114, 293–306. [Google Scholar] [CrossRef]
- Snyder, W. Guideline for Fluid Modeling of Atmospheric Diffusion: Environmental Sciences Research Laboratory; Office of Research and Development, US Environmental Protection Agency: Washington, DC, USA, 1981; Volume 81. [Google Scholar]
- Chan, A.; So, E.; Samad, S. Strategic guidelines for street canyon geometry to achieve sustainable street air quality. Atmos. Environ. 2001, 35, 5681–5691. [Google Scholar] [CrossRef]
- Gu, Z.; Zhang, Y.; Lei, K. Large eddy simulation of flow in a street canyon with tree planting under various atmospheric instability conditions. Sci. China Technol. Sci. 2010, 53, 1928–1937. [Google Scholar] [CrossRef]
- Baik, J.; Park, R.; Chun, H.; Kim, J. A laboratory model of urban street-canyon flows. J. Appl. Meteorol. 2000, 39, 1592–1600. [Google Scholar] [CrossRef]
- Walton, A.; Chen, A.; Yeung, W. Large-eddy simulation of pollution dispersion in an urban street canyon—Part I: Comparison with field data. Atmos. Environ. 2002, 36, 3602–3613. [Google Scholar] [CrossRef]
- Li, Z.; Zhang, H.; Wen, C.; Yang, A.; Juan, Y. Effects of height-asymmetric street canyon configurations on outdoor air temperature and air quality. Build. Environ. 2020, 183, 107195. [Google Scholar] [CrossRef]
- Memon, R.; Leung, D.; Liu, C. Effects of building aspect ratio and wind speed on air temperatures in urban-like street canyons. Build. Environ. 2010, 45, 176–188. [Google Scholar] [CrossRef]
- Laussmann, D.; Helm, D. Air Change Measurements Using Tracer Gases: Methods and Results. Significance of Air Change for Indoor Air Quality. In Chemistry, Emission Control, Radioactive Pollution and Indoor Air Quality; IntechOpen: London, UK, 2011. [Google Scholar]
- Ai, Z.; Mak, C. Wind-induced single-sided natural ventilation in buildings near a long street canyon: CFD evaluation of street configuration and envelope design. J. Wind. Eng. Ind. Aerodyn. 2018, 172, 96–106. [Google Scholar] [CrossRef]
Disclaimer/Publisher’s Note: The statements, opinions and data contained in all publications are solely those of the individual author(s) and contributor(s) and not of MDPI and/or the editor(s). MDPI and/or the editor(s) disclaim responsibility for any injury to people or property resulting from any ideas, methods, instructions or products referred to in the content. |
© 2023 by the authors. Licensee MDPI, Basel, Switzerland. This article is an open access article distributed under the terms and conditions of the Creative Commons Attribution (CC BY) license (https://creativecommons.org/licenses/by/4.0/).