Article

Simulation Analysis of the Fracture of Reinforcement Concrete Columns Using High-Voltage Pulse Discharge

1
School of Architectural and Civil Engineering, Harbin University of Science and Technology, Harbin 150080, China
2
Heilongjiang Province Hydraulic Research Institute, Harbin 150050, China
*
Author to whom correspondence should be addressed.
Buildings 2023, 13(9), 2200; https://doi.org/10.3390/buildings13092200
Submission received: 29 July 2023 / Revised: 22 August 2023 / Accepted: 27 August 2023 / Published: 29 August 2023
(This article belongs to the Special Issue Dynamic Response of Structures)

Abstract

:
High-voltage pulse discharge (HVPD) in liquid technology, when applied to the demolition of concrete structures, has the advantages of green environmental protection, saving energy, emission reduction, safety, reliability, etc. However, research on the influence law of various factors on the effect of crushing is still insufficient. Therefore, this manuscript equated the shock load caused by HVPD to the blasting load and introduced a cohesive zone model based on ABAQUS. The whole process of a concrete column being subjected to a shock wave generated by pulse power discharge was simulated and analyzed. To validate the model’s reasonableness, a comparison and analysis were conducted with the results of experimental studies on concrete column fractures caused by HVPD in liquid. The study further investigated the influence of three parameters—one-side longitudinal reinforcement ratio, volume hoop ratio, and concrete grade strength—on the degree of fracture of the concrete column with a single row of holes (i.e., the width of transverse cracks or longitudinal cracks around the drilled holes). The simulation results revealed that the width of transverse cracks decreases significantly with the increase in the one-side longitudinal reinforcement ratio of the column, while the width of longitudinal cracks decreases substantially with the increase in the volume hoop ratio of the column. In addition, the degree of fracture of concrete columns decreases slightly with the increase in the concrete grade strength. Based on the simulation results, the mathematical expressions between the crack widths (transverse crack width and longitudinal crack width) and the key parameters, such as the one-side longitudinal reinforcement ratio of the column, volume hoop ratio of the column, and concrete grade strength, were established, respectively. These expressions facilitate their practical application in engineering practice.

1. Introduction

HVPD technology is an innovative approach that accumulates low-power energy over a period of time and then releases high-power energy for a brief period [1]. This technology has shown significant hydro-mechanical destructive capabilities in engineering applications and finds extensive use in wastewater treatment and rock crushing [2,3,4]. With the acceleration of urbanization in China, the demand for building demolition is on the rise. Compared with the traditional manual, mechanical, and blasting demolition methods, the crushing method centered on HVPD technology has the characteristics of being green, easy to operate, energy-saving, and having high efficiency, making it a promising option for engineering applications [5]. At present, a number of scholars have conducted experimental studies on fractures using HVPD in liquid for rock, concrete, and other brittle solid materials. T.H. Weise [6] conducted rock-breaking tests using copper wire explosion methods and concluded that HVPD serves as a viable alternative to traditional explosive blasting. I.V. Lisitsyn and H. Inoue [7] demonstrated that the efficiency of solid-material crushing depends significantly on the discharging energy, with different pulse energies requiring corresponding optimal voltage settings. N.S. Kuznetsova [8] conducted an experimental study on electric-wire explosion crushing of concrete blocks and found that the efficiency of electric-wire explosion improves with the increase in the length of the wire under a certain diameter. K.J. Uenishi [9] found that the fluctuation-based explosives blast analysis method is also applicable to high-voltage pulse blasting, enabling the controlled non-strenuous dynamic crushing of building materials and structures. A.S. Yudin et al. [10] conducted a test involving crushing concrete using a metal electric-wire explosion. The energy utilization of simultaneous blasting and hole-by-hole blasting was compared, and a multi-hole pulse-discharge separation method was proposed. Additionally, a method for separating concrete blocks via the pulse discharge of multiple boreholes was proposed. Multiple holes discharging at the same time can form cracks along the predetermined direction, and the solid undergoes oriented separation. Simultaneous explosions have more advantages in terms of energy consumption than pore-by-hole explosions. Q. Xue [11] utilized COMSOL v. 2021 software to simulate the fracture of rocks using HVPD, revealing that the rock crushing area increases with higher voltage and decreases with greater electrode spacing. N. Li [12] simulated and analyzed the whole process of concrete being subjected to shock waves generated using HVPD. L. Che [13] conducted numerical simulation and experimental research of hard-rock breaking using HVPD, examining using two parameters: electrode gap and hard rock type. Using the three-dimensional electromagnetic simulation software Computer Simulation Technology v2023, the electric field distribution of the electrode and variation of motion trajectory of discharge particles within the hard rock were simulated. Y. Qin [14] proposed an innovative technology of HVPD to investigate the crushing characteristics of galena ore. The optimal experiment parameters were determined as follows: spark gap spacing of 25 mm, pulse number of 120, and voltage of 25 kV.
In recent years, most simulation analysis on the fracture of solid materials using HVPD in liquid has primarily focused on rocks. Although there have been some simulation studies on plain concrete members, the simulation analysis of reinforced concrete fractures is still limited. In order to better apply this method in the field of engineering demolition, it is essential to simulate the whole process of concrete components with complex reinforcements being subjected to shock waves generated using HVPD. In view of this, a numerical simulation of the experimental study on the fracture of concrete columns using HVPD was carried out to verify the rationality of the computational numerical model and to determine the complete and reliable relevant parameters based on ABAQUS in this manuscript. The influence patterns of different concrete grade strengths, one-side longitudinal reinforcement ratios, and volumetric hoop ratios on the fracture effect (i.e., the width of the transverse crack or longitudinal crack around the drilled holes) of the concrete columns were further investigated. Meanwhile, mathematical expressions involving the degree of reinforcement concrete-column destruction and the parameters of concrete grade strength, one-side longitudinal reinforcement ratio, and volume hoop ratio were established to facilitate applications in engineering practice.

2. Basic Theory of Concrete Fracture Using HVPD in Liquid

The crushing method using HVPD in liquid can be classified into three types based on the different discharge methods: direct breakdown, electrohydraulic effect, and electric-wire explosion. In an experimental study [15] of this subject group, comparing the impact of these three discharge methods on the fracture effect of concrete members, electric-wire explosion (using copper wire) was selected as the test program.

2.1. Principle of Electric-Wire Explosion in Liquid

Electrical-wire explosion is the process of applying a high voltage at both ends of a wire instantaneously and introducing a powerful pulse current using an energy storage capacitor bank. The metal wire can obtain huge energy in an instant to make its temperature rise rapidly. During the temperature rise, the wire undergoes a phase transition. The wire changes from the solid state to a liquid, gas, or plasma state, accompanied by shock waves, generating high energy [16]. The entire process of metal electric-wire explosion is shown in Figure 1 [17].

2.2. Shock Pressure from Electric-Wire Explosion

Regarding the physical process, the liquid electric-wire explosion can be approximated as an outwardly expanding column piston. Whenever there is a sufficiently fast acceleration (volume mutation) process, shock waves are generated, and volume changes generally correspond to the onset of phase transitions. As the phase transition of the wire is complex, the entire electro-explosive process can produce multiple shock waves of varying strengths and spatial and temporal orders [18,19]. Water is a good medium for pressure transfer because of the low compressibility and the little deformation energy consumed. As the wire rises in temperature in the water, the surrounding liquid rapidly heats up and evaporates into vapor, which in turn forms bubbles. These bubbles expand and collapse rapidly as the pressure in the liquid changes. The process causes the violent movement of the surrounding liquid, and the collapse of the bubbles and the violent movement of the liquid create a shock wave.
According to the results of the experimental study of the shock wave characteristics of discharge in liquid carried out by Touya [20] and others, the empirical equation for the shock compressive stress P in the direction of the hole ring is shown in Equation (1).
P = 9000 d E 1 0.35
where: E1—the energy released from the liquid; d—distance between the discharge point and the test point.

3. Finite Element Modeling

3.1. General Details

The FE software ABAQUS was used in order to build and analyze a FE model for the concrete column. An eight-node linear hexahedral element (C3D8R)) for concrete and a two-node linear 3-D truss element (T3D2) for reinforcements were used for modeling the main structural members, respectively. As a result of the sensitivity study for mesh size, a mesh size of about 10 mm was suggested in this manuscript. In order to better reflect the limiting effect of steel reinforcements on concrete cracking, this manuscript used a command of ‘Embedded’ to combine the concrete and internal reinforcements.

3.2. Material Principal Relationships

3.2.1. Concrete Principal Relationships

There are three commonly used concrete principal models in ABAQUS: Concrete Damaged Plasticity, Concrete Smeared Cracking, and Cracking Model for Concrete. Among them, Cracking Model for Concrete is only applicable to ABAQUS’s explicit analysis module. The Concrete Damaged Plasticity (CDP) model is utilized in ABAQUS to simulate the finite element model of concrete. This model is based on plasticity and represents a continuum medium-damage model. The material in this model undergoes hardening initially, followed by softening after compressive yielding, as well as softening after tensile yielding. Moreover, the CDP model accounts for the distinct tensile and compressive properties of the material, leading to a successful convergence during simulations. It proves effective for unidirectional loading, as well as cyclic and dynamic loading scenarios. Additionally, the CDP model enables the simulation of material damage post-compressive yielding [21].
The CDP model assumes that concrete materials are damaged primarily by tensile cracking and compressive crushing. The evolution of the yield or damage surface is governed by two variables: ε c p l (compressive equivalent plastic strain) and ε t p l (tensile equivalent plastic strain). The stress–strain curve adopts the curve recommended by the Code for Design of Concrete Structures GB50010-2010 [22].
When the concrete strain is ε c or ε t unloaded, the corresponding concrete compressive stress σ c , C D P and tensile stress σ t , C D P calculation formulas are shown in Equation (2) and Equation (3), respectively:
σ c , C D P = ( 1 d c ) E 0 ( ε c ε c p l )
σ t , C D P = 1 d t E 0 ( ε t ε t p l )
where: E 0 —concrete modulus of elasticity, dc, dt—concrete damage factor. They are calculated using the concrete damage factor calculation method, proposed based on the assumption of energy equivalence [14]. According to the conversion results of damaged plastic stress–strain parameter calculation, it can be calculated according to Equation (4):
d i = 1 σ i , C D P E 0 ε i , i = c , t
where: when the concrete is under compression, i = c ; when the concrete is in tension, i = t .
Table 1 representatively summarizes the concrete properties in ABAQUS v.2021 software. One notable parameter is fb0/fc0, which signifies the ratio between the initial equivalent biaxial compressive yield stress and the initial uniaxial compressive yield stress. Additionally, the parameter “K” represents the ratio between the constant stress in the tensile meridian and that in the compressive meridian.

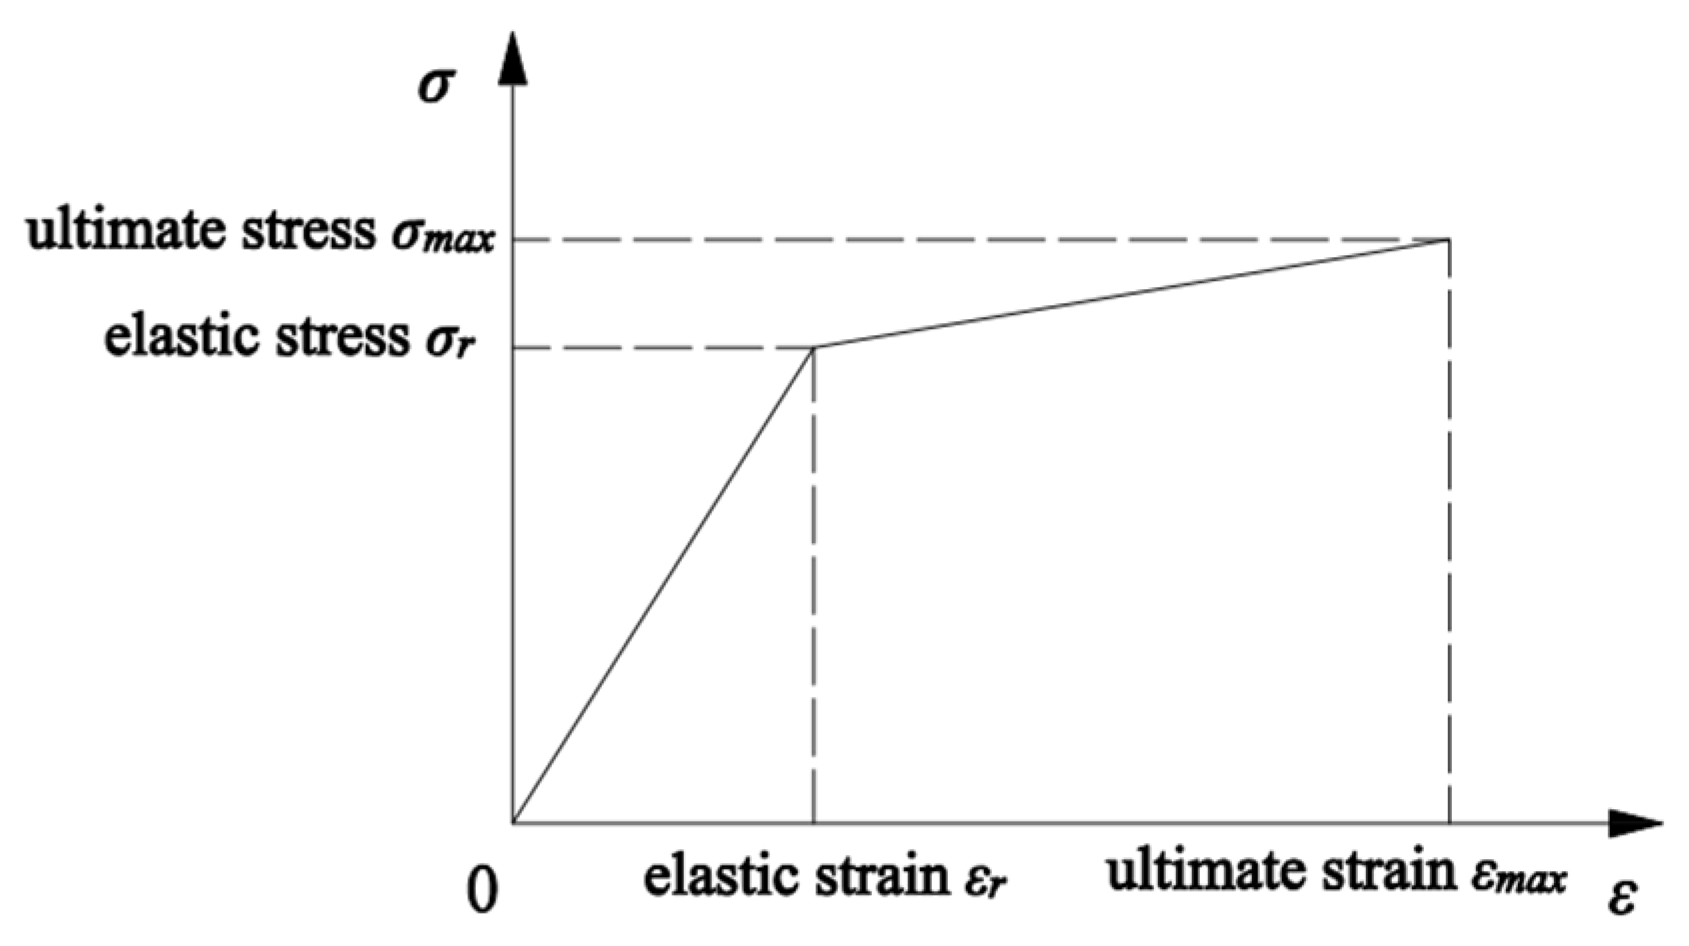
3.2.2. Reinforcement Principal Relationships

According to the performance of the reinforcement in the test, the stress–strain relationship model of the reinforcement is adopted using the bilinear principal model. The tensile and compressive elastic moduli of the steel reinforcement are the same, the post-yield elastic modulus ES = 0.01Es, and the stress–strain relationship is still linear. Poisson’s ratio was taken as 0.3 for both, and the material properties of steel and reinforcement were set based on Table 3. The principal relationship curves are shown in Figure 2 [23].

3.2.3. Determination of the Dynamic Increase Factor of the Material

According to U.S. Standard UFC 3-340-02 [24], some rapid loading—similar to an explosion—generates very high strain rates in the material. The strength of the material increases at high strain rates, so the Dynamic Increase Factor (DIF) is introduced, which is equal to the ratio of the dynamic strength to the static strength [25].
For reinforcement:
D I F y = f d y f d = 1.17
D I F u = f d u f u = 1.05
For concrete:
D I F c = f d c f c = 1.19
where: f d y —Dynamic yield strength of the reinforcement; f d u —Dynamic ultimate strength of the reinforcement; f d c —Dynamic compressive strength of concrete; f d —Yield strength of the reinforcement; f u —The ultimate strength of the reinforcement; f c —Compressive strength of concrete.

3.3. Shock Load Simulation of HVPD in Liquid

3.3.1. Equivalent Simulation of HVPD in Liquid

HVPD in liquid involves a change in the phase state of the discharged material from liquid to gas to plasma, and therefore direct finite element simulation is difficult to realize. The process of producing shock waves using HVPD in liquid and explosions is similar, and the current TNT-blast-loading simulation techniques are better established and described. Therefore, in this manuscript, the equivalency of HVPD in liquid and TNT-blast loading is used to carry out simulation and analysis.

3.3.2. Selection and Application of Explosion Loads

The CONWEP (Conventional Weapons Effects Program) model is a widely used empirical model for proximity blast calculations. In ABAQUS, it is only necessary to define the point of initiation, the area of the structural surface on which the blast load acts, the type of explosion, and the TNT equivalent of the explosive. The model can calculate parameters such as load arrival time, maximum overpressure, overpressure time, exponential decay factor, etc., in the blast-load curve based on the above data. The curve of the CONWEP blast shock wave with time is shown in Figure 3 [25].
According to the wire explosion principle, if the energy is sufficient, the explosion process occurs continuously in a short period of time on the wire, so the whole wire electrically explodes. In this manuscript, based on the principle of equal impact pressure, the HVPD impact load is equated to the shock wave generated by the explosion of TNT explosives, which acts in the circular direction on the side walls of the drilled borehole [26].
A simple model for estimating the shock pressure from an explosion—the Friedlander equation—is introduced here. The specific equation is given in Equation (8). This manuscript made P in Equation (1) equal to P in Equation (8) to equate the shock load caused by HVPD to the TNT blasting load [27].
P = C W R 2
where: P is the impact pressure (Pa); C is a constant, related to the nature of the explosive; W is the mass of explosives (kg); R is the observation point from the center of the explosion distance (m).

4. Simulation of Concrete Fracture Mechanics Based on the Cohesive Zone Model

The degree of concrete fragmentation using HVPD in liquid can be measured according to the crack development width. In this manuscript, the cohesive zone model is applied to numerically simulate the whole process of concrete crack development.

4.1. Basic Theory of Concrete Fracture Mechanics

Concrete is a multiphase composite material, and its damage cracking is a comprehensive problem involving mechanics and materials science. When concrete is loaded, it can no longer be regarded as a homogeneous and continuous material. The strength calculated by the traditional strength-design method will be higher than the actual strength of the material with cracks, so the traditional strength-design method is no longer applicable. Fracture mechanics theory takes into account the existence of macro cracks in the structure, and the mechanical properties of the material are investigated separately in the local area near the macro cracks, while the structure is still regarded as an isotropic homogeneous continuum in the infinite distance away from the tip of the cracks [28].
In the finite element software ABAQUS, simulation of concrete cracks carried out methods are element failure, XFEM, based on cohesive behavior. Among them, element failure is greatly affected by the grid size, and XFEM can only be used for the ABAQUS explicit analysis module.
The more common type of cracking in concrete structures is type I cracking, while a mixture of type II and III cracks exists. In this manuscript, only the type I cracking of concrete is considered, and the crack mouth opening displacement (CMOD) equivalent is used to replace the output crack width wz required for the test [29].

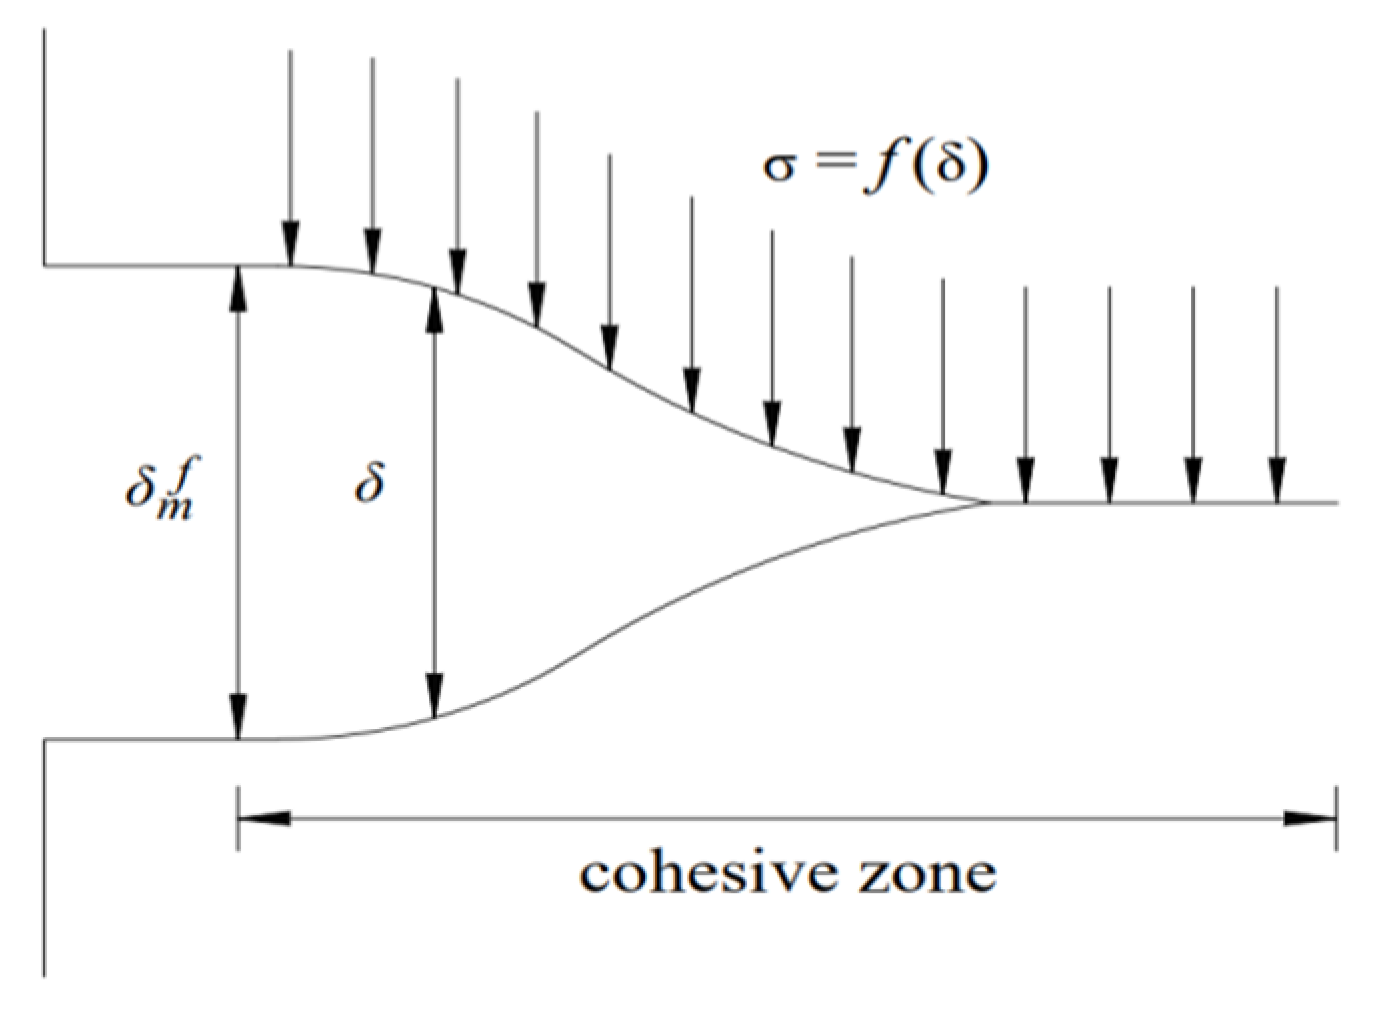
4.2. Cohesive Zone Model (CZM)

4.2.1. Fundamentals

The cohesive zone model theory considers the crack as two parts. One part is a complete separation of the two free surfaces. The other part of the crack tip at the microscopic level of cohesion, resulting in the material cracking, is not immediately after the complete disconnection. This part is the cohesive zone (cohesive zone), as shown in Figure 4 [30].
In the cohesive zone, there exists a crack opening displacement δ less than the critical value δ m f , and the cohesive force σ acting on the crack surface is defined as a function of the crack opening displacement δ, which is called the relationship between σ and δ and is referred to as the Traction Separate Law [31].
When the cohesive zone starts to carry, the cohesive force σ first increases gradually with the crack opening mouth displacement δ. When the crack opening mouth displacement reaches δ m 0 , the material begins to show damage. Subsequently, the cohesion starts to decrease to zero with the increase in crack opening displacement, and the fracture energy reaches the critical fracture energy G C (the area included in the σ-δ curve, i.e., G C = σ d δ = f δ d δ ), which is required for material damage. At this point, the cohesive unit is completely disconnected and moves forward, and the structure sprouts a crack [31].
The basic idea of the cohesive zone model is to describe the bond-slip phenomenon between units by embedding a kind of cohesive unit without thickness between adjacent solid units. In this manuscript, a 3D cohesive element, COH3D8, is applied for better compatibility with hexahedral units, as shown in Figure 5, where, numbers 1–8 are node numbers.
According to the damage pattern of typical test columns in the test, it is believed that there are fracture surfaces between the drill holes and from the drill holes to the edge of the columns, and cohesive elements are inserted out of the modeled fracture surfaces through the ABAQUS software, which is shown in Figure 6.

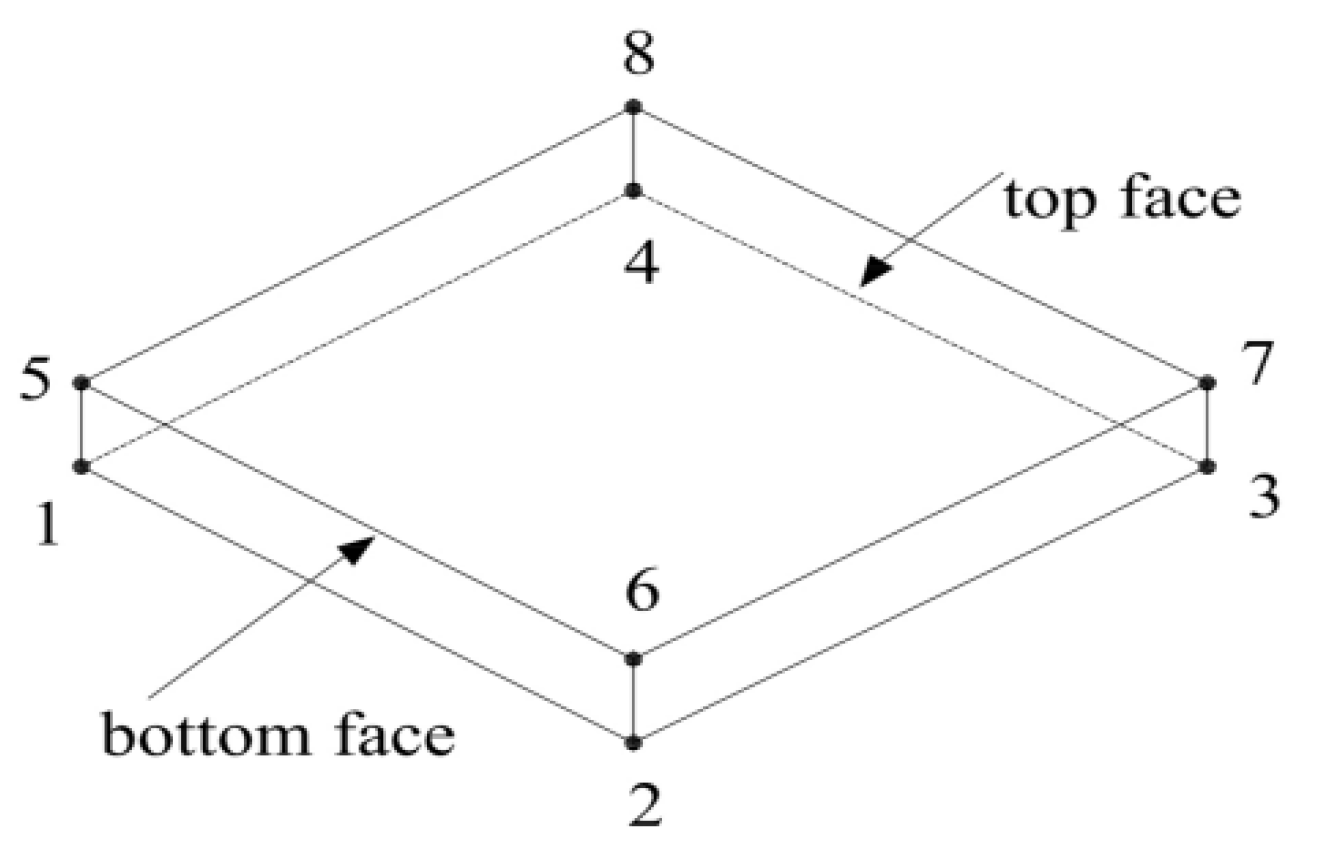
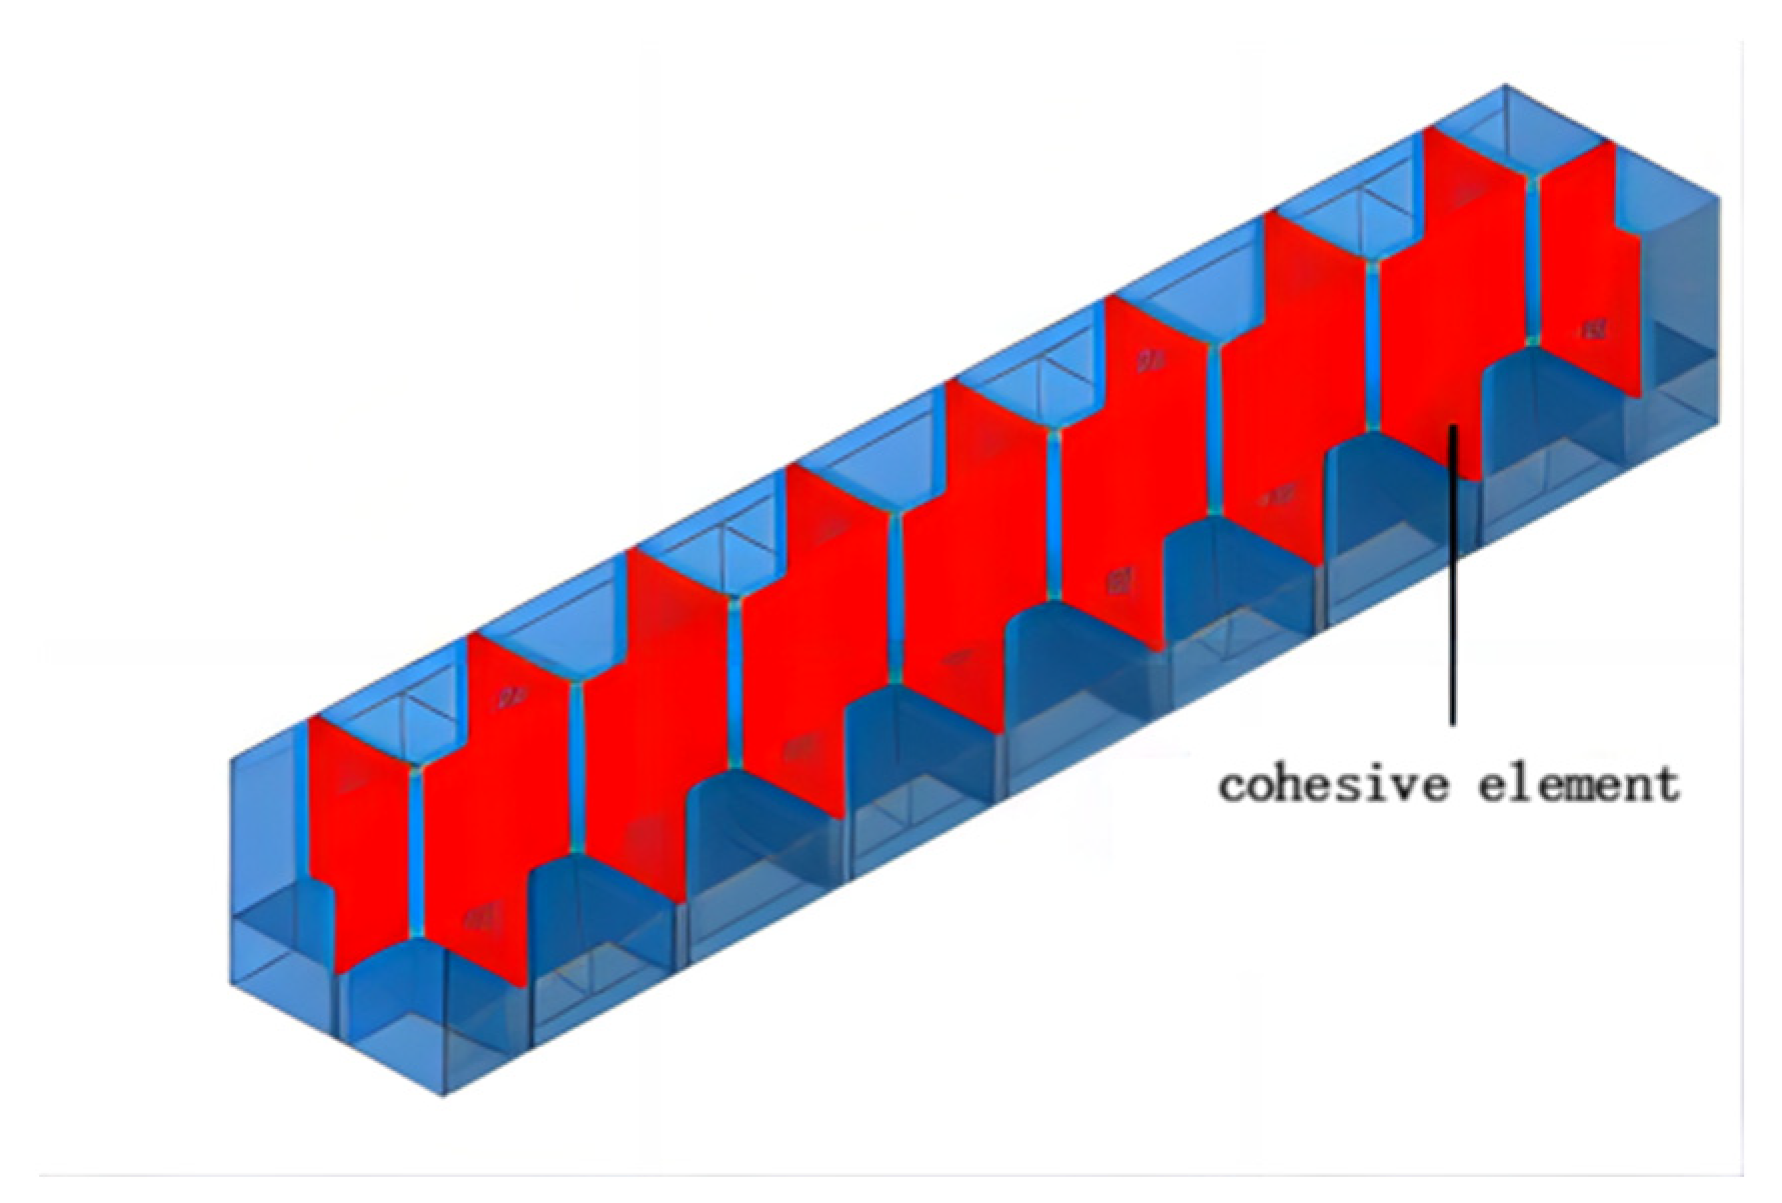
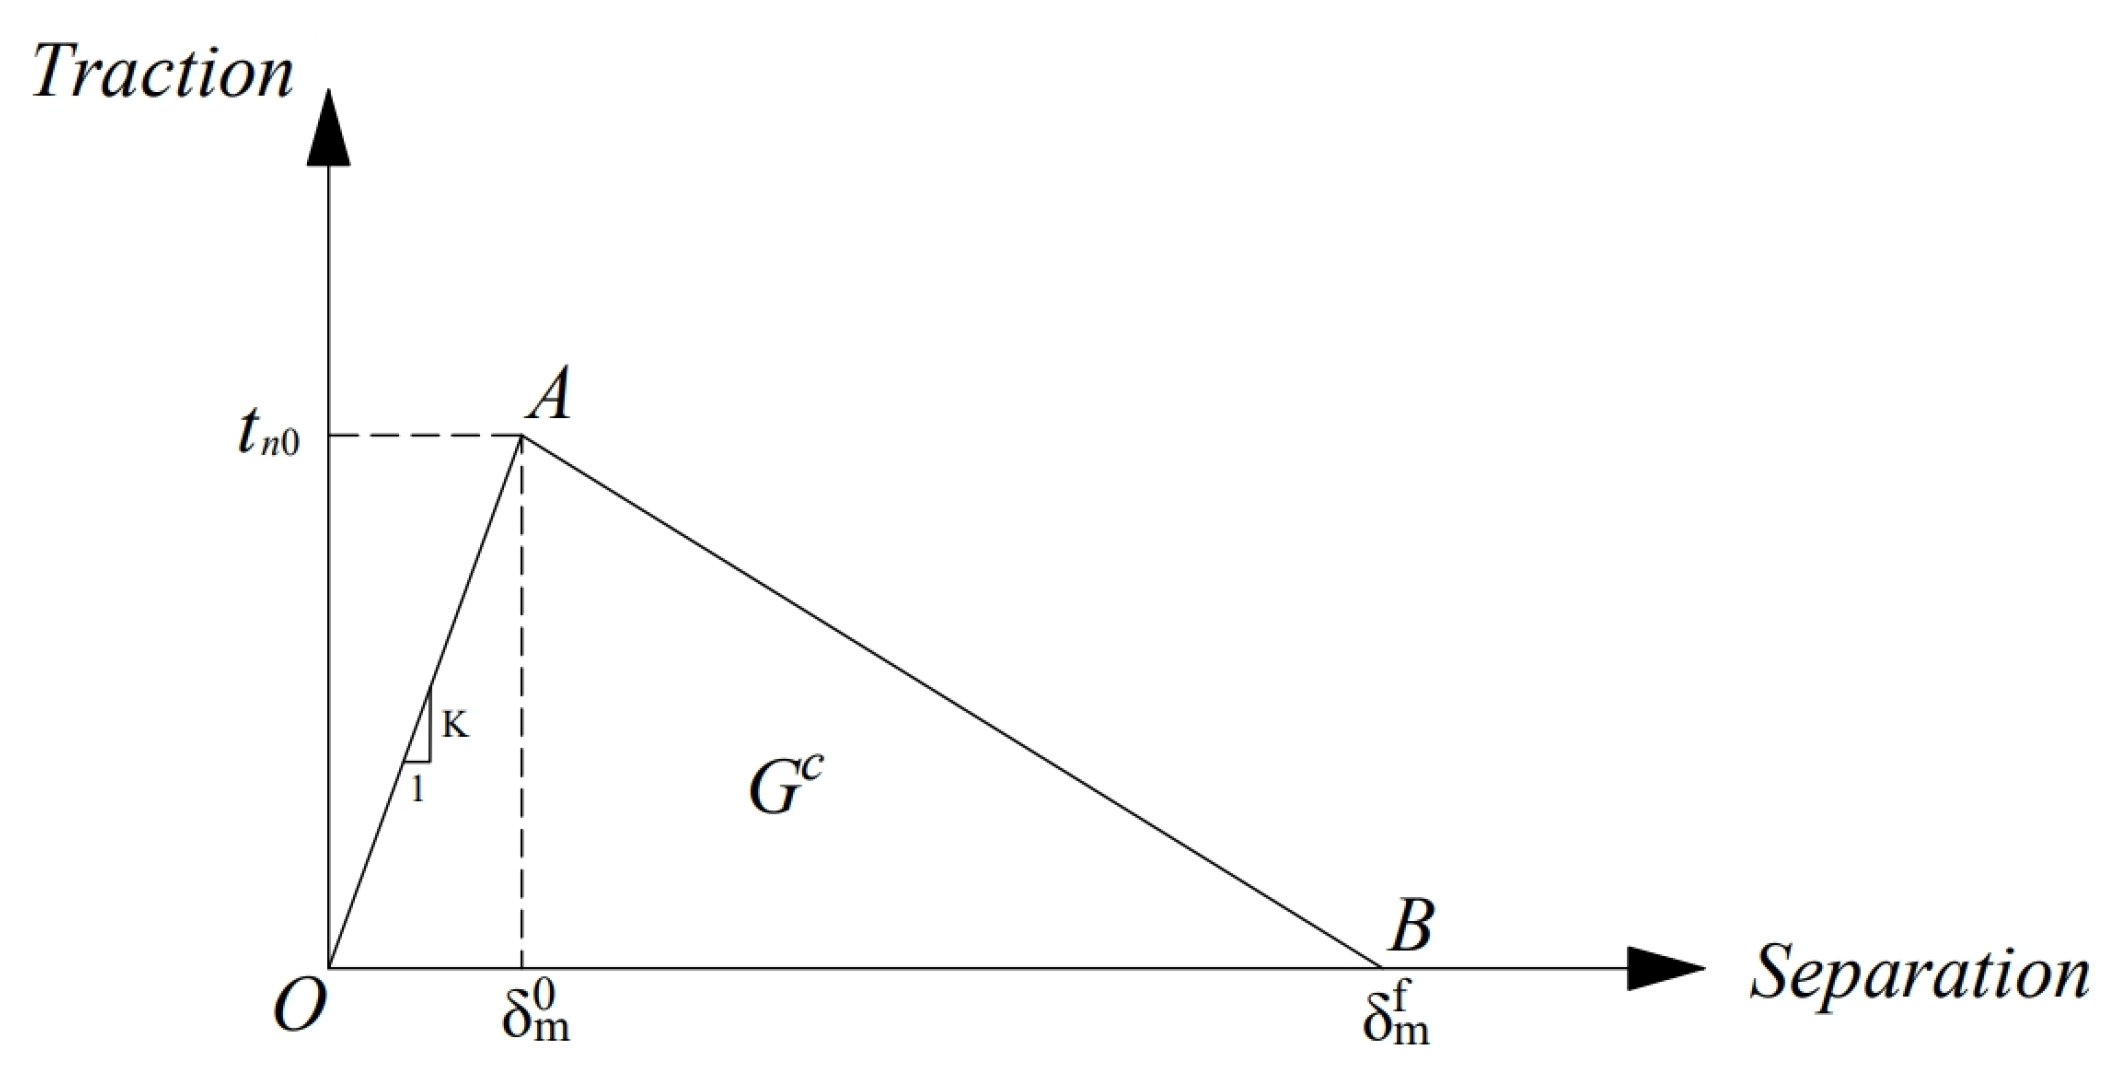
4.2.2. Cohesive Element Principal Relationship

The principal relationship of a cohesive element is mainly defined by three stages: traction-separation, damage initiation, and damage evolution, while the failure mechanism of a cohesive element at a fracture consists of three parts: damage initiation criterion, damage evolution law, and unit removal. When the stress or strain state of a cohesive element meets the damage initiation criterion, it enters the damage evolution stage and reaches the damage criterion for removal [32,33].
Given that only type I cracks are considered in this manuscript, and the acting force is normal tensile stress, the selected cohesive element has the intrinsic response under pure tensile stress shown in Figure 7 [34]. In Figure 7, K is the normal stiffness, t n o is the damage onset stress, δ m 0 is the damage onset displacement, δ m f is the damage failure displacement, and Gc is the normal fracture energy.
The traction-separation of the cohesive element corresponds to the OA section in Figure 7, and the cohesive element shows the linear-elastic ontological relationship in this stage. This manuscript chose the Maximum Nominal Stress Criterion (MAXS) as the damage initiation criterion; the damage evolution stage corresponds to the AB section in Figure 7, and the cohesive element enters into the damage evolution stage when the stress state of the cohesive element satisfies the Maximum Nominal Stress Criterion and adopts Equation (9) in ABAQUS [34].
There are two ways to define the damage evolution: one is based on the effective displacement damage evolution and the other is based on the energy damage evolution. This manuscript chose the energy damage evolution and used the linear form [34].
M A X t n t n o 1
where t n is the tensile stress applied to the unit in the normal direction; t n o is the maximum stress that the unit can withstand, called bond strength;   is Macaulay brackets, defined as follows:
t n = { t n , t n 0 0 , t n < 0
The source of the parameters related to the cohesive model to be entered in ABAQUS is the experimental study [15], and the specific values are shown in Table 2.

5. Comparative Analysis of Finite Element Simulation and Test Results

In order to verify the accuracy of the finite element model analysis results in this manuscript, an experimental study on the fracture of concrete columns using HVPD in liquid was simulated.

5.1. Introduction to the Experimental Study

This manuscript followed up with a theoretical numerical approach to the previous experimental research and testing of concrete columns under HVPD loading, as described in [15]. The section dimensions of the column were 400 mm × 400 mm and 500 mm × 500 mm, respectively, and the thickness of the concrete protective layer was 10 mm. A single row of boreholes equidistant along the longitudinal side of the column was arranged. As an example, for a 400 mm × 400 mm column, the layout of the holes and the numbering of the holes are shown in Figure 8 [15]. The physical and mechanical properties of the concrete and reinforcement are shown in Table 3. Among them, the longitudinal reinforcement of the test column adopts a hot-rolled ribbed steel bar with a yield strength characteristic value of 335 MPa (HRB335), and the frame reinforcement and hoop reinforcement adopted a hot-rolled plain bar with a yield strength characteristic value of 300 MPa (HPB300).
In this manuscript, Z-1, Z-4, Z-7, Z-10, Z-13, and Z-16 test columns were selected for comparative analysis, and the specific specimen parameters and discharge parameters are shown in Table 4 and Table 5. Where the discharge voltage is 100 kV and the number of copper wires discharged is 60, the electrical energy released is 100 kJ.

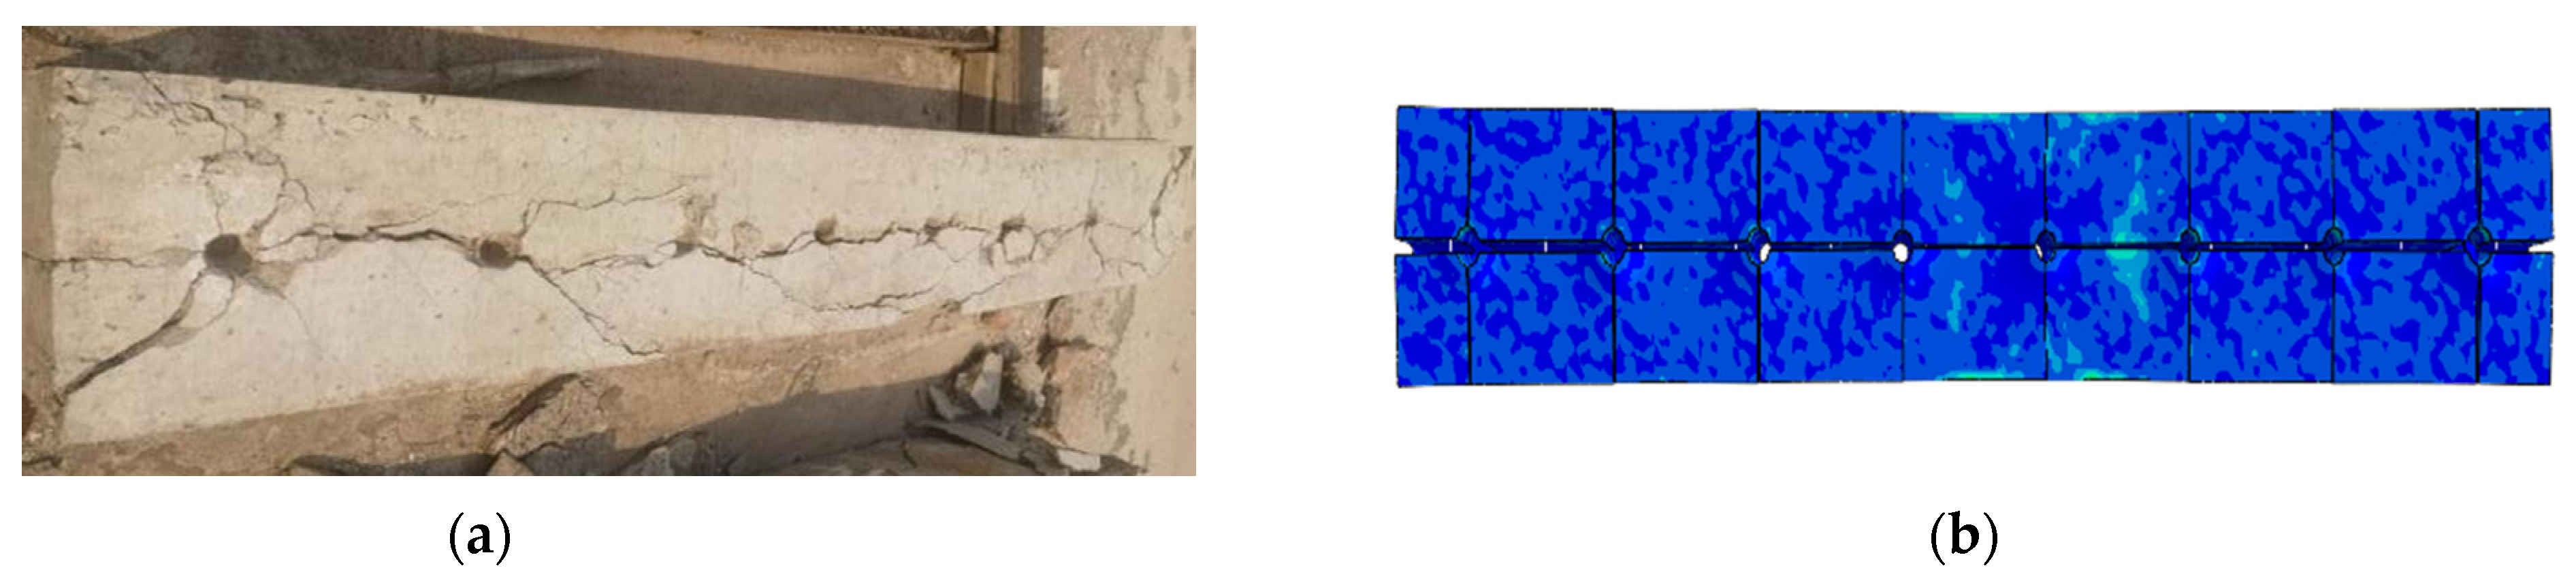
5.2. Comparison of Damage Patterns

Taking column Z-4 as an example, Figure 9 shows the comparison of the damage patterns obtained from the test and simulation. As can be seen from the figure, the simulated specimen columns all formed type I cracks at the fracture surface. A longitudinal through-crack was formed along the upper surface of the column and passed through the drill hole. The transverse crack developed from the borehole with a small width. The above phenomenon is basically consistent with the test.

5.3. Comparative Analysis of the Effect of Concrete Strength on the Crack Width of Concrete Columns with a Single Row of Holes

Figure 10 shows a comparison between the numerical simulation results of crack widths of concrete columns caused by HVPD and the measured data under different concrete grade strengths. It can be seen that the simulation fits well with the test results, and most of the data errors are within 10%. Meanwhile, from Figure 10, it can be seen that the crack width wz of concrete columns has a small decrease with the increase in concrete strength. In the case of a scheme with a discharge voltage of 100 kV and 60 copper wires, for example, when the concrete strength class is raised from C20 to C40, the average crack width decreases by only 17%. Because of this, it can be concluded that concrete tensile strength has limited effect on crack development. The above law coincides with the law of the test results. In summary, the finite element model established in this manuscript can excellently describe the fracture effects of concrete columns using HVPD in liquid.

6. Results and Discussion

The experimental study of the fracture of concrete columns using HVPD in liquid consumes a large amount of material and energy, so it was necessary for parametric study to use the finite element analysis method. In order to comprehensively understand the influencing factors of the effect of the fracture of concrete using HVPD, this manuscript selected three parameters: one-side longitudinal reinforcement ratio of the column, volume hoop ratio of the column, and concrete grade strength. According to the analysis results of the above model, the mathematical formulas were established.

6.1. Program Design

In this manuscript, 48 concrete columns with single row of holes were designed. The thickness of the protective layer of the concrete column was 20 mm, the diameter of the drilling holes was selected as 40 mm, the surface of the member was drilled at intervals of 300 mm, and the depth of the drilling holes was 0.85 times the height of the column cross-section. The grade of the concrete was selected as C30 (concrete with a standard value of cubic compressive strength of 30 N/mm2), C40, and C50. Taking C30 as an example, Table 6 shows the specific reinforcement parameters.
According to the Design Code for Concrete Structures, the column volume hoop ratio ρsv can be calculated using the following formula:
ρ s v = n 1 A s 1 l 1 + n 2 A s 2 l 2 A c o r s
where: A c o r —Concrete core area within the hoops. A c o r = l 1 · l 2 ; n 1 , A s 1 , l1—Number of hoop limbs on the long side of the cross-section, cross-sectional area of a single hoop on the long side of the cross-section, and width of the hoop on the long side of the cross-section. n 2 , A s 2 , l2—Number of hoop limbs on the short side of the cross-section, cross-sectional area of a single hoop on the short side of the cross-section, and width of the hoop on the short side of the cross-section. s —The spacing of the hoops.
The number of copper wires and the discharge voltage in the HVPD scheme were chosen to be 60 wires and 100 kV in order to achieve the most optimal crushing effect.

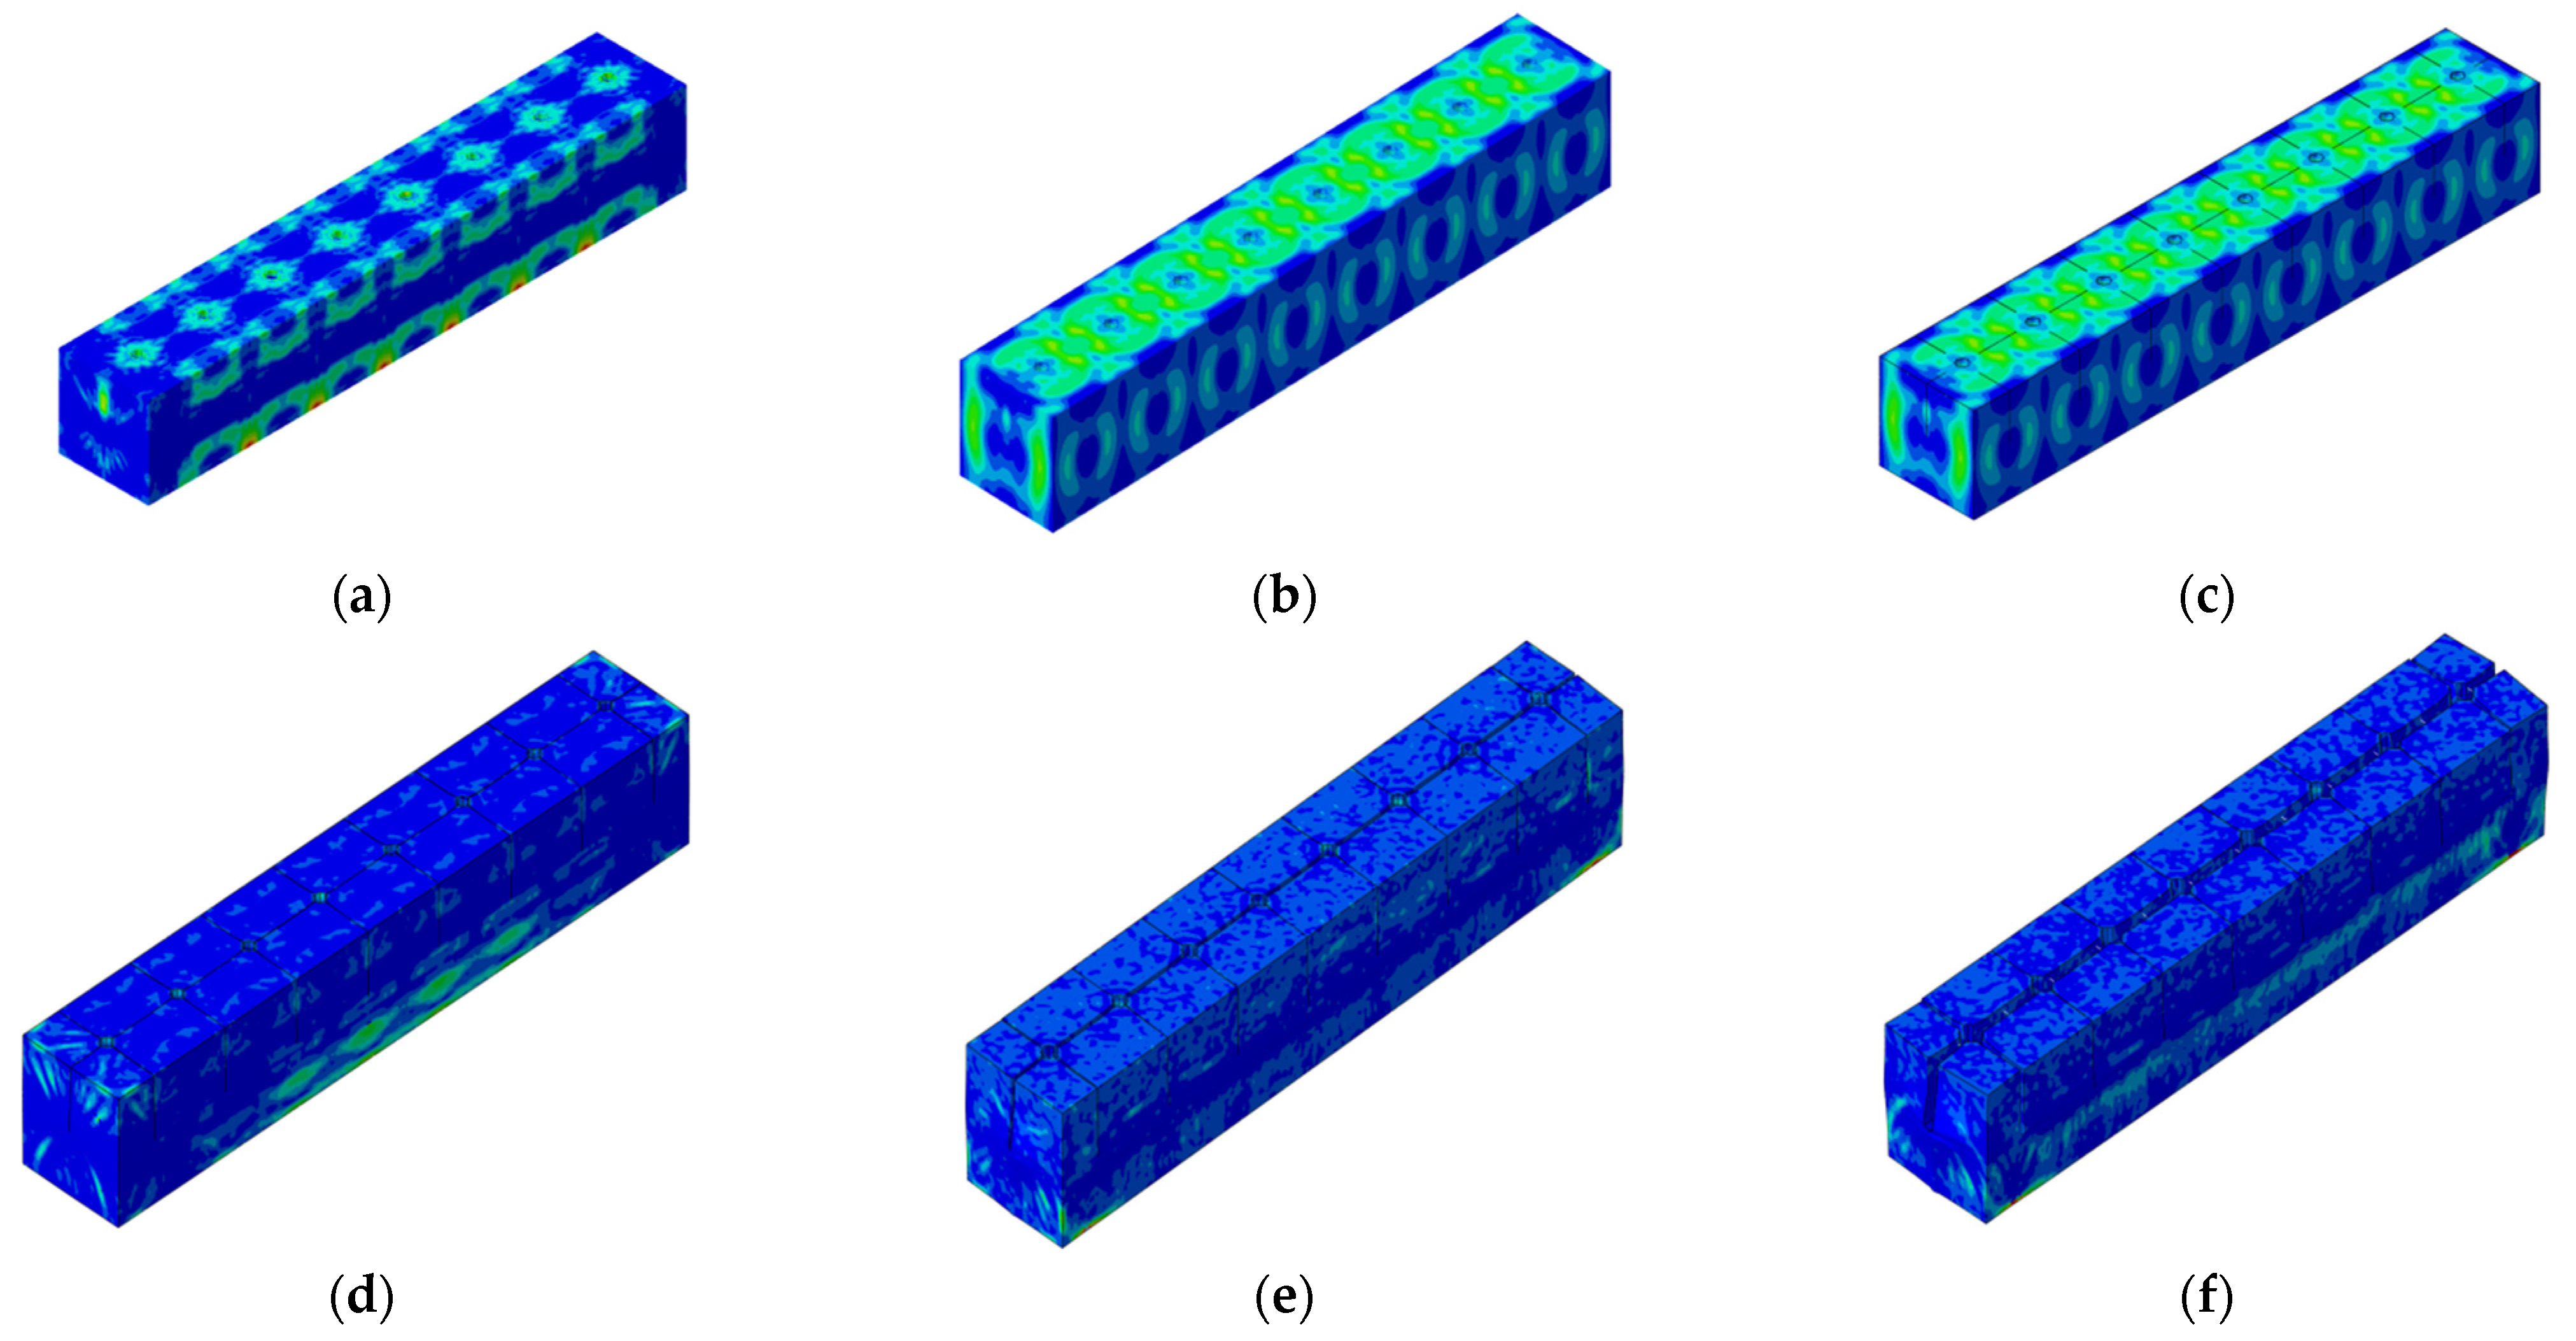
6.2. Analysis of the Whole Process of Reinforcement Concrete Column with a Single Row of Holes Force

Taking column C-3 as an example, the simulation results of the whole stress process of the concrete column subjected to HVPD crushing-impact load are shown in Figure 11. As can be seen from Figure 11a, at the initial stage (0–60 µs) when the concrete column was subjected to HVPD crushing-impact loading, small stress waves were formed around the boreholes, and at this time, no cracks were formed on the upper surface of the column. As the stress waves extended outward from the borehole, the stress waves gradually intersected and cracks began to extend from the borehole, as shown in Figure 11b (t = 80 µs). The stress wave further extends and intersects between two neighboring holes, the tensile stress gradually becomes larger and reaches the tensile strength, and surface cracks begin to form, but the longitudinal cracks are not yet connected, as shown in Figure 11c (t = 90 µs). As shown in Figure 11d, the tensile stress further increases when t = 100 µs. The longitudinal cracks start to connect, and the transverse cracks reach the edges accordingly, but the width is small. As shown in Figure 11e (t = 120 µs), the width of the cracks is getting bigger, but it has not yet reached the requirement of crushing. With the continuous release of energy, the whole girder section is cut into several pieces, and the longitudinal cracks are connected and reach the required width.

6.3. Effect of Different Parameters on Crack Width of Reinforcement Concrete Columns with a Single Row of Holes

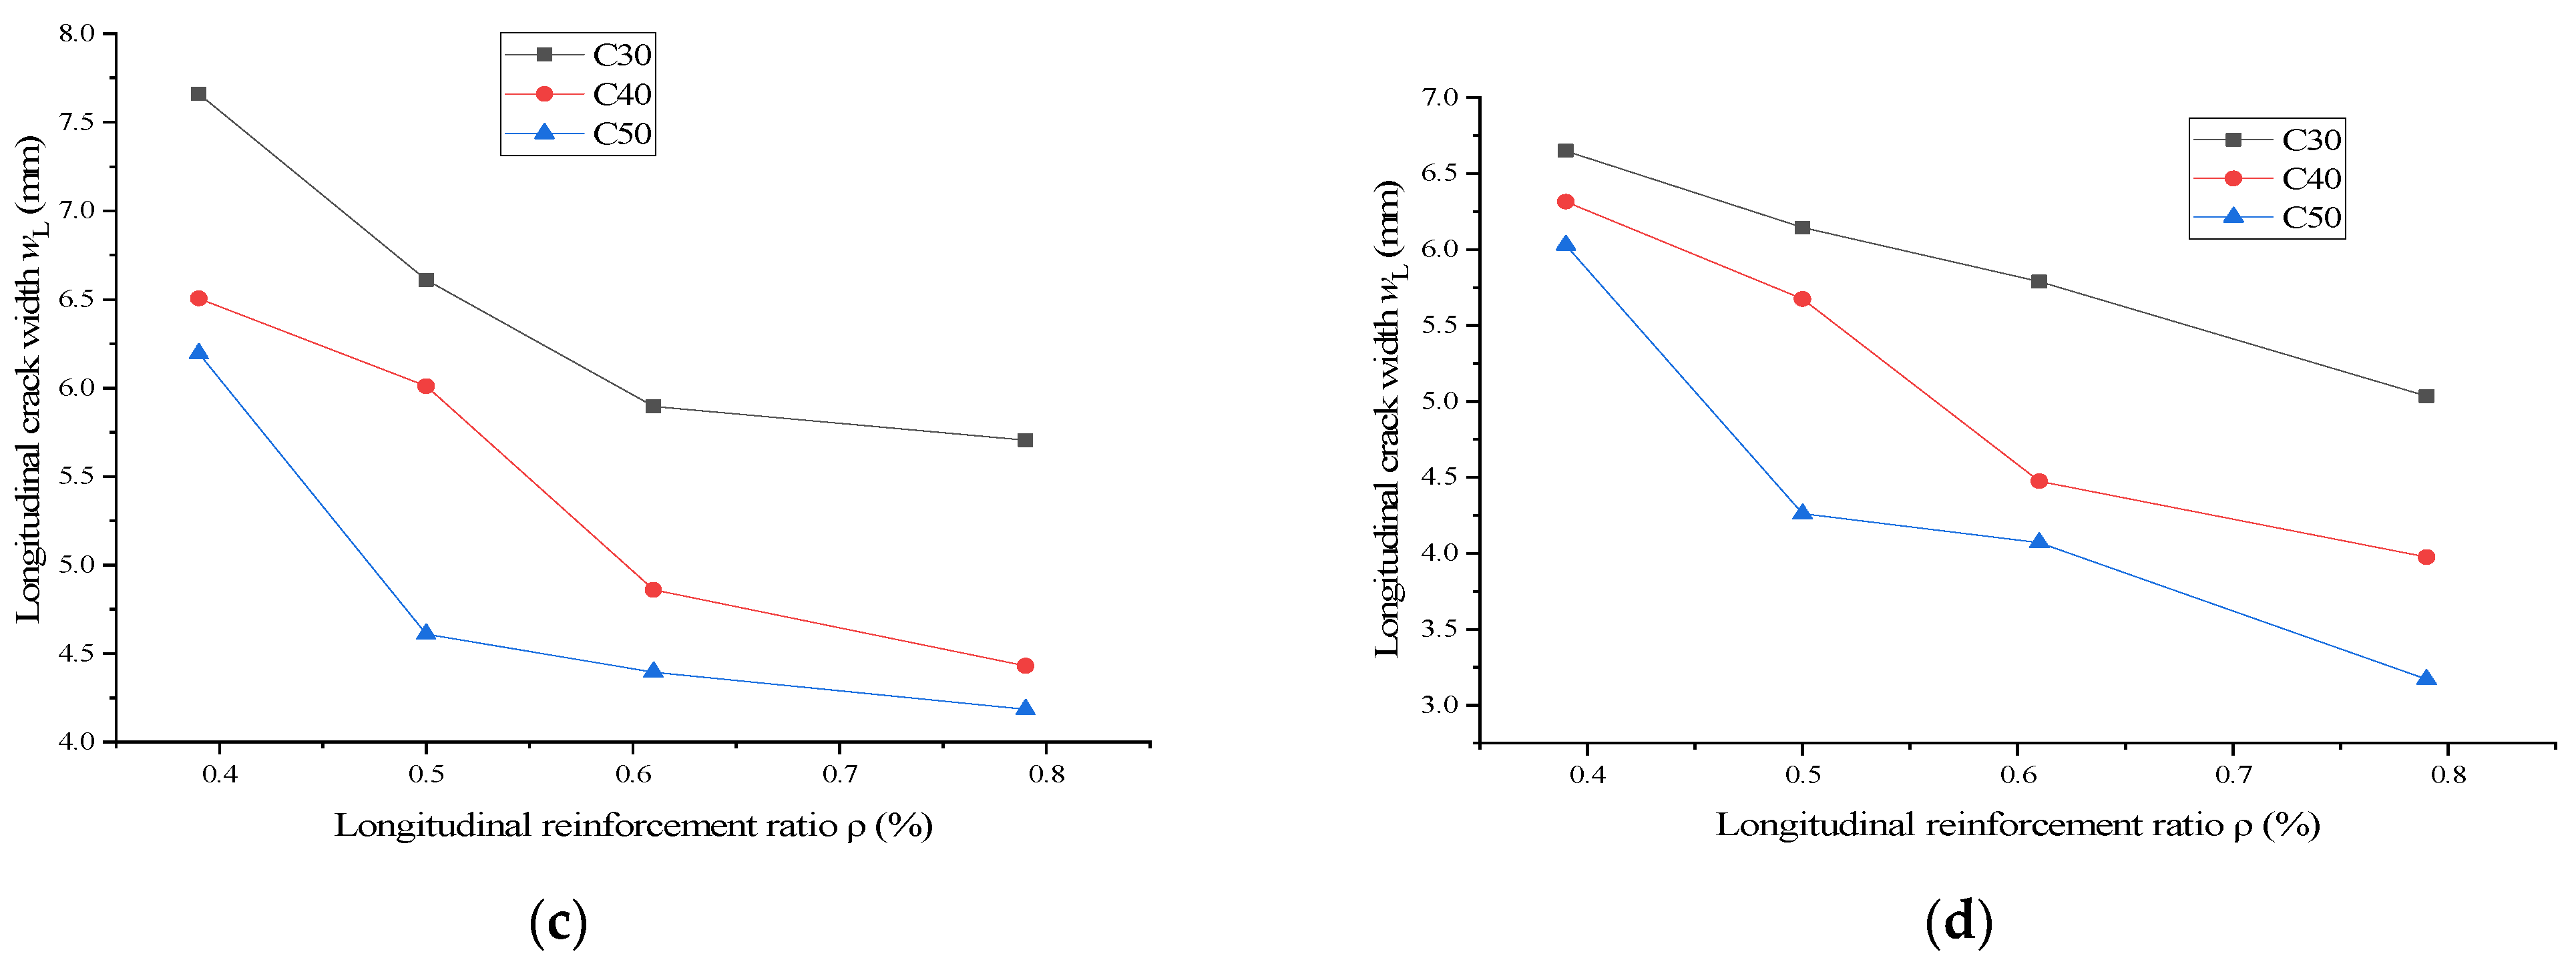
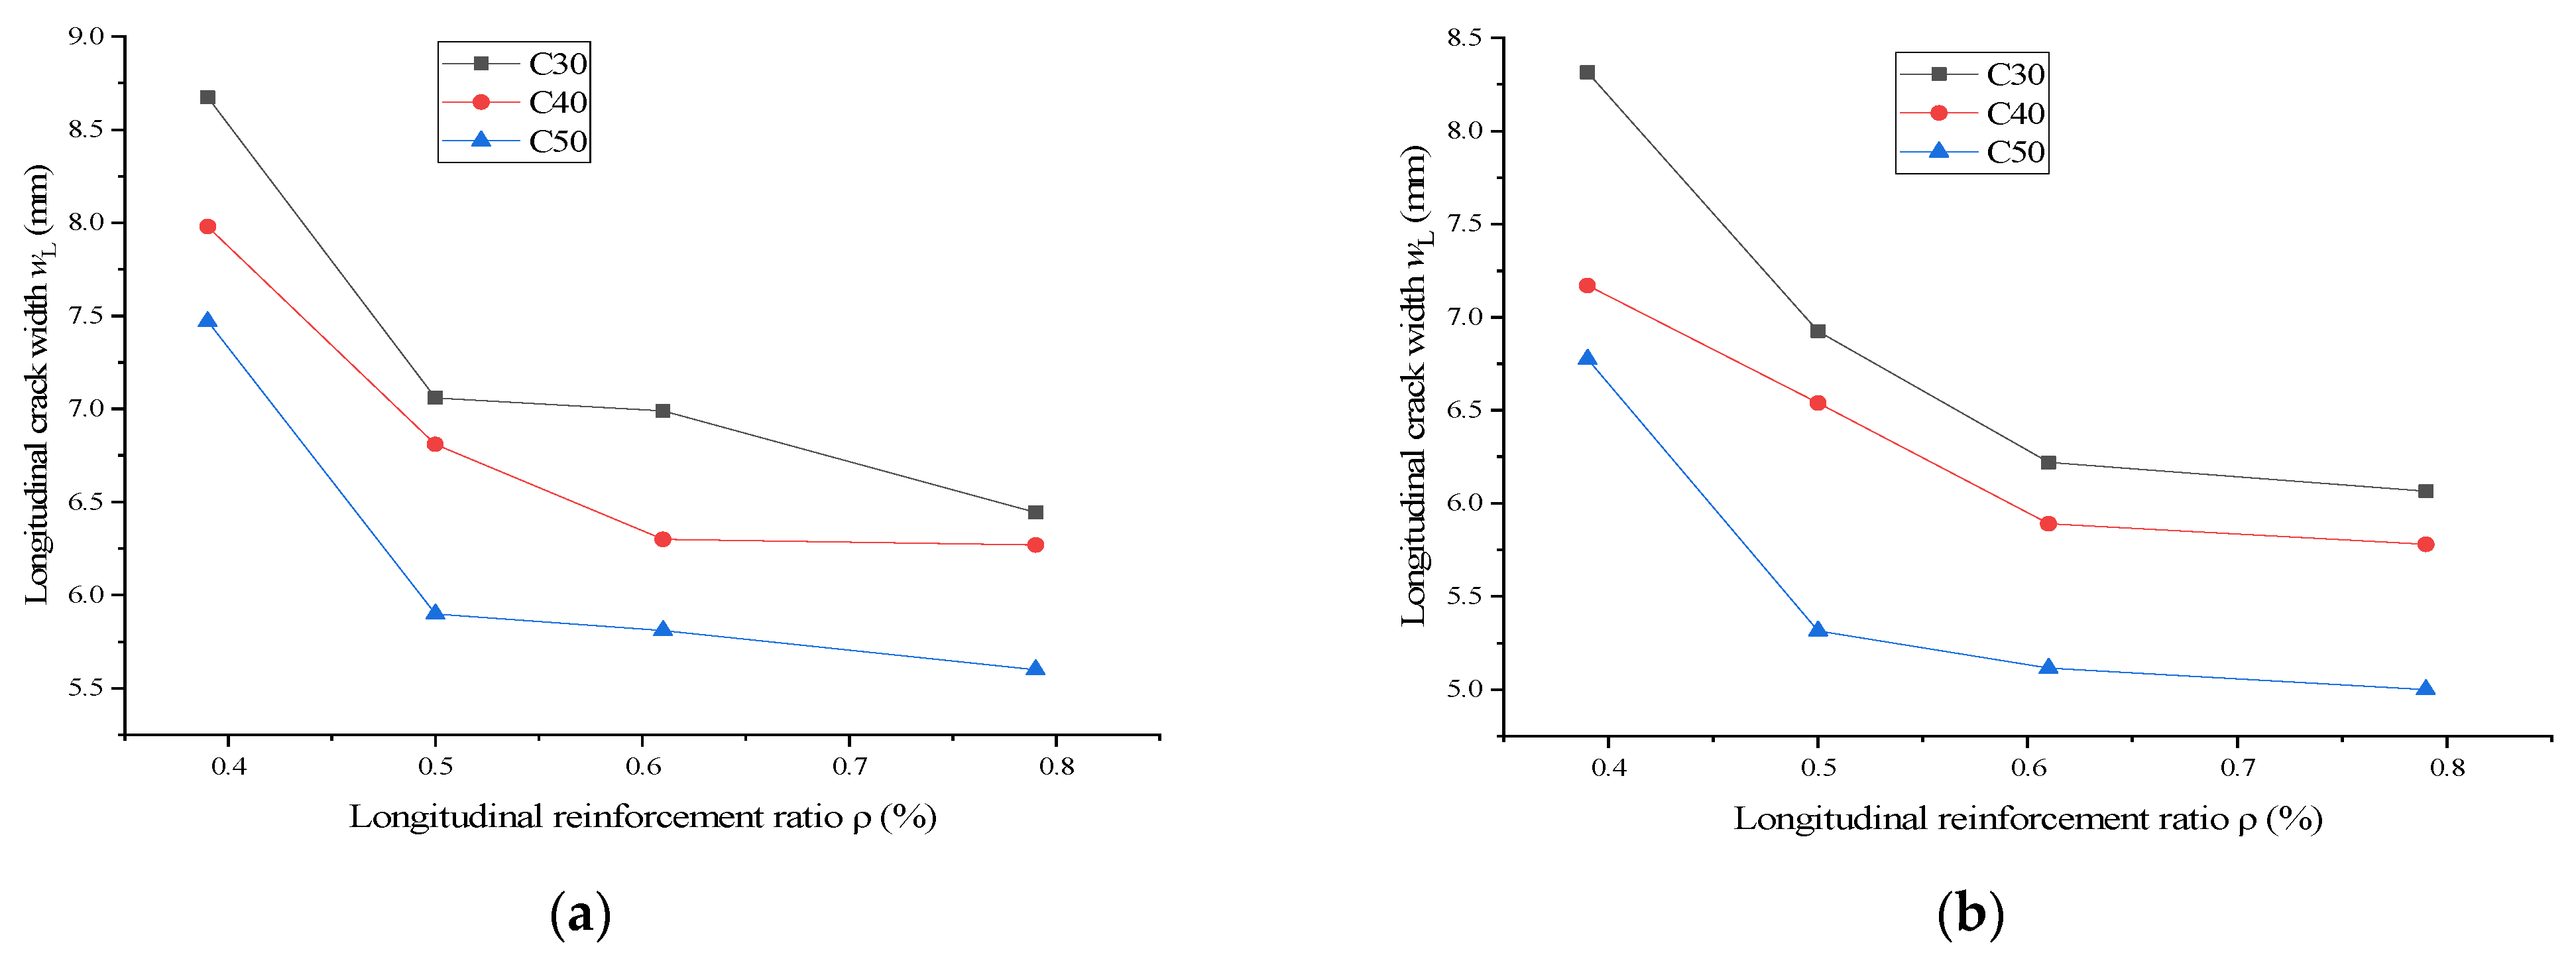
6.3.1. Effect of One-Side Longitudinal Reinforcement Ratio of the Column

Figure 12 shows the relationship curve between the average transverse crack width wT (transverse crack width) near each hole and one-side longitudinal reinforcement ratio ρ under four fixed-volume hoop ratios. As can be seen from Figure 12, in the case of the same concrete grade strengths and volume hoop ratios, the transverse crack width decreases substantially with the increase in the one-side longitudinal reinforcement ratio of the column, which indicates that the longitudinal reinforcement has a strong restraining ability for the transverse cracks during the HVPD process. In engineering applications, for the concrete column components with a high one-side longitudinal reinforcement ratio, it is necessary to increase the number of copper wires and the discharge voltage to ensure the crushing effect.
Figure 13 shows the relationship between the average longitudinal crack width wL (longitudinal crack width) near each hole and the one-side longitudinal reinforcement ratio of the column ρ under four fixed-volume hoop ratios. As can be seen from Figure 13, under the same concrete grade strength and volume hoop ratio, the longitudinal crack width decreases slightly with the increase in the one-side longitudinal reinforcement ratio. Especially in the case where the one-side longitudinal reinforcement ratio of the column is greater than 0.5%, the change of the longitudinal crack width is very small, which indicates that the one-side longitudinal reinforcement ratio of the column has less effect on the longitudinal crack width compared with on the transverse cracks. In the case of C30, increasing the one-side longitudinal reinforcement ratio from 0.5% to 0.80% results in a reduction of longitudinal crack width by 8%, 12%, 13%, and 18% under four different volumetric hoop ratios.

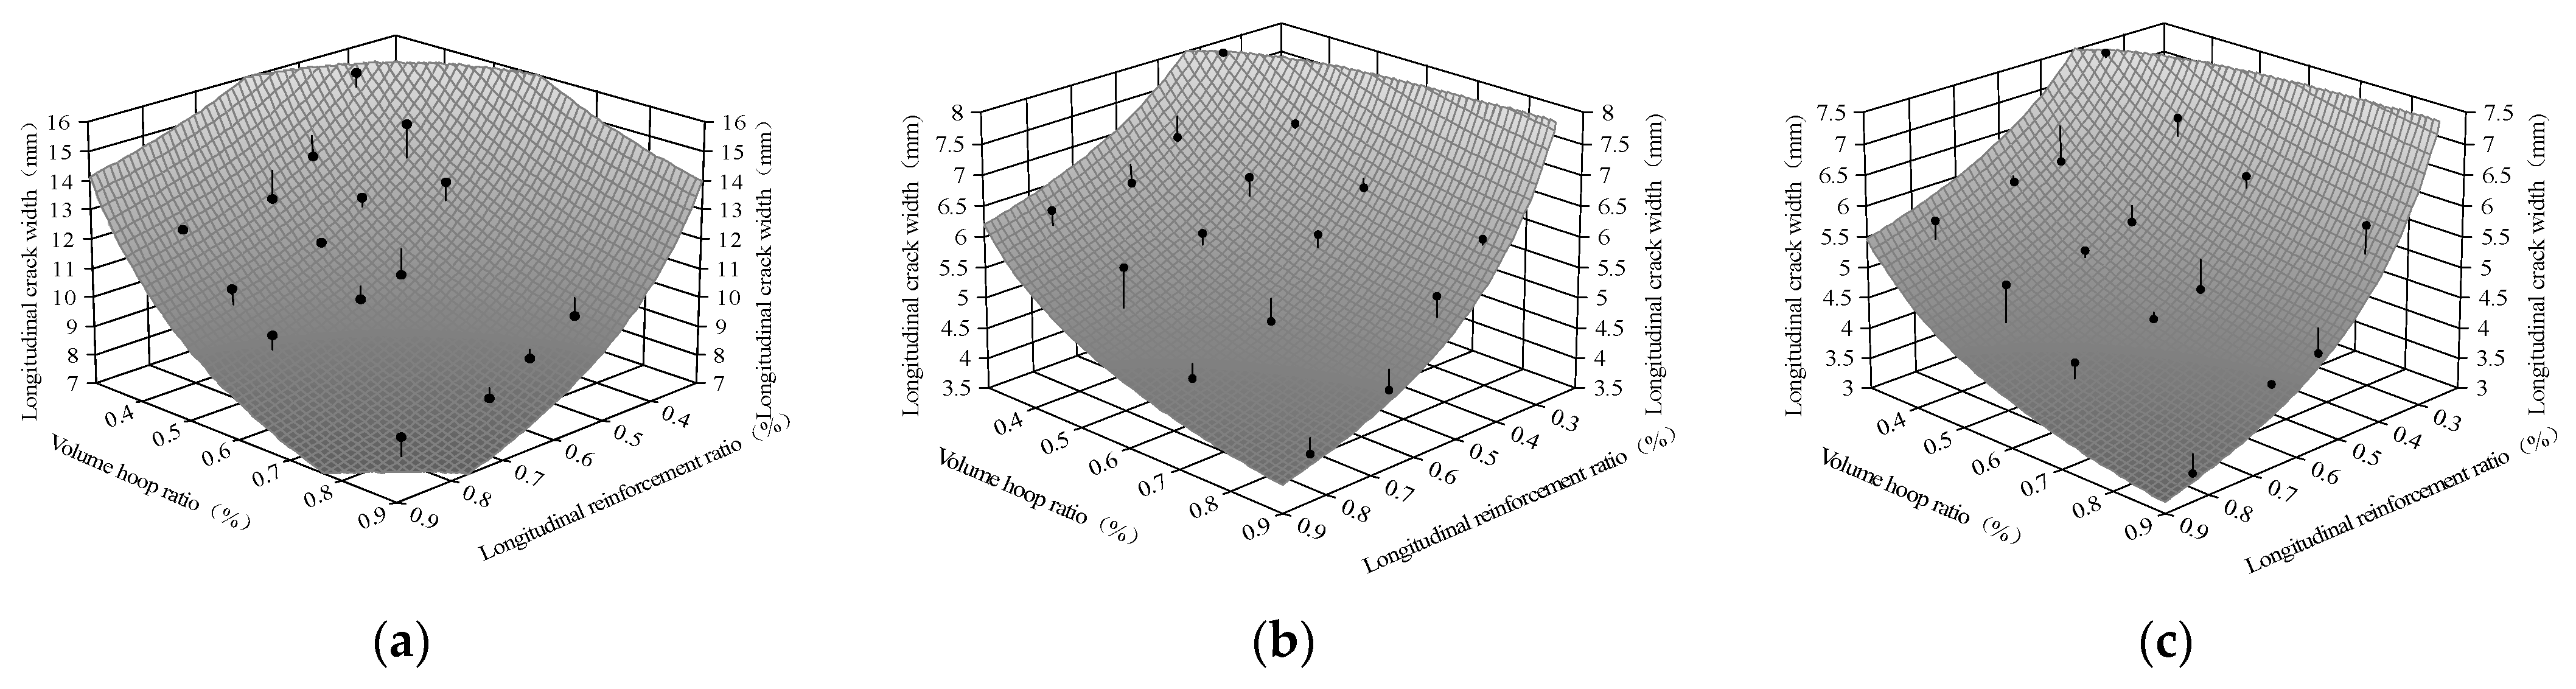
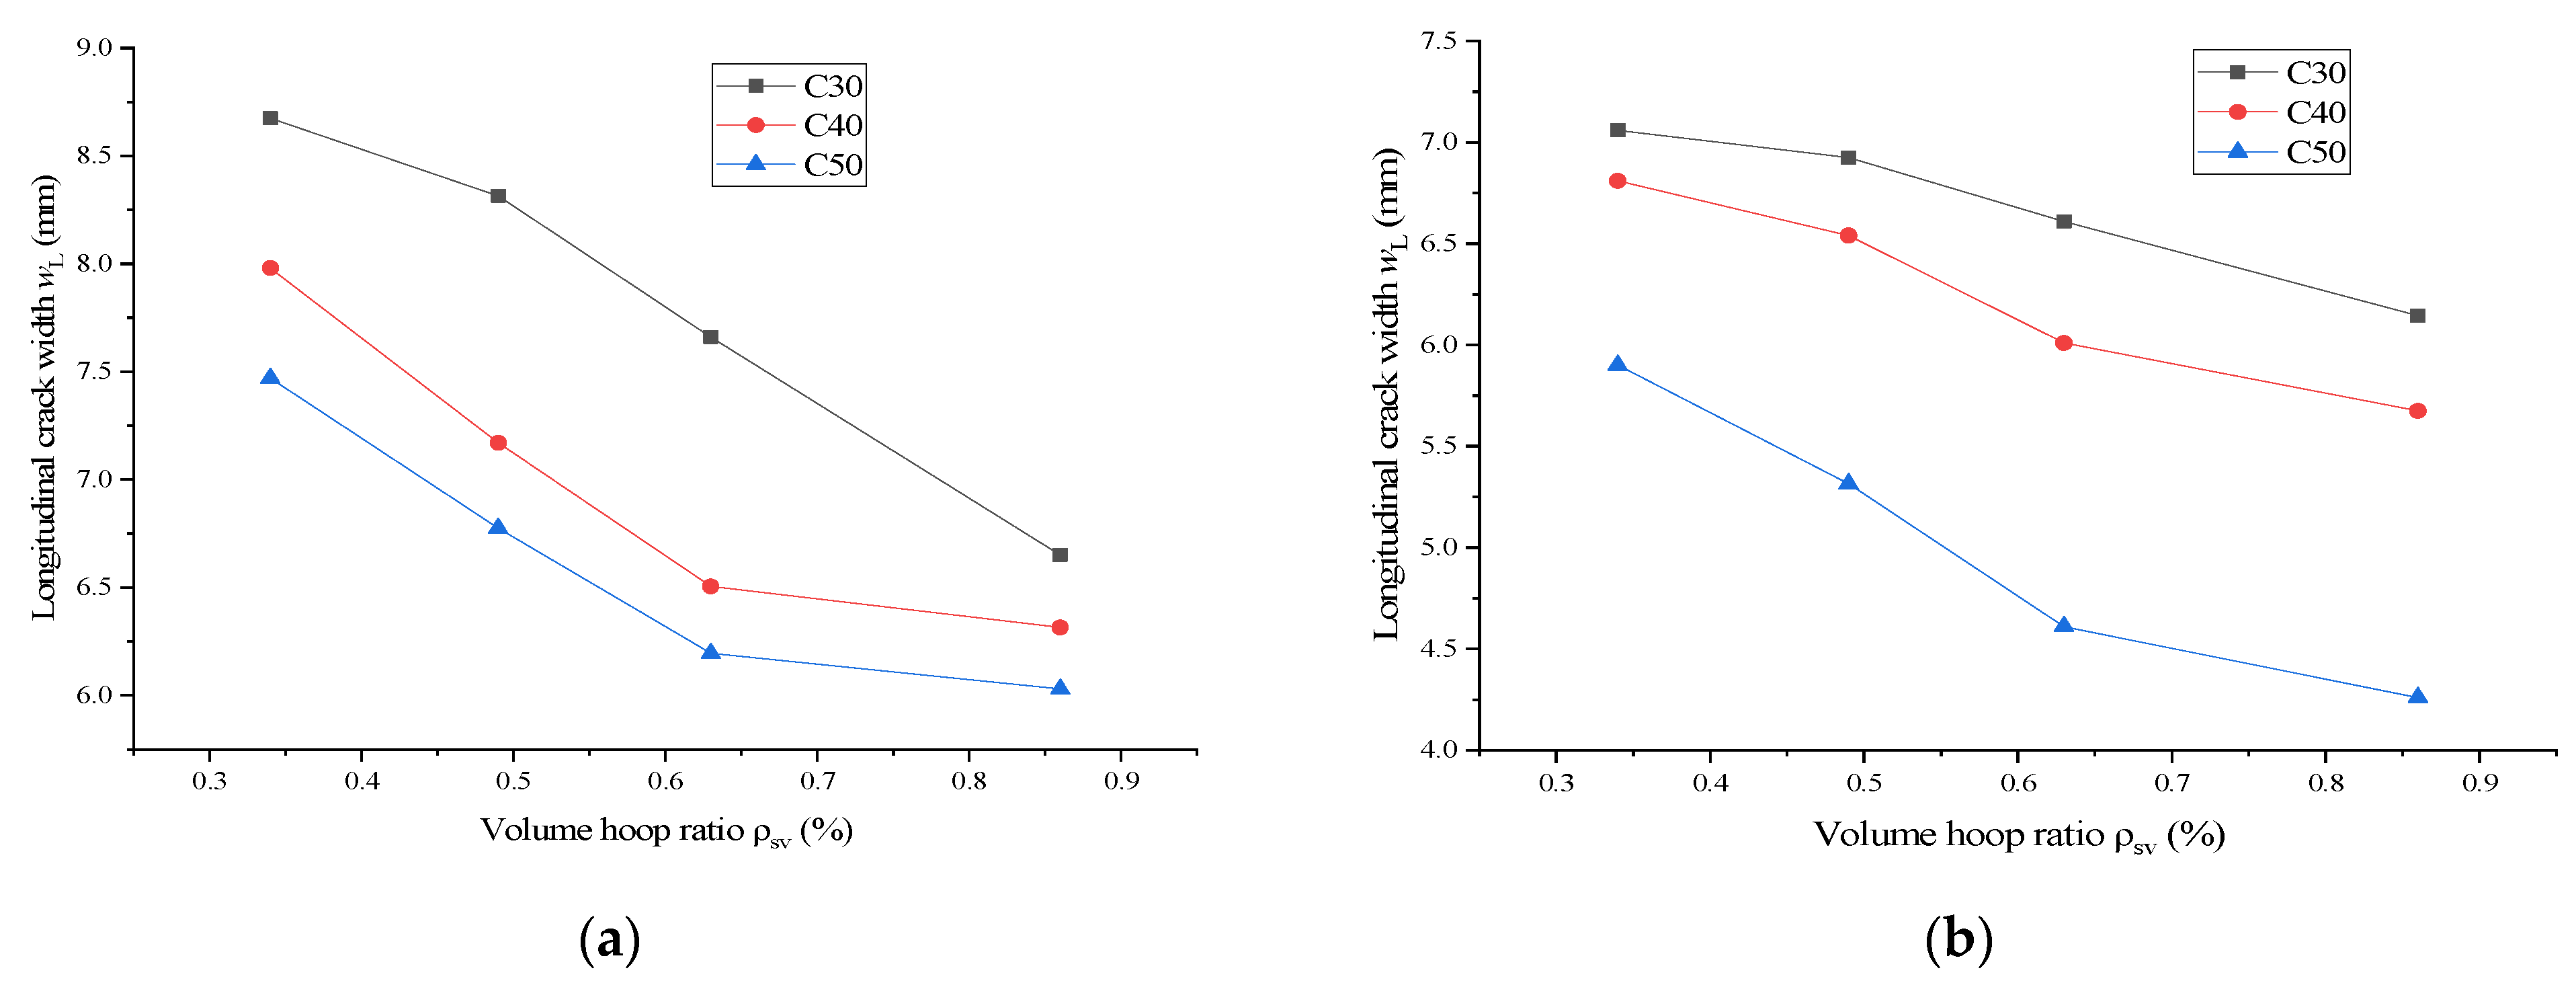
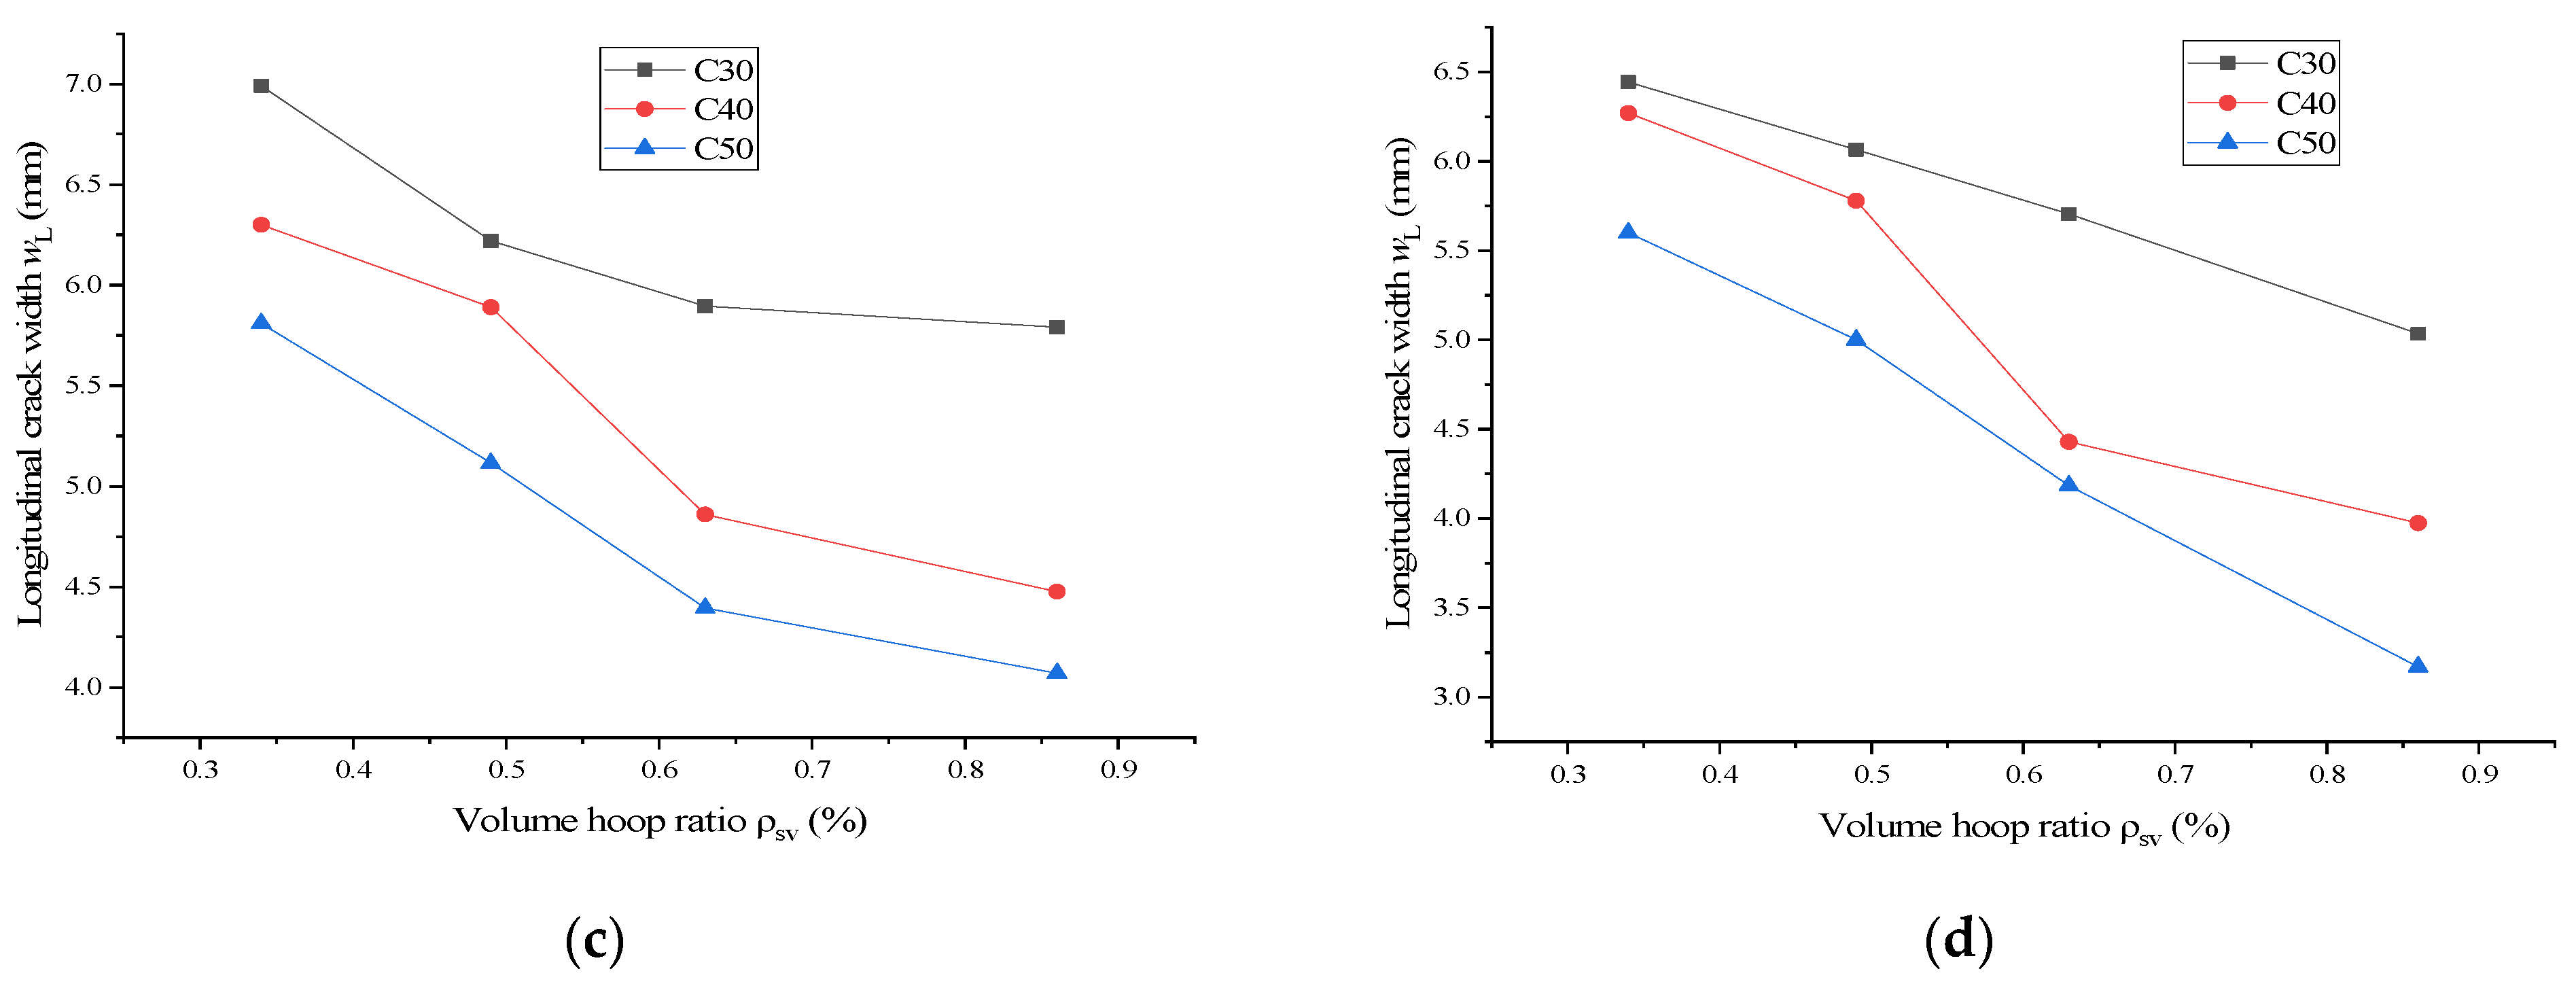
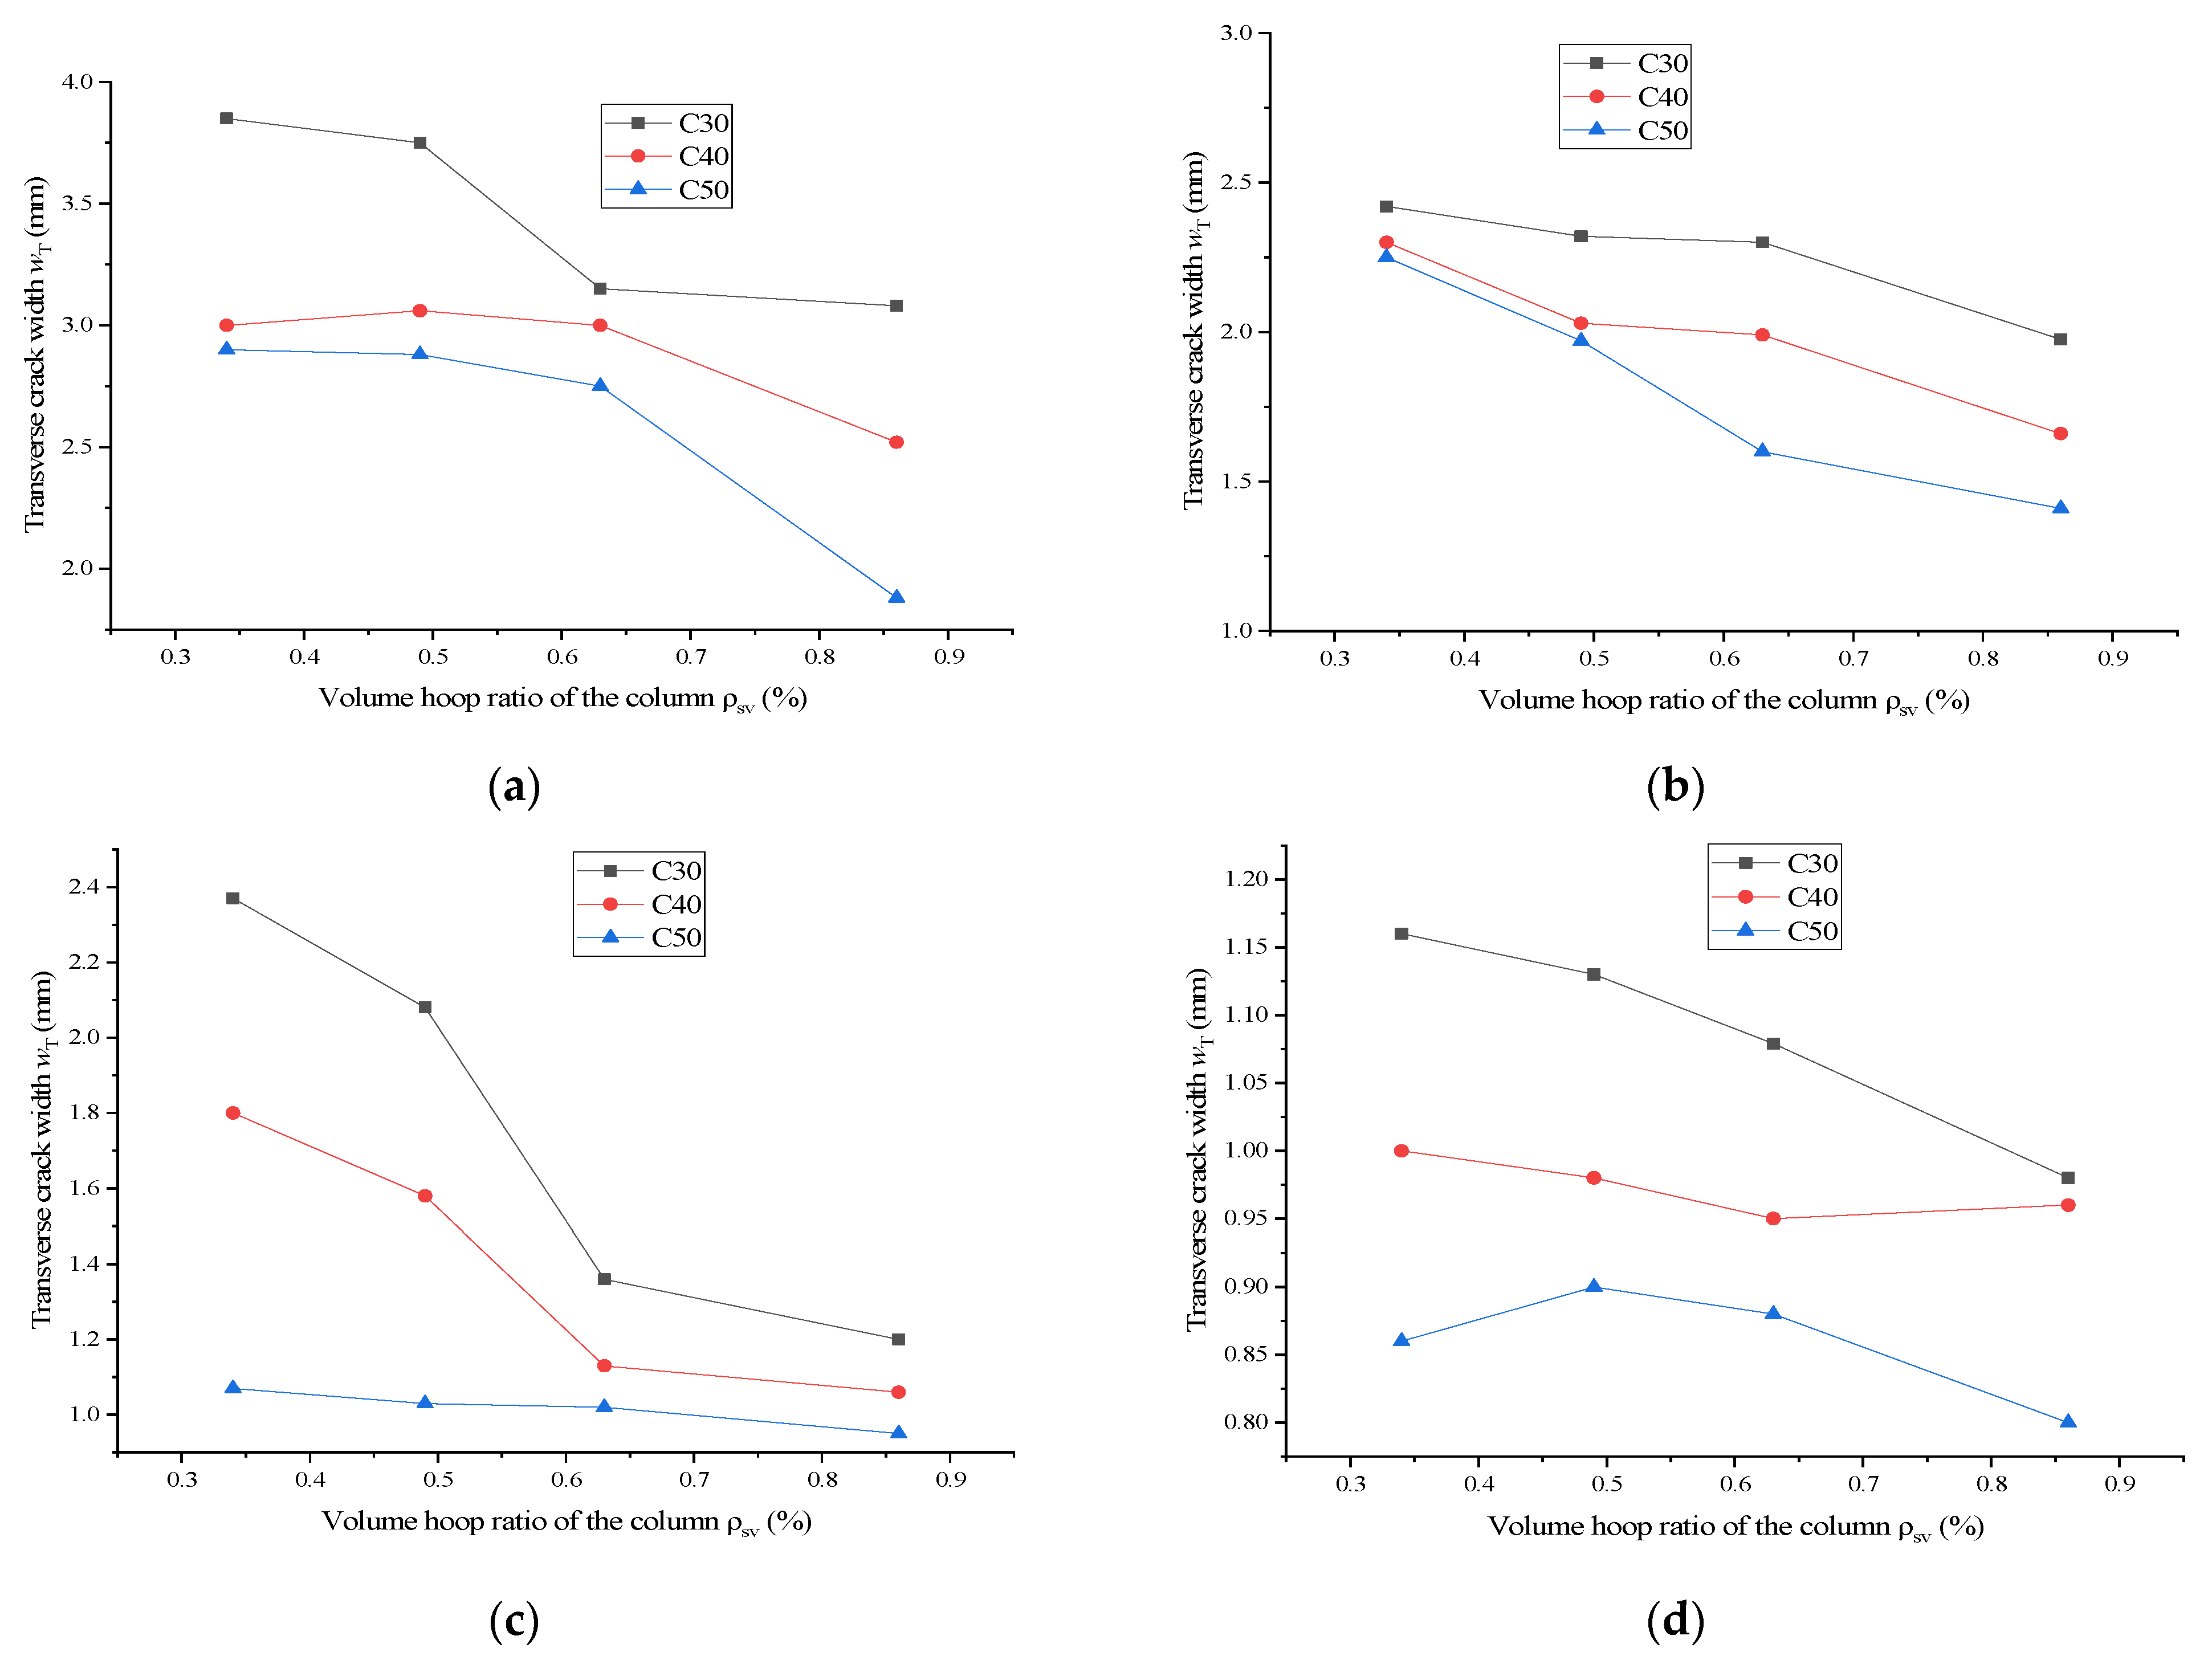
6.3.2. Effect of Volume Hoop Ratio

Figure 14 shows the relationship between the average longitudinal crack width wL (longitudinal crack width) near each hole and the volume and volume hoop ratio of the concrete columns ρsv under four fixed one-side longitudinal reinforcement ratios. As can be seen from Figure 14, in the case of the same concrete grade strength and one-side longitudinal reinforcement ratio, the longitudinal crack width decreases substantially with the increase in the volume hoop ratio of the column, which indicates that in the process of HVPD, the hoop reinforcement restrains the development of longitudinal cracks, which affects the crushing effect to a large extent. In engineering applications, for concrete column components with high volume hoop ratios, it is necessary to increase the number of copper wires and the discharge voltage to ensure that the longitudinal cracks are adequate.
Figure 15 shows the relationship between the average transverse crack width wT (transverse crack width) near each hole and the volume hoop ratio of the concrete column ρsv under four fixed one-side longitudinal reinforcement ratios. From Figure 15, it can be seen that the transverse crack width decreases slightly with the increase in the volume hoop ratio of the column for the same concrete strength class and one-side longitudinal reinforcement ratio. At four different one-side longitudinal reinforcement ratios, the transverse crack width decreased by 20%, 18%, 23%, and 25% when the volume hoop ratio was increased from 0.34% to 0.86%, respectively. This indicates that the volume hoop ratio has less influence on the transverse crack width than the longitudinal crack.

6.3.3. Effect of Concrete Grade Strength

From Figure 12, Figure 13, Figure 14 and Figure 15, it can be seen that there is a small decrease in concrete crack width with the increase in concrete grade strength. This is due to the fact that as the tensile strength of concrete rises, the fracture energy of concrete increases, the ability to resist crack development increases, and the crack width decreases.

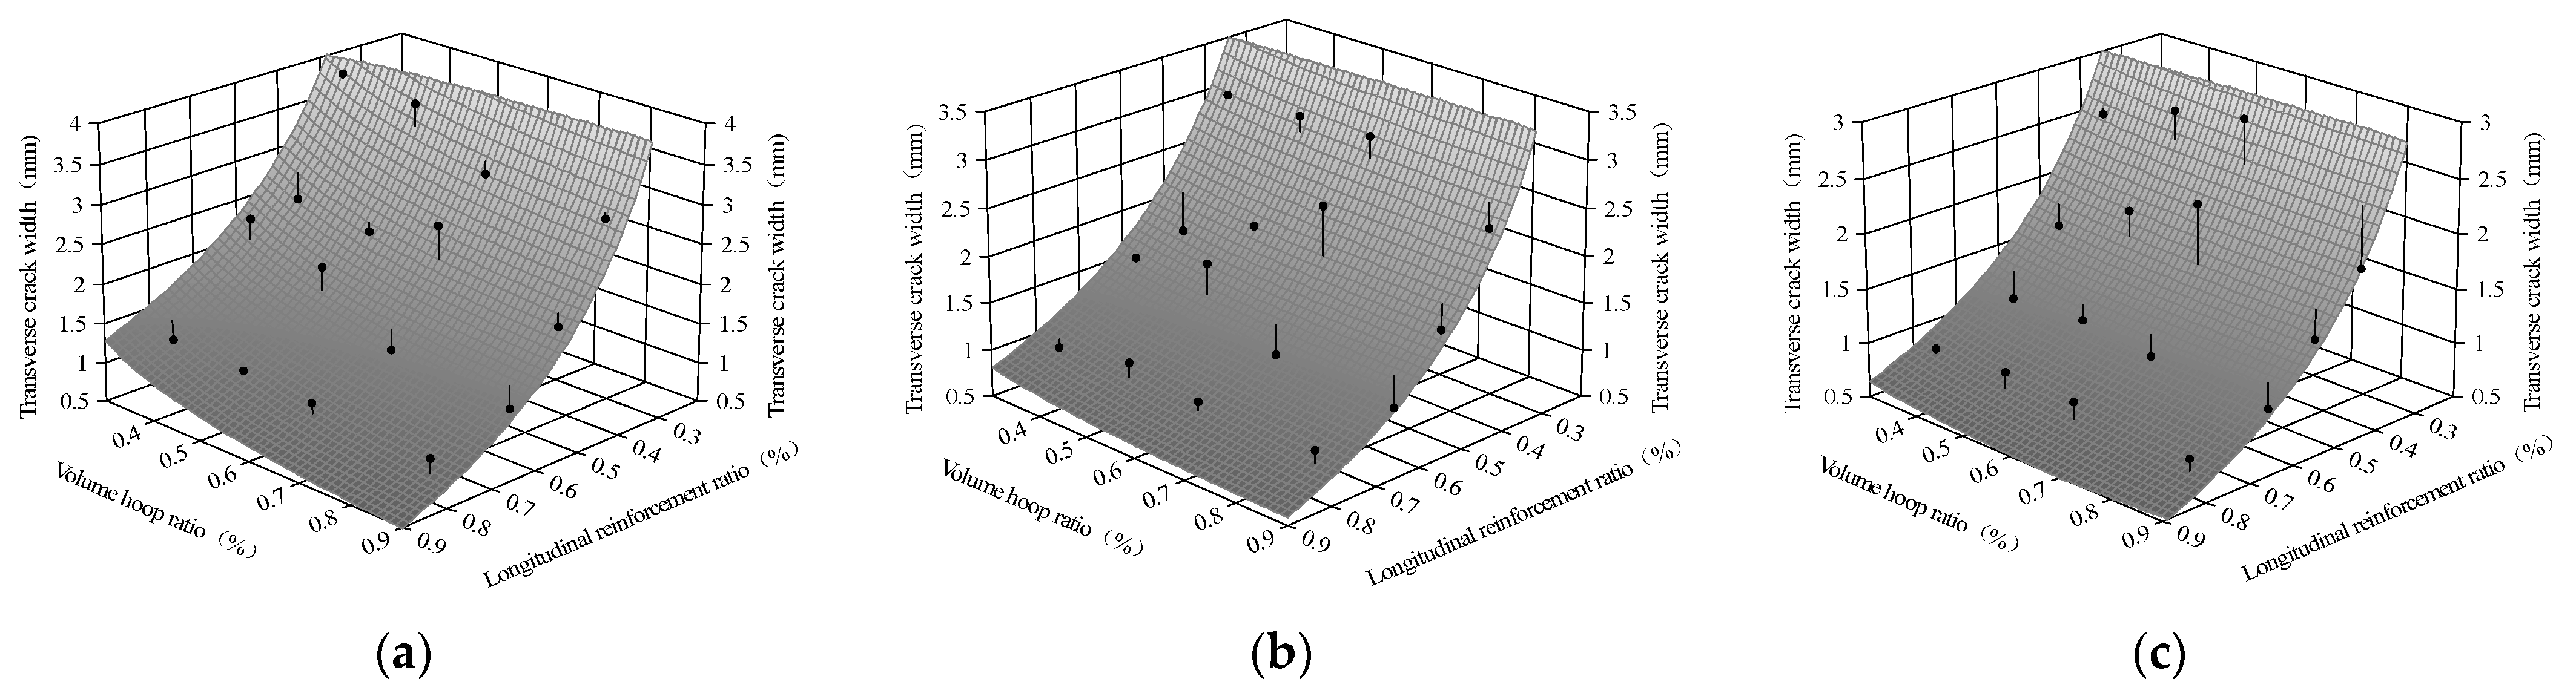
6.4. Mathematical Expression of the Effect of HVPD Demolition of Concrete Columns with a Single Row of Holes

For engineering applications, the average transverse crack width wT or longitudinal crack width wL of the concrete columns near the drilled holes, one-side longitudinal reinforcement ratio ρ, and volume hoop ratio ρsv under each concrete strength class were fitted in three dimensions, and the fitted surfaces are shown in Figure 16 and Figure 17. Mathematical expressions for the removal effect of concrete columns with a single row of holes (i.e., the average transverse crack width wT or longitudinal crack width wL near the drilled holes) as the objective function and the key parameters of the one-side longitudinal reinforcement ratio ρ and the volume hoop ratio ρsv as the independent variables were established based on the fitted surfaces in Figure 16 and Figure 17 for each concrete strength class, as shown in Equations (11) and (12). Equation (11) is applicable for studying the transverse crack width and Equation (12) is applicable for studying the longitudinal crack width.
ω T 1.912 + 1.819 ρ + 0.351 ρ s v       C 30   Concrete 1.195 + 1.507 ρ + 0.099 ρ s v       C 40   Concrete 1.093 + 1.342 ρ + 0.072 ρ s v       C 50   Concrete
ω L 2.282 + 1.553 ρ + 0.752 ρ s v       C 30   Concrete 1.132 + 1.527 ρ + 1.011 ρ s v       C 40   Concrete 0.255 + 1.606 ρ + 1.030 ρ s v       C 50   Concrete
From Figure 16 and Figure 17, it can be seen that the surface of the formula is closer to the data points. The squared value of the correlation coefficient of Equation (11), R2 is above 0.84, and the squared value of the correlation coefficient of Equation (12), R2, is above 0.90, which indicates that the calculated value of the formula is in good conformity with the original data.

7. Conclusions

(1) Through the finite element simulation, it can be seen that the HVPD generated stress waves in the discharge hole that spread outward. The intersection of stress waves between neighboring holes caused tensile stress in the concrete, and when the tensile stress exceeded the tensile strength of the concrete, the concrete cracked. Moreover, a 100 kV voltage can cause multiple cracks to form on the side of the concrete column along the longitudinal and transverse directions after multiple discharges so that the concrete column is effectively divided.
(2) The results of finite element simulation analysis show that the volume hoop ratio is the main factor affecting the width of the longitudinal cracks in the concrete. Under the same conditions, the longitudinal crack width at a 0.4% volume hoop ratio is about 1.5 times that at a 0.8% volume hoop ratio. The one-side longitudinal reinforcement ratio is the main factor affecting the transverse crack width of the concrete. The transverse crack width at a 0.4% one-side longitudinal reinforcement rate was about three times as large as that at 0.8% under the same conditions. The increase in concrete grade strength also plays a role in limiting the development of longitudinal and transverse cracks.
(3) The width of the longitudinal cracks produced using HVPD on concrete columns is about twice as large as the width of transverse cracks. This indicates that the restraining effect of the longitudinal reinforcement on transverse cracks is significantly higher than the restraining effect of hoop reinforcement on longitudinal cracks.
(4) Mathematical expressions involving the damage degree of concrete columns with a single row of holes (i.e., transverse crack width of concrete around the drilled holes wT or longitudinal crack width wL) and the key parameters, such as one-side longitudinal reinforcement ratio ρ, volume hoop ratio ρsv, and concrete grade strength, were established. According to the comparison between the calculated results of the formula and the simulation analysis results, the square root of the correlation coefficient, R2, is above 0.84, which indicates that the calculated formula conforms well to the simulation results and can guide the application of the actual project.

Author Contributions

Conceptualization, X.W.; software, Y.S.; visualization, M.W. All authors have read and agreed to the published version of the manuscript.

Funding

This research was funded by Heilongjiang Provincial Natural Science Foundation of China, grant number LH2023E088.

Data Availability Statement

Not applicable.

Conflicts of Interest

The authors declare no conflict of interest.

References

  1. Han, R.; Wu, J.; Zhou, H.; Zhang, Y.; Qiu, A.; Yan, J.; Ding, W.; Li, C.; Zhang, C.; Ouyang, J. Experiments on the characteristics of underwater electrical wire explosions for reservoir stimulation. Matter Radiat. Extrem. 2020, 5, 047201. [Google Scholar] [CrossRef]
  2. Vishnyakov, V. Pulsed high-voltage electrical discharges in water: The resource for hydrogen production and water purification. Int. J. Hydrogen Energy 2022, 47, 12500–12505. [Google Scholar] [CrossRef]
  3. Kuşçu, Ö.; Eke, E. Oxidation of olive mill wastewater by a pulsed high-voltage discharge using oxygen or air. J. Environ. Chem. Eng. 2021, 9, 104701. [Google Scholar] [CrossRef]
  4. Yan, G.; Zhang, B.; Zhao, P.; Zhuang, S.; Zhou, E.; Zhao, Y. Investigating the influence of mineral characteristics on induced effect of high-voltage pulse discharge by synthetic minerals. Miner. Eng. 2020, 153, 106380. [Google Scholar] [CrossRef]
  5. Li, Q. Experimental Study on Crushing Concrete Beams by High-Voltage Pulse Discharge. Master’s Thesis, Harbin University of Science and Technology, Harbin, China, 2022. [Google Scholar]
  6. Weise, T.H.; Loffler, M.J. Experimental investigations on rock fractioning by replacing explosives with electrically generated. In Proceedings of the Ninth IEEE International Pulsed Power Conference, Albuquerque, NM, USA, 21–23 June 1993. [Google Scholar]
  7. Lisitsyn, I.V.; Inoue, H.; Katsuki, S.; Akiyama, H.; Nishizawa, I. Drilling and demolition of rocks by pulsed power. In Proceedings of the IEEE 12th International Pulsed Power Conference, Monterey, CA, USA, 27–30 June 1999. [Google Scholar]
  8. Kuznetsova, N.S.; Lopatin, V.V.; Yudin, A.S. Effect of electro-discharge circuit parameters on the destructive action of plasma channel in solid media. J. Phys. Conf. Ser. 2014, 552, 012029. [Google Scholar] [CrossRef]
  9. Uenishi, K.; Yamachi, H.; Yamagami, K.; Sakamoto, R. Dynamic fragmentation of concrete using electric discharge impulses. Constr. Build. Mater. 2014, 67, 170–179. [Google Scholar] [CrossRef]
  10. Yudin, A.S.; Kuznetsova, N.S.; Lopatin, V.V.; Voitenko, N.V. Multi-borehole electro-blast method for concrete monolith splitting off. J. Phys. Conf. Ser. 2014, 552, 012028. [Google Scholar] [CrossRef]
  11. Ma, N.; Xue, Q.; Jin, B.; Fan, X.; Gong, D.; Hong, J.; Zhang, N.; Ye, Y.; Wang, Y.; Sun, Y. Simulation study on high voltage discharge rock breaking based on COMSOL. Explor. Eng. 2022, 49, 62–70. [Google Scholar]
  12. Wang, X.; Li, N.; Du, J.; Wang, W. Concrete crushing based on the high-voltage pulse discharge technology. J. Build. Eng. 2021, 41, 102366. [Google Scholar] [CrossRef]
  13. Che, L.; Gu, X.; Li, H. Numerical analysis and experimental research on hard rock fragmentation by high voltage pulse discharge. Miner. Eng. 2021, 168, 106942. [Google Scholar] [CrossRef]
  14. Qin, Y.; Gao, P.; Yuan, S.; Zhang, N.-Y.; Han, L.-R. A novel technology of high-voltage pulse discharge for comminution of galena ore. Trans. Nonferrous Met. Soc. China 2021, 31, 2479–2492. [Google Scholar] [CrossRef]
  15. Wang, X.; Du, J.; Li, Q. Experimental study on crushing of concrete columns by high voltage pulse discharge. Case Stud. Constr. Mater. 2022, 16, e01090. [Google Scholar] [CrossRef]
  16. Smirnov, A.P.; Zhekul, V.G.; Taftai, E.I.; Khvoshchan, O.V.; Shvets, I.S. Experimental Study of Pressure Waves upon the Electrical Explosion of Wire under the Conditions of Elevated Hydrostatic Pressure. Surf. Eng. Appl. Electrochem. 2022, 56, 192–200. [Google Scholar] [CrossRef]
  17. Wang, T. Numerical Simulation of Damage of Rock Caused by Electrical Explosion of Wire. Master’s Thesis, China University of Petroleum, Beijing, China, 2018. [Google Scholar]
  18. Zolnikov, K.P.; Kryzhevich, D.S.; Shilko, E.V.; Korchuganov, A. Molecular Dynamics Simulation of Electric Pulse Explosion of Metal Wires. Procedia Struct. Integr. 2016, 2, 1421–1426. [Google Scholar] [CrossRef]
  19. Kozhevnikov, V.Y.; Kozyrev, A.V.; Semeniuk, N.S.; Kokovin, A.O. Theory of a High-Voltage Pulse Discharge in a High-Pressure Gas: Hydrodynamic and Kinetic Approaches. Russ. Phys. J. 2018, 61, 603–610. [Google Scholar] [CrossRef]
  20. Yan, G.; Fu, H.; Zhao, Y.; Sun, Z.; Zhang, B. A review on optimizing potentials of high voltage pulse breakage technology based on electrical breakdown in water. Powder Technol. 2022, 404, 117293. [Google Scholar] [CrossRef]
  21. Lee, S.H.; Abolmaali, A.; Shin, K.J.; Lee, H.-D. ABAQUS modeling for post-tensioned reinforced concrete beams. J. Build. Eng. 2020, 30, 101273. [Google Scholar] [CrossRef]
  22. GB 55008-2021; Code for Design of Architecture & Concrete Structures. China Architecture & Building Press: Beijing, China, 2010.
  23. Cao, X. Quasic-static Nonlinear Test Analysis of Reinforced Concrete Columns Based on ABAQUS. China Concr. Cem. Prod. 2023, 1, 60–65. [Google Scholar] [CrossRef]
  24. UFC 3-340-02; Structures to Resist the Effects of Accidental Explosions. US Army Corps of Engineers, Naval Facilities Engineering Command (Preparing Activity). Air Force Civil Engineer Support Agency: Washington, DC, USA, 2008.
  25. Zhang, Y.; Fu, F. Study on bond slip behavior and numerical simulation of CFRP bars and concrete under blast load. Concrete 2022, 11, 15–22. [Google Scholar]
  26. Bao, X.K.; Guo, J.Y.; Liu, Y.; Zhao, G.; Cao, J.; Wu, J.; Zhao, J. Damage characteristics and laws of micro-crack of underwater electric pulse fracturing coal-rock mass. Theor. Appl. Fract. Mech. 2021, 111, 102853. [Google Scholar] [CrossRef]
  27. Zhang, X. Simulation for Crushing of Concrete by High-Voltage Pulse Discharge in Liquid. Master’s Thesis, Harbin University of Science and Technology, Harbin, China, 2021. [Google Scholar]
  28. Niaki, M. Fracture mechanics of polymer concretes: A review. Theor. Appl. Fract. Mech. 2023, 125, 103922. [Google Scholar] [CrossRef]
  29. Zhang, J.Q.; Wang, S.H.; Dong, W. Three-dimensional numerical study on mode-I local crack propagation of concrete considering boundary effect. Theor. Appl. Fract. Mech. 2023, 125, 103856. [Google Scholar] [CrossRef]
  30. Lhonneur, J.; Jamin, F.; Monerie, Y.; Pélissou, C. Experimental Study of Concrete Normal Mode Cohesive behavior at the Centimeter Scale. Procedia Struct. Integr. 2022, 42, 513–521. [Google Scholar] [CrossRef]
  31. Li, Y.; Hao, Z.B.; Shen, Z.H.; Fu, P.; Zhang, J. Mesoscopic modeling and simulation of tensile properties of cracked concrete using cohesive model. Case Stud. Constr. Mater. 2023, 18, e02186. [Google Scholar] [CrossRef]
  32. Xu, Y.J.; Yuan, H. Applications of normal stress dominated cohesive zone models for mixed-mode crack simulation based on extended finite element methods. Eng. Fract. Mech. 2011, 78, 544–558. [Google Scholar] [CrossRef]
  33. Abbas, M.; Bary, B.; Jason, L. A 3D mesoscopic frictional cohesive zone model for the steel-concrete interface. Int. J. Mech. Sci. 2023, 237, 107819. [Google Scholar] [CrossRef]
  34. Li, L. Application of Cohesive Traction Crack Model in Crack Propagation in Concrete. Master’s Thesis, Wuhan University of Science and Technology, Wuhan, China, 2015. [Google Scholar]
Figure 1. Changes in the state of the wire during electric-wire explosion [17]. (a) solid; (b) liquid; (c) gas; (d) plasma.
Buildings 13 02200 g001
Figure 2. Bilinear material model of steel reinforcement [23].
Buildings 13 02200 g002
Figure 3. Explosion pressure–time curve [25].
Buildings 13 02200 g003
Figure 4. Schematic diagram of cohesion model [31].
Buildings 13 02200 g004
Figure 5. Cohesive element.
Buildings 13 02200 g005
Figure 6. Schematic diagram of insertion of cohesive element.
Buildings 13 02200 g006
Figure 7. Intrinsic response of cohesive element under pure tensile stresses [34].
Buildings 13 02200 g007
Figure 8. Schematic diagram of components (unit: mm) [15].
Buildings 13 02200 g008
Figure 9. Comparison of destruction patterns. (a) Z-4 test crushing effect [15]; (b) Z-4 simulated crushing effect.
Buildings 13 02200 g009
Figure 10. Comparative analysis of experimental and numerical simulations. (a) Concrete C20; (b) Concrete C30; (c) Concrete C40.
Buildings 13 02200 g010
Figure 11. The whole fracture process of concrete column with single row of holes force. (a) t = 60 µs; (b) t = 80 µs; (c) t = 90 µs; (d) t = 100 µs; (e) t = 120 µs; (f) t = 160 µs.
Buildings 13 02200 g011
Figure 12. Curve of transverse crack width wT versus one-side longitudinal reinforcement ratio ρ . (a) ρsv = 0.34%; (b) ρsv = 0.49%; (c) ρsv = 0.63%; (d) ρsv = 0.86%.
Buildings 13 02200 g012
Figure 13. Curve of longitudinal crack width wL versus one-side longitudinal reinforcement ratio ρ. (a) ρsv = 0.34%; (b) ρsv = 0.49%; (c) ρsv = 0.63%; (d) ρsv = 0.86%.
Buildings 13 02200 g013aBuildings 13 02200 g013b
Figure 14. Curve of longitudinal crack width ωL versus volume hoop ratio ρsv; (a) ρ = 0.39%; (b) ρ = 0.50%; (c) ρ = 0.61%; (d) ρ = 0.79%.
Buildings 13 02200 g014aBuildings 13 02200 g014b
Figure 15. Curve of transverse crack width wT versus volume hoop ratio ρsv; (a) ρ = 0.39%; (b) ρ = 0.50%; (c) ρ = 0.61%; (d) ρ = 0.79%.
Buildings 13 02200 g015
Figure 16. Transverse crack width wT, one-side longitudinal reinforcement ratio ρ and volume hoop ratio ρsv fitted surface. (a) C30; (b) C40; (c) C50.
Buildings 13 02200 g016
Figure 17. Longitudinal crack width wL, one-side longitudinal reinforcement ratio ρ and volume hoop ratio ρsv fitted surface; (a) C30; (b) C40; (c) C50.
Buildings 13 02200 g017
Table 1. Concrete properties in ABAQUS.
Plasticity Property Values
Expansion Angle (°)Eccentricityfb0 /fc0KCoefficient of Viscosity
300.11.160.66670.0005
Elastic Property Values
Concrete Grade StrengthDensity (t/mm3)E0 (MPa)Poisson’s Ratio, ν
C202.4 × 10−92.83 × 1040.2
C302.4 × 10−93.14 × 1040.2
C402.4 × 10−93.20 × 1040.2
C502.4 × 10−93.55 × 1040.2
Table 2. Cohesive model parameters.
Concrete Grade StrengthK (MPa/mm) t n o (MPa)Gc (N/mm)
C202.83 × 1041.90.00128
C303.14 × 1042.50.00199
C403.20 × 1042.70.00228
C503.55 × 1043.00.00254
Table 3. Physical and mechanical properties of concrete and reinforcement.
Concrete Strength Gradeμfcu/
(N/mm2)
μfc/
(N/mm2)
μft/
(N/mm2)
μEc × 104/
(N/mm2)
C2025.619.51.92.83
C3034.626.12.53.14
C4044.330.92.73.20
Types of Reinforcingμfy/
(N/mm2)
μfu/
(N/mm2)
μEs × 105/
(N/mm2)
A6336.7523.32.37
A8331.9510.62.43
B12376.4563.12.23
B14412.1564.32.31
Note: μfy is the measured average value of the tensile yield strength of reinforcement; μfu is the measured average value of the tensile ultimate strength of reinforcement; μEs is the measured average value of the modulus of elasticity of reinforcement. μfcu is the measured average value of the compressive strength of the concrete cube; μfc is the measured average value of the compressive strength of the concrete prism; μft is the measured average value of the tensile strength of the concrete prism; and μEc is the measured average value of the modulus of elasticity of concrete.
Table 4. Parameters of column specimens.
SpineSection Size/
mm
Concrete StrengthColumn Length/
m
Longitudinal BarHoopAperture/
mm
Hole Spacing/
mm
Drilling Length/
mm
Z-1400 × 400C202.44B12A6@200 (2)40300410
Z-4400 × 400C302.44B12A6@200 (2)40300410
Z-7400 × 400C402.44B12A6@200 (2)40300410
Z-10500 × 500C202.44B14A8@200 (2)40300495
Z-13500 × 500C302.44B14A8@200 (2)40300495
Z-16500 × 500C402.44B14A8@200 (2)40300495
Table 5. Explosive discharge parameters of copper wire in concrete columns.
Drill HoleParametersZ-1Z-4Z-7Z-10Z-13Z-16
1-1Voltage V (kV)60601001008060
Number n604040605060
1-2Voltage V (kV)60608010010060
Number n604060604060
1-3Voltage V (kV)806080100100100
Number n504060604050
1-4Voltage V (kV)606080100100100
Number n506050605060
1-5Voltage V(kV)60608010080100
Number n405050406040
1-6Voltage V (kV)10080808080100
Number n406040605040
1-7Voltage V (kV)6010080808080
Number n405040504040
1-8Voltage V (kV)8010080808060
Number n404050604050
Table 6. Design of reinforcement for concrete columns with a single row of holes.
Specimen Number Concrete StrengthSection Size/
mm
Longitudinal ReinforcementOne Side Longitudinal Reinforcement RatioHoopVolume Hoop Ratio
C-1C30500 × 5002C250.39%A10@2000.34%
C-2C30500 × 5002C250.39%A12@2000.49%
C-3C30400 × 4002C200.39%A10@2000.63%
C-4C30400 × 4002C200.39%A12@2000.86%
C-5C30500 × 5004C200.50%A10@2000.34%
C-6C30500 × 5004C200.50%A12@2000.49%
C-7C30400 × 4004C160.50%A10@2000.63%
C-8C30400 × 4004C160.50%A12@2000.86%
C-9C30500 × 5004C220.61%A10@2000.34%
C-10C30500 × 5004C220.61%A12@2000.49%
C-11C30400 × 4002C250.61%A10@2000.63%
C-12C30400 × 4002C250.61%A12@2000.86%
C-13C30500 × 5004C250.79%A10@2000.34%
C-14C30500 × 5004C250.79%A12@2000.49%
C-15C30400 × 4004C200.79%A10@2000.63%
C-16C30400 × 4004C200.79%A12@2000.86%
Disclaimer/Publisher’s Note: The statements, opinions and data contained in all publications are solely those of the individual author(s) and contributor(s) and not of MDPI and/or the editor(s). MDPI and/or the editor(s) disclaim responsibility for any injury to people or property resulting from any ideas, methods, instructions or products referred to in the content.

