Article

An IoT-Enabled Sensing Device to Quantify the Reliability of Shared Economy Systems Using Intelligent Sensor Fusion Building Technologies

by
Rayan H. Assaad
1,*,
Mohsen Mohammadi
1 and
Aichih (Jasmine) Chang
2
1
Smart Construction and Intelligent Infrastructure Systems (SCIIS) Lab, John A. Reif, Jr. Department of Civil and Environmental Engineering, New Jersey Institute of Technology, Newark, NJ 07102, USA
2
Martin Tuchman School of Management, New Jersey Institute of Technology, Newark, NJ 07102, USA
*
Author to whom correspondence should be addressed.
Buildings 2023, 13(9), 2182; https://doi.org/10.3390/buildings13092182
Submission received: 19 May 2023 / Revised: 17 August 2023 / Accepted: 22 August 2023 / Published: 28 August 2023
(This article belongs to the Special Issue Sustainable, Resilient, and Intelligent Buildings)

Abstract

:
The concept of smart sustainable cities—as a favorable response to different challenges faced in urban areas—is rapidly gaining momentum and worldwide attention. This trend has driven the exploration of various technologies to improve the utilization of limited resources and idling capacities (i.e., underutilized physical assets such as buildings or facilities). In fact, a new business model has been introduced recently to smart cities, known as “shared economy”. The shared economy is a socioeconomic system that enables intermediary exchanges of goods and services between people and/or organizations, which boosts productivity and leverages underutilized resources to maximum potential. However, one of the inherent issues hindering the wide adoption of shared economy systems is the lack of trust between the providers and users of such systems. To this end, this study focuses on long-term shared properties/buildings and proposes an intelligent, IoT-enabled device and dynamic pricing model to address the issue of information asymmetry. First, 10 indicators were identified to assess the condition of the shared property. Next, multiple sensors were used, calibrated, and integrated into an IoT-enabled sensing device where the collected data was combined using intelligent sensor fusion technologies in a real-time manner. Third, a survey was developed and distributed to examine the significance of the 10 indicators, and an innovative reliability index was created accordingly to reflect the overall condition of the shared property. Fourth, a dynamic pricing model was developed to reward condition-conscious property users and penalize condition-unconscious ones. To ensure applicability and robustness of the proposed device and model, a pilot project was implemented in a smart long-term rental property in Newark, NJ, United States. Ultimately, this research provided insights on how to improve the operational efficiency of shared economy systems by offering (1) the providers of shared properties visibility over the condition of their properties through real-time assessment of the user reliability, and (2) the users of shared properties assured safety and monetary incentives to maintain the shared environment in a good condition.

1. Introduction

It is estimated that about 70% of the world’s population will be living in urban areas by 2050, which can add 2.5 billion people to the current urban population [1]. This expected growth is caused by many factors, including the overall increase in global population and the progressive migration from rural to urban regions. In urban cities, the existing built environment has already been enduring considerable social, economic, and environmental pressure [2,3,4,5], such as energy supply, air and water pollution, marginalization, and public safety and health, among others [6].
Technology solutions are needed to address those pressing challenges faced in urban areas and to meet the growing need for affordable housing, essential services, and infrastructure. Hence, the concept of a smart city has been introduced recently to solve many urbanization-related problems. A smart city is an established metropolitan region that uses Information and Communication Technology (ICT) and the Internet of Things (IoT) to maximize operational effectiveness at a low cost, to raise the standard of public services, and to enhance the quality of life [7]. The smart city concept describes a city’s development strategy that maximizes stakeholders’ interests while balancing social sustainability and environmental impacts [8].
Intelligent buildings and infrastructures are crucial for improving and developing smart cities and attaining the United Nations’ Sustainable Development Goals [9]. However, intelligent buildings and infrastructures cannot be achieved without smart technologies [4]. For instance, the IoT can make a building smarter by monitoring and managing the space remotely in a real-time manner. Through the integration of sensors and communication protocols, the IoT propels the growth of smart technology, industry, services, management, and life in smart cities [10].
To maximize resource utilization and minimize waste in smart cities, a new concept has been introduced recently, known as “shared economy”. The concept or notion of a shared economy is generally referred to in a variety of ways including “asset-light lifestyle”, “collaborative consumption”, “collaborative economy”, “peer economy”, “access economy”, or “sharing economy”, among others [11]. Shared economy is defined as “a socioeconomic system that enables an intermediated set of exchanges of goods and services between individuals/organizations which aim to increase efficiency and optimization of underutilized resources in society” [12]. In simple words, the shared economy is a new economic model that aims at sharing resources (e.g., goods and services) that are unused, underutilized, or newly created [13].
Shared economy systems are considered as peer-to-peer (P2P)-based activities of acquiring, providing, or sharing access to goods and services that are often facilitated by a digital or online platform (e.g., through the Internet) [14]. Sharing economies are vital to smart cities since they allow individuals and/or organizations to generate revenue from underutilized assets [15]. For example, underutilized resources like unused properties or extra spaces (such as buildings, apartments, or offices) can be rented out (either short-term or long-term) to other parties in a shared economy to generate additional stream of cash flow [16].
Sharing economies allow organizations or individuals to generate income from underused assets where idle assets such as parked cars and spare bedrooms or apartments can be rented out when not in use [14]. In populated smart, urban areas around the globe, people have already relied on shared economies by sharing various resources, including buildings (i.e., rental offices, rooms, houses, etc.), transportation (i.e., rental cars, ride-sharing, etc.), utilities, and spaces [17]. Uber is just one of many examples showing how cities can embrace and benefit from the shared economy concept (applied in the transportation sector in this case).
A sharing economy involves a business model where assets and resources are rotated, reused, and shared between different stakeholders [18]. Recently, urban population growth and rapid technology development (e.g., digital technologies, peer-to-peer Internet capabilities, etc.) has triggered a business boom in the shared economy. It is reported that as cities become smarter and denser, the public is becoming more inclined to explore and embrace shared economy systems [17]. Ultimately, the shared economy and the smart city coherently catalyze each other’s growth [17]. Ultimately, the concept of a sharing economy is growing rapidly since more customers are looking for more cost-effective ways to find, fund, and purchase assets or resources.
In the sharing economy, there are two primary parties: service providers and users. Providers are the entities (people/organizations) that own the shared space (e.g., an office, building, apartment, room, etc.), while the users are the entities (people/organizations) that use or rent the shared space (i.e., the tenants). The focus of this research is on shared properties (i.e., buildings/apartments/rooms). The “provider” represents the owner or manager (either an individual or an organization) who rents out his/her redundant space, whereas the “user” is the individual who rents and lives in the space. While the rental could be either short-term (e.g., Airbnb, hotel, etc.) or long-term (e.g., apartment lease, etc.), this study particularly focuses on the long-term rental of shared properties.

2. Literature Review

This section provides a review of relevant research studies and identifies the knowledge gap that this paper addresses.

2.1. Technology Applications in Smart Cities

Smart cities are critical to meet the United Nations’ Sustainable Development Goals (SDGs) [19]. In smart cities, technologies are potentially capable to collect information about the city’s environment, offer new services to citizens, facilitate their daily life, and enhance the city’s livability [20]. Previous studies have proposed and developed different technologies for various smart city services and applications. Ref. [21] provided some examples for such services and applications, including smart buildings, smart energy and smart grid, smart water, smart public services, smart lighting, smart mobility, smart waste management, smart meters, among others. Ref. [22], on the other hand, exemplified technologies that can be used in smart cities, including IoT, big data, geospatial technology, 5G technology, cloud/edge computing, blockchain, artificial intelligence, and information communication, among others. Out of those technologies, IoT, is one of the most used in smart cities since it enables efficient communication and real-time data exchange between devices [23].
IoT technologies have wide applications in smart cities. For instance, ref. [24] developed an IoT system for infrastructure monitoring and operation in smart cities. Ref. [25] created an IoT-enabled environmental monitoring system for smart cities to facilitate air quality and weather management. Ref. [26] developed an IoT-based energy management system to effectively handle the intermittence and uncertainty of energy supply and demand in smart cities. Ref. [27] designed an IoT-enabled fire detection system to minimize fire risk and loss in smart cities. Ref. [28] developed a custom-based sensor node, gateway, and handheld device for the real-time transmission of agricultural data to a cloud server.
IoT technologies have also been used for different building-related applications including: UAV-assisted task offloading in smart buildings [29], occupancy-driven plug load management systems [30], indoor climate anomaly detection [31], thermal comfort assessment [32,33], energy-efficient task offloading and resource allocation [34], occupancy detection [35], influence of façades on occupant perception and occupant–façade interaction [36], hyper-local PM2.5 assessment [37], and secure location clustering for facility management [38]. Other widely implemented smart city applications that have leveraged IoT technologies also include smart vehicle movement and activity tracking [39], smart HVAC controls [40], and smart device identification [41].

2.2. Shared Economy Systems

A shared economy is a peer-to-peer type of economy where participants exchange services and products, and the transactions are usually made over online platforms [42], most of which are enhanced with smart technologies. Therefore, the shared economy and smart technologies are supplementary and mutually beneficial to each other’s growth and prosperity in a smart city [43,44]. Thanks to technology, the shared economy has been expanded and blossomed in many fields, including mobility/transportation, housing, utilities, etc. [45].
Various research efforts have been conducted to examine different aspects of shared economies. For example, ref. [46] focused on the business aspects of shared economies and their associated regulations. Ref. [47] explored how the Internet of Things and blockchain technology can be applied and stimulate the shared economy. Ref. [48] investigated the effects of shared economies on urban sustainability by considering their social, economic, and environmental impacts. Ref. [49] examined the properties and the dynamics of shared economies to support their collaborative systems and expand their shared services. Ref. [50] studied how shared economies could contribute to the smart, sustainable, and inclusive growth of cities with a focus on the labor market, employment, and education. Ref. [51] surveyed startup businesses in the technology industry and found that there has been a substantial growth in the number of companies providing shared services and goods. Ref. [52] explored the smart city concept and principles and examined how they are aligned with shared economies, specifically on transport and shared mobility. Ref. [53] investigated the challenges in digital supply chains of shared economies and how business relationships could be integrated into supply chains. Ref. [54] explored how the shared economy concept could be applied to smart grids through shared energy storage and transactive energy.

2.3. Indoor Environmental Assessment

There have been multiple IoT prototypes specifically developed for indoor air quality (IAQ) to collect, process, and transmit data through sensors. These prototypes provide real-time access to the collected data from various platforms, including web and mobile applications [55]. For example, ref. [56] developed CO2 real-time monitoring systems for smart buildings enabled by IoT technologies. Many other studies developed systems considering multiple (rather than single) air quality measurands. Among those studies, most considered temperature, humidity, and CO2 as major components that affect indoor health conditions [57,58,59,60], while only a few further considered other measurands such as ozone, particulate matter, carbon monoxide, nitrogen oxides, sulfur dioxide, VOC, etc. [61]. More specifically, some studies [62,63,64] used wireless sensor networks for IAQ assessment (e.g., temperature, humidity, CO, CO2, and luminosity, etc.), which served as a single gateway to receive data from multiple sensors with Ethernet and web services. However, such a prototype requires a complex sensor configuration and installation architecture. Therefore, some proposed leveraging an open public cloud to create Application Programming Interface (API)-based platforms for data exchange among IoT devices, which is simple and easy to install. Accordingly, some recent studies used and recommended the MQTT protocol as the communication system to collect and access sensor data for its advantages of being lightweight, battery-friendly, efficient, and secure [65,66]. However, those studies mainly focused on prototype and system design, rather than applications, and were not applied in sharing economy systems.

2.4. Research Need and Knowledge Gap

Despite the various benefits of shared economy systems, there are some challenges faced by both the users and providers of the shared services. First of all, it is difficult to build trust between the two parties [42,67]. For instance, numerous incidents have been reported regarding shared economy environments such as Airbnb, including dirty rooms, death due to carbon monoxide poisoning while sleeping, and dead bodies found in the apartments, among many others [68,69]. These incidents reflect the challenges of information asymmetry and lack of trust in the shared economy. Therefore, to ensure sustainable growth, the ecosystem of the shared economy must be reshaped to enhance information transparency and trust among stakeholders [70], and this could be achieved through smart technologies such as IoT devices and capabilities. More specifically, methods or tools are needed to quantify the reliability of the users of shared services so that the service providers can make better and informed decisions. In relation to that, ref. [42] indicated that there is a prevailing need to develop intelligent technology platforms to allow providers and users of shared services to make trustworthy decisions.
The providers of the shared service (e.g., the owner of a rented office space, a room, or an apartment) cannot access information, monitor, or control the condition of how the users of the shared property (e.g., the person/organization that rented the space) use and maintain the shared service/space. Next, most existing shared economic systems focused on the reliability of the shared product/service rather than the credibility of the provider/user (i.e., reliability of goods/services vs. credibility of individuals) [70]. Such a system design has caused significant economic losses and damage to both providers and users.
To assess or quantify the user reliability of shared properties, an evaluation system must be built, and indicators or metrics must be identified and selected. These indicators must reflect the condition at which the user maintains the shared property during his/her stay (i.e., rental period), and include various measures, including temperature, humidity, and other metrics generally used for indoor environmental assessment.
Furthermore, despite the different IoT applications mentioned in the previous subsections, there is only limited attention that was placed by existing research studies on the shared economy, which recently has emerged and blossomed into smart cities. Also, while the rise of the shared economy has successfully drawn significant attention, most research efforts were conducted to examine its characteristics, challenges, and social impacts, and very few research studies attempted to address those challenges (e.g., information asymmetry) by leveraging technologies, especially IoT.
Therefore, this paper addresses the research needs identified and fills the existing knowledge gap by developing an intelligent IoT device to quantify the reliability of the users of shared economy systems with a focus on shared properties (i.e., shared rooms or apartments in buildings). The associated objects include: (1) identifying and understanding the different indicators that could be used to assess the reliability of shared economy systems; (2) creating a quantifiable metric or measure that could be used to numerically quantify the reliability of shared economy systems, and (3) formulating a dynamic pricing model that dynamically establishes the rental price of the shared economy system according to the calculated reliability. Finally, expanding from the literature on indoor environmental assessments, this study aims to explore the applications of indoor environmental condition-related aspects in a shared economy system. Specifically, this study creates an IoT-enabled prototype device, develops a user reliability index and a dynamic pricing scheme, and builds a cloud-based platform to share information with stakeholders in a shared economy environment. This study aims to effectively reduce economic losses and damage, efficiently allocate resources, enhance trust, and ultimately stimulate the concept of the shared economy in smart cities.

3. Methodology

The methodology employed in this study involved five steps as shown in Figure 1 and detailed in the subsequent sections.

3.1. Identification and Selection of Indicators

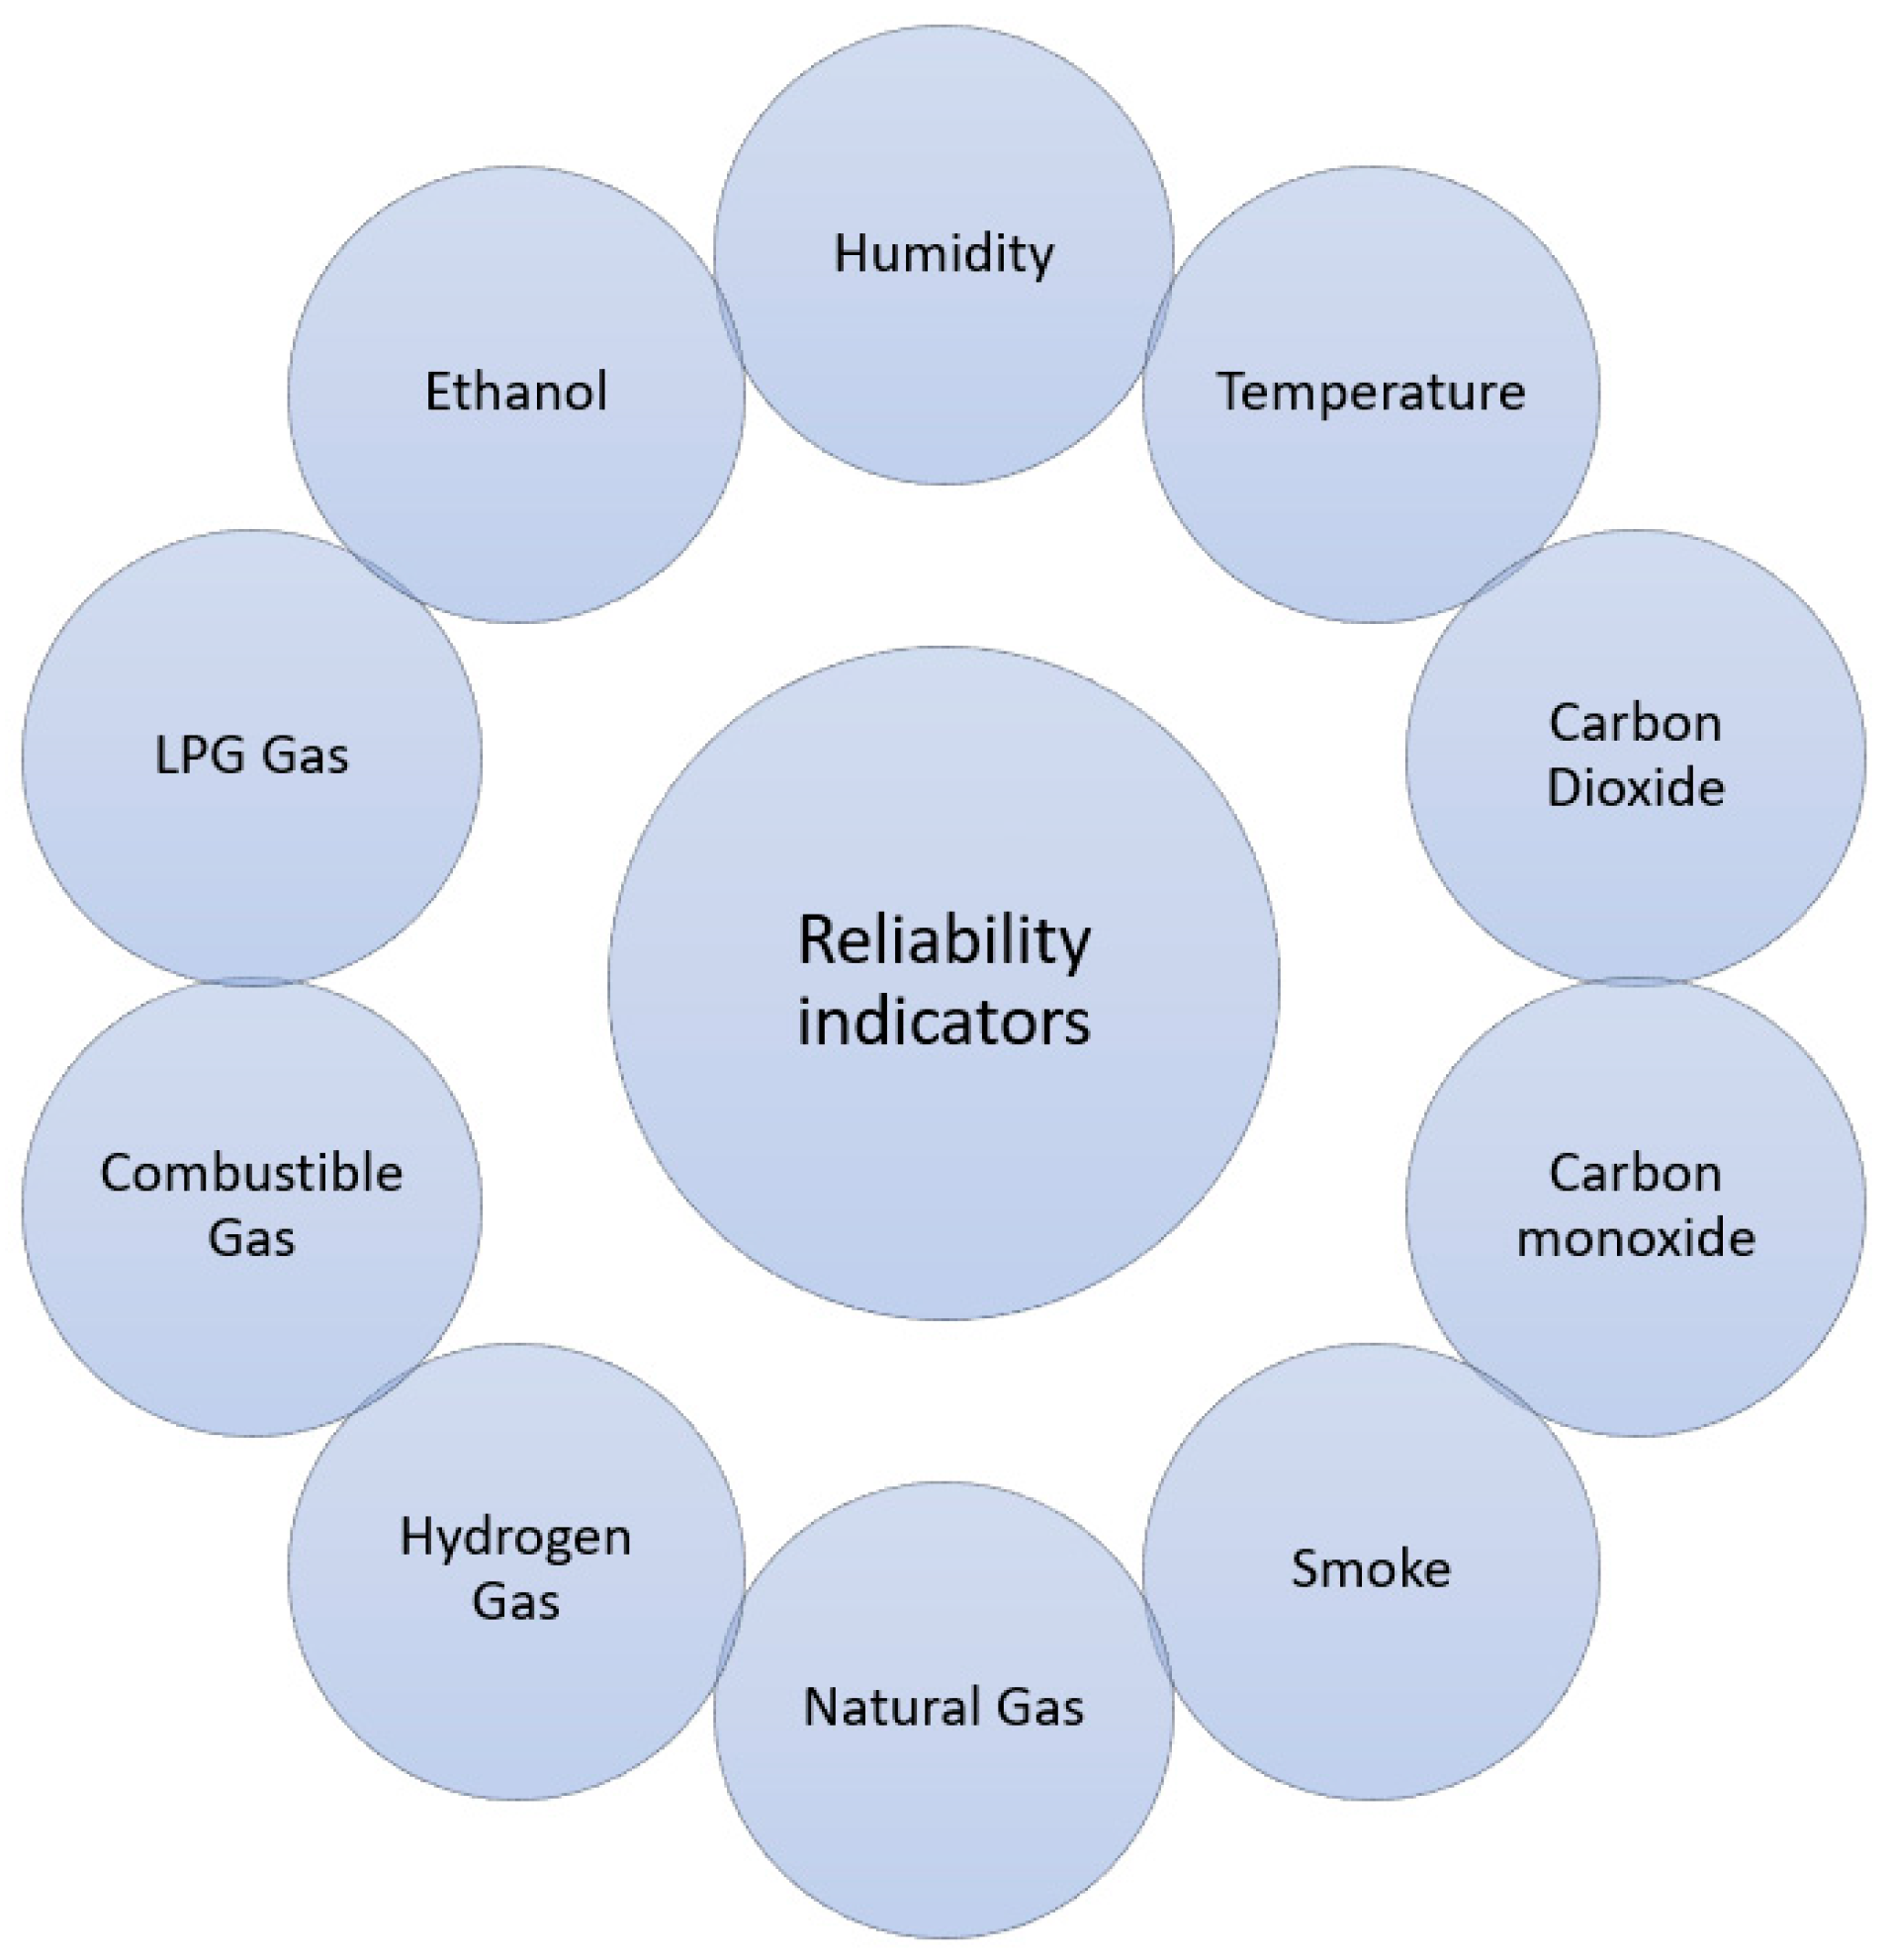
To identify indicators that could be used to quantify the reliability in shared economy systems, the authors performed a comprehensive literature review to determine a preliminary list of indicators that could be used. To further validate and examine the importance of those indicators collected from the literature, interviews were conducted with 12 providers of shared properties and 10 indicators were finalized as shown in Figure 2.

3.2. Development of a Sensing Device

After finalizing the 10 indicators, a sensing device was designed to collect data for each indicator.

3.2.1. Sensor Selection

Specific features were considered when developing the sensing device, including high sensitivity, fast response, high reception accuracy from different distances, simple drive circuits, long lifespan, and low cost. In terms of accuracy, the “BME-680” sensor was selected to collect the following two indicators: temperature and relative humidity. The “MQ” sensor family was selected and used in this study to collect real-time data for the other 8 indicators. These sensors are made up of an electrode which is coated with a sensing material and heated to be more reactive and sensitive. More specifically, the MQ-2, MQ-4, MQ-5, MQ-7, and MQ-9 sensors were used to collect the data for the following 5 indicators: LPG gas, natural gas, hydrogen gas, carbon monoxide, and combustible gas, respectively, while the MQ-135 sensor was used for the remaining 3 indicators: ethanol, smoke, and carbon dioxide.
These sensors are needed to track and monitor the conditions maintained by the shared property user during a certain rental period. As detailed in the next subsections, these sensors were next integrated into an IoT-enabled sensing device. To assess the reliability of the shared property, six classifications (i.e., excellent, good, fair, poor, bad, and very bad) were defined for each one of the 10 indicators as shown in Table 1 based on several well-established standards, including the World Health Organization (WHO), the National Institute for Occupational Safety and Health (NIOSH), the Occupational Safety and Health Administration (OSHA), and related literature.

3.2.2. Calibration of Sensors

MQ sensors are equipped with a variable resistor which alters its value based on the concentration detected. As the concentration increases, the resistance decreases, and vice versa. In addition to the variable resistor, a load resistor is also included to calibrate the sensor’s sensitivity and precision. The load resistor can range from 2 k Ohms to 47 k Ohms, where a higher value indicates a greater sensitivity of the sensor. The sensor also contains a built-in resistor for the sensor’s heater which maintains the required temperature for the device to properly function.
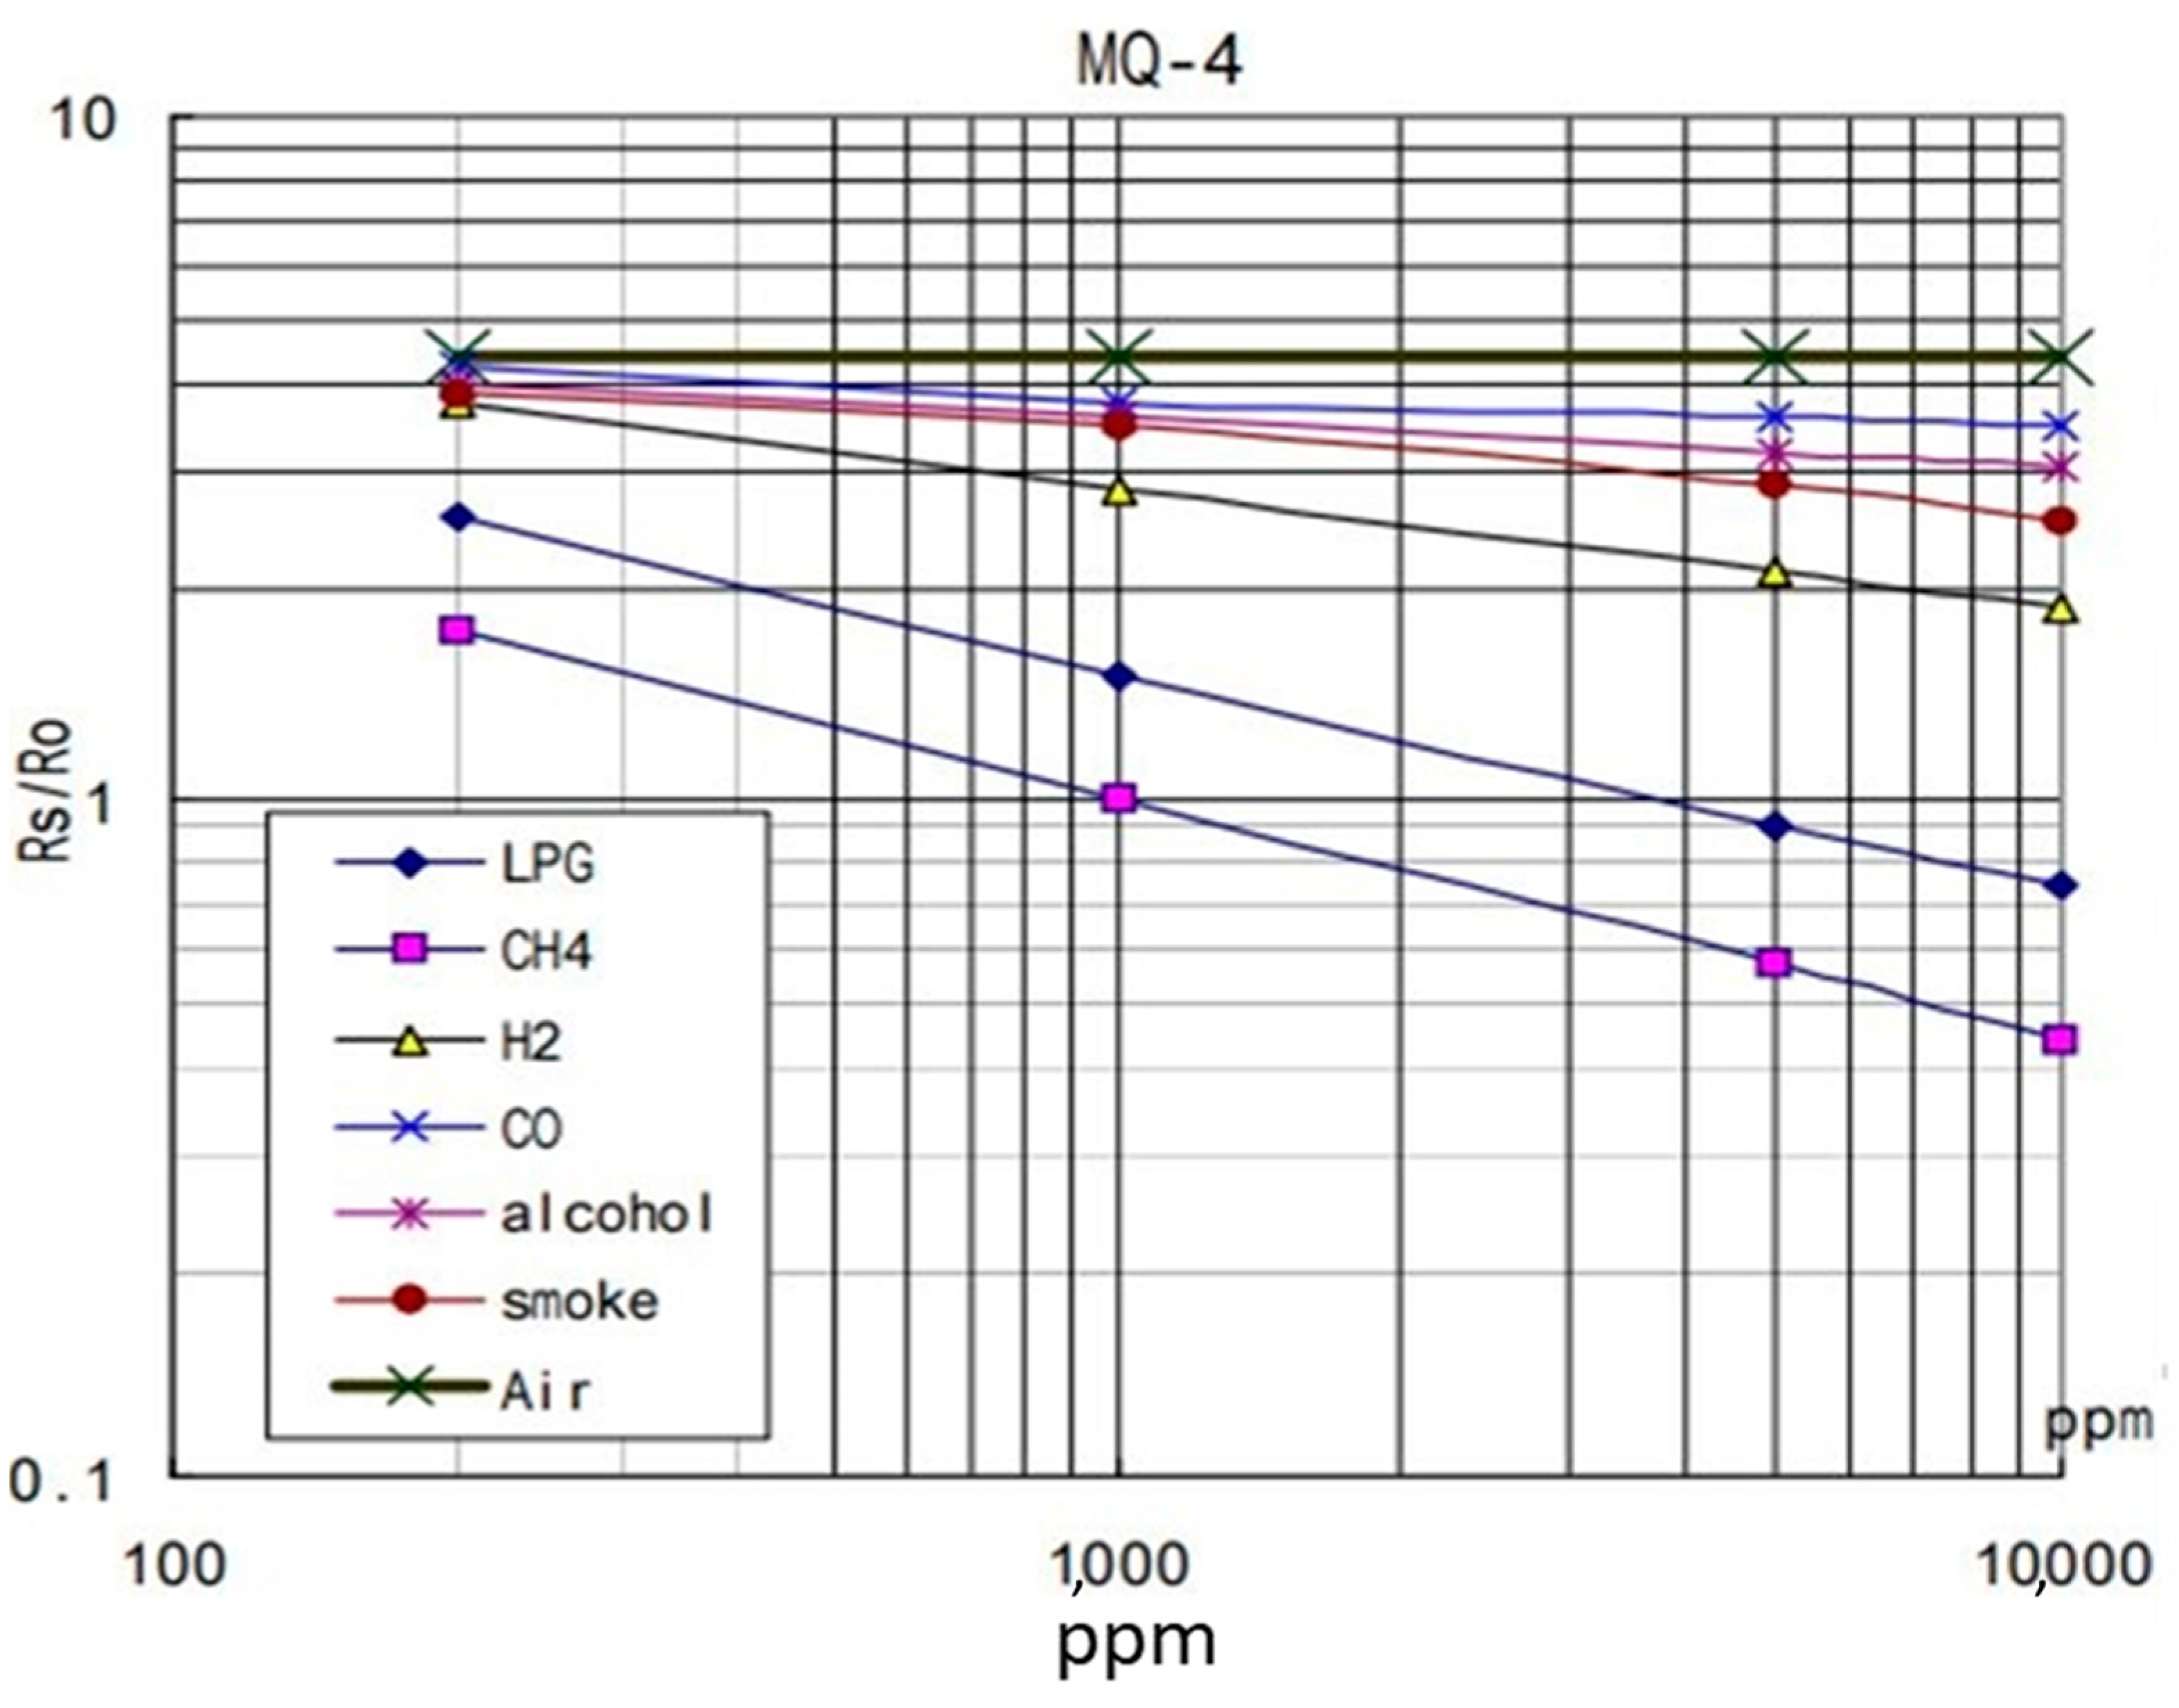
The sensor’s accuracy depends on the sensor’s resistance ratio ( R S / R O ), where R S is the sensor’s resistance which varies according to the measured concentration, and R O is the sensor’s resistance at a known concentration (i.e., without other gases or in fresh air). To calibrate the sensor, the R S / R O ratio in fresh air must be determined, and the ratio for each sensor can be found in the manufacturer’s datasheet. Taking the MQ-4 as an example, the R S / R O in fresh air is 4.4 (see the green line labeled “Air” in Figure 3). To this end, all sensors in this study were calibrated accordingly.
Finally, Equation (1) was used to calculate the measured concentration/value of each indicator in ppm (part per million) units [93]:
P P M =   a × R s / R O b  
where a and b are constants that vary according to the measured indicator.
The values of R S / R O , a, and b for each of the MQ sensors in this study and their corresponding indicator(s) are shown in Table 2.

3.2.3. Data Fusion, Sensor Integration, and Programming

A total of 7 sensors were integrated into the smart device to measure the different indicators. More specifically, the “BME-680” sensor was used to collect the following two indicators: temperature and relative humidity. The MQ-2, MQ-4, MQ-5, MQ-7, and MQ-9 sensors were used to collect the data for the following 5 indicators: LPG gas, natural gas, hydrogen gas, carbon monoxide, and combustible gas, respectively. Finally, the MQ-135 sensor was used for the remaining 3 indicators: ethanol, smoke, and carbon dioxide.
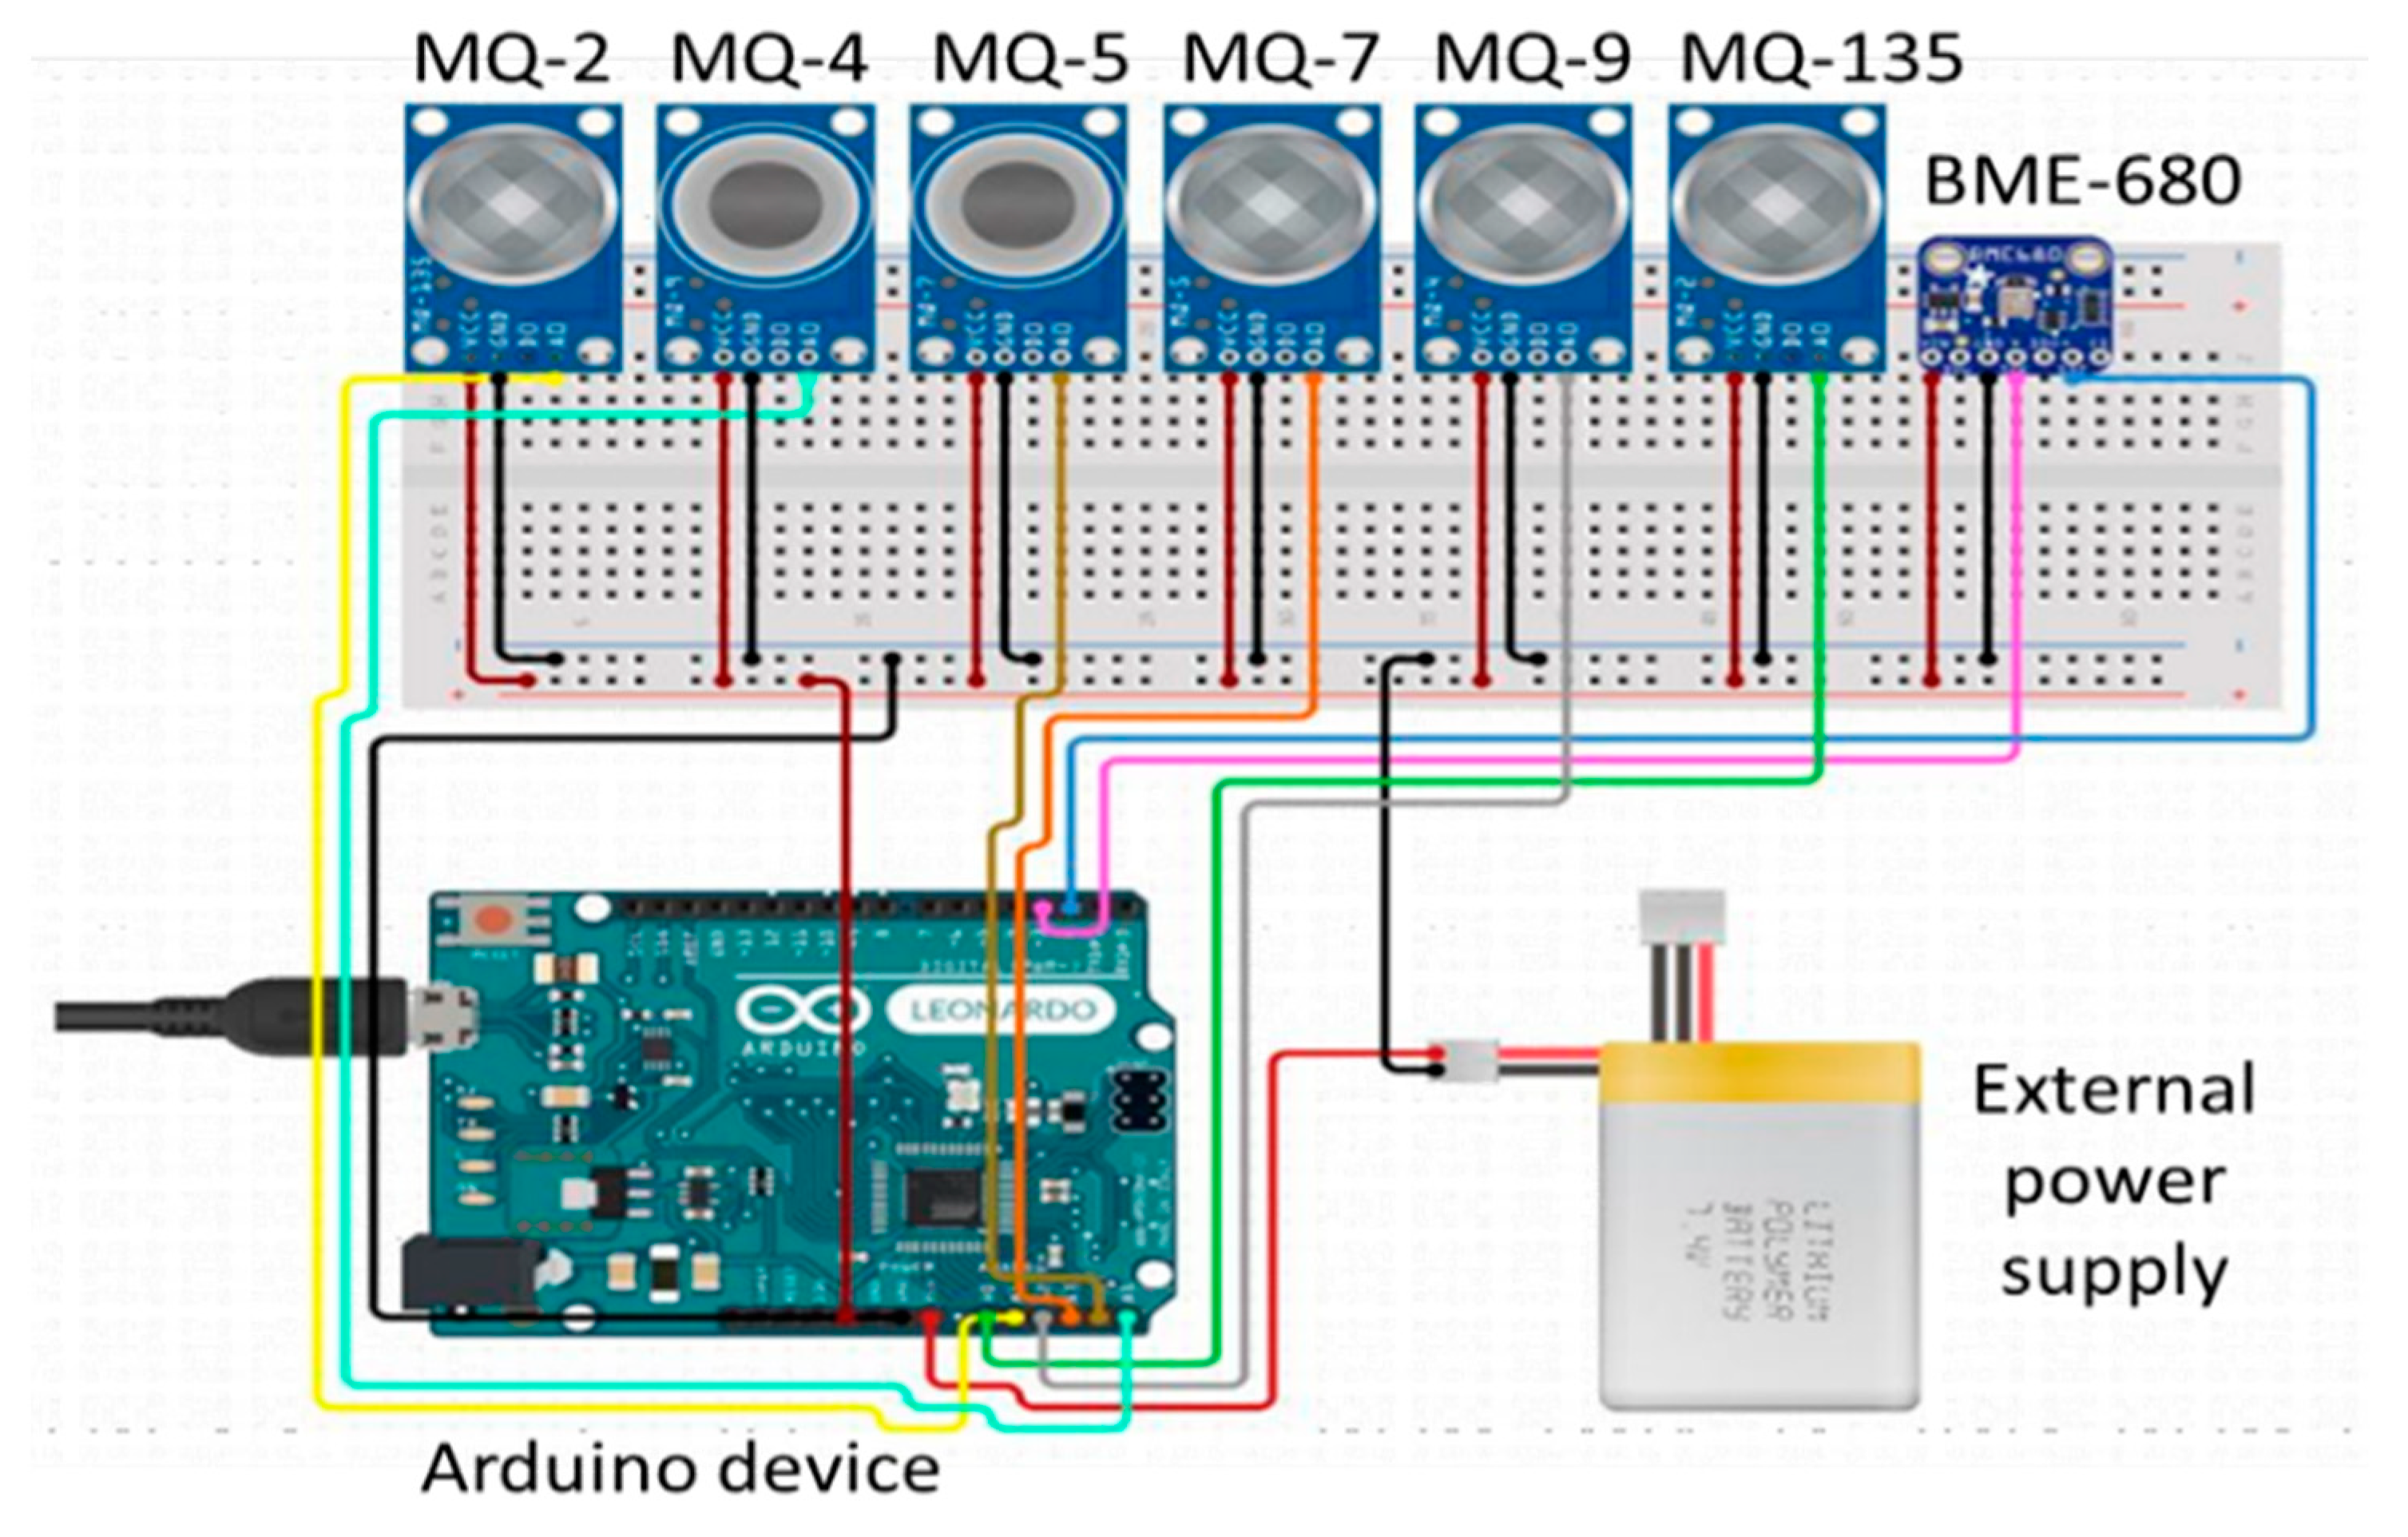
To integrate all sensors into the proposed smart IoT-enabled sensing device, an Arduino Uno WIFI microcontroller board was used. More specifically sensor fusion—which refers to the process of gathering, combining, and fusing data from multiple sensors to produce more reliable information with less uncertainty [94]—was implemented in this paper. In relation to that, the different sensors were integrated into the same device by following several steps including: (1) connecting the A0 pin of the MQ sensors to the Arduino Uno WIFI board through A0 to A5 analog pins, and connecting the ground and VCC pins of the MQ sensors to the corresponding ground and 5 volts pins of the Arduino since the operational voltage of the MQ sensors is 5 volts, (2) connecting the BME-680 sensor to the Arduino board through Inter-Integrated Circuit (I2C) communication (i.e., connecting the Serial Clock Line (SCL) and Serial Data Line (SDA) pins of both the BME-680 sensor and the Arduino board), and connecting the ground and VCC pins of the BME-680 sensor to the corresponding ground and 3.3 volts pins of the Arduino since the operational voltage of the BME-680 sensor is 3.3 volts, and (3) adding an external power supply to provide electrical power for the IoT-enabled sensing device (i.e., the Arduino board and the integrated sensors), and (4) using the Arduino Integrated Development Environment (IDE) to upload programming scripts in order to read, process, and publish data to the cloud in real-time. It is worth mentioning that any microcontroller equipped with WIFI capabilities could be used instead of the Arduino UNO WIFI board. However, the Arduino UNO WIFI board was used in this paper because it has a small form factor (which makes it easier to be installed in a shared property), it is WIFI-enabled (which is needed to enable IoT capabilities), and it has the needed pins to connect for different sensors.

3.2.4. IoT Cloud Web Server Development

In general, an IoT device is a network-enabled client that sends and/or receives data from an online cloud server. The data transmitted can contain any information, including sensor data and control messages. The most common IoT device protocols are HTTP, MQTT, Web Sockets, SMQ, and OPC-UA. This study selected the MQTT protocol web server because it is lightweight, battery-friendly, efficient, and secure [65]. In addition, an API token was defined for the MQTT web server to further enhance the security of the developed IoT cloud environment by requiring both the property user and provider to access data via a two-step verification process (i.e., password and token).

3.3. Development of a Reliability Index

In order to quantify the overall reliability of a property user in a shared environment, a reliability index (RI) is proposed to integrate the measurements from the 10 indicators. However, each indicator might have different perceived significance. For example, the carbon monoxide level might be more critical than temperature, and weighing them equally in the model might be biased. Therefore, a survey was developed and distributed to users and providers of shared properties to examine the importance of each indicator which will be used to build the reliability index model.

3.3.1. Survey Development

A survey was created to determine the importance of each of the selected indicators in the context of shared properties. To minimize potential bias, a standard 5-point Likert scale was used in the survey; the respondents were asked to assess the importance of the indicators as follows: 1 = Very unimportant; 2 = Unimportant; 3 = Neutral; 4 = Important; and, 5 = Very important. The survey also contained questions on demographic information (e.g., gender, age, location, etc.), contact information, property type, ownership status, and tenancy period. To ensure the validity and robustness of the survey, a pilot study was conducted in advance to examine respondents’ understanding and perception toward the survey questions. The survey was modified accordingly by adding questions, removing redundant ones, providing clarifications, and enhancing consistency.
Once finalized, based on the pilot study results, the purposive sampling was used to disseminate the survey. The participants selected for the survey must: (1) have experience with long-term shared property either as a provider or a user, (2) live in a city, and (3) possess knowledge about smart building technologies such as IoT-enabled devices. The survey was distributed to 100 persons, and a total of 84 responses were received, 71 of which were deemed “valid” and considered in the study.

3.3.2. Weight Calculation

Based on the survey results, the significance of the 10 indicators is reflected by assigning individual weights for each indicator. A higher weight/value is allocated to the indicator that is perceived more important, and the sum of the 10 indicators’ weights must be equal to 1. For each indicator (denoted as j), the average value (denoted as I L ¯ j ) was computed from the survey results. In relation to the total average values of all indicators (i.e., j = 1 10 I ¯ L ¯ j ), the significance of the individual indicator was assessed and the weight (denoted as W j ) was allocated according to Equation (2):
W j = I L ¯ j j = 1 10 I L ¯ j    

3.3.3. Reliability Index

To quantify the reliability of the user, a reliability index (RI) is proposed. More specifically, the user’s RI collectively considers the 10 indicators with the weight allocation scheme developed from the survey results. First, an individual index for each of the 10 indicators was calculated as shown in Equation (3), which was inspired by the widely-used air quality index (AQI) developed by the US Environmental Protection Agency (EPA) [95], which ranges from 0 to 500, where 0 represents good air quality and 500 represents hazardous conditions:
I i , j = S i , j L i , j L o L i , j H i L i , j L o × I i H i I i L o + I i L o
where I i , j   is the index for the user i (i = 1, 2,..., N) and indicator j (j = 1, 2,..., 10). S i , j is the real-time measurement taken by the sensor for the user i and indicator j. L i , j H i   and   L i , j L o   represent the upper and lower measurement limit of indicator j for user i (obtained from Table 1) such that L L o i , j S i , j L H i i , j . Finally, I i H i   and   I i L o are the upper and lower indices for the environment conditions and follow the scheme shown in Table 3, which is also inspired by EPA’s AQI [95].
To determine the index for a certain indicator, cross-referencing is needed for both Table 1 and Table 3. Take temperature (j = 1) as an example, if the IoT device reads a temperature of 20 °C (i.e., S i , 1 = 20 ), by referring to Table 1, it lies within the range of 18 (i.e., L i L o = 18 ) and 21 (i.e., L i H i = 21 ), defined as an “excellent” condition (see Table 1). Next, by referring to Table 3, the “excellent” condition ranges from 0 (i.e., I i L o = 0 ) to 49.99 (i.e., I i H i = 49.99 ). Inserting these numbers into Equation (3), we obtain I i , 1 = 33.32 . The same process is followed for the other indicators.
Finally, after obtaining individual indices for each indicator, the overall RI is computed according to Equation (4):
R I i = j = 1 10 W j × 1 I i , j 500 ,   for     i =   1 ,   2 ,   ,   N   and   j = 1 ,   2 ,   ,   10    
where R I i is the reliability index with a range of 0 ,   1   such that 1 represents the best user reliability and 0 represents the worst user reliability, and W j is the weight of each indicator (obtained from the survey as detailed before).

3.3.4. Publishing the RI to Cloud

The proposed RI algorithm was programmed into the IoT-enabled sensing device (i.e., the Arduino microcontroller) to generate the individual and the overall reliability index in a real-time manner. More specifically, the collected data for each indicator was transferred to an MQTT gateway server which aggregated and sent the data to an IoT cloud platform. The integrated code included acquisition, forwarding, and storage of the collected data, and the sensor readings and the RIs were constantly calculated, stored, and published through the MQTT web server to an IoT cloud which is accessible by both providers and users of the shared property in a real-time manner.

3.4. Dynamic Pricing Model

Different from the traditional dynamic pricing, which adjusts price by market supply and demand (e.g., airline ticket, hotel room rate, etc.), the proposed model in this paper sets the rental price dynamically according to the calculated reliability. For a long-term rental, it is technically difficult to constantly monitor the maintenance condition of the shared property, and the property condition is usually observed when the contract ends or terminates. However, the economic loss or damage might have already been made and therefore, it will be too late to be reversed. Therefore, the proposed dynamic pricing model in this paper enabled by real-time RI aims to rationalize rental pricing by rewarding condition-conscious renters and penalizing condition-unconscious ones. The proposed dynamic pricing model considers (1) the base price ( P 0 ) of the shared property agreed upon by the user and the provider, and (2) a reward/penalty (i.e., RP term). Inspired by the penalty–reward contrast analysis (PRCA) [96], the RP scheme determines the reward/penalty by the reliability of the user (i.e., the calculated RI from Equation (4)) according to Table 4.
As shown in Table 4, the users ranked “excellent” and “good” are considered condition-conscious and will be awarded a discounted rental price for the shared property; those ranked “bad” and “very bad” are considered condition-unconscious and will be penalized with a higher rental price.
The final rental price of the shared property is calculated by Equation (5):
P t = P 0 × 1 + R P t ,   t = 1 ,   2 ,   ,   T  
where P t is the dynamic price of the shared property for the tth month, P 0 is the base price of the shared property, and R P t is the reward/penalty term for the tth month.
It is worth noting that the average RI (i.e., R I ¯ t ) is calculated at the end of a month (t = 1, 2, ..., T), based on which the rental price is determined by the corresponding RP term in Table 4. For example, a user with “excellent” RI is awarded with a 15% discount toward his/her rent, while a “very bad” user is penalized with 20% of extra rent.

3.5. Real-World Implementation

To ensure the applicability and robustness of the proposed IoT-enabled dynamic pricing model, a pilot project was implemented in a smart long-term rental property in Newark, New Jersey, United States for a period of 7 months.

4. Results and Analysis

4.1. Development of IoT-Enabled Device

As detailed in the Methodology section, different sensors were integrated into an IoT-enabled sensing device with the Arduino Uno WIFI microcontroller to collect real-time data for the 10 indicators. A schematic diagram of the developed smart device is presented in Figure 4.
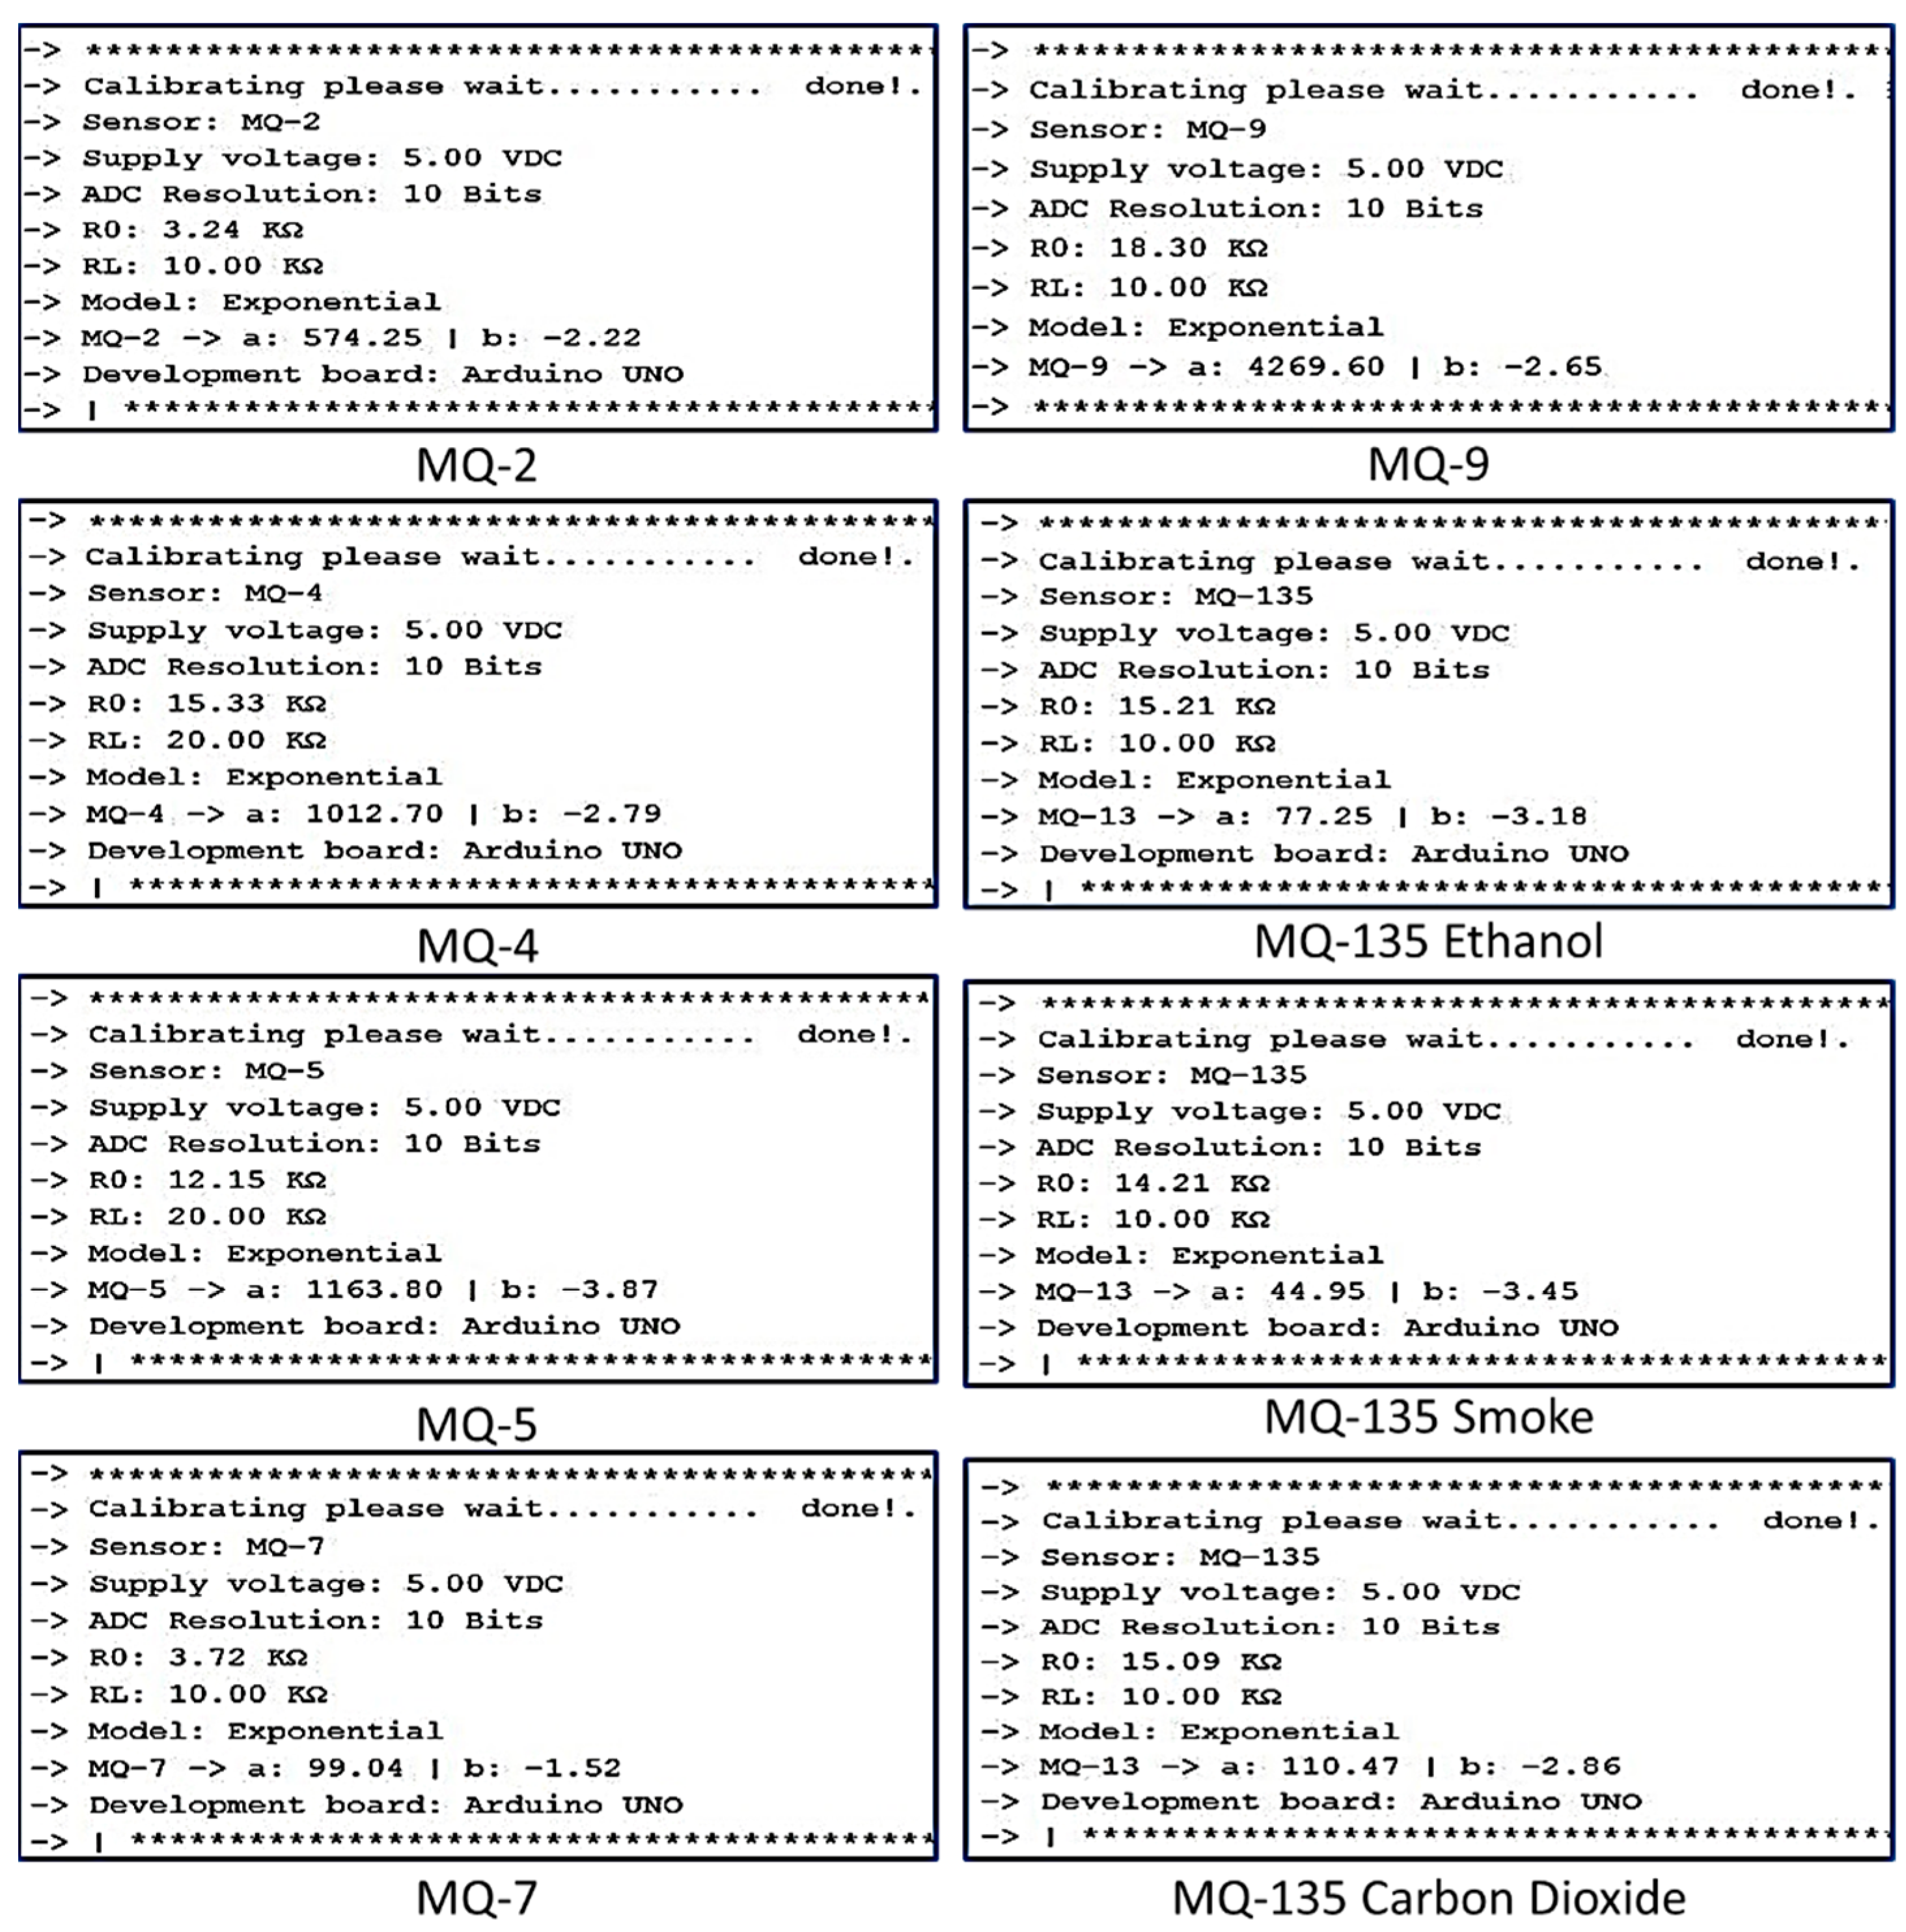
To ensure data accuracy, the sensors were calibrated as detailed in the Methodology section. The results of the calibration process are provided in Figure 5.

4.2. Survey Results

A survey was distributed to determine the importance of each indicator and 71 responses were collected. The survey results and analysis are provided in the following subsections.

4.2.1. Respondents’ Demographics

Out of the 71 valid responses, 37% of the participants were female and 63% were male. The geographic distribution of the survey respondents was: (1) 54% of the participants were from New Jersey, (2) 37% from Massachusetts, (3) 8% from New York, and (4) 1% from Maryland. Furthermore, 31% of the participants were owners/providers of shared services/properties, while the remaining 69% were renters/users of shared services/properties.

4.2.2. Importance of Indicators

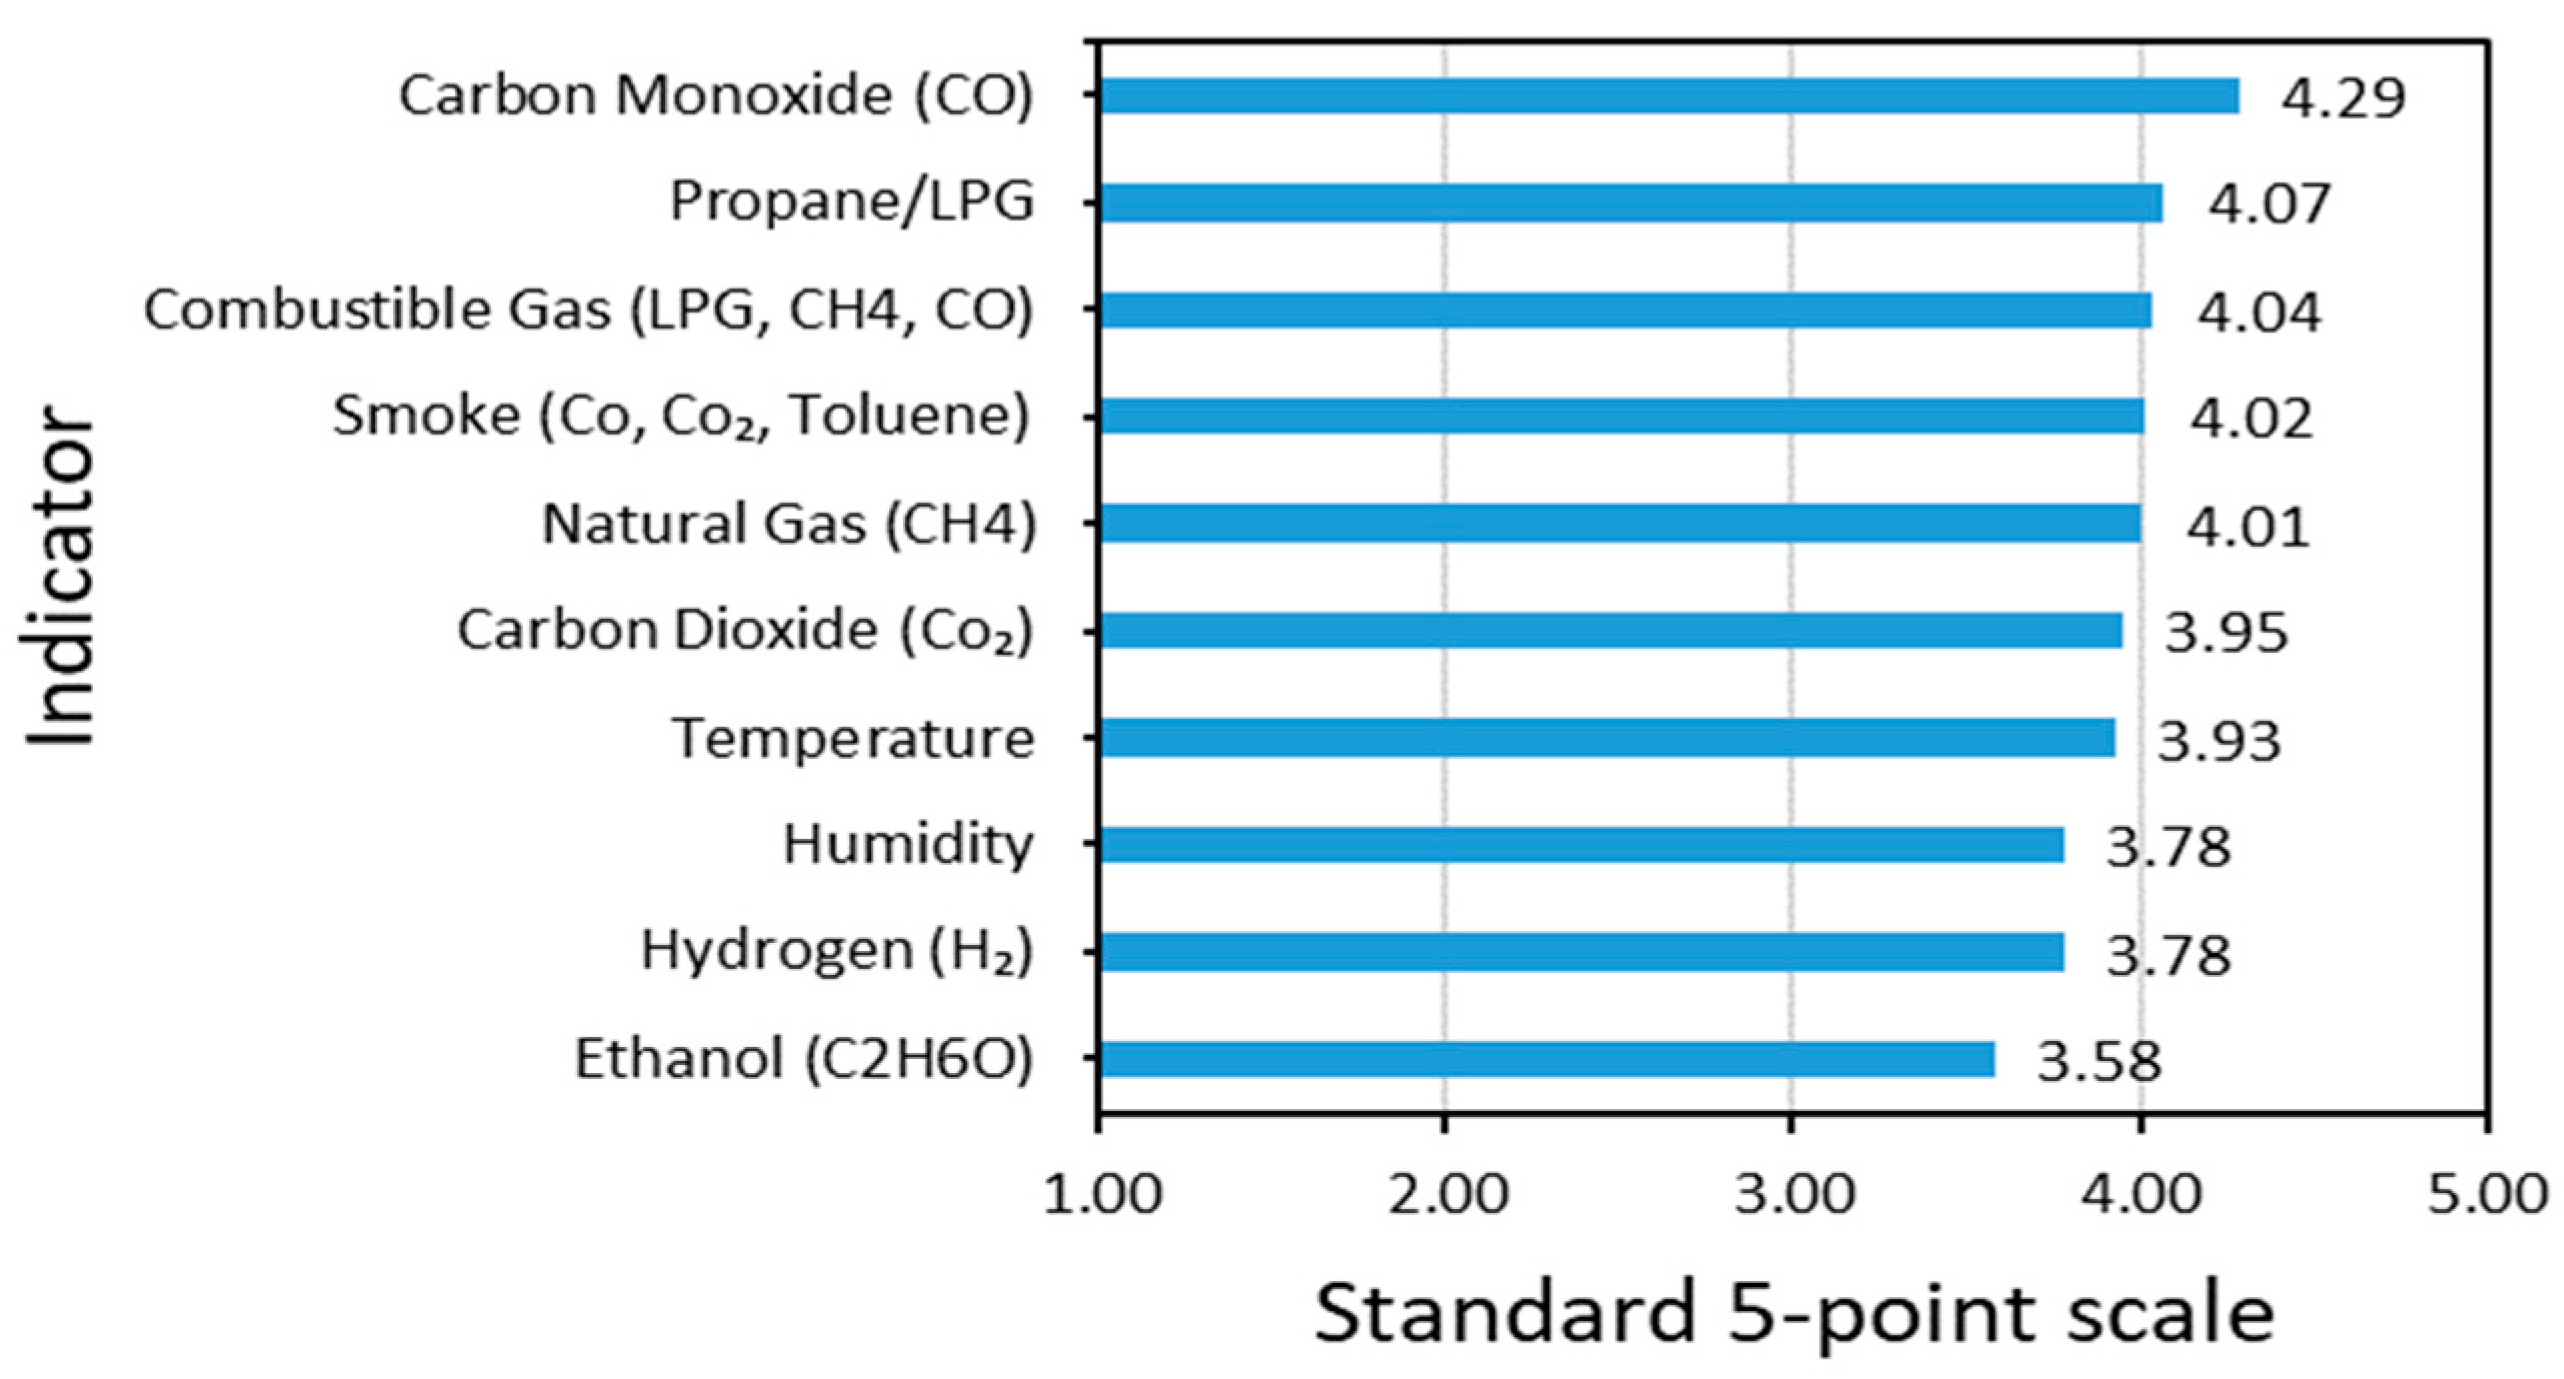
As detailed in the Methodology section, a 5-point Likert scale was used to assess the significance of the 10 indicators, and the average point for each indicator j (i.e., I L ¯ j ) from the 71 responses is provided in Figure 6. The 71 respondents indicated that carbon monoxide (CO) is the most critical with an average of 4.29/5, and ethanol (C2H6O) is the least critical with an average of 3.58/5.
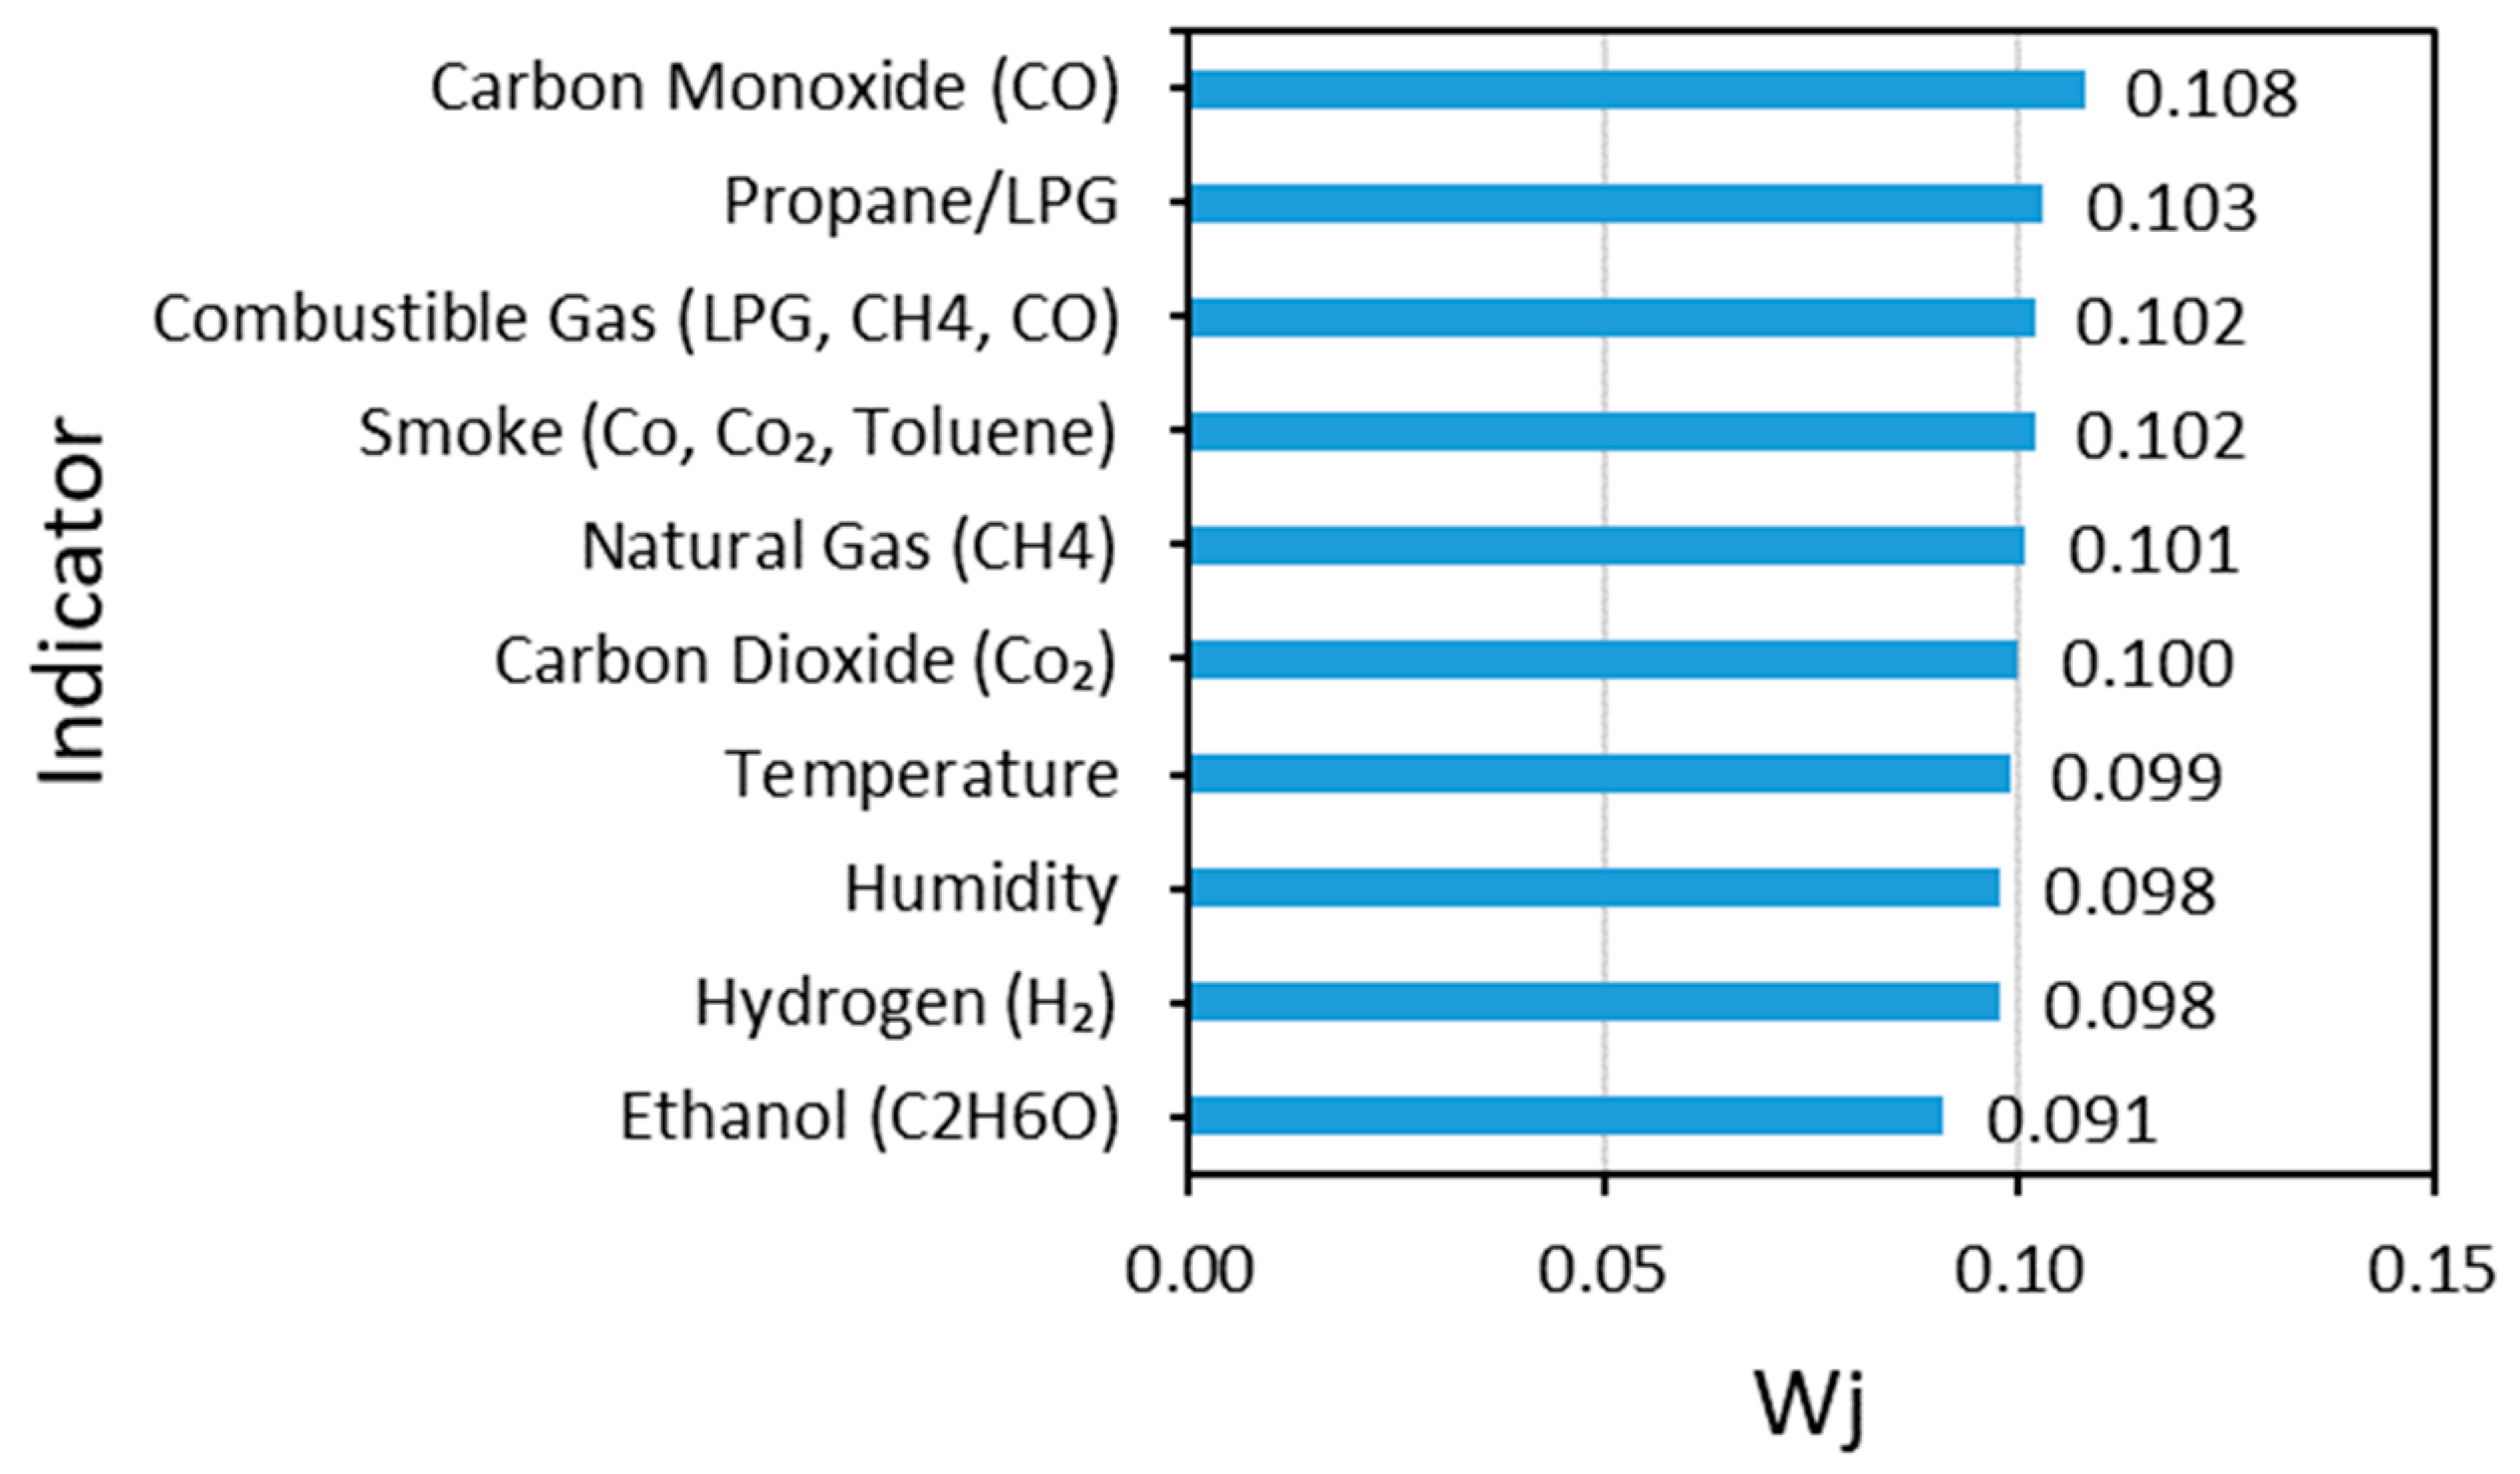
Following Equation (2), the weight for each indicator is computed and summarized as shown in Figure 7.

4.3. Graphical User Interface

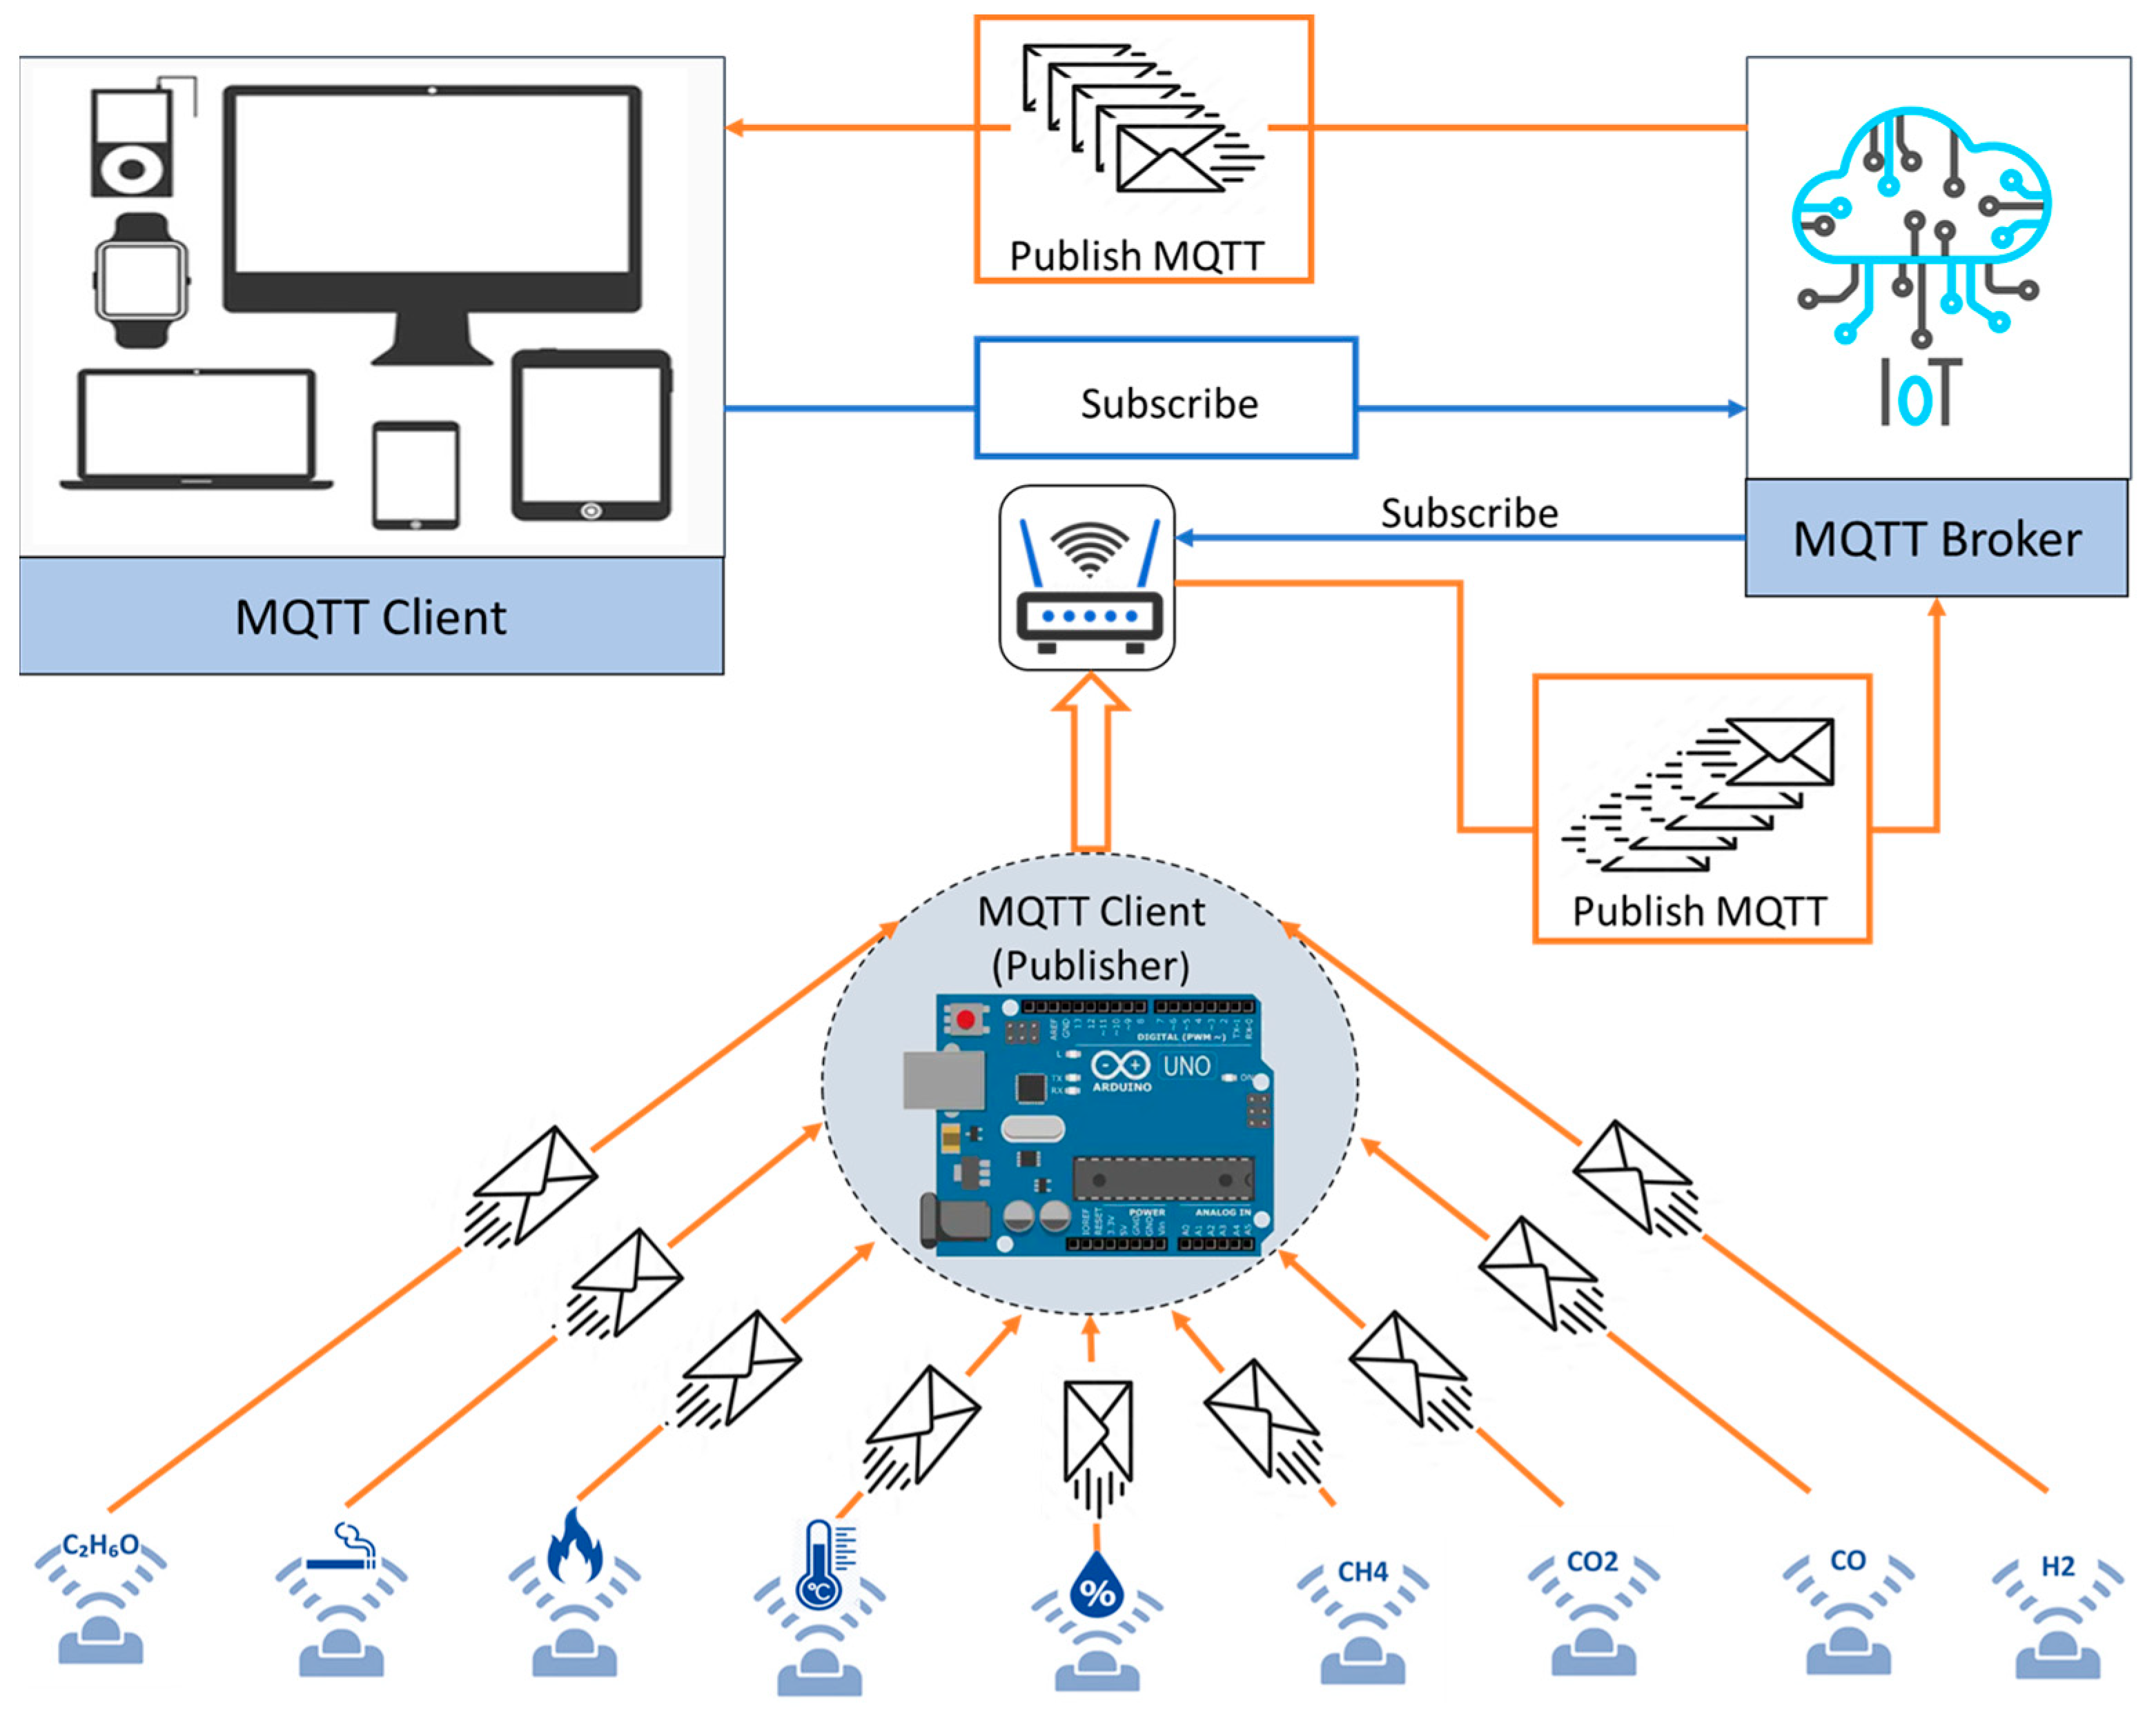
To promote the applicability and commercialization of the proposed model, it is important to develop an interface that is intuitive and user-friendly. The WIFI module of the Arduino Uno embedded system is used to publish data to the Internet through the MQTT web server. The overall workflow for publishing data to the IoT cloud through the MQTT server is presented in Figure 8.
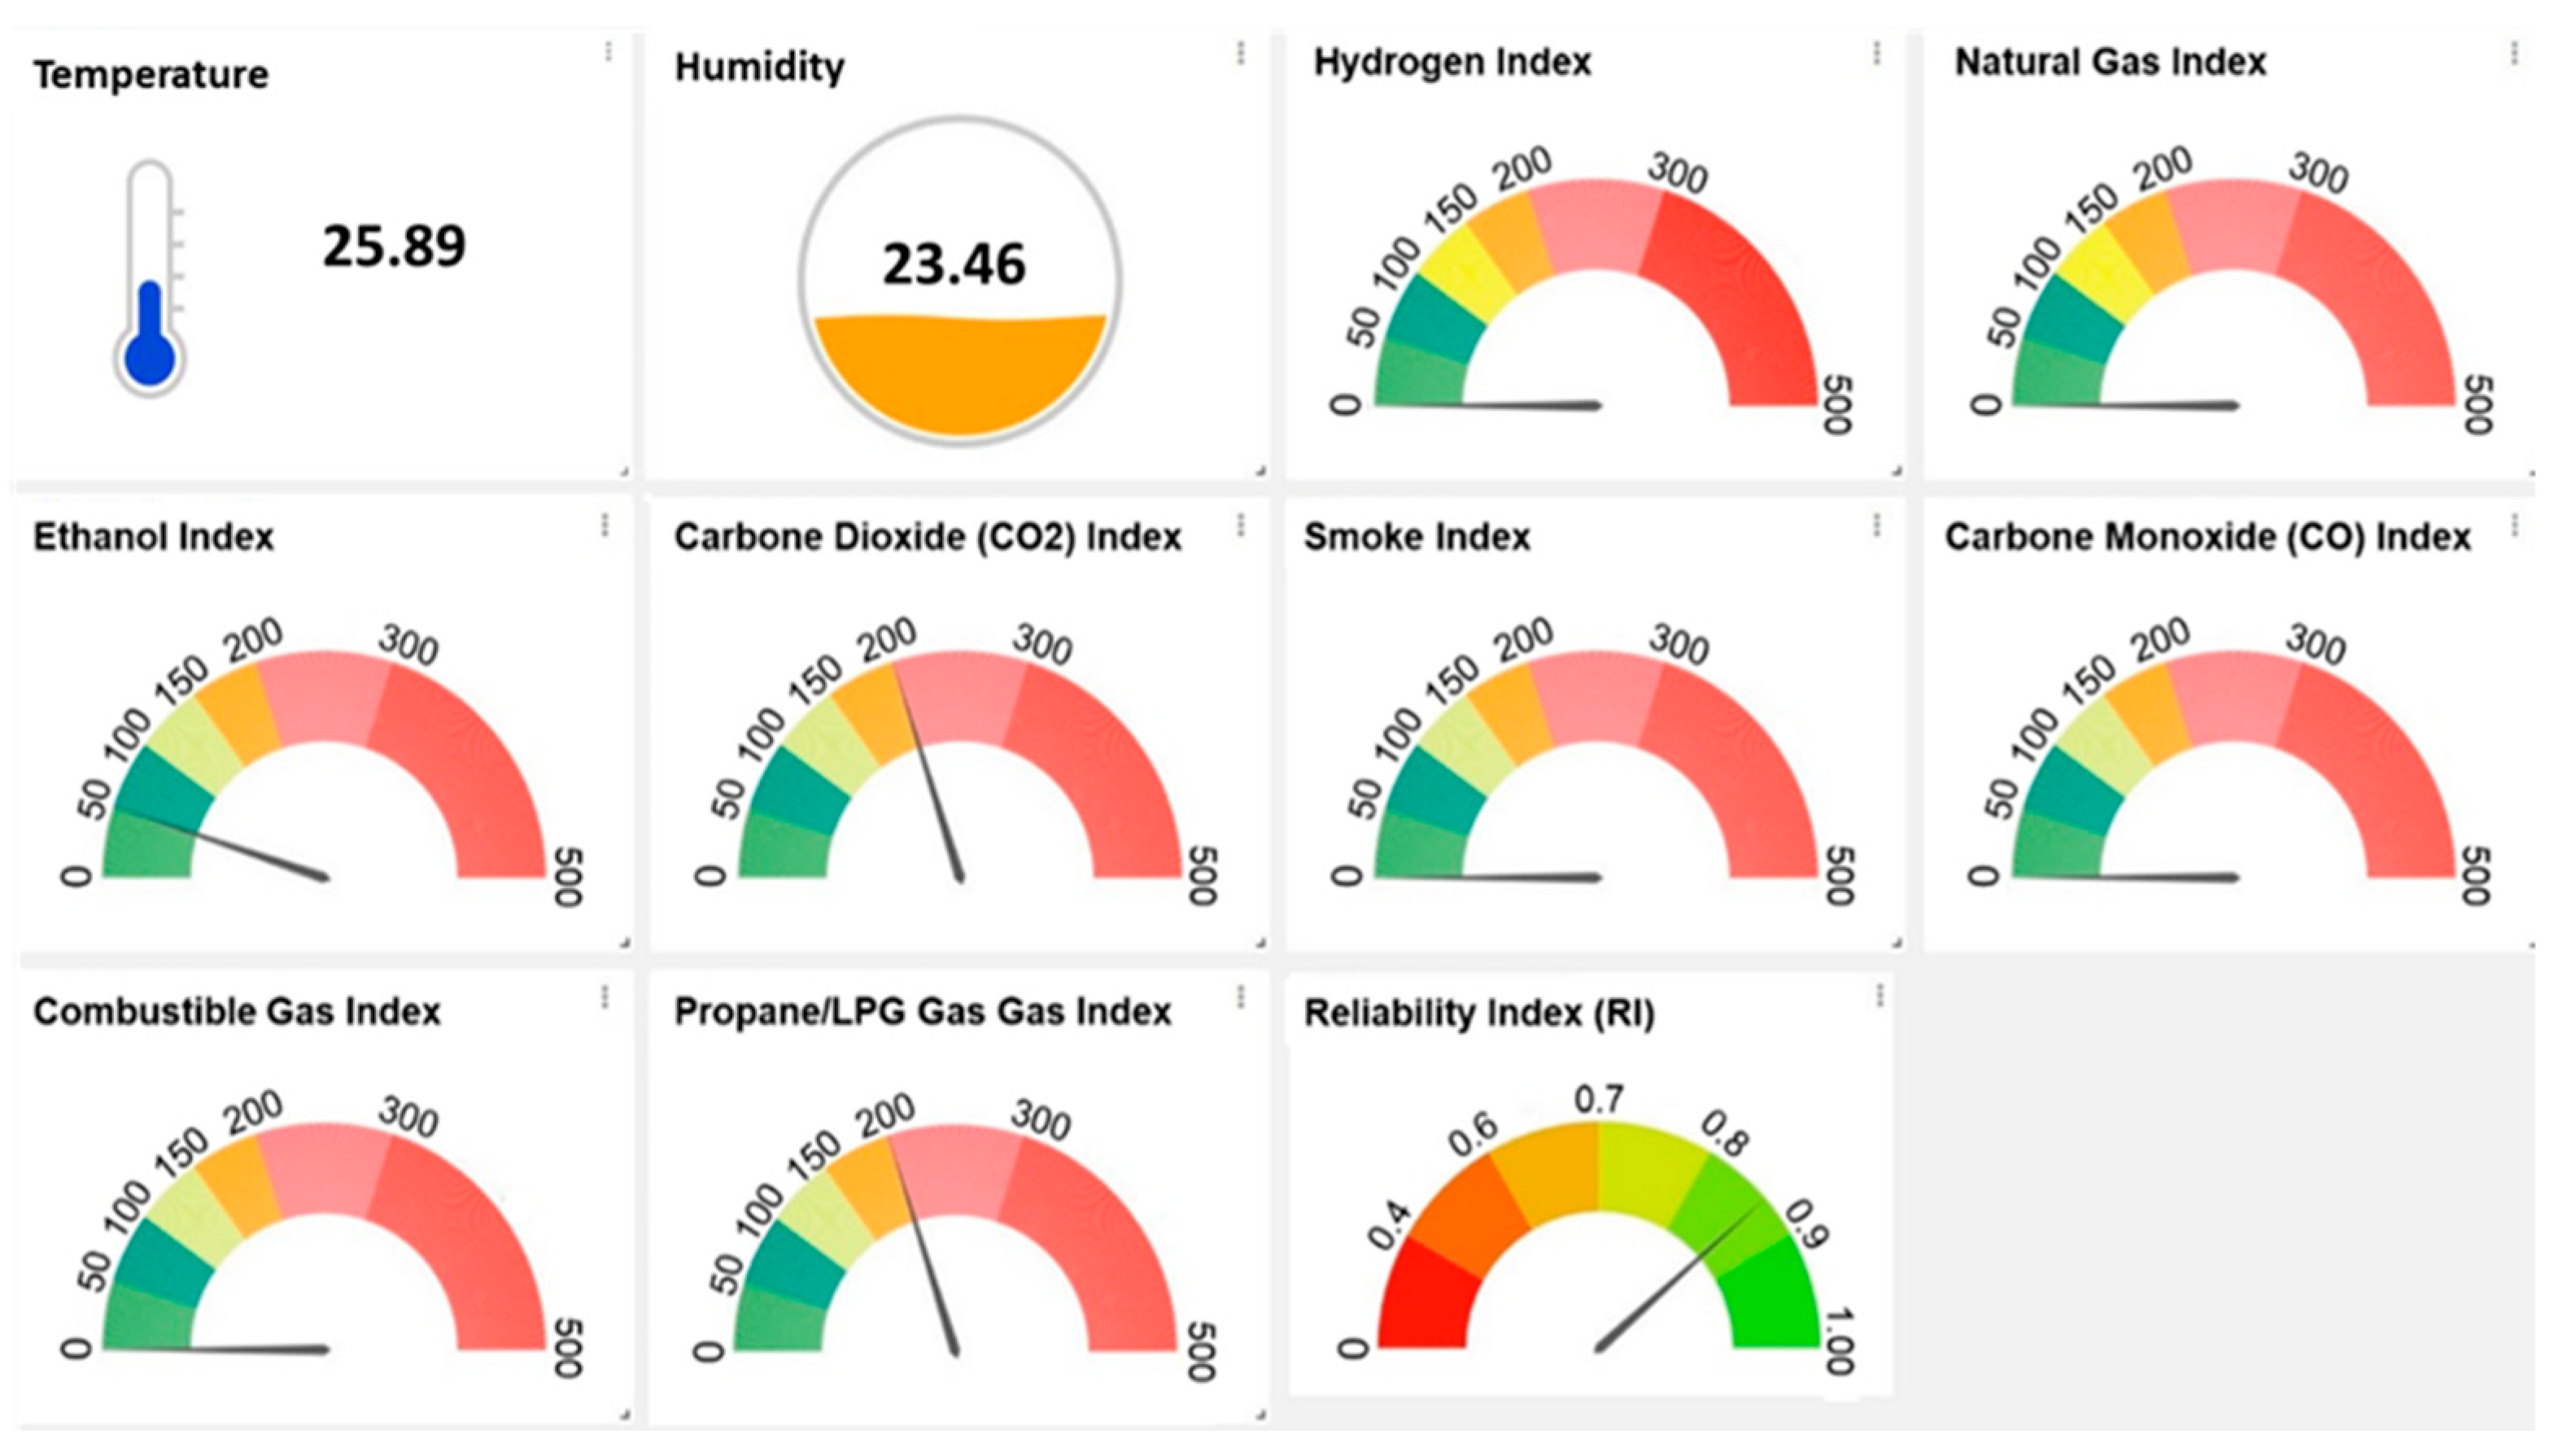
The cloud-based platform, which can be easily accessed by property users and providers, is designed to allow system users to easily visualize and understand the measure metrics. Figure 9 exemplifies the developed graphical interface, which contains the real-time measures of the 10 indicators (i.e., temperature, humidity, hydrogen, etc.), as well as the overall RI that could be used to quantify and assess the reliability of the user of the shared property.
It is to be noted that the sharing economy environment required multiple sensing modules (as shown in Figure 9) in order to accurately track and assess the condition of the shared property based on the 10 different indicators that were identified based on a literature review as well as interviews conducted with different providers of shared properties. More specifically, the sensing modules or indicators used in this paper were those that were determined to be beneficial and important for assessing the reliability of shared properties as well as those that could be influenced by actions taken by the users of the shared properties (i.e., the users could contribute to changes in these indicators). In relation to that, the final list of indicators considered in this paper does not particularly focus on IAQ assessment but rather on evaluating the reliability of the users of shared economies. Since each sensing module (or indicator) reflects a particular measurand of interest, the real-time values of the 10 indicators were displaced separately (see the first 10 visuals in Figure 9). Also, the aggregated reliability index that integrates the values of all sensing modules was also displayed (see the last visual in Figure 9). Such representation is particularly useful since it provides an overall and easy-to-understand assessment of the condition of the shared property as well as insights into what indicators could potentially lead to a lower reliability index or those that could be further improved.
Finally, it is worth noting that the interface is accessible from cellphones, laptops, or any WIFI-connected devices. To ensure data privacy (i.e., the data are not accessible to a third party other than the authorized entities), the authorized providers and users are required to create accounts and must log in to the IoT cloud with preset usernames and passwords to access the system.

4.4. Use of the IoT-Enabled Device

The pilot project (i.e., IoT-enabled dynamic pricing model) was implemented in a smart long-term rental property in Newark, New Jersey, United States for 7 months.
The average RI for the user was calculated at the end of each month (i.e., R I ¯ t ,   where   t = 1 ,   2 ,   , 7 ) and used to determine the reward/penalty term (i.e., R P t ), based on which the final rent for that month was computed (according to Equation (5)). Table 5 shows the rental prices during the 7-month rental period with a base rental price of USD 900/month (i.e., P 0 = 900 ).
The 5th column of Table 5 shows the monthly rental prices computed from the average monthly reliability index (i.e., the 3rd column) and its corresponding reward/penalty term (i.e., the 4th column). For instance, by having a good reliability index (e.g., R I 3 = 0.81 as shown in Table 5), the user was able to exploit a 10% discount (= USD 90) from the base rent of the shared property. However, due to a poor reliability index in month 7 (i.e., R I 7 = 0.62 as shown in Table 5), the user was penalized with a 10% additional charge to the base rent.
The proposed approach in this study is considered to be among the first research efforts that integrate data and information regarding different indicators that could be tracked and assessed to monitor shared properties. In addition, compared to existing or traditional dynamic pricing models existing in the literature which dynamically adjusts price by market supply and demand (i.e., raising prices when demand is strong and cutting prices when demand is weak), the proposed intelligent IoT-enabled dynamic pricing model allows the price to be dynamically determined based on the user reliability (i.e., the proposed model effectively identifies and rewards condition-conscious renters while penalizing condition-unconscious ones). Hence, instead of pricing indifferently, the proposed model rationalizes the rental price while enhancing the transparency between landlords and renters. Ultimately, the proposed approach encourages good and responsible renter behavior, decreases economic losses, reduces risk and uncertainties, and ultimately stimulates shared economy systems.

5. Discussion and Contributions

This research has multiple implications and contributions. The proposed approach in this study integrates data and information regarding different indicators that could be tracked and assessed to monitor shared properties.
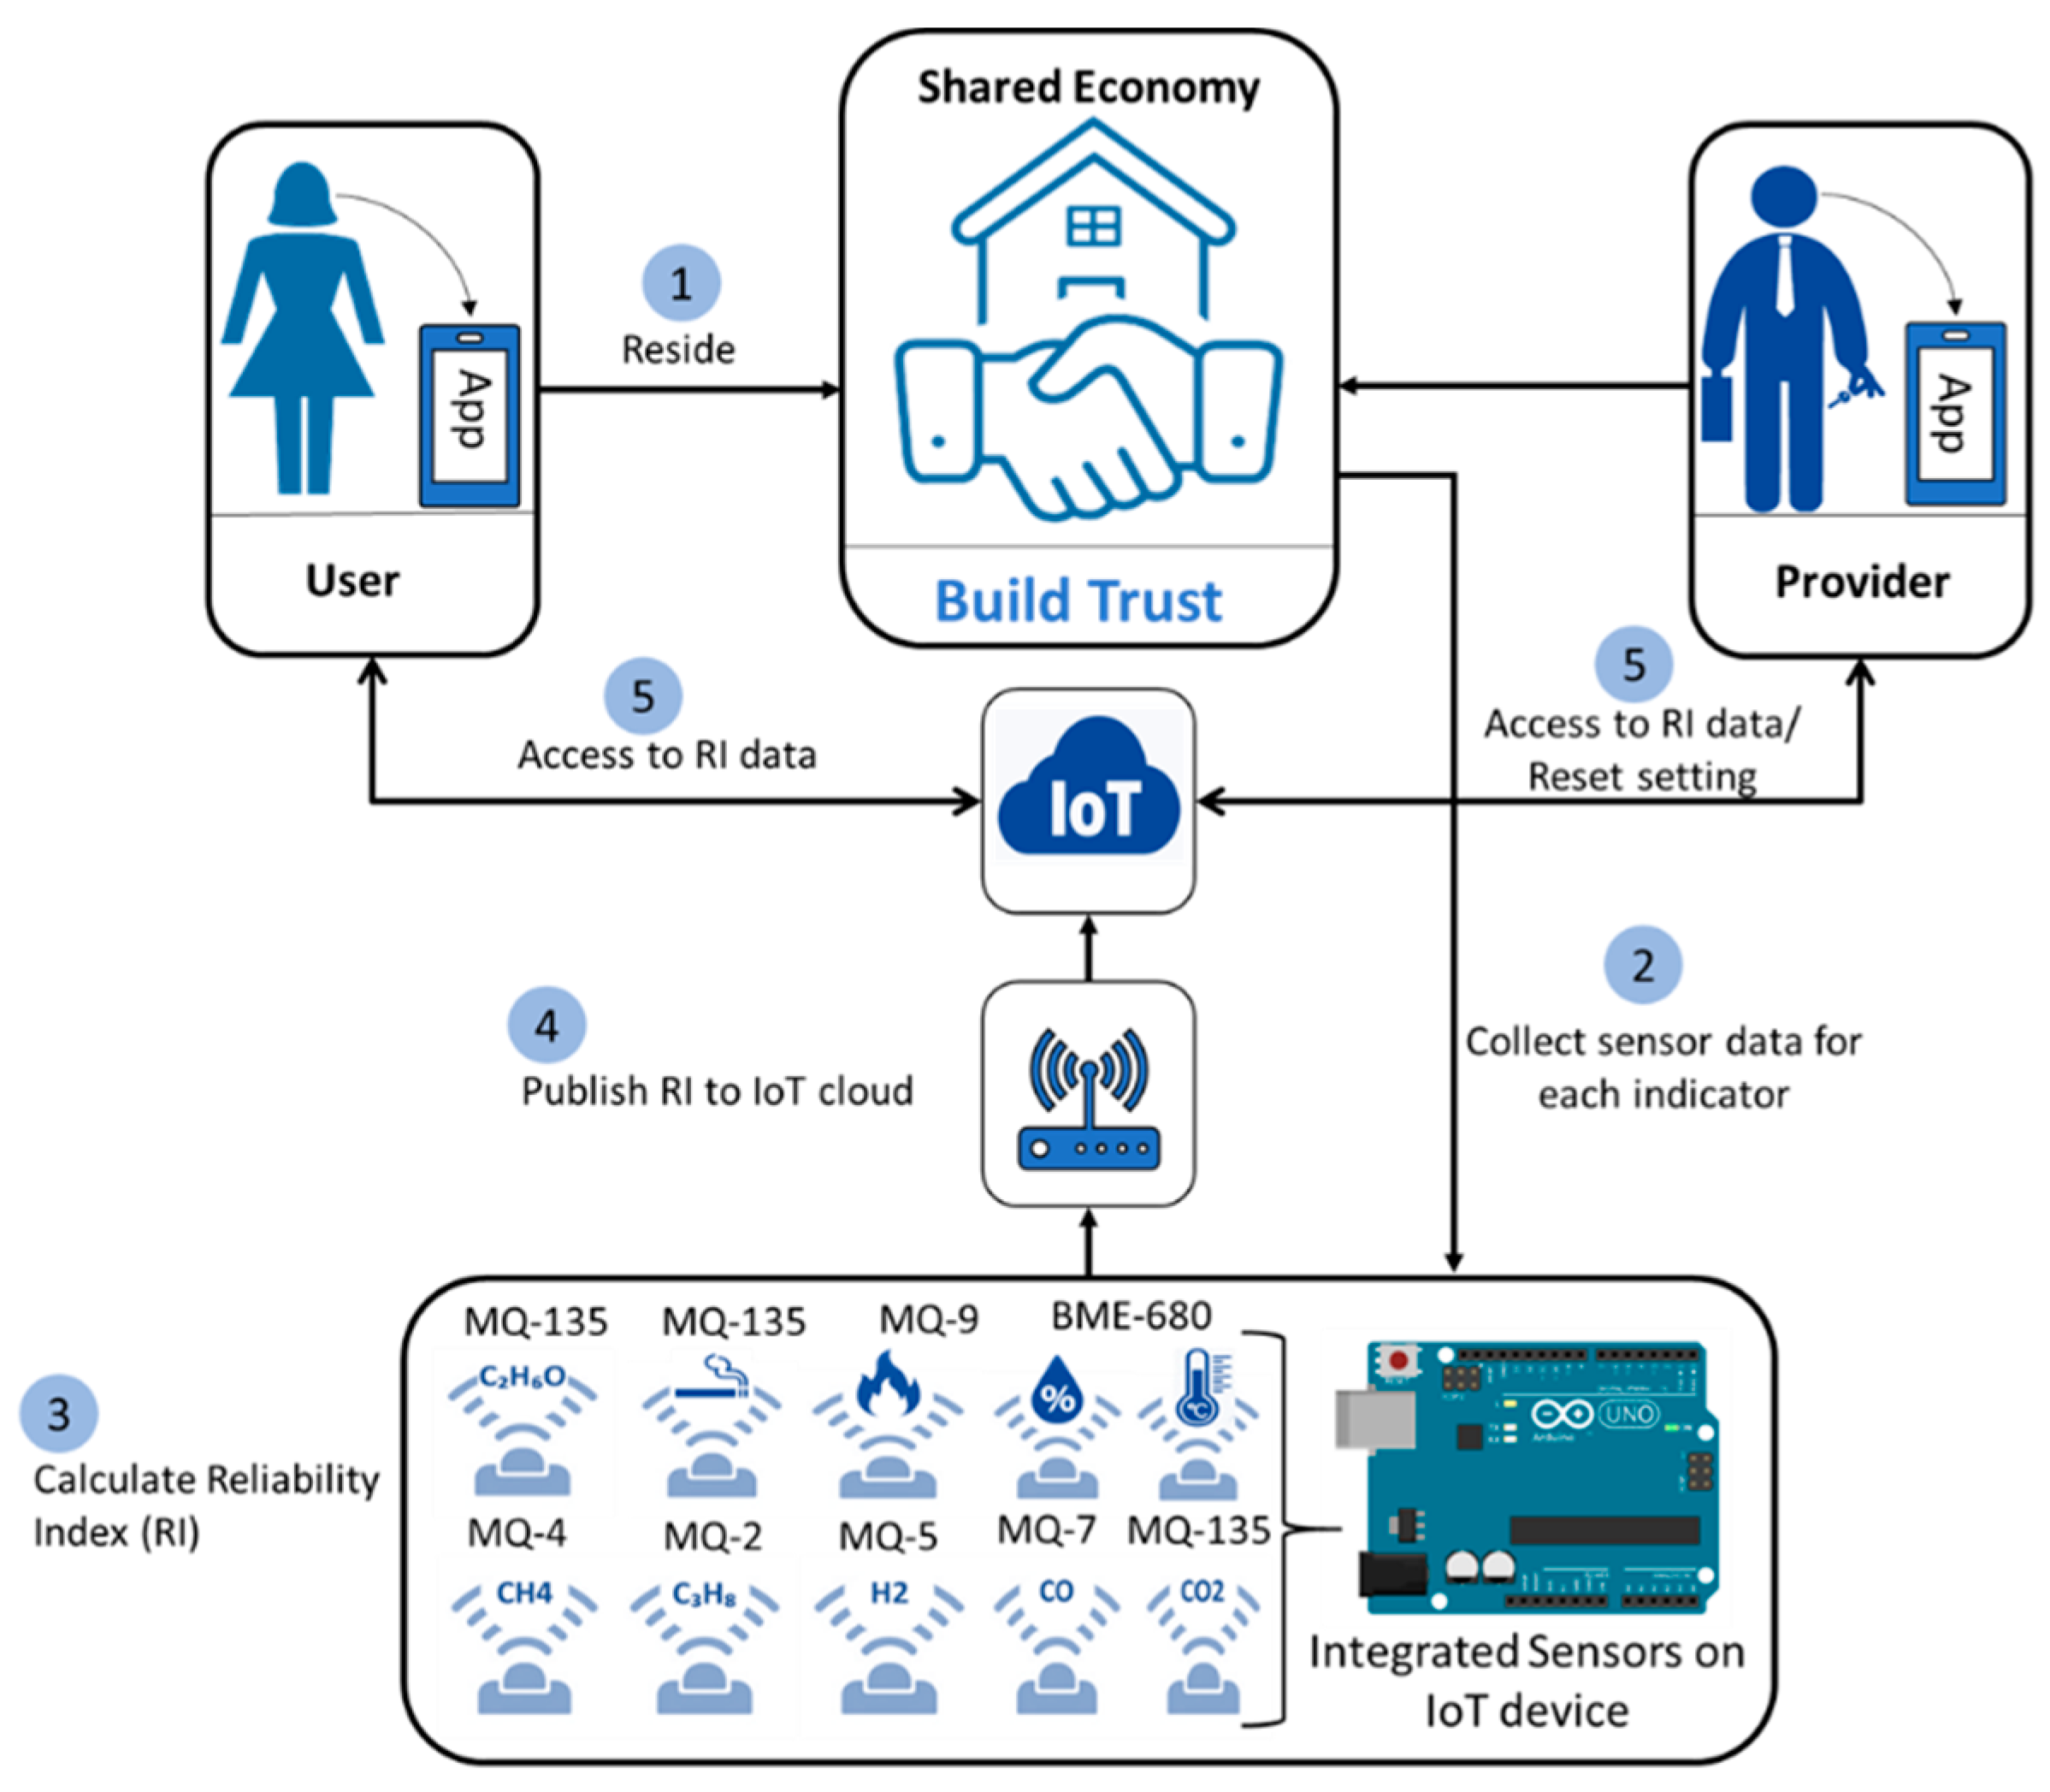
In addition, the proposed incentive-based dynamic pricing mechanism could improve renter behavior. Being aware of the proposed scheme (i.e., reward for good rental condition and penalty for bad rental condition) enforced by the real-time IoT device, a rational renter will try hard to maintain the shared property, which reduces landlords’ costs of maintenance. Eventually, a conscious, virtuous circle (i.e., through rewards and good maintenance) of property maintenance will be created and trusts can be significantly enhanced. Furthermore, equipped with the proposed IoT-enabled dynamic pricing scheme, it will also be easier for the property provider to find good, responsible property users. On the other hand, the real-time information on individual indicators and the overall RI allows the property provider to assess the property condition and potential risks. The IoT-enabled, instant, and transparent information effectively resolves the inherent information asymmetry issue in a shared economy, which enhances resource utilization and rental ethics [70]. Figure 10 illustrates the framework of the proposed model and explains how trust is built in a shared property relationship based on the proposed work in this paper.
In contrast to the traditional dynamic pricing model, which dynamically adjusts price by market supply and demand (i.e., raising prices when demand is strong and cutting prices when demand is weak), the proposed intelligent, IoT-enabled dynamic pricing model allows the price to be dynamically determined based on the user reliability. The proposed model effectively identifies and rewards condition-conscious renters while penalizing condition-unconscious ones. The pilot project was implemented in a long-term rental space for 7 months, and as illustrated in Table 5, the renter was rewarded when the rental space was maintained in good condition and punished otherwise. Instead of pricing indifferently, the proposed model rationalizes the rental price while enhancing the transparency between landlords and renters. The proposed dynamic pricing scheme encourages good, responsible behavior, decreases economic losses, reduces risk and uncertainties, and ultimately stimulates shared economy systems. Furthermore, the RI historical records may have a wide application. A good RI not only suggests good maintenance of a shared property, but an individual with a good RI history also implies his/her responsibility and credibility. In other words, the RI historical records can be applied to screen applications, such as loans, leases, jobs, etc.
The requirements to use the proposed IoT device include the following: (1) having the consent of both the providers and users of the shared economy to install the device in pre-agreed upon location(s) in the property; (2) agreement between the providers and users of the shared property on the base price ( P 0 ) and the reward/penalty term ( R P t ) to be used in the dynamic pricing model; (3) consensus among the providers and users of the shared economy on the indicators and the associated weights to be used for assessing the reliability of the shared property, and (4) establishment of username(s) and password(s) to access the data in real-time. Potential use case challenges might include keeping the device powered up all the time. This could be addressed by powering up the proposed device using an electrical power socket with the needed voltage regulator or through another 3–5 V power source rather than through an external battery that must be constantly changed or recharged. Another potential challenge could include potential privacy concerns that the users might have in relation to sharing information on some of the indicators. However, this could be addressed by having an agreement between the provider and user of the shared economy regarding which indicators to track and measure as well as by having a two-factor authentication process that ensures secure and private access to the data by authorized personnel only.
The proposed device could also be used for building facility management applications. For instance, it could be used to inform and support the functionality, safety, and sustainability of buildings. In relation to that, the developed IoT-enabled device can be used to automatically send alerts to the user and/or provider of the shared property when any of the indicators reach an alarming level. Taking carbon monoxide as an example, the proposed IoT device can be programmed so that whenever the reading of carbon monoxide goes over 1000 ppm (i.e., “very bad” as shown in Table 1) or any other desired threshold, an alert could be sent to both the user and provider to initiate any necessary precautions and prevent hazardous situations.

6. Conclusions

This study developed an intelligent IoT-enabled device to quantify the reliability of users of shared economy systems with a focus on shared properties (i.e., shared rooms or apartments in buildings). The proposed IoT-enabled device integrated sensors that instantly measured 10 indicators to reflect the indoor environmental condition of shared properties. Based on the real-time values of the 10 different indicators, a reliability index was generated to provide a quantitative assessment. Finally, a dynamic pricing model was developed from the reliability index, where condition-conscious users were rewarded with discounted rents and condition-unconscious users were penalized with additional rental fees. The proposed model was implemented in a real-world long-term rental space for 7 months. This research provided insights on how to improve the operational efficiency of the shared economy by offering (1) the providers of shared properties visibility over the condition of their facilities through real-time assessment of the user reliability, which can be accessed remotely from any place using IoT capabilities, and (2) the users of shared properties assured safety and monetary incentives to maintain the shared environment in a good condition. Ultimately, the proposed model in this study can: (1) rationalize rental pricing, (2) improve information transparency and enhance trust between providers and users of shared economies, (3) ensure the safety of property users in the shared economy, (4) raise awareness and reduce property maintenance costs, and (5) ultimately stimulate the shared economy in smart cities.
Ultimately, the results of this study add to the body of knowledge by paving the way for transforming traditional practices in the shared economy towards a more intelligent and sustainable ecosystem whereby both the providers and the users have fewer, or ideally no, regrets for their decisions in their shared environments.
The conducted research in this paper has some limitations. First, the proposed approach in this paper is best applicable to long-term shared properties rather than other types of shared economies (i.e., transportation, utilities, etc.) or short-term shared properties. Thus, future research studies are recommended to build on the proposed approach in this paper and expand it to other types of shared economies. Second, the proposed approach in this paper focuses on 10 indicators that were deemed to be the most relevant to assess the reliability of shared economies. Hence, future research efforts might consider adding more indicators that are relevant to their specific application or case by making any necessary changes to the list of indicators considered in this paper to accommodate the specific requirements of the application’s case of interest. Third, the proposed approach in this paper was mainly focused on assessing the reliability mostly based on different environmental conditions that the user might influence; hence, future studies could be conducted to expand the reliability index by considering other influencing factors such as energy usage patterns, among others. In relation to that, beyond the indicators considered in this study (e.g., temperature, humidity, etc.), the proposed approach can be extended to other elements in a shared economy (i.e., rental space), including water, appliances, etc. Furthermore, future research studies are recommended to build on the proposed dynamic pricing model in this paper and expand it further by developing an e-Auction- based mechanism that could be integrated into the proposed device. This mechanism could be implemented in order to enable the providers and users of shared economy systems to connect directly and to allow users to compete against one another where the user with the highest reliability and the best price will be chosen. This will streamline the procurement process, reduce risks, save both time and money, and improve efficiency by providing a fast, secure, and transparent way to achieve the best match between the providers and users of shared economy systems. Finally, the proposed approach in this paper is scalable and malleable and could be adjusted to be used in shared economy environments other than shared properties such as car sharing, coworking, parking space rental, shared transport vehicles, and furniture sharing, among others. Nevertheless, the list of reliability indicators needs to be changed or adjusted to meet the specific requirements of the application’s case of interest.

Author Contributions

Conceptualization, R.H.A.; methodology, R.H.A., M.M. and A.C.; formal analysis, R.H.A., M.M. and A.C.; data curation, R.H.A. and M.M.; writing—original draft preparation, R.H.A. and M.M.; writing—review and editing, R.H.A. and A.C.; supervision, R.H.A. and A.C.; project administration, R.H.A. and A.C. All authors have read and agreed to the published version of the manuscript.

Funding

This paper is based upon work supported by the Paul Profeta Real Estate Technology, De-sign and Innovation Center (RETDIC). Any opinions, findings, conclusions, or recommendations expressed in this paper are those of the authors and do not necessarily reflect the views of the funding agency.

Data Availability Statement

All data generated or analyzed during the study are included in the published paper.

Conflicts of Interest

The authors declare no conflict of interest.

References

  1. United Nations. World Urbanization Prospects. The 2014 Revision; Department of Economic and Social Affairs: New York, NY, USA, 2015. Available online: http://esa.un.org/unpd/wup/Publications/Files/WUP2014-Report.pdf (accessed on 11 May 2023).
  2. Assaf, G.; Hu, X.; Assaad, R.H. Predicting Urban Heat Island severity on the census-tract level using Bayesian networks. Sustain. Cities Soc. 2023, 97, 104756. [Google Scholar] [CrossRef]
  3. Assaf, G.; Hu, X.; Assaad, R.H. Mining and modeling the direct and indirect causalities among factors affecting the Urban Heat Island severity using structural machine learned Bayesian networks. Urban Clim. 2023, 49, 101570. [Google Scholar] [CrossRef]
  4. Assaf, G.; Assaad, R.H. Optimal Preventive Maintenance, Repair, and Replacement Program for Catch Basins to Reduce Urban Flooding: Integrating Agent-Based Modeling and Monte Carlo Simulation. Sustainability 2023, 15, 8527. [Google Scholar] [CrossRef]
  5. Assaad, R.H.; Assaf, G.; Boufadel, M. Optimizing the maintenance strategies for a network of green infrastructure: An agent-based model for stormwater detention basins. J. Environ. Manag. 2023, 330, 117179. [Google Scholar] [CrossRef]
  6. Bibri, S.E.; Krogstie, J. Smart sustainable cities of the future: An extensive interdisciplinary literature review. Sustain. Cities Soc. 2017, 31, 183–212. [Google Scholar] [CrossRef]
  7. Rejeb, A.; Rejeb, K.; Simske, S.; Treiblmaier, H.; Zailani, S. The big picture on the internet of things and the smart city: A review of what we know and what we need to know. Internet Things 2022, 19, 100565. [Google Scholar] [CrossRef]
  8. Alaei, A. The Impact of Real Estate Technology on Smart City Stakeholders. Master’s Thesis, Metropolia University of Applied Sciences, Helsinki, Finland, 2020. [Google Scholar]
  9. United Nations. Collection Methodology for Key Performance Indicators for Smart Sustainable Cities. 2017. Available online: https://unece.org/DAM/hlm/documents/Publications/U4SSC-CollectionMethodologyforKPIfoSSC-2017.pdf (accessed on 11 May 2023).
  10. Kim, T.H.; Ramos, C.; Mohammed, S. Smart city and IoT. Future Gener. Comput. Syst. 2017, 76, 159–162. [Google Scholar] [CrossRef]
  11. Cannon, B.; Chung, H. A framework for designing co-regulation models well-adapted to technology-facilitated sharing economies. Santa Clara Comput. High Tech. Law J. 2014, 31, 23. [Google Scholar]
  12. Muñoz, P.; Cohen, B. Mapping out the sharing economy: A configurational approach to sharing business modeling. Technol. Forecast. Soc. Chang. 2017, 125, 21–37. [Google Scholar] [CrossRef]
  13. Zeng, Y.; Gu, J.; Qian, W.; Wu, S.; Zhu, J. The Current Situation and Problems of the Shared Economy. 2018. Available online: https://pdf.hanspub.org/ECL20180300000_89941131.pdf (accessed on 24 August 2023).
  14. Scott, G. Sharing Economy: Model Defined, Criticisms, and How It’s Evolving. 2020. Available online: https://www.investopedia.com/terms/s/sharing-economy.asp (accessed on 12 July 2023).
  15. Vaidya, D. Sharing Economy. 2023. Available online: https://www.wallstreetmojo.com/sharing-economy/ (accessed on 12 May 2023).
  16. Diana, L.; Ștefan, V. The Evolution of the Collaborative/Shared Economy on Demand and its Impact on Fiscal Systems. Ovidius Univ. Ann. Econ. Sci. Ser. 2022, 22, 838–845. [Google Scholar]
  17. Sergio. Who Puts the “Smart” in Smart Cities? 2015. Available online: https://medium.com/smartcityworld/who-puts-the-smart-in-smart-cities-ef41881d57d7 (accessed on 10 May 2023).
  18. Pristovnik, A. Business Models in the Sharing Economy. 2020. Available online: https://tridenstechnology.com/business-models-in-the-sharing-economy/ (accessed on 13 July 2023).
  19. Blasi, S.; Ganzaroli, A.; De Noni, I. Smartening sustainable development in cities: Strengthening the theoretical linkage between smart cities and SDGs. Sustain. Cities Soc. 2022, 80, 103793. [Google Scholar] [CrossRef]
  20. Mohammed, A.A.J.; Burhanuddin, M.A.; Basiron, H.; Tunggal, D. Key enablers of IoT strategies in the context of smart city innovation. J. Adv. Res. Dyn. Control Syst. 2018, 10, 582–589. [Google Scholar]
  21. Novotný, R.; Kuchta, R.; Kadlec, J. Smart city concept, applications and services. J. Telecommun. Syst. Manag. 2014, 3, 1–5. [Google Scholar]
  22. Ahad, M.A.; Paiva, S.; Tripathi, G.; Feroz, N. Enabling technologies and sustainable smart cities. Sustain. Cities Soc. 2020, 61, 102301. [Google Scholar] [CrossRef]
  23. Matuszak, J. The Rise of IoT in Smart Cities. 2023. Available online: https://knowhow.distrelec.com/internet-of-things/the-rise-of-iot-in-smart-cities/ (accessed on 12 March 2023).
  24. Lv, Z.; Hu, B.; Lv, H. Infrastructure Monitoring and Operation for Smart Cities Based on IoT System. IEEE Trans. Ind. Inform. 2019, 16, 1957–1962. [Google Scholar] [CrossRef]
  25. Shah, J.; Mishra, B. IoT enabled environmental monitoring system for smart cities. In Proceedings of the 2016 International Conference on Internet of Things and Applications (IOTA), Pune, India, 22–24 January 2016; pp. 383–388. [Google Scholar]
  26. Liu, Y.; Yang, C.; Jiang, L.; Xie, S.; Zhang, Y. Intelligent edge computing for IoT-based energy management in smart cities. IEEE Netw. 2019, 33, 111–117. [Google Scholar] [CrossRef]
  27. Sharma, A.; Singh, P.K.; Kumar, Y. An integrated fire detection system using IoT and image processing technique for smart cities. Sustain. Cities Soc. 2020, 61, 102332. [Google Scholar] [CrossRef]
  28. Swain, M.; Zimon, D.; Singh, R.; Hashmi, M.F.; Rashid, M.; Hakak, S. LoRa-LBO: An Experimental Analysis of LoRa Link Budget Optimization in Custom Build IoT Test Bed for Agriculture 4.0. Agronomy 2021, 11, 820. [Google Scholar] [CrossRef]
  29. Xu, J.; Li, D.; Gu, W.; Chen, Y. UAV-assisted task offloading for IoT in smart buildings and environment via deep reinforcement learning. Build. Environ. 2022, 222, 109218. [Google Scholar] [CrossRef]
  30. Tekler, Z.D.; Low, R.; Yuen, C.; Blessing, L. Plug-Mate: An IoT-based occupancy-driven plug load management system in smart buildings. Build. Environ. 2022, 223, 109472. [Google Scholar] [CrossRef]
  31. Liu, Y.; Pang, Z.; Karlsson, M.; Gong, S. Anomaly detection based on machine learning in IoT-based vertical plant wall for indoor climate control. Build. Environ. 2020, 183, 107212. [Google Scholar] [CrossRef]
  32. Shahinmoghadam, M.; Natephra, W.; Motamedi, A. BIM-and IoT-based virtual reality tool for real-time thermal comfort assessment in building enclosures. Build. Environ. 2021, 199, 107905. [Google Scholar] [CrossRef]
  33. Brik, B.; Esseghir, M.; Merghem-Boulahia, L.; Snoussi, H. An IoT-based deep learning approach to analyse indoor thermal comfort of disabled people. Build. Environ. 2021, 203, 108056. [Google Scholar] [CrossRef]
  34. Li, K.; Zhao, J.; Hu, J.; Chen, Y. Dynamic energy efficient task offloading and resource allocation for NOMA-enabled IoT in smart buildings and environment. Build. Environ. 2022, 226, 109513. [Google Scholar] [CrossRef]
  35. Jeon, Y.; Cho, C.; Seo, J.; Kwon, K.; Park, H.; Oh, S.; Chung, I.J. IoT-based occupancy detection system in indoor residential environments. Build. Environ. 2018, 132, 181–204. [Google Scholar] [CrossRef]
  36. Luna-Navarro, A.; Fidler, P.; Law, A.; Torres, S.; Overend, M. Building Impulse Toolkit (BIT): A novel IoT system for capturing the influence of façades on occupant perception and occupant-façade interaction. Build. Environ. 2021, 193, 107656. [Google Scholar] [CrossRef]
  37. Swaminathan, S.; Guntuku, A.V.S.; Sumeer, S.; Gupta, A.; Rengaswamy, R. Data science and IoT based mobile monitoring framework for hyper-local PM2.5 assessment in urban setting. Build. Environ. 2022, 225, 109597. [Google Scholar] [CrossRef]
  38. Wu, H.; Li, L.; Liu, Y.; Wu, X. Vehicle-based secure location clustering for IoT-equipped building and facility management in smart city. Build. Environ. 2022, 214, 108937. [Google Scholar] [CrossRef]
  39. Low, R.; Cheah, L.; You, L. Commercial Vehicle Activity Prediction with Imbalanced Class Distribution Using a Hybrid Sampling and Gradient Boosting Approach. IEEE Trans. Intell. Transp. Syst. 2020, 22, 1401–1410. [Google Scholar] [CrossRef]
  40. Zhuang, D.; Gan, V.J.; Tekler, Z.D.; Chong, A.; Tian, S.; Shi, X. Data-driven predictive control for smart HVAC system in IoT-integrated buildings with time-series forecasting and reinforcement learning. Appl. Energy 2023, 338, 120936. [Google Scholar] [CrossRef]
  41. Tekler, Z.D.; Low, R.; Zhou, Y.; Yuen, C.; Blessing, L.; Spanos, C. Near-real-time plug load identification using low-frequency power data in office spaces: Experiments and applications. Appl. Energy 2020, 275, 115391. [Google Scholar] [CrossRef]
  42. Hamari, J.; Sjöklint, M.; Ukkonen, A. The sharing economy: Why people participate in collaborative consumption. J. Assoc. Inf. Sci. Technol. 2016, 67, 2047–2059. [Google Scholar] [CrossRef]
  43. Koźlak, A. The relationship between the concepts of sharing economy and smart cities: The case of shared mobility and smart transport. Int. J. Sustain. Soc. 2020, 12, 152–184. [Google Scholar] [CrossRef]
  44. Karentay. The Sharing Economy Tackles One of the Biggest Issues Every Modern City Faces—Inequality. 2017. Available online: https://techandpublicgood.com/2017/01/15/the-sharing-economy-can-address-one-of-the-biggest-issues-every-modern-city-faces-inequality/ (accessed on 10 May 2023).
  45. Alekhin, V. Building Resilience: Key Takeaways on Smart Cities from the ChangeNOW Summit (Paris, September 28–29, 2018). 2018. Available online: https://www.linkedin.com/pulse/building-resilience-key-takeaways-smart-cities-from-summit-starikova/ (accessed on 10 May 2023).
  46. Stemler, A. Betwixt and between: Regulating the sharing economy. Fordham Urban Law J. 2016, 43, 31–70. [Google Scholar] [CrossRef]
  47. Huckle, S.; Bhattacharya, R.; White, M.; Beloff, N. Internet of Things, Blockchain and Shared Economy Applications. Procedia Comput. Sci. 2016, 98, 461–466. [Google Scholar] [CrossRef]
  48. Wu, X.; Zhi, Q. Impact of Shared Economy on Urban Sustainability: From the Perspective of Social, Economic, and Environmental Sustainability. Energy Procedia 2016, 104, 191–196. [Google Scholar] [CrossRef]
  49. David, B.; Chalon, R.; Yin, C. Collaborative systems & shared economy (uberization): Principles & case study. In Proceedings of the 2016 International Conference on Collaboration Technologies and Systems (CTS), Orlando, FL, USA, 31 October–4 November 2016; pp. 57–63. [Google Scholar]
  50. Dirgová, E.; Janičková, J.; Klencová, J. New trends in the labor market in the context of shared economy. TEM J. 2018, 7, 791. [Google Scholar]
  51. Chaudhari, S.L.; Sinha, M. A study on emerging trends in Indian startup ecosystem: Big data, crowd funding, shared economy. Int. J. Innov. Sci. 2021, 13, 1–16. [Google Scholar] [CrossRef]
  52. Kalašová, A.; Harantová, V.; Čulík, K. Public Transport as a Part of Shared Economy. Arch. Automot. Eng. Arch. Mot. 2019, 85, 49–56. [Google Scholar] [CrossRef]
  53. Kupriyanovsky, V.; Sinyagov, S.; Klimov, A.; Petrov, A.; Namiot, D. Digital supply chains and blockchain-based technologies in a shared economy. Int. J. Open Inf. Technol. 2017, 5, 80–95. [Google Scholar]
  54. Song, M.; Meng, J.; Lin, G.; Cai, Y.; Gao, C.; Chen, T.; Xu, H. Applications of shared economy in smart grids: Shared energy storage and transactive energy. Electr. J. 2022, 35, 107128. [Google Scholar] [CrossRef]
  55. Marques, G.; Pitarma, R.; Mujeebu, M.A. Indoor air quality monitoring for enhanced healthy buildings. In Indoor Environmental Quality; InTech: London, UK, 2018; pp. 1–18. [Google Scholar]
  56. Marques, G.; Ferreira, C.R.; Pitarma, R. Indoor Air Quality Assessment Using a CO2 Monitoring System Based on Internet of Things. J. Med. Syst. 2019, 43, 67. [Google Scholar] [CrossRef] [PubMed]
  57. Salamone, F.; Belussi, L.; Danza, L.; Ghellere, M.; Meroni, I. How to control the Indoor Environmental Quality through the use of the Do-It-Yourself approach and new pervasive technologies. Energy Procedia 2017, 140, 351–360. [Google Scholar] [CrossRef]
  58. Ciribini, A.L.; Pasini, D.; Tagliabue, L.C.; Manfren, M.; Daniotti, B.; Rinaldi, S.; De Angelis, E. Tracking users’ behaviors through real-time information in BIMs: Workflow for interconnection in the Brescia Smart Campus Demonstrator. Procedia Eng. 2017, 180, 1484–1494. [Google Scholar] [CrossRef]
  59. Molka-Danielsen, J.; Engelseth, P.; Wang, H. Large scale integration of wireless sensor network technologies for air quality monitoring at a logistics shipping base. J. Ind. Inf. Integr. 2018, 10, 20–28. [Google Scholar] [CrossRef]
  60. Martín-Garín, A.; Millán-García, J.; Baïri, A.; Millán-Medel, J.; Sala-Lizarraga, J. Environmental monitoring system based on an Open Source Platform and the Internet of Things for a building energy retrofit. Autom. Constr. 2018, 87, 201–214. [Google Scholar] [CrossRef]
  61. Kim, J.-Y.; Chu, C.-H.; Shin, S.-M. ISSAQ: An Integrated Sensing Systems for Real-Time Indoor Air Quality Monitoring. IEEE Sensor. J. 2014, 14, 4230–4244. [Google Scholar] [CrossRef]
  62. Marques, G.; Pitarma, R. Health informatics for indoor air quality monitoring. In Proceedings of the 2016 11th Iberian Conference on Information Systems and Technologies (CISTI), Gran Canaria, Spain, 15–18 June 2016; pp. 1–6. [Google Scholar]
  63. Pitarma, R.; Marques, G.; Ferreira, B.R. Monitoring Indoor Air Quality for Enhanced Occupational Health. J. Med. Syst. 2017, 41, 23. [Google Scholar] [CrossRef]
  64. Lee, C.L.; Lee, J.S. Development of indoor air quality supervision systems using zigbee wireless networks. In Proceedings of the 2018 13th IEEE Conference on Industrial Electronics and Applications (ICIEA), Wuhan, China, 31 May–2 June 2018; pp. 95–98. [Google Scholar]
  65. Yang, X.; Yang, L.; Zhang, J. A WiFi-enabled indoor air quality monitoring and control system: The design and control experiments. In Proceedings of the 2017 13th IEEE International Conference on Control & Automation (ICCA), Ohrid, Macedonia, 3–6 July 2017; pp. 927–932. [Google Scholar]
  66. Kodali, R.K.; Sarjerao, B.S. MQTT based air quality monitoring. In Proceedings of the 2017 IEEE Region 10 Humanitarian Technology Conference (R10-HTC), Dhaka, Bangladesh, 21–23 December 2017; pp. 742–745. [Google Scholar]
  67. Tang, X.; Luo, Y.; Zhou, P.; Lowe, B. Regulating sharing platforms in lateral exchange markets: The role of power and trust. Eur. J. Mark. 2023, 57, 1014–1036. [Google Scholar] [CrossRef]
  68. Walsh, C.; Saxena, D.; Muzellec, L. AirBnB: Managing trust and safety on a platform business. Ir. J. Manag. 2020, 39, 126–134. [Google Scholar] [CrossRef]
  69. Sthapit, E.; Björk, P.; Jimenez Barreto, J. Negative memorable experience: North American and British Airbnb guests’ perspectives. Tour. Rev. 2021, 76, 639–653. [Google Scholar] [CrossRef]
  70. Deng, T.; Zhang, K.; Shen, Z.-J.M. A systematic review of a digital twin city: A new pattern of urban governance toward smart cities. J. Manag. Sci. Eng. 2021, 6, 125–134. [Google Scholar] [CrossRef]
  71. ASHRAE 55-2017; Thermal Environmental Conditions for Human Occupancy. ASHRAE (The American Society of Heating, Refrigerating and Air-Conditioning Engineers): Peachtree Corners, GA, USA, 2017. Available online: https://www.techstreet.com/ashrae/standards/ashrae-55-2017?product_id=1994974 (accessed on 11 May 2023).
  72. ASHRAE 55 (The American Society of Heating, Refrigerating and Air-Conditioning Engineers). ASHRAE Technical FAQ. 2017. Available online: https://www.ashrae.org/File%20Library/Technical%20Resources/Technical%20FAQs/TC-02.01-FAQ-92.pdf (accessed on 26 June 2023).
  73. ASHRAE. Humidifiers. In ASHRAE Handbook; ASHRAE: Peachtree Corners, GA, USA, 2016; Available online: https://www.ashrae.org/file%20library/technical%20resources/covid-19/i-p_s16_ch22humidifiers.pdf (accessed on 26 June 2023).
  74. OSHA (Occupational Safety and Health Administration). Butane. 2020. Available online: https://www.osha.gov/chemicaldata/49 (accessed on 26 June 2023).
  75. OSHA (Occupational Safety and Health Administration). Occupational Health Guideline for LPG. 2020. Available online: https://www.cdc.gov/niosh/docs/81-123/pdfs/0372.pdf (accessed on 26 June 2023).
  76. OSHA (Occupational Safety and Health Administration). Propane. 2020. Available online: https://www.osha.gov/chemicaldata/563 (accessed on 26 June 2023).
  77. NIOSH (National Institute for Occupational Safety and Health). L.P.G. 2014. Available online: https://www.cdc.gov/niosh/idlh/68476857.html#:~:text=Basis%20for%20revised%20IDLH%3A%20Because,and%202.1%25%20for%20propane (accessed on 26 June 2023).
  78. Norway Administrative Norms for Contaminants in the Workplace. Safety Data Sheet. 2013. Available online: https://www.valero.com/sites/default/files/2019-12/2010_butane_-_liquefied_petroleum_gas_lpg_rev5.pdf (accessed on 26 June 2023).
  79. NIOSH (National Institute for Occupational Safety and Health). Chlorobromomethane. 2014. Available online: https://www.cdc.gov/niosh/idlh/74975.html (accessed on 26 June 2023).
  80. New Jersey Department of Health. Hazardous Substance Fact Sheet. 2016. Available online: https://nj.gov/health/eoh/rtkweb/documents/fs/1202.pdf (accessed on 26 June 2023).
  81. Department of Environmental Quality. Occupational Air Contaminants. 2023. Available online: https://rules.mt.gov/gateway/ShowRuleVersionFile.asp?RVID=14244 (accessed on 26 June 2023).
  82. NIOSH (National Institute for Occupational Safety and Health). Hydrogen sulfide. 2014. Available online: https://www.cdc.gov/niosh/idlh/7783064.html (accessed on 26 June 2023).
  83. NIOSH (National Institute for Occupational Safety and Health). Carbon monoxide. 2014. Available online: https://www.cdc.gov/niosh/idlh/630080.html (accessed on 26 June 2023).
  84. US EPA (The United States Environmental Protection Agency). Carbon Monoxide Levels Chart. 2023. Available online: https://www.co2meter.com/blogs/news/carbon-monoxide-levels-chart#:~:text=ACGIH%20Carbon%20Monoxide%20Levels%20Exposure%20Limits&text=The%20ACGIH%20recommends%20a%20Threshold,exposure%20limit%20of%20400%20ppm (accessed on 26 June 2023).
  85. OSHA (Occupational Safety and Health Administration). OSHA Carbone Monoxide Fact Sheet. 2002. Available online: https://www.energy.gov/sites/prod/files/2016/06/f32/OSHA_carbonmonoxide-factsheet.pdf (accessed on 26 June 2023).
  86. NIOSH (National Institute for Occupational Safety and Health). Propane. 2014. Available online: https://www.cdc.gov/niosh/idlh/74986.html (accessed on 26 June 2023).
  87. National Library Medicine. Acute Exposure Guideline Levels for Selected Airborne Chemicals. 2012. Available online: https://www.ncbi.nlm.nih.gov/books/NBK201461/ (accessed on 2 July 2023).
  88. NIOSH (National Institute for Occupational Safety and Health). Occupational Health Guideline for Diethylamino Ethanol. 2014. Available online: https://www.cdc.gov/niosh/docs/81-123/pdfs/0210.pdf?id=10.26616/NIOSHPUB81123 (accessed on 26 June 2023).
  89. National Library Medicine. Emergency and Continuous Exposure Limits. 1984. Available online: https://www.ncbi.nlm.nih.gov/books/NBK208299/ (accessed on 26 June 2023).
  90. New Jersey Department of Health. Hazardous Substance Fact Sheet. 2016. Available online: https://nj.gov/health/eoh/rtkweb/documents/fs/1076.pdf (accessed on 26 June 2023).
  91. NIOSH (National Institute for Occupational Safety and Health). Toluene. 2014. Available online: https://www.cdc.gov/niosh/idlh/108883.html (accessed on 26 June 2023).
  92. EN 13779; Indoor Air Quality—IAQ. European Standard: Brussels, Belgium, 2007. Available online: http://www.camfil.ee/sites/default/files/docs/IAQ_Indoor_Air_Quality_EN-GB%5B1%5D.pdf (accessed on 26 June 2023).
  93. Zorić, M.; Simić, M.; Orlović, S.; Mladenović, E.; Babić, Z. Indoor Ecosystem Services: Impacts of Plants on Air Quality. Contemp. Agric. 2019, 68, 12–16. [Google Scholar] [CrossRef]
  94. Rehman, S.; Khan, M.F.; Kim, H.-D.; Kim, S. Analog–digital hybrid computing with SnS2 memtransistor for low-powered sensor fusion. Nat. Commun. 2022, 13, 2804. [Google Scholar] [CrossRef]
  95. OAQPS (Office of Air Quality Planning and Standards). 2018. Available online: https://www.airnow.gov/publications/air-quality-index/technical-assistance-document-for-reporting-the-daily-aqi/ (accessed on 11 May 2023).
  96. Jooshaki, M.; Abbaspour, A.; Fotuhi-Firuzabad, M.; Moeini-Aghtaie, M.; Ozdemir, A. A new reward-penalty mechanism for distribution companies based on concept of competition. In Proceedings of the IEEE PES Innovative Smart Grid Technologies, Istanbul, Turkey, 12–15 October 2014; pp. 1–5. [Google Scholar]
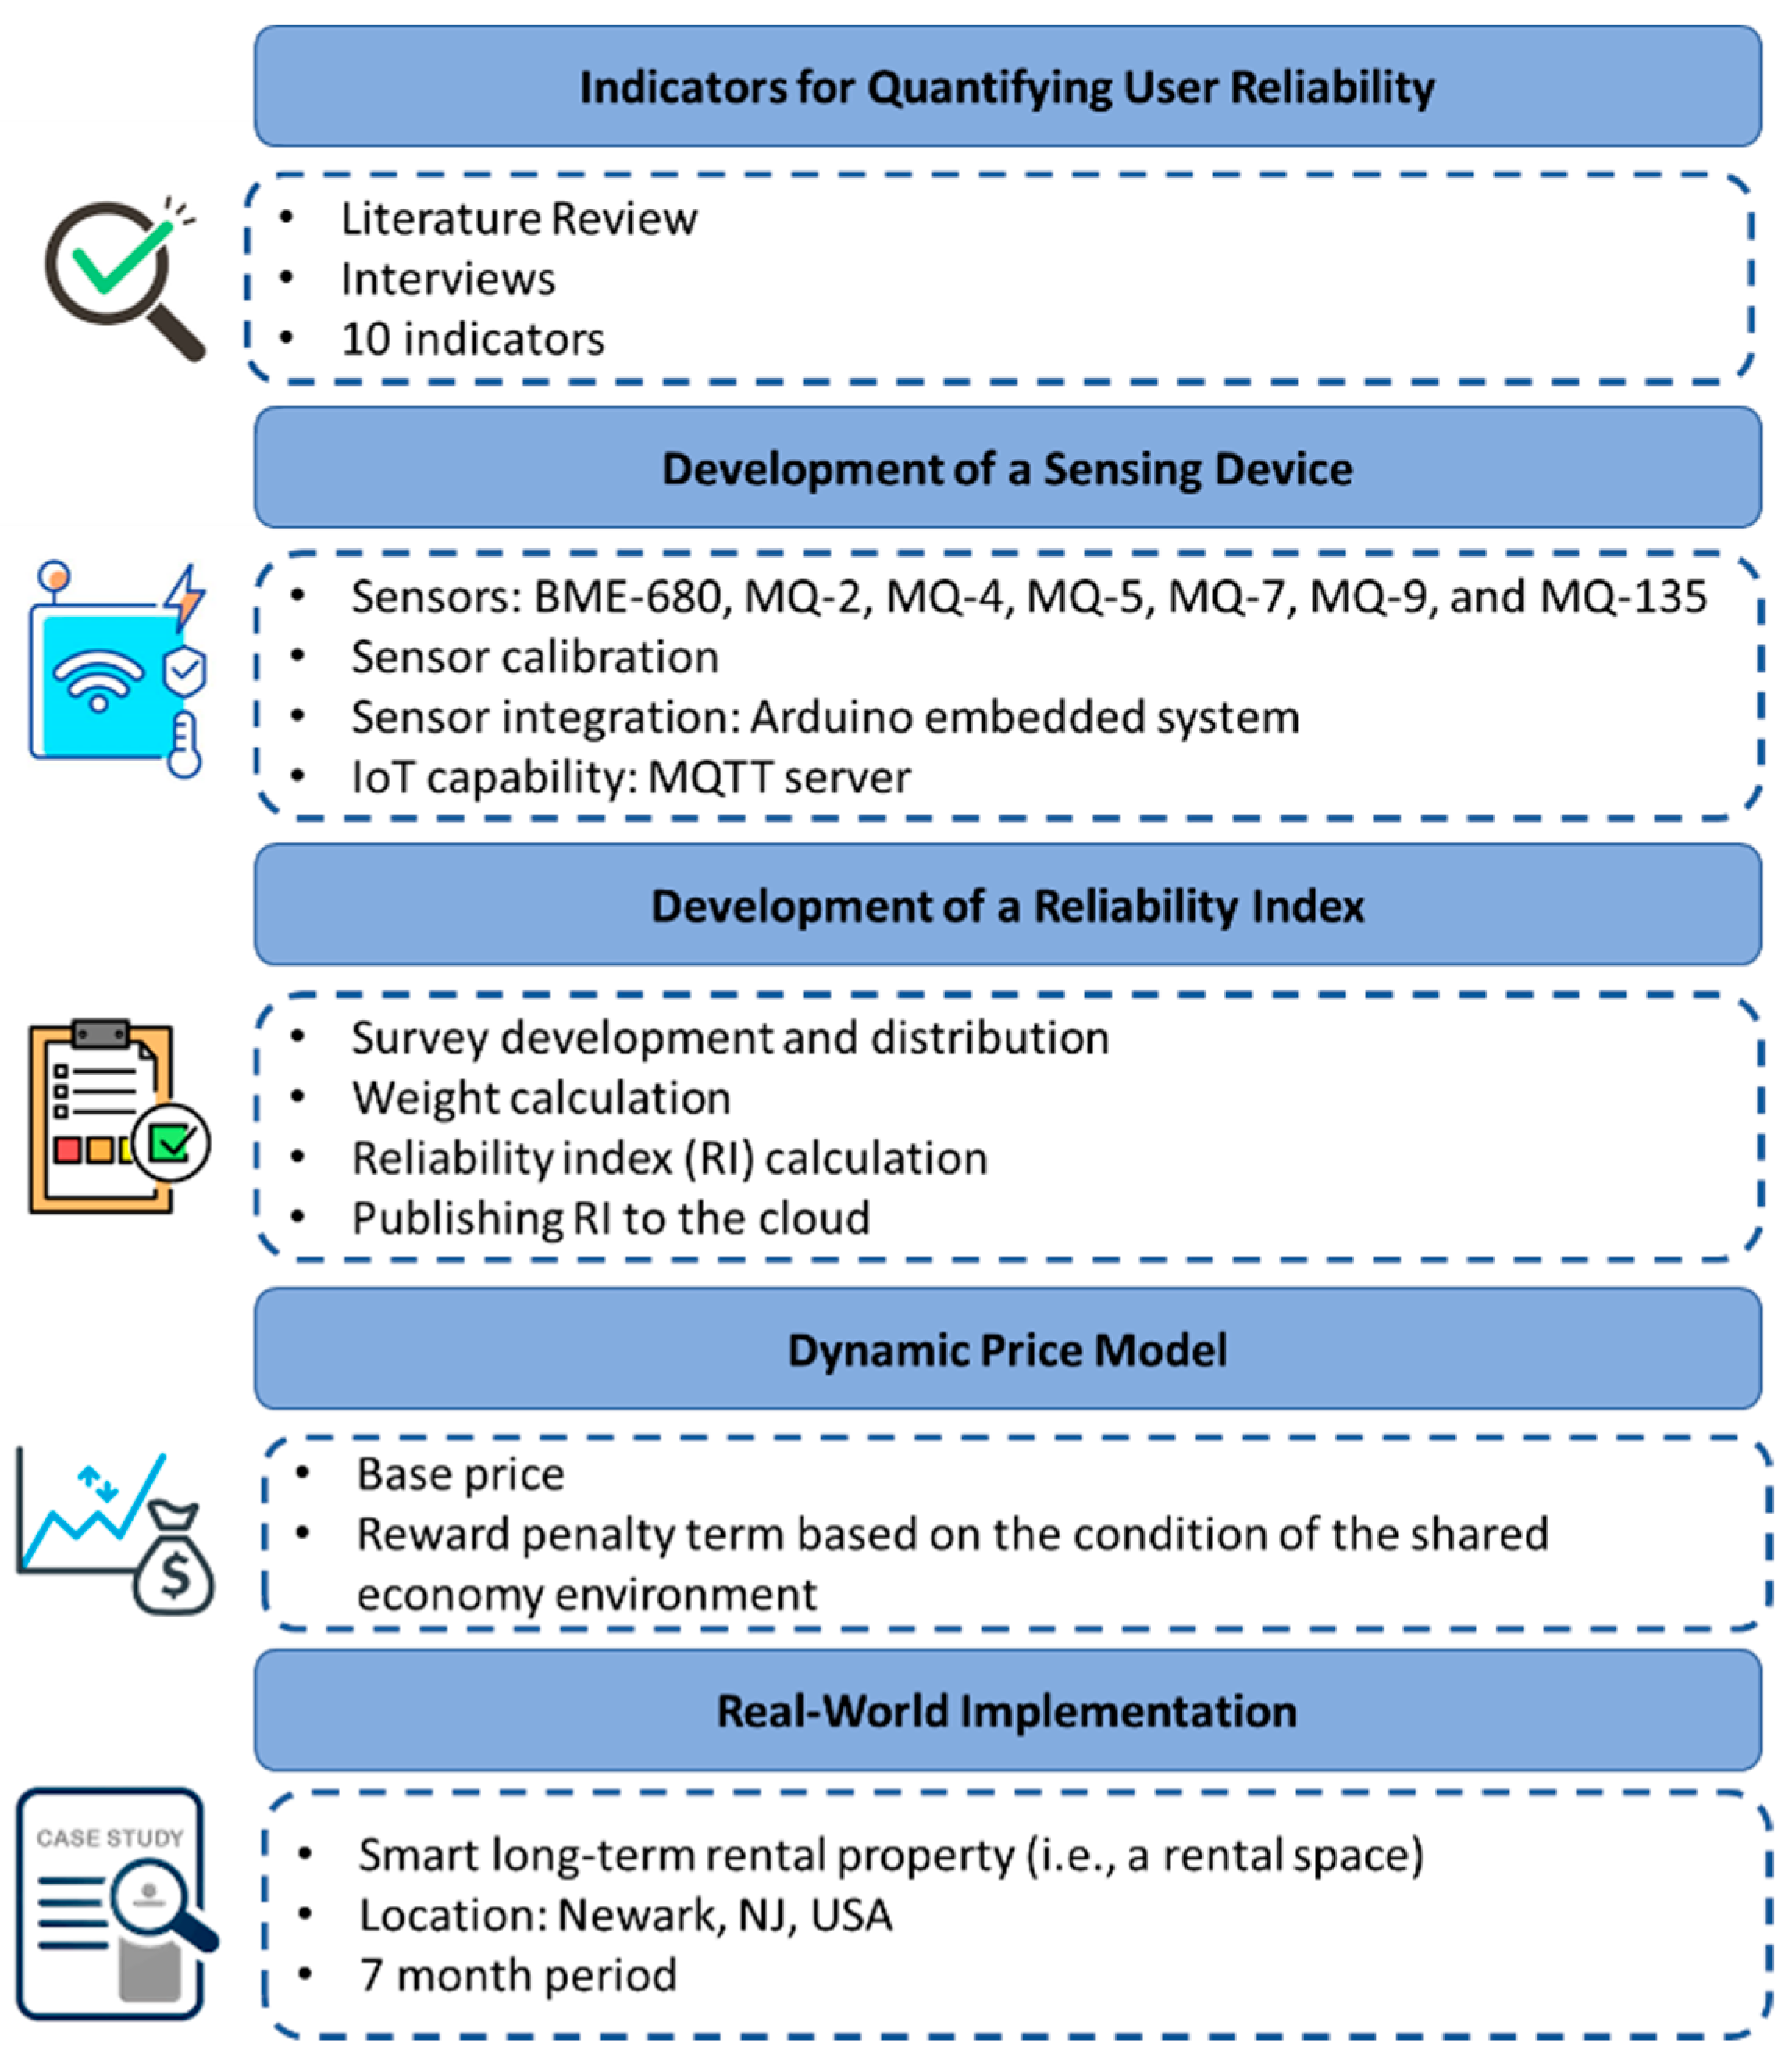
Figure 1. Research methodology.
Buildings 13 02182 g001
Figure 2. Identified reliability indicators.
Buildings 13 02182 g002
Figure 3. Sensitivity characteristics of the MQ-4.
Buildings 13 02182 g003
Figure 4. Schematic representation of the sensor integration flow.
Buildings 13 02182 g004
Figure 5. Results for calibrating the MQ sensors.
Buildings 13 02182 g005
Figure 6. Importance level of each indicator based on a 5-point Likert scale.
Buildings 13 02182 g006
Figure 7. Weight of each indicator.
Buildings 13 02182 g007
Figure 8. Publishing sensor data to the IoT cloud through the MQTT server.
Buildings 13 02182 g008
Figure 9. The developed visual interface.
Buildings 13 02182 g009
Figure 10. Building trust between shared economy users and providers based on the proposed model.
Buildings 13 02182 g010
Table 1. List of the indicators and classifications.
IndicatorExcellentGoodFairPoorBadVery BadReferences
Temperature (°C)19–2121–2727–3030–32 or 13–1832–35 or 9–13>35 or <9[71,72]
Humidity (%)30–5050–6060–7070–80 or 20–3080–90 or 10–20>90 or <10[73]
LPG (ppm)0–100100–250250–800800–10001000–2000>2000[74,75,76,77,78]
Natural Gas (ppm)0–100100–200200–800800–10001000–2000>2000[79,80,81]
Hydrogen (ppm)0–170170–300300–700700–10001000–2000>2000[82]
Carbon Monoxide (CO) (ppm)0–3535–5050–100100–400400–1200>1200[83,84,85]
Combustible Gas (ppm)0–100100–250250–800800–10001000–2100>2100[76,86,87]
Ethanol (ppm)0–4040–100100–200200–400400–500>500[88,89,90]
Smoke (ppm)0–100100–200200–300300–500500–600>600[91]
Carbon Dioxide (CO2) (ppm)0–400400–500500–600600–800800–1000>1000[92]
Table 2. Parameters for calibrating the MQ sensors used in this study.
SensorDetected Indicator( R S / R O )Constant aConstant b
MQ2LPG9.83658.71−2.168
MQ4Natural Gas4.41012.70−2.786
MQ5Hydrogen6.51163.80−3.874
MQ7Carbon Monoxide27.599.04−1.518
MQ9Combustible Gas9.64269.60−2.648
MQ135Ethanol3.677.26−3.180
MQ135Smoke3.644.95−3.445
MQ135Carbon Dioxide3.6110.47−2.862
Table 3. Scheme for individual indices.
ILoIHiCondition
049.99Excellent
5099.99Good
100149.99Fair
150199.99Poor
200299.99Bad
300500Very Bad
Table 4. Reward/penalty (i.e., RP term) associated to each RI condition.
RI ValueDescription of RIReward/Penalty (i.e., RP Term)
[0.90, 1.00]Excellent−15%
[0.80, 0.90]Good−10%
[0.70, 0.80]Fair0%
[0.60, 0.70]Poor+10%
[0.40, 0.60]Bad+15%
[0.00, 0.40]Very Bad+20%
Table 5. Pilot Project results of the IoT-enabled dynamic price model.
Month ( t )Base Rent ( P 0 ) (USD) R I ¯ t R P t Dynamic Price ( P t ) (USD)
19000.690.00900
29000.710.00900
39000.81−10%810
49000.81−10%810
59000.85−10%810
69000.89−10%810
79000.6210%990
Disclaimer/Publisher’s Note: The statements, opinions and data contained in all publications are solely those of the individual author(s) and contributor(s) and not of MDPI and/or the editor(s). MDPI and/or the editor(s) disclaim responsibility for any injury to people or property resulting from any ideas, methods, instructions or products referred to in the content.