Abstract
The healthcare industry significantly impacts the environment due to its high usage of energy and natural resources and the associated waste generation. This study applied a cradle-to-grave Life Cycle Sustainability Assessment (LCSA) approach to assess the environmental and social life cycles of public hospitals. One hundred twenty-four public hospitals were selected for the current study; their sustainability performance was compared with those certified by Leadership in Energy and Environmental Design (LEED). The comparison revealed several factors contributing to the poor sustainability performance of public hospitals. These include inadequate management, substandard planning, political interference, insufficient staffing and funding, high energy consumption, high expenses, inconsistent healthcare policies, and conventional building designs. System thinking was leveraged, and a causal loop diagram (CLD) was developed to visualize the interdependency of the identified indicators of LCSA. Based on the findings of the study, a policy framework is proposed to guide the development of sustainable healthcare buildings. The framework includes using eco-friendly materials and techniques in construction, harnessing solar energy, improving hospital management practices, promoting public awareness about sustainability, conserving energy and water, and adopting sustainable waste management and transportation. Additionally, it emphasizes addressing social issues such as improving indoor air quality, thermal comfort, lighting, acoustics, patient safety, and security and ensuring that healthcare services are accessible and affordable. This study contributes to the literature on sustainable healthcare buildings by providing a practical policy framework for achieving sustainability in the healthcare sector.
1. Introduction
Hospitals play a significant role in achieving holistic sustainability and circularity, and their impact extends beyond just providing healthcare services [1]. They consume bulk natural resources, generate excessive waste, and emit various pollutants, which can negatively impact the environment [2]. Healthcare is the second largest greenhouse-gas-emitting sector in the built environment, after the industrial sector [3]. The US healthcare system is responsible for approximately 25% of worldwide healthcare-related greenhouse gas emissions [4]. Between 2010 and 2018, greenhouse gas emissions from the US healthcare system increased by 6%, resulting in healthcare emissions rising from 520 to 554 million metric tons of carbon dioxide equivalents (CO2e) or, in other words, from 1685 to 1693 kg CO2e per capita [5]. In Australia, the health sector is estimated to be responsible for 7% of the total carbon emissions from buildings [6]. Similarly, in 2012, healthcare contributed 2.7% to China’s total greenhouse gas (GHG) emissions, equivalent to 315 megatons of CO2e [7]. Drew et al. [8] explained that the yearly carbon footprint resulting from the operational surgical suites falls within a range of 3200–5200 tons of CO2e. Further, there is significant variability in the environmental impact of each surgical procedure, with estimates ranging from 6 to 1007 kg of CO2e. Therefore, in the face of escalating environmental challenges, such as resource scarcity, infrastructure damage, supply chain disruption, and the mounting burden of environment-related diseases, the global healthcare system must reduce its environmental impact while providing effective care [9]. This requires a comprehensive approach to quantify and mitigate the healthcare sector’s ecological footprint while meeting patients’ needs and adapting to environmental change.
The concept of sustainability assessment has attracted significant global attention due to the increasing need for health systems that are economically, socially, and environmentally sustainable [10]. Although various approaches have been developed to address sustainability in healthcare, the focus is on specific aspects and involves only a limited number of stakeholders. To effectively tackle the complexity of this issue, a systemic and comprehensive approach is necessary that involves all stakeholders and facilitates long-term decision-making [11]. Therefore, it is essential to understand the sustainability performance of hospitals throughout their life cycle.
Life Cycle Sustainability Assessment (LCSA) is an effective tool to evaluate the sustainability of hospitals. LCSA provides a holistic approach that assesses the environmental, social, and economic impacts of a product or service throughout its entire life cycle [12]. LCSA can help hospitals identify and prioritize areas to improve sustainability [13]. To achieve sustainable healthcare, it is crucial to consider the interdependence of the associated economic, social, and environmental factors. Economically sustainable healthcare systems can offer high-quality care at affordable costs. Social sustainability ensures that healthcare is accessible and equitable for all members of society [14]. On the other hand, environmental sustainability entails reducing the negative impact of healthcare on the environment by minimizing waste, reducing energy consumption, and utilizing sustainable materials, thus promoting a circular economy [11].
In recent years, the concept of LCSA has been extensively studied, with several studies focusing on its application to the healthcare sector [15]. However, the existing literature indicates that LCSA research on hospitals is limited. The environmental dimension of sustainability in healthcare has received the most attention, with many studies focusing on identifying the environmental impacts of hospitals and exploring ways to reduce them. Researchers have mainly focused on specific aspects of healthcare for sustainability analysis, such as sustainable business management [16], energy efficiency [17], embodied carbon [18], hospital waste [19], medical devices [20], patients satisfaction [21], nursing practice [22], healthcare supply chain [23], healthcare security challenges [24], medical procedures [25], surgical and anesthesiology-related LCA [8], bed capacity [26], pathology testing [27], and eHealth innovations [28]. Additionally, healthcare providers have come to realize the critical importance of providing patients with high-quality services while balancing the resources and needs of patients as part of their sustainability practices [29]. This is because patient satisfaction is an essential measure of healthcare sustainability, closely linked to improving service quality, reducing medical bills, and meeting customer expectations [30]. The literature also highlights the role of information technology and artificial intelligence in directing healthcare organizations toward sustainability, facilitating increased efficiency, creating sustainability tools, and transforming products into services that integrate sustainable systems and lifestyles [31].
The use of advanced healthcare technologies such as home-based telemedicine [25], home-based surgery [32], and minimal to non-invasive surgeries with online monitoring and alarm systems using internet of things (IoT) technologies have helped to improve healthcare access, affordability, and quality [33]. Furthermore, personalized medications using 3D-printing technology have also contributed to smart and sustainable healthcare [34]. Other approaches include funding premium-priced medicines for universal access [35], vaccination for sustainable health [36], sustainable medical education, appropriate workforce development [37], green human resource management practices [38], and medical tourism to foster a culture of sustainability in healthcare organizations [39], all of which can help achieve social sustainability.
The financial sustainability of publicly funded healthcare systems has been the main focus of researchers studying the economic aspect of sustainability [40]. It has been observed that achieving this objective poses a challenging task for policymakers in several countries. Despite economic sustainability being a direct and indirect result of various environmental and social initiatives such as energy conservation, recycling, job creation, and support for educational institutions, efforts to promote it have been limited [41]. The healthcare industry has also recognized the strategic and critical importance of green hospitals, which adopt environmentally friendly products, practices, and construction [10]. In addition, reducing operational costs is a pressing objective for healthcare providers [42].
According to Marimuthu and Paulose [43], achieving sustainability in healthcare requires effective management of four critical factors: addressing environmental concerns, meeting patient needs, satisfying employee requirements, and responding to community concerns while continually enhancing quality and reducing costs. Additionally, it is crucial to consider the differences in healthcare challenges between developed and developing countries and their impact on the environment. In many underprivileged countries, healthcare provision is insufficient, leading to poor health in the population [44,45,46]. Despite having lower healthcare expenditure per capita and a smaller environmental footprint, the environmental intensity of their health expenditure is typically higher, highlighting the need for greater environmental sustainability practices [1]. This necessitates further research on the sustainability of hospitals in developing countries, which may face unique sustainability challenges in their healthcare facilities. Additionally, hospital design and construction should integrate LCSA. To date, no studies have evaluated the LCSA of a complete hospital building covering holistic aspects of sustainability [47].
Hospitals in Pakistan face distinctive sustainability challenges stemming from limited access to renewable energy sources, climate conditions, social inequality, inadequate healthcare planning, high healthcare costs, energy crises, and political interference [44,45,48]. The lack of research on hospital sustainability in Pakistan exacerbates the issue, hindering the development of effective sustainability strategies for these facilities. The current study aims to address this issue by conducting LCSA evaluations of public healthcare buildings in Pakistan. The goal is to propose a policy framework for developing sustainable healthcare facilities incorporating the country’s climatic and demographic conditions. This framework serves as a stepping stone for enhancing the sustainability of healthcare buildings in developing countries. It delineates a methodology for appraising the full life cycle sustainability, spanning from inception to ultimate disposal in healthcare buildings.
2. Tools and Methods
This study aids decision making in the healthcare sector by conducting an LCSA of public hospitals based on the three dimensions of sustainability: environmental, economic, and social. Klöpffer [49] proposed a formula to assess the sustainability of products, which has been employed as a reference in this research (see Equation (1)). In addition, it guides how to conduct an LCSA through the combination of ELCA, LCC, and SLCA.
LCSA = ELCA + LCC + SLCA
Figure 1 illustrates the flowchart of the methodology employed in the current study, which comprises various sequential steps. A thorough literature review was conducted to examine existing LCSA research in the healthcare industry to establish the study’s objectives and scope. Subsequently, the functional unit was selected, and a questionnaire was developed to collect data for SLCA. Finally, environmental and cost assessments were conducted by acquiring data from hospital management and administration and through physical monitoring and surveys. The impacts were then calculated, and the results were normalized and rationalized to obtain a single representative value of the LCSA of every hospital. In essence, the methodology involves comprehensive data collection and analysis to assess the sustainability of healthcare practices, which is elucidated in the following subsections.
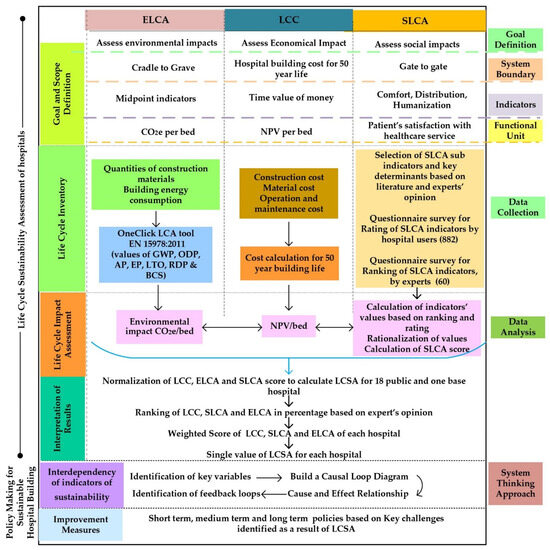
Figure 1.
Framework of methodology.
2.1. Scope and Goal Definitions
This study develops an evidence-based policy for constructing and designing hospitals and healthcare facilities in Pakistan that reduces resource use and leads to a lesser environmental footprint. The scope of the research is limited to the LCSA of public hospital buildings in Pakistan. The system boundary for this research includes the entire life cycle of the building, from the extraction of materials to the end of the building’s lifespan, during which all three pillars of sustainability are evaluated. Figure 2 provides the indicators of LCSA selected for this study. In order to properly compare the environmental impact of different buildings, it is important to define a functional unit (FU) that considers factors such as lifespan and the services offered by the building [50]. The most widely used FU in the literature for building life cycle studies is the unit area of the building, regardless of the building types and functions [51]. But according to experts, the impact per bed is a more suitable FU for calculating hospital impacts, as it aligns with the primary goal of a hospital, which is to provide care for patients. During interviews conducted in the current study, the relevant experts highlighted the importance of measuring impacts on a per-bed basis to ensure that the focus is on the number of patients that can be cared for rather than on the physical size of the hospital. Table 1a,b indicate that the area per bed varies among the hospitals, which could impact the accuracy of results if calculated on a per unit area basis. This is because hospitals with larger rooms could appear to have a smaller impact, even if they are using more resources overall.
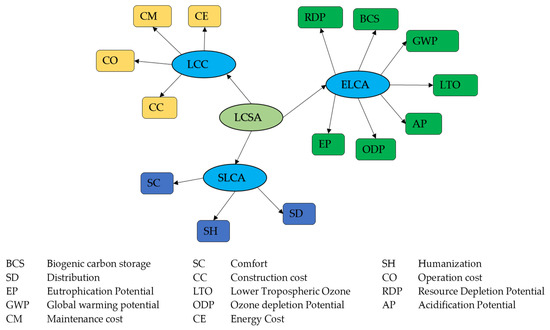
Figure 2.
Indicators of Life Cycle Sustainability Assessment.

Table 1.
(a) Summary of significant building features and attributes. (b) Summary of significant building features and attributes.
As of 2020, there were 1289 public hospitals in Pakistan. A purposive sampling approach was utilized in two stages to gather data for the study. In the first level, a sample was selected from the province of Punjab, renowned for its large population and industrialized status, as well as its numerous high-quality public and private hospitals with teaching and specialized facilities. Similar to other provinces in Pakistan, the healthcare infrastructure in Punjab is largely publicly funded and offers comparable services. Given the significant role of the province of Punjab in governing healthcare policy and influencing the economy of Pakistan, the relevant policy decisions based on the data collected from this province can be generalized to the entire country. This belief is supported by literature [52] that suggests that results from studies conducted in highly populated and influential regions can be extrapolated to the larger population. This is due to the larger sample size and the representation of diverse demographic and economic groups in these regions.
In the initial sampling stage, 124 hospitals were selected from the 390 hospitals in Punjab based on the location and population size criteria. Monthly data were collected on various aspects of these selected hospitals. These aspects include electricity and water consumption, waste generation, annual patient rate, number of beds, doctors, parking facilities, location, building area, and Koppen climate classification.
In the subsequent stage, a further sample of 18 out of 124 hospitals was selected for LCSA using the maximum-variation sampling method. These 18 hospitals were carefully chosen based on various factors, such as energy use intensity, climate, number of beds, area-to-bed ratio, annual patient rate, location, and expert opinions, to ensure the representativeness of all hospitals in the country, considering regional and climatic variations. To assess the ELCA and LCC of these hospitals, it was imperative to quantify various material quantities, which could be accomplished through hospital drawings and BOQs. Unfortunately, despite the best efforts of the researchers to obtain the data, the public stakeholders did not provide these documents because of confidentiality restrictions. Therefore, the required quantities were estimated by visiting each hospital and manually measuring its area, walls, windows, and other amenities.
2.2. Base Hospital
A base hospital is used for sustainability comparison as it provides a benchmark against which other healthcare buildings can be evaluated [53]. Using a hospital that has already achieved a high level of sustainability as a model, it is possible to identify the specific practices and technologies contributing to its success and evaluate other hospitals based on those criteria. This approach allows for a standardized and objective comparison of sustainability practices across healthcare buildings. A US-LEED Gold certified hospital (H19), recently constructed in the country, is used as a base hospital in this study to compare the LCSA results of public hospitals. It has implemented many sustainable practices and technologies, such as efficient water and energy-management systems, solar energy systems, eco-friendly materials, and sunlight and rainwater harvesting systems. Comparing the LCSA of public hospitals shortlisted for the study to the standards set by H19 makes it possible to identify areas where sustainability improvements can be made in public hospitals.
2.3. Data Collection of Public Hospitals for LCSA
2.3.1. ELCA
The OneClick LCA tool is utilized to conduct the ELCA of hospital buildings. This standard outlines the process for determining a building’s environmental impact using LCA and relevant data. It establishes a way to present and convey the assessment results [54]. To collect the required data, public hospitals were visited across Punjab. Most of the hospital buildings were very old. Due to government data confidentiality, the officials did not share the original architectural drawings and BOQs with the researchers. Nevertheless, with their permission, the research team of the current study was allowed to visit the hospital and take measurements of areas to calculate quantities of materials used during the construction. The electricity and fuel consumption data per year were used to calculate the operational energy use impact [55], which was provided by the hospital administration. The data on construction materials, construction technology, energy use, waste production, and water use for all hospitals were input into the software to calculate ELCA in the form of CO2e [56].
2.3.2. SLCA
In a social life cycle assessment (SLCA), the social impact of products is assessed along with their potential positive and negative impacts throughout their lifetime [57]. In the context of healthcare, quality is defined as the performance of an intervention in relation to a standard known to be safe and its ability to improve health with the resources available [58]. There has been increasing attention in recent years to patient satisfaction in hospitals. Studies have shown that patients are most satisfied when interpersonal interactions, such as those between the staff and the patient, are provided [59]. According to a study in South Africa, patient satisfaction is a fundamental indicator of the quality of care provided in any hospital [60]. In assessing indoor environmental quality performance, it is necessary to consider the occupants of a building who are intended to be satisfied by the indoor environment [61]. Face-to-face and online surveys, including questionnaires and interviews, were used for collecting SLCA data in this study. The measurement used three primary indicators, comfort [62], distribution [63], and humanization [29], as shown in Figure 3. The comfort indicator comprises five sub-indicators: acoustic, lighting, indoor air quality, hospitalization blocks, and thermal comfort. Similarly, the distribution indicator comprises four sub-indicators, i.e., space flexibility, access and paths, departments, and well-being. The humanization indicator was measured through three sub-indicators: safety and security, health promotion, and social aspects.
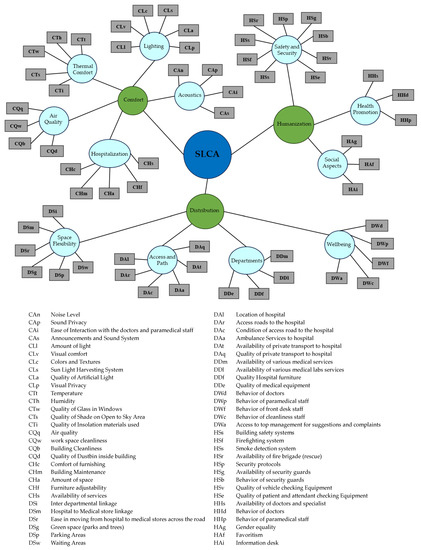
Figure 3.
Indicators of social sustainability assessment.
To obtain detailed data on these indicators and sub-indicators, key determinants were identified and assessed through questions pertinent to the satisfaction level of respondents. For instance, within the lighting sub-indicator of comfort, six key determinants were identified: the amount of light, visual comfort, colors and textures, sunlight-harvesting system, quality of artificial light, and visual privacy. By breaking down these indicators and sub-indicators into specific key determinants, the current study was able to provide a comprehensive assessment of the different aspects of the social sustainability of healthcare and how they contribute to the overall well-being of individuals in various settings. These detailed measurements and assessments enabled researchers to better understand the complex factors that contribute to social sustainability and develop strategies to improve it [64].
As the survey in the current study aimed to assess the current social sustainability performance of existing hospitals, the targeted population was those who received healthcare services in their local area. For a population of 110 million, a 3% margin of error, a 95% confidence level, and a sample size of 876 individuals were required, following a simple random sampling method. The seven-point Likert scale, where 1 = completely dissatisfied, 2 = mostly dissatisfied, 3 = somewhat dissatisfied, 4 = neither dissatisfied nor satisfied, 5 = somewhat satisfied, 6 = mostly satisfied, 7 = completely satisfied [65], was employed in the questionnaire. The result of this survey was used to calculate the score of each key determinant. The face-to-face survey method was used to collect these data, and 882 responses were collected. As the researchers filled out the questionnaire via face-to-face survey, the chances of bias were eliminated.
The next stage was to assign weightage to the key determinants required for calculating the LCSA value. To rank the factors, only experienced professionals with a sound understanding of sustainability were targeted for this questionnaire survey. These included field experts and experts from academia. This questionnaire was based on a 5-point Likert scale in which 1 = not important, 2 = moderately important, 3 = important, 4 = very important, and 5 = critically important [66]. Both online google forms and face-to-face interviews were used for ranking the indicators at three levels, i.e., key determinants, sub-indicators, and main indicators. Social sustainability in healthcare is not widely understood, so a relatively small number of responses were received.
Moreover, only two studies on SLCA have been performed in Pakistan [67,68]. The number of respondents who ranked the indicators in both studies was less than 30. A total of 60 responses were collected in the current study. All participants in the study had over ten years of experience in their respective fields. Overall, the results of this survey are reliable, robust, and reflective of the experiences and perspectives of a diverse group of professionals with substantial industry experience. The weightage of indicators, sub-indicators, and key determinants was calculated using the relative importance index formula presented in Equation (2).
where W is the weighting assigned to each factor by the respondents (ranging from 1 to 5), A is the highest weight (i.e., 5 in this case), and N is the total number of respondents, which is 60 in this case [69]. Equation (3) is used for aggregation. Sj is the value of indicator j, wi is the weightage of sub-indicator i, and vi is the score of sub-indicator i.
RII = ΣW/(A × N)
Sj = ∑wivi
Equation (3) was used to aggregate the key determinants, providing a score for sub-indicators. The aggregation of sub-indicators then provided a score for the main indicators. These main indicators were further aggregated to obtain a single value for SLCA for each hospital.
2.3.3. LCC
LCC includes the initial costs of evaluating the investment, designing and building the structure, and the ongoing costs of operating, maintaining, and using the building. The end-of-life costs, such as refurbishment, dismantling, and disposal, must also be considered. The literature suggests that the average lifespan of hospital assets is 50 years [70]. Thus, it is crucial to pay close attention to the facility’s operational phase, specifically its maintenance and operating costs, as these are critical for maintaining the unique and essential assets that serve the community. The measurements of 18 healthcare buildings were taken manually, including the measurement of each floor, room, door, window, and total covered area. The structural design and material estimation was carried out using these drawings. The cost analysis was performed based on the market rate system (MRS) of the year in which each healthcare building was constructed. Monthly data on the operation and maintenance costs of the healthcare buildings were collected from the hospital administration. To calculate the construction, operation, and maintenance costs over the life cycle, a 50-year building lifespan was used as a standard [71] so that the cost of each hospital, regardless of their age difference, could be compared. Cost values were discounted using the net present value method [72] using the interest rate in the country at the time of this study (i.e., 16%) [73].
Public hospital buildings are large infrastructures that are not demolished but instead renovated and extended based on future needs [70]. Therefore, based on interviews with hospital administration and field experts, the residual cost is not considered, but the renovation cost is included as part of the maintenance cost [74]. This whole process represents the LCC of healthcare buildings. It does not include the land cost, as the public buildings are constructed on government land. The operation and maintenance cost does not include the cost of staff salaries and pharmaceutical expenditures of the hospital. This is because the data are confidential, and no literature or report has been published that provides a methodology for considering the building’s employee salaries as part of the LCC calculation. Moreover, the number of employees is proportional to the number of beds in each hospital. Therefore, during interviews, experts believed that it might not have a significant impact on the overall sustainability values of these hospitals.
2.4. Rationalization and Normalization
The final step of the study was to calculate the LCSA values. Because LCC, ELCA, and SLCA values were in different scales and units, these values were normalized and rationalized to the same unit, and values for the FU were considered [75]. These values were added up to obtain a single value of LCSA. FU in this study was the impact per bed. Therefore, the value of LCC per bed was calculated for each hospital. Similarly, ELCA in the form of CO2e/bed was calculated for sample hospital buildings. The values of SLCA were also calculated per bed for every hospital. In the next step, based on the weightage and ranking given to each pillar of sustainability by the experts, data were rationalized and added to obtain the LCSA [75]. According to the questionnaire and interview survey, the LCC was ranked as least important to low by experts because they believed that the government must facilitate the public in infrastructure projects like hospitals. Therefore, the cost was uncompromised because these projects could not be closed even if the hospital expenses were very high. Experts believed that environmental and social impact was critical for a public hospital. To enhance sustainability in the entire life cycle of a hospital structure, it is crucial for stakeholders to have a deep comprehension of the complex interdependencies among its various aspects and to effectively identify crucial opportunities for driving positive transformation [76]. Therefore, a causal loop diagram (CLD) based on systems thinking was developed to find the interdependency of indicators of LCSA, which is presented and discussed in Section 3.5.
3. Results
This section presents the results of the LCSA conducted in this study. First, all three pillars of sustainability and their ultimate values are discussed. To better understand the results, it is essential to outline the key structural features and important data of the selected buildings. Table 1a,b provide important information about these buildings.
3.1. Environmental Life Cycle Assessment
The impact values were aggregated in the form of CO2e as a single value. For confidentiality, these hospitals were named H1, H2 and so on. The total emission is a combination of emissions from construction material, the construction process, the hospital’s operation, and maintenance, which depends on the area and bed capacity of the hospital. It can be seen from Figure 4 that the values of ELCA are discordant, which may be because the area per bed is inconsistent, as can be seen from Table 1a,b. The results reveal that public hospitals, on average, emit 1865.44 kg CO2e per bed per year, indicating a considerable carbon footprint.
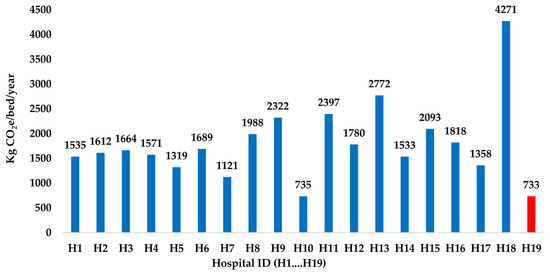
Figure 4.
ELCA of hospitals in Kg CO2e/bed/year.
The hospitals constructed in less developed areas have fewer beds due to a lower population, whereas the hospitals in urban areas have a greater number of beds. The per-bed, per-year emissions of H10 and H19 are commensurable. But H10 has 648 beds while H19 is a 280-bedded hospital. Further, these buildings have an area difference of more than 2000 m2. The area per bed for each hospital was calculated, and the values were found to be inconsistent. No two hospitals considered in this study have the same area per bed. Therefore, it was suggested to calculate impacts per unit area given in Figure 5 to explore any reciprocity of emissions data.
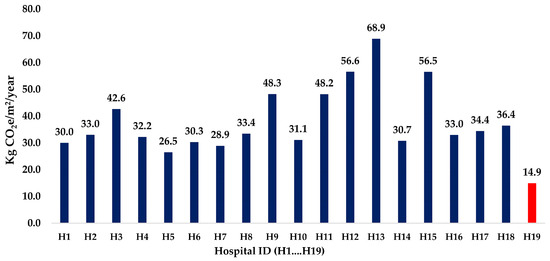
Figure 5.
ELCA of hospitals in Kg CO2e/m2/year.
It is obvious from Figure 5 that impacts per area for all public hospitals are comparable except for three hospitals that have more than 50 kg CO2e/m2/year emission. H19 shows the lowest impact, i.e., 14 kgCO2e/m2/year. Also, on average, all public hospital buildings have 88.14% higher energy consumption than H19.
3.2. Life Cycle Cost
Figure 6 shows the results of the LCC of the investigated hospitals. Despite being similar, these buildings’ maintenance and operational costs varied greatly and were not proportional to the covered area of the buildings. It was observed that the design standards used in constructing these healthcare buildings, particularly the ratio of area per bed, the balance of demand and supply, etc., were inconsistent. Government land was allocated for the construction of the hospital, and the maximum area was covered in places where the population was low, which increased the project’s initial cost and led to higher operational and maintenance costs and a larger carbon footprint. The same trend has been observed in H5, H6, H9, H15, and H16, where more area has been covered, keeping in mind the future extension without considering the actual demand.
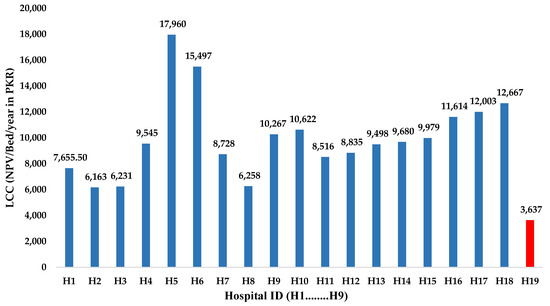
Figure 6.
Life cycle cost (NPV/bed/year).
The average cost per bed for the studied public hospital buildings was PKR 10,095.51. However, the cost per bed for H19 was significantly lower, i.e., PKR 3637.50, which is 63.64% less than the average cost of the 18 remaining hospitals.
3.3. Social Life Cycle Assessment
The social LCA was determined by assessing the satisfaction of patients through three main indicators: comfort, distribution, and humanization. Overall, the social sustainability of public hospitals was very poor. The criterion used for measuring qualitative indicators was the level of satisfaction, as mentioned in the methodology section. It is clear from Figure 7 that the aggregated values of comfort, distribution, and humanization are between the scales of 3 and 4, which reflects somewhat dissatisfied to neither-satisfied-nor-dissatisfied patients. H19 has social sustainability values higher than public hospitals; it stays between neither satisfied nor dissatisfied and somewhat satisfied on the scale. This indicates that the base hospital’s overall social sustainability was better than others, though not ideal.
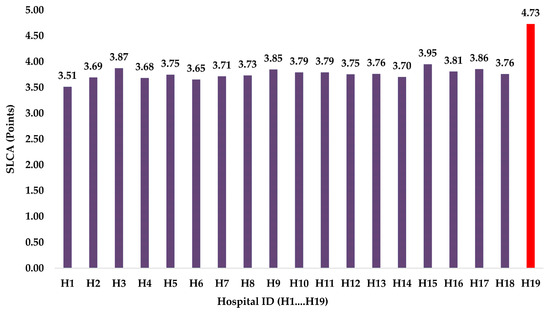
Figure 7.
Social sustainability results.
The values of the main indicators are dependent on the values of sub-indicators. These twelve sub-indicators were further dependent on sixty key determinants. The scores of these key determinants were collected from the 882 respondents via face-to-face questionnaires and interview surveys. Comparing scores of these sixty key determinants for the base and 18 public hospitals was difficult. However, in the broader picture, the average score of these sixty key determinants of H19 was 23.47% better than the of 18 public hospital buildings.
Due to its efficient design and management, the base hospital performed well in the comfort indicator. The patients were satisfied with the light, sound, air quality, and thermal comfort. In comparison, public hospitals faced many issues while providing comfort to patients. Similarly, H19 was better in the distribution indicator than the other 18 public hospital buildings. H19 had a smaller building, lesser area, and green spaces than the public hospital buildings, but these areas and facilities have been efficiently managed and utilized. Therefore, the overall score of the base hospital building in these sub-indicators was still slightly better than that of public hospital buildings. In addition, the score of the base hospital was better in the humanization indicator than in public hospital buildings.
H19, on average, scored 10% less in a few key determinants than the other public hospitals. These key determinants included the space or area, hospital-to-medical-store linkage, ease of moving from hospital to medical stores across the road, availability of private transport to the hospital, green space (parks and trees), parking areas, quality of private transport to the hospital, and favoritism.
In some key determinants, the percentage difference between base hospital and public hospital scores was more than 30%. The base hospital was superior to the remaining public hospitals. These key determinants included the behavior of paramedical staff, ease of interaction with the doctors and paramedical staff, firefighting system, smoke detectors, security system, quality hospital furniture, building cleanliness, air quality, temperature, and sound privacy. All these key determinants were related to cleanliness, building security, behaviors of paramedical staff, comfort, and facilities.
3.4. Life Cycle Sustainability Assessment
The LCSA value for each hospital was obtained by adding all three values, i.e., cost, social, and environmental assessments. Their normalization and rationalization were required because the values were in different units [77]. The LCC, ELCA, and SLCA values were rationalized on a scale from 0 to 1 to obtain comparable values. These values were then multiplied with the weightage [78] assigned to each pillar of sustainability based on the experts’ opinions and were added up [79]. It provided a single unitless value of LCSA of all hospitals, as shown in Figure 8. H19 is used as a reference for calculating these results, and its score was higher for each aspect. Therefore, it was assigned a value of 1 or 100% as a sustainable hospital and was used as a benchmark.
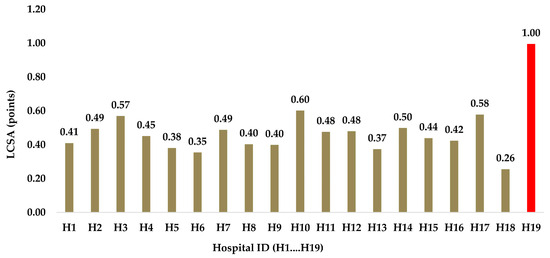
Figure 8.
Life Cycle Sustainability Assessment.
The results revealed that only 4 out of 18 hospitals attained an LCSA score exceeding 50%, indicating most hospitals need significant improvements in sustainability practices. Notably, no public hospital recorded an LCSA score exceeding 60%, suggesting that even the hospitals that performed better than others have ample opportunities to enhance their sustainability practices.
3.5. Causal Loop Diagram
CLDs serve as formidable instruments for elucidating the causal ramifications among variables [80]. This diagram intends to illustrate the interconnectedness of sustainability indicators. Selecting critical indicators was based on higher-weighted scores assigned by experts during the survey conducted in the current study. Independent variables served as pivots to discern the behaviors of other variables. In an ideal sustainability scenario, the aim is to diminish environmental impacts and augment social sustainability, all while being cost-efficient. Within the CLD, bed capacity stands as a dominant independent variable. It steers the hospital’s total area, necessitating more construction costs, increasing operation and maintenance costs, and simultaneously escalating waste generation. Figure 9 displays the intricate interdependencies among the variables and sustainability indicators. It features six loops in total: two for social sustainability, and one each for cost and environmental sustainability. Four of these, represented as R1, R2, R3, and R4, are reinforcing loops, while two, B1 and B2, function as balancing loops.
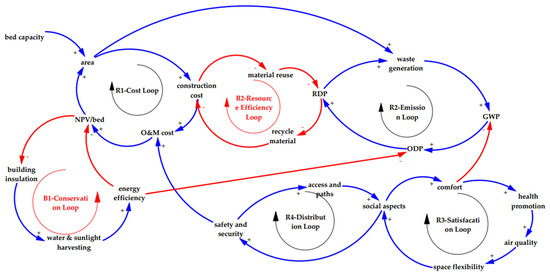
Figure 9.
Causal loop diagram of system thinking. Note: Blue color represents positive loops and factors; red color represents negative loops and factors.
In the envisioned system thinking model, the loop direction emanates from the impact flow of connected variables, either clockwise or counterclockwise, reflecting their nature in terms of cause and impact. The sign attributed to the variables is predicated on the nature of the impact or the direction of the impact flow. A “+” sign signifies that an increase in one variable enhances the other and vice versa, whereas a “−” sign denotes that an increase in one variable leads to a decrease in the other and vice versa. These are synonymous to reinforcing and balancing factors. Reinforcing loops engender the amplification of alterations, resulting in either proliferation or deterioration, while balancing loops preserve a state of equilibrium. Proficiency in comprehending both loop types is imperative for grasping intricate systems, as reinforcing loops impel growth or decline, whereas balancing loops foster stability. The meticulous scrutiny and identification of these structures within a CLD elevate the discernment of system dynamics and behavioral patterns.
In Figure 9, the R1 loop, designated as the cost loop, originates from the hospital’s total area, which is dictated by the facility’s bed capacity. This loop follows a clockwise trajectory, where a larger area necessitates heightened construction, operational, and maintenance costs, thus escalating the hospital’s LCC depicted as NPV/bed. The B1 loop, termed the conservation loop, interfaces with the cost loop. It demonstrates that implementing conservation measures such as rainwater and sunlight harvesting, energy efficiency, and building insulation, curtails the LCC. While this might amplify the initial construction cost, the operation and maintenance expenses will decrease due to lower energy costs.
The B2 loop, labeled as the resource efficiency loop, is a balancing mechanism illustrating the effect of material reuse and the incorporation of recycled materials on construction costs. This loop is interlaced with the emission loop, R2, reflecting the interdependencies of the ELCA indicators. This loop also connects to R1 at the area variable, as larger areas augment waste generation. This escalates emissions such as global warming potential (GWP), ozone depletion potential (ODP), and resource depletion potential (RDP). This loop’s behavior is directly influenced by B1, B2, and R3.
The satisfaction loop, R3, encapsulates essential factors to bolster social sustainability. It presents a spectrum of impacts, including comfort, health promotion, air quality, space flexibility, and social implications. An uptick in comfort is also reciprocated on the emission loop. R4, the distribution loop, fosters social sustainability, interfaces with R1 at the O&M cost variable, and links with R3 at the “social aspects” node. It delineates a relationship where an increase in safety and security increases the hospital’s O&M costs, a less desirable outcome, but simultaneously enhances the social aspects of the hospital, which is a beneficial effect.
These interconnections and interdependencies facilitated by the CLD enhance the policy framework. It demonstrates the necessity of striking a balance between the three tiers of sustainability.
3.6. Discussion
The LCSA scores of public hospital buildings reveal a need for comprehensive sustainability initiatives in these buildings to mitigate their environmental, social, and economic impacts. These values are directly influenced by LCC, ELCA, and SLCA values in which public hospital buildings have underperformed. Further, these values are interrelated, and improving one sustainability aspect of a hospital building can positively or negatively impact the other aspects. Therefore, the trade-offs and synergies among sustainability’s environmental, social, and economic aspects must be considered to strive for a balanced approach that addresses all aspects [81]. H19 scored relatively higher in ELCA due to its green design and material choice.
Public hospital buildings in Pakistan are typically constructed using reinforced concrete and bricks, which have a high embodied carbon footprint due to the energy-intensive manufacturing processes involved in their production [82]. Moreover, it has been noted that no recycled aggregate has been used in the construction of these public hospital buildings. The steel bars used have no recycled content, increasing these buildings’ embodied carbon value [83]. H10 had similar emissions per bed to H19. However, it had almost double the emissions per unit area compared to H19, which suggests a difference in area per bed of these two hospitals. Using the area per bed of base hospital as a benchmark, it can be inferred that public hospitals have more area per bed, making these buildings inefficient in terms of energy and cost, resulting in poor economic and environmental sustainability performance. Therefore, it is important for hospitals to carefully consider the trade-offs between reducing the area per bed and maintaining high-quality patient care and experience [84].
Furthermore, it should be noted that a government department constructed and maintained all public hospitals in the country. Hence, they shared the same window-to-wall ratio and similar building structure. Brick masonry was commonly used in the construction of these buildings, with no notable design innovations implemented even during extensions. For instance, hospitals H1, H2, H6, H7, H8, H10, H14, H15, and H17 had 450 mm thick brick walls, while H3, H4, H5, H11, H13, H16, and H18 had 340 mm thick brick masonry walls with simple English bond. Using a rat trap bond can help reduce the number of bricks required and decrease the energy consumption of buildings if bricks are the chosen building material. The higher energy consumption in public hospital buildings as compared to base hospital buildings was due to the efficient design and construction of H19. The base hospital included energy-saving features such as sensors that monitored patient and visitor traffic, a rewards system for operational managers to promote energy conservation, a well-maintained schedule for electrical appliances, and the integration of renewable energy sources such as photovoltaic technology to meet half of its power needs, thus reducing its carbon emissions. It was observed during the survey that the electrical equipment, including lighting, fans, air conditioners, and medical equipment, were often left on in these buildings, leading to significant energy wastage and increased carbon emissions. This led to low scores in the LCC and ELCA of these buildings. However, the base hospital building did not face these issues because an operation manager controlled the efficient use of these appliances, effectively managing the energy demand. This aligns with a study that reported that careful monitoring of electrical equipment used in hospitals can reduce up to 20% of a hospital’s energy consumption without compromising patients’ comfort [85].
The results also indicate that public hospitals fail to meet social sustainability goals. One primary reason for this failure is the improper management and maintenance of hospital buildings. During surveys and data collection, it was observed that the air conditioning systems in some hospitals were inefficient. A study by Radi et al., (2022) [86] suggested that proper maintenance of HVAC systems can lead to 35% of energy savings and reduced greenhouse gas emissions. There was no backup supply during periods of electricity shortfall, even if there were diesel-operated generators; these were only used for lighting, leaving patients to wait for a power supply in the case of any diagnostic equipment that requires electricity, such as ultrasound, X-rays, and ECGs. Green spaces that play a critical role in social and environmental sustainability are often unavailable or, if they do exist, not adequately maintained or cleaned in public hospitals [87].
The low lighting and visual comfort scores in public hospitals can be attributed to the lack of sunlight harvesting inside the building. Windows in some hospitals were covered with blinds or dark color paint that hindered the sunlight from entering. The lighting systems of these buildings relied heavily on artificial lighting. Moreover, no hospital had more than a 20% window-to-wall ratio (see Table 1a,b). In contrast, the base hospital had large windows that allowed natural light to enter the rooms, which can significantly improve patient well-being, including reducing pain and stress levels [88]. Another study found that daylight exposure in patient rooms can lead to lower medication use and faster recovery times [89].
H19 scored lower than public hospitals in the sub-indicator of access and paths, which can be attributed to its location. In healthcare, choosing the right hospital location is crucial for providing effective, high-quality, and equitable services, as it is a strategic decision with the potential to impact customer satisfaction and cost [90]. Despite scoring higher in key determinants of space flexibility than public hospitals, the performance of base hospitals was unsatisfactory due to the limited area. However, the hospital’s management efficiently used the available space. Moreover, most attendants used their own vehicles to reach H19, which might be one of the reasons for the low scores in the transport-related key determinants. It is also pertinent to mention here that the public transport service is unavailable in most areas of the country, except the metropolitan, which makes access to the hospitals very costly because people have to use their private vehicles [91].
The behavior of the paramedical staff and the level of security in H19 were better in the social aspect compared to public hospitals, where security and staff behavior towards patients and attendants are often poor. This is consistent with previous studies on patient satisfaction and the behavior of healthcare workers [30,92]. In addition, the promotion criteria and recognition of the best officer of the month at H19 created a sense of fairness and impartiality, making it a more attractive option for patients compared to public hospitals where favoritism and inequality appeared to be common. The system thinking approach has revealed that understanding the interrelationships between variables such as thermal comfort, energy efficiency, health promotion, and specific hospital considerations empowers targeted interventions and discernment of improvement opportunities. Cultivating collaboration among diverse stakeholders nurtures a sustainable culture, while a comprehensive monitoring and evaluation system facilitates periodic assessment and adaptive strategies based on metrics and stakeholder feedback. Embracing perpetual learning and adaptability fosters awareness of emerging trends, technologies, and exemplary practices in hospital sustainability.
4. Policy Framework for Sustainable Hospitals in Pakistan
A comprehensive policy framework (see Figure 10) is developed in the current study, aimed at enhancing the sustainability of existing hospital buildings and providing guidance for constructing new hospitals.
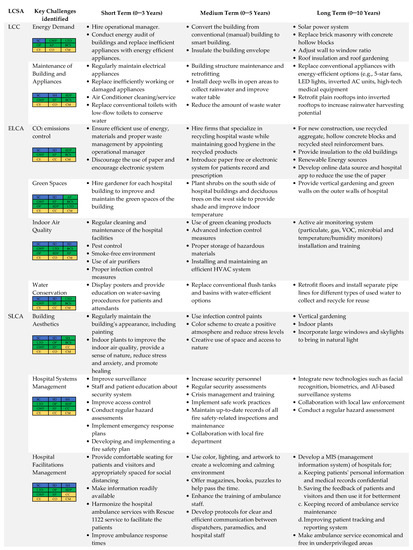
Figure 10.
Policy framework for sustainable hospital building development in Pakistan.
The framework encompasses short-term, medium-term, and long-term policies, targeting three pillars of sustainability, as provided in the first column of this figure. In the second column, the key challenges identified in the results and discussion sections of this study are listed, demanding significant attention and offering the potential to enhance a hospital building’s sustainability. The policies presented in Figure 10 are specifically tailored to address the identified challenges. To provide further clarity, a small tabular code of indicators of LCSA is provided, illustrating the potential impact of these policies on different aspects of sustainability. During the course of this research, it was noted that public hospitals, despite their paramount significance, frequently encounter various crucial challenges that significantly impact their sustainability and overall performance. Poor management is a major factor contributing to the lower sustainability values of public hospitals. This encompasses a range of issues, such as insufficient staffing, inadequate funding, and a lack of proper planning and decision-making processes. These issues can result in poor resource allocation, ineffective maintenance practices, and an inability to respond to changing health needs and demands. Another issue contributing to the lower sustainability of public hospitals is the conventional design of these buildings. This includes using outdated building codes, limited use of energy-efficient technologies, and a lack of consideration for the unique needs of healthcare buildings. As a result, public hospitals experience higher energy consumption, greater environmental impacts, and a less effective healthcare environment.
Neglecting operation and maintenance practices is another major issue that affects the sustainability of public hospitals. This involves failing to address repair and maintenance needs, neglecting to implement energy-saving measures, and not paying enough attention to critical aspects of building management, such as indoor air quality and lighting. These issues can result in increased costs, decreased comfort levels, and a higher potential for health problems. Finally, political involvement can also have a significant impact on the sustainability of public hospitals [45]. This includes short-term decision-making processes, political pressure to prioritize certain projects over others, and a lack of accountability for the long-term impacts of healthcare policies and initiatives. These issues can lead to an inconsistent approach to healthcare and impede progress toward implementing a more sustainable and effective healthcare system.
Kurji et al. [46] explained that the healthcare system’s inequality in Pakistan is due to the underqualified administration, which develops policies without the involvement of relevant professionals, and the fact that no lessons are learned for the future. Considering the above issues, a policy framework has been developed to improve the sustainability of existing public hospitals in the current study. One of the key measures in the proposed framework is a strong focus on reducing energy demand. To reduce hospital energy use, implementing short-term solutions such as installing energy-efficient equipment, lighting, and improved building insulation should be considered. Building energy audits [93] should be carried out to identify and replace inefficient appliances with energy-efficient appliances regularly. Also, hiring expert operation managers to control energy demand by efficiently using electrical appliances will help [94]. In the long term, installing photovoltaic cells can provide a source of green energy, further reducing the environmental impact of public hospitals.
Moreover, providing building envelope insulation [95] and green walls [87] will reduce energy demand for HVAC and increase building aesthetics, adding to social sustainability. The usage of natural lighting sources should be maximized by optimizing the ratio of walls to windows and by incorporating skylights, which will decrease the reliance on artificial lighting sources such as grid power and generators during power outages. The construction of a new hospital should prioritize energy efficiency and environmental sustainability. This can be partially achieved by replacing brick masonry walls with concrete hollow blocks, adjusting the window-to-wall ratio for optimal natural light utilization, and installing roof insulation [96].
The buildings should rely on solar energy instead of fossil fuels. Further, using smart building sensors [97] can help reduce energy use. Instead of the conventional rooftop, it should be constructed as an efficient catchment for rainwater collection [98]. To further reduce GHG emissions, recycled materials should be used in new construction, and the outer brick masonry walls in existing hospitals can be replaced with grooved concrete blocks for potential vertical gardening [99]. Waste-management and air-monitoring systems should be installed, and the buildings should have a separate piping system for water collection and recycling. Water use should also be reduced by replacing conventional water fixtures with low-flow water fixtures [100]. The aesthetic look and comfort of the building should be improved through vertical gardening, painting the walls, and planting trees. The color scheme inside the building should provide a warm and healing effect [101]. Laws on medical waste handling and disposal should be developed, and the hospital should have dedicated gardeners and staff for maintenance. The hospital should also have optimized and efficient bed space, dedicated waiting areas, and proper wall-to-window ratios for leveraging natural light.
Moreover, advanced and well-monitored security, firefighting, and disaster-management systems should be installed in public hospitals. It has been found during the survey conducted in the current study that the ambulance services of public hospitals are either not available or inadequate. Therefore, people have to use private ambulances or vehicles, which is costly. Therefore, public hospitals should have fully equipped advanced ambulances that provide economical services, and in some underprivileged areas, this service should be free. These steps allow public hospitals to become more sustainable and provide a healthier environment for patients and staff.
5. Conclusions
Developing nations like Pakistan face unique challenges in achieving sustainability due to social, economic, and environmental factors. This study highlights the importance of the LCSA in evaluating the sustainability of hospital buildings and emphasizes the need to integrate LCSA into the design, construction, operation, and maintenance of hospital facilities. Moreover, this research presents a policy framework for constructing sustainable healthcare buildings that consider the country’s climate and demographic conditions, which can also guide the improvement of sustainability in existing hospital buildings.
The study performed a cradle-to-grave LCSA on public hospitals with conventional design and practice and compared them with a LEED-certified base hospital (H19). H19 showed significantly lower carbon emissions than public hospitals, emitting 733.20 kg CO2e per bed annually, while public hospitals released an average of 1865.44 kg CO2e per bed per year. The environmental impacts of the H19 were lower due to its green architecture, smart building features, energy-efficient practices, use of photovoltaic energy, and high-quality maintenance. The poor sustainability performance of public hospital buildings necessitates urgent attention to ensure that these institutions can sustainably meet the current and future healthcare needs of the population. The CLD visualized in the current study emphasizes that improving sustainability requires considering the interconnectedness of indicators within LCSA.
A holistic policy framework is presented in this study that aims to optimize the sustainability of hospital buildings with short-term, medium-term, and long-term policies. Installing energy-efficient equipment and lighting, building energy audits, and hiring an operations manager are recommended to reduce energy demand. Furthermore, green walls and roofs can enhance building aesthetics while reducing the cooling load inside the buildings. Staff training is recommended to cultivate a sustainability mindset that encourages reduced energy and water consumption, decreases waste generation, and raises awareness about sustainability. Hospitals can encourage stakeholders to actively participate in environmental stewardship by promoting sustainable behaviors and practices.
Additionally, educating patients on the impact of their behavior on the environment can help foster a culture of sustainability. To reduce paper waste, an electronic information management system should be implemented. The policy framework also suggests measures to enhance public hospital buildings’ aesthetic appeal and comfort by implementing vertical gardening, planting trees, and painting the walls. In light of the observed gap in the current study, it is proposed that future research should focus on conducting comprehensive investigations into the impact of sustainability initiatives on medical spaces and operational costs within hospital design and space planning. Finally, public hospitals must prioritize sustainability in their operations, and the government must provide adequate funding and an enabling environment that supports sustainability efforts.
Author Contributions
Conceptualization, Z.U. and A.R.N.; data curation, Z.U., A.R.N., F.U., M.J.T. and A.M.; investigation, Z.U., A.R.N. and M.J.T.; methodology, Z.U., A.R.N. and M.J.T., project administration, A.R.N., F.U., M.J.T., F.K.A. and A.M., writing—original draft preparation, Z.U. and A.R.N.; writing—review and editing, Z.U., A.R.N., F.U., F.K.A. and A.M.; supervision, A.R.N. and F.U. funding acquisition, F.K.A. All authors have read and agreed to the published version of the manuscript.
Funding
This research was funded by the Researchers Supporting Project number (RSP2023R264), King Saud University, Riyadh, Saudi Arabia.
Data Availability Statement
Data are available with the first author and can be shared upon reasonable request.
Acknowledgments
The authors extend their appreciation to the Researchers Supporting Project number (RSP2023R264), King Saud University, Riyadh, Saudi Arabia, for funding this work.
Conflicts of Interest
The authors declare no conflict of interest.
Abbreviations
| BOQS | Bill of Quantities |
| CMU | Concrete Masonry Unit |
| CO2E | Carbon Dioxide Equivalent |
| CLD | Causal Loop Diagram |
| ELCA | Environmental Life Cycle Assessment |
| EW | East–West |
| FU | Functional Unit |
| GHG | Greenhouse Gas |
| HVAC | Heating, Ventilation, and Air Conditioning |
| IOT | Internet of things |
| LCA | Life Cycle Assessment |
| LCC | Life Cycle Cost |
| LCIA | Life Cycle Impact Assessment |
| LCSA | Life Cycle Sustainability Assessment |
| LEED | Leadership in Energy and Environmental Design |
| MRS | Market Rate System |
| NS | North–South |
| RCC | Reinforced Cement Concrete |
| SLCA | Social Life Cycle Assessment |
| WWRB | Windows to Wall Ratio of Building |
References
- Lenzen, M.; Malik, A.; Li, M.; Fry, J.; Weisz, H.; Pichler, P.-P.; Chaves, L.S.M.; Capon, A.; Pencheon, D. The environmental footprint of health care: A global assessment. Lancet Planet. Health 2020, 4, e271–e279. [Google Scholar] [CrossRef] [PubMed]
- Borges de Oliveira, K.; dos Santos, E.F.; Neto, A.F.; de Mello Santos, V.H.; de Oliveira, O.J. Guidelines for efficient and sustainable energy management in hospital buildings. J. Clean. Prod. 2021, 329, 129644. [Google Scholar] [CrossRef]
- U.S. Energy Information Administration. Commercial Buildings Energy Consumption Survey 2012. Available online: https://www.eia.gov/consumption/commercial/ (accessed on 22 September 2022).
- Karliner, J.; Slotterback, S.; Boyd, R.; Ashby, B.; Steele, K.; Wang, J. Health care’s climate footprint: The health sector contribution and opportunities for action. Eur. J. Public Health 2020, 30, ckaa165.843. [Google Scholar] [CrossRef]
- Affair, H. Health Care Pollution and Public Health Damage in the United States: An Update. Health Aff. 2020, 39, 2071–2079. [Google Scholar] [CrossRef]
- Malik, A.; Lenzen, M.; McAlister, S.; McGain, F. The carbon footprint of Australian health care. Lancet Planet. Health. 2018, 1, 27–35. [Google Scholar] [CrossRef]
- Wu, R. The carbon footprint of the Chinese health-care system: An environmentally extended input–output and structural path analysis study. Lancet Planet. Health 2019, 3, e413–e419. [Google Scholar] [CrossRef]
- Drew, J.; Christie, S.D.; Tyedmers, P.; Smith-Forrester, J.; Rainham, D. Operating in a Climate Crisis: A State-of-the-Science Review of Life Cycle Assessment within Surgical and Anesthetic Care. Environ. Health Perspect. 2021, 129, 076001. [Google Scholar] [CrossRef] [PubMed]
- Drew, J.; Christie, S.D.; Rainham, D.; Rizan, C. HealthcareLCA: An open-access living database of health-care environmental impact assessments. Lancet Planet. Health 2022, 6, e1000–e1012. [Google Scholar] [CrossRef] [PubMed]
- GGHH. Global Green and Healthy Hospitals (GGHH), Healthcare without Harm. Available online: https://www.greenhospitals.net/ (accessed on 10 February 2023).
- Pereno, A.; Eriksson, D. A multi-stakeholder perspective on sustainable healthcare: From 2030 onwards. Futures 2020, 122, 102605. [Google Scholar] [CrossRef] [PubMed]
- Alejandrino, C.; Mercante, I.; Bovea, M.D. Life cycle sustainability assessment: Lessons learned from case studies. Environ. Impact Assess. Rev. 2021, 87, 106517. [Google Scholar] [CrossRef]
- Llatas, C.; Soust-Verdaguer, B.; Passer, A. Implementing Life Cycle Sustainability Assessment during design stages in Building Information Modelling: From systematic literature review to a methodological approach. Build. Environ. 2020, 182, 107164. [Google Scholar] [CrossRef]
- Cristiano, S.; Ulgiati, S.; Gonella, F. Systemic sustainability and resilience assessment of health systems, addressing global societal priorities: Learnings from a top nonprofit hospital in a bioclimatic building in Africa. Renew. Sustain. Energy Rev. 2021, 141, 110765. [Google Scholar] [CrossRef]
- Troullaki, K.; Rozakis, S.; Kostakis, V. Bridging barriers in sustainability research: A review from sustainability science to life cycle sustainability assessment. Ecol. Econ. 2021, 184, 107007. [Google Scholar] [CrossRef]
- Azadi, M.; Yousefi, S.; Farzipoor Saen, R.; Shabanpour, H.; Jabeen, F. Forecasting sustainability of healthcare supply chains using deep learning and network data envelopment analysis. J. Bus. Res. 2023, 154, 113357. [Google Scholar] [CrossRef]
- Bharathi, R.; Abirami, T.; Dhanasekaran, S.; Gupta, D.; Khanna, A.; Elhoseny, M.; Shankar, K. Energy efficient clustering with disease diagnosis model for IoT based sustainable healthcare systems. Sustain. Comput. Inform. Syst. 2020, 28, 100453. [Google Scholar] [CrossRef]
- García-Sanz-Calcedo, J.; de Sousa Neves, N.; Almeida Fernandes, J.P. Measurement of embodied carbon and energy of HVAC facilities in healthcare centers. J. Clean. Prod. 2021, 289, 125151. [Google Scholar] [CrossRef]
- Campion, N.; Thiel, C.L.; Woods, N.C.; Swanzy, L.; Landis, A.E.; Bilec, M.M. Sustainable healthcare and environmental impacts of disposable supplies: A focus on disposable custom packs. J. Clean. Prod. 2015, 94, 46–55. [Google Scholar] [CrossRef]
- Guzzo, D.; Carvalho, M.M.; Balkenende, R.; Mascarenhas, J. Circular business models in the medical device industry: Paths towards sustainable healthcare. Resour. Conserv. Recycl. 2020, 160, 104904. [Google Scholar] [CrossRef]
- Altmann, T.; Roth, M. Is social mindfulness perceptible and effective? Its associations with personality as judged by others and its impact on patients’ satisfaction with their care teams. Personal. Individ. Differ. 2023, 201, 111920. [Google Scholar] [CrossRef]
- Yakusheva, O.; Czerwinski, M.A.; Buerhaus, P.I. Value-informed nursing practice is needed to make our healthcare systems more environmentally sustainable. Nurs. Outlook 2022, 70, 377–380. [Google Scholar] [CrossRef]
- Alamelu, R.; Rengarajan, V.; Dinesh, S.; Nalini, R.; Shobhana, N.; Amudha, R. Sustainable supply chain practices with reverse innovation in healthcare start-ups—A Structural Equation Model (SEM) approach. Mater. Today Proc. 2022, 52, 882–887. [Google Scholar] [CrossRef]
- Alam Khan, F.; Asif, M.; Ahmad, A.; Alharbi, M.; Aljuaid, H. Blockchain technology, improvement suggestions, security challenges on smart grid and its application in healthcare for sustainable development. Sustain. Cities Soc. 2020, 55, 102018. [Google Scholar] [CrossRef]
- Chauhan, A.; Jakhar, S.K.; Jabbour, C.J.C. Implications for sustainable healthcare operations in embracing telemedicine services during a pandemic. Technol. Forecast. Soc. Chang. 2022, 176, 121462. [Google Scholar] [CrossRef] [PubMed]
- Pantzartzis, E.; Edum-Fotwe, F.T.; Price, A.D.F. Sustainable healthcare facilities: Reconciling bed capacity and local needs. Int. J. Sustain. Built Environ. 2017, 6, 54–68. [Google Scholar] [CrossRef]
- McAlister, S.; Grant, T.; McGain, F. An LCA of hospital pathology testing. Int. J. Life Cycle Assess. 2021, 26, 1753–1763. [Google Scholar] [CrossRef]
- Oderanti, F.O.; Li, F.; Cubric, M.; Shi, X. Business models for sustainable commercialisation of digital healthcare (eHealth) innovations for an increasingly ageing population. Technol. Forecast. Soc. Change 2021, 171, 120969. [Google Scholar] [CrossRef]
- Rattan, T.K.; Joshi, M.; Vesty, G.; Sharma, S. Sustainability indicators in public healthcare: A factor analysis approach. J. Clean. Prod. 2022, 370, 133253. [Google Scholar] [CrossRef]
- Christian, Z.; Curley, K.L.; Richards, A.E.; Zhang, N.; Lyons, M.K.; Bendok, B.R.; Patel, N.P.; Kalani, M.A.; Neal, M.T. Factors associated with greater patient satisfaction in outpatient neurosurgical clinics: Recommendation for surgery, older age, cranial chief complaint, and public health insurance. Clin. Neurol. Neurosurg. 2022, 222, 107436. [Google Scholar] [CrossRef]
- Lockwood, C.; Munn, Z.; Jordan, Z.; Pilla, B.; Püschel, V.A.d.A.; dos Santos, K.B.; Albornos-Muñoz, L.; Kent, B.; Mu, P.-F.; Khalil, H.; et al. JBI series paper 3: The importance of people, process, evidence, and technology in pragmatic, healthcare provider-led evidence implementation. J. Clin. Epidemiol. 2022, 150, 203–209. [Google Scholar] [CrossRef] [PubMed]
- Aldoori, J.; Hartley, J.; MacFie, J. Sustainable surgery: In and out of the operating theatre. Br. J. Surg. 2021, 108, e219–e220. [Google Scholar] [CrossRef]
- Kruk, M.E.; Gage, A.D.; Arsenault, C.; Jordan, K.; Leslie, H.H.; Roder-DeWan, S.; Adeyi, O.; Barker, P.; Daelmans, B.; Doubova, S.V.; et al. High-quality health systems in the Sustainable Development Goals era: Time for a revolution. Lancet Glob. Health 2018, 6, e1196–e1252. [Google Scholar] [CrossRef]
- Aquino, R.; Barile, S.; Grasso, A.; Saviano, M. Envisioning Smart and Sustainable Healthcare: 3D-Printing Technologies for Personalized Medication. Futures 2018, 103, 35–50. [Google Scholar] [CrossRef]
- Le Douarin, Y.; Traversino, Y.; Graciet, A.; Josseran, A.; Briac Bili, A.; Blaise, L.; Chatellier, G.; Coulonjou, H.; Delval, C.; Detournay, B.; et al. Telemonitoring and experimentation in telemedicine for the improvement of healthcare pathways (ETAPES program). Sustainability beyond 2021: What type of organisational model and funding should be used? Therapies 2020, 75, 43–56. [Google Scholar] [CrossRef] [PubMed]
- Chowdhury, N.R.; Ahmed, M.; Mahmud, P.; Paul, S.K.; Liza, S.A. Modeling a sustainable vaccine supply chain for a healthcare system. J. Clean. Prod. 2022, 370, 133423. [Google Scholar] [CrossRef]
- McKee, M. Global sustainable healthcare. Medicine 2018, 46, 383–387. [Google Scholar] [CrossRef]
- Mousa, S.K.; Othman, M. The impact of green human resource management practices on sustainable performance in healthcare organisations: A conceptual framework. J. Clean. Prod. 2020, 243, 118595. [Google Scholar] [CrossRef]
- Mehra, R.; Sharma, M. Measures of Sustainability in Healthcare. Sustain. Anal. Model. 2021, 1, 100001. [Google Scholar] [CrossRef]
- Giusti, M.; Persiani, N.; Fissi, S.; Ricci, R. Planning and Managing of Diagnostic Imaging Technologies in Healthcare: The Introduction of Managed Equipment Service (MES) for the System’s Sustainability. In Proceedings of the KnE Social Sciences—Economies of the Balkan and Eastern European Countries, Bucharest, Romania, 10–12 May 2019. [Google Scholar]
- Hearld, L.; Alexander, J.A.; Wolf, L.J.; Shi, Y. Funding profiles of multisector health care alliances and their positioning for sustainability. J. Health Organ. Manag. 2018, 32, 587–602. [Google Scholar] [CrossRef] [PubMed]
- Chang, H.-T.; Jerng, J.-S.; Chen, D.-R. Reduction of healthcare costs by implementing palliative family conference with the decision to withdraw life-sustaining treatments. J. Formos. Med. Assoc. 2020, 119, 34–41. [Google Scholar] [CrossRef]
- Marimuthu, M.; Paulose, H. Emergence of Sustainability Based Approaches in Healthcare: Expanding Research and Practice. Procedia Soc. Behav. Sci. 2016, 224, 554–561. [Google Scholar] [CrossRef]
- Callen, M.; Gulzar, S.; Hasanain, A.; Khan, A.R.; Khan, Y.; Mehmood, M.Z. Improving public health delivery in Punjab, Pakistan: Issues and opportunities. Lahore J. Econ. 2013, 18, 249. [Google Scholar] [CrossRef]
- Deborah, M. Poor healthcare in Pakistan. Harv. Int. Rev. 2014, 35, 52. [Google Scholar]
- Kurji, Z.; Premani, Z.; Mithani, Y. Analysis of The Health Care System of Pakistan: Lessons Learnt and Way Forward. J. Ayub Med. Coll. Abbottabad 2016, 28, 601–604. [Google Scholar]
- Backes, J.G.; Traverso, M. Life cycle sustainability assessment as a metrics towards SDGs agenda 2030. Curr. Opin. Green Sustain. Chem. 2022, 38, 100683. [Google Scholar] [CrossRef]
- Khowaja, K. Healthcare Systems and Care Delivery in Pakistan. JONA J. Nurs. Adm. 2009, 39, 263–265. [Google Scholar] [CrossRef]
- Kloepffer, W. Life cycle sustainability assessment of products. Int. J. Life Cycle Assess. 2008, 13, 89–95. [Google Scholar] [CrossRef]
- Häfliger, I.-F.; John, V.; Passer, A.; Lasvaux, S.; Hoxha, E.; Saade, M.R.M.; Habert, G. Buildings environmental impacts’ sensitivity related to LCA modelling choices of construction materials. J. Clean. Prod. 2017, 156, 805–816. [Google Scholar] [CrossRef]
- Cabeza, L.F. Buildings Life Cycle Assessment. In Reference Module in Earth Systems and Environmental Sciences; Elsevier: Amsterdam, The Netherlands, 2022. [Google Scholar]
- Fuhg, J.N.; Hamel, C.M.; Johnson, K.; Jones, R.; Bouklas, N. Modular machine learning-based elastoplasticity: Generalization in the context of limited data. Comput. Methods Appl. Mech. Eng. 2023, 407, 115930. [Google Scholar] [CrossRef]
- Morgenstern, P.; Li, M.; Raslan, R.; Ruyssevelt, P.; Wright, A. Benchmarking acute hospitals: Composite electricity targets based on departmental consumption intensities? Energy Build. 2016, 118, 277–290. [Google Scholar] [CrossRef]
- Morsi, D.M.A.; Ismaeel, W.S.E.; Ehab, A.; Othman, A.A.E. BIM-based life cycle assessment for different structural system scenarios of a residential building. Ain Shams Eng. J. 2022, 13, 101802. [Google Scholar] [CrossRef]
- Ding, G.K.C. Life cycle energy assessment of Australian secondary schools. Build. Res. Inf. 2007, 35, 487–500. [Google Scholar] [CrossRef]
- Feng, H.; Zhao, J.; Zhang, H.; Zhu, S.; Li, D.; Thurairajah, N. Uncertainties in whole-building life cycle assessment: A systematic review. J. Build. Eng. 2022, 50, 104191. [Google Scholar] [CrossRef]
- Fatourehchi, D.; Zarghami, E. Social sustainability assessment framework for managing sustainable construction in residential buildings. J. Build. Eng. 2020, 32, 101761. [Google Scholar] [CrossRef]
- Khamis, K.; Njau, B. Patients’ level of satisfaction on quality of health care at Mwananyamala hospital in Dar es Salaam, Tanzania. BMC Health Serv. Res. 2014, 14, 400. [Google Scholar] [CrossRef]
- Catalano, M.A.; Hemli, J.M.; Yu, P.-J.; Scheinerman, S.J.; Hartman, A.R.; Patel, N.C. Patient Satisfaction Scores After Cardiac Surgery: Should They Be Risk-Adjusted? Semin. Thorac. Cardiovasc. Surg. 2022. [Google Scholar] [CrossRef]
- Myburgh, N.G.; Solanki, G.C.; Smith, M.J.; Lalloo, R. Patient satisfaction with health care providers in South Africa: The influences of race and socioeconomic status. Int. J. Qual. Health Care 2005, 17, 473–477. [Google Scholar] [CrossRef] [PubMed]
- Nimlyat, P.S. Indoor environmental quality performance and occupants’ satisfaction [IEQPOS] as assessment criteria for green healthcare building rating. Build. Environ. 2018, 144, 598–610. [Google Scholar] [CrossRef]
- Elnaklah, R.; Walker, I.; Natarajan, S. Moving to a green building: Indoor environment quality, thermal comfort and health. Build. Environ. 2021, 191, 107592. [Google Scholar] [CrossRef]
- Yi, P.; Li, W.; Zhang, D. Sustainability assessment and key factors identification of first-tier cities in China. J. Clean. Prod. 2021, 281, 125369. [Google Scholar] [CrossRef]
- Ayarkwa, J.; Joe Opoku, D.-G.; Antwi-Afari, P.; Li, R.Y.M. Sustainable building processes’ challenges and strategies: The relative important index approach. Clean. Eng. Technol. 2022, 7, 100455. [Google Scholar] [CrossRef]
- Veenhoven, R. Developments in satisfaction-research. Soc. Indic. Res. 1996, 37, 1–46. [Google Scholar] [CrossRef]
- Johnson, J.; LeBreton, J. History and Use of Relative Importance Indices in Organizational Research. Organ. Res. Methods 2004, 7, 238–257. [Google Scholar] [CrossRef]
- Akber, M.Z.; Thaheem, M.J.; Arshad, H. Life cycle sustainability assessment of electricity generation in Pakistan: Policy regime for a sustainable energy mix. Energy Policy 2017, 111, 111–126. [Google Scholar] [CrossRef]
- Arshad, H.; Thaheem, M.J.; Bakhtawar, B.; Shrestha, A. Evaluation of Road Infrastructure Projects: A Life Cycle Sustainability-Based Decision-Making Approach. Sustainability 2021, 13, 3743. [Google Scholar] [CrossRef]
- Kumar, C.N.; Subba Reddy, Y.V.; Adi Kesava Naidu, O.; Srinivas, R. Role of proposed Relative Importance Index (RII) in acute ST segment elevation Myocardial Infarction patients in relation to prognosis and complexity of the lesion. Indian Heart J. 2014, 66, S33. [Google Scholar] [CrossRef][Green Version]
- Sdino, L.; Brambilla, A.; Dell’Ovo, M.; Sdino, B.; Capolongo, S. Hospital Construction Cost Affecting Their Lifecycle: An Italian Overview. Healthcare 2021, 9, 888. [Google Scholar] [CrossRef] [PubMed]
- Bhattacharjee, B. Some issues related to service life of concrete structures. Indian Concr. J. 2012, 86, 23–29. [Google Scholar]
- Kim, T.-H.; Choi, J.-S.; Park, Y.; Son, K. Life Cycle Costing: Maintenance and Repair Costs of Hospital Facilities Using Monte Carlo Simulation. J. Korea Inst. Build. Constr. 2013, 13, 541–548. [Google Scholar] [CrossRef]
- State Bank of Pakistan. Monetary Policy. Available online: https://www.sbp.org.pk/m_policy/index.asp (accessed on 28 November 2022).
- Farr, J.V. Systems Life Cycle Costing: Economic Analysis, Estimation, and Management; Taylor & Francis: Abingdon, UK, 2011. [Google Scholar]
- UN Environment Programme. Guidelines for Social Life Cycle Assessment of Products and Organisations 2020; UN Environment Programme: Nairobi, Kenya, 2020. [Google Scholar]
- Kumar, P.; Datta, S.K. Interdependence between environmental performance and economic growth with a policy approach towards sustainability: Evidence from panel data. Curr. Res. Environ. Sustain. 2021, 3, 100105. [Google Scholar] [CrossRef]
- Dong, Y.H.; Ng, S.T. A modeling framework to evaluate sustainability of building construction based on LCSA. Int. J. Life Cycle Assess. 2016, 21, 555–568. [Google Scholar] [CrossRef]
- Vinyes, E.; Oliver-Solà, J.; Ugaya, C.; Rieradevall, J.; Gasol, C.M. Application of LCSA to used cooking oil waste management. Int. J. Life Cycle Assess. 2013, 18, 445–455. [Google Scholar] [CrossRef]
- Roinioti, A.; Koroneos, C. Integrated life cycle sustainability assessment of the Greek interconnected electricity system. Sustain. Energy Technol. Assess. 2019, 32, 29–46. [Google Scholar] [CrossRef]
- Han, S.; Yao, R.; Essah, E. Developing a theoretical framework to assist policymaking for retrofitting residential buildings using system player analysis and causal loop diagrams. J. Clean. Prod. 2023, 411, 137211. [Google Scholar] [CrossRef]
- Du, M.; Zhao, M.; Fu, Y. Revisiting urban sustainability from access to jobs: Assessment of economic gain versus loss of social equity. Environ. Impact Assess. Rev. 2020, 85, 106456. [Google Scholar] [CrossRef]
- Minunno, R.; O’Grady, T.; Morrison, G.M.; Gruner, R.L. Investigating the embodied energy and carbon of buildings: A systematic literature review and meta-analysis of life cycle assessments. Renew. Sustain. Energy Rev. 2021, 143, 110935. [Google Scholar] [CrossRef]
- Amini Toosi, H.; Lavagna, M.; Leonforte, F.; Del Pero, C.; Aste, N. Life Cycle Sustainability Assessment in Building Energy Retrofitting; A Review. Sustain. Cities Soc. 2020, 60, 102248. [Google Scholar] [CrossRef]
- Ravaghi, H.; Alidoost, S.; Mannion, R.; Bélorgeot, V.D. Models and methods for determining the optimal number of beds in hospitals and regions: A systematic scoping review. BMC Health Serv. Res. 2020, 20, 186. [Google Scholar] [CrossRef]
- Batista, A.P.; Freitas, M.E.A.; Jota, F.G. Evaluation and improvement of the energy performance of a building’s equipment and subsystems through continuous monitoring. Energy Build. 2014, 75, 368–381. [Google Scholar] [CrossRef]
- Ala’raj, M.; Radi, M.; Abbod, M.F.; Majdalawieh, M.; Parodi, M. Data-driven based HVAC optimisation approaches: A Systematic Literature Review. J. Build. Eng. 2022, 46, 103678. [Google Scholar] [CrossRef]
- Manso, M.; Teotónio, I.; Silva, C.M.; Cruz, C.O. Green roof and green wall benefits and costs: A review of the quantitative evidence. Renew. Sustain. Energy Rev. 2021, 135, 110111. [Google Scholar] [CrossRef]
- Park, M.Y.; Chai, C.-G.; Lee, H.-K.; Moon, H.; Noh, J.S. The effects of natural daylight on length of hospital stay. Environ. Health Insights 2018, 12, 1178630218812817. [Google Scholar] [CrossRef] [PubMed]
- Canellas, F.; Mestre, L.; Belber, M.; Frontera, G.; Rey, M.A.; Rial, R. Increased daylight availability reduces length of hospitalisation in depressive patients. Eur. Arch. Psychiatry Clin. Neurosci. 2016, 266, 277–280. [Google Scholar] [CrossRef]
- Gul, M.; Guneri, A.F. Hospital Location Selection: A Systematic Literature Review on Methodologies and Applications. Math. Probl. Eng. 2021, 2021, 6682958. [Google Scholar] [CrossRef]
- Vicente, P.; Sampaio, A.; Reis, E. Factors influencing passenger loyalty towards public transport services: Does public transport providers’ commitment to environmental sustainability matter? Case Stud. Transp. Policy 2020, 8, 627–638. [Google Scholar] [CrossRef]
- Haas, D.; Pozehl, B.; Alonso, W.W.; Diederich, T. Patient Satisfaction with a Nurse Practitioner–Led Heart Failure Clinic. J. Nurse Pract. 2022, 19, 104496. [Google Scholar] [CrossRef]
- Mohamed, O.; Fakhoury, S.; Aldalou, G.; Almasri, G. Energy Auditing and Conservation for Educational Buildings: A Case Study on Princess Sumaya University for Technology. Process Integr. Optim. Sustain. 2022, 6, 901–920. [Google Scholar] [CrossRef]
- Tian, Z.; Zhang, X.; Shi, X.; Han, Y. Mining operation hours on time-series energy data to identify unnecessary building energy consumption. J. Build. Eng. 2023, 63, 105509. [Google Scholar] [CrossRef]
- Cui, B.; Dong, J.; Lee, S.; Im, P.; Salonvaara, M.; Hun, D.; Shrestha, S. Model predictive control for active insulation in building envelopes. Energy Build. 2022, 267, 112108. [Google Scholar] [CrossRef]
- Chel, A.; Kaushik, G. Renewable energy technologies for sustainable development of energy efficient building. Alex. Eng. J. 2018, 57, 655–669. [Google Scholar] [CrossRef]
- Shah, S.F.A.; Iqbal, M.; Aziz, Z.; Rana, T.A.; Khalid, A.; Cheah, Y.-N.; Arif, M. The Role of Machine Learning and the Internet of Things in Smart Buildings for Energy Efficiency. Appl. Sci. 2022, 12, 7882. [Google Scholar] [CrossRef]
- Pradhan, R.; Sahoo, J.P. Smart rain water harvesting techniques. Int. J. Water 2021, 14, 141–166. [Google Scholar] [CrossRef]
- Madushika, U.G.D.; Ramachandra, T.; Zainudeen, N. Energy and life cycle cost saving potential of buildings using green walls: A case study from Sri Lanka. J. Green Build. 2022, 17, 179–197. [Google Scholar] [CrossRef]
- Tourigny, A.; Filion, Y. Sensitivity Analysis of an Agent-Based Model Used to Simulate the Spread of Low-Flow Fixtures for Residential Water Conservation and Evaluate Energy Savings in a Canadian Water Distribution System. J. Water Resour. Plan. Manag. 2019, 145, 04018086. [Google Scholar] [CrossRef]
- Mirzaei, M.; Movahed, K. The effect of color of medical buildings in reducing stress and length of treatment (Case study: Kowsar Hospital, Shiraz). J. Urban Dev. Archit. Environ. Identity JUDA-EI 2020, 1, 60–72. [Google Scholar]


Disclaimer/Publisher’s Note: The statements, opinions and data contained in all publications are solely those of the individual author(s) and contributor(s) and not of MDPI and/or the editor(s). MDPI and/or the editor(s) disclaim responsibility for any injury to people or property resulting from any ideas, methods, instructions or products referred to in the content. |
© 2023 by the authors. Licensee MDPI, Basel, Switzerland. This article is an open access article distributed under the terms and conditions of the Creative Commons Attribution (CC BY) license (https://creativecommons.org/licenses/by/4.0/).