Abstract
The possibility of blast impact loads acting on bridge structures is gradually increasing. The local and entire explosion response law of a concrete box girder bridge is still unclear, and anti-explode devices for reducing the entire explosion response of a bridge are scarce. In this study, a rotational inertia particle damper (R-IPD) and a 1:4 scale model of a typical three-span continuous-girder bridge were designed and manufactured. Subsequently, an explosion test of the bridge model with and without R-IPDs was conducted. The results showed that the local dynamic response (LDR) of the bridge model was more likely to occur under an explosion load. The local overpressure, strain, and acceleration responses of the box girder near the explosion centre were more significant than those at other locations or of other components. Moreover, the LDR of the box girder was similar in the middle and side spans. As the explosive equivalent (EE) increased, the entire displacement response (EDR) of the model bridge increased. Under the same EE conditions, a larger span suffered a larger EDR. After the R-IPD installation, the EDR of the bridge model decreased. Furthermore, the damping effect of the R-IPDs on the EDR of the bridge model increased with an increase in the EE, and the maximum vibration reduction rate was up to 12%. However, the damping effect of the R-IPDs on the LDR of the model bridge was not obvious. The damping effect of the R-IPDs depended on the relative displacement between the two ends of the damper and exhibited obvious hysteresis.
1. Introduction
The anti-explosion ability of bridge structures has become the focus of structural designers [1], which is an important aspect of transportation and urban resilience. Therefore, the explosion response and anti-explosion performance of bridge structures, as well as innovative anti-explosion devices, have become popular research topics in recent years [2,3,4]. Numerous experimental and numerical studies have been conducted to clarify the explosion response law and anti-explosion performance of bridge structures.
In terms of experimental studies, Son [5] pointed out that the steel box girder deck near the bridge tower underwent severe plastic deformation and local breaches under an explosion load, but the steel box girder still exhibited good overall bearing performance. Rong [6,7] considered the influence of the explosion load and structural size on the dynamic response of a structure and clarified the sensitivity of the deformation and dynamic response of a structure to an explosion load. Yao [8] studied the influence of EE and initiation distance on the damage to a beam through a near-field explosion load test and found that the cracked area of the beam increased with a decrease in the initiation distance. Moreover, the damage mode of the beam was bending failure. Winget [9] summarised the influence of an explosion load on a bridge structure and indicated that the dynamic response of the bridge under an explosion load largely depended on the bridge geometry. Zong carried out the explosion test of a continuous bridge with an RC column, and the local impact response of the main beam was systematically analysed [10].
In terms of numerical studies, Tang [11,12] simulated the explosion response of a separated steel box girder of a cable-stayed bridge with an explosive equivalent (EE) of 1000 kg TNT using the equivalent static load method. The results showed that the concrete pavement layer and bridge deck of the separated steel box girder were seriously damaged under the simulated explosion load, whereas the bottom plate and mediastinal plate of the main beam were less damaged. The explosion load had little effect on the mechanical performance of the main beam. Cofer [13] conducted numerical simulation research on the anti-explosion performance of prestressed concrete beam bridges and carried out an anti-explosion test of a single beam. The results indicated that the damage mode of the main beam was a shear failure under an explosion load. Shiravand [14] studied the dynamic response of a prestressed concrete box girder under a near-field explosion load through numerical simulation and indicated that the explosion shock wave could be enhanced by 2.7 times in a box girder. Moreover, the failure of the anchorage area caused a loss of prestress. Wang [15] studied the dynamic response law of an RC continuous beam bridge under an explosion load via numerical simulation and indicated that the anti-explosion performance of the middle span was the weakest when the explosion load was located on the upper deck. Additionally, an internal explosion can cause more serious damage to bridges.
Based on the above-mentioned, reinforced concrete beams and slabs with different structures exhibit different dynamic responses and failure modes under different explosion loads. The main failure modes of the main beams of bridges include flexural shear failure, flexural failure, and shear failure under explosion loads. The explosion response law and anti-explosion performance of single beams, slabs, and column components have been widely studied. However, the explosion response law and anti-explosion performance of an entire bridge have not been comprehensively investigated, and relevant experimental results are rare.
Moreover, owing to the significant difference in explosion damage modes, the corresponding anti-explosion methods for reinforced concrete beams, slabs, and columns are significantly different. To reinforce concrete beams, Ahmed [16] proposed a series of anti-explosion construction methods for bridges, including increasing the interval distance, arranging safe shelving, using high-ductility materials, and increasing the support width. Omar [17,18,19] found that steel fibres could significantly improve the anti-explosion performance of high-strength concrete beams through experimental research. Moreover, the peak and residual displacements of beams decreased for the same EE. Liu [20] pointed out that glass fibre-reinforced concrete beams exhibit excellent anti-explosion performance under near-field explosion loads. Qu [21] studied the influence of a steel slab on the dynamic characteristics of a T-beam under an explosion load through numerical simulation and concluded that the reinforcement method had the best anti-explosion performance. However, the local steel slab reinforcement provided a limited improvement over the entire anti-explosion performance of the T-beam. Liao [22] pointed out that high-strength reinforcement can effectively reduce the deformation, crack length, and width of a beam under an explosion load.
To reinforce concrete slabs, Wu [23] pointed out through explosion tests that the anti-explosion performance and ductility of ultra-high-performance fibre-reinforced concrete slabs were better than those of ordinary concrete slabs. Kong [24] studied the effect of FRP on the anti-explosion performance of a reinforced concrete slab through experiments and numerical simulations. The results showed that FRP delayed the cracking time and changed the failure mode of concrete spalling. However, the local FRP reinforcement had a limited effect on the entire anti-explosion performance of the reinforced concrete slab. Li [25] found through an explosion test that wire mesh-micro steel fibres could effectively alleviate the development of cracks and change the failure mode of a reinforced concrete slab. However, the local reinforcement method had little effect on the entire anti-explosion performance of the concrete slab.
To reinforce concrete columns and innovative anti-explosion structures, Fu [26] verified that a concrete-filled steel tube column exhibited good anti-explosion performance and ductility through an explosion test. Nurick [27,28] analysed the dynamic response of a metal sandwich slab under an explosion load through experiments and numerical simulations and found that the metal sandwich slab exhibited good anti-explosion performance. Li [29,30] found that a denser core layer improved the anti-explosion performance of a gradient honeycomb sandwich structure through experiments and numerical simulations. Through experiments and numerical simulations, Xu [31] found that a foamed concrete layer effectively improved the anti-explosion performance of a buried steel box.
In view of the aforementioned, in recent years, auxiliary structures or devices have been proven to improve the anti-explosion performance of reinforced concrete members such as external hanging and outsourcing steel, FRP, CFRP, and foam concrete. However, the existing anti-explosion method for reinforced concrete members is mainly suitable for local explosion response. In fact, local explosion damage has little influence on the entire mechanical performance of structures [5,11,12]. Thus, the local anti-explosion ability improvement of structural members also has a limited effect on the entire anti-explosion performance of structures [21,24,25]. An anti-explosion method for the entire explosion response control of structures has not yet been established. Accordingly, innovative anti-explosion devices should be developed, and the relevant damping effect for the entire explosion response of structures should be revealed.
In view of this, this study first proposes a rotational inertia particle damper (R-IPD). Then, the mechanical model of a single freedom system with R-IPD is established. Subsequently, a 1:4 scale model of a typical three-span continuous beam bridge, as well as the relevant R-IPD for the scale model, were designed and manufactured. On this basis, an explosion test of the bridge model with and without R-IPDs was performed. Finally, the explosion response law of the bridge model and the damping effect of the R-IPDs were systematically investigated through the overpressure, displacement, acceleration and strain parameters. The relevant findings can be used as a reference to improve the anti-explosion performance of bridge structures.
2. Experiment Design
2.1. Rotational Inertia Particle Damper
2.1.1. Operating Principle of R-IPD
The idea of R-IPD originated from the inertia viscous damper [32] and particle damper [33,34]. A particle damper (PD) is denoted as a damper, which tunes and dissipates kinetic energy of the controlled structure using additional particles [35,36,37,38]. The particles can be set in cavities of the controlled structure or additional cavities connected with the controlled structure. That is, when the controlled structure vibrates, the particles can occur in relative movement which can tune the dynamic response of the controlled structure; and the particles can also collide with the cavities which can dissipate the kinetic energy of the controlled structure. It should be pointed out that the tunning effect and dissipation capacity of a PD is significantly influenced by the movement state of the particles [38,39]. When the particles cannot occur relative movement with the controlled structure, the tunning effect and dissipation capacity of a PD is quietly limited. On this basis, this study introduced the inertia into the particle damper and proposed an R-IPD (shown in Figure 1), which can absorb energy through the inertia, and dissipate the energy through collision and friction of particles. The R-IPD mainly consisted of a metal shell, ball screw, flywheel, damper particles, and bearings.
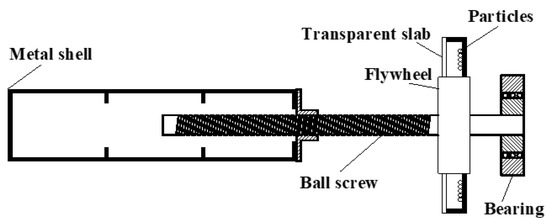
Figure 1.
Rotational inertia particle damper.
As above mentioned, when there is no particle in the cavity of the flywheel, the R-IPD can be equivalent to a common ball-screw inertial damper, which can convert the linear motion of both ends of the ball screw into a rotation of the flywheel. When there are particles in the cavity of the flywheel, the common inertial damper and particle damper are combined. In this case, due to the amplification effect of the inertial effect of the flywheel, the initial vibration condition of the particles can be reduced, and the particles can move violently. Therefore, the energy dissipation capacity of the particle damper can be improved. Moreover, the introduction of particles not only enhances the energy dissipation capacity of the original inerter, but also has little influence on the inertial capacity of the damper.
The mechanical model of a single-degree-of-freedom system with a rotational inertia particle damper (SDOF-R-IPD) is shown in Figure 2. The dynamic equation of the SDOF-R-IPD controller is expressed as
where m, c, and k are the mass, damping, and stiffness coefficients of the system with an SDOF, respectively, and FIS is the R-IPD output. ks is the effective stiffness of the R-IPD spring; min is the inertia coefficient of the R-IPD; cd is the equivalent damping coefficient of the R-IPD energy dissipation device; kd is the equivalent stiffness coefficient of the R-IPD energy dissipation device; u is the displacement of the main structure; xd is the relative displacement of both ends of the R-IPD, and p(t) is the external incentive.
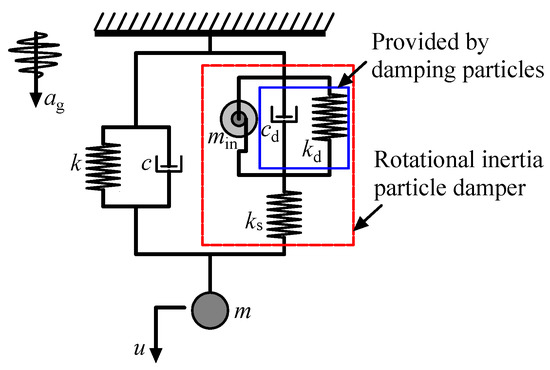
Figure 2.
Single degree of freedom system with rotational inertia particle damper.
2.1.2. Parameter Optimisation Method
According to the R-IPD operating principle, the acting torque of the flywheel and particles on the ball screw can be expressed as
where T is the driving torque of the ball screw; Js is the flywheel moment of inertia; αs is the flywheel angular acceleration; and Tij is the torque of the contact force on the wall of the damper (the impact force between the particle and cavity) relative to the flywheel shaft.
When particles do not collide with the cavity wall, the damper can be regarded as an ordinary inertial damper; that is, Tij ≈ 0 (the friction between the particles and the wall is small). When particles collide with the cavity wall, the contact force between the particles and flywheel cavity wall should be considered. We assumed that the collision model of the flywheel and particles was a soft sphere model. Moreover, because the tangential force on the flywheel centre torque was small compared to the normal force on the flywheel centre torque, the tangential force can be ignored. Thus, the loading history of the particle contact force was not considered, and elastic and damping coefficients were introduced. Accordingly, the contact force between the particles or between the particles and cavity walls can be calculated according to the overlap between these contact members. During the flywheel rotation process, the motion equation of a particle in the damping hole at a certain moment is
where mi is the particle mass; xi is the particle displacement; and Fn is the normal contact force between the particles and the cavity wall. Based on the Hertz contact theory [40,41], it was assumed that the particles collided positively with the wall and only a normal contact force was generated. The normal linear contact force of the particles is expressed as
where xf denotes the displacement of the flywheel; xi denotes the displacement of particle i; kn denotes the normal contact stiffness in the contact model; and ζ denotes the normal damping ratio. Combining Equations (2)–(4), the dynamic equation of the damper is
where is the distance between the particles and flywheel shaft, and the other parameters are the same as before. The ball screw inertial damper uses a ball screw to convert the linear motion of the two ends into the rotational motion of the flywheel [32,42], and the dynamic equation is
where ω is the rotation angular velocity of the ball screw and P is the lead of the ball screw. Equation (7) can be obtained by combining Equations (5) and (6) as
The Laplace transform of the dynamic equation of the particles in Equation (7) is obtained as
We substituted s = ω0i into Equation (8) to obtain the modulus of the displacement transfer function between the flywheel and damper as
where .
Because the displacement and velocity direction of particles are constantly changing, to ensure the accuracy of the desired superposition and relative velocity, the collision process between particles and the flywheel was divided into the following four stages. (1) The displacement and velocity directions of the particle and flywheel are opposite. (2) The displacement direction of the particle is opposite to that of the flywheel, whereas the velocity direction is the same. (3) The displacement and velocity directions of the particle and flywheel are the same, but the particle velocity is less than the flywheel velocity. (4) The displacement and velocity directions of the particle and flywheel are the same, but the particle velocity is greater than the flywheel velocity. In general, Stage (1) is used as an example for the following analysis. First, we set and assume that the frequency of the input and output responses does not change (i.e., set ). Therefore, the displacement relationship between the particle and damper can be expressed as
where xi(t) is the displacement of the particle at time t, and η is the modulus of the displacement transfer function between the particle and flywheel. Substituting Equation (10) into Equation (7) yields
The force of the damper can be obtained by combining Equations (6) and (11) to obtain
Combined with Equation (9), the parameters of the R-IPD are
where .
We can see that the stiffness coefficient term of the Փ1 equation is much larger than that of the other terms. The Փ1 value directly depends on the term of the stiffness coefficient kn, and the p value is far less than 2πr; therefore, Փ1 can be simplified using and Equation (13) can be expressed as
where is the ratio of the flywheel radius to the ball screw radius. Equation (14) shows that the inertia coefficient, damping coefficient, and stiffness coefficient of the R-IPD are closely related to the lead of the ball screw. Therefore, the equation of motion of the SDOF system with an R-IPD can be simplified as
Based on Equation (15), an analysis of the parameter influence of the dynamic response of the SDOF-R-IPD can be performed, and then the optimisation parameters of the R-IPD can be obtained. Let p(t) = −mag(t), then
where .
If the initial state of the system is static, that is, , Equation (16) can be expressed through the Laplace transform as
where .
The frequency–domain transfer function between the structural response, R-IPD response, and input excitation is
where ω0 is the input excitation frequency. Combined with Equations (16) and (19), the frequency–domain transfer function of the damping force of the R-IPD and the input excitation can be expressed as
According to random vibration theory [43,44,45], if the input power spectrum is SX(ω0) and the transfer function of the specified linear system is H(iω0), the root mean square (RMS) σY of the output response can be expressed as
In Equation (21), the RMS response of a variable system can be determined using the transfer function of the system and the input power spectrum. To simplify the analysis process, we assumed that the input excitation is a white noise excitation; that is, SX(ω0) = S0. The displacement ratio and damping force ratio between the SDOF-R-IPD system and the SDOF are given, respectively, as
In Equations (22) and (23), the displacement and damping force ratios are not related to the natural frequency w of the structure but are related to the inertial mass ratio μ and natural damping ratio ξ1 of the structure, stiffness ratio δ1, nominal damping ratio ξ2, and nominal stiffness ratio δ2 of the R-IPD. Based on the above formulas, taking the SDOF-R-IPD system with an inherent damping ratio ξ1 = 0.02 and inertial mass ratio μ = 0.1 as an example, the cloud charts of the displacement ratio and damping force ratio between the SDOF-R-IPD system and the SDOF are shown in Figure 3.
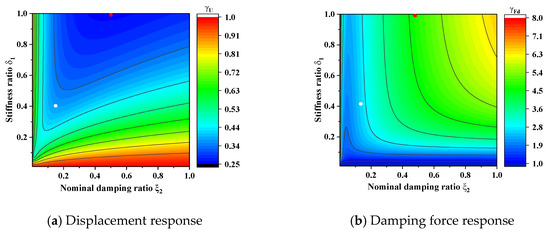
Figure 3.
Response cloud chart of SDOF-R-IPD (ξ1 = 0.02, μ = 0.1, δ2 = 0.03). The blue area represents the better damping effect of the R-IPD on the SDOF system.
As shown in Figure 3a, the upper right of the cloud chart (where the red dot is located) is the optimal damping effect. However, compared with the damping force response of Figure 3b, the damping force (regarded as the control cost) was relatively large when the damping effect was optimal. Therefore, the damping target and control cost are considered when selecting the damping design parameters of the R-IPD controller [44,45]. Although the damping effect of the white spot in the figure was not optimal, its damping force was relatively small, and the damping effect was better under the condition of low control cost. The abovementioned corresponding parameters were selected as the optimal design parameters of the R-IPD controller in this study.
Based on the above-mentioned, the inertial effect of R-IPD is mainly affected by the relative displacement response between two ends of R-IPD. In other words, the inertial effect of R-IPD is mainly affected by the macro response of the controlled structure. In this study, the R-IPD is used to decrease the entire explosion response of bridge (a low-frequency dynamic response). Accordingly, we do not pay much attention to the suitable control frequency of R-IPD. However, it can be supposed that the control effect (tuning effect, inertial effect, and pounding effect) of R-IPD is theoretically influenced by the dynamic characteristic of the controlled structure, as well as the frequency characteristics of dynamic loads. Therefore, the experimental test of the mechanical properties of R-IPD is further needed. The influence of parameters on the damping effect and damping mechanism of R-IPD need to be clarified in future.
2.2. Model Bridge Design
The span arrangement of the prototype bridge was 24 m + 32 m + 24 m. The concrete type of the superstructure of the bridge was C50, and the longitudinal reinforcement, transverse reinforcement, and stirrups of the main beam were HRB400. The cross-section of the box beam was a single box with two chambers. The substructure of the bridge adopted a double-column concrete pier with C40 concrete, and the longitudinal reinforcement and stirrups of the pier were HRB400. Based on the test site and economic limitation, the dimension scale of the model was selected as 1:4. On this basis, the similarity conditions of the model are shown in Table 1. The materials of the scaled model were all consistent with those of the prototype bridge. The geometry of all the components of the model bridge was consistent with those of the prototype bridge. The reinforcement ratio of each member of the scaled model was also consistent with that of the bridge prototype. An ordinary slab rubber bearing was arranged between the main beam and bridge pier, and the same slab rubber bearing as the prototype was selected for the scale model bridge. The bridge model is shown in Figure 4.

Table 1.
Similarity conditions of the model.

Figure 4.
Three-span continuous box girder bridge model.
2.3. R-IPD Design
As mentioned in Section 2.1, the flywheel rotates and absorbs energy through the relative displacement of the two ends of the R-IPD and dissipates energy through the collision and friction of the damping particles in the flywheel cavity, so as to reduce the overall displacement of the bridge. Thus, the R-IPD need to be designed and manufactured based on the design parameters of the controlled bridge. In practical application, the control capability requirements of the controlled bridge are first determined. Secondly, the control force of an R-IPD is designed. Subsequently, the number of the R-IPD can be obtained. Finally, the R-IPDs are located at the key points of the controlled structure, which have significant relative displacement. Therefore, three R-IPDs had been located in the scaled model bridge in this study. Additionally, each R-IPD can provide 10 kN control force, which was about 15% of the gravity of the model bridge.
The physical drawing and specific parameters of the R-IPD controller are shown in Figure 5 and Table 2, respectively. During the test, an R-IPD was installed on the bottom plate of each span of the main beam, one end of which was fixed on the bottom surface of the box beam using bolts, and the other end was supported on a steel pipe bracket. To reduce the influence of flexible connections on the damping performance of the R-IPDs, steel tubes were inserted into the concrete base.
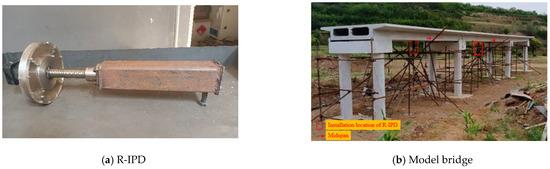
Figure 5.
R-IPD and its installations.
Table 2.
Main R-IPD design parameters.
According to the R-IPD design parameters in Table 2, the mass ratio, damping ratio, and stiffness ratio between the particles and R-IPDs obtained using Equation (14) are shown in Table 3.
Table 3.
Coefficient ratio between particles and R-IPD.
2.4. Arrangement of Measurement Points
The main dynamic response was measured, including the overpressure, displacement, acceleration, and longitudinal reinforcement strain. Overpressure sensors were arranged on the roof of the middle span. The displacement and acceleration sensors were arranged on the bottom slab of the side and middle spans, which were uniformly arranged around the centre of the span. The measurement points of the reinforcement strain were arranged along the longitudinal bars of the bottom slab in the middle span as shown in Figure 6.
Figure 6.
Arrangement of measurement points.
2.5. Test Cases
During the test, the explosive load was simulated using TNT, and a high-speed camera was used to record the explosion process as shown in Figure 7. Because the damping effect of R-IPD can hardly be estimated when the model bridge happened inelastic response. The explosion equivalent should be selected as a suitable range. In this study, the explosion location, EE, and R-IPD installation was selected as the variable parameters. In addition, the testing cases were designed as shown in Table 4.
Figure 7.
Explosion test phenomenon.
Table 4.
Test cases.
3. Experimental Results without R-IPDs
3.1. Overpressure
Figure 8 shows the time–history curves of overpressure at measuring points without R-IPDs.
Figure 8.
Time–history curve of overpressure of main beam.
As shown in Figure 8, after the explosion impact wave reached the bridge deck, the deck experienced a period of positive pressure with a large peak value and a short duration. The overpressure declined rapidly and finally approached atmospheric pressure after a few milliseconds. The farther the measuring point was from the location of the blast centre, the later the arrival time of the shock wave, and the smaller the corresponding peak overpressure. The peak values of the overpressure of K1, K2, and K3 were 4.16 MPa, 8.54 MPa and 10.14 MPa, respectively. To analyse the measured overpressure and predict the overpressure, the theoretical prediction formula of overpressure of reference [46] was used:
where P is the actual reflected peak overpressure on the component surface (MPa), Pr is the peak value of the reflected overpressure (MPa), Pso is the peak incident overpressure (MPa), and θ is the angle of incidence. Based on Equation (24), a comparison between the theoretical and measured overpressures is shown in Table 5 and Figure 9.
Table 5.
Peak overpressure of bridge deck.
Figure 9.
Comparison between theoretical and measured values of overpressure.
As shown in Table 2 and Figure 9, the difference ratio between the measured and theoretical values was in the range −13.59–14.34%. That is, the existing theoretical methods described the overpressure and its distribution law of non-contact explosions well. Under the same EE condition, the peak overpressure increased significantly with a decrease in the distance between the explosion centre and the measuring points. In addition, the rate of increase in the peak overpressure was much faster than the rate of decrease in the distance between a measuring point and the explosion centre. For example, the peak overpressure of the measuring points CY3 and CY4 of K1 were 4.70 and 24.68 times higher than that of CY2, respectively. With the EE varying from 0.8 kg to 2.0 kg, the peak overpressure increased by 1.44 times.
The theoretical and measured peak values of CY4 at the midspan measurement point were significantly different. This may have occurred because the amount of chemical reaction of the explosives was different, and the sensitivity of the overpressure sensor was low.
3.2. Displacement
Figure 10 shows the displacement–time history curves of the main beam measuring points under various test conditions. As shown in Figure 10, the displacement at the midspan was significantly larger than that at the other locations and gradually decreased from the midspan to both beam ends. There was little change in the transverse displacement in the same longitudinal section. This may have occurred because there was no transverse support for the main beam and the main beam did not suffer serious local damage. In other words, the main beam remained within the elastic range. After the explosion, the displacement response of the main beam reached the maximum value at 40 ms, then declined in the form of an oscillation and finally approached zero. This phenomenon also shows that the stiffness and other structural characteristics of the main beam did not change significantly.
Figure 10.
Time–history curve of bridge deck displacement.
Additionally, when the EE was small, the displacement response of each span was still dominated by low-frequency vibrations which were significantly affected by the span (stiffness) of the main beam. Therefore, the peak displacement of the middle span was larger than that of the side span. For example, the peak displacements of K1 and K4 were −2.85 mm and −2.62 mm with an EE of 0.8 kg, respectively.
3.3. Acceleration
Figure 11 shows the acceleration–time history curves of the main beam measurement points under various test conditions. Figure 12 shows the longitudinal distribution of the peak acceleration at each measurement point.
Figure 11.
Acceleration–time history curves of the main beam measurement points under various test conditions.
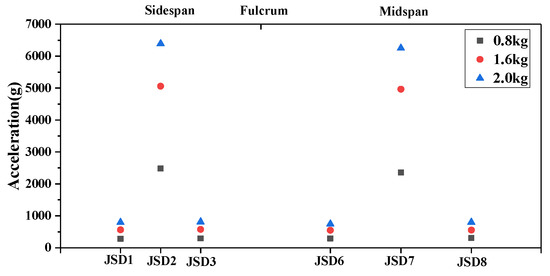
Figure 12.
Peak acceleration distribution in longitudinal direction of bridge.
As shown in Figure 11 and Figure 12, the acceleration response of the main beam started at approximately 10 ms and decreased rapidly after 0.5 ms. Moreover, the acceleration response of the main beam preceded its displacement response. The acceleration response first occurred in the midspan near the explosion centre and then diffused to the other parts of the bridge. Additionally, the acceleration response of the bridge model was dominated by a high-frequency response which completely dissipated in a short time. The peak acceleration of the midspan measuring point caused by the midspan explosion was essentially the same as that of the side span measuring point caused by the side span explosion. The local effect of the explosion load on the main beam can be described by the acceleration response. Under the same EE, the local acceleration response of the main beam was essentially the same, and the local damage caused by the explosion load had little correlation with the span.
3.4. Strain
Figure 13 shows the strain–time history curves of the reinforcement measurement points under various test conditions. As shown in Figure 13, the strain measurement point was more sensitive than the acceleration measurement point. The longitudinal reinforcement strain reached its peak at approximately 0.5 ms after receiving the dynamic response, then dropped sharply and approached zero in the form of an oscillation. The distribution of the peak strain of the longitudinal reinforcement was similar to that of the overpressure, which indicated that the reinforcement strain was significantly affected by the local overpressure. The reinforcement strain increased with an increase in the EE. When the EE was 2.0 kg, the peak strain was 1863 με at YB-3 and did not reach the yield strain of the steel bar. It was further verified that the main beam remained within the elastic range under the explosion load.
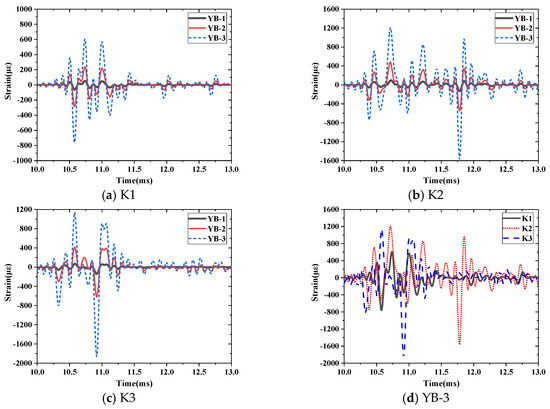
Figure 13.
Time–history curves of longitudinal reinforcement strain.
The action time of the explosion load was extremely short. The insufficient sensitivity of the strain gauge, low acquisition frequency of the collection instrument, and trigger time delay caused the different peak strain attainment times for the measurement points under various test conditions as shown in Figure 13d.
4. Experimental Results with R-IPDs
4.1. Displacement
Figure 14 shows a comparison of the displacement responses under each test condition with and without R-IPDs.
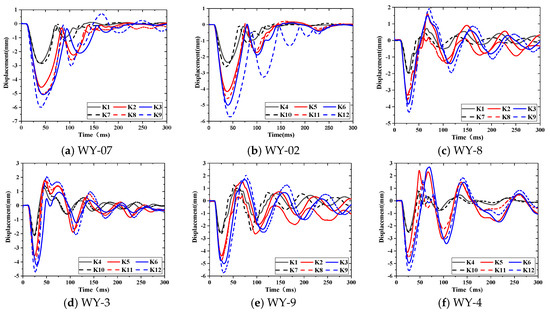
Figure 14.
Displacement comparison with and without R-IPDs.
As shown in Figure 14, the displacement response of each measuring point decreased after the R-IPD installation. Meanwhile, the decreasing ratio of the peak displacement increased with an increase in EE, which was similar to the displacement response law after sticking steel plate [21]. However, compared with sticking steel plates, the decreasing ratio of the peak displacement was much larger than that after the R-IPD arrangement when the EE increased. For WY-7, the peak displacement decreased by 4.20%, 8.83%, and 12.50% with EEs of 0.8 kg, 1.6 kg, and 2.0 kg after the R-IPD arrangement, respectively. This occurred because the R-IPDs provided a damping force through the relative displacement between the two ends of the damper. A larger EE resulted in a larger relative displacement between the two ends of the damper. Accordingly, a greater damping force was provided for the bridge model, and the damping ratio increased.
To further analyse the damping effect of the R-IPD controllers, the decreasing ratio of the peak displacement is shown in Figure 15.
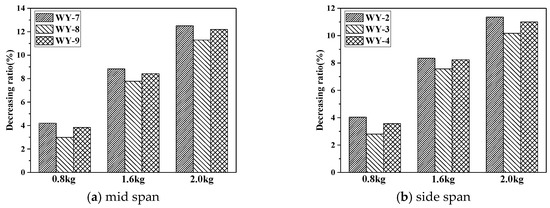
Figure 15.
Decreasing ratio of peak displacement of main beam.
As shown in Figure 15, the decreasing ratio of the peak displacement of the main beam gradually increased with an increase in EE. The decreasing ratio of the peak displacement of the midspan was greater than that of the 1/4 span. However, the decreasing ratios for each transverse measurement point at the same longitudinal location were essentially the same. When EE was 2.0 kg, the decreasing ratios of the displacement for WY-2, CY-7, WY-8, and WY-9 were 11.36%, 12.50%, 11.29%, and 12.20%, respectively. The R-IPDs had a good control effect on the EDR of the bridge model in the elastic stage.
4.2. Acceleration
Figure 16 shows a comparison of the acceleration responses under each test condition with and without R-IPDs.
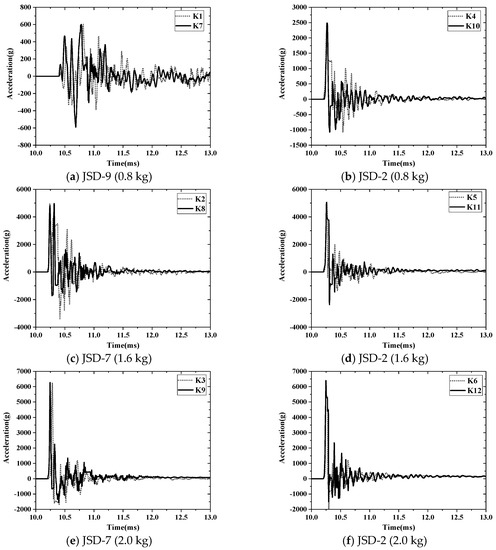
Figure 16.
Acceleration comparison with and without R-IPDs.
According to Figure 16, the acceleration response of each measuring point of the main beam was basically the same with and without R-IPDs, particularly for the peak acceleration. For example, when the EE was 2.0 kg, the accelerations of JSD-2 were 6330 g and 6395 g, respectively, with and without R-IPDs, respectively, and the rate of decrease in acceleration was 1.01%. The reason was that the acceleration response of the main beam was a local response which occurred much earlier than that of the EDR. Thus, the R-IPDs had no obvious effect on the local dynamic response of the bridge model, which was quite different from the existing findings with sticking FRP [24]
4.3. Strain
Figure 17 shows a comparison of the strain response under each test condition with and without R-IPDs.
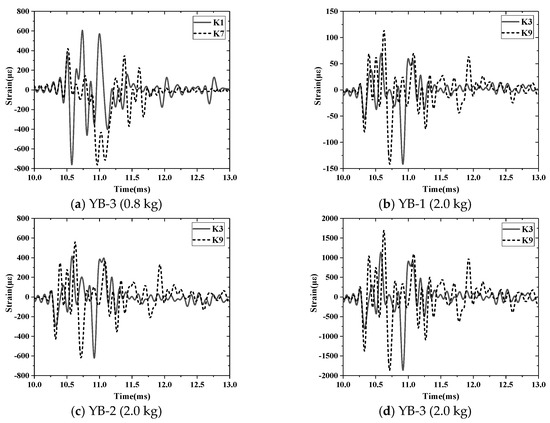
Figure 17.
Strain comparison of longitudinal reinforcement with and without R-IPDs.
As shown in Figure 17, the variation law of the longitudinal reinforcement strain of the main beam was essentially the same with and without R-IPDs. The damping effect of R-IPDs on the longitudinal reinforcement strain of the main beam was not obvious. For example, when the EE was 2.0 kg, the longitudinal reinforcement strains of YB-3 were −1841 με and −1864 με with and without R-IPDs, respectively, and the decreasing ratio rate of the longitudinal reinforcement strain was 1.23%. The damping effect of the R-IPDs exhibited an evident hysteresis characteristic. The damping effect of the R-IPDs was directly related to the relative displacement response between the two ends of the dampers.
The local and entire responses of the bridge were different under an explosion load. Therefore, anti-explosion design methods for local and entire responses need to be modified. In other words, the local anti-explosion method cannot significantly improve the overall anti-explosion performance of a structure. Moreover, the entire anti-explosion method (such as R-IPDs) did not have a significant effect on the local explosion response of the structure.
5. Conclusions
In this study, an R-IPD was proposed. A 1:4 scale model of a typical three-span continuous beam bridge and an R-IPD was designed and manufactured. An explosion test of the bridge model with and without R-IPDs was performed, and the explosion response law of the bridge model and the damping effect of the R-IPDs were systematically investigated.
- (1)
- The overpressure at the measuring point increased with an increase in the explosive equivalent (EE). The rate of increase in the peak overpressure was much faster than the rate of decrease in the distance between the measuring point and the explosion centre. For non-contact explosions, the existing theoretical methods in [46] can describe the overpressure and the distribution law of the model bridge.
- (2)
- The peak displacement of the main beam was significantly affected by its span (stiffness) when the EE was small. Additionally, the peak displacement of the middle span was larger than that of the side span. However, the local dynamic response (acceleration and strain) of the main beam was not significantly affected by its span, and the acceleration and strain responses of the main beam preceded its displacement response. With an increase in EE, the entire displacement and local dynamic responses of the main beam increased gradually.
- (3)
- The damping effect of the R-IPD on the explosion displacement response of the main beam was evident (the maximum decreasing ratio reached 12.5%). The decreasing ratio of the peak displacement of the main beam gradually increased with an increase in EE. Moreover, the decreasing ratio of the peak displacement of the midspan was greater than that of the 1/4 span. However, the damping effect on the acceleration and strain response of the main beam was not significant (less than 2%). The damping effect of the R-IPD had evident hysteresis characteristics and was directly related to the relative displacement response between the two ends of the damper. In other words, the R-IPD can obviously decrease the entire dynamic response of bridges but has little effect on the local dynamic response, such as acceleration and reinforcement strain.
- (4)
- The local response and entire response of bridge structures are quite different under explosion loads. The existing anti-explore method is mainly focused on the local response of bridge structures, which cannot be used to control their entire response. An R-IPD can be used to decrease the entire response of bridges under explosion loads. However, the parameter-optimised method of R-IPDs, as well as the dynamic response law of R-IPD under explosion loads, need to be further studied.
Author Contributions
Writing—original draft, M.X.; Writing—review & editing, W.X., J.W., Y.C., D.Z., L.H. and Q.Y. All authors have read and agreed to the published version of the manuscript.
Funding
This research was funded by the National Natural Science Foundation of China (Grant No. 52108428, 52178446, 51978021, 51908015) and Beijing Natural Science Foundation (8232001).
Data Availability Statement
Not applicable.
Conflicts of Interest
The authors declare no conflict of interest.
References
- Stewart, M.G.; Mueller, J. Terrorism Risks for Bridges in a Multi-Hazard Environment. Int. J. Prot. Struct. 2014, 5, 275–289. [Google Scholar] [CrossRef]
- Williams, G.; Holland, C.; Williamson, E.B.; Bayrak, O.; Marchand, K.A.; Ray, J.C. Blast-Resistant Highway Bridges: Design and Detailing Guidelines; The National Academies Press: Washington, DC, USA, 2012; pp. 143–151. [Google Scholar] [CrossRef]
- Wierschem, N.E.; Luo, J.; Wilcoski, J.; Hubbard, S.A.; Fahnestock, L.A.; Spencer, B.F., Jr.; McFarland, D.M.; Quinn, D.D.; Vakakis, A.F.; Bergman, L.A. Simulating offset blast loads experimentally using shake-table-generated ground motions: Method development and validation. Struct. Control Health Monit. 2020, 27, e2480.1–e2480.14. [Google Scholar] [CrossRef]
- Temsah, Y.; Jahami, A.; Khatib, J.; Sonebi, M. Numerical analysis of a reinforced concrete beam under blast loading. In MATEC Web of Conferences; EDP Sciences: Les Ulis, France, 2018; Volume 149, p. 02063. [Google Scholar]
- Son, J.; Lee, H.-J. Performance of cable-stayed bridge pylons subjected to blast loading. Eng. Struct. 2011, 33, 1133–1148. [Google Scholar] [CrossRef]
- Li, Q.M.; Meng, H. Pressure-mpulse diagram for blast loads based on dimensionalanalysis and single-degree-of-freedom model. J. Eng. Mech. 2002, 128, 87–92. [Google Scholar] [CrossRef]
- Rong, H.C.; Li, B. Probabilistic response evaluation for RC flexural memberssubjected to blast loadings. Struct. Saf. 2007, 29, 146–163. [Google Scholar] [CrossRef]
- Zhang, D.; Yao, S.; Lu, F.; Chen, X.; Lin, G.; Wang, W.; Lin, Y. Experimental study on scaling of RC beams under close-in blast loading. Eng. Fail. Anal. 2013, 33, 497–504. [Google Scholar] [CrossRef]
- Winget, D.G.; Marchand, K.A.; Williamson, E.B. Analysis and Design of Critical Bridges Subjected to Blast Loads. J. Struct. Eng. 2005, 131, 1243–1255. [Google Scholar] [CrossRef]
- Yuan, S.; Hao, H.; Zong, Z.; Li, J. A study of RC bridge columns under contact explosion. Int. J. Impact Eng. 2017, 109, 378–390. [Google Scholar] [CrossRef]
- Hao, H.; Tang, E.K.C. Numerical simulation of a cable-stayed bridge response to blast loads, Part II: Damage prediction and FRP strengthening. Eng. Struct. 2010, 32, 3193–3205. [Google Scholar] [CrossRef]
- Tang, E.K.C.; Hao, H. Numerical simulation of a cable-stayed bridge response to blast loads, Part I: Model development and response calculations. Eng. Struct. 2010, 32, 3180–3192. [Google Scholar] [CrossRef]
- Cofer, W.F.; Matthews, D.S.; McLean, D.I. Effects of Blast Loading on Prestressed Girder Bridges. Shock Vib. 2012, 19, 186272. [Google Scholar] [CrossRef]
- Shiravand, M.; Parvanehro, P. Numerical study on damage mechanism of post-tensioned concrete box bridges under close-in deck explosion. Eng. Fail. Anal. 2017, 81, 103–116. [Google Scholar] [CrossRef]
- Wang, X.Y.; Feng, Y.J. Study of Dynamic Response and Influence Factors of Continuous Girder Bridge under Blast Loading. Blasting 2017, 34, 104–113. [Google Scholar]
- Tokal-Ahmed, Y.M. Response of Bridge Structures Subjected to Blast Loads and Protection Techniques to Mitigate the Effect of Blast Hazards on Bridge; Rutgers The State University of New Jersey: New Brunswick, NJ, USA, 2009. [Google Scholar] [CrossRef]
- Algassem, O.; Li, Y.; Aoude, H. Ability of steel fibers to enhance the shear and flexural behavior of high-strength concrete beams subjected to blast loads. Eng. Struct. 2019, 199, 109611. [Google Scholar] [CrossRef]
- Algassem, O.; Li, Y.; Aoude, H. Influence of steel fibers on the shear and flexural performance of high-strength concrete beams tested under blast loads. IOP Conf. Ser. Mater. Sci. Eng. 2017, 246, 012032. [Google Scholar] [CrossRef]
- Li, Y.; Aoude, H. Influence of steel fibers on the static and blast response of beams built with high-strength concrete and high-strength reinforcement. Eng. Struct. 2020, 221, 111031. [Google Scholar] [CrossRef]
- Liu, S.; Zhou, Y.; Zheng, Q.; Zhou, J.; Jin, F.; Fan, H. Blast responses of concrete beams reinforced with steel-GFRP composite bars. Structures 2019, 22, 200–212. [Google Scholar] [CrossRef]
- Qu, Y.; Liu, W.; Gwarzo, M.; Zhang, W.; Zhai, C.; Kong, X. Parametric study of anti-explosion performance of reinforced concrete T-shaped beam strengthened with steel plates. Constr. Build. Mater. 2017, 156, 692–707. [Google Scholar] [CrossRef]
- Liao, Z.; Tang, D.; Li, Z.; Xue, Y.; Shao, L. Study on explosion resistance performance experiment and damage assessment model of high-strength reinforcement concrete beams. Int. J. Impact Eng. 2019, 133, 103362. [Google Scholar] [CrossRef]
- Wu, C.; Oehlers, D.J.; Rebentrost, M.; Leach, J.; Whittaker, A.S. Blast testing of ultra-high performance fibre and FRP-retrofitted concrete slabs. Eng. Struct. 2009, 31, 2060–2069. [Google Scholar] [CrossRef]
- Kong, X.; Qi, X.; Gu, Y.; Lawan, I.A.; Qu, Y. Numerical evaluation of blast resistance of RC slab strengthened with AFRP. Constr. Build. Mater. 2018, 178, 244–253. [Google Scholar] [CrossRef]
- Li, J.; Wu, C.; Hao, H.; Su, Y.; Li, Z.-X. A study of concrete slabs with steel wire mesh reinforcement under close-in explosive loads. Int. J. Impact Eng. 2017, 110, 242–254. [Google Scholar] [CrossRef]
- Fouch, P.; Bruneau, M.; Asee, F. Modified steel-jacketed columns for combined blast and seismic retrofit of existing bridge columns. J. Bridge Eng. 2016, 21, 4016035. [Google Scholar] [CrossRef]
- Nurick, G.; Langdon, G.; Chi, Y.; Jacob, N. Behaviour of sandwich panels subjected to intense air blast—Part 1: Experiments. Compos. Struct. 2009, 91, 433–441. [Google Scholar] [CrossRef]
- Karagiozova, D.; Nurick, G.N.; Langdon, G.S. Behaviour of sandwich panels subject to intense air blasts Part 2: Numerical simu-lation. Compos. Struct. 2009, 91, 442–450. [Google Scholar] [CrossRef]
- Li, S.; Li, X.; Wang, Z.; Wu, G.; Lu, G.; Zhao, L. Finite element analysis of sandwich panels with stepwise graded aluminum honeycomb cores under blast loading. Compos. Part A Appl. Sci. Manuf. 2016, 80, 1–12. [Google Scholar] [CrossRef]
- Li, S.; Li, X.; Wang, Z.; Wu, G.; Lu, G.; Zhao, L. Sandwich panels with layered graded aluminum honeycomb cores under blast loading. Compos. Struct. 2017, 173, 242–254. [Google Scholar] [CrossRef]
- Wang, X.; Zhang, X.; Song, L.; Zhou, H.; Wang, Y.; Zhang, H.; Cong, P. Mitigating confined blast response of buried steel box structure with foam concrete. Thin-Walled Struct. 2021, 169, 108473. [Google Scholar] [CrossRef]
- Ikago, K.; Saito, K.; Inoue, N. Seismic control of single-degree-of-freedom structure using tunedviscous mass damper. Earthq. Eng. Struct. Dyn. 2012, 41, 453–474. [Google Scholar] [CrossRef]
- Fricke, J.R. Lodengraf damping: An advanced vibration damping technology. SV Sound Vib. 2000, 34, 22–27. [Google Scholar]
- Panossian, H.V. Structural damping enhancement via Non-obstructive particle damping technique. J. Vib. Acoust. 1992, 114, 101–105. [Google Scholar] [CrossRef]
- Shen, B.; Xu, W.; Wang, J.; Chen, Y.; Yan, W.; Huang, J.; Tang, Z. Seismic control of super high-rise structures with double-layer tuned particle damper. Earthq. Eng. Struct. Dyn. 2021, 50, 791–810. [Google Scholar] [CrossRef]
- Huang, X.H.; Xu, W.B.; Yan, W.M. Equivalent model of a multiparticle damper considering the mass coupling coefficient. Struct. Control Health Monit. 2020, 27, e2580. [Google Scholar] [CrossRef]
- Huang, X.H.; Xu, W.B.; Wang, J.; Yan, W.M.; Chen, Y.J. Equivalent model of a multi-particle damper considering particle rolling and its analytical solution. Struct. Control Health Monit. 2021, 28, e2718. [Google Scholar] [CrossRef]
- Huang, X.H.; Xu, W.B.; Yan, W.M.; Wang, J. Equivalent model and parameter analysis of non-packed particle damper. J. Sound Vib. 2021, 491, 115775. [Google Scholar] [CrossRef]
- Lu, Z.; Chen, X.; Zhou, Y. An equivalent method for optimization of particle tuned mass damper based on experimental para-metric study. J. Sound Vib. 2018, 419, 571–584. [Google Scholar] [CrossRef]
- Matuttis, H.G.; Chen, J.F. Understanding the Discrete Element Method: Simulation of Non-Spherical Particles for Granular and Multi-Body Systems; John Wiley & Sons Inc.: Hoboken, NJ, USA, 2014. [Google Scholar]
- Lu, Z.; Wang, Z.; Masri, S.F.; Lu, X. Particle impact dampers: Past, present, and future. Struct. Control Health Monit. 2018, 25, e2058.1–e2058.25. [Google Scholar] [CrossRef]
- Zhao, G.; Ma, Y.; Yang, Z.; Wang, Q.; Li, Y. Friction mechanism and experimental investigation of the response-amplified friction damper. Struct. Control Health Monit. 2022, 29, e2953.1–e2953.19. [Google Scholar] [CrossRef]
- Crandall, S.H.; Mark, W.D. Random Vibration in Mechanical Systems; Academic Press: New York, NY, USA, 2014. [Google Scholar]
- Pan, C.; Zhang, R.; Luo, H.; Li, C.; Shen, H. Demand-based optimal design of oscillator with parallel-layout viscous inerter damper. Struct. Control Health Monit. 2017, 25, e2051. [Google Scholar] [CrossRef]
- Pan, C.; Zhang, R.F. Design of structure with inerter system based on stochastic response mitigation ratio. Struct. Control Health Monit. 2018, 25, e2169. [Google Scholar] [CrossRef]
- Randers-Pehrson, G.; Bannister, K.A. Airblast Loading Model for DYNA2D and DYNA3D. No. Arl-Tr-1310; Army Research Lab: Aberdeen Proving Ground, MD, USA, 1997.


Disclaimer/Publisher’s Note: The statements, opinions and data contained in all publications are solely those of the individual author(s) and contributor(s) and not of MDPI and/or the editor(s). MDPI and/or the editor(s) disclaim responsibility for any injury to people or property resulting from any ideas, methods, instructions or products referred to in the content. |
© 2023 by the authors. Licensee MDPI, Basel, Switzerland. This article is an open access article distributed under the terms and conditions of the Creative Commons Attribution (CC BY) license (https://creativecommons.org/licenses/by/4.0/).