Abstract
Improved thermal storage capacity and reduced building energy consumption can be attained by utilizing phase-change materials (PCM) in glass enclosure structures, which can effectively utilize solar energy to improve the building’s thermal performance. This article investigates the thermal performance of double-layer glass filled with PCM as a function of relevant thermal physical parameters. Numerical analyses were conducted on the PCM glass units to assess the glass greenhouse thermal performance. Results indicate that the temperature distribution of the glass channel is mainly influenced by the absorption coefficient of the paraffin material. Compared to the absorption coefficient, the refractive index has a smaller impact on the temperature of the glass channel. On the other hand, the transmittance of the interior surface of the glass channel is greatly affected by solar radiation. According to the outdoor meteorological conditions of different seasons, increasing the latent heat of paraffin materials within a certain range with a reasonable density and melting temperature can greatly improve the thermal performances. Meanwhile, the thermal conductivity of paraffin materials and the change in the specific heat of paraffin materials have little impact on the improvement of thermal performance.
1. Introduction
As the world population increases, the demand for food also increases significantly. To overcome the increasing demand for food supply, the greenhouse, one of the most promising agricultural technologies, can be used to grow more efficient crops by preparing the required thermal conditions [1]. Nowadays, diverse types of methods are studied to maintaining a suitable microclimate for crops. Burning fossil fuels in greenhouses can provide a favorable environment for food production, resulting in 29% of total global greenhouse gas emissions [2]. As a green and stable renewable energy source, solar energy has been widely used to improve the energy structure of greenhouses. Therefore, in response to the limitations of traditional microclimate control methods in intensive agriculture, improving the thermal and light environment can be ensured by a developing reasonable utilization of solar energy [3,4].
Transparent materials, namely glass or plastic, are mainly utilized for the envelope of the greenhouse to absorb sufficient sunlight. In the daytime, the solar radiation easily enters the greenhouse, which is mainly due to the high shortwave radiation transmittance of the transparent envelope. The greenhouse envelope structure is not likely to transmit longwave radiation from the inside, so the interior temperature of the greenhouse can be increased to meet the needs of crop growth in cold seasons [5]. Investment in greenhouses should take into account three analyses; energy amount, cost, and environmental impact [6]. Recently, a large amount of research has been conducted on the shape of greenhouses [7] and passive solar storage devices [8,9] among different types of solar energy utilization systems. The advantage of the greenhouse structure is its simple form, which is why it is adopted to maximize the rational use of natural light. To increase the capture area of solar radiation, studies were conducted on greenhouses with different spans, indicating that the type that can receive more solar radiation is an east–west single-span greenhouse [10,11,12,13]. In addition, the effect of orientations and elliptical surface aspect ratios on solar energy capture was studied [14]. However, the instability of solar energy is a weakness that affects the thermal environment of greenhouse structures.
In general practical applications, although greenhouses can provide a certain interior temperature for plant growth during sunny daytime in winter, attention should be paid to avoiding excessive temperatures that are not conducive to plant growth. However, considering the poor insulation and heat storage ability of the greenhouse envelope structure, the interior temperature of the greenhouse significantly decreases at night. Some issues indicate that the utilization of solar energy in greenhouses is limited by seasonal, diurnal, and weather changes, as well as the poor heat storage capacity of the greenhouse envelope, resulting in instability and indirectness [15]. If it is not heated in regions with a cold climate, the plants may freeze to death [16]. Some heating system may be installed to overcome this issue; however, this may result in an increase in the cost of the greenhouse construction and operation [5]. Latent heat thermal energy storage (LHTES) technology can be employed to achieve sustainable and stable solar energy utilization in greenhouses. This technology allows arriving solar radiation to be stored by storage materials during the daytime and release the stored heat into the greenhouse at night-time by convection and radiation [17,18,19,20,21]. Among them, the PCM wall is the most common LHTES component in a greenhouse. Berroug et al. [22] studied the impact of the PCM integration in the north wall on the internal temperature of east–west greenhouses, where CaCl2·6H2O is the storage medium; it was revealed that the greenhouse indoor temperature fluctuation at night is relatively small, and the winter temperature is 6–12 °C higher than that of greenhouses without PCM, indicating that PCM can improve the greenhouse thermal performance. Guarino et al. [23] applied PCM to the interior layer of walls for experimental research, and the results showed that using PCM walls remained effective under cold temperature conditions. Also, the heat stored by the walls during the day would be released at night, lasting approximately 6–8 h. Latent heat storage units containing PCM can also be used for heat recovery in greenhouses [24,25], but for the simple, fragile plastic greenhouse structure without an actual envelope, and they cannot support large heating equipment [26].
Plastic greenhouses are widely used, due to their lower investment needs and high short-term production. However, they have poor durability and are easy to damage, and the plastic film needs to be replaced frequently. Although the cost of a glass greenhouse is high, it has good thermophysical properties, and has been gradually popularized and applied, which has attracted the attention of scholars. Reichrath and Davies [27] verified that the simulation of pressure distribution in 52 span Venlo-type glasshouses using computational fluid dynamics (CFD) is feasible and accurate. Benni et al. [28] studied 2D or 3D models of Italian glass greenhouses, and calibrated and compared different CFD methods for greenhouse airflow analysis. Santolini et al. [29] studied the CFD method for wind-driven ventilation with screens, and found that the air flow velocity distribution was greatly affected by the screen. Lin et al. [30] proposed a closed-loop model predictive control strategy for Venlo-type greenhouse thermal performance increment, providing a cost reduction in the operation in the South African climate. Santolini et al. [31] focused on the impact of shading screens on the internal climate of greenhouses. By comprehensively considering the direction and placement of windows in complex environments taking into account elements such as solar radiation and wind direction, the optimal position and permeability of shading screens were determined. Mazzeo et al. [32] identified the best solution for the transparent envelope of greenhouses using TRNSYS under different climate scenarios.
To improve the thermal quality of glass units, scholars have studied adding PCM into embedded glass structures in common buildings, and carried out numerical and experimental research on various heat storage solutions as a technology to reduce building energy consumption [33,34]. Ismail et al. [35] carried out experimental research on a model filled with air or PCM inside a glass window, and obtained some laws of infrared and ultraviolet radiation transmittance and reflectance by analyzing the optical and energy characteristics of the model. Ismail et al. [36] created a one-dimensional radiation and heat-conduction model for the filling of PCM in double-layer glass windows, and explored the effect of thermal and optical parameters. Goia et al. [37] carried out simulations on the optical properties of solid-phase and liquid-phase PCM, and introduced the thermophysical behavior of PCM, combined with transparent materials. An investigation of the optical and thermal properties of PCM units was conducted by Gowreesunker et al. [38], in which they mainly used spectrophotometry and the T-history method. In studying the solar absorption and transmittance characteristics of PCM-filled glass windows, Li et al. [39] suggested two optical parameters for calculation, and investigated the thermal performance of PCM-filled glass windows in areas with high temperature differences in summer and winter in China. In studying the dynamic heat transfer behavior of windows containing PCMs, Zhong et al. [40] mainly focused on the influence of various physical parameters of PCMs, and proposed that the insulation performance and load transfer effect increase with the increase in the latent heat of melting of PCMs. Goia et al. [41] studied the spectra and angles of samples filled with different thicknesses of PCM in glass, and measured the differences in the spectral characteristics of PCM with different thicknesses using a dedicated optical testing bench and a spectrophotometer. In another study, Li et al. [42,43] simulated the thermal performance changes of PCM-filled double-layer glass units with different thermophysical parameters, through numerical analysis. Zhang et al. [44] studied PCM-filled glass roofs, and achieved high energy efficiency by analyzing their thermal performance.
In summary, the thermal performance of the PCM-filled glass unit is greatly influenced by the thermophysical and optical properties of PCMs, and there are many research results available in the literature. However, these results are not fully applicable to glass units in greenhouses. Moreover, there are few research results on thermal physical and optical properties. This paper takes the severe cold region of Northeast China as the background for investigating the impact of thermal physical parameters and optical constants of PCMs on the thermal performance of glass greenhouse containing PCM. The results obtained in this study will provide technical support for the use of glass greenhouses filled with PCM in severe cold areas.
2. Methodology
2.1. Geometric Description
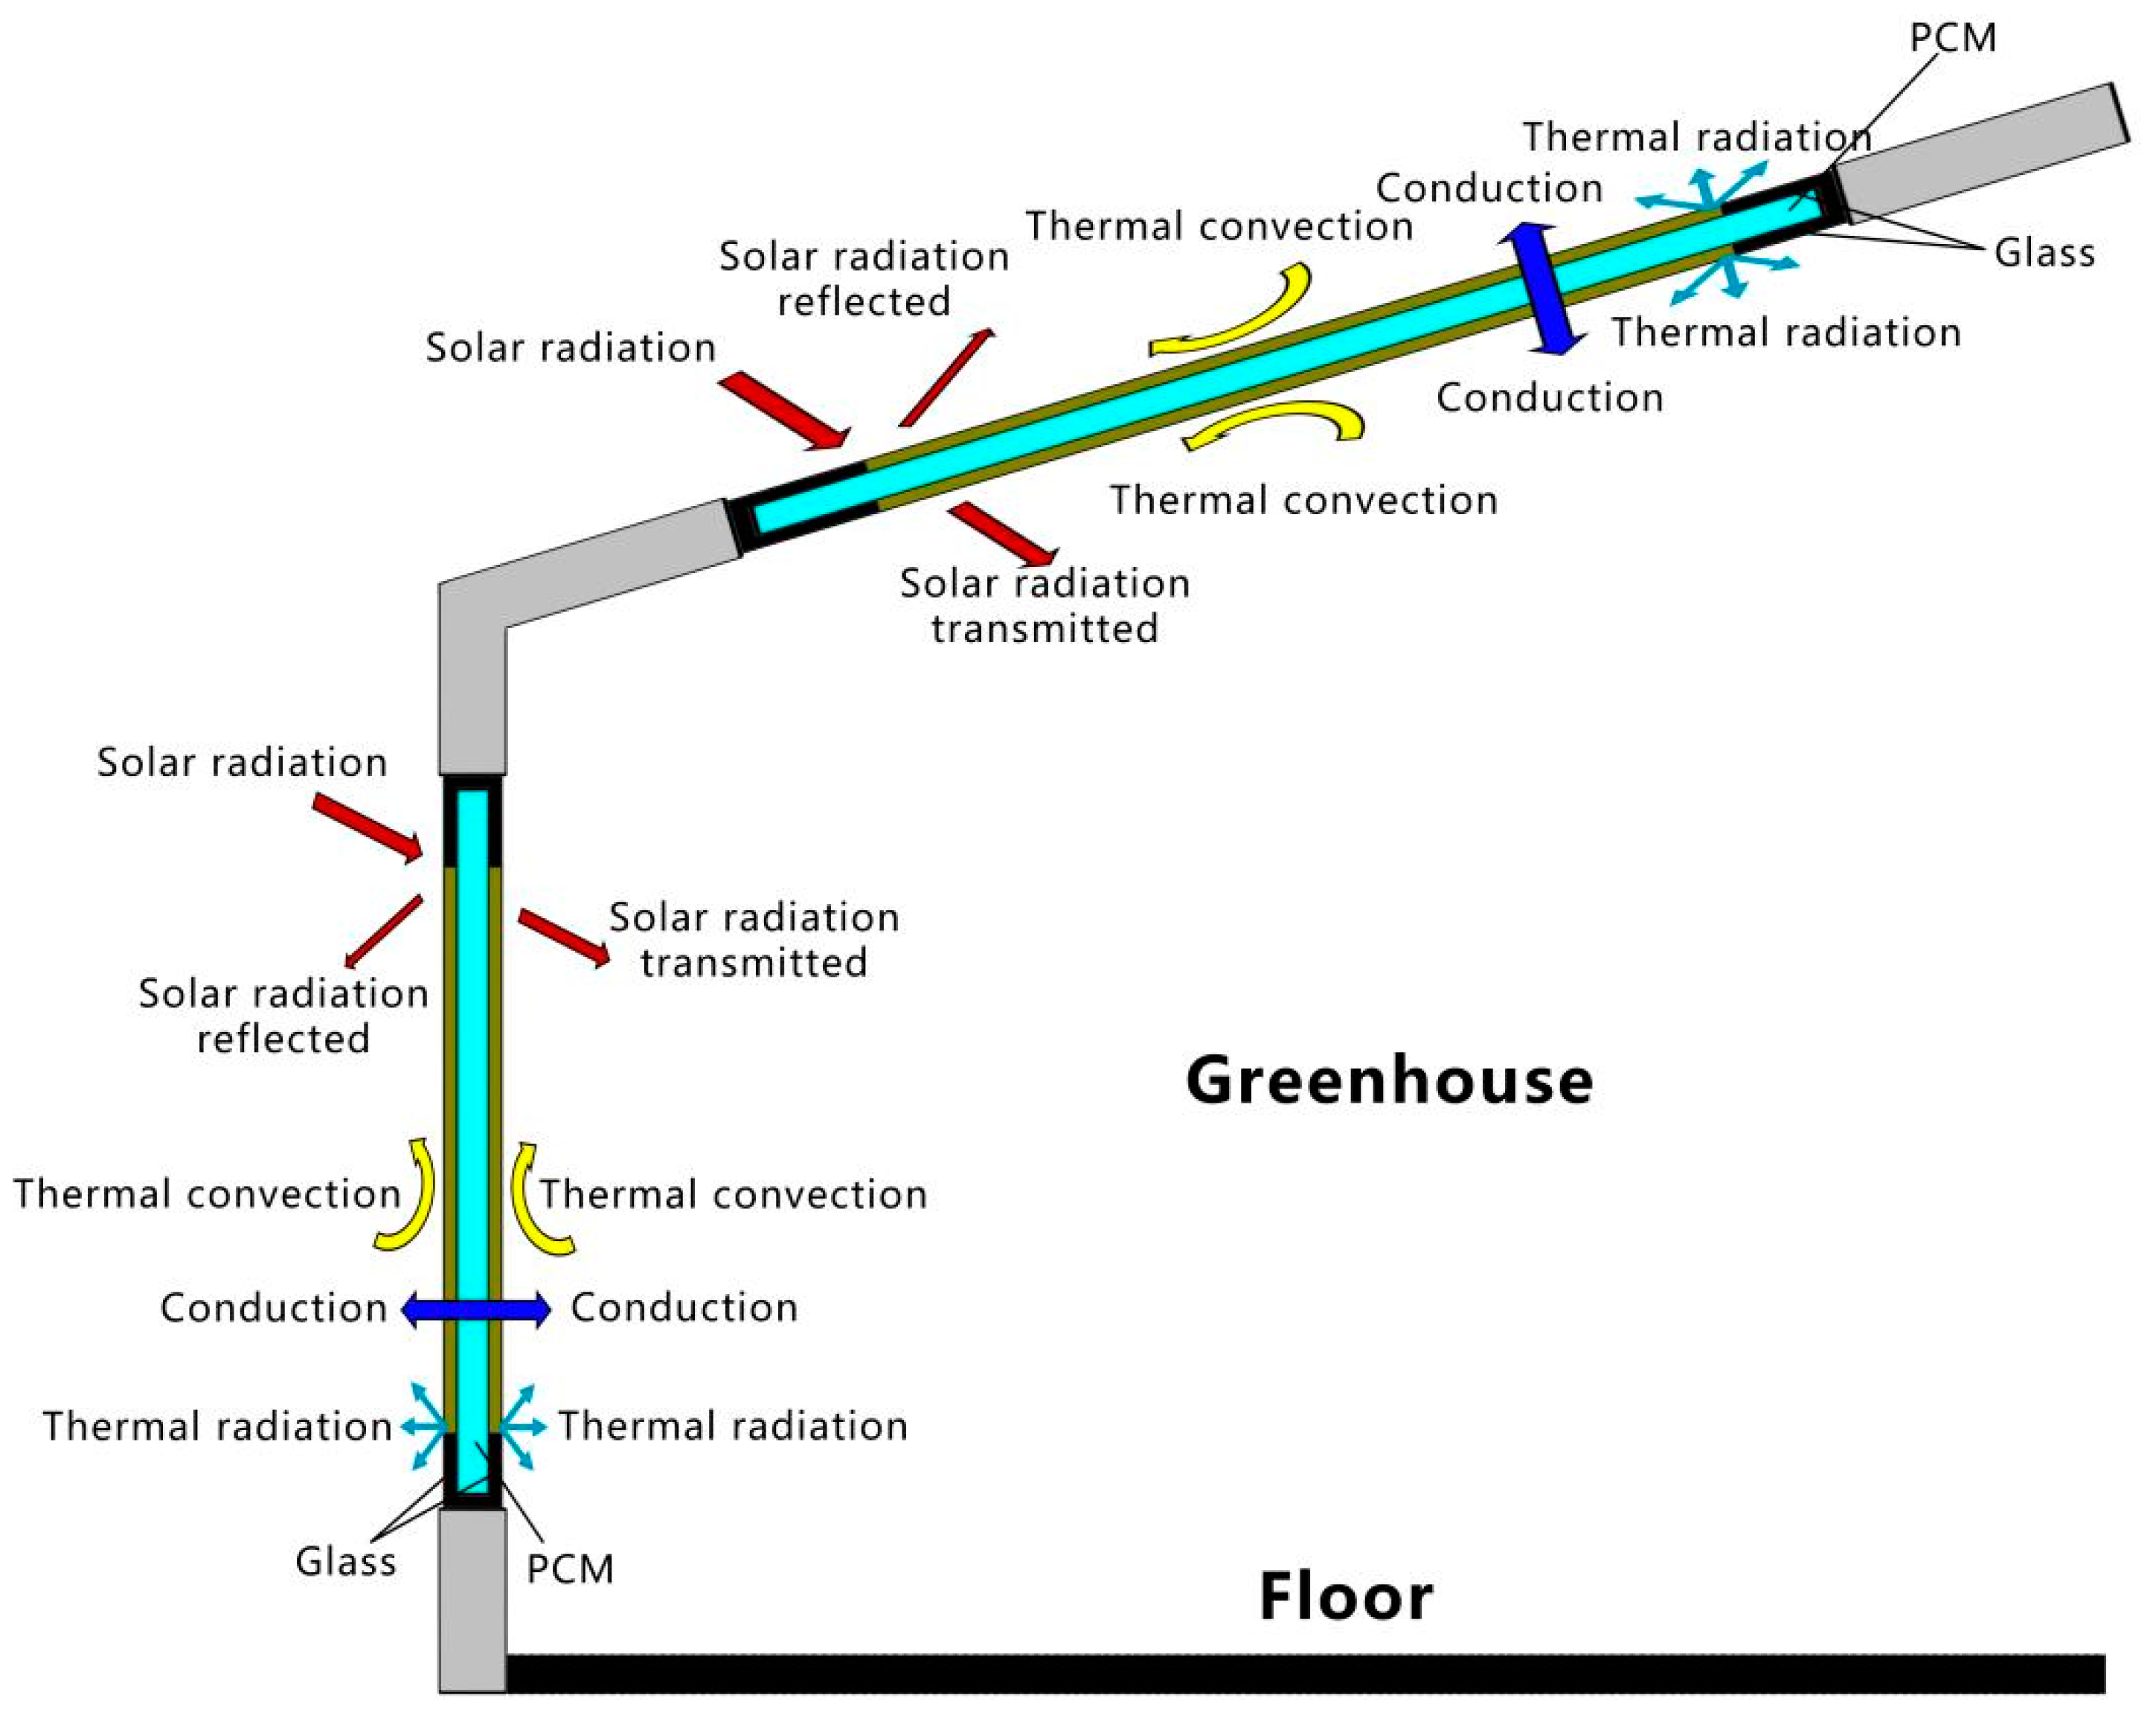
A glass greenhouse mainly absorbs solar energy from its side where the solar radiation is applied, and PCM is filled into the double glazing unit located on this side. The double-layer glass unit filled with PCM is applied to a regular glass greenhouse, as shown in Figure 1. Unlike conventional buildings, glass greenhouses absorb solar radiation from vertical and inclined planes. The solar heat absorbed by the glass surface is transmitted to the inside or outside of the PCM glass unit through conduction, convection, and radiation exchange processes. In addition to the portion absorbed by the PCM and the glass, there is also a portion of solar irradiance that is transmitted into the structure and another portion that is reflected. The heat transfer processes of thermal convection and radiation mainly occur at the boundaries of the outer and inner surfaces of the greenhouse envelope.
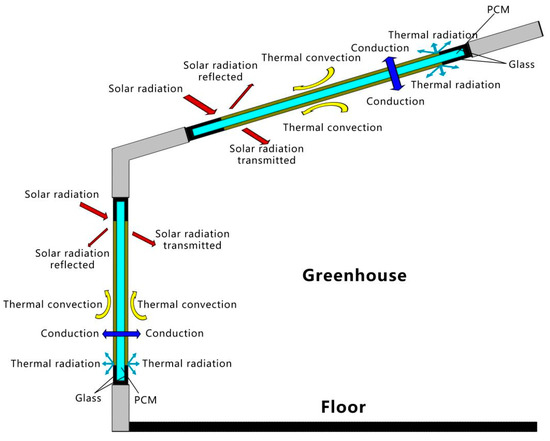
Figure 1.
Double-glazed units filled with PCM in the greenhouse envelope.
2.2. Boundary Conditions and Corresponding Equations
The following assumptions are made to build the mathematical model:
- (1)
- The heat transfer process in the glass unit is taken as one-dimensional (1D) transient heat transfer instead of multidimensional, for the calculation.
- (2)
- The convection effects occurring in the liquid PCM are ignored.
- (3)
- The scattering effect observed in the PCM layer is neglected.
- (4)
- Considering that PCM is highly opaque in the long-wave radiation of liquids and solids, the heat radiation exchange between the glass surfaces on both sides of the cavity is ignored.
- (5)
- PCM and glass are regarded as homogeneous isotropic media, and the material thermal properties are not affected by temperature variation.
- (6)
- The wavelength does not affect the glass and PCM optical properties.
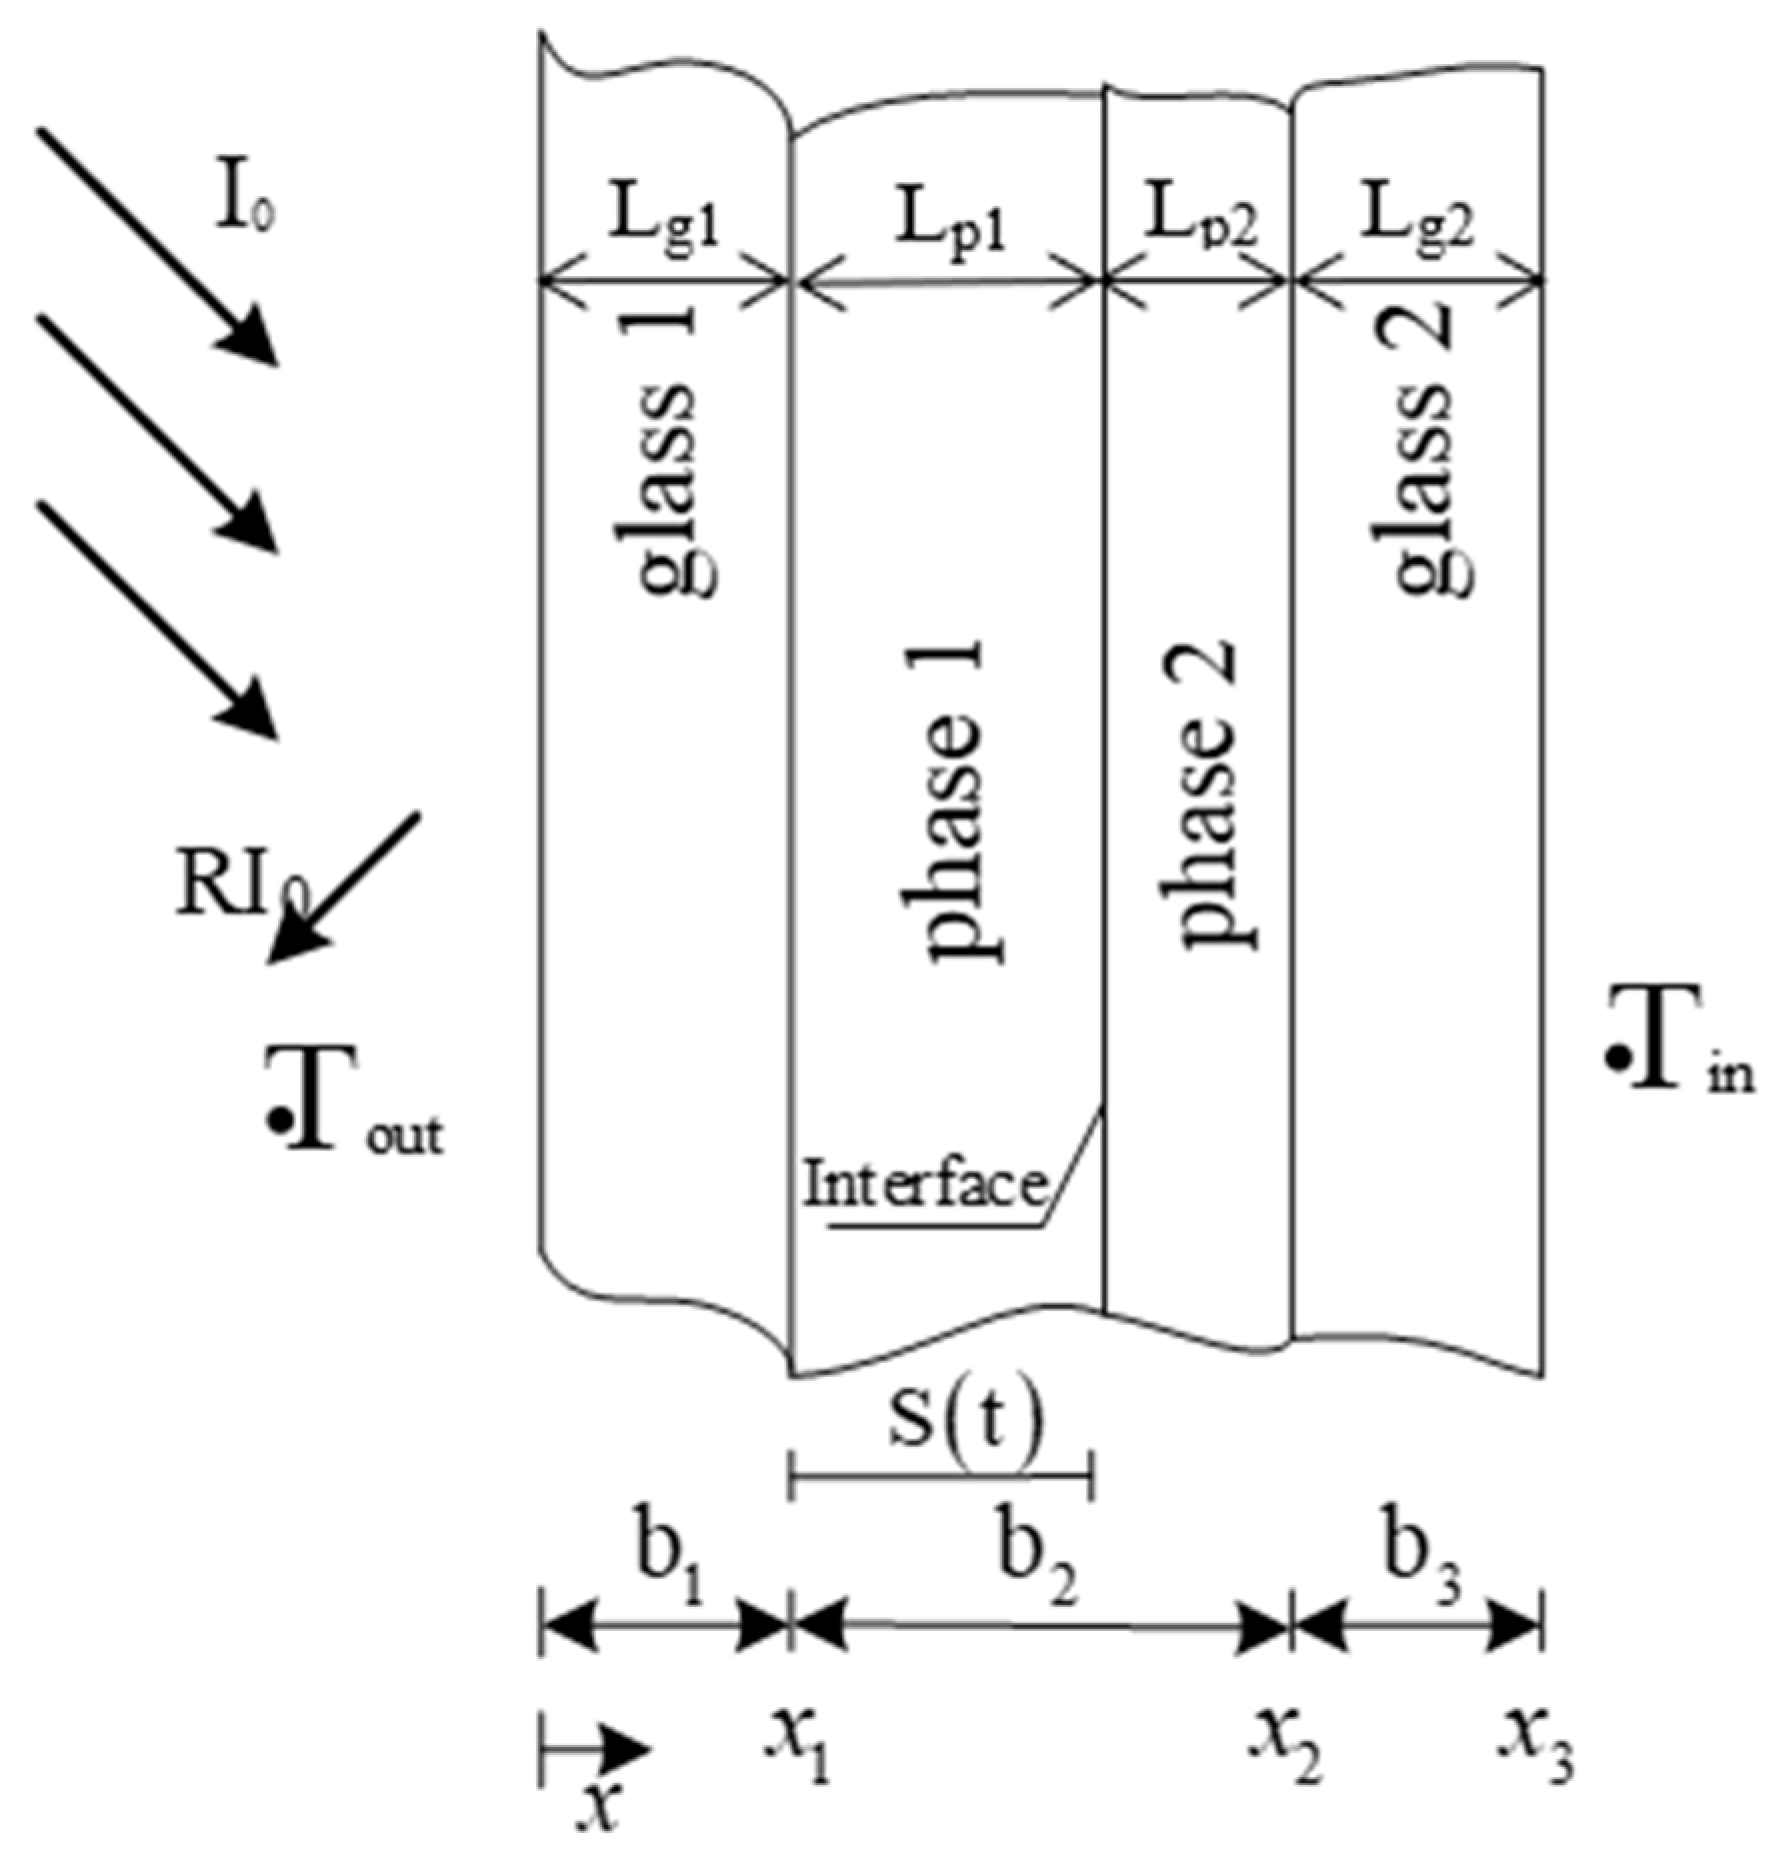
The schematic diagram of the composition of the double-layer glass unit equipped with PCM is shown in Figure 2. Since solid and liquid phases are concurrently formed during the phase-change process, in the figure, two different phases (phase 1 and phase 2) are shown on the figure. For instance, when solar radiation hits the surface, the PCM layer which is initially in a solid state will start to melt, forming two different sublayers: phase 1 (liquid PCM) and phase 2 (solid PCM). Research conducted on heat transfer includes the three areas, namely the outer glass, PCM layer, and the inner glass.
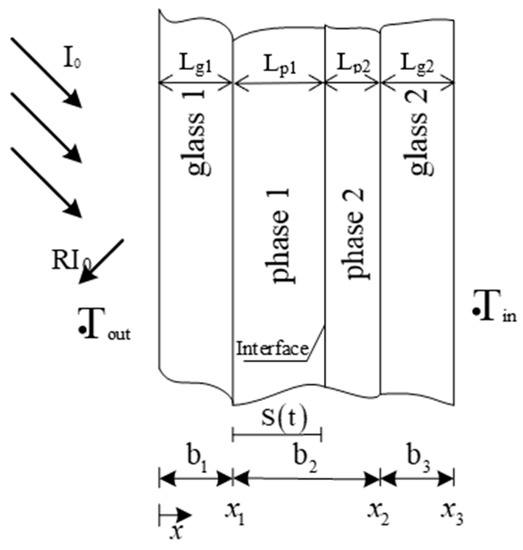
Figure 2.
Composition of double-glazed units equipped with PCM.
The 1D transient energy equation for the glass region is as follows [42].
where, ρg, cP,g, λga and x are density (kg/m3), specific heat capacity (J/kg·K), thermal conductivity (W/m·K), and thickness (mm) of glass, respectively. T is temperature (K), is time (s), and is radiative source term (W/m3), which is calculated by Equation (5).
The 1D transient energy equation for the PCM region is given by [45]:
where, ρp and H are density (kg/m3) and specific enthalpy (J/kg) of the PCM, respectively, and H is calculated by Equation (3). λp and x are the thermal conductivity (W/m·K) and thickness (mm) of the PCM, respectively.
where, Tr and cp,p are the PCM reference temperature (K) and specific heat capacity (J/kg·K), respectively. β is the local liquid fraction in the different calculation region, which is calculated by the linear interpolation of Equations (4a)–(4c). The latent heat capacity of the PCM during the phase-transition process is depicted as QL (J/kg).
where, Ts and Tl are the solid and liquid phase-transition temperatures of the PCM, respectively.
The radiation source term formula of each layer for calculation is given below. Equations (5a), (5b), (5c), and (5d), respectively, given below, are used when the calculation nodes are located inside the glass layer 1, phase layer 1, phase layer 2, and glass layer 2.
where, Isol is the solar radiation during the day (W/m2) obtained from local meteorological data. Following the order of each material layer of the glass unit from left to right in Figure 2, Ag1, Ap1, Ap2, and Ag2 are the solar absorption ratios with respect to each layer, which are calculated by Equation (7). The material layer thicknesses (m) are denoted by Lg1, Lp1, Lp2, and Lg2. Finally, the solar transmittance values are represented by Tg1, Tp1, Tp2,, and Tg2, which are calculated based on Equation (6).
The solar transmittance of the glass and PCM layers are calculated by the following equations [46].
where, ρ1, ρ2, ρ3, and ρ4 are the interface reflectivity of the surface between the glass and air; phase layer 1 and the glass; phase layer-1 and 2; and phase layer 2 and the glass, which is calculated by Equation (8). The extinction coefficient (m−1) of the glass, phase layer 1, and phase layer 2 are respectively represented by and .
The absorptance of the glass and phase layers are obtained by the following equation [45].
The ρ is calculated using Fresnel’s relations [46,47,48,49].
where, nR and nL are the refractive indices (RIs) of the materials on the left and right sides of each interface in Figure 2, and nL is 1 when ρ1 is calculated.
The boundary condition on the outer glass exterior surface (x = 0) considering the convective heat exchange with the outdoors as well as the solar radiation effect when it is available, is given by:
where, qr is the heat transfer through radiation between the outside surface of the outermost glass and the external atmosphere (W/m2), which is calculated by Equation (10). Also, ho is the exterior surface convection heat-transfer coefficient of the outermost glass (W/m2·K). Ta,o and To are, respectively, the ambient temperature and the temperature of the exterior surface of the outermost glass (K).
Here, is the Stefan–Boltzmann constant. is the emission rate of the glass surface. Fs is the angle coefficient between the glass channel and the sky, which is calculated by Equation (11a). is the radiation attenuation factor between sky and air, in the case where it is assumed that all surface temperatures are consistent, which is calculated by Equation (11b). Ts is the sky temperature (K), which is calculated by Equation (11c). Fg is the angle coefficient between the glass windows and surrounding surfaces, which is calculated by Equation (11d).
where is the angle between the ground and the glass channel. For example, when = 0°, it is a horizontal glass channel.
The interior surface boundary condition of the inner glass at x = x3 accounting for heat exchange by convection and radiation with the interior is given as [36]:
Here, hi and Ti are the heat transfer coefficient (W/m2·K) and temperature (K) on the interior surface of the inner glass layer, respectively. Ta,i is the interior temperature (K).
The surface between the outer glass and paraffin material boundary condition at x = x1 is Equation (13a) [36]. When the PCM layer near the inner surface of the outer glass is liquid, the boundary condition of the coupling surface between the outer glass and the paraffin material at x = x1 is Equation (13b) [36].
where is the radiation heat flux from the surface (coupling) between the outer glass and paraffin material (W/m2). The coupling surface temperature of the outer glass (K) and the coupling surface temperature of PCM (K) are denoted by Tg and Tp, respectively. The PCM thickness (m) of the liquid is represented by .
When phase change occurs in the phase-change material region, the boundary conditions at the solid–liquid interface at x = x1 + S(t) are given in Equation (14) [36].
Here, Tp,l and Tp,s are the liquid phase-change material temperature near the interface (K) and the solid PCM temperature near the interface (K), respectively. The radiative heat flux is represented by at the phase-change interface of PCM (W/m2). The thermal conductivity (W/m·K) of molten PCM near the phase-change interface and of solid PCM near the phase-change interface are represented by kp,l and kp,s, respectively.
The boundary condition for the surface (at x = x2) between the inner glass and the PCM is given by Equation (15a). When the PCM layer near the inner glass is liquid, the boundary condition of the coupling surface between the inner glass and the phase-change material at x = x2 is expressed by Equation (15b).
Here, (W/m2) is the surface radiation heat flux between the inner glass and the PCM.
2.3. Solution Method
A 1D optical and numerical heat transfer model for PCM containing double-glazed windows is established, and the dynamic characteristics of the optical and thermal mechanisms of a glass window with PCM are numerically studied. Based on the model developed in [42], the explicit finite difference scheme is used to discretize the equations and boundary conditions defined previously. The PCM area and glass panel are divided into 12 equally spaced portions and 6 equally spaced portions along the thickness direction, respectively.
2.4. Validation of Numerical Model
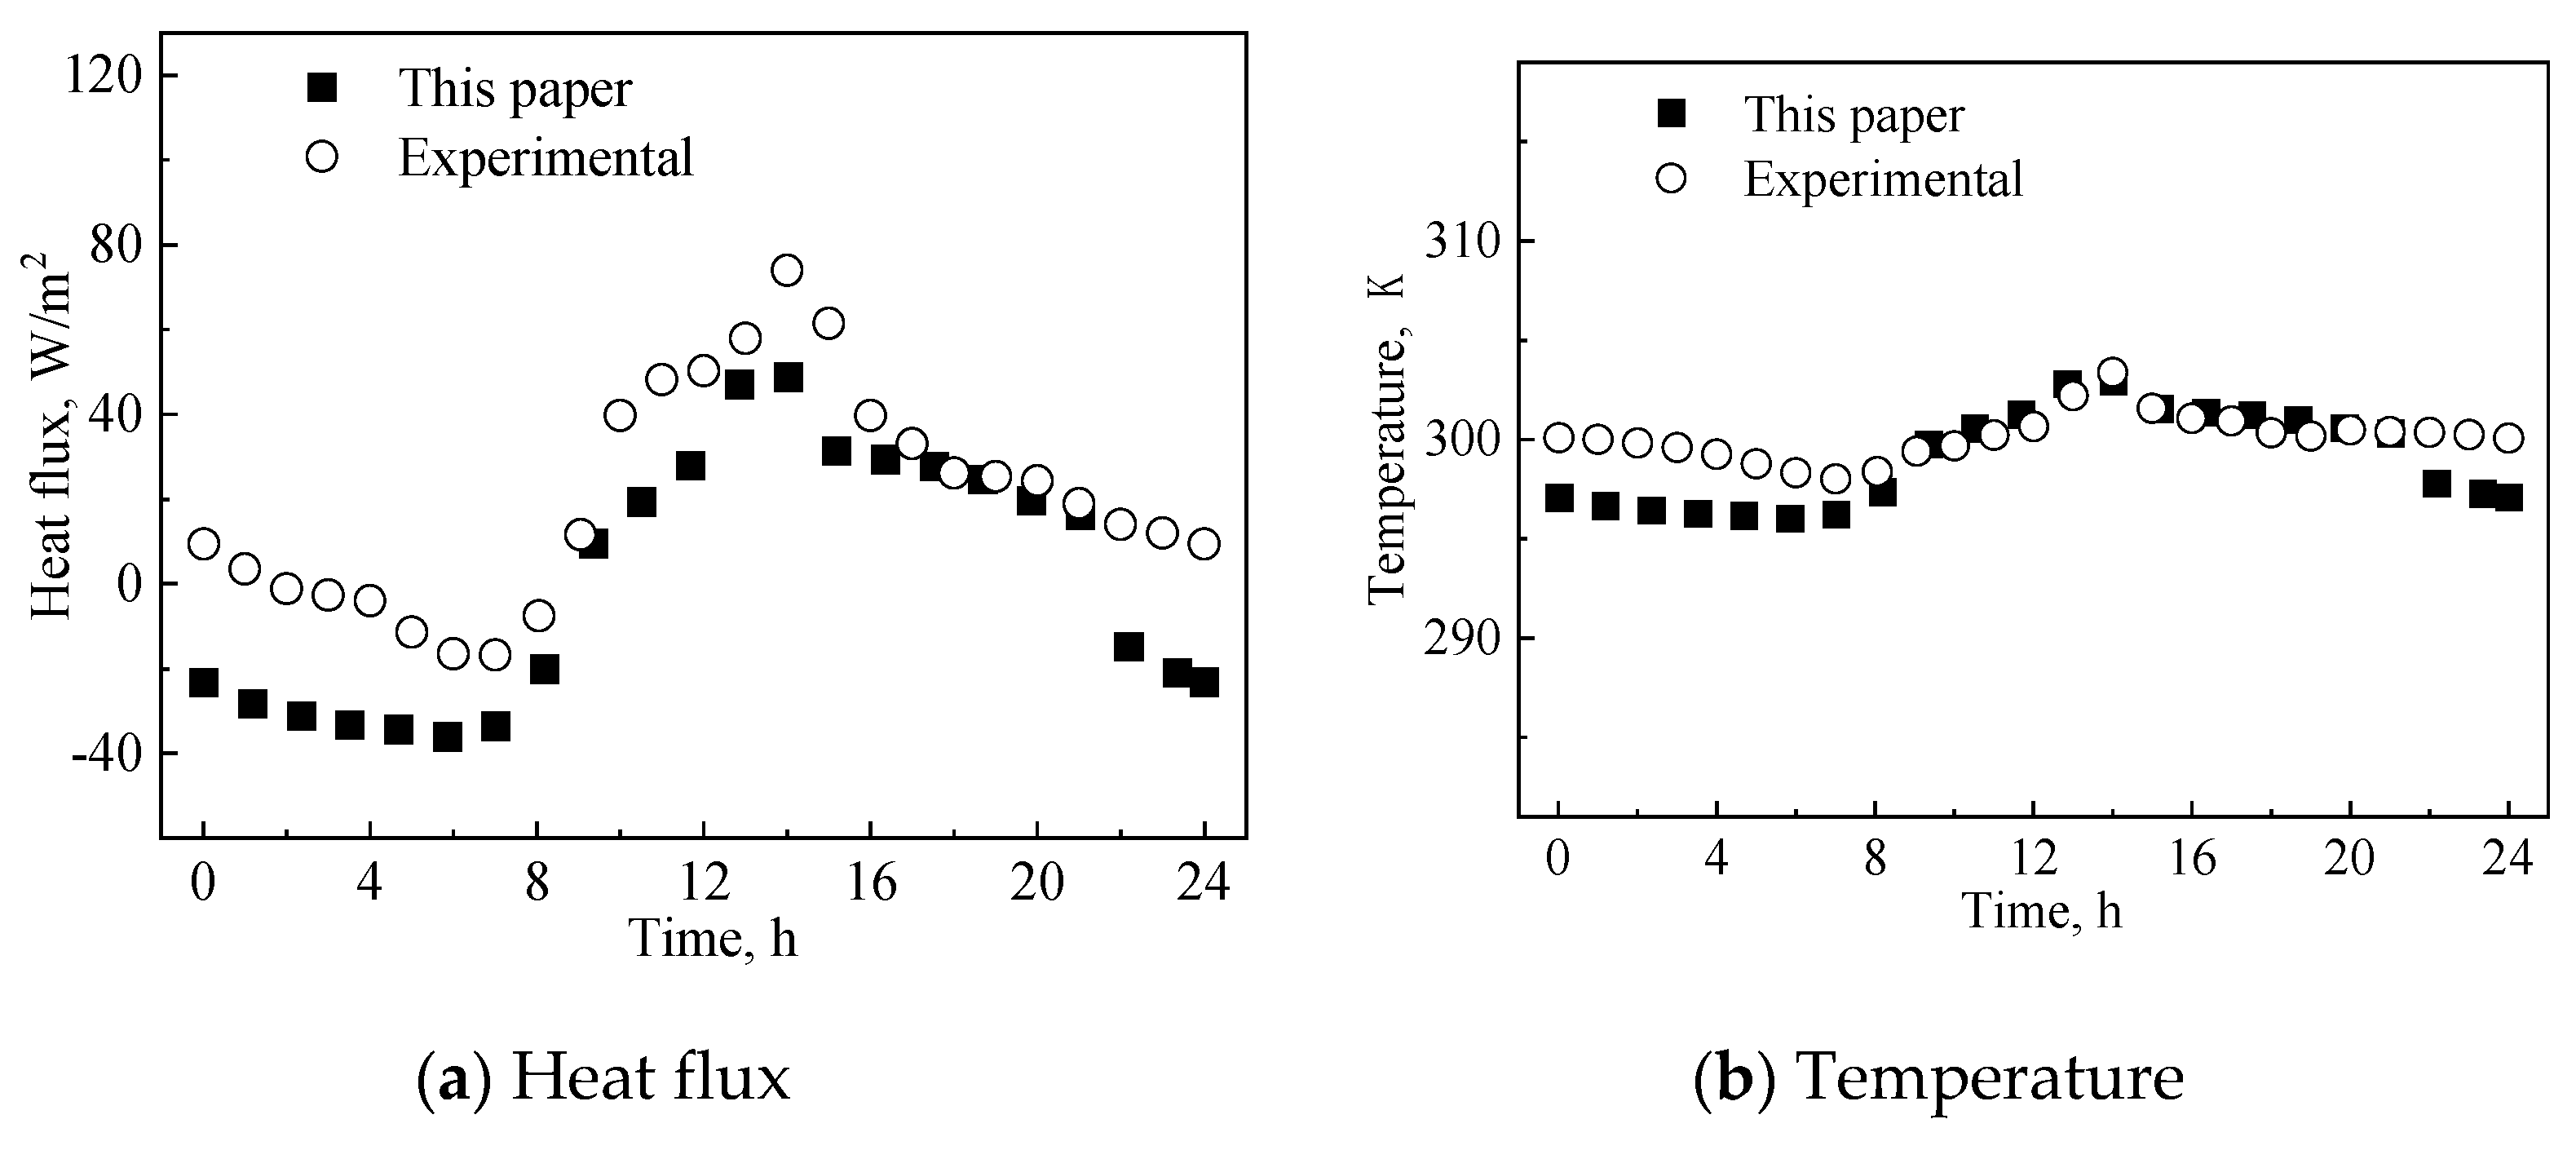
The numerical calculation process is verified by the parameters and results in [40]. In the process of model verification, the parameters and environmental parameters of double-layer embedded glass filled with PCM are selected according to [40]. The simulation process reaches a periodic change over two days. Figure 3 shows the comparison between the heat flux density (with absence of transmitted solar energy) and the inner surface temperature of the PCM glass channel calculated through the establish numerical model and the experimental results in [40].

Figure 3.
Obtained heat flux and temperature results in present work and in [40].
As shown in Figure 3, due to the influence of the initial temperature and paraffin morphology, the calculated results have different characteristics compared to the literature results at different time periods. Due to the impact of the initial temperature of the glass channel containing paraffin material in the experiment, there is a significant difference between the two before 7:00. There is another time period between 11:00 and 14:00 where there is a significant difference between the two, because during this stage, the paraffin is liquid and radiation heat transfer dominates the process. Since the influence of the initial temperature has been eliminated after 7 h of the experiment, the two results are basically consistent between 7:00 and 11:00. During the period from 14:00 to 22:00, the calculation results are very close to the literature values.
3. Results and Discussion
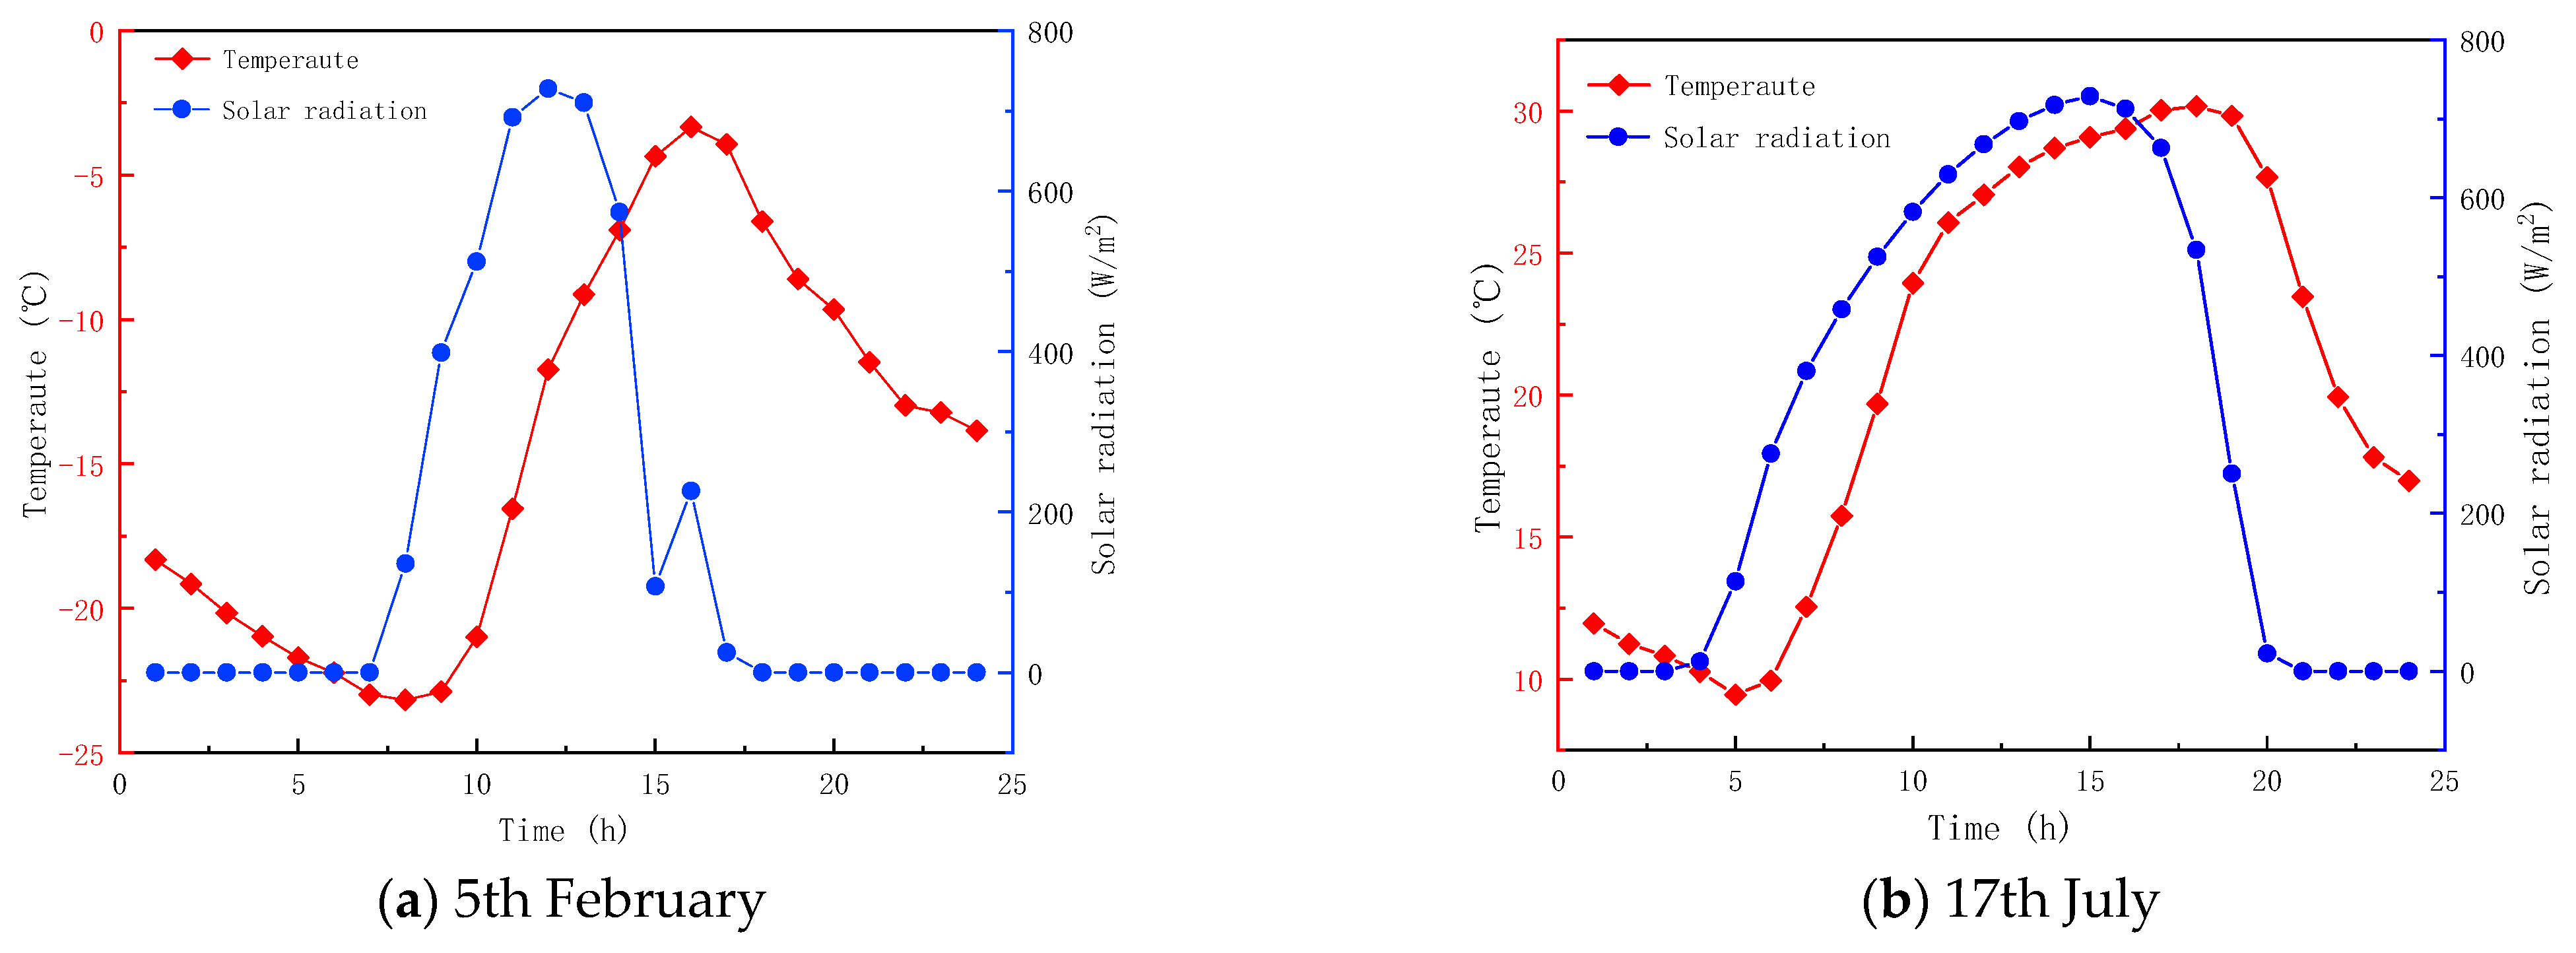
Table 1 provides the relevant parameters of the material. The angle between the glass and PCM is 0. The greenhouse is located in Heihe City, Heilongjiang Province, China. Figure 4 shows the hourly ambient temperature and total radiant intensity of Heihe on 5 February and 17 July. The data is obtained from the EnergyPlus V8.9 software. The indoor temperature is set to 20 °C for the numerical calculations. The hi and ho on the surfaces of the glass are respectively taken as 7.75 and 7.43 W/m2·K [40]. The emissivity of the glass is 0.88 [36]. The RI and extinction coefficients (EC) of the glass are 1.5 and 19 m−1, respectively [38]. The RI of the PCM is the same in both phases, and is equal to 1.3. However, the ECs of the PCM are phase-dependent and equal to 30 m−1 and 5 m−1, respectively, for the solid and liquid phases.

Table 1.
Thermophysical properties of glass and PCM.
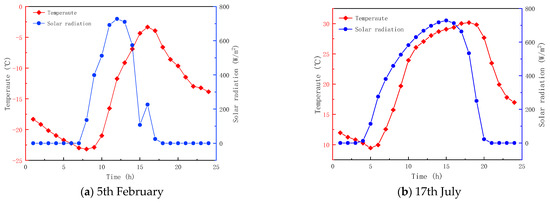
Figure 4.
Average hourly fluctuation of ambient temperature and solar radiation intensity.
3.1. Optical Parameters
3.1.1. Effects of Refractive Index
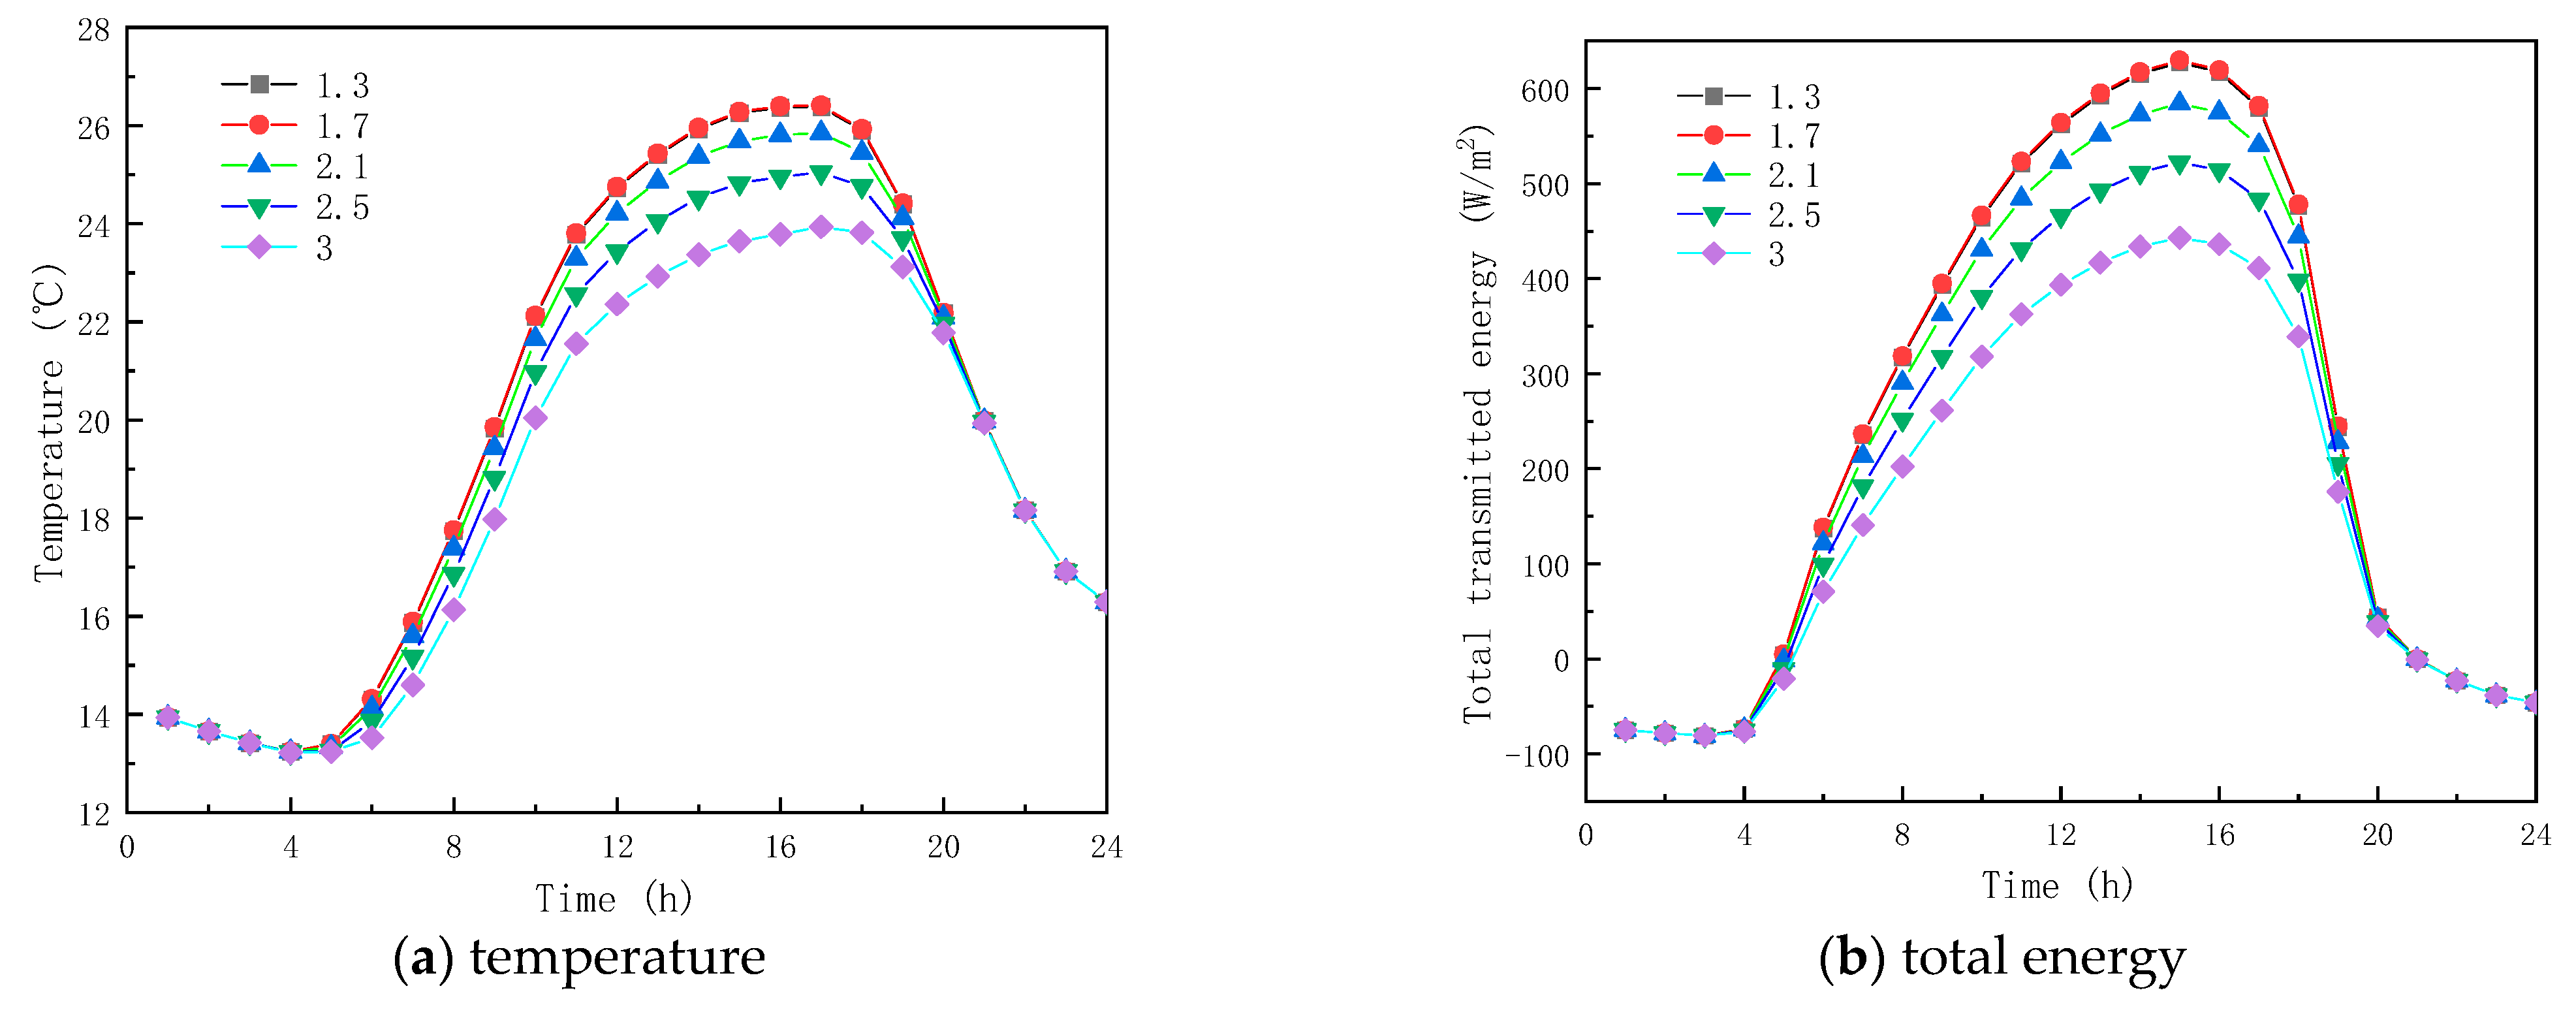
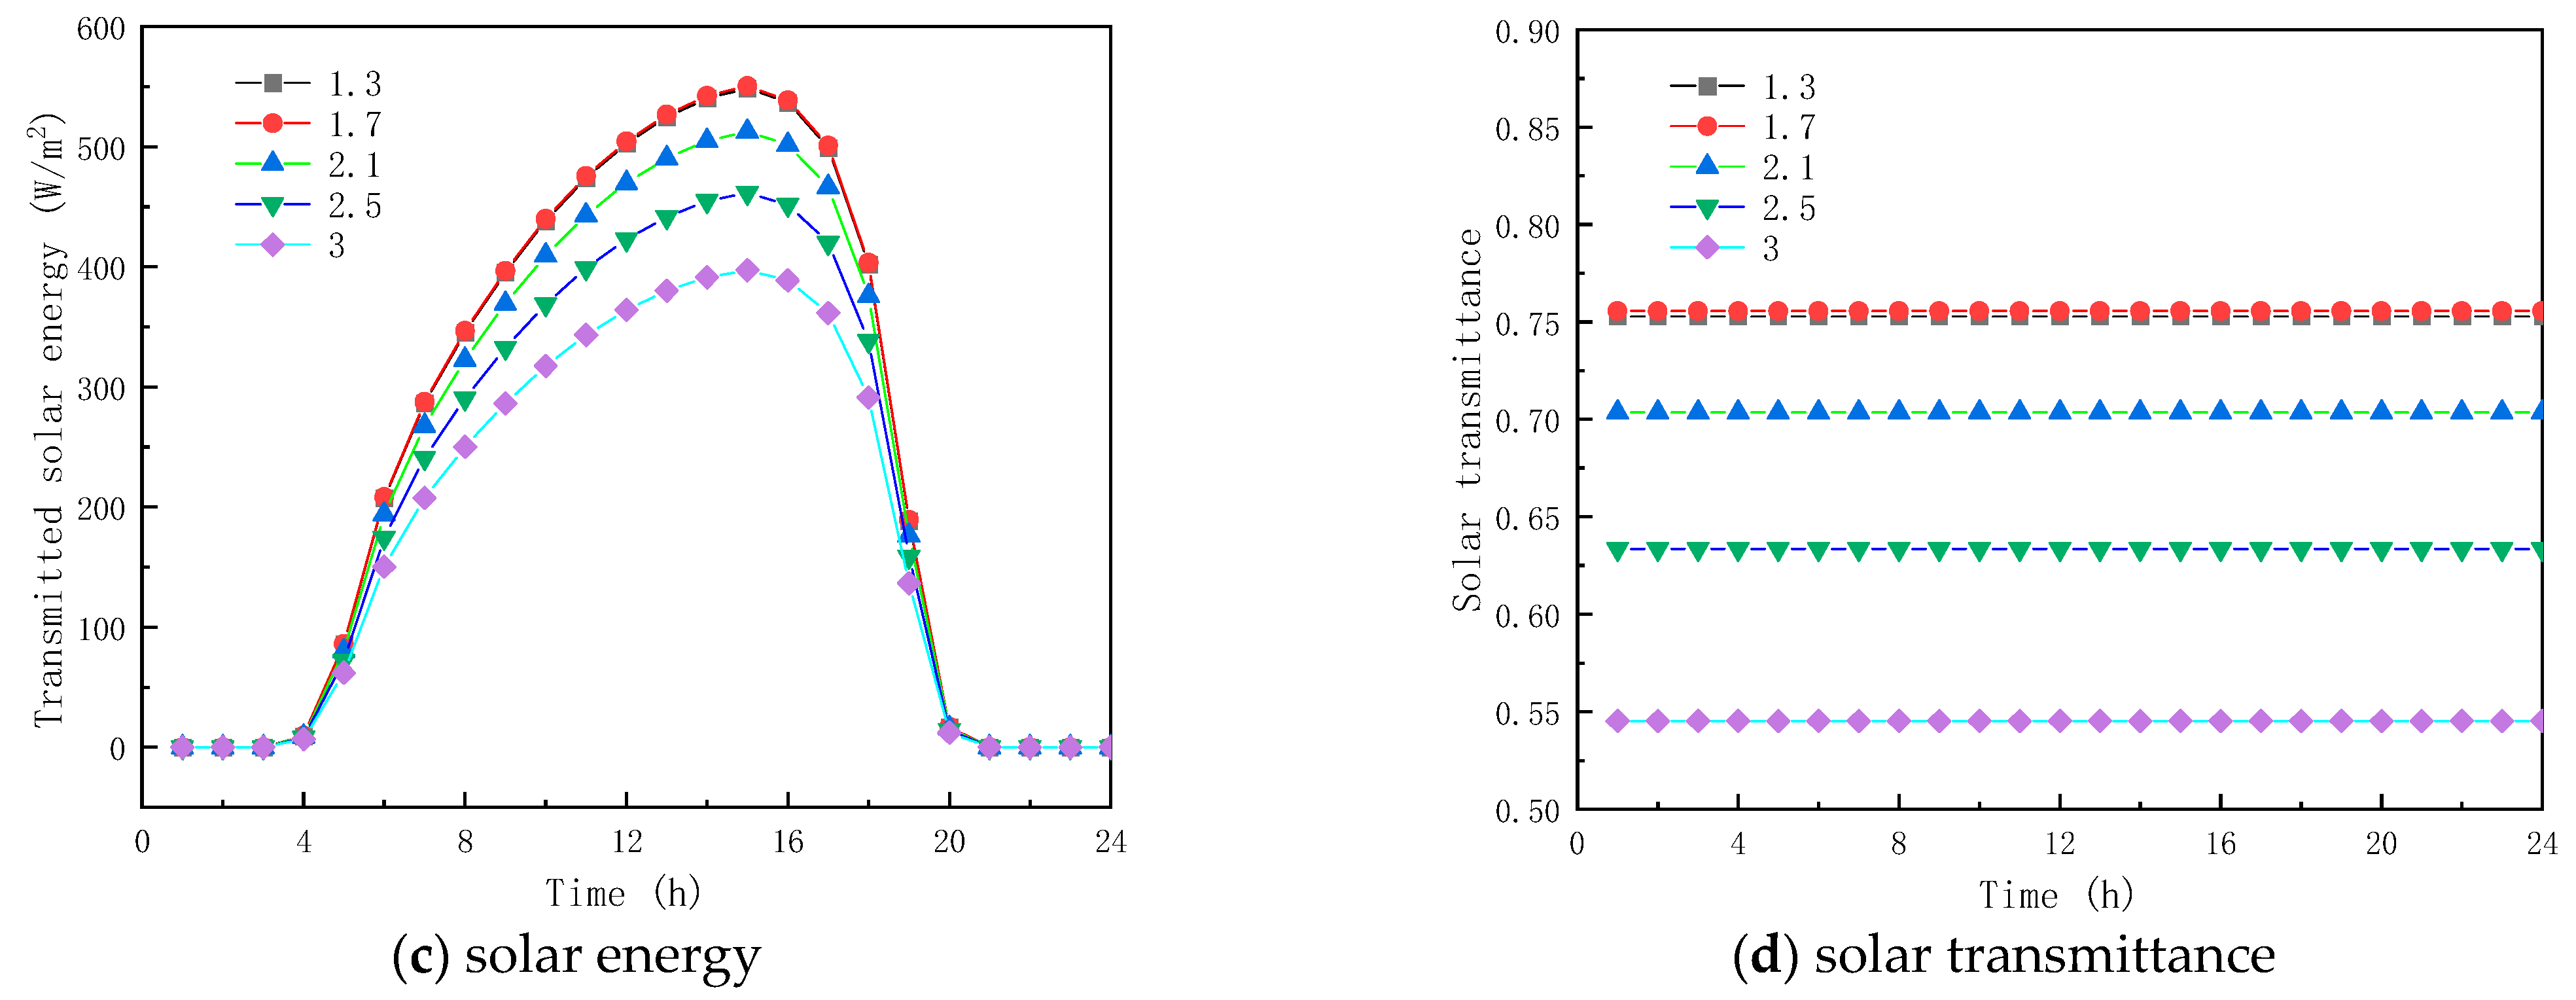
In order to analyze the effect of PCM RI on the thermal performance of glass channels containing PCM, five RI conditions were studied for solid phase-change materials with a constant RI of 1.3, and for liquid phase-change materials with RIs of 1.3, 1.7, 2.1, 2.5, and 3.0, respectively.
Figure 5a shows the inner surface temperature of the glass channel containing liquid paraffin material at different RIs. As seen in Figure 5, the trends of the inner surface temperature profiles of the glass channel before 10:00 and after 17:00 are roughly the same, and the interior surface temperatures with different RIs at the same time are almost the same. The reason is that the liquid phase rate of paraffin material in the glass channel is very small during this time, so the RI effect of the liquid paraffin material is not obvious. Considering the time between 10:00 and 17:00, the liquid phase rate of the paraffin material in the glass channel increases, and the RI of the liquid paraffin material has a weaker effect on the temperature of the interior surface. At 14:00, the temperatures of the inner surface of the glass channel containing paraffinic materials with RIs of 1.3, 1.7, 2.1, 2.5, and 3.0 were 25.93 °C, 25.93 °C, 25.37 °C, 24.53 °C, and 23.37 °C, respectively. As given in Figure 5, the inner surface presented the highest temperature at similar times, and the results indicate that the liquid paraffinic material RI has marginal influence on the interior surface temperature of the glass unit.
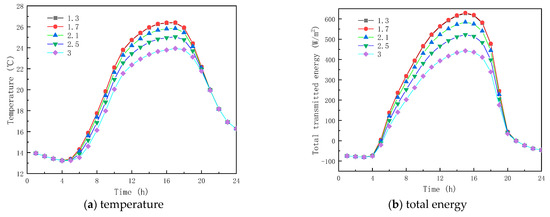
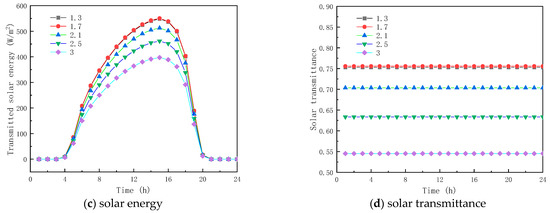
Figure 5.
Effect of refractive index on glass channels containing PCM (17th July).
The solar radiation energy and the transmission energy of the inner surface of the glass unit containing liquid paraffin material are shown in Figure 5b,c for different RIs. As seen from the figures, there are considerable differences in the transmitted energy between 10:00 and 17:00. For example, at 15:00, the energy transmission and solar radiation of the inner surface of the glass channel of liquid paraffin material with RIs of 1.3, 1.7, 2.1, 2.5 and 3.0 are 627.49 W/m2 and 548.60 W/m2, 629.82 W/m2, and 550.55 W/m2. In contrast, before 10:00 and after 17:00, the energy transmittance and solar radiation energy of the inner surface of the channel are almost the same, because of the observed low liquid-phase rate of the phase-change material in the glass channel. The results show that solar radiation energy has a great impact on the inner surface transmission energy of the glass channel, resulting in the highest transmission energy appearing around 15:00. The total inner surface transmission energy of the channel decreases as the RI of the liquid paraffin material increases, meaning that the RI of the liquid paraffin material has a major effect on the inner surface transmission energy of the glass channel. From Figure 5d, it is seen that when the RI is less than or equal to 1.7, the transmittance of the paraffin material no longer increases. When the RI is greater than 1.7, the liquid-phase transmittance reduces with the increase in the RI of the paraffin, and reaches the minimum value of 55% when the RI equals 3.
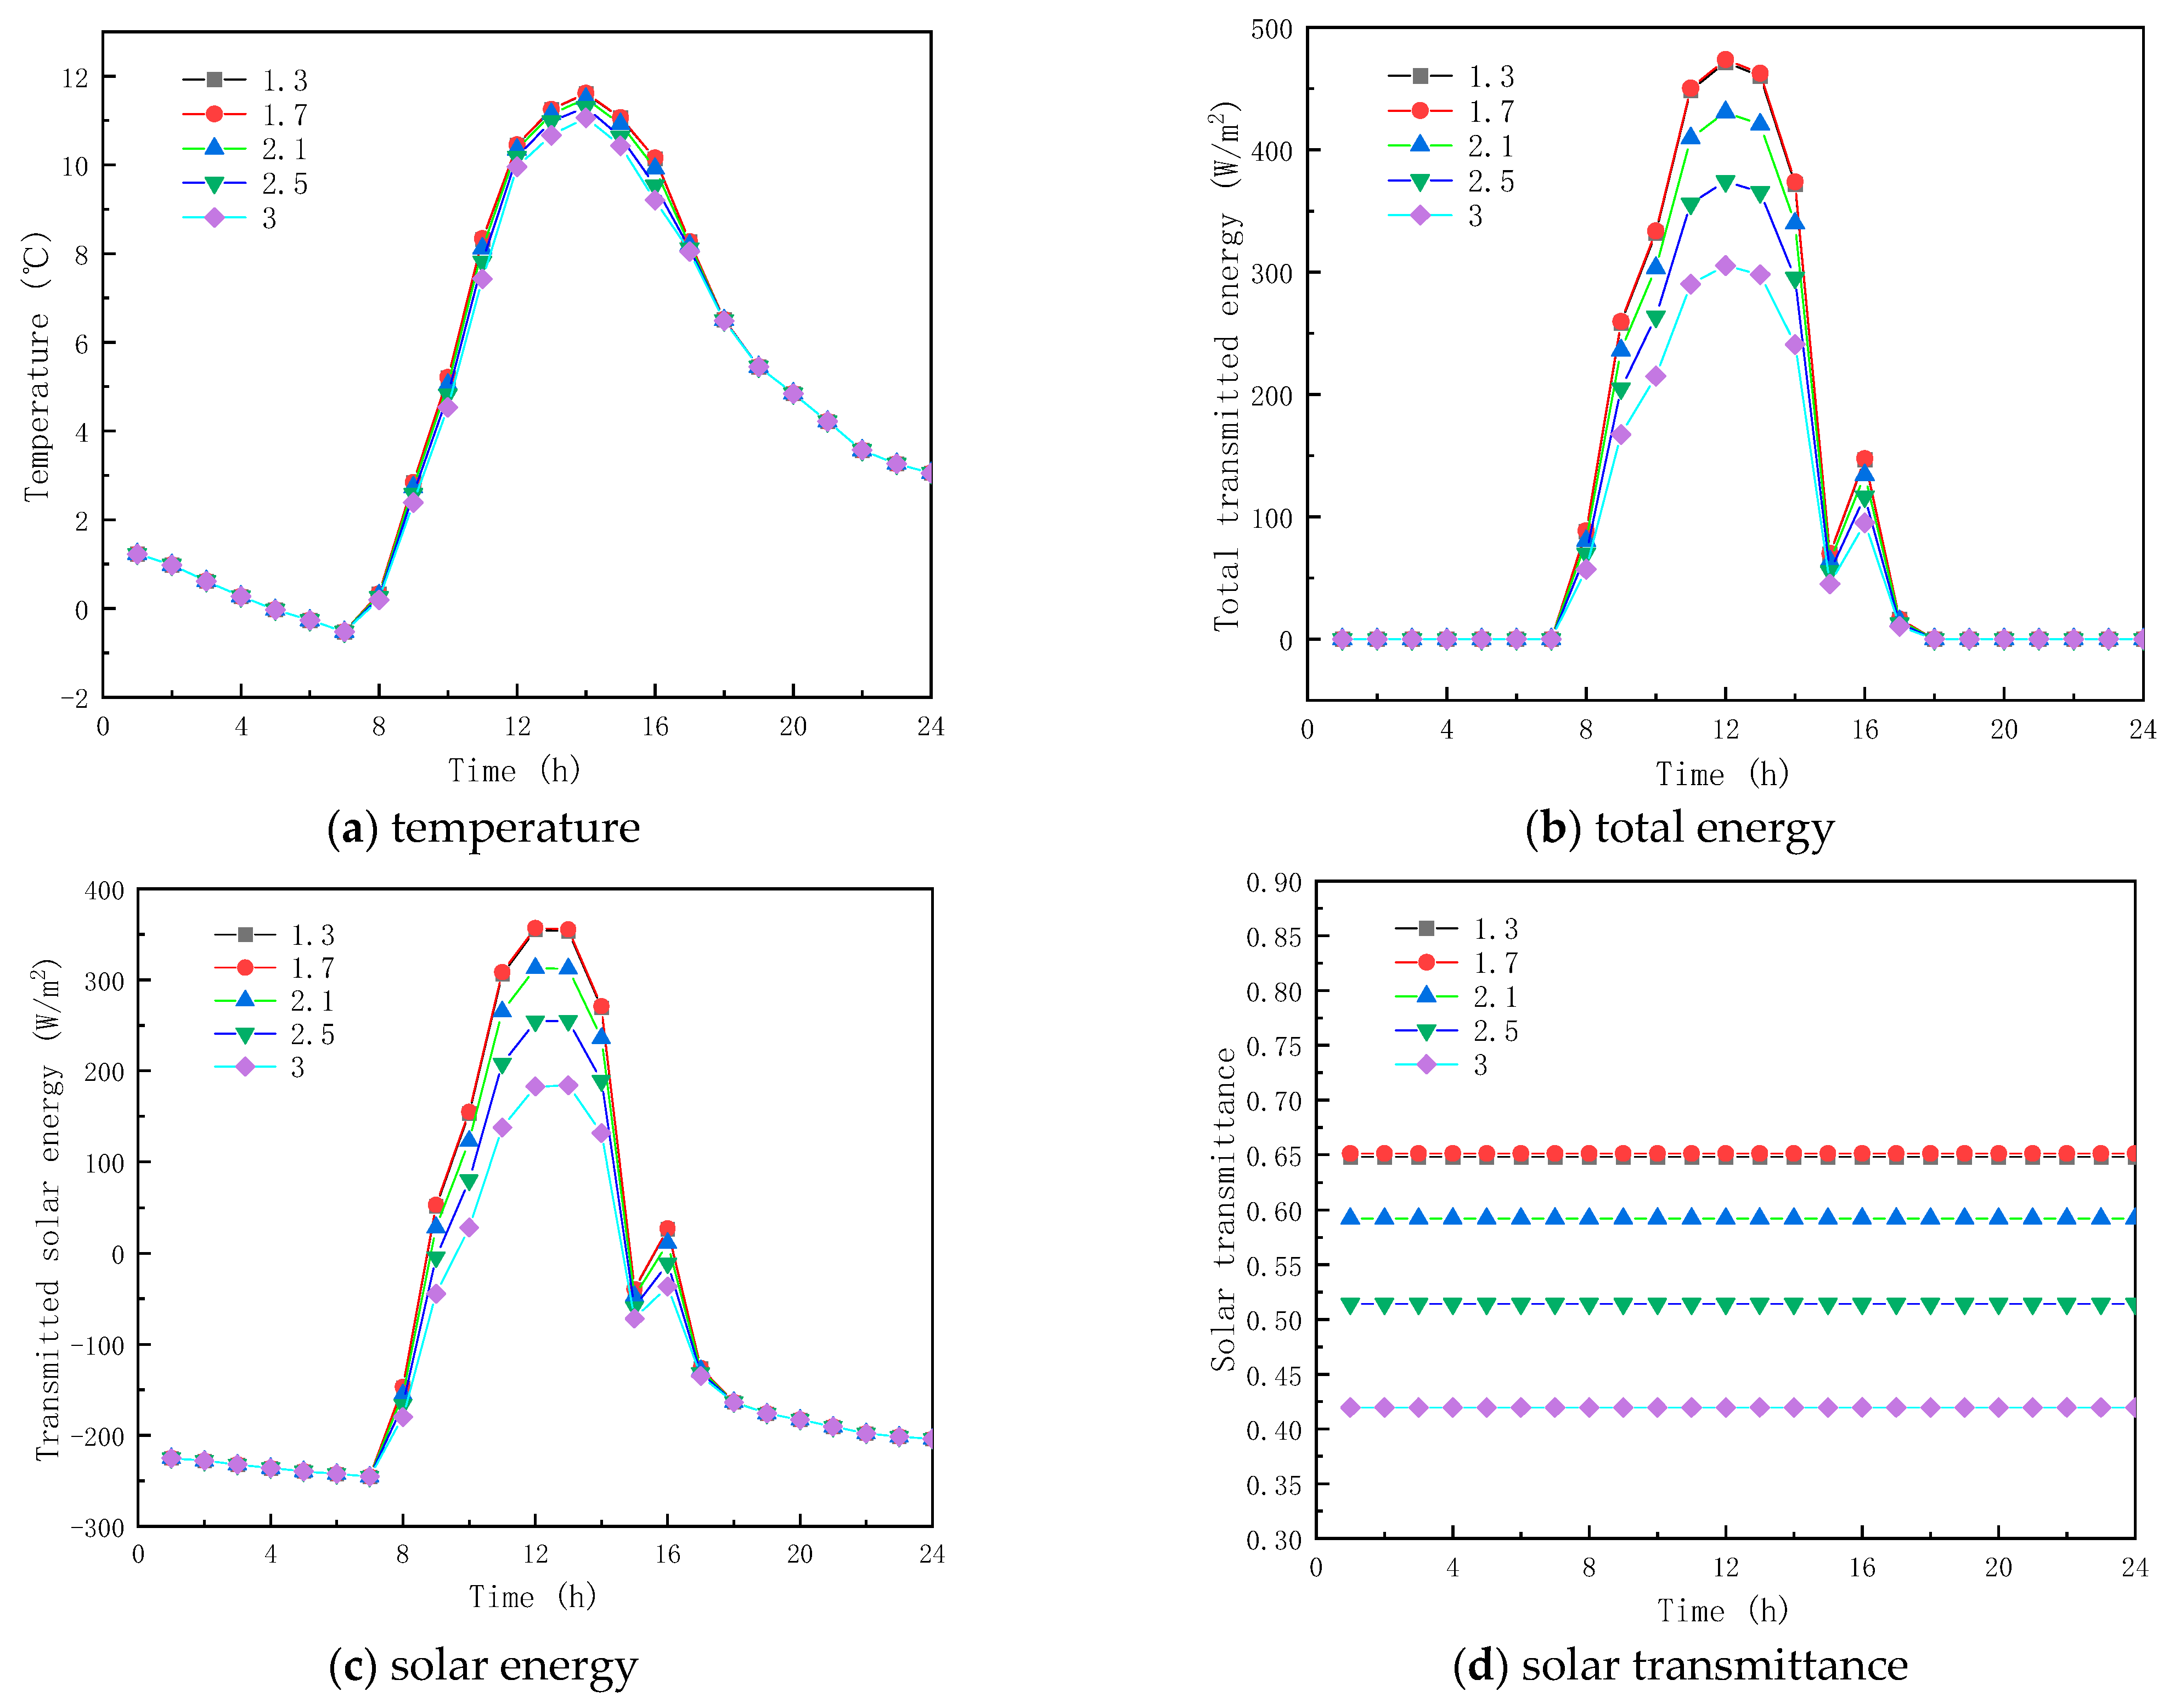
To analyze the effect of the RI of paraffin materials on the thermal properties of glass units containing solid paraffin materials, five solid paraffin materials with RIs of 1.3, 1.7, 2.1, 2.5, and 3.0 were studied. The RI of the paraffin materials in the liquid state was 1.3, and the solid–liquid paraffin material absorption coefficients (ACs) were 30 m−1 and 5 m−1, respectively.
Figure 6a shows the temperature profiles of the inner surface of the glass channels containing solid paraffin materials with different RIs. As observed, the RI of the solid paraffin material has a minor effect on the inner surface temperature. Between 7:00 and 17:00, the RI of the solid paraffin material has some influence on the interior surface temperature, due to the solar radiation. For example, at 13:30, the inner surface temperatures of the glass channel of the liquid paraffin material with RIs of 1.3, 1.7, 2.1, 2.5, and 3.0 are 11.61 °C, 11.61 °C, 11.49 °C, 11.30 °C, and 11.30 °C, respectively.

Figure 6.
Effect of refractive index on glass channels containing PCM (5th February).
Figure 6b,c show the transmission energy of the glass channel containing solid paraffin material with different RIs. As seen from the figure, the total inner surface energy transmission and solar radiation energy of the glass channel are almost the same before 7:00 because the solar radiation energy is 0; in contrast, there is a significant difference between 8:00 and 16:00, due to solar radiation exposure, total energy transmission and the solar radiation of the interior surface of the glass channel. During this time, the total transmittance energy and solar radiation energy of the inner surface of the glass channel decreased with the increase in RI of the solid paraffin material, and the melting time of the PCM increased, which was due to the increase in interfacial reflectivity with the increase in RI of the paraffin material, resulting in the decrease in transmittance energy into the glass channel, e.g., at 10:00, the RI of 1.3, 2.1, 2.5 of the solid. The inner surface total energy transmittance and solar radiation energy of the glass channel of paraffin materials with RIs of 1.3, 2.1, and 2.5 are 399.04 W/m2 and 361.01 W/m2, 358.84 W/m2 and 323.13 W/m2, and 305.83 W/m2 and 272.57 W/m2 at 10:00, respectively. The total energy transmittance and solar radiation of the inner surface of the glass channel of paraffin material with RIs of 1.3, 2.1 and 2.5 at 12:00 were, respectively, 471.42 W/m2 and 354.73 W/m2, 430.79 W/m2 and 312.87 W/m2, and 305.21 W/m2 and 182.71 W/m2. Since the paraffin was in liquid state between 12:00 and ~17:00, the total energy transmitted and solar radiation of the inner surface of the glass channel were almost the same. Between 17:00 and 20:00, the total energy transmitted and for solar radiation of the inner surface of the glass channel decreased as the RI of the paraffin material increased due to the curing of the paraffin material. The results indicate that the RI of the solid paraffin material has a substantial influence on the total transmittance energy of the inner surface of the glass channel. As given in Figure 6d, when the RI is less than or equal to 1.7, the transmittance of the paraffin material no longer increases. When the RI is greater than 1.7, the transmittance decreases as the RI of the solid phase of the paraffin material increases, and reaches a minimum value of 41.95% when the RI is 3.
3.1.2. Effects of Extinction Coefficients
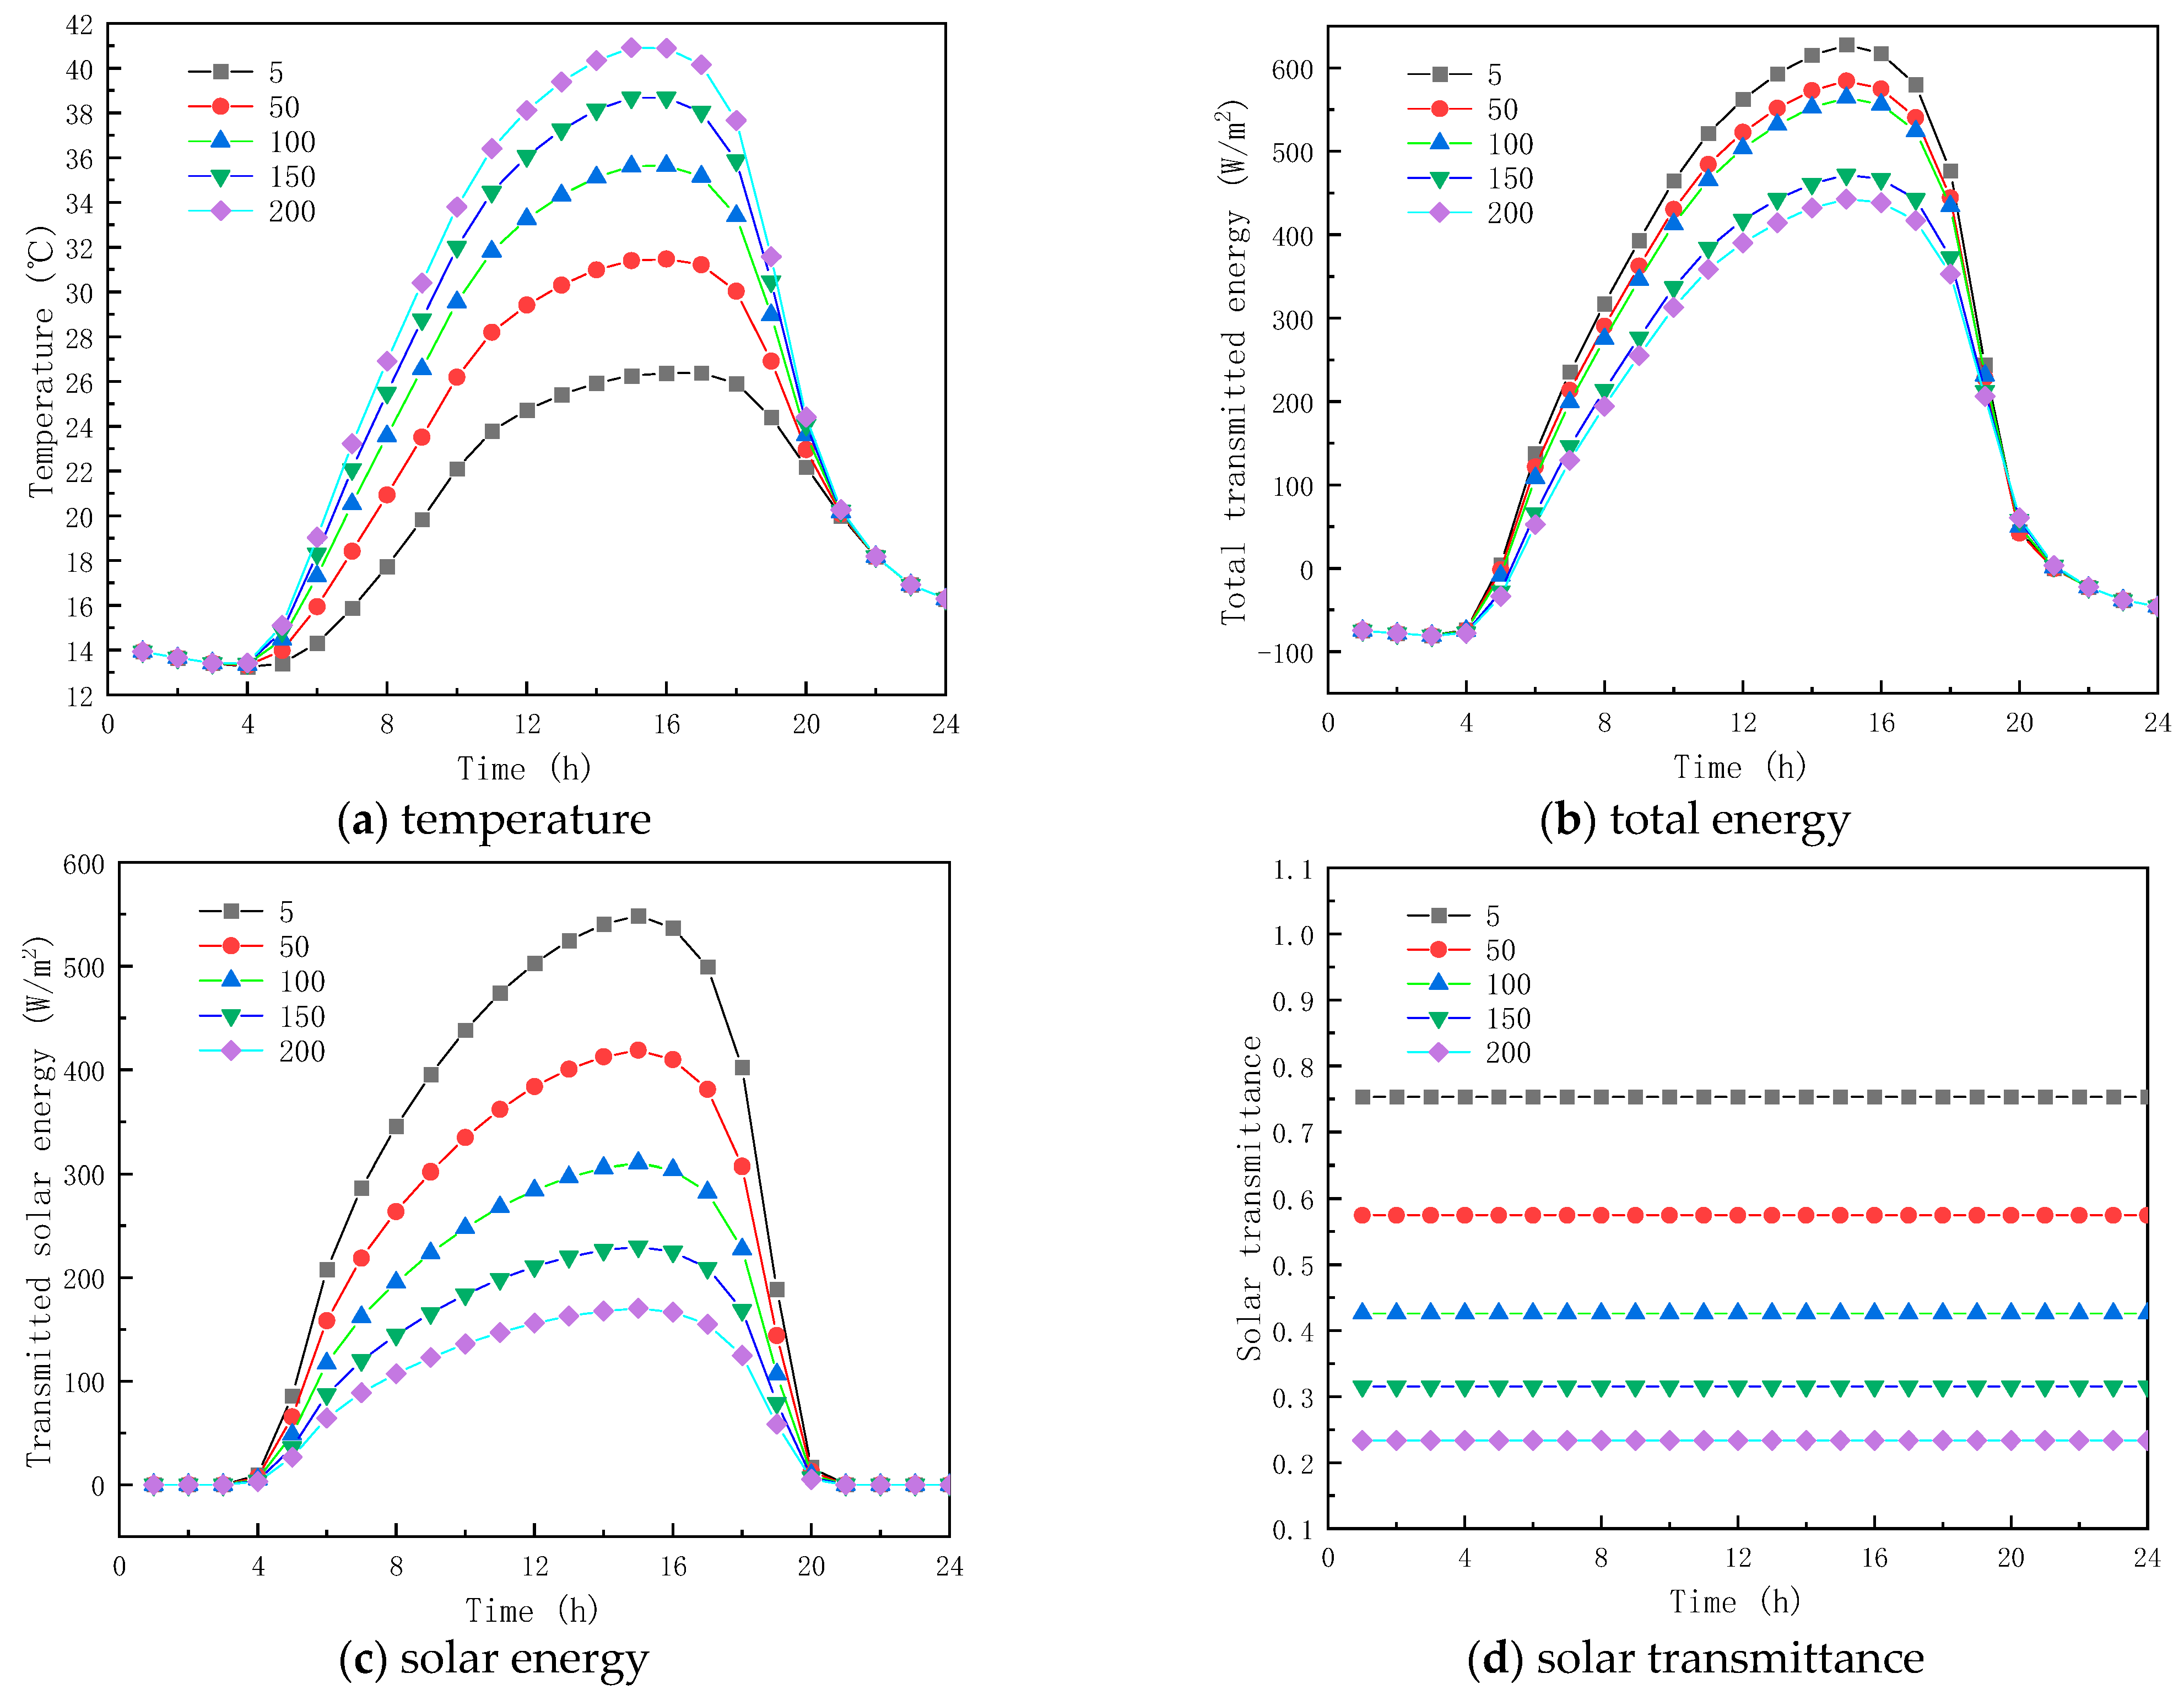
The four different solid and liquid ECs of the PCM are 30 and 5 m−1, 30 and 50 m−1, 30 and 100 m−1, 30 and 150 m−1, and 30 and 200 m−1, respectively. It is also noted that the RI of the PCM is calculated as 1.3.
Figure 7a shows the impact of EC on glass channels containing liquid PCM. As seen from Figure 7, before 4:00, the temperature curves of the interior surface of the glass channel have the same trend because of the solar radiation absence, and the temperature values of the interior surface of the glass channel containing solid paraffin materials with different ACs were very close at the same time; after 4:00, the AC of the liquid-phase paraffin materials has a great influence on the interior surface temperature, due to the influence of solar radiation energy. Between 4:00 and 20:00, the influence of the AC of paraffin material on the inner surface temperature increases, and with the increasing AC of the liquid paraffin material, the interior surface temperature of the glass channel increases; for example, at 16:00, the temperature of the inner surface of the glass channel of molten paraffin material with an AC of 5, 50, 100, 150, 200 m−1 is 26.37, 31.47, 35.64, 38.67, and 40.89 °C. The findings show that the AC of the liquid paraffin material has a significant influence on the temperature of the inner surface.

Figure 7.
Effect of extinction coefficients on glass channels containing PCM (17th July).
Figure 7b,c show the transmission energy of the inner surface of the glass channel containing liquid phase-change material when the ACs are different. As shown in the figures, before 4:00, the solar radiation energy and total transmitted energy of the inner surface of the glass channel are almost the same, due to the absence of solar radiation energy. However, between 4:00 and 20:00, the solar radiation energy and the inner surface total transmitted energy of the glass channel are significantly different because of the AC of the liquid PCM, and are so during this time, as the liquid PCM EC increases. The total energy transmittance and solar radiation then decrease, and the time of maximum transmittance energy is delayed because the absorption capacity of paraffin material for solar energy increases with the increase in liquid paraffin material AC, which leads to the decrease in transmittance energy into the room and the increase in temperature of the paraffin material layer at the same time. For example, at 15:00, the solar radiation energy and total transmitted energy of the inner surface of the glass channel of liquid paraffin material with ACs of 5, 50, 100, and 200 m−1 are 627.49 and 548.60 W/m2, 564.16 and 418.78 W/m2, 584.35 and 310.24 W/m2, 471.69 and 229.83 W/m2, and 442.47 and 170.26 W/m2, and the time for presenting the maximum transmission energy on the inner surface of the glass channel of the liquid paraffin material with an AC of 200 m−1 experiences a significant delay, compared to 5 m−1 AC. The results show that the AC of the liquid paraffin material has a considerable effect on the transmission energy of the glass channel, as shown in Figure 7d.
The four different ECs of solid and liquid PCM are 3 and 5 m−1, 30 and 5 m−1, 60 and 5 m−1, 90 and 5 m−1, and 120 and 5 m−1, respectively, when the RI of the PCM is constant and equal to 1.3.
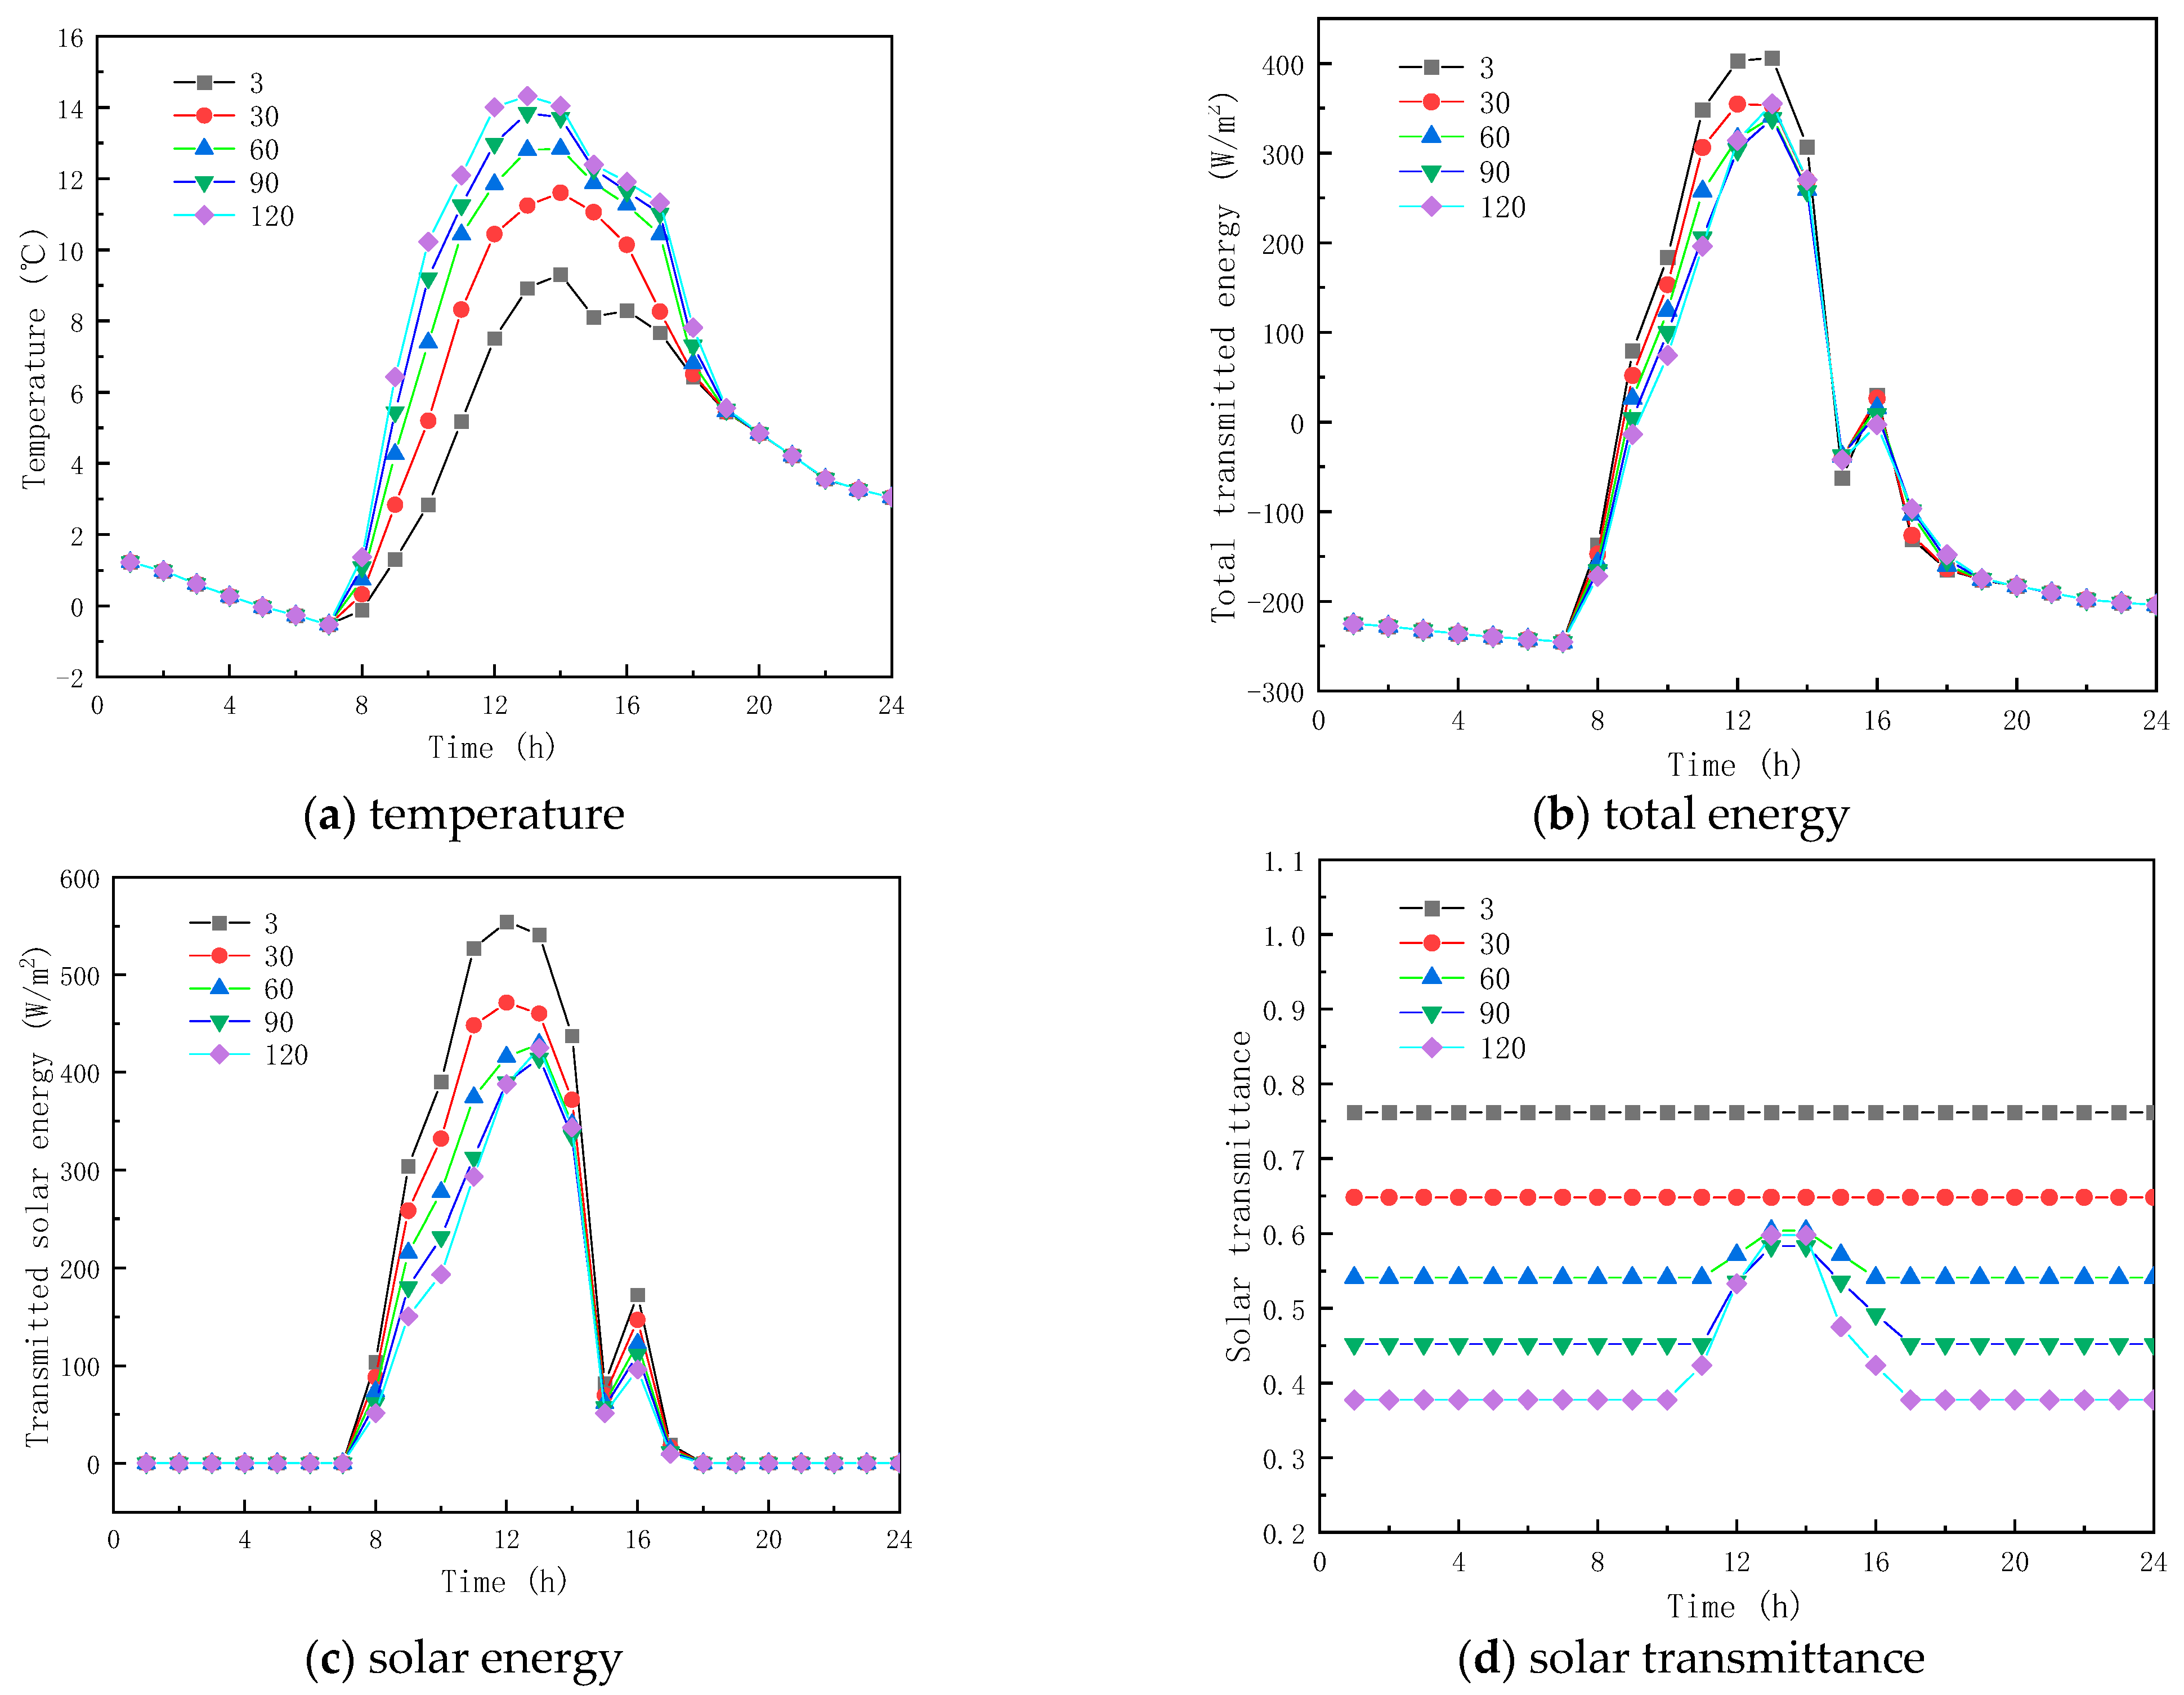
Figure 8a gives the interior surface temperature profiles of the glass channel containing solid paraffin material with different ACs. As given in Figure 8a, the temperature curves of the interior surface of the glass channel trend the same way before 7:00, and their values are very close at the same time point. Before the paraffin material becomes completely liquid, the temperature of the inner surface of the glass channel increases with the increase in the AC of the solid paraffin material, and, when the paraffin material is completely liquid for the ACs of 60, 90 and 120 m−1 for the inner glass channel. The surface temperature decreases rapidly. Before the paraffin material melts completely, a substantial amount of solar energy is stored in the glass channel, resulting in the temperature of the glass channel being much higher than in the outdoor temperature, and when the paraffin material is molten, the absorption capacity of solar energy in the paraffin material decreases, so the temperature of the glass channel also decreases. From the results, it is shown that the AC of the solid paraffin material has a major influence on the inner surface temperature.

Figure 8.
Effect of extinction coefficients on glass channels containing PCM (5th February).
Figure 8b,c show the transmission energy of the inner surface of the glass channel containing solid paraffin material when the AC is different. As seen from the figures, before 7:00, the solar radiation energy and total transmitted energy of the inner surface of the glass channel are basically the same, because of the solar radiation energy absence; on the contrary, however, between 7:00 and 16:00, a considerable difference is observed between the total energy transmitted and the solar radiation, because of the solar radiation energy influence, and during this period the total energy transmittance and solar radiation of the inner surface of the glass reduces with the increase in the paraffin material AC. The reason is that the solid paraffin material AC has a considerable impact on the inner surface energy transmittance of the glass, while the role of the time of presenting the maximum transmission energy and solar radiation energy on the inner surface of the glass is not obvious.
3.2. Thermal Parameters
3.2.1. Effect of Melting Temperature
To analyze the effect of phase-change temperature on the glass channels containing PCM, five phase change materials were studied with melting temperatures of 279–281 K, 282–284 K, 285–287 K, 288–290 K, and 291–293 K. The phase-change interval was fixed at 2 K, and other parameters were selected according to Table 1.
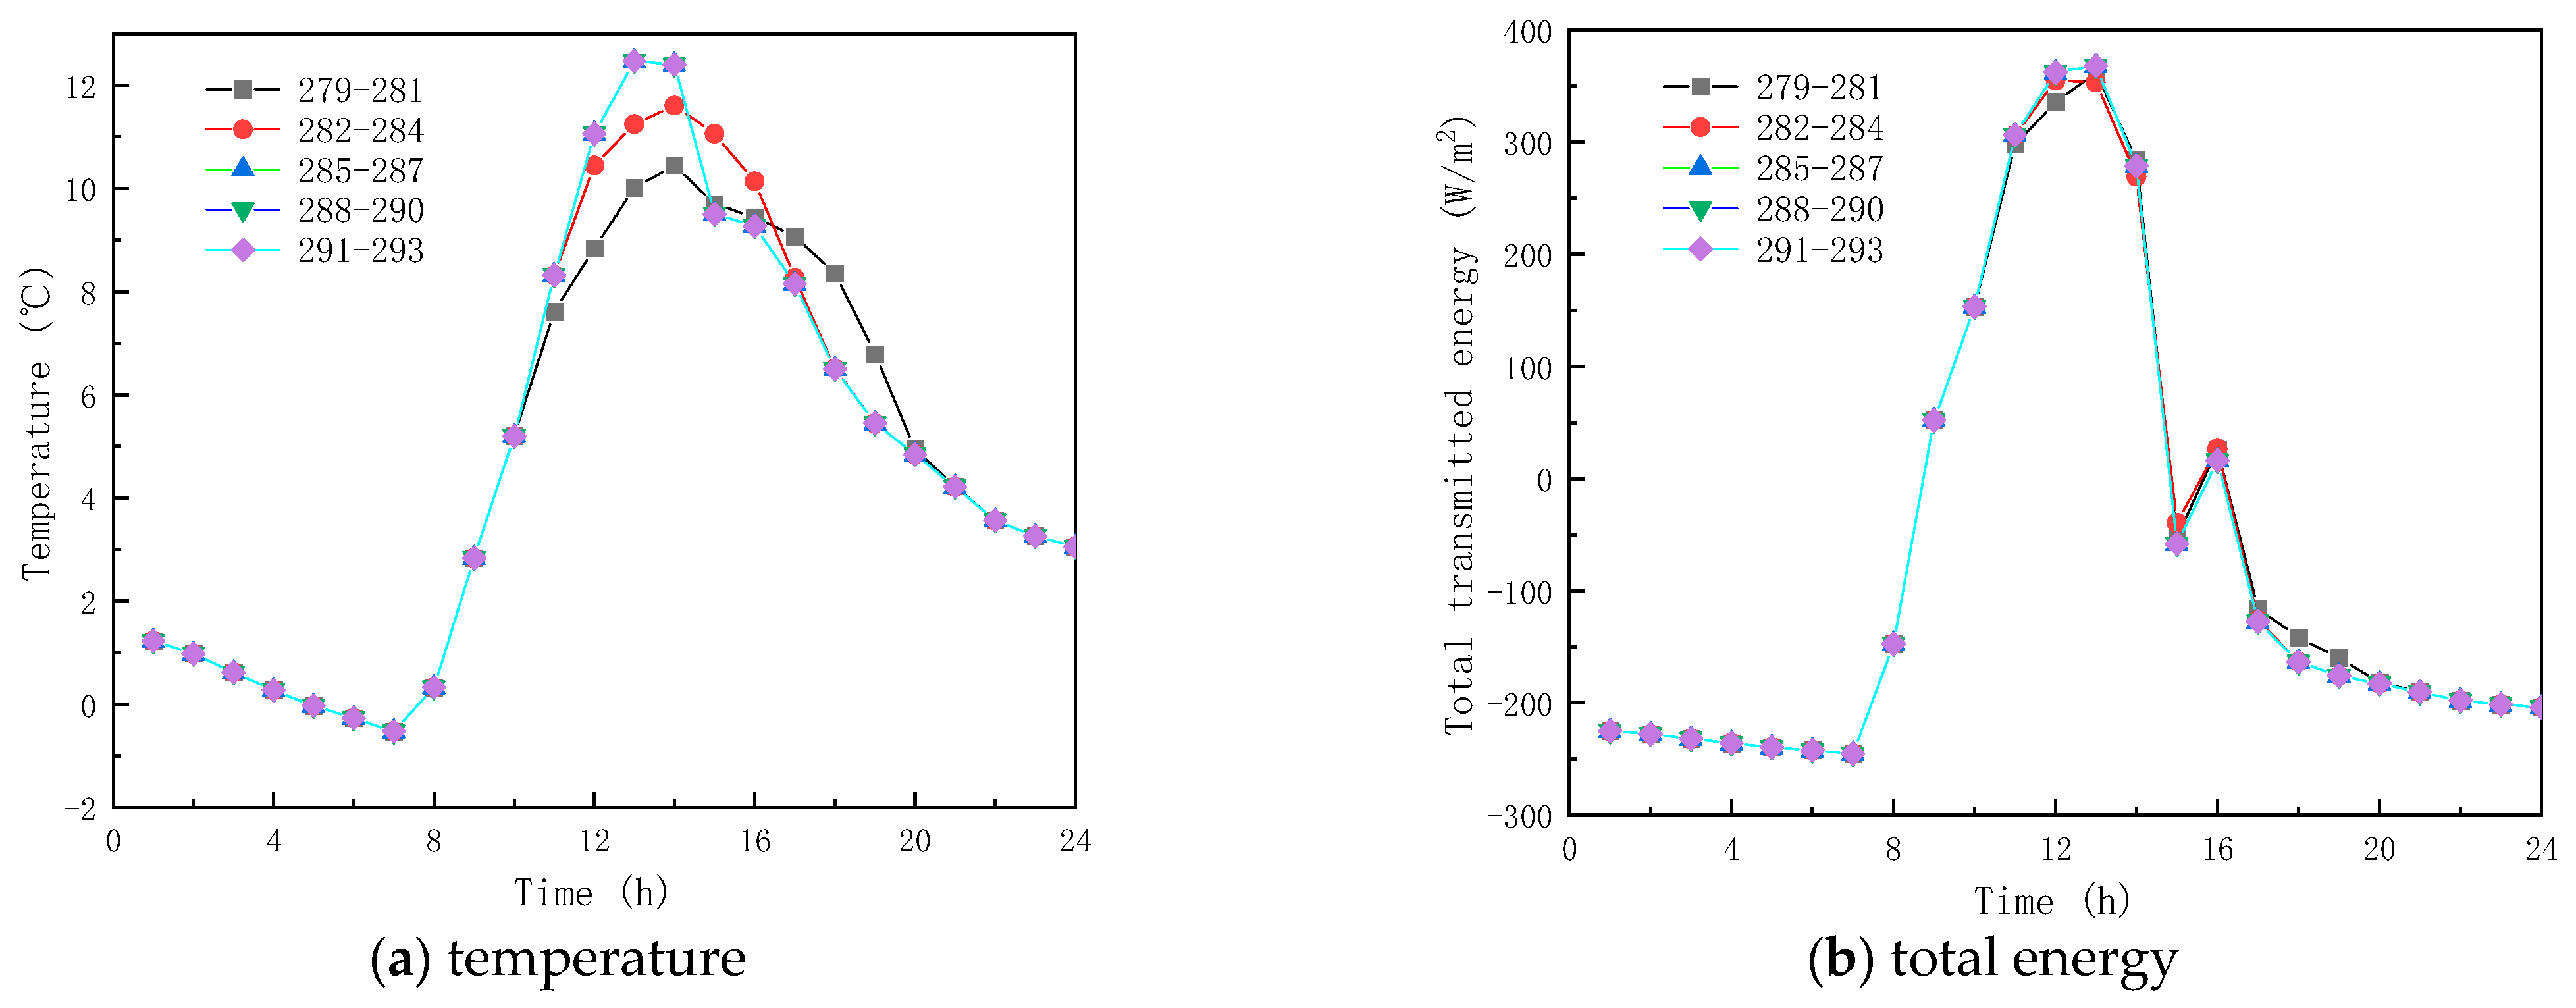
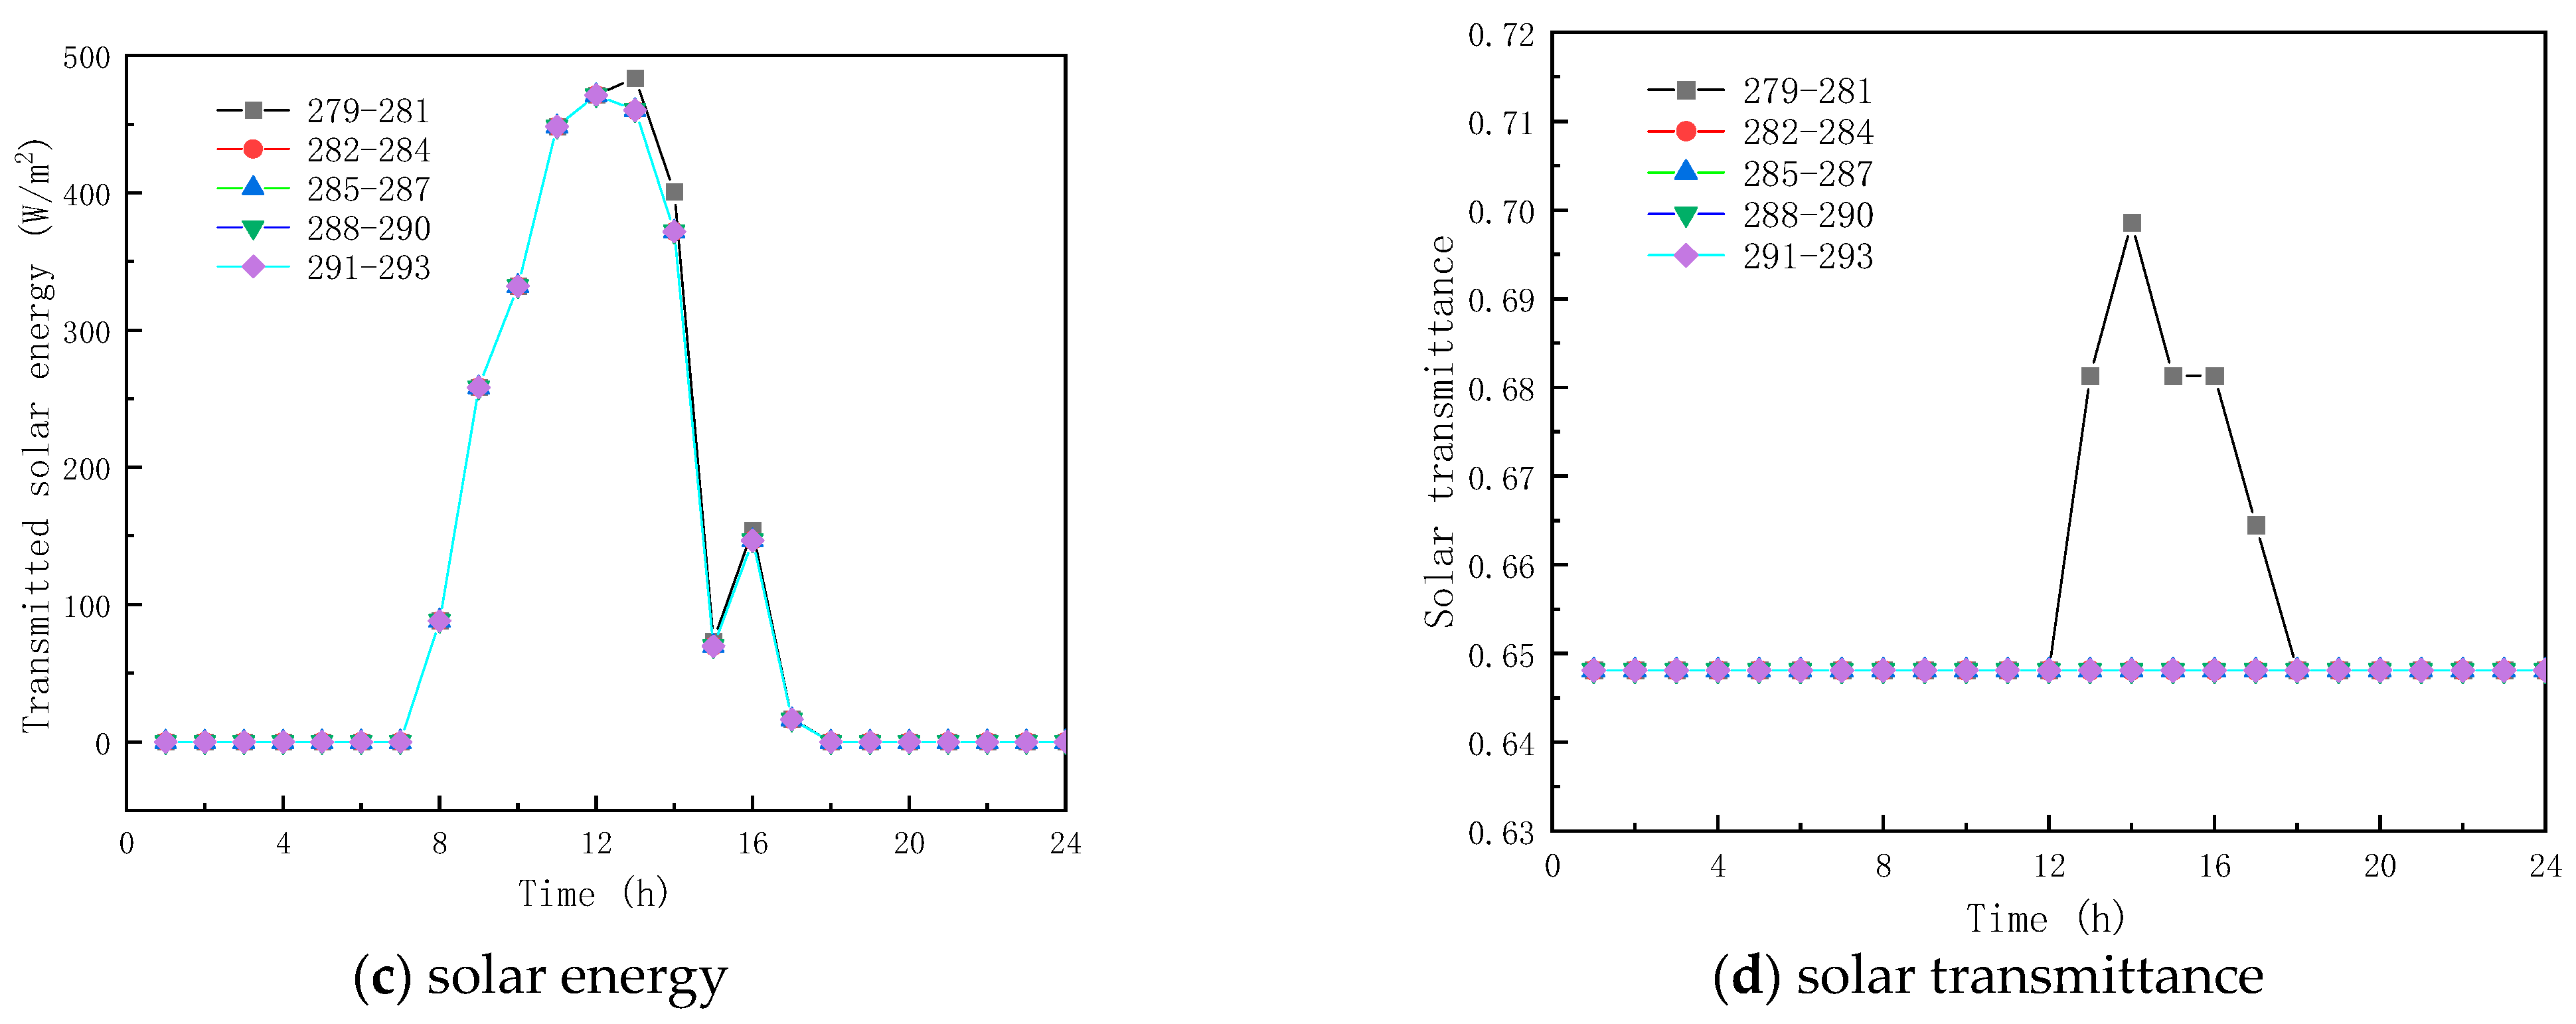
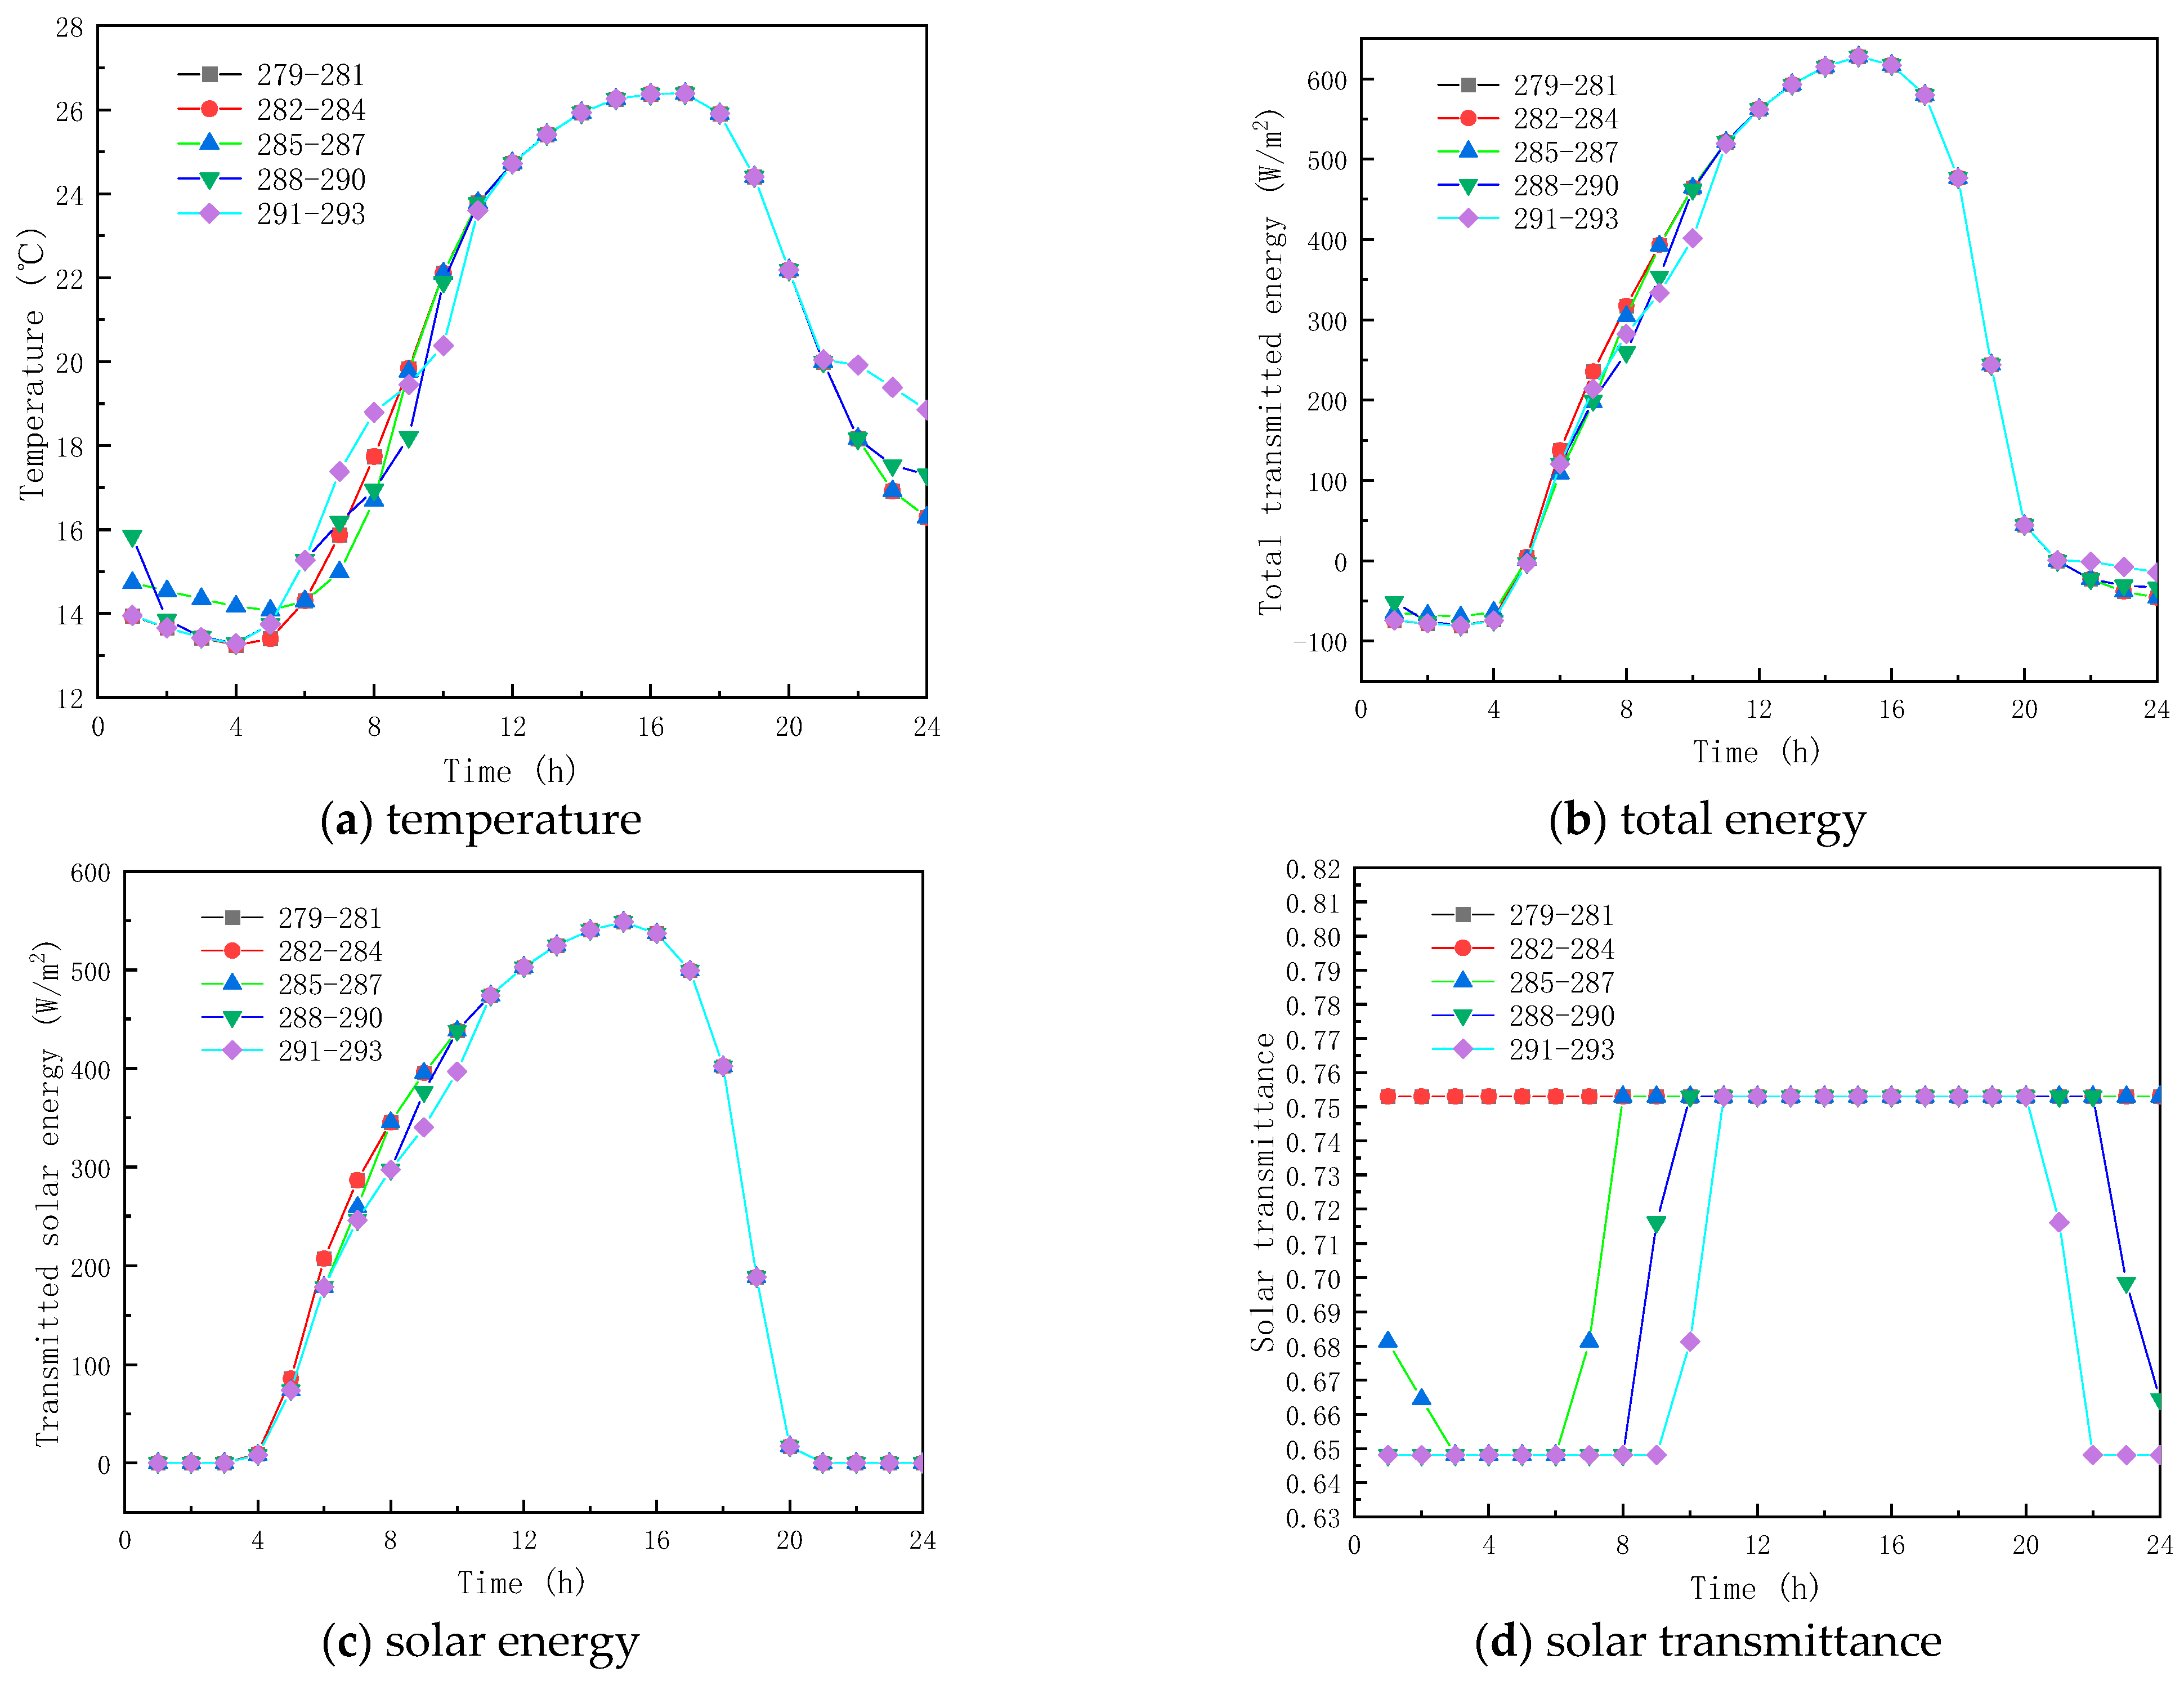
Figure 9 shows the obtained findings for the different melting temperatures of the phase change materials on February 9 (winter). As shown in Figure 9a, the peak temperature increase values with respect to corresponding ambient temperature for the PCM melting of 279–281 K, 282–284 K, 285–287 K, 288–290 K, and 291–293 K, are respectively 13.78 K, 14.95 K, 15.81 K, 15.81 K, and 15.81 K. The results show that as the melting temperature of the PCM increases, an increment in the inner surface temperature is seen, and the peak temperature is reached early. However, when the melting temperature range of the PCM is not less than 285–287 K, the inner surface temperature no longer increases. This is due to the fact that the peak transmission energy of the phase-change material no longer changes, as shown in Figure 9b,c, and it can also be observed that the change in the temperature range of the PCM has less effect on the interior surface transmission energy and the glass roof containing the total paraffin energy. As shown in Figure 9d, the transmittance of the inner surface of the paraffin-containing glass roof remains constant at 64.8% when the phase transition range of the PCM is around 279–281 K. Figure 10 displays the simulation results for the phase-change material’s various melting temperatures on July 17 (summer). According to Figure 10a, the apex for the inner surface temperature is nearly constant, and the temperature increases by 3.80, 3.80, 4.62, 4.80, and 3.80 K, respectively, when the phase transition temperatures of the PCM are 279–281 K, 282–284 K, 288–290 K, and 291–293 K, respectively. The findings demonstrate that the surface temperatures of the paraffin-containing glass roof fluctuate the least at 12.30 K, and remain solid–molten for the longest at 5 h. The phase change occurs between 0:00 and 3:00 a.m. and 6:00 and 8:00 a.m., when the melting temperature of the PCM ranges from 285 to 287 K.

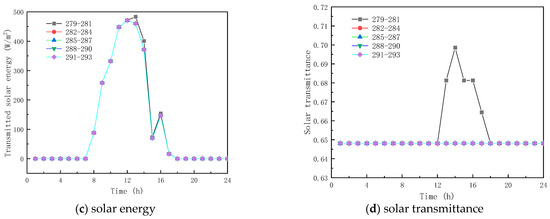
Figure 9.
Effect of melting temperature on glass channels containing PCM (5th February).
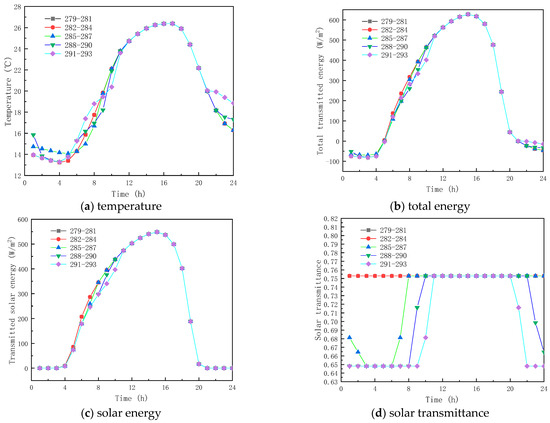
Figure 10.
Effect of melting temperature on glass channels containing PCM (17th July).
3.2.2. Effect of Thermal Conductivity
Five thermal conductivity coefficients of the PCM, including , , , were investigated, to examine the influence of thermal conductivity on the thermal performance of paraffin-containing glazing structures. All other parameters shown in Table 1 remained the same.
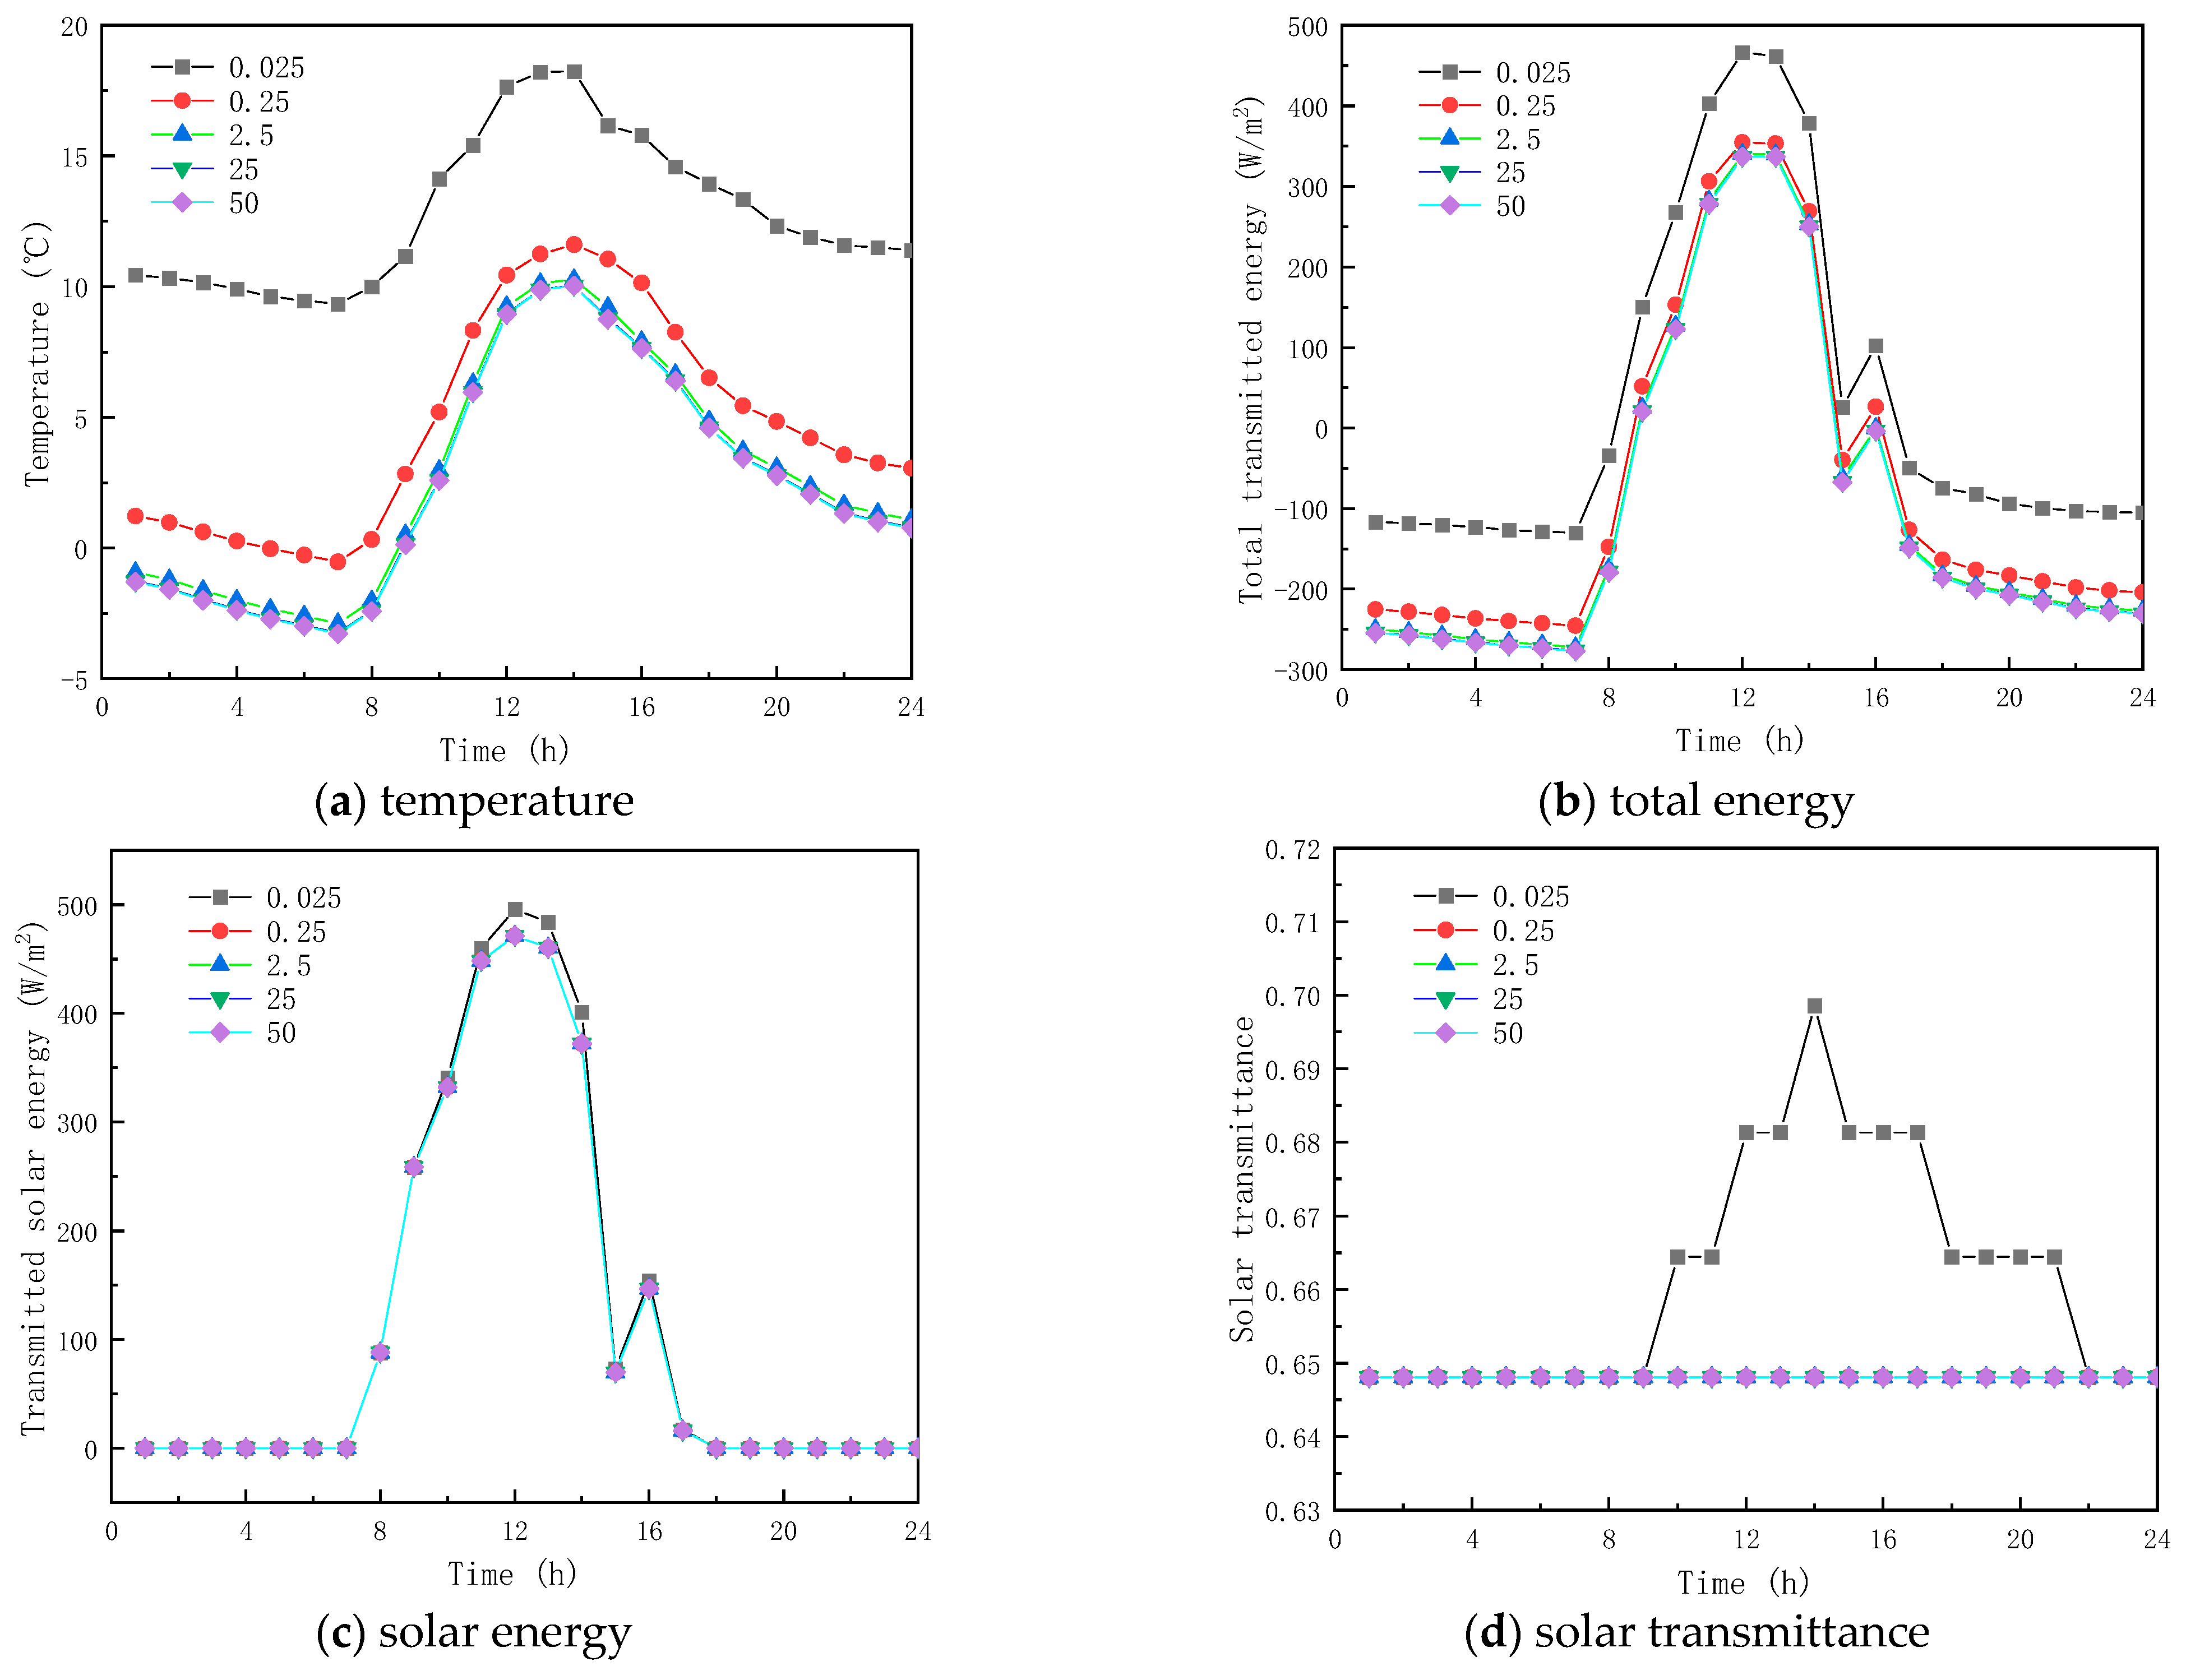
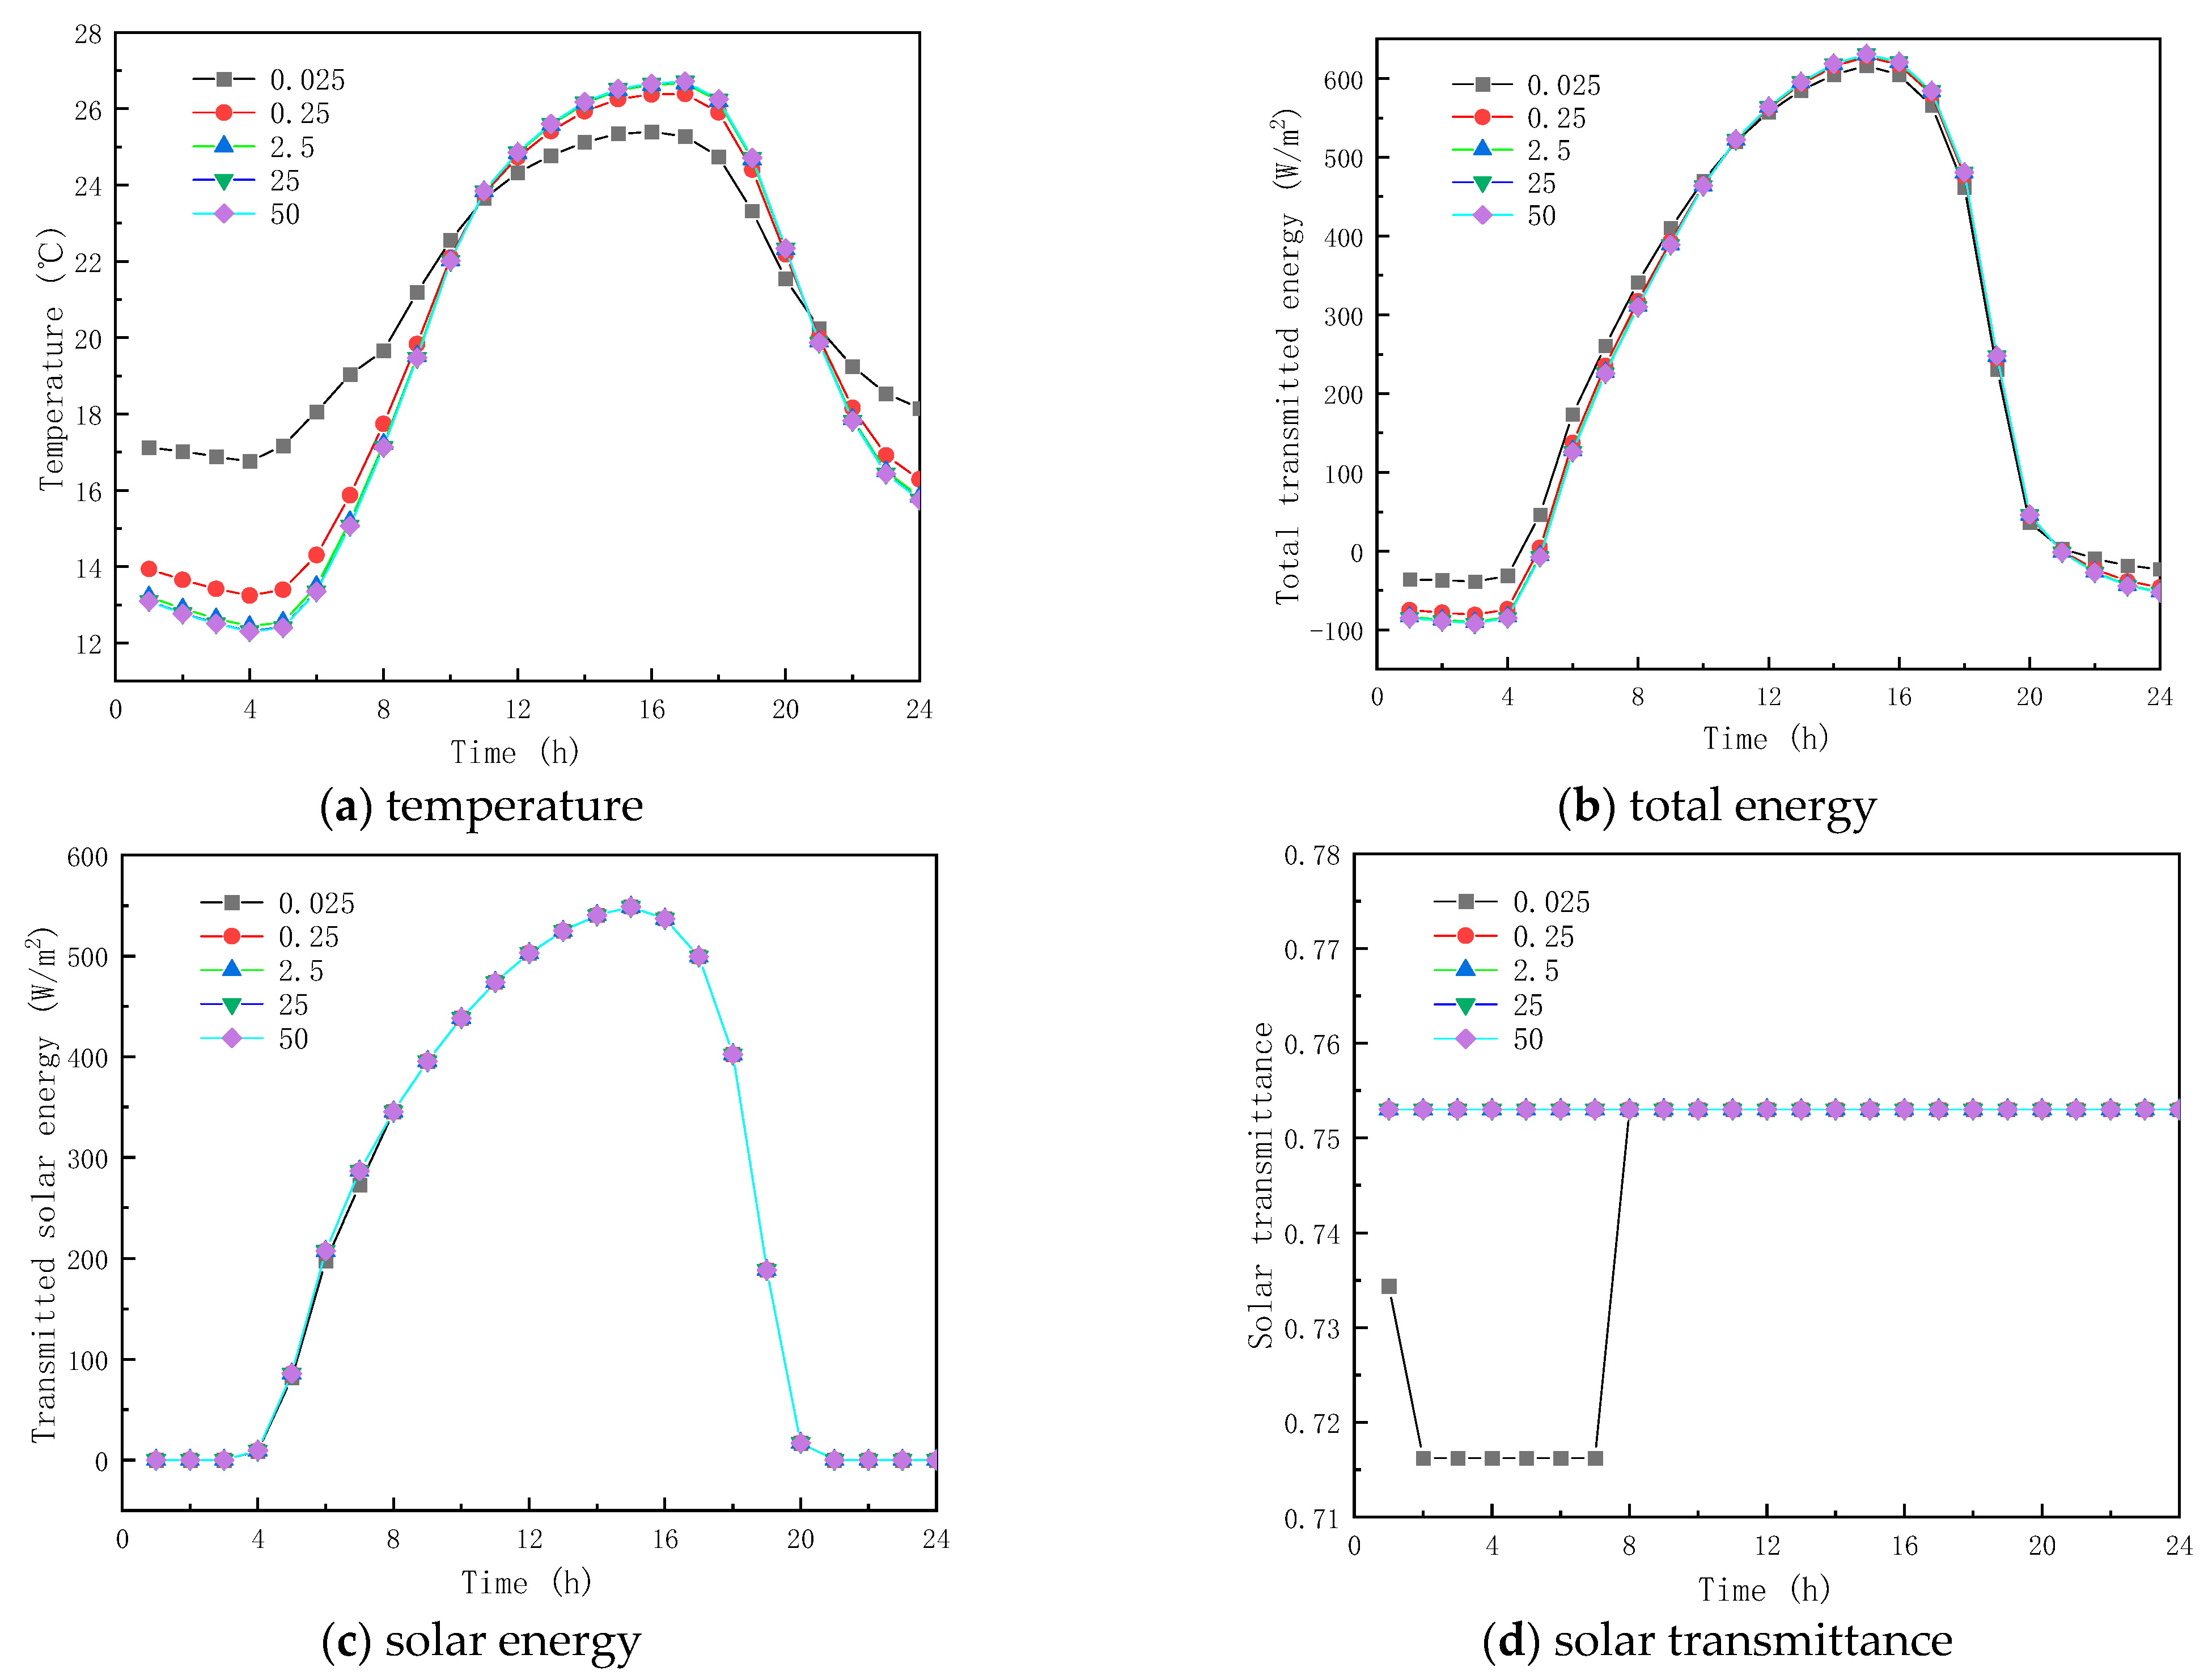
Figure 11 and Figure 12 show the results of the simulation in winter and summer time, respectively. As shown in Figure 11a and Figure 12a, the peak temperatures are 11.605 and 26.385 °C and the valley temperatures are −0.527 and 13.247 °C when the thermal conductivity is 0.025, 0.25, 2.5, 25, and 50 W/(m·K), respectively. The peak temperature change factors corresponding to each thermal conductivity coefficient were −6.604 and 0.993 °C, 1.330 and −0.282 °C, 1.560 and −0.326 °C, and 1.575 and −0.329 °C, respectively, and the valley temperature change factors corresponding to each thermal conductivity coefficient were −9.867 and −3.511 °C, 2.354 and 0.810 °C, 2.725 and 0.938 °C, and 2.748, respectively. The results show that when the thermal conductivity of the paraffin material is less than 0.25 W/(m·K), the temperature fluctuation of the inner surface is minimal and it provides thermal insulation in winter and summer respectively; when the thermal conductivity of the paraffin material is greater than 0.25 W/(m·K), the temperature change factor increases with the increment in the thermal conductivity, but the effect is weak when the thermal conductivity is higher than that. From Figure 11b,c and Figure 12, it is seen that when the thermal conductivity of paraffin material is higher than that, its effect on the total inner surface transmission energy of the glass channel of paraffin-containing material is weak, because solar radiation is dominant in the heat transfer mechanism in the paraffin-containing glass channel.
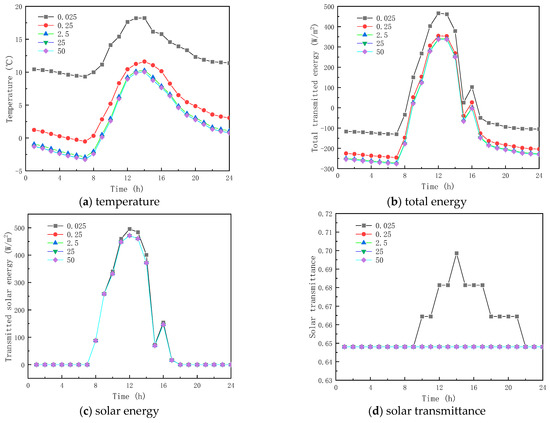
Figure 11.
Effect of thermal conductivity on glass channels containing PCM (5th February).
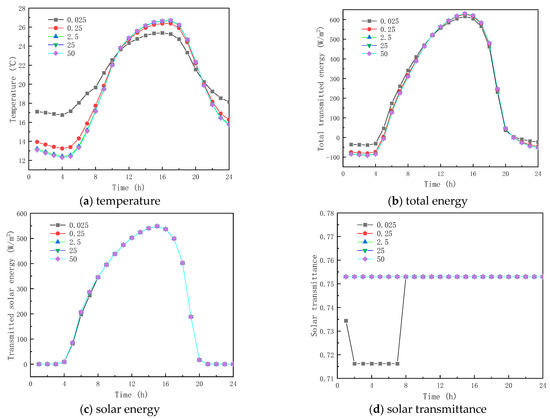
Figure 12.
Effect of thermal conductivity on glass channels containing PCM (17th July).
Meanwhile, it can be seen from Figure 11d and Figure 12d that the initial melting time and the length of time in the liquid state of the paraffin-containing material are 8:00 and 14 h (winter) and 7:00 and 19 h (summer) when the thermal conductivity of the paraffin is 0.025 W/(m·K), respectively. As the thermal conductivity of paraffin increases, the paraffin may not melt in winter and solidify in summer, losing the functional role of the latent heat energy storage. As the above analysis shows, when the thermal conductivity of the material is higher than 0.025 W/(m·K), changing the thermal conductivity of the paraffin material does not provide an efficient way to augment the thermal performance of glass channels containing paraffin material.
3.2.3. Effect of Specific Heat Capacity
Five specific heat capacity coefficients of PCMs, , , , and are investigated in this section; all other parameters remained the same, as shown in Table 1.
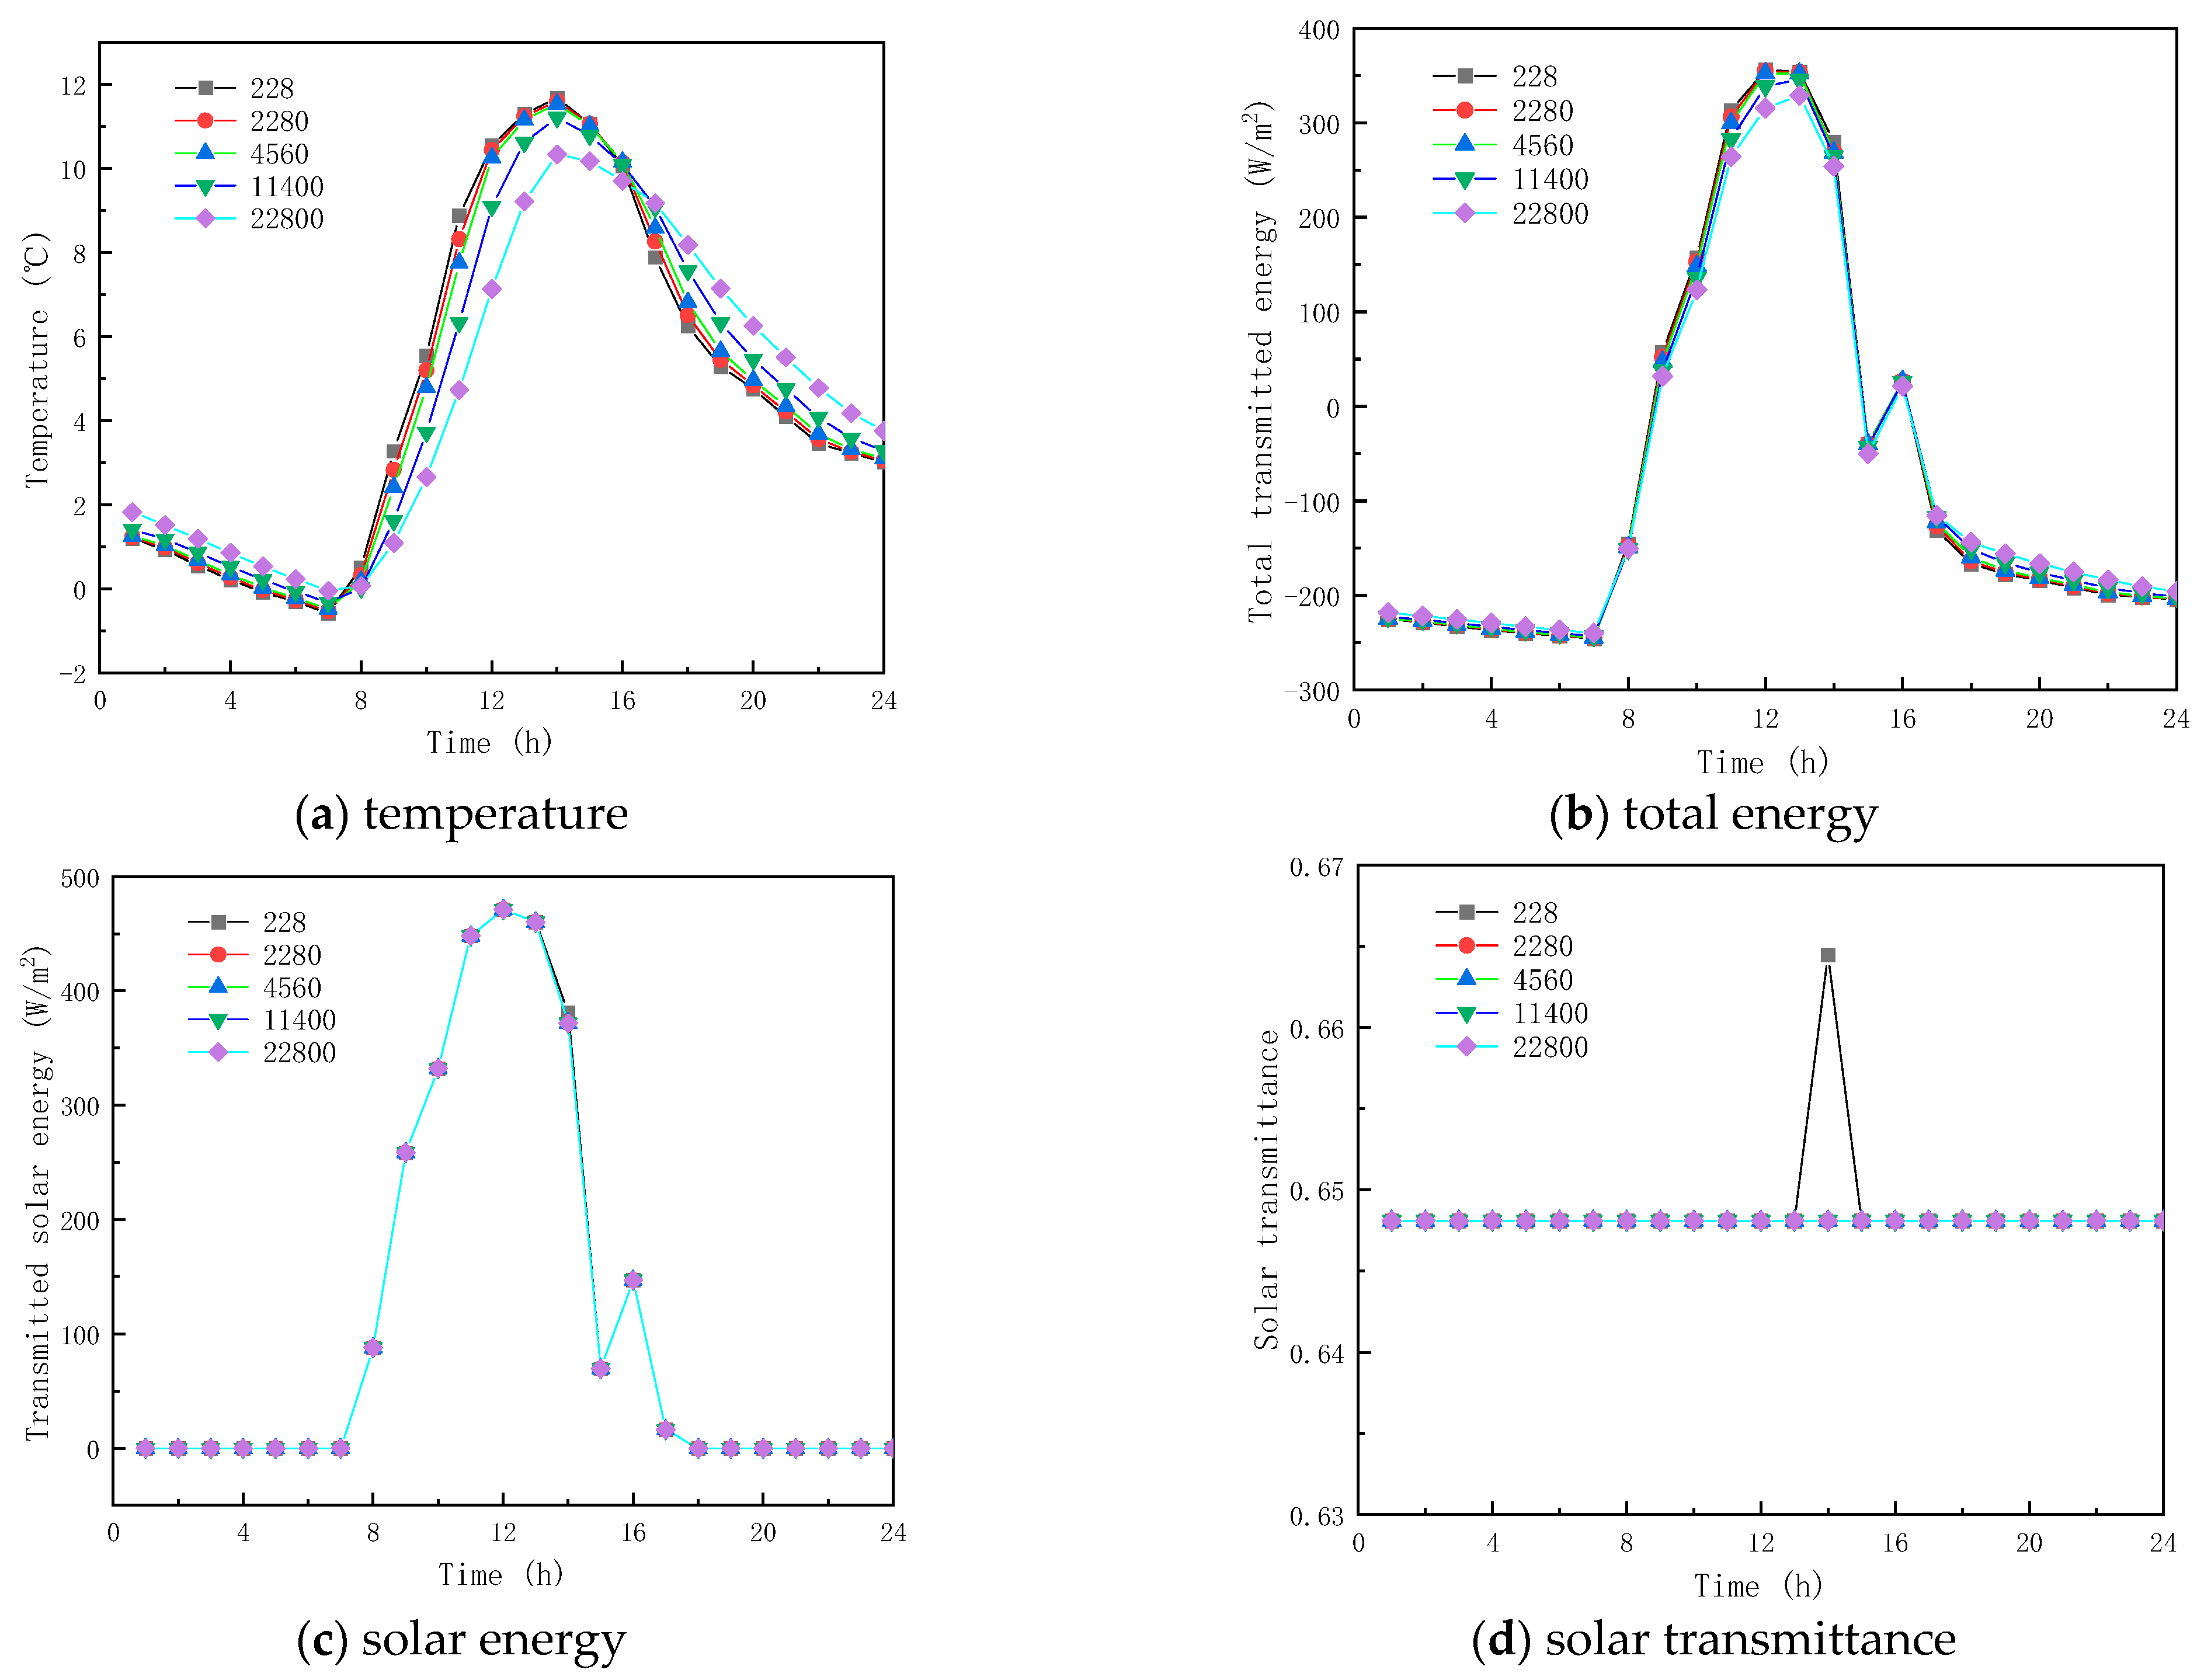
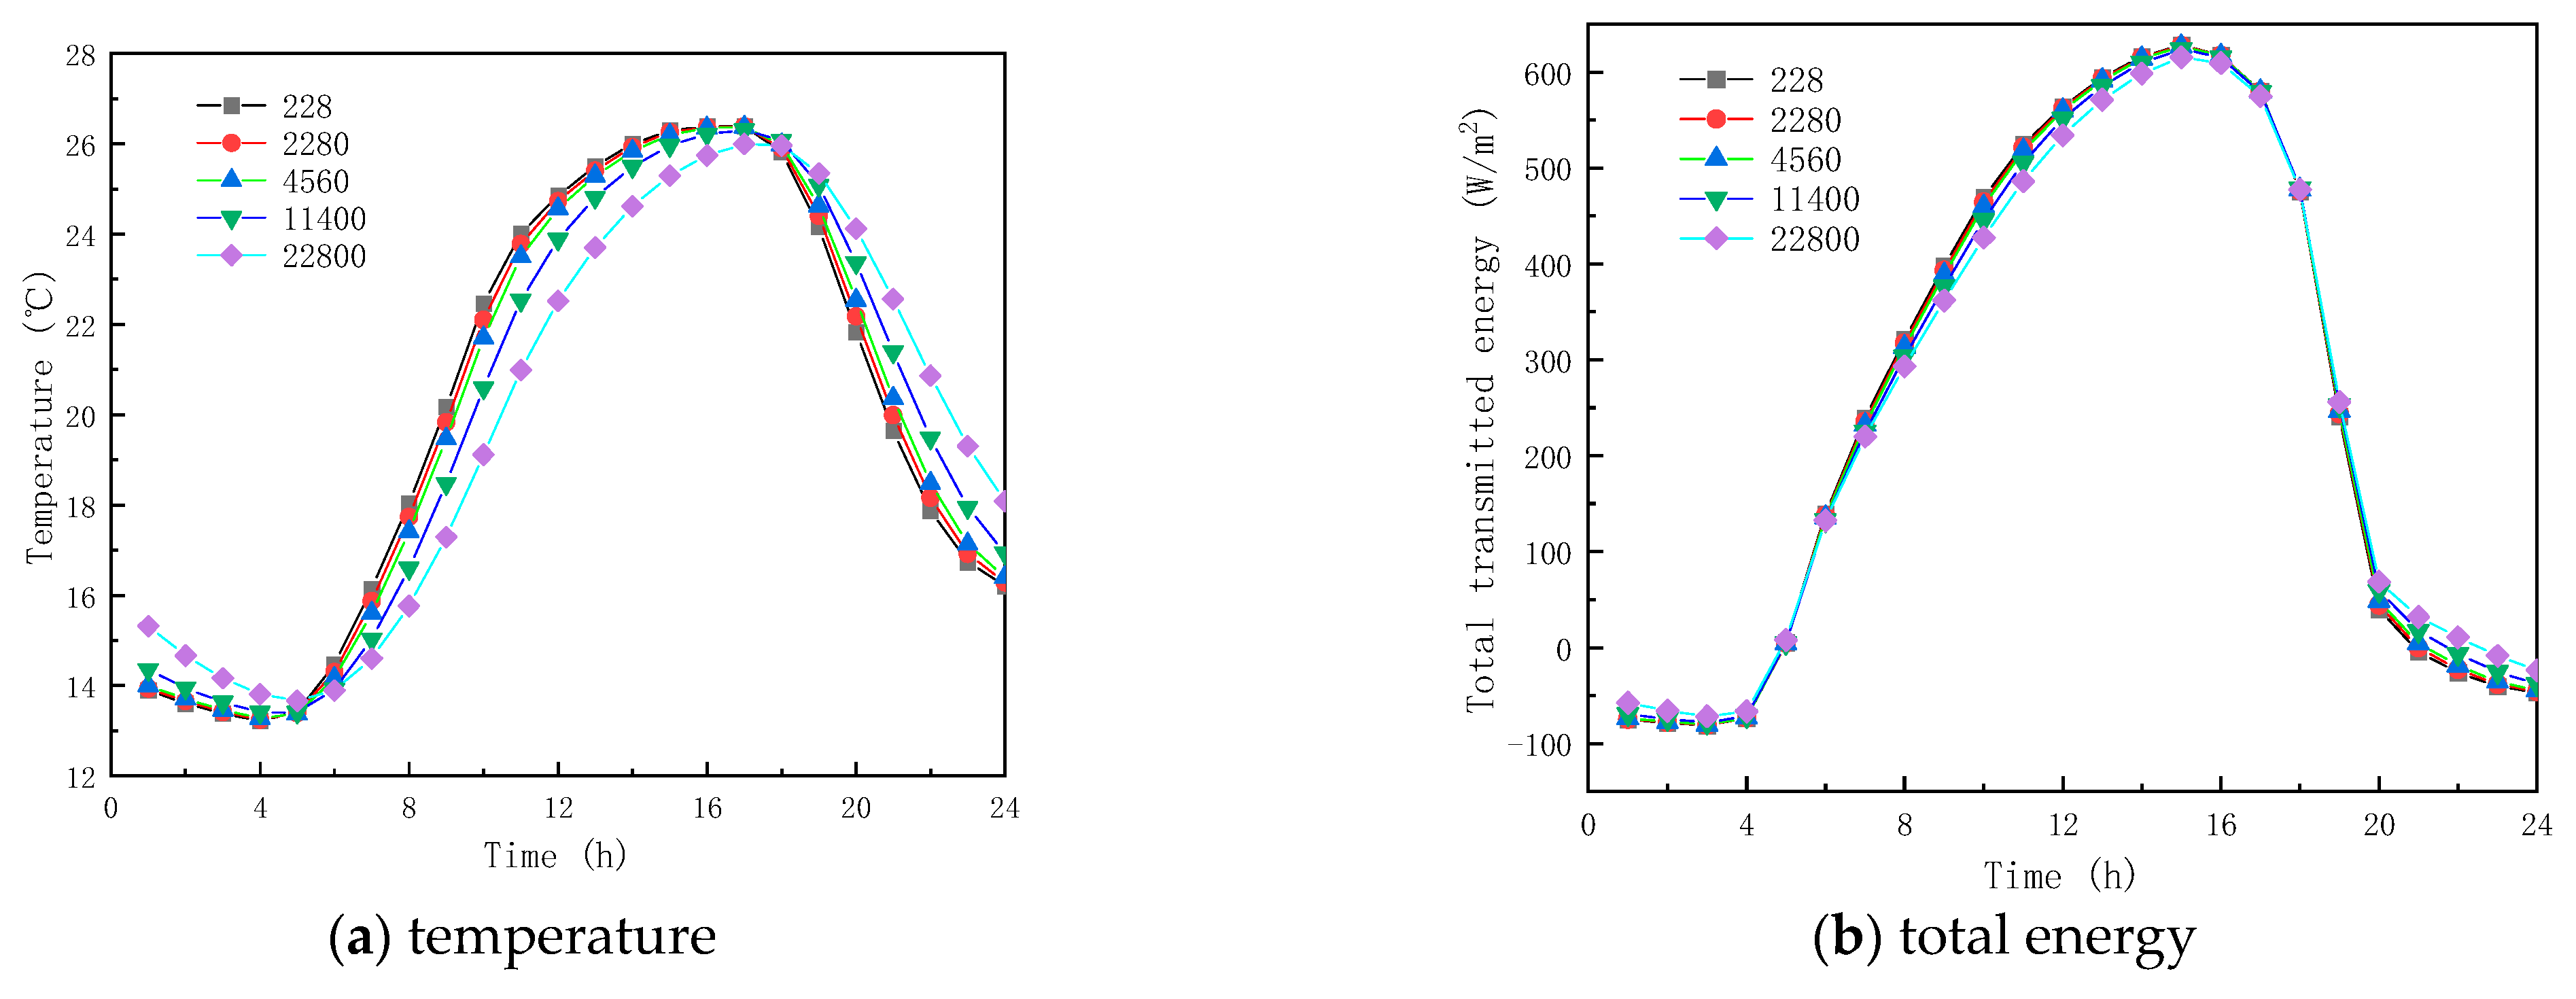
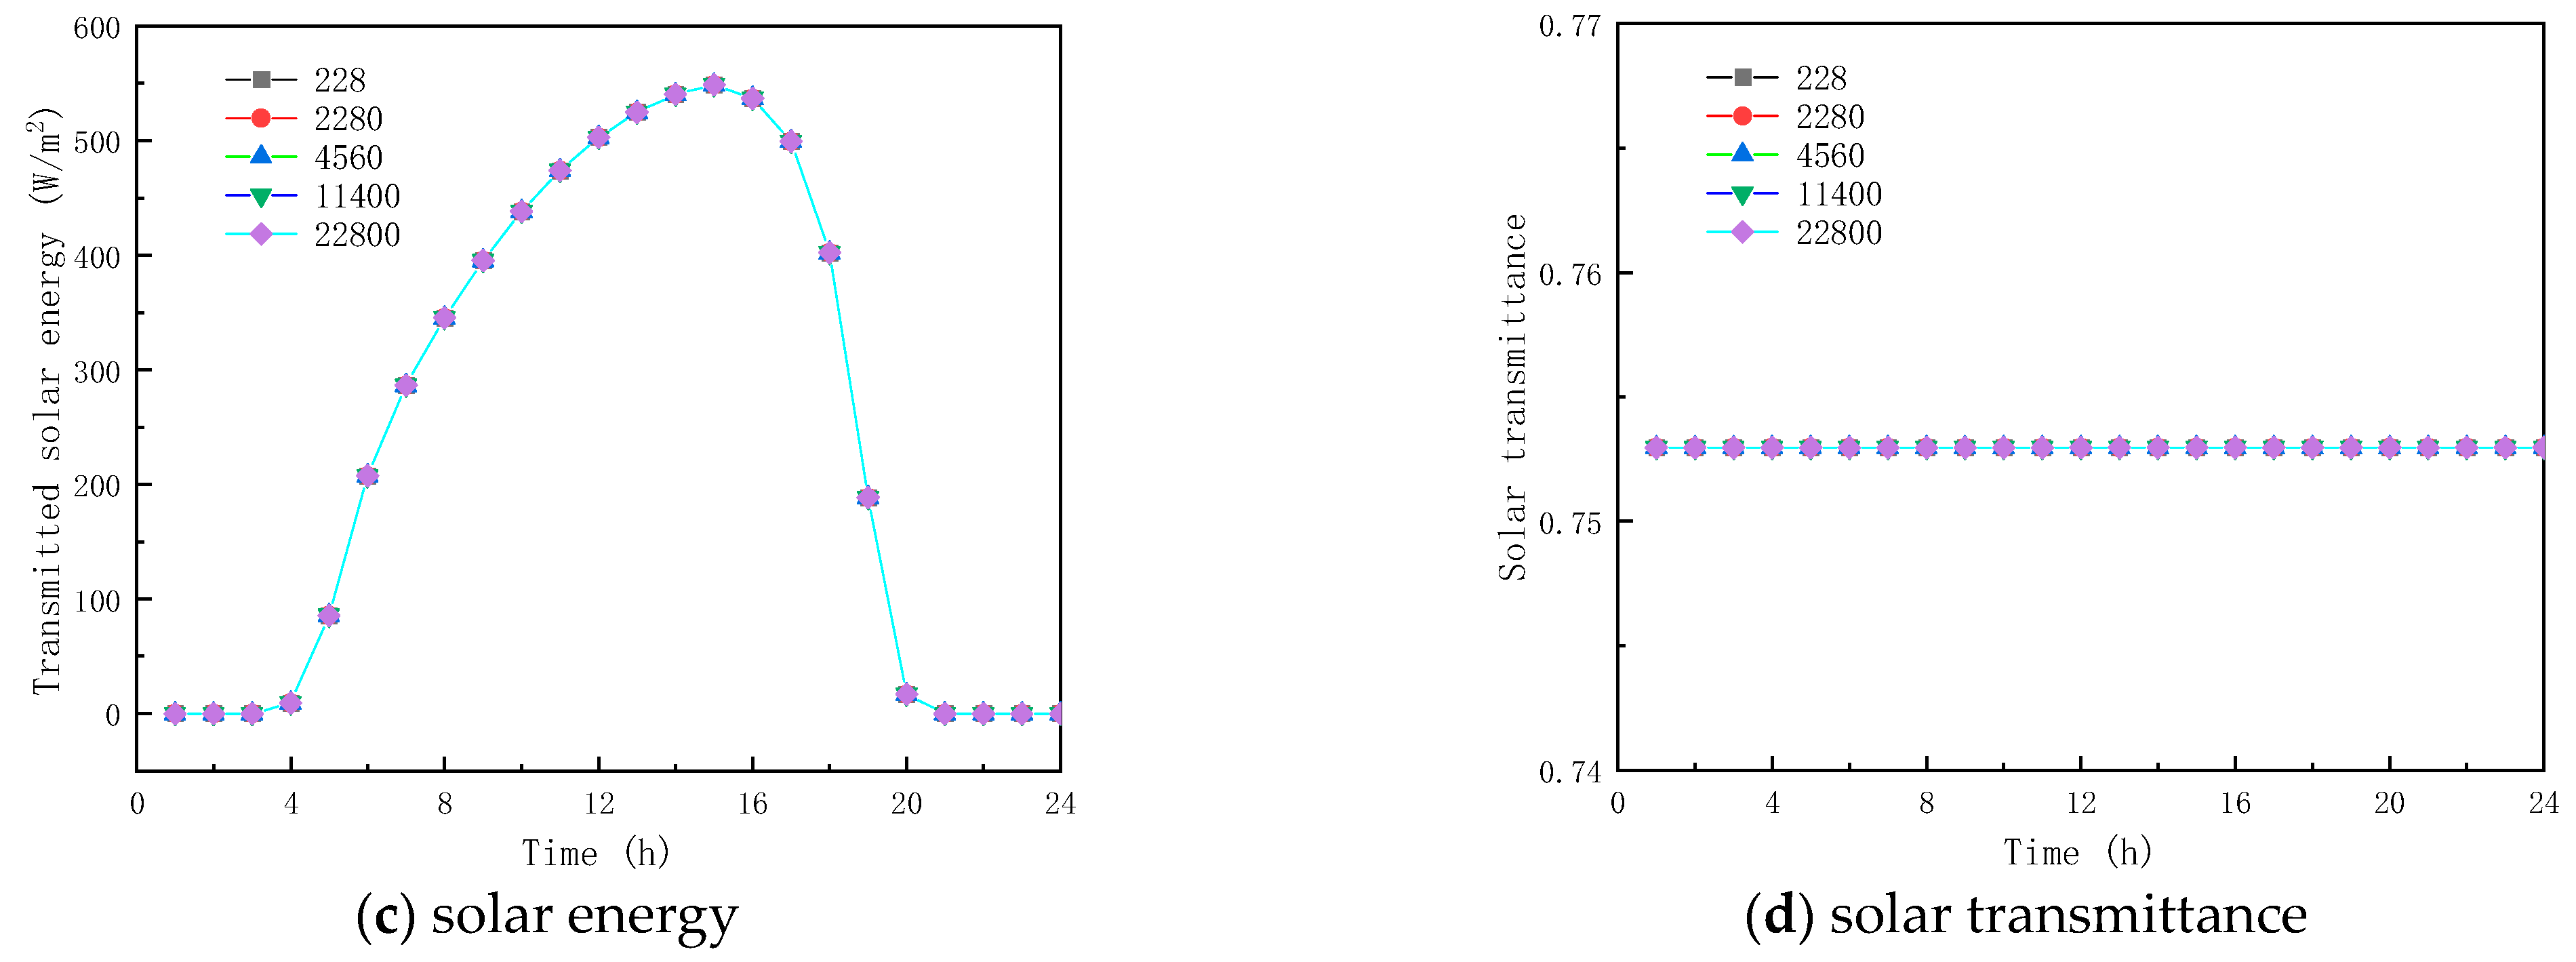
Figure 13 and Figure 14 show the results of simulated specific heat effects on the thermal performance of roofs containing paraffin glass during winter and summer, respectively. As shown in Figure 13a and Figure 14a, the peak temperatures are 11.539 and 26.375 °C and the trough temperatures are −0.476 and 13.281 °C. When the specific heats are 228, 2280, 11,400, and 22,800 J/(kg·K), respectively, the various factors of the peak temperatures of winter and summer were −0.1399 and −0.017 °C, −0.066 and −0.010 °C, 0.326 and 0.068 °C, and 1.200 and 0.383 °C, and the various factors of the valley temperature were 0.100 and 0.064 °C, 0.051 and 0.034 °C, and −0.154 and −0.130 °C. The results show that the specific heat of the paraffin material has a small effect on the inner surface temperature. In the case of the specific heat of the paraffin material being equal to 22,800 J/(kg·K), the smallest fluctuation in the interior temperature is found with a value of only 10.383 °C.

Figure 13.
Effect of specific heat capacity on glass channels containing PCM (5th February).

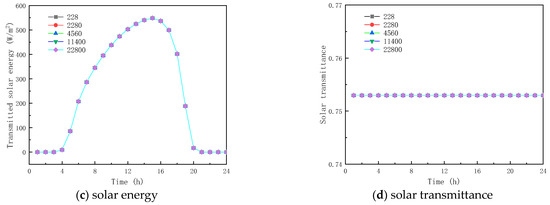
Figure 14.
Effect of specific heat capacity on glass channels containing PCM (17th July).
From the (b) and (c) sub-figures of Figure 13 and Figure 14, it is seen that when the specific heat of the paraffin material is less than or equal to 4560 J/(kg·K), its effect on the total inner surface transmission energy of the glass channel containing paraffin material is weak; when the specific heat of the paraffin material is greater than 4560 J/(kg·K), the total transmitted energy reduces with the increment of the specific heat, because of the heat transfer process of solar radiation in the glass channel containing paraffin material, and most of it is absorbed by the PCM during the phase-change process.
Meanwhile, it can be concluded from Figure 13d and Figure 14d that when the specific heat of the paraffin material is 228 J/(kg·K), the initial melting time and the duration of the melting process are 13:00 and 2 h (winter), and 00:00 and 24 h (summer), respectively. The consequence of the increase in the specific heat of paraffin materials is that they are difficult to melt in winter and to solidify in summer. As shown in the above analysis, improving the thermal performance of glass channels containing paraffin materials by varying the specific heat of paraffin materials does not present an effective solution.
4. Conclusions
The one-dimensional steady-state heat transfer in the glass unit of paraffin-containing materials was numerically analyzed based on the control volume method in the present work. Thereafter, the transient heat transfer in the glass channel with PCM was analyzed using the finite difference method, and the thermal influence of the optical and thermal properties of paraffin on the glass unit of paraffin-containing materials was further investigated. After the numerical computations and discussions, the following conclusions were drawn from the study:
- The influence of the paraffin absorption coefficient on the glass channel temperature distribution is significant. The larger the absorption coefficient, the higher the temperature of the glass channel, and this becomes more obvious with the enhancement of the solar radiation intensity. The influence of the refractive index of paraffin on the temperature of the glass channel is weak, compared with the absorption coefficient, but the trend of its refractive index on its temperature distribution is the same as the absorption coefficient. The heat transfer in the glass channel increases with the increase in the refractive index and absorption coefficient, but the influence of the paraffin absorption coefficient on the transmittance of the glass channel is greater than that of the refractive index.
- Solar radiation energy has a significant impact on the transmittance of the inner surface of the glass channel, resulting in the highest transmittance at around 12:00 in winter and 16:00 in summer. As the refractive index of the liquid paraffin material increases and the absorption coefficient of the solid paraffin material increases, the total transmittance energy and solar radiation energy of the inner surface of the glass channel decreases.
- Depending on the outdoor meteorological conditions in different seasons, increasing the latent heat of the PCM within a certain range, choosing a reasonable density of PCM, and managing the melting temperature range of the PCM are effective ways to augment the thermal performance of glass channels containing paraffin materials, while changing the thermal conductivity and specific heat of paraffin materials does not necessarily improve their thermal performance.
Future work should be devoted to experimentally analyzing the thermal performance of greenhouse glazing units incorporating PCM, focusing on the effect of the solid- and liquid-phase properties, as well as performing a thermoeconomic analysis.
Author Contributions
Methodology, W.G.; Software, W.G.; Validation, W.G.; Formal analysis, W.G., G.L., K.Z., Y.J. and M.A.; Investigation, W.G., G.L., K.Z., Y.J. and M.A.; Writing—original draft, W.G., G.L., K.Z. and Y.J.; Writing—review & editing, M.A. All authors have read and agreed to the published version of the manuscript.
Funding
The financial support is provided by Heilongjiang Bayi Agricultural University Support Program for San Heng San Zong of China (Grant No. ZRCPY202225), Heilongjiang Province Key Research and Development Program Guidance Project of China (Grant No. GZ20220028), and the Daqing Philosophy and Social Science Planning Projects of China (Grant No. DSGB2023075).
Data Availability Statement
Not applicable.
Conflicts of Interest
The authors declare no conflict of interest.
References
- Yan, S.; Fazilati, M.A.; Toghraie, D.; Khalili, M.; Karimipour, A. Energy cost and efficiency analysis of greenhouse heating system enhancement using phase change material: An experimental study. Renew. Energy 2021, 170, 133–140. [Google Scholar] [CrossRef]
- Huang, L.; Deng, L.; Li, A.; Gao, R.; Zhang, L.; Lei, W. Analytical model for solar radiation transmitting the curved transparent surface of solar greenhouse. J. Build. Eng. 2020, 32, 101785. [Google Scholar] [CrossRef]
- Vermeulen, S.J.; Campbell, B.M.; Ingram, J.S.I. Climate Change and Food Systems. Annu. Rev. Environ. Resour. 2012, 37, 195–222. [Google Scholar] [CrossRef]
- Esen, M.; Yuksel, T. Experimental evaluation of using various renewable energy sources for heating a greenhouse. Energy Build. 2013, 65, 340–351. [Google Scholar] [CrossRef]
- Chen, S.; Zhu, Y.; Chen, Y.; Liu, W. Usage strategy of phase change materials in plastic greenhouses, in hot summer and cold winter climate. Appl. Energy 2020, 277, 115416. [Google Scholar] [CrossRef]
- Taki, M.; Rohani, A.; Rahmati-Joneidabad, M. Solar thermal simulation and applications in greenhouse. Inf. Process. Agric. 2018, 5, 83–113. [Google Scholar] [CrossRef]
- Sahdev, R.K.; Kumar, M.; Dhingra, A.K. A comprehensive review of greenhouse shapes and its applications. Front. Energy 2017, 13, 427–438. [Google Scholar] [CrossRef]
- Gourdo, L.; Fatnassi, H.; Bouharroud, R.; Ezzaeri, K.; Bazgaou, A.; Wifaya, A.; Demrati, H.; Bekkaoui, A.; Aharoune, A.; Poncet, C.; et al. Heating canarian greenhouse with a passive solar water–sleeve system: Effect on microclimate and tomato crop yield. Sol. Energy 2019, 188, 1349–1359. [Google Scholar] [CrossRef]
- Bazgaou, A.; Fatnassi, H.; Bouharroud, R.; Elame, F.; Ezzaeri, K.; Gourdo, L.; Wifaya, A.; Demrati, H.; Tiskatine, R.; Bekkaoui, A.; et al. Performance assessment of combining rock-bed thermal energy storage and water filled passive solar sleeves for heating Canarian greenhouse. Sol. Energy 2020, 198, 8–24. [Google Scholar] [CrossRef]
- Sethi, V. On the selection of shape and orientation of a greenhouse: Thermal modeling and experimental validation. Sol. Energy 2009, 83, 21–38. [Google Scholar] [CrossRef]
- Choab, N.; Allouhi, A.; El Maakoul, A.; Kousksou, T.; Saadeddine, S.; Jamil, A. Review on greenhouse microclimate and application: Design parameters, thermal modeling and simulation, climate controlling technologies. Sol. Energy 2019, 191, 109–137. [Google Scholar] [CrossRef]
- Mobtaker, H.G.; Ajabshirchi, Y.; Ranjbar, S.F.; Matloobi, M. Simulation of thermal performance of solar greenhouse in north-west of Iran: An experimental validation. Renew. Energy 2019, 135, 88–97. [Google Scholar] [CrossRef]
- Mobtaker, H.G.; Ajabshirchi, Y.; Ranjbar, S.F.; Matloobi, M. Solar energy conservation in greenhouse: Thermal analysis and experimental validation. Renew. Energy 2016, 96, 509–519. [Google Scholar] [CrossRef]
- El-Maghlany, W.M.; Teamah, M.A.; Tanaka, H. Optimum design and orientation of the greenhouses for maximum capture of solar energy in North Tropical Region. Energy Convers. Manag. 2015, 105, 1096–1104. [Google Scholar] [CrossRef]
- Ezzaeri, K.; Fatnassi, H.; Wifaya, A.; Bazgaou, A.; Aharoune, A.; Poncet, C.; Bekkaoui, A.; Bouirden, L. Performance of photovoltaic canarian greenhouse: A comparison study between summer and winter seasons. Sol. Energy 2020, 198, 275–282. [Google Scholar] [CrossRef]
- Zhang, L.; Xu, P.; Mao, J.; Tang, X.; Li, Z.; Shi, J. A low cost seasonal solar soil heat storage system for greenhouse heating: Design and pilot study. Appl. Energy 2015, 156, 213–222. [Google Scholar] [CrossRef]
- Berardi, U.; Soudian, S. Experimental investigation of latent heat thermal energy storage using PCMs with different melting temperatures for building retrofit. Energy Build. 2019, 185, 180–195. [Google Scholar] [CrossRef]
- Li, D.; Wu, Y.; Wang, B.; Liu, C.; Arıcı, M. Optical and thermal performance of glazing units containing PCM in buildings: A review. Constr. Build. Mater. 2020, 233, 117327. [Google Scholar] [CrossRef]
- Yang, R.; Li, D.; Salazar, S.L.; Rao, Z.; Arıcı, M.; Wei, W. Photothermal properties and photothermal conversion performance of nano-enhanced paraffin as a phase change thermal energy storage material. Sol. Energy Mater. Sol. Cells 2020, 219, 110792. [Google Scholar] [CrossRef]
- Goia, F.; Boccaleri, E. Physical–chemical properties evolution and thermal properties reliability of a paraffin wax under solar radiation exposure in a real-scale PCM window system. Energy Build. 2016, 119, 41–50. [Google Scholar] [CrossRef]
- Li, D.; Zhang, C.; Li, Q.; Liu, C.; Arıcı, M.; Wu, Y. Thermal performance evaluation of glass window combining silica aerogels and phase change materials for cold climate of China. Appl. Therm. Eng. 2019, 165, 114547. [Google Scholar] [CrossRef]
- Berroug, F.; Lakhal, E.; El Omari, M.; Faraji, M.; El Qarnia, H. Thermal performance of a greenhouse with a phase change material north wall. Energy Build. 2011, 43, 3027–3035. [Google Scholar] [CrossRef]
- Guarino, F.; Athienitis, A.; Cellura, M.; Bastien, D. PCM thermal storage design in buildings: Experimental studies and applications to solaria in cold climates. Appl. Energy 2017, 185, 95–106. [Google Scholar] [CrossRef]
- Lazaar, M.; Bouadila, S.; Kooli, S.; Farhat, A. Conditioning of the tunnel greenhouse in the north of Tunisia using a calcium chloride hexahydrate integrated in polypropylene heat exchanger. Appl. Therm. Eng. 2014, 68, 62–68. [Google Scholar] [CrossRef]
- Bouadila, S.; Lazaar, M.; Skouri, S.; Kooli, S.; Farhat, A. Assessment of the greenhouse climate with a new packed-bed solar air heater at night, in Tunisia. Renew. Sustain. Energy Rev. 2014, 35, 31–41. [Google Scholar] [CrossRef]
- Chen, J.; Ma, Y.; Pang, Z. A mathematical model of global solar radiation to select the optimal shape and orientation of the greenhouses in southern China. Sol. Energy 2020, 205, 380–389. [Google Scholar] [CrossRef]
- Reichrath, S.; Davies, T. Computational fluid dynamics simulations and validation of the pressure distribution on the roof of a commercial multi-span Venlo-type glasshouse. J. Wind. Eng. Ind. Aerodyn. 2002, 90, 139–149. [Google Scholar] [CrossRef]
- Benni, S.; Santolini, E.; Barbaresi, A.; Torreggiani, D.; Tassinari, P. Calibration and comparison of different CFD approaches for airflow analysis in a glass greenhouse. J. Agric. Eng. 2017, 48, 49–52. [Google Scholar] [CrossRef]
- Santolini, E.; Pulvirenti, B.; Benni, S.; Barbaresi, L.; Torreggiani, D.; Tassinari, P. Numerical study of wind-driven natural ventilation in a greenhouse with screens. Comput. Electron. Agric. 2018, 149, 41–53. [Google Scholar] [CrossRef]
- Lin, D.; Zhang, L.; Xia, X. Hierarchical model predictive control of Venlo-type greenhouse climate for improving energy efficiency and reducing operating cost. J. Clean. Prod. 2020, 264, 121513. [Google Scholar] [CrossRef]
- Santolini, E.; Pulvirenti, B.; Guidorzi, P.; Bovo, M.; Torreggiani, D.; Tassinari, P. Analysis of the effects of shading screens on the microclimate of greenhouses and glass facade buildings. Build. Environ. 2022, 211, 108691. [Google Scholar] [CrossRef]
- Mazzeo, D.; Baglivo, C.; Panico, S.; Congedo, P.M. Solar greenhouses: Climates, glass selection, and plant well-being. Sol. Energy 2021, 230, 222–241. [Google Scholar] [CrossRef]
- Pielichowska, K.; Pielichowski, K. Phase change materials for thermal energy storage. Prog. Mater. Sci. 2014, 65, 67–123. [Google Scholar] [CrossRef]
- Silva, T.; Vicente, R.; Rodrigues, F.; Samagaio, A.; Cardoso, C. Performance of a window shutter with phase change material under summer Mediterranean climate conditions. Appl. Therm. Eng. 2015, 84, 246–256. [Google Scholar] [CrossRef]
- Ismail, K.; Henríquez, J. Parametric study on composite and PCM glass systems. Energy Convers. Manag. 2002, 43, 973–993. [Google Scholar] [CrossRef]
- Ismail, K.A.; Salinas, C.T.; Henriquez, J.R. Comparison between PCM filled glass windows and absorbing gas filled windows. Energy Build. 2008, 40, 710–719. [Google Scholar] [CrossRef]
- Goia, F.; Perino, M.; Haase, M. A numerical model to evaluate the thermal behaviour of PCM glazing system configurations. Energy Build. 2012, 54, 141–153. [Google Scholar] [CrossRef]
- Gowreesunker, B.; Stankovic, S.; Tassou, S.; Kyriacou, P. Experimental and numerical investigations of the optical and thermal aspects of a PCM-glazed unit. Energy Build. 2013, 61, 239–249. [Google Scholar] [CrossRef]
- Li, S.; Zhong, K.; Zhou, Y.; Zhang, X. Comparative study on the dynamic heat transfer characteristics of PCM-filled glass window and hollow glass window. Energy Build. 2014, 85, 483–492. [Google Scholar] [CrossRef]
- Zhong, K.; Li, S.; Sun, G.; Li, S.; Zhang, X. Simulation study on dynamic heat transfer performance of PCM-filled glass window with different thermophysical parameters of phase change material. Energy Build. 2015, 106, 87–95. [Google Scholar] [CrossRef]
- Goia, F.; Zinzi, M.; Carnielo, E.; Serra, V. Spectral and angular solar properties of a PCM-filled double glazing unit. Energy Build. 2015, 87, 302–312. [Google Scholar] [CrossRef]
- Li, D.; Li, Z.; Zheng, Y.; Liu, C.; Hussein, A.K.; Liu, X. Thermal performance of a PCM-filled double-glazing unit with different thermophysical parameters of PCM. Sol. Energy 2016, 133, 207–220. [Google Scholar] [CrossRef]
- Li, D.; Ma, T.; Liu, C.; Zheng, Y.; Wang, Z.; Liu, X. Thermal performance of a PCM-filled double glazing unit with different optical properties of phase change material. Energy Build. 2016, 119, 143–152. [Google Scholar] [CrossRef]
- Zhang, S.; Ma, Y.; Li, D.; Liu, C.; Yang, R. Thermal performance of a reversible multiple-glazing roof filled with two PCM. Renew. Energy 2022, 182, 1080–1093. [Google Scholar] [CrossRef]
- Li, D.; Qi, H.; Wu, G. Determined optical constants of liquid hydrocarbon fuel by a novel transmittance method. Optik 2015, 126, 834–837. [Google Scholar] [CrossRef]
- Wang, F.; Tan, J.; Ma, L.; Shuai, Y.; Tan, H.; Leng, Y. Thermal performance analysis of porous medium solar receiver with quartz window to minimize heat flux gradient. Sol. Energy 2014, 108, 348–359. [Google Scholar]
- Wang, F.; Shuai, Y.; Tan, H.; Lin, R.; Cheng, P. Researches on a new type of solar surface cladding reactor with concentration quartz window. Sol. Energy 2013, 94, 177–181. [Google Scholar] [CrossRef]
- Wang, F.; Tan, J.; Ma, L.; Wang, C. Effects of glass cover on heat flux distribution for tube receiver with parabolic trough collector system. Energy Convers. Manage. 2015, 90, 47–52. [Google Scholar]
- Dai, G.-L.; Xia, X.-L.; Hou, G.-F. Transmission performances of solar windows exposed to concentrated sunlight. Sol. Energy 2014, 103, 125–133. [Google Scholar] [CrossRef]
Disclaimer/Publisher’s Note: The statements, opinions and data contained in all publications are solely those of the individual author(s) and contributor(s) and not of MDPI and/or the editor(s). MDPI and/or the editor(s) disclaim responsibility for any injury to people or property resulting from any ideas, methods, instructions or products referred to in the content. |
© 2023 by the authors. Licensee MDPI, Basel, Switzerland. This article is an open access article distributed under the terms and conditions of the Creative Commons Attribution (CC BY) license (https://creativecommons.org/licenses/by/4.0/).

