Abstract
In 2020, domestic buildings represented 27% of the energy consumption in the European Union. The EC Renovation Wave concluded that the annual renovation rate should be doubled, from 1% to 2%, over the next decade in order to meet the 2030 energy efficiency targets. Funding programs are being implemented at national and European levels to accelerate this process. These aim to prioritize large-scale interventions and the most efficient energy conservation measures by including strict performance targets as eligibility conditions. However, these programs are coordinated by local authorities, and they struggle to generate reliable energy estimates for large areas, not least predict potential savings at both aggregated and individual levels. This paper presents a bespoke energy retrofit analysis methodology based on urban building energy modelling, which is defined and calibrated with the Energy Performance Certificate Database. We apply this method to the case study Barrio das Flores. The model adopts a hybrid approach, defining and simulating representative typologies to extrapolate the results to the whole district according to each dwelling’s specific parameters. This methodology will be used to predict the potential energy savings in the study area and support the grant application for the funding renovation program.
1. Introduction
The renovation of the residential building stock is one of the main targets in the European Union’s (EU) environmental agenda [1,2]. Building retrofit for energy efficiency has been boosted in the EU by the funding opportunities provided by the NextGenerationEU program. Spain is the member state with the maximum grant allocation, with 69.5 billion euros out of the 338 billion euros of the program [3]. Moreover, the Spanish government has drafted the development instrument to channel those funds, namely the Mechanism for Recovery and Resilience (MRR), and the subsequent Recovery, Transformation and Resilience Plan (RTRP) [4]. They defined an investment agenda to be financed through this mechanism based on 30 components, the second of which is the Urban and Rural Agenda that contains the Housing Renovation and Urban Regeneration Plan. Ultimately, an investment of up to 6.8 billion euros has been estimated to retrofit the building stock to higher energy efficiency standards.
Although the NextGenerationEU program was planned in response to the economic crisis caused by the aftermath of COVID-19 pandemic, its implementation takes place when dramatic geopolitical circumstances have aggravated economic and social crisis, leading to acute inflation that has particularly affected energy prices. The rising cost of gas and oil is an added incentive for individuals and communities to consider energy-efficiency investments, such as building renovation.
One of the key principles of the European Commission Strategy [1] is to make a better use of available funding, thus targeting inefficient buildings and vulnerable areas. Following these principles, the most recent Housing Renovation and Social Housing Program in Spain [5] based on the RTRP has established a regulatory framework with very specific energy saving thresholds as a condition for funding eligibility.
These initiatives are eventually channeled through local authorities [1], which have to identify the eligible areas of the city where building renovation can be incentivized through these funds and estimate the energy savings that will result from the renovation actions. The RTRP’s Neighborhood Level Funding Program calls these areas Residential Environments Scheduled for Renovation (RESR). Although local authorities can identify the priority areas, based on socio-economic indicators, they lack the resources, knowledge and tools to support energy-based decisions, not least generate accurate energy savings estimates at the neighborhood scale. Since getting funding is dependent on the fulfillment of strict energy efficiency goals, deviations between estimated and achieved savings may impose a severe economic burden to those potential recipients that were expecting to but failed to meet the objectives. Given that the renovation plan for the RESR is defined for an entire neighborhood or district, it is impractical to estimate potential energy savings for each individual building. Instead, an appropriate strategy to develop an Urban Building Energy Model (UBEM) should be considered.
Although a good number of UBEMs have been developed in recent years, they cover a wide array of approaches as they try to respond to highly diverse objectives. Mostly they focus on energy supply planning: the calculation of energy generation, networks and smart grids, or renewable systems integration. Reviews of scientific literature on this topic, e.g., [6,7,8], classify the models based on their assumptions to [a] adapt the model to the urban scale and [b] calculate the energy loads.
In relation to the urban scale, the UBEM can be classified based on their approach: In top-down models [9], each unit of analysis encompasses multiple buildings. The level of resolution can vary from one block to the entire district or city. Alternatively, in a bottom-up approach [10] each building is analyzed individually, in a disaggregated way. They can be used to either make detailed estimates or to aggregate the results sequentially thus generating large-scale estimates.
Regarding the energy calculation methodology used in the model, the most common UBEMs can be classified in three categories: thermodynamic, statistical or hybrid models [11].
Thermodynamic models, sometimes referred to as “white-box” models, may use an existing simulation engine such as Energy Plus [12] and the thermal characteristics of the building, such as construction specifications, climate and systems to calculate heating, cooling and lighting loads. A typical approach is to classify the urban fabric into various archetypes, which represent the key characteristics regarding uses, typologies, size and envelope materials. Only the archetype buildings are simulated and the results are extrapolated to the whole study area, which is classified based on the archetypes.
Statistical models, also referred to as “black-box” or “data-driven”, use available information and databases, of diverse origin and character, such as census, energy meters, sensors, cadaster, audits, monitoring, etc. [13]. Statistical methods are used with these data to establish relationships between energy variables and other parameters to characterize the urban fabric (for example, spatial, socioeconomic data…). The most common techniques to generate these models are regressions (single or multiple), although in recent years the use of Artificial Intelligence (AI) techniques such as Machine Learning (ML) has emerged.
Hybrid models combine the statistical and thermodynamic approaches and for this reason they are referred to as “grey-box” models. They aim to reduce the number of parameters needed to produce estimates. They usually use standardized heat-transfer calculation procedures, recognized by entities such as ASHRAE (American Society of Heating, Refrigerating and Air Conditioning Engineers) or CEN (European Committee for Standardization). The reduction in parameters is usually based on previous simulations and the formation of building clusters, for which statistics techniques are applied [14].
The main aim of the research summarized in this article is to develop an integrated methodology to support urban-scale energy-conservation methods (ECM) for residential buildings using a bottom-up and data-driven approach. This method exploits the regional Energy Performance Certificate Database (EPCD) [15] to map energy demand and consumption patterns in the study area. The EPCD are repositories of all energy performance certificates issued in each region as established by the Energy Performance of Buildings Directive [16]. They include the cadastral reference and building address, building type (flat or single family house), total energy consumption (kWh/m2 per year) and CO emissions (Kg CO2e/m2 year). The EPCD is used to calibrate a bespoke Urban Building Energy Model (UBEM) that will be subsequently applied to evaluate the energy savings from ECM. The calibration is conducted by means of spatial analysis; the energy consumption values from the database are mapped in order to establish their relation with the morphological characteristics of the building. The UBEM introduces several archetypes to characterize the building form. The values from the UBEM and the EPCD are then compared to fine tune the former. A more detailed explanation is provided in Section 2.3.
A case study applying this methodology was conducted in the urban district of Barrio das Flores, in A Coruña, Spain. This neighborhood was conceived as a unitary development to accommodate nearly 2000 working class families in the 1960s. Although it represents the modern movement’s hygienic ideals, its building stock has deteriorated and the local councils aims to draft a plan to retrofit them. The workflow to develop the UBEM begins with a typological analysis of the study area, followed by the study of the energy demand and consumption patterns derived from the EPCD. The thermodynamic tool CE3X [17], which is one of the official applications of the EPC procedure [18] is applied to obtain detailed results for the representative typological units. Finally, a bespoke UBEM is inferred from these results to the potential efficiency of alternative ECM in the entire district. This methodology can be applied to any urban district or neighborhood for which cadastral information and a EPCD registry exist.
2. Materials and Methods
The Royal Decree [5] that develops the Recovery, Transformation and Resilience Plan [4] establishes a reduction of at least 30% of non-renewable energy consumption and a 25% decrease in the heating and cooling demand for ECM to be eligible for funding. Unlike previous programs, the improved efficiency must be verified after the renovation, by issuing an official Energy Performance Certificate for each dwelling. In addition to this, the program also establishes different funding limits depending on the energy savings obtained after the renovation (Table 1). It is therefore of paramount importance to define the building renovation plan very carefully in order to prevent a potential performance gap between expected and realized energy savings that may lead to partial or complete funding withdrawal.

Table 1.
Maximum eligible funding for building renovation actions in relation with the energy savings achieved (after [5]).
This research was conducted as part of the work to develop the Energy Renovation Plan for the RESR Barrio das Flores (As Flores Neighborhood) in A Coruña, Spain. Its findings were subsequently applied to other three RESRs in the same city: Ventorrillo, Labañou and the Old City District. All four study areas secured over 5 million Euros funding from the RTRP to be distributed over the next four years. Given the limited space, this article will describe the methodology in detail using Barrio de las Flores as case study.
Barrio de las Flores spans over 17 hectares in the southern limit of A Coruña city center (Figure 1a), in the Northwestern corner of Spain. The neighborhood was built during the 1960s, following the Slab-In-The-Park principle of the Modern Movement. It aimed to provide affordable housing for nearly 2000 families. Its formal structure is mainly determined by two factors: the east–west slope and the presence of a major oil pipeline that crosses the district diagonally (Figure 1b). The 2000 dwellings are organized in five neighborhood units and a total of 42 residential blocks, with a mixture of typologies, mostly oriented along the east–west axis. In addition, there are 16 building for non-residential uses (commercial and facilities). The masterplan aimed at maximizing solar access and ventilation for most buildings, whose layout is adapted to the topography, whereas a linear park covers the pipeline’s footprint.
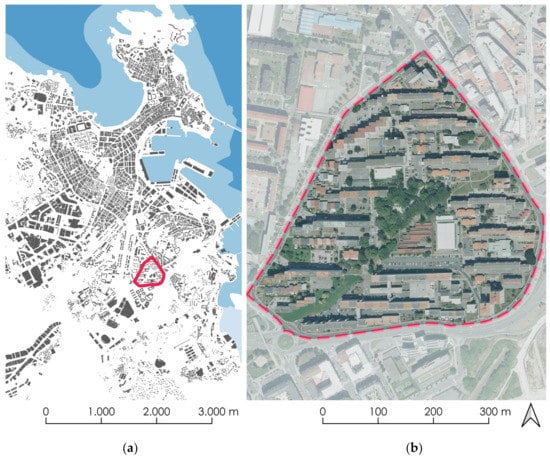
Figure 1.
(a) Location of As Flores neighborhood in the city of A Coruña; (b) Orthoimage of As Flores neighborhood taken in 2023.
The energy assessment of Barrio de las Flores was based on a hybrid UBEM. Firstly, a typological clustering of the building stock was conducted. Then, the Galician Energy Performance Certificate Database (EPCD) [15] was exploited to map and analyze the primary energy consumption and demand from all certificates completed in the neighborhood since 2016. The typological archetypes were modelled and calibrated against the EPCD values. The energy simulations were carried out using the application CE3X, developed by IDEA for the Ministry for Ecological Transition [17]. This tool was selected because it is recognized by the official Energy Efficiency Certification methodology [18].
The relevant information for building characterization was obtained from As Flores Integrated Regeneration Masterplan [19] as well as the Preliminary Studies for an Integrated Regeneration Zone in As Flores neighborhood [20].
2.1. Typological Analysis and Building Characterization
The urban structure of the Barrio de las Flores is characterized by three residential typologies (Figure 2):
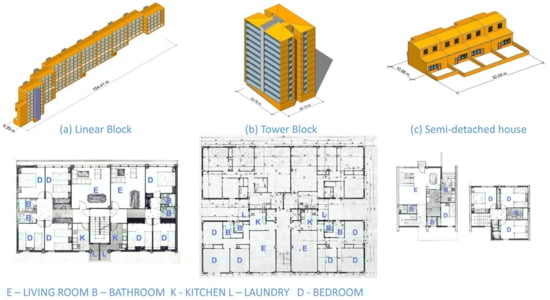
Figure 2.
The three most characteristic building typologies in As Flores neighborhood (after [19]).
- The most predominant typology is the linear block, with a longitudinal axis oriented E–W, and double-aspect dwellings oriented N–S. The units are 12 m deep by 6–7 m wide. Each vertical communication core provides access to two units per floor, with the number of stories varying from 3 to 10 due to the slope of the terrain. All linear blocks maintain a continuous cornice height and adapt to the descending slope by gradually increasing the number of stories from east to west. An open corridor provides additional deck access every three or four floors thus reducing the vertical itineraries. Due to budget limitations the buildings were originally built without elevators. Some blocks have added them with an external structure in recent years. The distance between blocks (over 60 m) and their southern exposure ensure adequate solar access for most units. The linear blocks of the Neighborhood Unit 3 are listed as a relevant example of modern architecture and hence some limitations on its renovation must be observed.
- The second typology is the free-standing tower. There are ten blocks that fall in this typology. They have a rectangular floor plan with sides of around 20–30 m and heights ranging from 5 to 12 floors. A central communications core serves four or five dwellings per floor and it usually includes elevators. The orientation of the internal spaces is not as uniform as in the linear typology although the S–N axis still prevails.
- The third existing residential typology in the Barrio de las Flores is the semi-detached single-family house. Each unit of this type has two floors and a small garden. The typical plot is 8 m wide and 11 m deep.
The analysis of the spatial distribution of the typologies described above confirms the prevalence of the linear block (Figure 3 and Figure 4), which contains 77% of the dwellings in the neighborhood (1516) and it accounts for 74% of the total built up area (126,297 m2). Secondly, 18% of the dwellings (353 units) are located in free-standing tower blocks, which accounts for 12% of the total built up area (21,346 m2). Finally, there are 88 semi-detached single-family houses that constitute 4% of the total stock and 7% of the built up area (11,447 m2). In addition to residential buildings, there are 9 buildings that host communal facilities (i.e., church, school, health center, etc.). They amount to 5% of the built up area. Finally, there are 160 commercial or tertiary premises, 23 of which are located in commercial buildings, covering 2% of the total built up area of the neighborhood. The rest of the premises (137) are integrated in the ground floor of residential buildings.
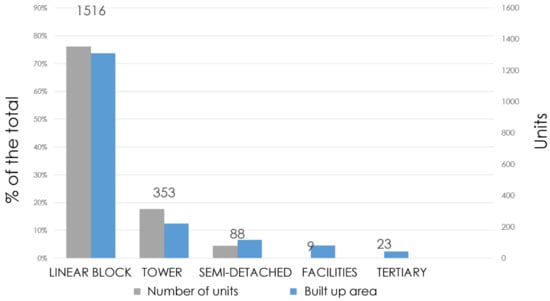
Figure 3.
Breakdown of building typologies according to number of units and percentage of built up area.
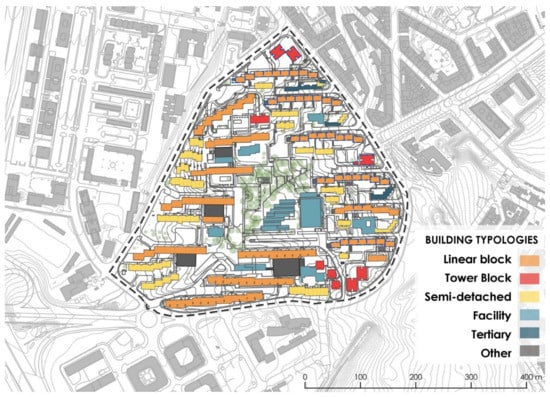
Figure 4.
Distribution of building typologies in As Flores neighborhood.
2.2. Energy Performance Certificate Database
Following the typological analysis, we studied energy consumption patterns in the neighborhood through the information available in the EPCD. The aim was to define performance benchmarks and to provide a calibration reference for the energy model. Firstly, we collected 22,874 Energy Performance Certificate (EPC) reports completed since 2016 in the city of A Coruña. We applied various filters: first, the postal code, and then the postal address and cadastral reference to narrow the sample down to only those EPC referring to units in the neighborhood. After iterative filters and quality checks, 277 EPCs were finally selected; 267 of them were dwellings and 10 referred to commercial units. As a standard procedure across the European Union, the Energy Performance Certificate is a well-known method that intends to provide information about the comparative performance of the building to its owners or tenants. The EPC contain data on primary energy consumption, expressed as kWh/m2 per year and emissions, expressed as CO2 Kg/m2 per year. Both values are also displayed in performance bands, from A (lower consumption and emissions) to G (higher consumption and emissions). The thresholds of these bands are context dependent and they are calculated for each climatic zone following the official procedure [21]. The specific values for the city of A Coruña are listed in Table 2.
Table 2.
Primary energy consumption reference values for private housing blocks and single-family houses in A Coruña [21].
The cadastral reference included in each EPC was used to geolocate the data. Moreover, since most of the certificates correspond to flats located in housing blocks with various entrances and, therefore, different street numbers, it is necessary to apply additional filters to associate each certificate with its specific location within the block.
The EPCD only differentiates between housing blocks and single-family houses but it does not break the housing typologies down. We mapped the spatial location of the EPC to overcome this limitation and thus reveal the relationship between energy consumption patterns and the building typologies identified in the previous study.
The majority (58%) of the certified residential units obtain an estimate of primary energy consumption corresponding to the letter E (Figure 5), which is not surprising given that this category covers a wide spectrum, from 93 to 200 kWh/m2 for the climate zone of A Coruña. A proportion of 36% of certifications fall under a lower category (F or G) while only 6% achieve a level D or higher. These patterns are similar for both housing blocks and single-family homes. To map the results of the EPCs (Figure 6), we obtained the average of all the estimates of each portal included in the database; when only a single certificate had been issued in a block, that value will be used as reference; when there is more than one certificate the average is found and plotted.
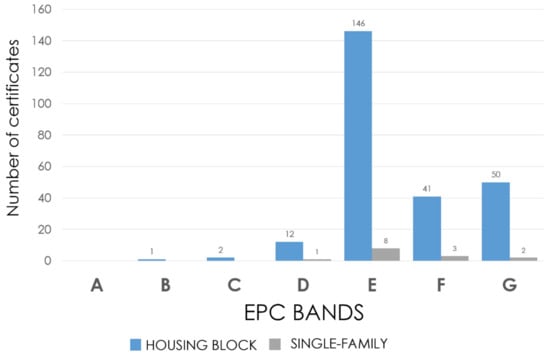
Figure 5.
Diagram of distribution of primary energy consumption from non-renewable sources according to the Energy Performance Certificates (EPC) for residential buildings in Barrio das Flores.
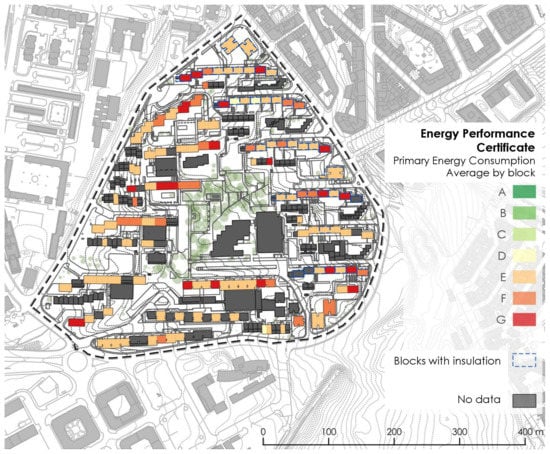
Figure 6.
Primary energy consumption from EPC Database. The map shows the average values obtained for each portal for which EPC data exist.
The initial observations suggest that linear blocks and towers have a similar performance. Moreover, the proportion of envelope exposure and façade insulation seem to have a stronger significance than the typology of the parent block. For this reason, and in order to avoid a repetitive analysis, we will group both tower and linear housing blocks under the same ‘block’ category, while the differentiation of single-family housing is maintained.
In order to fine tune the model’s calibration, the EPC data are disaggregated based on the relative position of each dwelling within the block. We assume that those dwellings with greater envelope exposure are more likely to endure a higher heat loss, either through their contact with the ground or to the outdoor environment.
The flats in housing blocks are classified into three categories: ground, intermediate, and top floor. It is expected that the units located on intermediate floors will have a lower energy consumption due to their reduced exposure, while those on the ground and top floor, as well as the single-family houses will present higher values, due to their larger heat losses. The study of the CEEs confirms this hypothesis (Figure 7). The most energy-efficient dwellings are those located on the intermediate floors, which share their floor and ceiling with other heated units. The relatively good performance of the top floors is counterintuitive, since they have a much larger exposure than the intermediate flats. The results for ground floor and single-family houses are clearly affected and show consumption values above 200 kWh/m2.
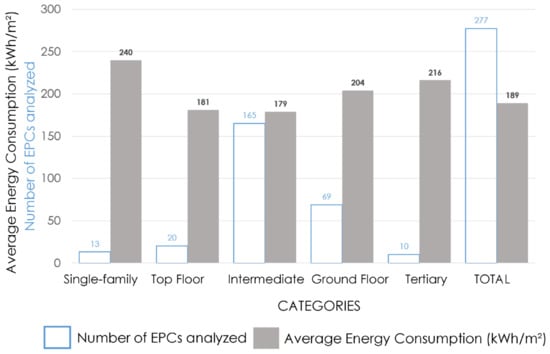
Figure 7.
Average energy consumption from EPC data, disaggregated by typology and location within the building.
A possible explanation for the results of the top floors’ EPCs may be found in their construction. Several blocks have been retrofitted in recent years. The most common interventions were roof and façade insulation. Therefore, it is possible that the roof-top samples included a large proportion of insulated flats, which would introduce bias in the results. For this reason, an additional disaggregation level was introduced in subsequent analyses, breaking the samples down in insulated and uninsulated flats.
A dispersion analysis was carried out showing the average energy consumption from the EPCs issued for renovated buildings and those which remain uninsulated (Figure 8). This study confirms that the flats located in intermediate floors are the most efficient. Their mean energy consumption in their original condition is 185 kWh/m2, which is 16% lower than those in the ground floor and merely 2% below the rooftops (Table 3). The mean value of the single family houses is 214 kW/m2, which is similar to the flats on the ground floor. As expected, the units located in insulated buildings are consistently more efficient than those in uninsulated ones. However, variations are within a modest range of a 10% decrease, which is far below the expected energy savings of current renovation programs. The map series shown in Figure A1, Figure A2 and Figure A3 (Appendix A) display the EPCs results for dwellings located on ground, intermediate and lower-roof floors, respectively. The blocks with an External Thermal Insulation System (ETICS) are also identified in these maps.
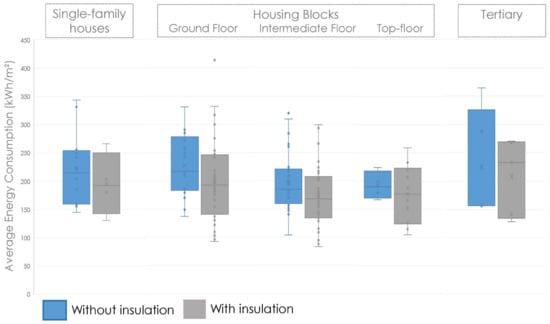
Figure 8.
Dispersion diagram of primary energy consumption by type and thermal properties of the envelope according to data from the CEEs.
Table 3.
Mean primary energy consumption (kWh/m2 year) by type, location and envelope insulation according to data from the EPCs.
2.3. Model Definition and Calibration
The EPCD provided a preliminary overview of energy consumption patterns in Barrio das Flores. However, the database contained a limited number of samples and there were discrepancies in some of its results as discussed in the previous section.
The RD 853/2021 [5] establishes a reduction of at least 30% of non-renewable energy consumption and a 25% decrease in the heating and cooling demand for ECMs to be eligible for funding within the RTRP program. Moreover, it also establishes that energy savings shall be calculated following the EPC procedure once the renovation is completed. The local authorities need to include specific energy calculations in their applications for the whole area (RESR) in order to adjust the funds requested with realistic targets. Otherwise, they risk losing a substantial part of the subsidy, thus imposing an unexpected burden on building owners who counted on those funds.
An ad hoc energy model was defined to support this application. Therefore, it needed to meet some requirements:
- Include the 2.000 dwellings of the RESR
- Provide reliable estimates for energy consumption and heating demand for current and future scenarios, applying ECMs.
- The calculation procedure should be aligned with the EPC methodology
The adopted solution is a hybrid Urban Building Energy Model that combines Geographic Information Systems (GIS) and building level thermal simulations.
First, we defined the representative archetypes from the typological and EPC analyses. Thermal simulations for single-family house, as well as flats in ground, intermediate and top floors were carried out using the CE3X tool [17], which is one of the official applications of the EPC procedure [18]. In this way, we ensured compliance with the mandatory energy efficiency outcomes defined in the RTRP program.
The CE3X tool is based on the comparison of the building object of the certification and a database that has been prepared for each of the representative cities of the climatic zones, with the results obtained from carrying out a large number of simulations with CALENER Calener VYP energy model [22]. It incorporates a predefined database with these reference buildings. The database covers all climatic regions and construction systems in the Spanish context. All the quantitative variables of the model are parametrized in order to enable comparisons between buildings with similar characteristics. When the user of the tool introduces the specific attributes (dimensions, climate, envelope…) of the building to be certified the model compares them with the values stored in the database to find the relevant reference building. Then, the tool will use the input parameters to estimate the energy consumption for heating, cooling, and hot water [23].
We extracted the archetype’s characteristics, such as dimensions, orientation and materials from the detailed building survey conducted as part of As Flores Integrated Regeneration Masterplan. The current condition of uninsulated buildings was modelled with exterior walls composed of two brick layers with an intermediate air cavity (U-value = 2.00 W/m2K) and single glazed windows with aluminum frame (U = 5.7 W/m2K). We calibrated the model against the EPC values of the intermediate flats due to the large number of samples available in the EPCD. The results of the calibration are summarized in Table 4. It can be observed how the simulated results of the intermediate floor closely matches the values obtained from the EPC analysis (Table 3). Once the model for the prevailing type was calibrated, we analyzed the coherence of the results for the remaining cases.
Table 4.
Primary energy consumption values (kWh/m2 year) by type, location and envelope insulation according to the calibrated model.
Finally, we used GIS to interpolate the results from the simulations to all the dwellings in the neighborhood. A geospatial dataset was created to integrate the buildings’ cadastral information, as well as the relevant characteristics from the survey. The data were stored in a shapefile that included information on typology, height, façade and roof construction, window systems, date of construction and/or renovation (if any) for each of the 253 existing buildings. The results from the model are shown in Figure 9 and discussed in the next section.
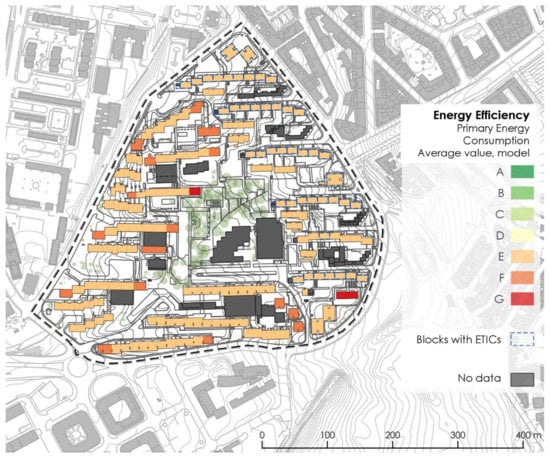
Figure 9.
Non-renewable primary energy consumption in Barrio de las Flores according to the model.
3. Results
The reduction in the energy consumption and heating of eligible ECMs can be estimated with the calibrated model. An enquiry was conducted to evaluate compliance with the reduction targets of at least 30% in non-renewable primary energy consumption and 25% in heating demand. The Energy Conservation Measures were introduced in the model. They were identified as the most common and efficient solutions in this region [24]:
- The addition of 6 cm external thermal insulation layer, for a U-value = 0.49 W/m2K, which is the maximum U-value permitted by the Spanish Building Code CTE HE [25] in this climatic region. In the listed block Neighborhood Unit 3, internal insulation is assumed due to heritage protection.
- Window replacement. Single-glazed windows (U-value 5.7 W/m2K, solar factor g = 0.82) are upgraded to double-glazing windows with thermal bridge breaks in the aluminum carpentry (U-value 2.1 W/m2K, solar factor g = 0.65). The transmittance of the system must comply with the CTE HE, and therefore it is established at 2.1 W/m2K. For the same reason, the permeability through the window system is reduced to 9 m3/hm2 Q (100, lim). Since the CTE does not establish a threshold for the solar factor, the default values of CE3X for single and double glazing were used.
- Conventional DHW and natural gas heating boilers are replaced by heat pumps. This measure is not eligible in itself since it does not affect the demand for heating, but it does affect the consumption of primary energy from non-renewable sources. Therefore, it could be eligible in combination with others ECMs while improving the overall efficiency of the dwelling.
- The installation of photovoltaic panels (PVs) on the roof of the building. As in the previous case, it does not affect the heating demand, but it does reduce the consumption of non-renewable energy sources. The estimation of the potential contribution is made with the Solar Energy Cluster’s tool [26]. It is assumed that PVs are deployed over half of the available roof space and the generated energy generated is evenly distributed among all dwellings of each housing block.
The ECMs described above were simulated in the C3EX application for each archetype: single family house and flats located on the ground floor, intermediate floor and top floor, respectively. Two initial conditions were assumed for the buildings: uninsulated and insulated. The first run of simulations evaluated each measure individually while a second run would focus on their combined efficiency (Table 5b). The results from these simulations are summarized in Table 5a,b for single measures and Table 6 for their combined efficiency. In addition, Table 7 shows the results when Planning Regulations prevent external insulation as it happens in Neighborhood Unit 3.
Table 5.
(a) Summary of reduction in energy consumption and heating demand resulting from energy conservation measures (ECM) for single family houses and ground floor flats. (b) Summary of reduction in energy consumption and heating demand resulting from energy-conservation measures (ECM).
Table 6.
Reductions in energy consumption and heating demand resulting from aggregated ECMs on an intermediate dwelling in an uninsulated block.
Table 7.
Reductions in energy consumption and heating demand resulting from aggregated ECMs applied to Neighborhood Unit 3. Thermal insulation is considered on the inside due to the urban limitations derived from the building being listed.
From this study, it can be inferred that the only measure that consistently meets the efficiency thresholds of the RTRP is the improvement in wall insulation. In all cases, the addition of a 6 cm insulation layer induces a reduction in energy consumption between 32 and 50%, while heating demand is decreased over 50%. By contrast, the probability of reaching the efficiency goals by only replacing windows is very low as the energy savings observed in the analysis are nearly 20 points below the objective. As expected, the measures that focus on building services (heat pump and photovoltaic panels) only affect energy consumption and do not reduce the heating demand.
The results obtained so far depict retrofitting scenarios for the typological archetypes of the neighborhood. The next step would be the formulation of the UBEM that extrapolates these values to the nearly 2000 dwellings of the study area. We use cadastral cartographic information and the observations collected in the building survey conducted in [13]. Each dwelling is characterized as single-family or housing block. The latter category is broken down into ground-, intermediate- and top-floor subcategories. The thermal properties are of the envelope are derived from the survey. The construction specifications for uninsulated buildings are inferred from the original plans. The thermal transmittance of the elements that were renovated (e.g., ETICS or roof) were assumed as the maximum values allowed by building regulations at the time of the intervention. Based on statistical correlations, the model extrapolated the results from the previous simulations to each flat, selecting the most suitable parameters for each case. The model was iteratively tested and audited to identify possible discrepancies between the characteristics of the dwellings and the energy outputs.
The results were stored and geolocated in a shapefile. We plotted the average primary energy consumption per block in the base case (current scenario) in Figure 9. It can be observed that most of the blocks fall under category E of the EPC, which is in line with the results of the EPC reports (Figure 6). According to the model, the estimated consumption for the entire neighborhood is nearly 30 GWh per year, which is equivalent to an average of 190 kWh/m2 of residential built up area. The urban model enables multiscalar analysis for alternative scenarios. It provides estimates for the entire neighborhood or for a single building. These values supported the local authorities’ grant application process. The expected savings determine the proportion of the renovation budget covered by the RTRP funding program. In a hypothetical scenario in which all ECMs were applied, the overall estimated energy consumption would be down to 8 GWh per year (equivalent to 50 kWh/m2 of built-up residential area). In this scenario, most building would be upgraded to band C in the EPC methodology (Figure 10).
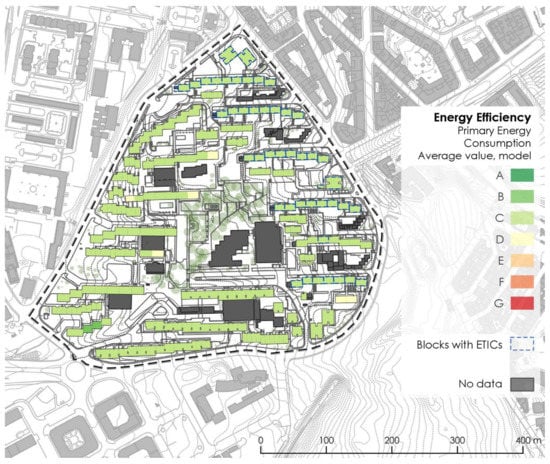
Figure 10.
Non-renewable primary energy consumption of barrio de las flores after the ECMs. Results from the model.
4. Discussion
The Renovation Wave Strategy of the European Commission [2] highlighted the need to make better use of available funding. Inefficient buildings and the most vulnerable areas need to be prioritized to maximize the returns. Following these principles, the most recent Housing Renovation and Social Housing Program in Spain [5], based on the 2020 Recovery, Transformation and Resilience Plan (RTRP) has established a regulatory framework with very specific energy savings thresholds as a condition for funding. These initiatives are eventually channeled through local authorities [2], which have to identify the eligible areas of the city where building renovation can be incentivized through these funds. However, cities do not currently have objective instruments to support energy based decisions. In previous programs, socio-economic indicators extracted from the census were used to identify vulnerable zones and rough estimates for energy savings were inferred based on statistics. This approach is now impractical, since falling short of the required savings makes the renovation ineligible for funding, which are only secured upon completion and verification
We explored the consistency of the EPC Database to support energy savings estimates. For the study area, we collected 277 samples covering 13% of the building stock and all the building typologies. The EPCD provides a useful benchmark since it consistently reports average values in the region of 200 kWh/m2 for uninsulated dwellings and around 170 kWh/m2 (16% reduction) in those blocks that were retrofitted. For buildings in their original condition, intermediate flats have the lowest energy consumption (185 kWh/m2 as average), which is 15% lower than that of single family houses and dwellings on the ground floor. The only results that deviate from the expected patterns are found on top floors. This could be due to the size of the sample or gaps in the quality checks of the EPC procedure.
Eventually, building owners need to demonstrate the intervention meets the energy efficiency targets after the renovation in order to secure funding. The procedure established by the RTRP is by issuing EPCs both before and after the renovation. In Spain, the EPCs must be calculated with one of the six verified tools [18]: HULC, CE3, CE3X, CERMA, CYPETHERM and SG SAVE. Although there are other tools, such as EnergyPlus or UMI [27,28], that allow more detailed input definitions, they are not part of the EPC procedure. Therefore, it is more practical to base the estimates on the same applications that will be used to evaluate the results. In this way, we can minimize a potential discrepancy between the estimates obtained when writing the grant application and the EPCs conducted for each individual building before and after the renovation. We selected CE3X because of its simplicity, flexibility and the transparency of its supporting technical documents, which provide information on all the calculation assumptions and stages.
The evaluation of the ECMs were consistent with literature [29]. The addition of thermal insulation is the keystone measure that defines whether the intervention is eligible based on energy efficiency criteria. No other measure has the capacity to meet the combined objectives of at least 30% of non-renewable energy consumption and a 25% decrease in the heating and cooling demand. Therefore, building owners must necessarily combine these other measures (window replacement, boilers or PV panels) with the insulation of the external envelope. This is the case even for buildings that were previously insulated (Table 5a,b). It is clear that this funding program seeks to incentivize the implementation of ETICs and similar solutions to upgrade the building envelope over small-scale individual actions.
This study assumed a 6 cm insulation layer as it meets, in combination with the existing external walls of the buildings in Barrio das Flores, the thermal transmittance required by the Spanish Technical Code in this climate (0.49 W/m2K) and it also meets the energy efficiency criteria when applied. However, further energy savings could be provided by additional insulation. As an example, the heating demand for an insulated intermediate floor goes down to 20 kW/m2 when a 6 cm insulation layer is implemented (Table 5b). On the other hand, the assessment of the combination of the four ECMs helps to visualize ambitious targets of nearly a 75% reduction in energy consumption and heating demand (Table 6).
5. Conclusions
This study introduces a modelling procedure to generate ad hoc UBEMs based on the requirements of the Recovery, Transformation and Resilience Plan (RTRP) and thus undertake urban-scale building energy retrofit analysis. The case study of Barrio das Flores demonstrated the use of the methodology to select, evaluate, and prioritize energy conservation measures (ECMs) for retrofitting Residential Environments Scheduled for Renovation (RESR). This method supports local administrations when making decisions about building energy efficiency and preparing the city’s applications to funding programs. The Energy Performance Certificate database provides a useful baseline to define benchmarks and calibrate the model. Additional efforts are needed to integrate this database in energy analysis for future applications as relevant information that was collected when issuing the EPCs is not included (e.g., materials or systems).
Urban Buildings Energy Modelling is a consolidated field which has acquired great relevance due to the need to conduct large scale energy analysis to optimize the available funds from building renovation programs.
Funding
The work supported by A Coruña City Council under Contract No. OTR2622.
Data Availability Statement
The data presented in this study are openly available in Zenodo at https://doi.org/10.5281/zenodo.8085762 (accessed on 11 May 2023).
Acknowledgments
Part of this research was applied to the City’s application to the RTRP program in collaboration with the Institute to Technology of Galicia.
Conflicts of Interest
The authors declare no conflict of interest. The funders had no role in the design of the study; in the collection, analyses, or interpretation of data; in the writing of the manuscript; or in the decision to publish the results.
Appendix A

Figure A1.
Primary energy-consumption values obtained from the CEEs issued for dwellings on ground floors.
Figure A1.
Primary energy-consumption values obtained from the CEEs issued for dwellings on ground floors.


Figure A2.
Primary energy-consumption values obtained from the CEEs issued for dwellings on ground floors.
Figure A2.
Primary energy-consumption values obtained from the CEEs issued for dwellings on ground floors.


Figure A3.
Primary energy-consumption values obtained from the CEEs issued for dwellings on top floors.
Figure A3.
Primary energy-consumption values obtained from the CEEs issued for dwellings on top floors.

References
- Energy Consumption in Households. Available online: https://ec.europa.eu/eurostat/statistics-explained/index.php?title=Energy_consumption_in_households (accessed on 11 May 2023).
- European Commission. A Renovation Wave for Europe—Greening our Buildings, Creating Jobs, Improving Lives. Communication from the Commission to the European Parliament, the Council, the European Economic and Social Committee and the Committee of the Regions. 2020. Available online: https://eur-lex.europa.eu/legal-content/EN/TXT/?uri=CELEX:52020DC0662 (accessed on 11 May 2023).
- European Commission. Budget Pre-Allocations. Summary of EU Budget Amounts Assigned to EU Countries for Specific Programmes in the Several Policy Areas. EU Budget 2021–2027 and Next Generation EU. Available online: https://commission.europa.eu/strategy-and-policy/eu-budget/long-term-eu-budget/2021-2027/spending/budget-pre-allocations_en (accessed on 11 May 2023).
- Government of Spain. Plan de Recuperación Transformación y Resiliencia; Government of Spain: Madrid, Spain, 2021.
- Royal Decree 853/2021, of 5 October, Which Regulates the Residential Renovation and Social Housing Renovation Programmes of the Recovery, Transformation and Resilience Plan. Available online: https://www.boe.es/buscar/act.php?id=BOE-A-2021-16233 (accessed on 11 May 2023).
- Ferrando, M.; Causone, F.; Hong, T.; Chen, Y. Urban building energy modeling (UBEM) tools: A state-of-the-art review of bottom-up physics-based approaches. Sustain. Cities Soc. 2020, 62, 102408. [Google Scholar] [CrossRef]
- Reinhart, C.F.; Cerezo Davila, C. Urban building energy modeling—A review of a nascent field. Build Env. 2016, 97, 196–202. [Google Scholar] [CrossRef]
- Swan, L.G.; Ugursal, V.I. Modeling of end-use energy consumption in the residential sector: A review of modeling techniques. Renew. Sustain. Energy Rev. 2009, 13, 1819–1835. [Google Scholar] [CrossRef]
- Summerfield, A.J.; Lowe, R.J.; Oreszczyn, T. Two Models for Benchmarking UK Domestic Delivered Energy. Build. Res. Inf. 2010, 38, 12–24. [Google Scholar] [CrossRef]
- Mastrucci, A.; Baume, O.; Stazi, F.; Leopold, U. Estimating Energy Savings for the Residential Building Stock of an Entire City: A GIS-Based Statistical Downscaling Approach Applied to Rotterdam. Energy Build. 2014, 75, 358–367. [Google Scholar] [CrossRef]
- Ali, U.; Shamsi, M.H.; Hoare, C.; Mangina, E.; O’Donnell, J. Review of Urban Building Energy Modeling (UBEM) Approaches, Methods and Tools Using Qualitative and Quantitative Analysis. Energy Build. 2021, 246, 111073. [Google Scholar] [CrossRef]
- Fonseca, J.A.; Nguyen, T.A.; Schlueter, A.; Marechal, F. City Energy Analyst (CEA): Integrated Framework for Analysis and Optimization of Building Energy Systems in Neighborhoods and City Districts. Energy Build. 2016, 113, 202–226. [Google Scholar] [CrossRef]
- Robinson, C.; Dilkina, B.; Hubbs, J.; Zhang, W.; Guhathakurta, S.; Brown, M.A.; Pendyala, R.M. Machine Learning Approaches for Estimating Commercial Building Energy Consumption. Appl. Energy 2017, 208, 889–904. [Google Scholar] [CrossRef]
- Dogan, T.; Reinhart, C. Shoeboxer: An Algorithm for Abstracted Rapid Multi-Zone Urban Building Energy Model Generation and Simulation. Energy Build. 2017, 140, 140–153. [Google Scholar] [CrossRef]
- Galician Energy Performance Certificate Database. Available online: https://appsinega.xunta.es/rgeee/web/consultaPublica.php?lang=es (accessed on 11 May 2023).
- European Commission. Directive (EU) 2018/844 of the European Parliament and of the Council of 30 May 2018 Amending Directive 2010/31/EU on the Energy Performance of Buildings and Directive 2012/27/EU on Energy Efficiency. 2018. Available online: https://eur-lex.europa.eu/legal-content/EN/TXT/?uri=uriserv:OJ.L_.2018.156.01.0075.01.ENG (accessed on 11 May 2023).
- IDEA. CE3 and CE3X Approved Software. Available online: https://www.idae.es/node/302 (accessed on 11 May 2023).
- Ministry of Ecological Transition and Demographic Challenge. Procedures for Energy Performance Certification. Available online: https://energia.gob.es/desarrollo/EficienciaEnergetica/CertificacionEnergetica/DocumentosReconocidos/Paginas/procedimientos-certificacion-proyecto-terminados.aspx (accessed on 11 May 2023).
- Territorisxlm; BCQ. As Flores Integrated Regeneration Masterplan; A Coruña City Council; The World Bank: Washington, DC, USA, 2022. [Google Scholar]
- ON Arquitectos & Crecente Asociados. As Flores Integrated Regeneration Zone. Preliminary Report; A Coruña City Council: A Coruña, Spain, 2018. [Google Scholar]
- IDAE. Building Energy Performance Assessment. Ministry of Industry, Energy and Tourism. 2015. Available online: https://energia.gob.es/desarrollo/EficienciaEnergetica/CertificacionEnergetica/DocumentosReconocidos/normativamodelosutilizacion/20151123-Calificacion-eficiencia-energetica-edificios.pdf (accessed on 11 May 2023).
- Unified Tool LIDER-CALENER (HULC). Available online: https://www.codigotecnico.org/Programas/HerramientaUnificadaLIDERCALENER.html (accessed on 11 May 2023).
- IDAE. Guide: CE3X Existing Buildings Energy Performance Certification. User Manual. 2012. Available online: http://www6.mityc.es/aplicaciones/CE3X/Manual_usuario%20CE3X_05.pdf (accessed on 11 May 2023).
- Ministerio de Fomento. Actualización 2020 de la Estrategia a Largo Plazo para la Rehabilitación Energética en el Sector de la Edificación en España. 2020. Available online: https://www.mitma.gob.es/el-ministerio/planes-estrategicos/estrategia-a-largo-plazo-para-la-rehabilitacion-energetica-en-el-sector-de-la-edificacion-en-espana (accessed on 11 May 2023).
- Spanish Building Code. CTE DB HE. Available online: https://www.codigotecnico.org/DocumentosCTE/AhorroEnergia.html (accessed on 11 May 2023).
- Energy Solar Cluster. PV Tool. Available online: https://www.solartys.org/es/autoconsumo-fotovoltaico/ (accessed on 11 May 2023).
- EnergyPlus. Available online: https://energyplus.net/ (accessed on 11 May 2023).
- Urban Modelling Interface 3.0. Available online: https://web.mit.edu/sustainabledesignlab/projects/umi/index.html (accessed on 11 May 2023).
- Rodríguez Álvarez, J. Urban Energy Index for Buildings (UEIB): A new method to evaluate the effect of urban form on buildings’ energy demand. Landsc. Urban Plan. 2016, 148, 170–187. [Google Scholar] [CrossRef]


Disclaimer/Publisher’s Note: The statements, opinions and data contained in all publications are solely those of the individual author(s) and contributor(s) and not of MDPI and/or the editor(s). MDPI and/or the editor(s) disclaim responsibility for any injury to people or property resulting from any ideas, methods, instructions or products referred to in the content. |
© 2023 by the author. Licensee MDPI, Basel, Switzerland. This article is an open access article distributed under the terms and conditions of the Creative Commons Attribution (CC BY) license (https://creativecommons.org/licenses/by/4.0/).