Abstract
Environmental psychology plays a vital role in the overall development of human health. Student activism and health concerns have arisen about the human health costs associated with a healthy built environment. This research focuses on recent design “trends”, active designs, and their relationship to environmental psychology and a healthy campus. This study examines the role of the active design approach in improving the environmental psychology of universities to achieve a healthy campus for students by hypothesising physical activity comprises three categories: physically active (body), mentally active (emotions), and socially active (group). The total number of student participants was 428 from ten university campuses. The methodology included a questionnaire survey with statistical analyses, ANOVA tests, and factor analyses. The results of this study reveal that students are more active outside campus than inside campus. Students are more interested in social activity than in mental and physical activities. In addition, the obstacles to students’ physical inactivity are a lack of time, lack of opportunities on campus, and the psychological feeling of anxiety, depression, and tension due to social activities and university work performances. In conclusion, a model is designed to demonstrate the relationship between environmental psychology and active design variables.
1. Introduction
The growing urban population has increased environmental demands and affects human health due to the rise of chronic diseases caused by populations’ inactivity [1]. A new design trend introduced by scientists and researchers for solving this issue is the active design approach [2]. This approach was developed in the U.K. by Sport England, which commissioned the active design to promote physical activity in a creative environment that encourages communities to be active as a natural part of their daily lives [3]. Additionally, A.I.A. (U.S.A.) released evidence-based active design guidelines (A.D.G.) with twenty-three strategies—thirteen for urban design and ten for building design—to increase physical activity through the built environment. The built environment includes all the physical parts of where we live and work (e.g., homes, buildings, streets, open spaces, and infrastructure) [2]. Additionally, the built environment influences a person’s level of physical activity [4,5]. For example, inaccessible or non-existent sidewalks, bicycles, or walking paths [6,7] contribute to sedentary habits. These habits lead to poor health outcomes such as obesity, cardiovascular disease, diabetes, and cancer [8,9], affecting human health and well-being.
In addition to public health [10], the built environment belongs to physical environments which are designed to achieve health and wellness as integral parts of communities’ health [11]. At the same time, studies have shown that built environments that were expressly designed to improve physical activity correlated to higher rates of physical activity, which in turn, positively affects health. In order to understand people–environment interactions and how they relate to real-world issues [10,12], environmental psychology now encompasses various research fields. Architecture is most familiar, and environmental psychology and architecture have been encouraged to become more attentive to each other’s impacts. In other words, architectural psychology links psychology with architecture. The study of architectural psychology, which emphasises how people interact with the built environment, increased in the 1950s to enhance humans’ peace of mind and well-being by designing or modifying architectural settings. Its impact can be seen in urban design through the long-term reconfiguration of personal and societal norms, values, and beliefs caused by social isolation, social segregation, and quarantine [13,14,15]. In addition, some people in the fields of interior design, architecture, landscape design, and urban design have conducted structured research using behavioural sciences, and this group grows enormously day by day [16]. Researchers believe behavioural sciences can develop some models and concepts that clearly understand human–environment relations. Consequently, it improves our knowledge of how the physical environment [17] affects the population’s health [18].
In the same way, environmental psychologists take into consideration any individual activity to be situated along three measurements at the same time: the person (e.g., age, gender, personality, and culture), the place (e.g., home, classroom, workplace, park, and nature), and the psychological procedure of enthusiasm (e.g., socialising, working, learning, playing, and exploring). Another significant aspect of environmental psychology is change throughout time with reference to the temporal dimension of the people–environment link, while the physical and social environments have generally been ignored in environmental psychology [19,20,21]. Multiple interventions are brought about by the time dimension, human well-being, and the importance of spatial anchoring. The act of anchoring is always a procedure that takes place in some dimension of time. It reflects the individual’s ambitions, social standing, family life circumstances, plans for the future, and human well-being. For the purpose of this article, we focused on the need (ambition) and well-being of users in the environmental psychology context. Jointly, [22] observed, “Due to the absence of any coherent body of study or theory, campus planning is likely to be continued on a pragmatic basis.” Thus, the environmental psychology of campuses is perhaps the most neglected. Also, improving environmental knowledge and capacities without the concurrent development of the possibility of action leads to a sense of meaninglessness [23]. Correspondingly, any educational institution may become a healthy university by establishing a community emphasising health and wellness by increasing active opportunities through the active design. The majority of students spend most of their time on campus. A healthy campus is a place that actively promotes optimal health outcomes and helps each student as a whole—as a single bio-psycho-social person [24,25,26]. The university campus environment is the most critical environment influencing students’ daily activities and health from the perspective of environmental behaviour and the campus space environment [27].
The evidence presented thus supports the idea that the environment plays a vital role in disease dynamics and in determining the health of individuals; specifically, the built environment significantly impacts the prevention and containment of both chronic and infectious diseases in humans. The effects of the built environment on health can be direct, for example, by influencing environmental quality, or indirect, by influencing behaviours that impact disease transmission and health [9]. No research studies have been conducted to study the temporal dimension of user ambition and well-being in environmental psychology and none relate to campus environmental psychology. Therefore, this study will fill this gap with the study’s main aim being to analyse the main parameter of active design (physical activity) in categories, which is the main key point tested by questionnaires to identify the demand for each of them in the community. The question is, why does physical activity decrease with the increase in population?
Thus, an active design approach might play a crucial role in enhancing the environmental psychology of the campus built environment to create a healthy environment for students by analysing the students’ ambition (need), in detail, for activism to improve their health. So, we hypothesise physical activity, in more detail, comprises three categories for the student, physically active, mentally active, and socially active, in a campus-built environment. Later, we show its impact on environmental psychology. This study conducted a questionnaire with statistical analyses to answer the research hypothesis and objective. The outcomes revealed the correlation between environmental psychology and the physical activity categories. This finding can improve future research on environmental psychology, a healthy campus built environment, and active design strategies, which will dramatically increase physical activity in the community.
1.1. Active Design and Physical Activity
The definitions for active design in the U.K. and U.S.A. are similar in that both promote physical activity to create a healthy environment and society. Likewise, physical activity is the primary variable of active design, so the last updated definition for the active method is, by [28], defined as “people moving, acting and performing within culturally specific spaces and contexts, and influenced by a unique array of interests, emotions, ideas, instructions, and relationships.” There is overwhelming evidence corroborating the definition of physical activity from Caspersen et al. 1985, reviewed from different sources, which covers aspects such as the cerebral, social, situated, and political. The last updated definition by [28] was accepted, studied, and analysed by being categorised into three categories by the author (Figure 1):
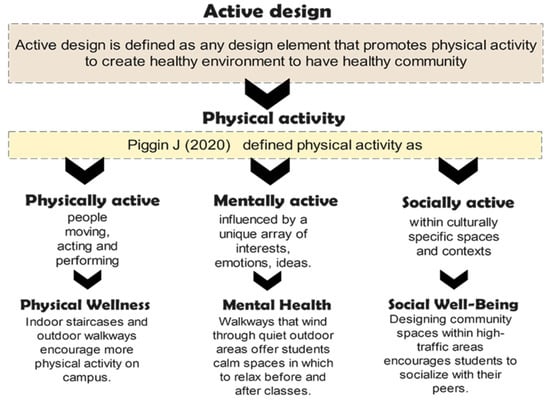
Figure 1.
Active design definitions and indicators (authors’ analysis) [28].
- Physically active: for example, the person moving, acting, and performing to achieve physical wellness in the built environment could be adopted as indoor staircases and outdoor walkways encourage more physical activity on campus, etc.
- Mentally active: influenced by a unique array of interests, emotions, and ideas to achieve mental health in a built environment which could be adopted as walkways that wind through quiet outdoor areas offer students calm spaces to relax before and after classes [29].
- Socially active: within culturally specific spaces and contexts, to achieve social well-being in a built environment, this could be adopted as designing community spaces within high-traffic areas encourages students to socialise with their peers.
Furthermore, the active built environment should enhance physical activity, which can be identified by its type, intensity, amount, and measuring tool, to know the amount of physical activity and active design in the built environment, thus displaying the ratio of active living and lifestyle.
Ultimately, the new approach to active design and its definition were studied, analysed, and categorised [26]. All research studies saw physical activity, in general, and its impact on mental health; none of them break it down into categories hypothesised as the need (ambition) of students and later explore its effect on the environmental psychology of a campus-built environment, which fill the goal of this research paper that examines the role of active design in improving the environmental psychology of a healthy built environment.
1.2. Environmental Psychology
Environmental psychology is a branch of psychology that studies the mutual relationships and interactions between human behaviour (including experience and action) and its surroundings (material, social, and cultural) [27,30]. There are multiple pieces of evidence showing environmental psychology could be considered in built environments as having an essential role in shaping human behaviour, such as the psycho-social approach which emphasises people’s environmental relationships in environmental perception, cognition, and attitude [31,32,33] in addition to space perception as urban spaces, which reflect daily life and shape personality with perception [34,35]. Concerning mental health with expanding urbanisation, more individuals are exposed to environmental stressors, which may contribute to increased stress and worsen mental health [36] and the effects of smell, colour, and light on human behaviour and experience, as well as the way physical environments influence social identity [37]. This also concerns cross-cultural environmental psychology since-human–environment interactions are culture-bound [30]. Environmental psychology also includes social-psychological contextual elements, such as the presence of others’ or one’s place in the group, which can affect behaviour in a specific physical setting [18]. Thus, the concepts of environmental psychology can be utilised in a wide variety of situations, including private homes, public institutions (such as schools), workplaces, and recreational areas. Humans may change their behaviour which hurts the environment at both the micro and macro levels [38]. Environmental psychology accepts the natural world through which we experience life and shapes human behaviour and health. The evidence with regard to the scope of this research study indicates the relevance of environmental psychology and the built environment in shaping human behaviour. Yet, notions such as the connection between the physical environment and psychological processes and investigating human behaviour in natural settings, rather than artificial settings, influenced many subsequent studies on human–environment interactions.
For this reason, environmental psychology (E.P.) is many things; it is something which is seen and felt more as an area of overlap between psychology and several disciplines or domains [33], and E.P. is not only an area within psychology but is interdisciplinary, suggesting the need to develop a coherent core for E.P. and recognise its applied context. There are multiple definitions for E.P. such as a “multi-disciplinary behavioural science, both basic and applied in orientation, whose foci are the systematic interrelationships between the physical and social environments and individual human behaviour and experience” [35]. Furthermore, “Environmental psychology is the discipline that studies the interplay between individuals, the built and natural environment”. So, environmental psychology examines the influence of the environment on human experiences, behaviour, and well-being, as well as the influence of individuals on the environment, that is, the factors influencing environmental behaviour and ways to encourage pro-environmental behaviour [39]. In other words, environmental psychology studies interactions between humans and their surroundings because human–environment interactions are culturally determined [30]. Many researchers use multiple ecological models to assess the linkage and relationships among various factors affecting health as an ecological model [40].
This study, concerning modern architecture, shows the distinction between traditional psychology and architectural psychology and includes studies of how different environments influence human perception and behaviour. Recently, regarding environmental psychology, much attention was given to the built physical environment and how it affects human behaviour and well-being [20,41]. So, environmental psychology in a built environment could create active behaviours and improve human well-being, with a new trend in active design. Along this line, here, we designed a model to identify the parameters of this environmental psychology study and relate them to active design approaches through physical activity categories. Figure 2 shows that environmental psychology is context (environment) and content (people–environment relation) interrelated, most of which emphasise social aspects. Conversely, for this study, the environmental psychology of a campus-built environment is context (campus environment) and content (student–environment relation) in three categories of physical activity: physically active, mentally active, and socially active.
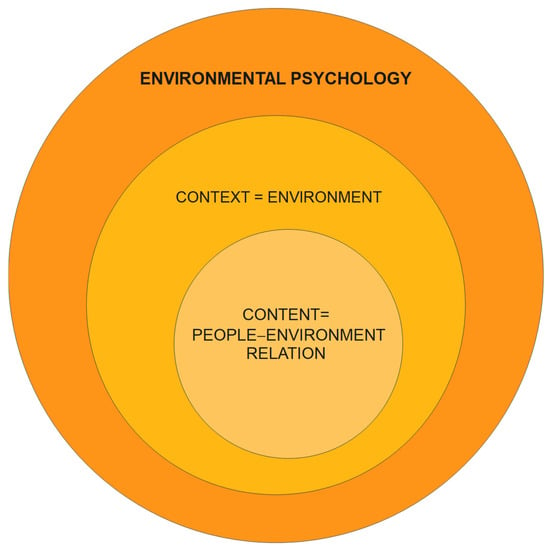
Figure 2.
Environmental psychology model for determining its parameters (authors).
1.3. Healthy Campus as a New Trend
In general, campus master plans prescribe a set of design and planning actions to achieve a university’s goals and objectives as a higher education institution. It started in medieval Europe, and modern universities evolved in America. Some of the best university campuses developed in the 19th century and early 20th century in the U.S.A. in terms of campus planning and architecture follow specific typologies such as the quadrangle campus, picturesque campus, and beaux-art campus, but after world war II, emphasise freestanding buildings than on-campus master plans [22,42]. The quality of the campus built environment determines the health of users; thus, most designs focus on micro-scale designs rather than macro-scale designs.
Therefore, an index proposed by [43] called the campus score measures the main physical qualities of university campuses, which are composed of three latent variables, urbanism, greenness, and on-campus living, with ten indicators, activity density, context land use mix, intersection density, campus connectivity, campus mass density, surface parking, pervious surfaces, tree canopy, and living on campus. University campuses can address this wide range of issues and concerns differently. The author of [44] argued for “campuses to be designed, not only to heighten the quality of the learning experience, but also as working demonstrations of ways in which places everywhere can be transformed into more healthy, humane, civic environments”. The authors of [42] discuss “trends” in contemporary campus designs which are adaptive reuses of buildings and facilities, architecture, hub buildings, interdisciplinary science research buildings, commercial urban developments, large-scale campus expansions, and revitalising master plans. But today, for modern society, the new trend is a healthy built environment with a new approach known as the “Healthy Campus framework”, which was formulated by the American College Health Association and lately presented multiple student health targets, including a requirement to “create social and physical environments that promote good health for all” to “support efforts to increase academic success, productivity, student and faculty/staff retention, and life-long learning.” [45] The ecological model of [46] was explained by the American College Health Association’s (2023) Healthy Campus 2020 initiative and composed of five factors: intrapersonal and interpersonal processes and primary groups, institutional factors, community factors, and the last public policy for creating a healthy campus.
The campus’s architectural design is the main factor in creating a healthy built environment for students and staff. The new design trends by A.I.A. and U.K. Sport England introduced an active design for promoting physical activity in built environments to obtain a healthy built environment and achieve a healthy community [2,3,47,48,49,50,51,52,53,54,55]. Figure 3 illustrates the chronological trend of a healthy campus by the American College Health Association (2023) and active design by Sport England and A.I.A. The start of a healthy campus, from 1979 till now, continued and developed, focusing on the healthy campus framework (infrastructure, cornerstone, community, and culture) which sets forward an approach for creating a college culture that sees students’ success as mainly reliant on their health and well-being. Any campus may become a healthy campus by fostering a community and culture that places a high value on health and well-being. But the start of an active design after the growth of chronic diseases and obesity among people since 2005 mainly focuses on physical activity that keeps humans active and improves their well-being. The chronological combination between the two trends includes when and where they started, since the active design approach will be used to show it is a way of achieving a healthy campus and improving the environmental psychology of a campus.
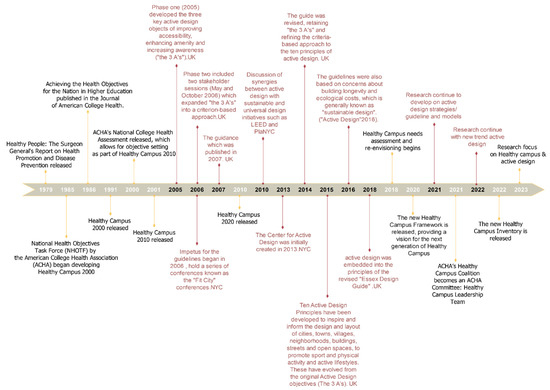
Figure 3.
Significant moments in healthy campus history data from American College Health Association 2023 with the active design approach. Timeline diagram (by the authors).
2. Materials and Methods
There are multiple methods to measure the environmental psychology of a built environment [20]. This study conducted a questionnaire survey and statistical analyses to identify students’ needs and fill the research gap. The questionnaire survey was designed from the new trend active design approach based on the physical activity definition, and the hypothesis is that physical activity has three categorisations, see Figure 1 and Figure 2, was used to show the relationship between environmental psychology (context and content) and a healthy built environment by determining its parameters based on the three forms of physical activity in the campus built environment. The total number of student participants was 428 from ten university campus built environments in the Kurdistan Region of Iraq of four different cities, Erbil, Dohuk, Sulaimani, Koya, and Zakho, which were selected as case studies to complete the questionnaire survey.
2.1. The Questionnaire Survey Design
The questionnaire was divided into three parts. Part one concerns the quality of students investigated by the demographic survey (gender, age, college, department, weight, marital status, living arrangements, having a chronic disease, playing sports, and hours and locations of exercises). Part two composed of three categories of physical activity that students perform either inside or outside of campus. First, physical activities (football, basketball, tennis, swimming, running, fitness/gym, work performance, and others) measured by frequency, duration, and intensity levels. Second, mentally active questions based on emotions about the activity measured by a five-point Likert scale agreement, and the last one is socially active (leisure time spent in cafeterias or restaurants, public spaces and green areas, libraries, event-hall spaces, theatres, and shopping market kiosks) measured by the frequency, duration, and importance levels of the activities for the students. The last part is open-ended questions about the university campus, the most active place, how it is active from the students’ point of view, and the positive and negative aspects of their university campuses.
2.2. Statistical Analyses
The data were analysed using the MedCalc Statistical Software, Version 20.218 (MedCalc Software Ltd., Ostend, Belgium; https://www.medcalc.org; accessed on 4 November 2022). Descriptive statistics, including n, mean, and frequency displays, were used to determine which components are most sought for. An ANOVA test was conducted for the comparison of means analysis of variance. This is a widely used statistical test that was first devised by Ronald Fisher in 1918. When utilised for data from three or more groups, ANOVA can reveal whether or not there are significant differences in mean scores. As a result, we needed to determine if there are statistically significant differences between the different data sets (types of physical activity) and used factor analysis to extract the most affected activity on students based on frequency. Statisticians use factor analysis to detect patterns or underlying factors in datasets and discover hidden variables impacting observable variables. Thus, factor analysis aims to explain observed variable variation by reducing them to fewer unseen components. Factor analysis estimates loadings of factors, which show how strongly each observable variable is related to each element. These loadings determine each variable’s factor contribution. The researcher usually chooses the number of components based on theoretical or statistical criteria [56].
3. Results
3.1. Demographic Survey
The questionnaire survey was distributed over 428 student participants from 10 university campuses in the Kurdistan region of four cities with different geographical territories. The participation rate was calculated based on the total student number in university campuses with 10%.
The questionnaires were randomly distributed to students from different universities and cities in various locations, sizes, and cultures. The female participants were more than the male participants, with percentages of 58.8% and 41.2%, aged 18–33 years old. The number of students with more than one year of experience on campus is 79.3%, the maximum number of participants, and the fresh students’ (first-year stage) rate is 4.8%. Other participants were those who went to university after the age of twenty-four, with a rate more than 15%. The weight of students ranged from 40–140 kg. Most students have an average weight range of 41–60 kg (48.2%), and those with a range of 61–80 kg (36.6%) are the students who are not interested in playing sports. The overweight students are categorised as ranging from 81–100 kg (12.1%), 101–120 kg (2.2%), and 121–140 kg (0.2%). This demonstrates that a low percentage of students are overweight, which does not indicate that they do not have any chronic diseases (Table 1).

Table 1.
Demographic survey.
Additionally, the percentage of hours students spend on sports per week is ≤1 h which is the maximum rate (42%), and ≥4 hours is the minimum rate (13.7%). Most students are interested in playing sports outside campus rather than inside campus, with a percentage of 74.6%; only 19.7% play sports inside the university campus, and 5.7% of the students, who are boys, play sports inside and outside the campus.
Regarding marital status, most students are single, with a rate of 91.7%. At the same time, many students live with their families in a house, at 78.8%. Only 18.6% of the students live in a campus dormitory, and a small percentage of the students living with their friends in rented apartments, at a rate of 2.6%. The results show that only 10.6% of the students suffer from chronic diseases (thyroid, arthritis, chronic kidney disease, liver disease, diabetes, and depression). The reason for this might be related to the fact that questionnaire forms are randomly distributed among students on university campuses.
Concerning playing sports, 58.2% of the students play sports, which is parallel to [57]’s conclusion that “campuses discouraged students from being physically active by missing out on opportunities—indoors and outdoors—for fostering movement, such as designating the greens for games or walks or providing enough lockers for bicycles”. These findings can be used to develop tailored public health interventions. The results illustrate that females participated more than males, more than half of the students perform activities outside of campus environments, and a few have a chronic disease. The number of students exercising decreased after COVID-19 [58,59]; moreover, 50% perform activities inside the building, 43.9% perform activities outside of the building, and only a small proportion, which is 6.1%, play sports in and out of the building.
3.2. Physical Activity Categories
3.2.1. Physical Activity
The physical activity types included in the questionnaire survey form are football, basketball, tennis, swimming, running, fitness/gym, walking, bicycling, exercise physiology (aerobic, yoga), and work performance (university activity participation). And each was measured in terms of frequency, repetition of an activity, which means how many times an activity was performed per week, duration, which is how long participants engaged in the activity for each session, particularly the length of time spent to perform each activity, and the last intensity level was “light, moderate, and vigorous”, which means the amount of physiological activity the participants’ experience in their body including their heart rate, respiration, and adrenaline. These were then analysed statistically, including a statistical description, by an ANOVA test and factor analyses.
Physical activities such as football, walking, and job performances were performed by most students on university campuses, while other activities were performed outside of campus based on individual ambitions. Most students prioritise physiology, swimming, and fitness/gym activities to shape their bodies and look beautiful. Additionally, sports like bicycling and jogging are performed by certain students interested in practising once for an hour per week. As shown in Table 1, it is apparent that just 19.7% of the students are active on campus, which is significantly less. The reason for this is that most of the campuses did not have the opportunity for students to be active; another reason for this is that the students who have a lab and practical lectures do not have the time for performing activities inside the campus. With regards to [60], these authors found that for students that do not work out, the reasons for this are a lack of time, energy, and inspiration to work out. Similar to [58], managing the education schedule to promote physical activity is crucial. Moreover, students engage in higher sedentary time at university by, for instance, sitting in lectures for a long time [61]. This indicates that time management, inspiration, and sedentary behaviour are essential factors that prevent students from being active.
Campus universities such as Case 1, Case 2, Case 3, and Case 4 have a College of Physical Education and Sport Sciences, which have all physical activities including “indoor and outdoor activities”, but Case 5, Case 6, and Case 10 have a football stadium that could be used for basketball and running too. Concerning Case 9, it has a basketball and tennis field that can be utilised by students whenever they are interested in doing so, but the last cases, Case 6 and Case 8, do not have any physical activities inside the campuses; they plan to add these activities in the future. These findings are consistent with [62], suggesting that implementing campus-wide physical activity programs can improve students’ psychological health and happiness. According to their data, anxiety, depression, and psychological discomfort decreased significantly before and after training. Physical activity interventions are essential for a campus to improve students’ mental health, as numerous studies have found a positive correlation between them [63,64,65]. It can be argued that the active design approach, through its strategies, promotes physical activity and could be applied to university campuses to increase physical activity in built environments and encourage students to be physically active.
Subsequently, in Table 2, in terms of how often they engage in these activities, students usually engage in three activities (1 h per week), indicating that three hours per week is the minimal frequency performed by students with low intensity, which is very low to demonstrate its adverse effects on students’ health. This illustrates that managing the time schedule for physical activity is crucial [58]. Hence, the mean for total physical activity frequency in Cases 1, 9, and 10 is 3.2, 3.6, and 3.4, respectively, nearly having the same result. However, other case studies have shown numbers below this range. For duration, the average time required to complete these routines, which might range from 1.32 h to 1.9 h, is relatively constant across all the case studies. Most students engage in physical activities, with the mean time ranging from an hour to over two hours.
Table 2.
One-way ANOVA analysis for determining the frequency, duration and intensity of the physical activity category among students.
Furthermore, the intensity level results illustrate that the percentage of people who engage in vigorously intensive physical activity, particularly in sports and fitness/gym, is low across all the groups. The median value is 1.9 while the mode is 1.2. If we compare the total mean of all the case studies, frequency is 2.5 repetitions of an activity, duration is 1.6 h per week, and intensity is 1.6, which is low to moderate. This indicates that physical activity on campus will gradually decline if the built environment is not improved in a way that promotes physical activity.
The increase in population indicates the importance of the active design approach application in a modern built environment.
Consequently, a significant correlation exists between the campus built environment and physical activity, parallel to the findings of [66]. The built environment on campus could indirectly impact the students’ ability to maintain a healthy level of physical activity. And for the ANOVA test (Table 2), the results are significant for physical activity, frequency, duration, and intensity, which are F (9.989; sig. 0.000), F (2.173; sig. 0.311), and F (9.129; sig. 0.000), respectively; if the p-value is < 0.05, the result is statistically significant, otherwise, it is not significant. Therefore, the university’s schedule is practically the same in all circumstances, and students’ activities are performed randomly rather than according to a set timetable.
3.2.2. Mentally Active
There were nine questions asked in statements on students’ point of view on emotions (mental) such as feeling good, comfortable, motivated, energy expended, depressed, anxious, stressed, safe, calm, and active in activities that they are performing daily and how they feel when they perform a physical activity, social activity, and their daily habits. In the end, an open-ended question was added to express their emotions on activities and a campus built environment, and the responses were measured by a five-point Likert scale of agreement.
Out of the 428 participants, only 2 participants were excluded and 426 answered positively. Case 1, Case 4, and Case 9 all have a mean of 4, as seen in Table 3. This demonstrates that they believe that physical activity is a great way to release stress, feel good, and get some exercise. Thus, the median is 3.8, and the mean is approximately the same in seven out of the ten case studies. According to the data, everyone agrees with these assertions. Students who responded to open-ended questions at the end of the survey reported feeling good and satisfied from increased social activity but not having enough time to engage in physical activity on campus [63,64,65,67].
Table 3.
One-way ANOVA analysis for determining the emotion side effect of the mentally active category among students.
Furthermore, psychological well-being is the primary indicator of environmental psychology [68]. Reduced interactions or exposures to the natural environment is associated with undesirable mental health outcomes because of the physiological and psychological advantages of contact with the natural environment. In addition, they highlighted the aesthetics of the constructed environment in the new building and the freshness of the gorgeous gardens. The status of the built environment in Case 1, Case 3, Case 4, and Case 5 comprises old (traditional) and new (moderate) buildings. In Case 2, the campus was designed as a project, and the construction of the material and design did not satisfy students, especially the interior design. Case 7 and Case 9 have a moderately built environment. Case 8 and Case 10 are new, but Case 10 gives importance to the interior design of the buildings. The active design approach should include an aesthetics strategy for the built environment, which has an indirect influence on human emotions via perception (eye), smell (nature, green plants), and touch (texture of employed materials).
As a result, individuals’ mental health may be affected by their agency level in shaping their built environment, both directly and indirectly. Direct paths include the elimination of environmental stressors and the promotion of social interactions in addition to aesthetics. In the end, the ANOVA test result (Table 3) is significant for mentally active student emotions on campus, which is F (4.027; sig 0.000), if a p-value of < 0.05 is statistically significant. So, there is a difference between the mean, which indicates the significance of mental activity in the campus built environment. This also differs across all the case study campus contexts, each with a particular mental impact.
3.2.3. Socially Active
The six social activities included in the questionnaire survey where students spend time with their friends are leisure activities (cafeterias and restaurants), public spaces (green areas, parks, and benches), libraries, event halls, theatres, and shopping market kiosks. These activities measured by frequency mean how many times they visit these spaces per day; the duration means how much time they spend there with their friends; the last measurement is the importance level of these activities to them (low, medium, and high). Also, an open-ended question was added, mentioning an activity not in the questionnaire form and their opinion on the social locations in the campus built environment (Table 4).
Table 4.
One-way ANOVA analysis for determining the frequency, duration and importance of the socially active category among students.
The results indicate that the average time students spent on campus social activities varied little between Case 8 (mean = 3.25), Case 9 (mean = 3.5), and Case 10 (mean = 3.0). In the other case studies, such as from Case 1 to Case 6, the mean for the number of times they visit social locations varies between 1.7 and 2.2 times per day, with Case 7 having the lowest mean at 1.2 (time spent in a social place). The results show that students in the first group, with a mean of more than 3, are more likely to spend time in places like cafeterias and restaurants on campuses with low-density students. Students in the second group, with a mean between 1.7 and 2.2, are less likely to spend time in these public spaces because they do not feel comfortable there. This shows that the location, the number of people in a space, and how it is designed affect student mentality. The third group has a mean score of 1.2 and comprises students who did not go to most public places due to poor indoor air quality and intense odours.
Regarding the duration (time periods) that students spend staying at social locations, the average length ranges from 1.39 to 2.1 h. Additionally, all universities follow the same break schedule, with a lunch break beginning at 12:00 and ending at 13:30, or a duration of almost 1.5 h. Another report [69] suggested that schools should incorporate more green areas to promote student engagement. This is consistent with the students’ demands for a greater green space and more gathering areas. As a consequence, students spend all of their spare time during breaks hanging out with friends.
Referring to how important social activities are for students, the results in Cases 1, 2, and 10 showed that most students were interested in social activities, with means of 1.70, 1.78, and 1.76, respectively. Case 3 (1.64), Case 5 (1.67), and the other case studies are less than the mean of 1.6. In the open-ended questions, students stated that the university should increase social activity locations with modern designs and new activities, such as cultural activities like festivals and competitions for students to participate in during lectures because they sometimes feel bored and tired in class, and most social locations are dense and old. The students’ mental health appears directly related to how significantly they interact with other people. In other words, the built environment affects how people interact with each other. Both planning and social behaviour have an effect on how students think and feel in a built environment.
The ANOVA test results are significant for social activity, frequency, duration, and importance level which are F (11,853; sig. 0.000), F (2.302; sig. 0.016), and F (4.486; sig. 0.000), respectively, if a p-value of < 0.05 is statistically significant, thus displaying the importance of social activities in the students’ daily life. This study highlights the significance of student participation in social activities, regardless of whether these spaces are inside or outside of the buildings. Also, there is a difference between the social activities of all the campuses. In terms of the built environment, the architect should consider the program, land use, landscape, and the locations of social interaction, passageways, and routes on campus, as these factors can contribute to an increase in the students’ feelings of belonging and well-being on campus. This demonstrates that they are more interested in socialising during their breaks than during physical activities. Remarkably, this shows that they all value having fun with their friends during their free time at the institution [70].
3.2.4. Factor Analyses for Physical Activity, Mentally Active and Socially Active
This research investigated the possibility that physical activity may be divided into three categories: those that are physically active (body), mentally active (emotions and mind), and socially active (group). Consequently, the hypothesis is significant. We used factor analysis and statistical methods to show the most prevalent student activity (behavioural observation) and the most important links between these activities:
- 1.
- Physical activity extraction:
In the questionnaire, physical activity asked about ten activities (football, basketball, tennis, swimming, running, fitness/gym, walking, bicycling, exercise physiology (aerobic, yoga), and work performance (university activity participation)).
The scree plot method determines the number of factors for each physical activity. The y-axis shows the total eigenvalue, and the x-axis indicates the number of physical activity components. The scree plot orders the eigenvalues from largest to smallest. The first three factors have eigenvalues of more than 1, extracted from three components. From the largest to the most minor, the values are 3.091, 1.455, and 1.053, respectively, as shown in the screen plot (Figure 4).
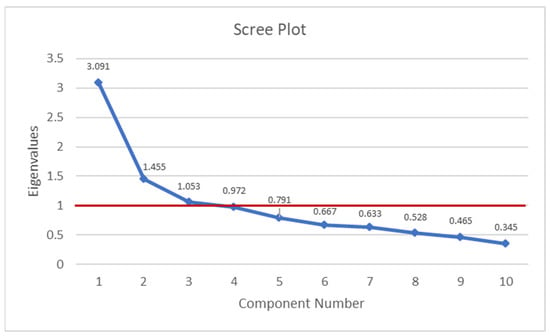
Figure 4.
Scree plot to determine the number of factors for each physical activity. The red line is eigenvalue fixed at one, its order from largest to smallest and blue line is physical activity components.
The eigenvalues change less markedly when more than nine factors are used. Therefore, Factors 4–9 appear to explain most of the variability in the data. The percentage of variability explained by Factor 1 is 3.091 or 30.91%. The rate of variability defined by Factor 3 is 1.053 or 10.53%. The scree plot shows that the first three factors account for most of the total variability in the data. The remaining factors account for a small proportion of the variability and are likely unimportant. Consequently, similar to the questionnaire findings, physical activity may play an essential role in improving the environmental psychology of the campus built environment and student health.
The Table 5 rotated component matrix extracted the ten factors into three components and the relation of each element with each other, Component 1, composed of six factors: swimming, tennis, basketball, working performance, exercise physiology, and football. According to this data, out of a total of six aspects, only two activities (tennis and football) were carried out primarily by students on campus. This indicates that students are more active outside university campuses. The second component has three factors (walking, running, and fitness/gym); walking is another factor students perform inside the university campus. The final component consists of a single factor, bicycling, which is performed by only a few students off campus due to their interest in participating in this activity. The results reveal that the lack of a bicycle lane in the transportation system is the reason students do not participate in it; consequently, there is no safety for students. Some students who reside in the countryside or in suburban areas, which are far from university campuses, utilise cars, taxis, and buses for transportation. Hostel-dwelling students walk to the buildings.
Table 5.
Extraction components of physical activity.
- 2.
- Mentally active extraction
The eight close-ended questions asked respondents how they felt about participating in various forms of physical and social activities. The number of elements associated with cognitive engagement is calculated using the scree plot method. The total eigenvalue is plotted on the y-axis, while the number of components is shown on the x-axis. Figure 5 shows a scree plot which sorts eigenvalues from most remarkable to most minor. More than one component was extracted, as demonstrated. When eight factors are employed, there is less of a drastic shift in the eigenvalues. This means that eight variables seem to account for the vast majority of the observed variance. Factor 1 accounts for 2.270, or 22.7%, of the total variance. Factor 2 accounts for 1.150, or 11.5%, of the total variance. The scatter plot reveals that the top two parameters explain almost 70% of the overall variation. The other components explain barely any of the variance and are hence probably irrelevant.
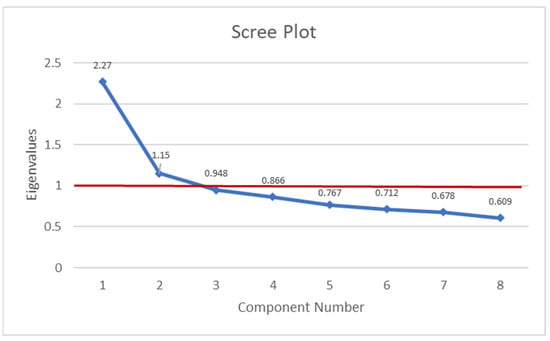
Figure 5.
Scree plot to determine the number of factors for mentally active category. The red line is eigenvalue fixed at one, its order from largest to smallest and blue line is mental activity components.
In Table 5, Component 1, shows that they feel anxious every four weeks and depressed when they do not do anything. The outcomes are similar to the answers they gave in the open-ended surveys, which include engaging in social activities and saying they feel this way during examinations. The other two factors are that they feel good when they are physically active and comfortable by walking. The second component factors are spending energy on daily activities such as assignments and exams with social activities, and the last one is their emotions about their health and motivation. The data suggest that, despite being aware of the health benefits of physical activities, students prioritise studying and socialising above maintaining a physically active lifestyle.
- 3.
- Socially active extraction
There are six queries in the questionnaire surveying public space regarding the frequency and duration of social activities with colleagues and the importance of these activities to them. The scree plot method determines the number of factors for being socially active. The y-axis shows the total eigenvalue, and the x-axis indicates the number of components (social activity). The scree plot orders the eigenvalues from largest to smallest. In scree plot Figure 6, as shown, one factor has been extracted, which is more than 1.
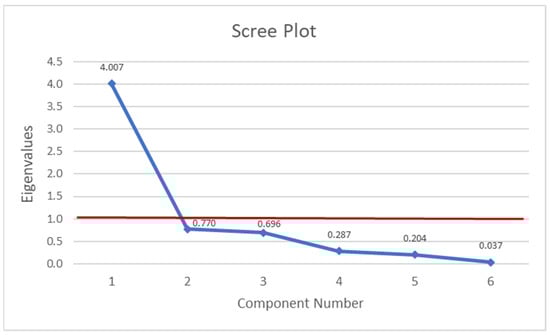
Figure 6.
Scree plot to determine the number of factors for social activity. The red line is eigenvalue fixed at one, its order from largest to smallest and blue line is social activity components.
The eigenvalues change less markedly when six factors are used. Therefore, only one aspect appears to explain most of the variability in the data. The percentage of variability explained by Factor 1 is 4.007 or 40.07%. There is only one factor: all items are consistent with a single theoretical framework. As an operational definition, this means they is one dimension or scale. The remaining factors account for a tiny proportion of the variability and are likely unimportant. It can be seen in Table 5 that there is only one factor and it cannot be rotated. This factor includes all social activities, leisure time (cafeterias and restaurants), public spaces (green areas, parks, and benches), theatres, event halls, shopping market kiosks, and libraries. If we compared this to the open-ended questionnaire survey, most of the students were interested in enjoying their free time at restaurants, cafés, and in public spaces such as gardens, parks, and resting on benches, then at shopping market kiosks after libraries, and the least preferred places were at event halls and theatres. Finally, the theoretical concept of environmental psychology may include valuing social activity within its scope to transform the built environment into a healthy one.
4. Discussion
As the physical world around us evolves and changes, so should our guiding principles and regulations. The needs and perspectives of users evolve as well. More people die each year from being overweight or from chronic diseases than from smoking cigarettes or from lack of physical activity. The current study is based on the active design promoting physical activity in a built environment to create a healthy environment for students to become active and healthy. This study’s primary hypothesis is that physical activity may be classified into three types: physically active (body), mentally active (emotions and mind), and socially active (group). The hypothesis was evaluated using a questionnaire and analysed using statistics software on the demands of students (demand for activities) who grow in a campus built environment and will be the world’s next generation. The results are significant.
As explained before, the environmental psychology of a campus built environment is defined as the context (campus environment) and content (student–environment relation) divided into three categories of physical activity: physically active, mentally active, and socially active. The question is, “Is the new approach to active design capable of improving the environmental psychology of the campus environment to achieve a healthy campus built environment?” Our study created a model based on active design parameters to answer this question.
The primary notion for active design is to create active behaviours among a society to achieve a healthy community that could be matched with the healthy behaviour theory [26]. Environmental psychology focuses on people’s social interactions with their surroundings, whereas the goal of active design is to encourage healthy behaviours by designing the built environment.
In contrast to what was expected, the findings revealed that students are interested in engaging in socially active behaviours despite knowing that physical activity benefits their physical and mental health, indicating a positive agreement with mentally active statements because of the positive relationship between the contexts (the campus environment) and the contents (the students’ environment relation). Similar to the students’ responses to the open-ended questions, they demonstrated a greater interest in social activities. They identified the campus cafés and restaurants, gardens, department entrances, and corridors as places where university students gather in groups and engage in social activities during break hours. Physical activity is a choice an individual makes, whereas social activity is the relationship between groups that psychologically impacts human health. There are considerable and dynamic interrelationships between these three activities at various health determinants, ranging from the individual (body) to environmental psychology; treatments are most likely to be effective when they seek factors at all levels. See Figure 7.
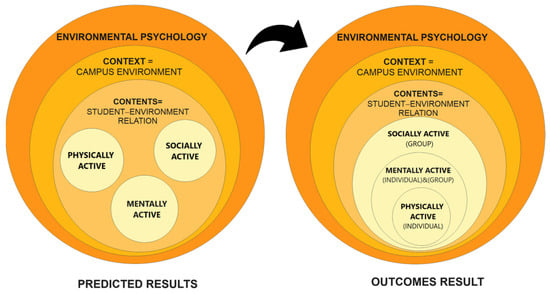
Figure 7.
Environmental psychology relation with active design approach result.
The demographic survey revealed that only 10% of the students have a chronic disease (thyroid, arthritis, chronic kidney disease, liver disease, diabetes, and depression) and that most students experience stress and anxiety regarding daily university activities, social activities, and communication. The contribution of this research, depicted in Figure 7, is that environmental psychology emphasises mental health in the direction of physical and social activity. The environmental psychology theory consists of the following components: phenomenology, ontology, arousal, stimulus load, behaviour constraint theory, adaption level, environmental stress, and ecological theory [31]. In contrast, the healthy behaviour theory is the starting point for an active design that can improve the environmental psychology of the campus built environment. To conclude, environmental psychology could be considered a component of the active design approach, which could be used to enhance social activities on campus and encourage students to engage in physical activity, thereby improving students’ physical and mental health.
This discussion shows that active design has a role in improving the environmental psychology of campus built environments. The active design could improve the campus built environment through their strategies at the level of urban and building designs.
Ten case studies were examined, which are located in different cities with different geographic locations, sizes, and cultures. All the buildings on Case 1’s, Case 3’s, and Case 4′s campuses, both old and new, were built gradually over time. Case 2 is the only campus that was simultaneously designed, constructed, and completed. Active design strategies could be implied to enhance physical activity at these campuses, such as land use mix, as all campuses include expansion lands for parks, open spaces, and recreational facilities. These facilities should be accessible to everyone, not just students in the Department of Sport and Science Education. Managing students’ timetables, designing pedestrian pathways connecting all spaces, and creating short pathways between buildings and activities should be implemented to encourage students to walk rather than sit and not participate in activities due to long distances. Programming streetscapes and a variety of social activities along the street enhances opportunities and reduces density in large campus areas.
The other campuses, Case 5, Case 6, Case 7, Case 8, and Case 9, are small-sized campuses that do not include all public facilities for students with high-density student populations. Physical activity could be enhanced by providing a walking environment for students, emphasising the garden and social amenities rather than a parking lot; perhaps a parking area covers a large area. Finally, social activities at most of the examined campuses should be developed and increased since students suffering from high-density and small areas feel uncomfortable. In small campuses, a public plaza could be utilised for multi-purpose activities and designed with a sitting area in the landscape with benches for socialising and completing assignments with friends. The last case, Case 10, is the only campus with a modern design, low student density, and several colleges and departments. It is a walkable campus with parking on each side, a public plaza in the centre, and a few social activities for students. It is the only contemporary campus that engages students but requires additional improvements.
Finally, active design approaches, particularly strategies for mental activity, should be improved because all campuses must stimulate emotions by attracting individuals to places with positive emotions through designs. There are some strategies mentioned in building design, such as appealing stairs and walking routes, that encourage movement. In urban design, by designing pathways, this section also requires developments using active design strategies. This issue will be solved in a future study to determine whether design components—like colour, artificial and natural lighting, vase plants, fresh air, etc.—indirectly influence human mentalities. Subsequently, the active design strategies support physical activity. These strategies could be implemented on university campuses to improve physical activity in built environments and encourage students to be active.
5. Conclusions
This study’s primary goal was to categorise the fundamental parameter of active design (physical activity) into separate groups to measure the demand for each in the community. The query is why physical activity declines as the population grows, causing obesity and chronic diseases. This study hypothesised that the main active design parameter, physical activity, has three categories, physically active (body), mentally active (emotions and mind) and socially active (group); its role in the environmental psychology of the campus built environment would have positive effects on students’ health and well-being. This possibility, tested by a questionnaire and analysed statistically, showed significant results. The three categories of physical activities are all interrelated, each at a different level of effect on environmental psychology and the built environment. As a result, the active design approach could be used to improve the environmental psychology toward a healthy campus built environment.
In other words, this study demonstrates the role of an active design approach (physical activity) in the environmental psychology of the campus built environment to produce a healthy environment for students’ well-being.
The following is a summary of the significance of the active design approach in the campus environmental psychology and the built environment:
- Observations indicate that only 19.7% of the university students engage in physical activity. Additionally, 74.6% of the students engage in physical activity off campus to modify their bodies and become more attractive, not because they want to be healthy. Only 5.7% of the male students who utilise the university’s football stadium engage in sports on and off campus. This suggests that university students are not physically active on campus for a variety of factors, including a lack of free time and the fact that not all physical activities are available to them on campus. The campus built environment could be healthier through active design strategies focusing on land use, pedestrian design, and measures to increase green spaces.
- The active design promotes physical activity in the built environment. Through testing the hypothesis, it was determined that physical activity could be categorised into three separate groups, and students are more interested in social activity and spending their break time with friends at campus social locations, which makes them happier than mental activities and physical activities that shape their bodies. Students’ health improves quickly and positively by introducing new social activities on campus. So, the university should consider how to make them socially engaged at university. Multiple social activities could be increased by adding social activity programs in small and large campus sizes, such as streetscape programming for large campuses to achieve multiple social activities. With a better emotional and mental health, students will be more motivated to engage in physical activity.
- Mentally active strategies should be established in active design strategies which consider that design elements indirectly affect human emotions and motivate positive or negative experiences, such as colour, lighting, both artificial and natural, vase plants, fresh air, etc.
- This study revealed that in all three activities (physically, mentally, and socially active), there are considerable and dynamic interrelationships between these three activities at various health determinant levels in university campus environmental psychology. They are essential in enhancing the campus built environment and students’ health. Finally, a model was developed to identify environmental psychology characteristics and their relationship with three types of physical activity.
- Determining what users desire (ambition) may lead to the formation of principles, regulations, and laws that help things grow and operate better. Because people’s opinions about things may also change over time, it is important to determine what users want.
6. Limitation and Future Study
The limitation of this study is that the active design strategies were explained in general rather than in detail and were categorised under three physical activities, and we used a single methodology to test the hypothesis. This could be amended in future research. In addition, three types of physical activity should be investigated in various countries to see whether the demands for these activities are the same or different worldwide.
Multiple future studies can be extracted from this study to develop active design strategies for mental and social activities by identifying design elements that impact health and well-being. Future investigations and matching between the active design theory and the environmental psychology theory might improve the temporal dimension of environmental psychology.
Author Contributions
S.A.A.: Collected data, prepared, analysed, and conceptualised the model, and wrote and prepared the original draft. F.A.M.: initiated and managed the project’s revision and edited and completed the manuscript. R.M.A.: supervised the methodology and statistical analyses, including the statistical description, ANOVA test, and factor analyses. All authors have read and agreed to the published version of the manuscript.
Funding
This research received no external funding.
Data Availability Statement
The data presented in this study generated or analyzed during this study are included in this article.
Acknowledgments
We gratefully appreciate the efforts of everyone who made this research project successful.
Conflicts of Interest
The authors declare no conflict of interest.
References
- Chen, W.; Zaid, S.M.; Nazarali, N. Environmental Psychology: The Urban Built Environment Impact on Human Mental Health. Plan. Malays. J. 2016, 23–28. [Google Scholar] [CrossRef]
- Active Design Guidelines: Promoting Physical Activity and Health in Design; New York City Department of Design and Construction: New York, NY, USA, 2010.
- Jennie Price Active Design: Planning for Health and Well-Being through Sport and Physical Activity; Sport England: Loughborough, UK, 2015.
- Day, K. Built environmental correlates of physical activity in China: A review. Prev. Med. Rep. 2016, 3, 303–316. [Google Scholar] [CrossRef] [PubMed]
- Brownson, R.C.; Hoehner, C.M.; Day, K.; Forsyth, A.; Sallis, J.F. Measuring the Built Environment for Physical Activity: State of the Science. Am. J. Prev. Med. 2009, 36, S99–S123.e12. [Google Scholar] [CrossRef] [PubMed]
- Fonseca, F.; Ribeiro, P.J.G.; Conticelli, E.; Jabbari, M.; Papageorgiou, G.; Tondelli, S.; Ramos, R.A.R. Built environment attributes and their influence on walkability. Int. J. Sustain. Transp. 2021, 16, 660–679. [Google Scholar] [CrossRef]
- Ewing, R.; Handy, S.; Brownson, R.C.; Clemente, O.; Winston, E. Identifying and Measuring Urban Design Qualities Related to Walkability. J. Phys. Act. Health 2006, 3, s223–s240. [Google Scholar] [CrossRef]
- Danaei, G.; Eric, L.D.; Dariush, M.; Ben, T.; Jürgen, R.; Christopher, J.L.M.; Majid, E. The Preventable Causes of Death in the United States: Comparative Risk Assessment of Dietary, Lifestyle, and Metabolic Risk Factors. PLoS Med. 2009, 6, e1000058. [Google Scholar] [CrossRef]
- Lam, T.M.; Vaartjes, I.; Grobbee, D.E.; Karssenberg, D.; Lakerveld, J. Associations between the built environment and obesity: An umbrella review. Int. J. Health Geogr. 2021, 20, 7. [Google Scholar] [CrossRef]
- White, F. Primary Health Care and Public Health: Foundations of Universal Health Systems. Med. Princ. Pract. 2015, 24, 103–116. [Google Scholar] [CrossRef]
- Altomonte, S.; Allen, J.; Bluyssen, P.M.; Brager, G.; Heschong, L.; Loder, A.; Schiavon, S.; Veitch, J.A.; Wang, L.; Wargocki, P. Ten questions concerning well-being in the built environment. Build. Environ. 2020, 180, 106949. [Google Scholar] [CrossRef]
- Institute of Medicine (US) Committee on Assuring the Health of the Public in the 21st Century The Future of the Public’s Health in the 21st Century; National Academies Press (US): Washington, DC, USA, 2002; ISBN 978-0-309-08622-6.
- Hamidi, S.; Sabouri, S.; Ewing, R. Does Density Aggravate the COVID-19 Pandemic? J. Am. Plan. Assoc. 2020, 86, 495–509. [Google Scholar] [CrossRef]
- Stevens, N.J.; Tavares, S.G.; Salmon, P.M. The adaptive capacity of public space under COVID-19: Exploring urban design interventions through a sociotechnical systems approach. Hum. Factors Ergon. Manuf. 2021, 31, 333–348. [Google Scholar] [CrossRef]
- Tootell, R.B.H.; Zapetis, S.L.; Babadi, B.; Nasiriavanaki, Z.; Hughes, D.E.; Mueser, K.; Otto, M.; Pace-Schott, E.; Holt, D.J. Psychological and physiological evidence for an initial ‘Rough Sketch’ calculation of personal space. Sci. Rep. 2021, 11, 20960. [Google Scholar] [CrossRef] [PubMed]
- Seidel, A.D.; Kim, J.T.; Tanaka, I.B.R. Architects, Urban Design, Health, and the Built Environment. J. Archit. Plan. Res. 2012, 29, 241–268. [Google Scholar]
- Schweitzer, M.; Gilpin, L.; Frampton, S. Healing Spaces: Elements of Environmental Design That Make an Impact on Health. J. Altern. Complement. Med. 2004, 10, S71–S83. [Google Scholar] [CrossRef] [PubMed]
- Gifford, R. Environmental Psychology Matters. Annu. Rev. Psychol. 2014, 65, 541–579. [Google Scholar] [CrossRef] [PubMed]
- Irwin, A. World Views in Psychology: Trait, Interactional, Organismic and Transactional Perspectives. In Handbook of Environmental Psychology; Krieger Publishing Company: Malabar, FL, USA, 1987. [Google Scholar]
- Handbook of Environmental Psychology; Wiley: Hoboken, NJ, USA, 2002; Available online: https://www.wiley.com/en-jp/Handbook+of+Environmental+Psychology-p-9780471405948 (accessed on 26 June 2023).
- Werner, C.M.; Altman, I.; Brown, B.B. A Transactional Approach to Interpersonal Relations: Physical Environment, Social Context and Temporal Qualities. J. Soc. Pers. Relatsh. 1992, 9, 297–323. [Google Scholar] [CrossRef]
- Dober: Campus Planning. Available online: https://scholar.google.com/scholar_lookup?title=Campus%20planning&author=R.P.%20Dober&publication_year=1996 (accessed on 6 April 2023).
- Uzzell, D. Education for Environmental Action in the Community: New roles and relationships. Camb. J. Educ. 1999, 29, 397–413. [Google Scholar] [CrossRef]
- DeClercq, C.P.; Cranz, G. Moving Beyond Seating-centered Learning Environments: Opportunities and Challenges Identified in a POE of a Campus Library. J. Acad. Libr. 2014, 40, 574–584. [Google Scholar] [CrossRef]
- Nutbeam, D. Health Promotion Glossary. Health Promot. Int. 1998, 13, 349–364. [Google Scholar] [CrossRef]
- Azeez, S.A.; Mustafa, F.A.; Ahmed, R.M. A Meta-Analysis of Evidence Synthesis for a Healthy Campus Built Environment by Adopting Active Design Approaches to Promote Physical Activity. Buildings 2023, 13, 1224. [Google Scholar] [CrossRef]
- Xu, S.; Li, W.; Cheng, B. Study on Campus Planning from the Perspective of Environmental Behavior—Taking Southwest University of Science and Technology in Mianyang, Sichuan Province as an Example. Open J. Soc. Sci. 2021, 9, 326–333. [Google Scholar] [CrossRef]
- Piggin, J. What Is Physical Activity? A Holistic Definition for Teachers, Researchers and Policy Makers. Front. Sports Act. Living 2020, 2, 72. [Google Scholar] [CrossRef]
- DeClercq, C. Toward the Healthy Campus: Methods for Evidence-Based Planning and Design. Plan. High. Educ. 2016, 44, 86–97. [Google Scholar]
- Tam, K.-P.; Milfont, T.L. Towards cross-cultural environmental psychology: A state-of-the-art review and recommendations. J. Environ. Psychol. 2020, 71, 101474. [Google Scholar] [CrossRef]
- Stokols, D. The paradox of environmental psychology. Am. Psychol. 1995, 50, 821–837. [Google Scholar] [CrossRef]
- Pronello, C.; Gaborieau, J.-B. Engaging in Pro-Environment Travel Behaviour Research from a Psycho-Social Perspective: A Review of Behavioural Variables and Theories. Sustainability 2018, 10, 2412. [Google Scholar] [CrossRef]
- Sime, J.D. What is environmental psychology? Texts, content and context. J. Environ. Psychol. 1999, 19, 191–206. [Google Scholar] [CrossRef]
- Elrafie, N.S.S.; Hassan, G.F.; El Fayoumi, M.A.; Ismail, A. Investigating the perceived psychological stress in relevance to urban spaces’ different perceived personalities. Ain Shams Eng. J. 2023, 14, 102116. [Google Scholar] [CrossRef]
- Veitch, R.; Arkkelin, D. Environmental Psychology: An Interdisciplinary Perspective; Prentice Hall: Hoboken, NJ, USA, 1995; ISBN 978-0-13-739954-3. [Google Scholar]
- Pelgrims, I.; Devleesschauwer, B.; Guyot, M.; Keune, H.; Nawrot, T.S.; Remmen, R.; Saenen, N.D.; Trabelsi, S.; Thomas, I.; Aerts, R.; et al. Association between urban environment and mental health in Brussels, Belgium. BMC Public Health 2021, 21, 635. [Google Scholar] [CrossRef]
- Cassidy, T. Environmental Psychology: Behaviour and Experience in Context. Available online: https://www.taylorfrancis.com/books/mono/10.4324/9780203940485/environmental-psychology-tony-cassidy (accessed on 26 June 2023).
- Bell, P.A. Environmental Psychology; Harcourt Brace College Publishers: San Diego, CA, USA, 1996; ISBN 978-0-15-501496-1. [Google Scholar]
- Environmental Psychology: An Introduction, 2nd ed.; Wiley: Hoboken, NJ, USA, 2019; Available online: https://www.wiley.com/en-ie/Environmental+Psychology%3A+An+Introduction%2C+2nd+Edition-p-9781119241089 (accessed on 26 June 2023).
- Gruenewald, P.J.; Remer, L.G.; LaScala, E.A. Testing a social ecological model of alcohol use: The California 50-city study. Addiction 2014, 109, 736–745. [Google Scholar] [CrossRef]
- Bonnes, M.; Bonaiuto, M. Environmental Psychology: From Spatial-Physical Environment to Sustainable Development. In Handbook of Environmental Psychology; Bechtel, R.B., Churchman, A., Eds.; John Wiley & Sons.: New York, NY, USA, 2002; pp. 28–54. [Google Scholar]
- Taylor, J.C. Paul Roberts, Isabelle University Planning and Architecture: The Search for Perfection; Routledge: London, UK, 2010; ISBN 978-0-203-84635-3. [Google Scholar]
- Hajrasouliha, A. Campus score: Measuring university campus qualities. Landsc. Urban Plan. 2017, 158, 166–176. [Google Scholar] [CrossRef]
- Chapman, M.P. American Places: In Search of the Twenty-First Century Campus; American Council on Education/Praeger series on higher education; Praeger Publishers: Westport, CT, USA, 2006; ISBN 978-0-275-98523-3. [Google Scholar]
- American College Health Association. The Healthy Campus Framework; American College Health Association: Silver Spring, MD, USA, 2023; Available online: https://www.acha.org/HealthyCampus/Framework/The_Healthy_Campus_Framework/HealthyCampus/Framework.aspx?hkey=494334db-0087-43b3-81d0-7e7ca7ab1117 (accessed on 24 May 2023).
- McLeroy, K.R.; Bibeau, D.; Steckler, A.; Glanz, K. An Ecological Perspective on Health Promotion Programs. Health Educ. Q. 1988, 15, 351–377. [Google Scholar] [CrossRef]
- Bloomberg, M.; Burney, D.; Farley, T.; Sadik-Khan, J. Active Design Guidelines. 2010. Available online: https://www.nyc.gov/assets/planning/download/pdf/plans-studies/active-design-guidelines/adguidelines.pdf (accessed on 24 December 2020).
- Sport England. Active Design The Role of Master Planning|Phase 1; Sport England: Loughborough, UK, 2005; p. 68. Available online: https://sportengland-production-files.s3.eu-west-2.amazonaws.com/s3fs-public/active-design-phase-1-sept-2005.pdf (accessed on 22 July 2023).
- Sport England Active Design Checklist. Available online: https://sportengland-production-files.s3.eu-west-2.amazonaws.com/s3fs-public/active-design-checklist-oct-2015.pdf (accessed on 20 March 2021).
- Sallis, J.F.; Linton, L.; Kraft, M.K. The first Active Living Research Conference: Growth of a transdisciplinary field. Am. J. Prev. Med. 2005, 28, 93–95. [Google Scholar] [CrossRef] [PubMed]
- Gebel, K.; King, L.; Bauman, A.; Vita, P.; Gill, T.; Rigby, A.; Capon, A. Creating Healthy Environments—A Review of Links between the Physical Enviornment, Physical Activity and Obesity; NSW Centre for Overweight and Obesity, NSW Centre for Physical Activity and Health, NSW Centre for Public Health Nutrition: Sydney, Australia, 2005; ISBN 978-1-921186-00-4. Available online: https://ses.library.usyd.edu.au/bitstream/handle/2123/16805/2005_creating_healthy_environments.pdf?sequence=1&isAllowed=y (accessed on 22 July 2023).
- Silver, L.; Bell, F. Fit-City 2: Promoting Physical Activity through Design. New York City Department of Health and Mental Hygiene and AIA. Wayback Machine. Available online: https://archive.org (accessed on 20 March 2021).
- Robbins, J.L. A New Design Movement That Can Help Us Beat Obesity. Available online: https://www.fastcompany.com/1663272/a-new-design-movement-that-can-help-us-beat-obesity (accessed on 16 March 2023).
- Lacasse, M.; Nienaber, S. Get Active: Implement Active Design in Your Neighborhoods and Open Spaces; Center for Active Design & GGLO Design: New York, NY, USA, 2015. [Google Scholar]
- Bustler FitCity 10: Promoting Physical Activity through Design. Available online: https://bustler.net/events/latest/6401/fitcity-10-promoting-physical-activity-through-design (accessed on 17 March 2023).
- Ahmed, R.M.; O Abdullah, M.; Altun, Y. Comparison Between Factor Analysis and Cluster Analysis to Determine the Most Important Affecting Factors for Students’ Admission and Their Interests in The Specializations: A Sample of Salahaddin University-Erbil. ZANCO J. PURE Appl. Sci. 2022, 34, 12–23. [Google Scholar] [CrossRef]
- Von Sommoggy, J.; Rueter, J.; Curbach, J.; Helten, J.; Tittlbach, S.; Loss, J. How Does the Campus Environment Influence Everyday Physical Activity? A Photovoice Study Among Students of Two German Universities. Front. Public Health 2020, 8, 561175. [Google Scholar] [CrossRef]
- Wong, M.-Y.C.; Fung, H.-W.; Yuan, G.F. The Association between Physical Activity, Self-Compassion, and Mental Well-Being after COVID-19: In the Exercise and Self-Esteem Model Revised with Self-Compassion (EXSEM-SC) Perspective. Healthcare 2023, 11, 233. [Google Scholar] [CrossRef]
- Mir, I.A.; Ng, S.K.; Jamali, M.N.Z.M.; Jabbar, M.A.; Humayra, S. Determinants and predictors of mental health during and after COVID-19 lockdown among university students in Malaysia. PLoS ONE 2023, 18, e0280562. [Google Scholar] [CrossRef]
- Jambusaria, S.; Berry, S.; Sanghvi, S.; Bhadra, S. Research Paper on Physical Activity and Fitness Patterns among University Students in Mumbai. Int. J. Adv. Res. Ideas Innov. Technol. 2020, 6, 568–575. [Google Scholar]
- Castro, O.; Bennie, J.; Vergeer, I.; Bosselut, G.; Biddle, S.J.H. How Sedentary Are University Students? A Systematic Review and Meta-Analysis. Prev. Sci. 2020, 21, 332–343. [Google Scholar] [CrossRef]
- Dejonge, M.L.; Jain, S.; Faulkner, G.E.; Sabiston, C.M. On campus physical activity programming for post-secondary student mental health: Examining effectiveness and acceptability. Ment. Health Phys. Act. 2021, 20, 100391. [Google Scholar] [CrossRef]
- Rodríguez-Romo, G.; Acebes-Sánchez, J.; García-Merino, S.; Garrido-Muñoz, M.; Blanco-García, C.; Diez-Vega, I. Physical Activity and Mental Health in Undergraduate Students. Int. J. Environ. Res. Public Health 2022, 20, 195. [Google Scholar] [CrossRef] [PubMed]
- Shahadan, S.Z.; Bolhan, N.S.; Ismail, M.F.M. The Association between Physical Activity Status and Mental Wellbeing among Overweight and Obese Female University Students. MJMHS 2022, 18, 80–86. [Google Scholar] [CrossRef]
- Zhang, Z.; He, Z.; Qian, J.; Qi, X.; Tong, J. Relationship Between Mindfulness and Physical Activity in College Students: The Mediating Effect of Eudaimonic Well-Being. Percept. Mot. Ski. 2023, 130, 863–875. [Google Scholar] [CrossRef] [PubMed]
- Lu, Z.; Li, Z.; Mao, C.; Tan, Y.; Zhang, X.; Zhang, L.; Zhu, W.; Sun, Y. Correlation between Campus-Built Environment and Physical Fitness in College Students in Xi’an—A GIS Approach. Int. J. Environ. Res. Public Health 2022, 19, 7948. [Google Scholar] [CrossRef] [PubMed]
- LaBelle, B. Positive Outcomes of a Social-Emotional Learning Program to Promote Student Resiliency and Address Mental Health. Contemp Sch. Psychol 2023, 27, 1–7. Available online: https://link.springer.com/article/10.1007/s40688-019-00263-y (accessed on 26 June 2023). [CrossRef]
- Beemer, C.J.; Stearns-Yoder, K.A.; Schuldt, S.J.; Kinney, K.A.; Lowry, C.A.; Postolache, T.T.; Brenner, L.A.; Hoisington, A.J. A brief review on the mental health for select elements of the built environment. Indoor Built Environ. 2021, 30, 152–165. [Google Scholar] [CrossRef]
- El-Darwish, I.I. Enhancing outdoor campus design by utilizing space syntax theory for social interaction locations. Ain Shams Eng. J. 2022, 13, 101524. [Google Scholar] [CrossRef]
- Mouratidis, K. Built environment and social well-being: How does urban form affect social life and personal relationships? Cities 2018, 74, 7–20. [Google Scholar] [CrossRef]


Disclaimer/Publisher’s Note: The statements, opinions and data contained in all publications are solely those of the individual author(s) and contributor(s) and not of MDPI and/or the editor(s). MDPI and/or the editor(s) disclaim responsibility for any injury to people or property resulting from any ideas, methods, instructions or products referred to in the content. |
© 2023 by the authors. Licensee MDPI, Basel, Switzerland. This article is an open access article distributed under the terms and conditions of the Creative Commons Attribution (CC BY) license (https://creativecommons.org/licenses/by/4.0/).