Abstract
A stochastic earthquake ground motion database comprising twelve groups of simulated ground motions was introduced. Ground motions were generated using the stochastic semi-physical model of earthquake ground motions, based on a cluster analysis of 7778 recorded earthquake ground motion. All twelve groups of simulated earthquake ground motions were validated through the probability density evolution method (PDEM) by comparing their time histories and response spectra. As an application of the proposed database, an 18-story reinforced concrete (RC) frame-shear wall structure was analyzed using one group of simulated earthquake ground motions. The probability densities of the top displacement of the structure were estimated using PDEM, highlighting the significant stochasticity of the structural response. The seismic reliability of the structure was assessed by evaluating the extreme value distribution of the story drift angle. The investigations indicate that the proposed stochastic earthquake ground motion database effectively captures the inherent stochasticity of ground motions. Moreover, it contributes to enhancing the efficiency of reliability assessments for structures.
1. Introduction
The stochasticity of earthquake ground motions exerts a significant influence on the response of structures to strong-motion earthquakes. However, the prevailing practice in seismic codes worldwide is to rely on a limited number of recorded or simulated earthquake ground motions for the seismic analysis of structures, which falls short of capturing the inherent stochastic nature of ground motions. To unravel this inherent stochastic behavior, a substantial number of earthquake ground motion records are required. Therefore, a substantial number of earthquake ground motions are required for screening. Over the past few years, tens of thousands of earthquake ground motions have been recorded, processed, and analyzed. Two prominent open earthquake ground motion databases have been widely utilized. The first is the Next Generation Attenuation (NGA) database [1,2,3,4], developed by the Pacific Earthquake Engineering Research Center (PEER). The second is the database compiled from the K-NET and KIK-NET seismographic network [5,6] in Japan. These two databases contain a vast number of recorded earthquake ground motions. Despite the extensive utilization of current earthquake ground motion databases, they exhibit two significant limitations that restrict their practical application. Primarily, a notable constraint arises from the absence of simulated ground motions. In numerous seismic design regions, conventional earthquake ground motion records are deficient, and even when available, they do not ensure that future earthquakes will resemble past historical earthquakes. Therefore, the inclusion of simulated ground motions is imperative for the seismic design of structures. Second, the ground motion data contained in these databases lack adequate refinement into distinct categories. The effectiveness of data retrieval for engineers can be enhanced by implementing a refined grouping system for recorded earthquake ground motions. To address the limitations inherent in current earthquake ground motion databases, it is crucial to develop a stochastic earthquake ground motion database that incorporates simulated ground motions and further refines them into specific groups.
In most seismic resistance codes, ground-motion records are commonly classified according to the local site where accelerographs are deployed at the station [7,8,9,10]. Additionally, some researchers have classified ground motion records based on their spectral properties [11,12]. Naeim and Anderson focused on classifying ground motions to determine and rank their damage potentials [13]. With the exponential increase in the availability of ground motion records, cluster analysis has emerged as an unsupervised method for classification. Alimoradi et al. proposed a fuzzy C-means classification approach utilizing six indicators for categorizing strong ground motion records [14]. Yaghmaei-Sabegh classified ground motion records using K-means and self-organizing map algorithms [15]. Ding et al. developed a k-means cluster analysis method to group ground motion records based on magnitude and propagation distance. In their approach, ground motion records were initially classified according to the average shear wave velocity down to 30 m (vs30), as specified in Minimum Design Loads for Building and Other Structures ASCE7-2010, before conducting the cluster analysis [16]. Among these approaches, the technique proposed by Ding et al. [16] stands out for its simple and practical attributes.
Although the abundance of recorded earthquake ground motions offers a unique and invaluable collection for studying strong ground motions, it does not encompass all possible recording conditions required to represent a comprehensive observational basis for engineering design. Furthermore, significant variability in the characteristics of recorded earthquake ground motions, even under similar conditions, underscores the need to characterize future shaking using an ensemble of accelerograms rather than relying solely on one or two “typical” records. These factors have prompted the need for a database that incorporates both recorded and simulated ground motions. Furthermore, to assess the reliability of structures under earthquake ground motions, it is essential to conduct repeated seismic analyses that consider the stochastic nature of these motions. However, this process is time-consuming due to the vast number of ground motions that need to be considered. Therefore, there is a need for a smaller set of simulated ground motions that provide complete probability information to efficiently evaluate structural reliability. Wang and Li proposed a physical stochastic function model for earthquake ground motion based on the underlying physical mechanisms of earthquakes [17]. Building upon their work, Song and Ding et al. further advanced the stochastic semi-physical model of earthquake ground motions by introducing four empirical random parameters to account for the stochastic nature of propagation paths [18,19]. This model exhibits a significant advantage over dimension-reduction models for earthquake ground motions and enhances its applicability in reliability assessments when integrated with PDEM [20,21,22,23]. Therefore, the stochastic semi-physical model appears suitable for generating earthquake ground motions and establishing a stochastic earthquake ground motion database.
Taking into account the aforementioned considerations, Ding et al. proposed an extensive earthquake ground motion database encompassing both categorized recorded ground motions and simulated ground motions [24]. In this study, we focus on the validation and application of the simulated earthquake ground motion database. The organization of the subsequent sections of this study is as follows. Section 2 offers a concise introduction to clustered earthquake ground motion records, which are utilized to generate earthquake ground motions and validate simulated earthquake ground motions. The database of stochastic earthquake ground motions was introduced in Section 3, which includes the simulation and validation of stochastic earthquake ground motions. In Section 4, we demonstrate the practical application of the database by analyzing an 18-story reinforced concrete frame-shear wall structure subjected to a selected group of simulated earthquake ground motions derived from the proposed database. The structural response, specifically the top displacement response and the maximum story drift angle, is evaluated using the probability density evolution method (PDEM) [20,21,22,23]. Furthermore, the dynamic reliability of the structure is assessed.
2. Recorded Earthquake Ground Motions
The stochastic earthquake ground motion database is constructed using a repository of recorded earthquake ground motions. The determination of random parameters for generating stochastic earthquake ground motions relies on these recorded earthquake ground motions. Furthermore, all simulated earthquake ground motions must undergo validation by comparing them with recorded ones. Consequently, an initial database of recorded earthquake ground motions was established, encompassing a substantial collection of recorded earthquake events.
A total of 7778 recorded earthquake ground motions from the NGA West2 database, provided by the Pacific Earthquake Engineering Center (PEER), were classified into four groups based on the site types defined in the Chinese Code for Seismic Design of Buildings (GB 50011-2010). The vs30s for site types I, II, III, and IV are as follows: >550 m/s, 265–550 m/s, 165–265 m/s, and <165 m/s, respectively [25]. Subsequently, the earthquake ground motions within each site-based group were further clustered into three subgroups, taking magnitude and epicentral distance as cluster attributes using the K-means clustering method. These three subgroups for each site type were labeled as follows: small earthquake and near-field (Group 1), large earthquake and near-field (Group 2), and large earthquake and far-field (Group 3). Ultimately, the 7778 recorded earthquake ground motions were classified into a total of 12 groups. The number of recorded earthquake ground motions in each group is presented in Table 1, while Figure 1 illustrates the mean acceleration response spectrum for each group.

Table 1.
Groups of recorded earthquake ground motions.
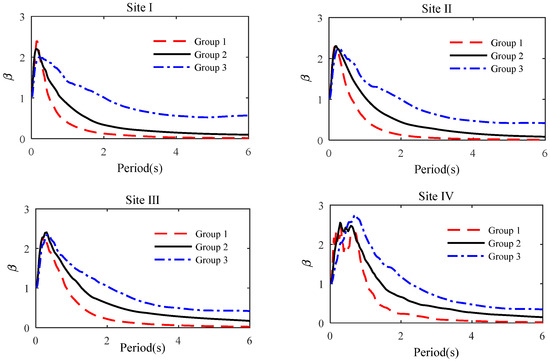
Figure 1.
Mean Fourier amplitude spectra of the 12 groups of recorded earthquake ground motions.
It is noteworthy that the peak accelerations of all acceleration time histories have been normalized to 0.1 g to ensure consistent demand. Let and denote the original and normalized acceleration time histories, respectively. The normalization of the acceleration time history is expressed as:
As a result, the mean spectrum predominantly reflects the spectral characteristics of the earthquake ground motions rather than the peak accelerations. Figure 1 illustrates significant differences in the spectral properties among the twelve groups of earthquake ground motions. Moreover, it is observed that the long-period component of earthquake ground motion expands as the earthquake magnitude and propagation distance increase. The outcomes of cluster analysis serve as a valuable reference for engineers in the selection of ground-motion records based on specific site conditions, magnitudes, and propagation distances.
3. Database of Stochastic Earthquake Ground Motions
3.1. Simulation of Stochastic Earthquake Ground Motions
The generation of earthquake ground motions was accomplished using the stochastic semi-physical model of earthquake ground motions [17,18,19]. In this model, the acceleration time history of the earthquake ground motion is depicted by employing the inverse Fourier transform, utilizing the amplitude and phase spectra.
in which, is a vector comprising nine random variables specific to the semi-physical model, is the amplitude parameter, measured in meters per second (m/s); is the Brune source parameter describing the decay process of the fault rupture, measured in second (s); is the equivalent damping ratio of the local site, which is dimensionless; is the equivalent predominate circular frequency of the local site, measured in radians per second; is the epicentral distance, measured by meters (m). are empirical parameters associated with the path.
The simulation of stochastic earthquake ground motions based on the semi-physical model of earthquake ground motions is illustrated in Figure 2 through a flow chart. The probability density functions (PDFs) of the nine random variables are determined utilizing the moment estimation method based on the twelve groups of recorded earthquake ground motions introduced in Section 2. A set of sample values for all nine random parameters was extracted from a single recorded earthquake ground motion. The sample values of each random parameter, obtained from a specific group of recorded earthquake ground motions, were combined to derive its PDF corresponding to that group, utilizing the moment estimation method. As a result, each random variable has twelve distinct PDFs corresponding to the twelve groups of recorded earthquake ground motions. Random parameters associated with the amplitude spectrum and phase spectrum are identified based on the Fourier amplitude spectrum and the phase difference of the recorded accelerations, respectively. The specific PDFs for each of the nine random variables can be found in reference [26].
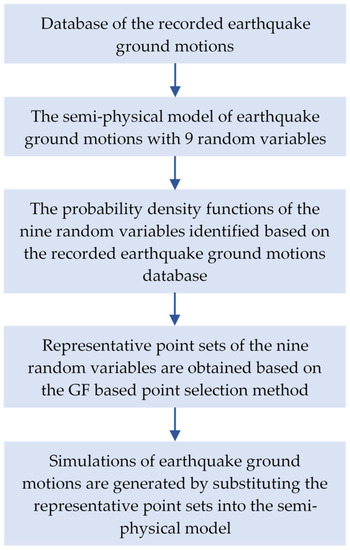
Figure 2.
Flow chart of the simulation process of stochastic earthquake ground motions.
The GF-based point selection method [27] is employed to generate representative point sets of the nine random variables. In this method, GF (Generalized F-discrepancy) is employed as a suitable metric to evaluate the uniformity of the generated point sets. Each representative point is assigned a probability, called an assigned probability, based on the Voronoi cells. A total of twelve representative point sets are created, with each set containing one hundred points. The sum of the assigned probabilities for the one hundred points in a single group is 1, as the combined space of their Voronoi cells represents the entire probability space.
These twelve representative point sets of the nine random variables were substituted into the semi-physical model of earthquake ground motions. Subsequently, twelve sets of earthquake ground motions were generated. Figure 3 displays the three representative acceleration time histories obtained from these simulations. In order to further illustrate the inherent stochastic characteristics of the earthquake ground motion database, the frequency distributions of durations, normalized peak accelerations, and periods corresponding to the maximum spectral accelerations of all one hundred simulated earthquake ground motions at Site III, Group 1 are presented in Figure 4. Notably, the figures exhibit significant stochasticity with regard to peak accelerations, durations, and spectral properties among the simulated ground motions.
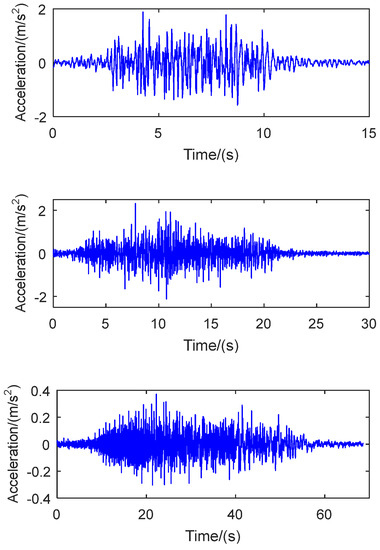
Figure 3.
Typical acceleration time histories of simulated earthquake ground motions.
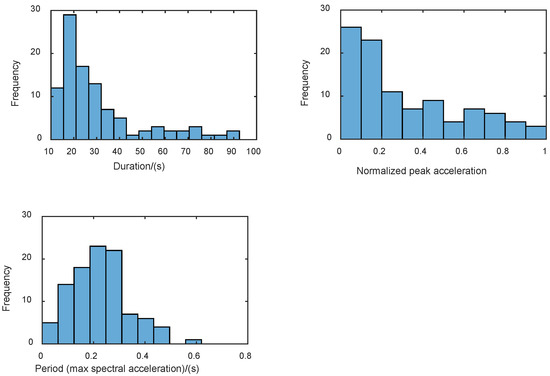
Figure 4.
Frequency distributions of durations, normalized peak accelerations, and periods corresponding to the maximum spectral accelerations of ground motions at Site III, Group 1.
3.2. Validation of the Simulated Earthquake Ground Motions
It is crucial to note that each simulated earthquake ground motion is assigned a probability, ensuring that the sum of the assigned probabilities for all simulated motions within the same group totals 1. As a result, the probabilistic nature of the simulated earthquake ground motions within a group is well defined. This characteristic enables the direct utilization of simulated motions in evaluating the dynamic reliability of structures using the PDEM approach. Therefore, the time histories and response spectra of these simulated motions were analyzed using PDEM. This analysis allowed us to obtain their mean, standard deviation, and probability density at any given time or period. The results were then compared with those of the recorded earthquake ground motions to validate the effectiveness of the semi-physical model of earthquake ground motions employed in this study.
In this study, the simulated earthquake ground motions of Site III, Group 1 are utilized as an illustrative example. To ensure consistent demand, the PGAs of both the recorded and simulated earthquake ground motions are normalized to 0.1 g. Figure 5 shows a comparison of the mean and standard deviation between the simulated and recorded acceleration time histories. Notably, the mean and standard deviation of the recorded and simulated acceleration time histories exhibit remarkable agreement, indicating strong correspondence between the two datasets. Figure 6 shows the PDFs of the accelerations for the simulated earthquake ground motions at various time instants. It is illustrated that the PDF shape exhibits considerable variability across different time instants. Figure 7 provides a comparative analysis of the PDFs of accelerations for both simulated and recorded earthquake ground motions at different time instants. The results demonstrate strong agreement between the simulated and recorded ground motion time histories in terms of PDF characteristics.
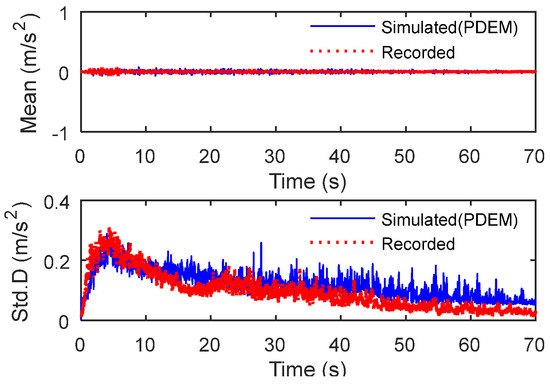
Figure 5.
Comparison of the mean and standard deviation of acceleration time histories between simulated and recorded earthquake ground motions.
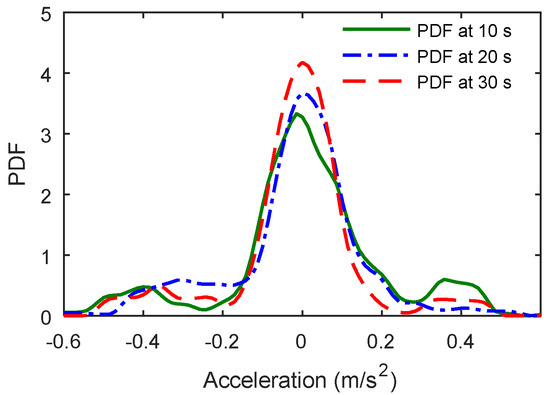
Figure 6.
Typical PDFs of accelerations of simulated earthquake ground motions at different time instants.
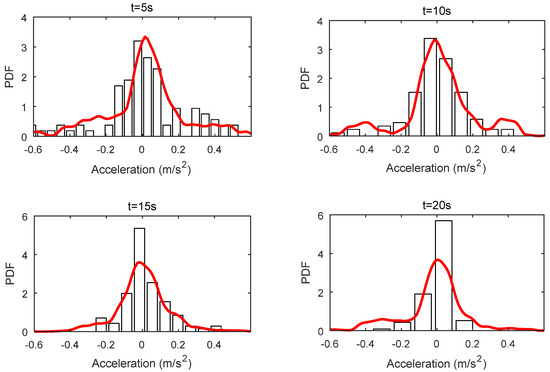
Figure 7.
Comparison of PDF of accelerations between simulated and recorded earthquake ground motions at different time instants.
Figure 8 illustrates a comparison of the response spectra, specifically the mean and standard deviation, between the simulated and recorded earthquake ground motions. The results indicate strong agreement in both the mean and standard deviation. Furthermore, utilizing the PDEM, the probability densities of Sa(0.2) and Sa(1.2), along with the corresponding statistical histogram of the response spectra for recorded ground motions, are calculated and depicted in Figure 9. Notably, the probability densities and statistical histograms exhibit a high level of coherence, particularly during typical periods. This finding suggests that the proposed stochastic physical model aligns well with practical engineering applications. By combining the comparative studies of ground motion time histories depicted in Figure 5, Figure 6 and Figure 7, it is demonstrated that the statistical characteristics of both the simulated ground motion time histories and response spectra effectively mirror those of the recorded data.
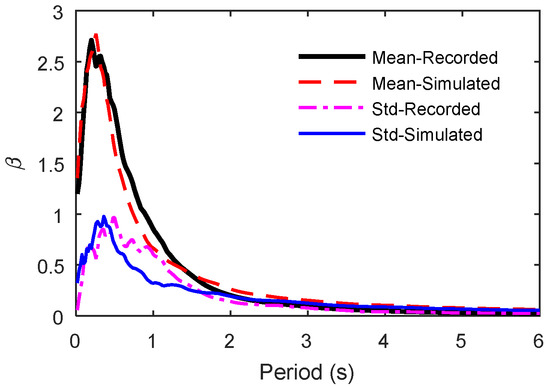
Figure 8.
Comparison of the mean and standard deviation of response spectra between simulated and recorded earthquake ground motions.
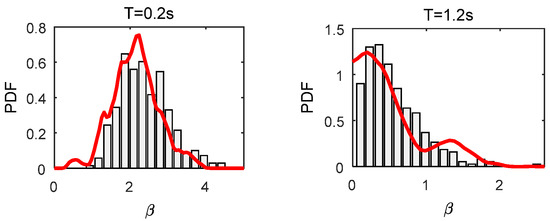
Figure 9.
Comparison of the spectral acceleration PDF between simulated and recorded earthquake ground motions at different periods.
Comparative studies were conducted on the remaining eleven groups of recorded and simulated earthquake ground motions, which yielded similar conclusions to those drawn for Site III, Group 1. This confirmed the effectiveness of the stochastic semi-physical model of earthquake ground motions. Moreover, the simulated ground motion database contains fewer ground motions compared to the recorded ground motion database, resulting in significant time savings during the stochastic seismic analysis of structures.
As a result, a database of stochastic earthquake ground motions was created, consisting of twelve groups of simulated ground motions. Each group contains one hundred simulated earthquake ground motions. All the groups are labeled based on the site type, magnitude level, and propagation distance, allowing for selection based on the specific earthquake conditions at the building’s location.
4. Reliability Assessment Based on the Proposed Stochastic Earthquake Ground Motion Database
In order to demonstrate the practical application of the stochastic earthquake ground motion database, an 18-story reinforced concrete frame-shear wall structure was selected for analysis as a representative case study. A specific group of stochastic earthquake ground motions was carefully chosen based on seismic conditions specific to the location of the building. This group of stochastic earthquake ground motions was then utilized to perform a comprehensive seismic analysis and reliability estimation of the structure.
4.1. Overview of an RC Frame-Shear Wall Structure
The 18-story reinforced concrete frame-shear wall structure was located in Xi’an city, Shaanxi province, China. The structural layout plan of a typical floor is depicted in Figure 10. The overall height of the frame-shear wall structure is 54.9 m. For a more comprehensive understanding, detailed information regarding the stories, including their respective heights, loads, and concrete strength, is provided in Table 2. The designations C30, C45, and C50 in Table 2 correspond to concrete strength grades, indicating cube compressive strengths of 30 MPa, 45 MPa, and 50 MPa, respectively. The rebar used in the construction follows the HRB400 specification, possessing a yield strength of 400 MPa. The steel and concrete strength adhere to the guidelines outlined in the Chinese Code for Seismic Design of Buildings (GB 50011-2010) [7].
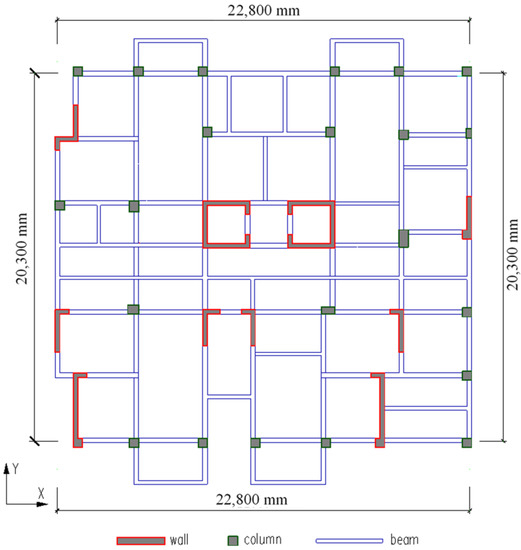
Figure 10.
The structural layout plan of the typical floor.
Table 2.
Basic information on all the stories.
4.2. Finite Element Model of the Structure
The reinforced concrete frame-shear wall building is meticulously modeled using the powerful computational tool OpenSEES, which provides a robust framework for simulating the structural response. To streamline the modeling process, the initial creation of the structure is carried out using the widely adopted software Etabs 9. Subsequently, the structure is converted into an OpenSEES model using an efficient ETO plug-in. During the transformation process, the dead floor load and live floor load are translated into equivalent nodal forces, ensuring a consistent representation of the structural loads within the OpenSEES model. This conversion preserves the accuracy of the loads while simplifying the subsequent analysis. Figure 11 serves as a visual depiction of the finite element model of the frame-shear wall building generated by Etabs 9. This comprehensive model captures the intricate details of the structural components, including the beams, columns, and shear walls, providing a detailed representation of their geometric and mechanical properties.
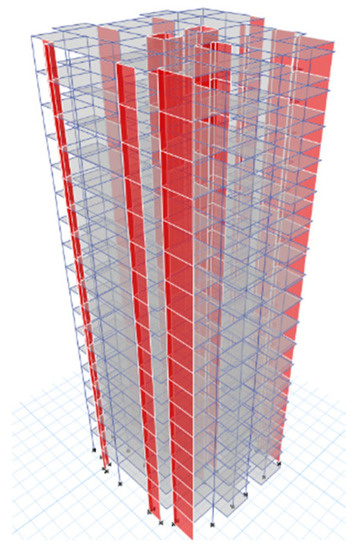
Figure 11.
The finite element model of the RC frame-shear wall structure.
The OpenSEES model utilizes widely accepted Concrete 02 and Steel 02 materials, which are extensively employed in structural analysis due to their reliability and accuracy. The dispBeamColumn element is employed to accurately represent the beam and column elements, allowing for precise modeling of their mechanical behavior and response. To ensure a faithful representation of the shear walls, the model incorporates a multi-layer shell element proposed by Lu et al. [28]. This specialized element is specifically designed to capture the intricate behavior exhibited by shear walls. Each shear wall within the multi-layer shell element consists of nine layers, comprising four steel layers and five concrete layers. This layering scheme enables an effective simulation of the interaction between steel and concrete, thereby accurately capturing the performance of shear walls under seismic loading. Table 3 provides valuable information on the natural period of vibration for the frame-shear wall building in the OpenSEES model. The analysis reveals that the first natural period of the structure is 1.09 s.
Table 3.
The natural period of vibration for the RC frame-shear wall structure.
4.3. Structural Response
In accordance with the Chinese Code for Seismic Design of Buildings (GB 50011-2010), the design working life of the building is set at 50 years, with a seismic fortification intensity of 8. The design basic acceleration of ground motion is determined as 0.2 g, while the design earthquake group is designated as 1 [7]. These specifications allow for the determination of peak ground acceleration (PGA) in accordance with the aforementioned code. Furthermore, considering that the building is situated in site III, Group 1 simulated earthquake ground motions specific to site III are selected for the seismic analysis of the RC frame-shear wall structure. The PGA of all one hundred simulated earthquake ground motions is established as 4 m/s², which aligns with the PGA specified by the Chinese Code for Seismic Design of Buildings (GB 50011-2010) [7].
Figure 12 illustrates the typical top displacement of the structure. Additionally, Figure 13 displays the typical maximum story drift angle for all stories resulting from two simulated ground motions. These visualizations highlight the notable impact of earthquake ground motion stochasticity on the structural displacement response.
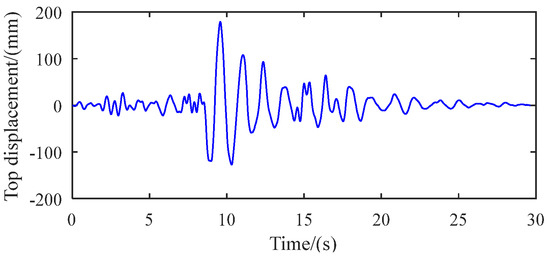
Figure 12.
Typical top displacement.
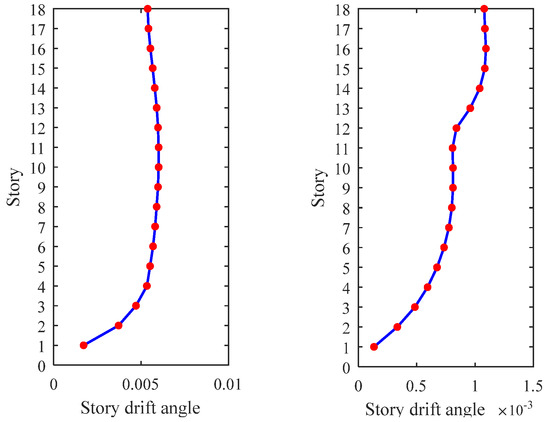
Figure 13.
The typical max story drift angle of all stories.
The PDEM is utilized to evaluate the following results of the structure. Figure 14 presents the PDFs of the top displacement at specific time instants, namely 4.0, 10.0, and 12.0 s. Notably, the PDFs exhibit significant variations across different time instants. Figure 15 illustrates the time-varying behavior of the PDF for the top displacement, while Figure 16 displays the contour of the PDF. These figures collectively indicate that the structural response process is a complex and stochastic evolution process.
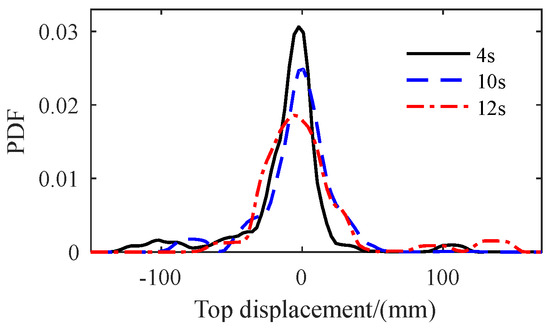
Figure 14.
The PDF at certain time instants of the top displacement.
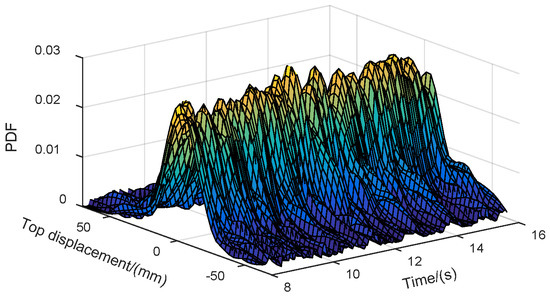
Figure 15.
The PDF surface of the top displacement varying with time.
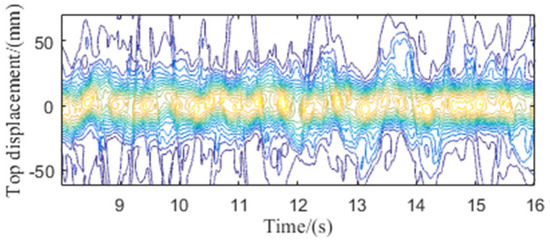
Figure 16.
The contour of the PDF surface of the top displacement.
4.4. Seismic Reliability of the RC Frame-Shear Wall Structure
The approach proposed by Chen and Li [29] for evaluating extreme value distribution and conducting dynamic reliability assessment using PDEM is employed to estimate the seismic reliability of the RC frame-shear wall structure. It is assumed that the structure will fail when the max story drift angle passes a threshold of . The reliability of the structure is then expressed as:
where denotes the probability of the random events, is the story drift angle of the th floor, is the number of floors of the structure. Denote the extreme value of the story drift angle as:
The extreme value of the story drift angle is related to the random parameter vector of the stochastic earthquake ground motions. For convenience, it can be assumed to take the form:
which means that the extreme value of , exists, is unique and a function of and . Equation (5) can be equivalently expressed as:
The evaluation of extreme value distribution can be achieved by constructing a virtual stochastic process within the framework of the PDEM. The reliability in Equation (8) can be evaluated through a simple integration.
In this study, the virtual stochastic process is:
The extreme value distribution of the story drift over the time interval [0, 90] s is depicted in Figure 17. Figure 18 shows the cumulative probability distribution function (CDF) of the extreme value of the story drift. The reliability of the structure is evaluated using Equation (10). Table 4 provides the seismic reliability values for the RC frame-shear wall structure with different threshold levels.
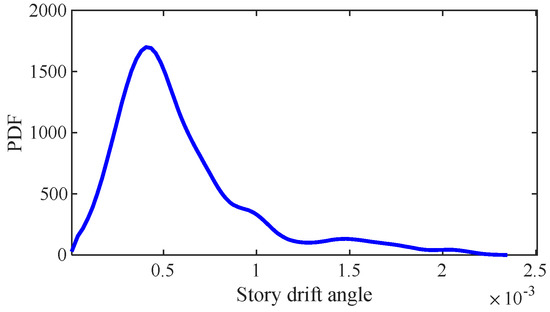
Figure 17.
The extreme value distribution of the story drift.
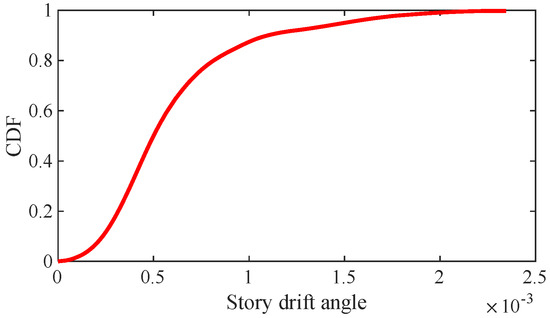
Figure 18.
The CDF of the extreme values of the story drift.
Table 4.
Dynamic reliabilities.
5. Conclusions
A set of earthquake ground motions, as opposed to several typical ones, has been deemed sufficient to capture the pronounced stochastic nature of earthquake ground motions, which exerts a significant influence on the seismic response of structures. The proposed stochastic earthquake ground motion database in this study provides an efficient method for obtaining a set of earthquake ground motions characterized by strong stochasticity. The proposed ground motion database includes assigned probabilities for each ground motion, providing known probability information. Furthermore, the inclusion of only one hundred simulated earthquake ground motions in each group significantly reduces the time required for assessing the seismic reliability of structures when combined with the probability density evolution method (PDEM).
All the twelve groups of simulated earthquake ground motions were validated by comparing them with the recorded earthquake ground motions. The results indicate a strong agreement between the statistical characteristics of the one hundred simulated earthquake ground motions and the thousands of recorded earthquake ground motions. This validation confirms the effectiveness of the simulation method used for generating stochastic earthquake ground motions and supports the validity of the proposed database. As a result, the efficiency of the reliability assessment is significantly enhanced.
The proposed stochastic earthquake ground motion database was tested using an 18-story reinforced concrete (RC) frame-shear wall structure. The structural response exhibited notable stochastic behavior, highlighting the influence of ground motion variability. The results obtained from the analysis showcased the comprehensive application and practical significance of the proposed stochastic earthquake ground motion database. The findings not only provided valuable insights into the structural response to ground motion variability but also highlighted the importance of considering such variability in seismic design and risk assessment processes. This research contributes to the advancement of knowledge in the field of earthquake engineering, paving the way for improved design methodologies and more resilient structures.
Author Contributions
Conceptualization, Y.D. and Y.X.; methodology, Y.D. and Y.X.; software, S.D.; validation, Y.X.; formal analysis, S.D.; investigation, Y.X. and S.D.; resources, Y.X. and S.D.; data curation, Y.X.; writing—original draft preparation, Y.D.; writing—review and editing, Y.X. and S.D.; visualization, Y.D.; supervision, Y.X. and S.D.; project administration, Y.D.; funding acquisition, Y.D. All authors have read and agreed to the published version of the manuscript.
Funding
This research was funded by the National Natural Science Foundation of China (Grant No. 52008339) and the China Postdoctoral Science Foundation (Grant No. 2022MD723815).
Data Availability Statement
Data sharing is not applicable to this article.
Acknowledgments
We sincerely acknowledge the support provided by the National Natural Science Foundation of China. All accelerograms utilized in this study were downloaded from the website of the Pacific Earthquake Engineering Research Center (PEER) at http://ngawest2.berkeley.edu (accessed on 5 June 2023). The authors would like to express their gratitude to PEER for making these valuable resources available.
Conflicts of Interest
The authors declare no conflict of interest.
References
- Chiou, B.; Darragh, R.; Gregor, N.; Silva, W. NGA project strong-motion database. Earthq. Spectra 2008, 24, 23–44. [Google Scholar] [CrossRef]
- Power, M.; Chiou, B.; Abrahamson, N.; Bozorgnia, Y.; Shantz, T.; Roblee, C. An overview of the NGA project. Earthq. Spectra 2008, 24, 3–21. [Google Scholar] [CrossRef]
- Bozorgnia, Y.; Abrahamson, N.A.; Atik, L.A.; Ancheta, T.D.; Atkinson, G.M.; Baker, J.W.; Baltay, A.; Boore, D.M.; Campbell, K.W.; Youngs, R.; et al. NGA-West2 research project. Earthq. Spectra 2014, 30, 973–987. [Google Scholar] [CrossRef]
- Ancheta, T.D.; Darragh, R.B.; Stewart, J.P.; Seyhan, E.; Silva, W.J.; Chiou, B.S.J.; Wooddell, K.E.; Graves, R.W.; Kottke, A.R.; Donahue, J.L.; et al. NGA-West2 database. Earthq. Spectra 2014, 30, 989–1005. [Google Scholar] [CrossRef]
- Okada, Y.; Kasahara, K.; Hori, S.; Obara, K.; Sekiguchi, S.; Fujiwara, H.; Yamamoto, A. Recent progress of seismic observation networks in Japan—Hi-net, F-net, K-NET and KiK-net. Earth Planets Space 2004, 56, xv–xxviii. [Google Scholar] [CrossRef]
- Aoi, S.; Kunugi, T.; Nakamura, H.; Fujiwara, H. Earthquake Data in Engineering Seismology: Deployment of New Strong Motion Seismographs of K-NET and KiK-Net; Springer: Dordrecht, The Netherlands, 2011. [Google Scholar]
- GB 50011-2010; Code for Seismic Design of Buildings. China Architecture and Building Press: Beijing, China, 2010.
- ASCE/SEI 7-05; Minimum Design Loads for Buildings and Other Structures. American Society of Civil Engineers: Reston, VA, USA, 2010.
- EN 1998–1. C’EN; Eurocode 8: Design of Structures for Earthquake Resistance-Part 1: General Rules, Seismic Actions and Rules for Buildings, EN 1998–1:2004. Comite Europeen de Normalisation: Brussels, Belgium, 2004.
- Ministry of Land, Infrastructure, Transport and Tourism. The Building Standard Law of Japan; Ministry of Land, Infrastructure, Transport and Tourism; Building Center of Japan: Tokyo, Japan, 2001. [Google Scholar]
- Seed, H.B.; Ugas, C.; Lysmer, J. Site-dependent spectra for earthquake-resistant design. Bull. Seismol. Soc. Am. 1976, 66, 221–243. [Google Scholar] [CrossRef]
- Nakamura, Y. A Method for Dynamic Characteristics Estimation of Subsurface Using Microtremor on the Ground Surface; Railway Technical Research Institute: Kokubunji-shi, Japan, 1989; Quarterly Reports; Volume 30. [Google Scholar]
- Naeim, F.; Anderson, J.C. Design Classification of Horizontal and Vertical Earthquake Ground Motion (1933–1994) (Inc. Report, No. 7738); John A. Martin and Associates: Los Angeles, CA, USA, 1996. [Google Scholar]
- Alimoradi, A.; Pezeshk, S.; Naeim, F.; Frigui, H. Fuzzy pattern classification of strong ground motion records. J. Earthq. Eng. 2005, 9, 307–332. [Google Scholar] [CrossRef]
- Yaghmaei-Sabegh, S. A novel approach for classification of earthquake ground-motion records. J. Seismol. 2017, 21, 885–907. [Google Scholar] [CrossRef]
- Ding, Y.; Peng, Y.; Li, J. Cluster analysis of earthquake ground-motion records and characteristic period of seismic response spectrum. J. Earthq. Eng. 2020, 24, 1012–1033. [Google Scholar] [CrossRef]
- Wang, D.; Li, J. Physical random function model of ground motions for engineering purposes. Sci. Sin. Technol. 2011, 54, 175–182. [Google Scholar] [CrossRef]
- Song, M. Studying Random Function Model of Seismic Ground Motion for Engineering Purposes. Master’s Thesis, Tongji University, Shanghai, China, 2013. [Google Scholar]
- Ding, Y.Q.; Peng, Y.Q.; Li, J. A stochastic semi-physical model of seismic ground motions in time domain. J. Earthq. Tsunami 2018, 12, 1850006. [Google Scholar] [CrossRef]
- Li, J.; Chen, J.B. Probability density evolution method for dynamic response analysis of structures with uncertain parameters. Comput. Mech. 2004, 34, 400–409. [Google Scholar] [CrossRef]
- Li, J.; Chen, J.B. The probability density evolution method for dynamic response analysis of non-linear stochastic structures. Int. J. Numer. Methods Eng. 2006, 65, 882–903. [Google Scholar] [CrossRef]
- Li, J.; Chen, J.B. The principle of preservation of probability and the generalized density evolution equation. Struct. Saf. 2008, 30, 65–77. [Google Scholar] [CrossRef]
- Chen, J.B.; Li, J. A note on the principle of preservation of probability and probability density evolution equation. Probabilistic Eng. Mech. 2009, 24, 51–59. [Google Scholar] [CrossRef]
- Ding, Y.; Li, J.; Peng, Y. Engineering random ground motion database for recorded and simulated ground motions. J. Vib. Shock 2021, 40, 143–148. [Google Scholar]
- Guo, F.; Wu, D.M.; Xu, G.F.; Ji, Y.L. Site classification corresponding relationship between Chinese and the overseas Seismic Design Codes. J. Civ. Eng. Manag. 2011, 28, 63–66. (In Chinese) [Google Scholar]
- Ding, Y.Q.; Li, J. Parameters identification and statistical modelling of physical stochastic model of seismic ground motion for engineering purposes. Sci. Sin. Technol. 2018, 48, 1422–1432. [Google Scholar] [CrossRef]
- Chen, J.B.; Yang, J.Y.; Li, J. A GF-discrepancy for point selection in stochastic seismic response analysis of structures with uncertain parameters. Struct. Saf. 2016, 59, 20–31. [Google Scholar] [CrossRef]
- Lu, X.Z.; Xie, L.L.; Guan, H.; Huang, Y.L.; Lu, X. A shear wall element for nonlinear seismic analysis of super-tall buildings using OpenSees. Finite Elem. Anal. Des. 2015, 98, 14–25. [Google Scholar] [CrossRef]
- Chen, J.B.; Li, J. The extreme value distribution and dynamic reliability analysis of nonlinear structures with uncertain parameters. Struct. Saf. 2007, 29, 77–93. [Google Scholar] [CrossRef]


Disclaimer/Publisher’s Note: The statements, opinions and data contained in all publications are solely those of the individual author(s) and contributor(s) and not of MDPI and/or the editor(s). MDPI and/or the editor(s) disclaim responsibility for any injury to people or property resulting from any ideas, methods, instructions or products referred to in the content. |
© 2023 by the authors. Licensee MDPI, Basel, Switzerland. This article is an open access article distributed under the terms and conditions of the Creative Commons Attribution (CC BY) license (https://creativecommons.org/licenses/by/4.0/).