Abstract
Accurately simulating the nonlinear response of reinforced concrete (RC) columns under cyclic loading is crucial in performance-based seismic design for building structures, especially regarding strength degradation. This paper presents the description, calibration and simulation of the hysteretic model for RC columns based on effective hysteretic energy dissipation with positive and negative directions. During the analysis of previous experimental data, the relationship between hysteresis energy dissipation, maximum displacement, and the effects of positive and negative loading directions on strength degradation has been summarized. The proposed method for determining the yield strength of the hysteresis loop is based on the farthest point method. Calibration of the hysteretic models’ existing RC columns’ experimental data demonstrates that the proposed model can simulate the main characteristics that influence deterioration.
1. Introduction
It is essential for performance-based seismic design to reasonably evaluate the performance of structures under seismic loading [1]. Reinforced concrete (RC) columns are the critical members bearing vertical loads and resisting horizontal loads in the actual structure. The phenomena in the experiments and the earthquake damage indicate that the seismic performance of the structure is related to the loading histories [2]. With the increasing duration and strength of strong ground motions, the strength of the columns decreases more significantly when the earthquake occurs. Therefore, the strength degradation of RC columns should be reasonably evaluated when analyzing the seismic performance of the structure.
Strength degradation in the cyclic loading refers to the phenomenon that the strength gradually decreases each time as the number of cycles increases, while the load reaches the same displacement [3]. In most seismic studies, hysteresis models that include strength degradation are developed and form a non-deteriorating backbone curve and hysteresis rules [4]. Park [5] and Miramontes [6] each proposed hysteresis rules for reloading paths pointing to points with larger displacement values. Ozcebe [7] and Sivaselvan [8] developed rules for reloading paths that point to strength-discounting points with the same displacement values. In traditional RC column hysteresis tests, the force–displacement curves at the column end sections are primarily obtained. Chalioris and his research group [9] ingeniously arranged piezoelectric sensors at the beam–column joints to trace the structural damage progression with high precision and fidelity. Capitalizing on the obtained data, they simulated the cyclic lateral behavior of carbon fiber-reinforced polymer bars as a longitudinal reinforcement in the beam using the finite element analysis software ABAQUS [10]. Regarding the simulation of other structural members, Thomoglou et al. [11] implemented an intricate micro-nonlinear finite element model in ANSYS to simulate and validate the shear behavior of unreinforced masonry walls containing units, mortar, and fiber-reinforced composites with their complex interactions.
The loading path is a critical factor that affects the strength degradation of RC columns. It primarily depends on two key indicators, namely maximum displacement and hysteresis energy dissipation. In most studies on the effect of loading path on strength degradation, the strength degradation rate proposed by Roufaiel [12], Chung [13] and Yousseef [14] was only related to the maximum displacement. Kunnath [15], Rahnama [16], Sucuoglu [17] and Lee [18] summarized degradation models associated with hysteretic energy dissipation. Qu [19] presented the concept of effective hysteretic energy dissipation, which applied the two factors of maximum displacement and hysteretic energy dissipation together to the hysteretic model of strength degradation. Huang [20] proposed a neural network-based hysteresis model to characterize the relationship between lateral force and displacement of RC columns with different properties.
When RC columns are subjected to seismic loading, both the steel rebar and concrete exhibit complex nonlinear properties. However, previous studies mostly utilized symmetric hysteresis experiments to simulate the response of RC columns under seismic loading, resulting in distortion of the simulation under asymmetric hysteresis. Previous studies have also utilized a complete hysteresis loop as the basis for their analysis, which has been shown to result in a failure of hysteresis models to accurately reflect the strength degradation when loading the opposite side after experiencing large deformation on one side. The simulation model proposed in this paper fully accounts for the asymmetry in horizontal loading procedures. It can predict the response of RC columns under seismic loading with superior accuracy. This model provides a foundation for analyzing and evaluating the seismic capacity of structures in the future.
2. The Proposed Hysteretic Model
2.1. Backbone Curve
The backbone curve represents the maximum strength that a structural member can develop at a given level of deformation, resulting in an effective limit to the strength of a member in force–deformation space [21]. The developed model includes four distinct sections: the elastic branch, hardening branch, softening branch, and residual branch, as illustrated in Figure 1.

Figure 1.
The proposed hysteretic model. (A) Backbone curve and hysteretic rule. (B) Strength degradation.
The backbone curve is a quad-linear idealization that is defined by several parameters, including the yield strength , the residual strength , the yield deformation , the strain-hardening stiffness , the cap deformation , and the residual deformation . In the elastic branch, the elastic stiffness is calculated, , which can determine the cap strength, . During the hardening stage, the strain-hardening stiffness is calculated, . The ratio of the cap deformation to the yield deformation can be described as the ductility capacity, (). The softening stage is defined by the post-capping stiffness, . The residual strength can be defined in the model, . If the deformation exceeds the residual displacement, the load capacity of the member is not less than the residual strength.
The above parameters of the backbone curves can be obtained from load–deformation data from the experiments or theories of previous studies [22,23,24,25,26].
2.2. Hysteretic Rule
The hysteretic rule defines the load–deformation path under cyclic loading [27]. The hysteretic rule for the developed model is shown in Figure 1A, where the load path points to the maximum displacement of the previous cycle, based on Clough’s theory [28]. This paper focuses on the strength degradation theory; therefore, the stiffness in the post-capping and residual stages is assumed to be the same as the backbone curve.
2.3. Cyclic Strength Degradation
Figure 1B shows the cyclic strength degradation, which controls the amount of the hysteretic curve that moves to the x coordinate axis with the cyclic deformation.
2.3.1. Calculation of Strength Degradation Value
In previous studies [4,19], it requires much time and effort to obtain the strength degradation value from the experimental hysteresis data. This paper introduces a new calculation method based on the farthest point method [29], as shown in Figure 2. The point on the curve farthest from the line connecting the intersection of the origin and the cap point is the yield point. As shown in the hysteretic model presented in this paper (Figure 1A), the RC column yields at point 1 within the initial hysteresis loop and reaches the cap response at point 2. Point 1 on the hysteresis curve represents the point that is furthest from the line connecting the origin and point 2. If there is more than one point, the yield point can be obtained by averaging the load values of these points and corresponding to the curve. The method has the advantages of easy operation and accurate calculation by programming, which can avoid the calculation error caused by manual value.
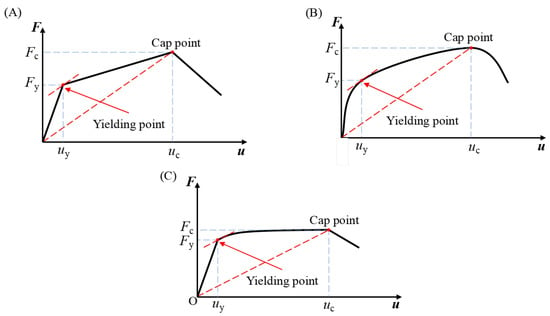
Figure 2.
Farthest point method used to determine yield point. (A) Bilinear curve. (B) Without obvious turning curve. (C) Traditional elastic–plastic curve.
The yield point can be obtained form the backbone curve based on the Equation (1).
where is the coordinate of any point on the backbone curve of the component; is the coordinate of the yield point determined by the farthest point method; is the coordinate of the cap point; and .
Since the reloaded hysteresis loop does not pass through the origin, the calculation is derived as Equation (2). Since the columns are axisymmetric, it is assumed that the yield strength in the negative direction is equal to the yield strength in the positive direction.
where is the intersection coordinate of the hysteresis loop and the coordinate axis, and . The positive and negative directions discussed in this paper are the directions of force loading on RC columns. Therefore, and Equation (2) can be simplified to Equation (3), which is suitable for positive and negative directions. In some experiments, the hysteresis loop loading did not exceed the cap point; thus, these hysteresis loops could not be calculated.
Since the columns are axisymmetric, it is assumed that the yield strength in the negative direction is equal to the yield strength in the positive direction, as shown in Figure 3.
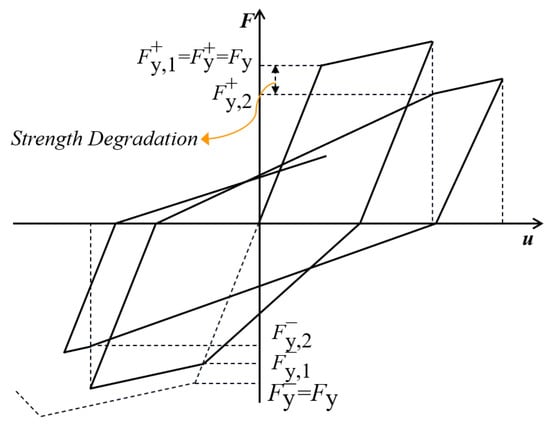
Figure 3.
Strength deterioration.
2.3.2. Strength Deterioration Rule
The authors’ previous [30] study showed that the degradation mechanism of the RC columns is usually considered to be the bond slip between the reinforcement and the concrete and the spalling of the concrete protective layer, as shown in Figure 4. Positive and negative sequential loading is the most common loading scheme in studying the cyclic behavior of structural members. At the same time, displacement loading with monotonically increasing amplitude is the most widely used loading path. However, the deformation of the column in the positive and negative directions is usually asymmetrical under the action of the ground motion.
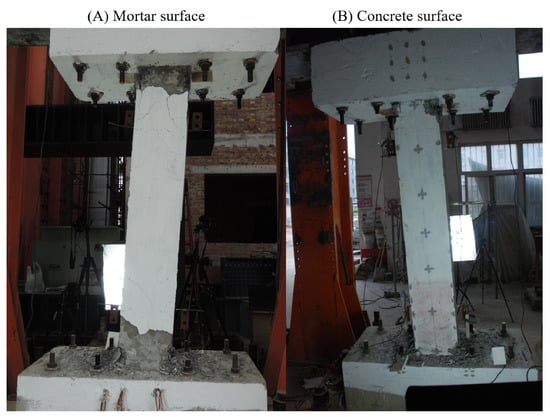
Figure 4.
Experimental phenomenon of RC column. (A) Mortar surface of RC column. (B) Concrete surface of RC column.
According to Takemura and Kawashima [31], two identical batch columns with the same design parameters were applied with different hysteresis loads. The specimen was first applied with a large displacement in the positive direction, and then, the same displacement was applied in the negative direction, as shown in Figure 5A. The other specimen was loaded with a large displacement in the positive direction only, and then, the displacement was gradually reduced, as shown in Figure 5B. Figure 6A shows the difference between the positive yield strength of 150 kN and the negative yield strength of 110 kN. Comparing Figure 6A,B, with only positive loading, the strength of the second hysteresis loop is significantly greater than that of both positive and negative loading. Therefore, the column damage by positive or negative deformation causes the strength deterioration in both negative and positive directions.
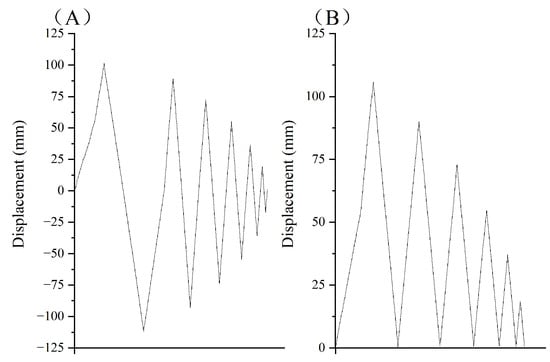
Figure 5.
Loading hysteresis of Takemura and Kawashima test. (A) Positive and negative hysteretic loading. (B) Positive hysteretic loading.
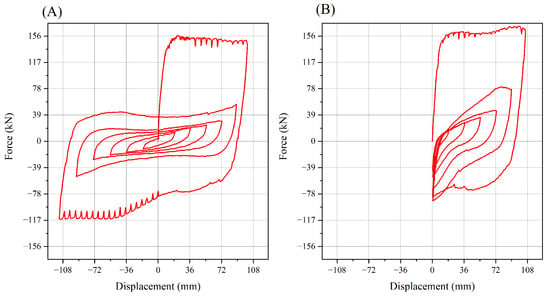
Figure 6.
Force–displacement hysteresis curve of Takemura and Kawashima’ test. (A) positive and negative hysteretic loading. (B) positive hysteretic loading.
On the basis of the above findings, the cyclical strength deterioration rates are proposed in this paper. The cyclic deterioration in excursion i is defined by the strength degradation parameter , considering positive and negative directional effects. The strength degradation is described by the following Equation (4).
where is the deteriorated yield strength in negative and positive directions of ith circle. and are each the time that the updated inelastic path crosses the horizontal axis. In the proposed hysteresis model, must be within the limits , due to the residual branch. If is outside these limits (), RC columns are advanced to the residual strength stage. The details of will be presented in subsequent sections.
3. Effective Hysteretic Energy Dissipation with Positive and Negative Directions
Liu [32] conducted a series of constant amplitude cyclic loading tests aimed at investigating the relationship between load displacement amplitude and low cycle fatigue life of RC members. The findings revealed that under larger displacement loading, even a relatively small amount of hysteretic energy dissipation could cause failure of the RC members. In light of these results and Section 2.3, Equation (5) was proposed to account for effective hysteretic energy dissipation in both positive and negative directions, taking into consideration the loading displacement, hysteresis energy dissipation, as well as the positive and negative directions.
where is the effective hysteretic energy dissipation up to the ith loading cycle in positive and negative directions; refers to the deformation amplitude of the jth cycle in positive and negative directions; is the cap deformation; represents the hysteretic energy dissipation up to the ith loading cycle in positive and negative directions. a, b and c are the model coefficients, and .
The strength degradation parameter is suggested in Equation (6).
where k is the parameter determined from the test.
Equation (6) is substituted into Equation (4). Therefore, the yield strength of each hysteresis loop is expressed by Equation (7).
In this model, the absolute value of the yield strength in negative and positive directions of ith circle is as the value of the effective hysteretic energy dissipation increases.
4. The Influence Degree of Loading Directions on Strength Deterioration
4.1. Rectangular RC Column Dataset
This study aimed to determine the relative influence of positive and negative loading directions on the strength deterioration of RC columns. For this purpose, 98 RC columns with rectangular cross-sections were selected from the PEER Structural Performance Database and the authors’ previous studies [33]. The stacked histograms in Figure 7 show the distribution of the design parameters of the RC columns, which include: (1) compressive strength of concrete , (2) yield strength of longitudinal reinforcement , (3) yield strength of transverse reinforcement , (4) axial compression ratio , (5) cross-sectional area , (6) length , (7) longitudinal reinforcement ratio , and (8) Vol transverse reinforcement ratio . Different colors indicate distinct limit zones, and these restrictions are already displayed in Figure 7. The parameters of the database can be found in Appendix A.
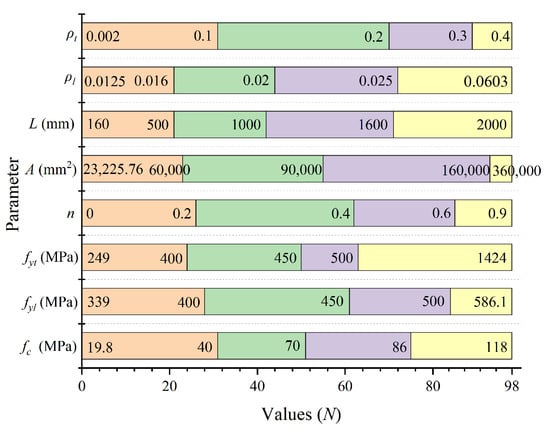
Figure 7.
Stacked histograms of the design parameters of the RC columns.
4.2. Proposed Regression Coefficients
In this sub-section, the rectangular RC column dataset will be analyzed in order to determine the impact of effective hysteretic energy dissipation with positive and negative directions on the strength degradation of RC columns. This means that by fitting the hysteresis curves within the dataset, the most suitable values for the three coefficients (a, b, and c) in Equation (5) can be determined.
The value a represents the magnitude of effective hysteresis energy dissipation during one half of the hysteresis loop, and b represents the magnitude of effective hysteresis energy dissipation during the other half. It is assumed that a takes on values between 1.02 and 2, with an interval of 0.02, and b is defined as . This means that b takes on values between 0 and 0.98, with the same interval of 0.02. The variable c is used to quantify the impact of the ratio between the maximum displacement of a half hysteresis loop and the cap displacement on the strength degradation. The value of c is assumed to range from 0.01 to 4, with increments of 0.01. The researchers used a statistical method called least squares linear fit [34] to process Equation (5). This method is commonly used in data analysis to find the best-fitting straight line through a set of data points. The goal is to minimize the sum of the squared differences between the observed values and the corresponding fitted values on the line. R-squared () is used to evaluate the performance of a regression model in the paper, as shown in Equation (8). is typically expressed as a percentage between 0% and 100%. The higher the value, the better the fit of the regression model [35].
where represents the actual value of the ith observation, represents the predicted value of the ith observation, and represents the mean value of all observations.
The average of the 98 reinforced concrete columns is depicted in Figure 8. When , , and , the mean value of is maximum, indicating a better fit. Figure 9 shows the statistical information for , when , , and . After performing the calculation, we can transform Equation (7) into Equation (9). The degradation in strength caused by the effective hysteresis energy in the same direction is 1.27 times greater than the effect of the effective hysteresis energy in the opposite direction. This finding aligns with and corroborates the effects of bidirectional hysteretic energy dissipation and strength deterioration elucidated in Section 2.3.2.
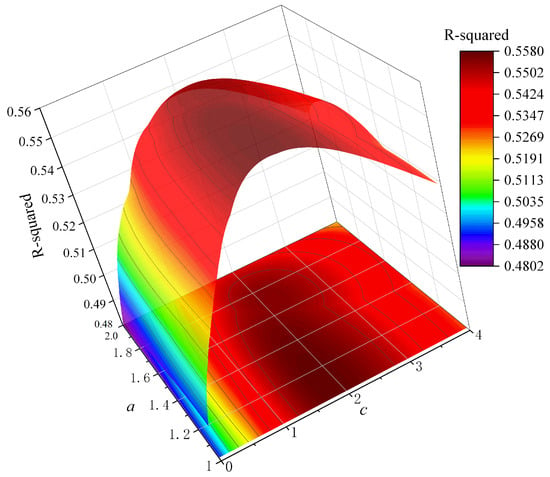
Figure 8.
The average of the 98 RC columns.
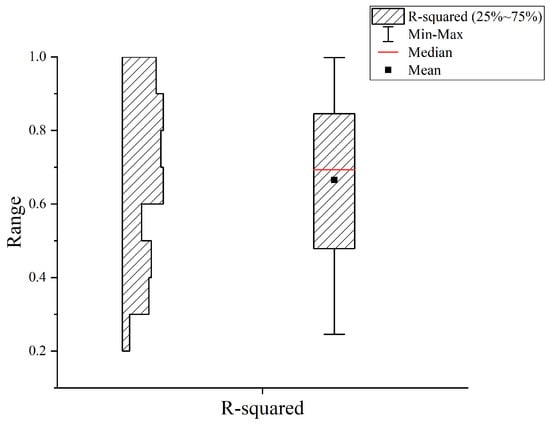
Figure 9.
The statistical information for .
5. Modeling of Strength Deterioration of RC Columns
The fiber beam element in ABAQUS (a software suite for finite element analysis and computer-aided engineering) is able to simulate the applicability of bending and axial force interactions for different cross-sectional profiles and reinforcement modeling members. By creating fiber bundles within the cross-section of the beam, the complex stress–strain behavior of RC columns can be captured more accurately, thus improving the accuracy of the model [36].
The strength degradation of the RC columns is a macroscopic behavior, which can be observed through the reduction of load-carrying capacity over time due to various factors. The mechanisms that contribute to this degradation are complex and involve multiple factors, including bond slip between the steel rebar and concrete and spalling of the concrete protective layer.
The constitutive relationship of the steel rebar plays a crucial role in the behavior of RC columns subjected to cyclic loading. Youssef [14] demonstrated that incorporating the degradation of the load-carrying capacity of the member into the constitutive relationships of the steel rebar can effectively simulate the load-carrying capacity degradation of RC columns under incremental loading. Based on the above conclusions, the forces and displacements in Equation (9) are replaced by the stresses and strains of the steel rebar, as shown in Equation (10).
where is the yield stress of the steel rebar; is the yield stress of the steel rebar in negative and positive directions; can be taken as the strain of the steel rebar when the member is monotonically loaded to the cap deformation .
There are more factors affecting the value of . After simulation, the proposed value of is shown in Equation (11).
where is the stirrup characteristic value; is the vol transverse reinforcement ratio; is the yield strength of transverse reinforcement; is the yield strength of longitudinal reinforcement. is the axial compression ratio, which takes the value 0.1. If it is less than 0.1, N is the axial compression, and A is the cross-sectional area.
The hysteretic models have been calibrated by force–displacement data from 12 experiments on RC columns with different design parameters and loading histories, based on the general purpose program ABAQUS. When accounting for strength deterioration, Equation (10) will be used to update the yield strength of the steel rebar during the analysis.
For the simulation of eight RC columns with different design parameters, the model results and experimental results are displayed in Figure 10, Figure 11, Figure 12 and Figure 13. The majority of the experimental results were effectively simulated, including the presentation of strength degradation. Additionally, information such as the axial compression ratio and stirrup characteristic values was added to the figures for a better understanding of the model’s applicability. In cases where the axial compression ratio is less than 0.5, the model simulation performs exceptionally well. This indicates that when the axial compression ratio is low, the analysis method can effectively predict the performance of RC columns. However, some discrepancies were observed in specific cases.
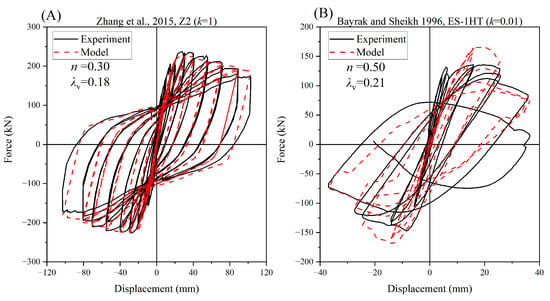
Figure 10.
Comparison between the analysis and experimental results of Zhang [33] and Bayrak [37].
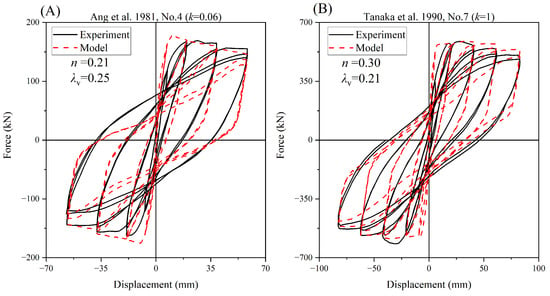
Figure 11.
Comparison between the analysis and experimental results of Ang [38] and Tanaka [39].
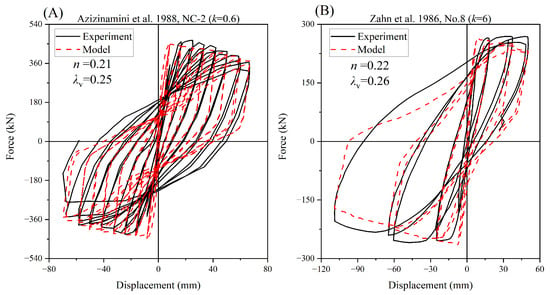
Figure 12.
Comparison between the analysis and experimental results of Azizinamini [40] and Zahn [41].
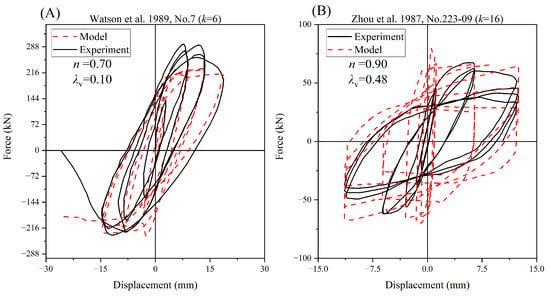
Figure 13.
Comparison between the analysis and experimental results of Watson [42] and Zhou [43].
For instance, in Figure 10B (Bayrak and Sheikh, 1996, ES-1HT), when high-strength concrete with a compressive strength of 72.1 MPa was used for the RC columns, the analytical model tended to underestimate the actual strength of the columns. This could be attributed to the limitations of the model in capturing the behavior of high-strength concrete or due to simplifications made in the model assumptions.
Regarding the specimens of Watson et al. 1989, No. 7 () and Zhou et al. 1987, No. 223-09 (), where the axial pressure was relatively large, discrepancies were observed in the compressive-bending load capacity of the simulated members compared to the experimental results. These discrepancies could be attributed to the model’s limitations in simulating the complex interaction between axial pressure, bending, and confinement effects.
The analytical model also demonstrates good simulation results for non-square rectangular columns, as evidenced by the specimens No. 40.033a and No. 40.033, as shown in Figure 14. These specimens had dimensions of 152 mm in width and 305 mm in depth. The accurate simulation of non-square rectangular columns is crucial, as it highlights the model’s versatility and applicability to a wider range of column geometries.
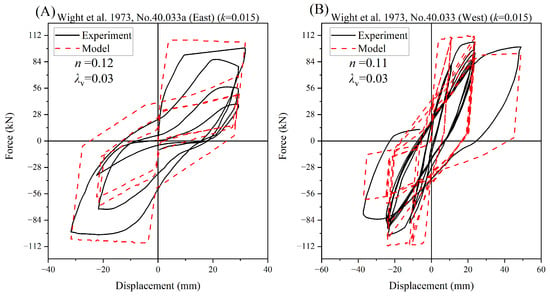
Figure 14.
Comparison between the analysis and experimental results of Wight [44].
Figure 14 and Figure 15 effectively simulate the hysteresis performance of the column under different loading paths. These figures demonstrate the role of effective hysteretic energy dissipation in both positive and negative directions on the column’s strength degradation. The ability to simulate hysteresis performance and energy dissipation is essential in understanding the behavior of RC columns under cyclic loading, which is commonly encountered in situations such as earthquakes.
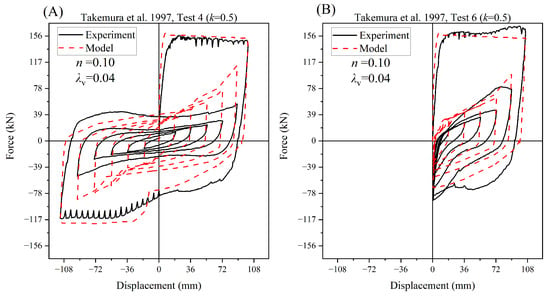
Figure 15.
Comparison between the analysis and experimental results of Takemura [31].
Despite these discrepancies, the analytical model generally provided effective simulations in the majority of experimental results. However, it is crucial to address these limitations and improve the model’s accuracy to provide a better understanding of the behavior of RC columns with different design parameters and under various loading conditions.
6. Discussion
1. In previous studies, the method of yield strengths reduction of the backbone curve derived from the force reduction at the reloading point was proposed by Qu [19], as shown in the Equation (12). However, that method has the disadvantage of requiring a lot of manual processing of experimental data. The furthest point method has a wider range of practical applications and is more convenient for converting into calculations, resulting in significantly reduced data-processing time.
2. Compared with the model of Qu [19], which only considers hysteretic energy dissipation and maximum historical displacement, the model proposed in this study considers the effects of positive and negative directions, which simulates the hysteretic behavior of the member more accurately and improves the simulation accuracy. Hysteretic energy is provided in the form of effective hysteretic energy, which comprehensively considers the effects of both directions and avoids the hysteretic energy in a single direction from dominating the simulation results. When the displacement in the first hysteresis loop is large, the model that considers the effects of both directions can produce more accurate simulation results. It is difficult to accurately simulate this situation by relying solely on the hysteretic energy of the symmetrical loading.
3. Figure 14 demonstrates the practical application of the proposed strength degradation model for non-square rectangular columns. The model can potentially be applied to beam simulations, depending on the force distribution in the beam and the column.
4. The model may produce some errors when simulating high-strength concrete and high axial compression ratios. Future studies could improve the accuracy of the simulation by taking into account the effect of transverse reinforcement on the concrete constitutive relationships.
5. During the simulation, the coefficients k differed significantly for different specimens of different design parameters. In future research, a neural network algorithm can be applied to find the relationship between the design parameters and the coefficients k.
7. Conclusions
This paper presents a hysteretic model for simulating the seismic response of RC columns incorporating loading direction and hysteretic energy dissipation. The model provides the following novel insights:
1. A new approach based on the farthest point method for accurately identifying yield points in bidirectional hysteresis loops. This technique can be readily implemented for computational efficiency.
2. An innovative hysteretic energy dissipation (effective hysteretic energy dissipation with positive and negative directions) model that considers loading orientation and maximum displacement, in addition to cumulative hysteretic energy. This formulation more realistically captures the damage caused by excursions in positive and negative directions and at varying displacement amplitudes.
3. Methodologies for introducing strength degradation in fiber beam element models to enable precise reproduction of the hysteretic behavior of RC columns, especially under cyclic loading.
The proposed model enhances simulation capabilities for structural response under asymmetric seismic ground motions. By incorporating salient features influencing damage and strength deterioration in RC members, the model can improve predictions of structural performance during severe earthquakes, enabling more reliable seismic design and assessment.
Author Contributions
Conceptualization, B.S. and G.Z.; methodology, B.S. and G.Z.; software, G.Z. and W.B.; validation, G.Z.; formal analysis, B.S., G.Z. and W.B.; investigation, G.Z.; resources, B.S.; data curation, G.Z.; writing—original draft preparation, G.Z.; writing—review and editing, G.Z.; visualization, G.Z.; supervision, B.S.; project administration, B.S.; funding acquisition, B.S. All authors have read and agreed to the published version of the manuscript.
Funding
This research was funded by National Natural Science Foundation of China (U2239252), the Scientific Research Fund of the Institute of Engineering Mechanics, the China Earthquake Administration (grant no. 2019EEEV0103) and the National Key R&D Program of China (grant no. 2019YFC1509301).
Institutional Review Board Statement
Not applicable.
Informed Consent Statement
Not applicable.
Data Availability Statement
The models and codes that support the findings of this study are available from the corresponding author upon reasonable request.
Acknowledgments
The work presented in this paper was supported by National Natural Science Foundation of China (U2239252), the Scientific Research Fund of the Institute of Engineering Mechanics, the China Earthquake Administration (grant no. 2019EEEV0103) and the National Key R&D Program of China (grant no. 2019YFC1509301), and the Program for Innovative Research Team in China Earthquake Administration.
Conflicts of Interest
The authors declare that they have no known competing financial interests or personal relationships that could have appeared to influence the work reported in this paper.
Abbreviations
The following abbreviations are used in this manuscript:
| RC | Reinforced concrete |
| A | Cross-sectional area |
| Effective hysteretic energy dissipation | |
| E | Hysteretic energy dissipation |
| N | Axial compression |
| F | Horizontal loading |
| Cap strength | |
| Residual strength | |
| Yield strength | |
| Post-capping stiffness | |
| Elastic stiffness | |
| Strain-hardening stiffness | |
| L | Length |
| n | Axial compression ratio |
| Strain-hardening stiffness ratio | |
| Post-capping stiffness ratio | |
| Residual strength ratio | |
| Stirrup characteristic value | |
| Longitudinal reinforcement ratio | |
| Vol transverse reinforcement ratio | |
| Cap deformation | |
| Ductility capacity | |
| u | Deformation |
| Residual deformation | |
| Yield deformation | |
| a, b, c | Model coefficients |
| k | Parameter determined from the test |
| Concrete compressive strength | |
| Yield strength of longitudinal reinforcement | |
| Yield strength of transverse reinforcement | |
| Stress of steel rebar | |
| Yield Stress of steel rebar | |
| Strain of steel rebar | |
| Cap Strain of steel rebar |
Appendix A
Table A1 summarize the rectangular RC column database and provide input parameters used for model calibration. These tables are useful for understanding the key characteristics of the database.

Table A1.
RC column database parameters.
Table A1.
RC column database parameters.
| # | ID | (MPa) | (MPa) | (MPa) | n | ||||
|---|---|---|---|---|---|---|---|---|---|
| 1 | Gill et al. 1979, No.2 [45] | 41.4 | 375 | 316 | 0.21 | 302,500 | 1200 | 0.0179 | 0.0230 |
| 2 | Ang et al. 1981, No. 3 [38] | 23.6 | 427 | 320 | 0.38 | 160,000 | 1600 | 0.0151 | 0.0280 |
| 3 | Ang et al. 1981, No. 4 [38] | 25 | 427 | 280 | 0.21 | 160,000 | 1600 | 0.0151 | 0.0220 |
| 4 | Soesianawati et al. 1986, No. 1 [46] | 46.5 | 446 | 364 | 0.1 | 160,000 | 1600 | 0.0151 | 0.0090 |
| 5 | Soesianawati et al. 1986, No. 2 [46] | 44 | 446 | 360 | 0.3 | 160,000 | 1600 | 0.0151 | 0.0120 |
| 6 | Soesianawati et al. 1986, No. 3 [46] | 44 | 446 | 364 | 0.3 | 160,000 | 1600 | 0.0151 | 0.0080 |
| 7 | Soesianawati et al. 1986, No. 4 [46] | 40 | 446 | 255 | 0.3 | 160,000 | 1600 | 0.0151 | 0.0060 |
| 8 | Zahn et al. 1986, No. 7 [41] | 28.3 | 440 | 466 | 0.22 | 160,000 | 1600 | 0.0151 | 0.0160 |
| 9 | Zahn et al. 1986, No. 8 [41] | 40.1 | 440 | 466 | 0.39 | 160,000 | 1600 | 0.0151 | 0.0200 |
| 10 | Watson et al. 1989, No. 5 [42] | 41 | 474 | 372 | 0.5 | 160,000 | 1600 | 0.0151 | 0.0070 |
| 11 | Watson et al. 1989, No. 6 [42] | 40 | 474 | 388 | 0.5 | 160,000 | 1600 | 0.0151 | 0.0030 |
| 12 | Watson et al. 1989, No. 7 [42] | 42 | 474 | 308 | 0.7 | 160,000 | 1600 | 0.0151 | 0.0130 |
| 13 | Watson et al. 1989, No. 8 [42] | 39 | 474 | 372 | 0.7 | 160,000 | 1600 | 0.0151 | 0.0070 |
| 14 | Watson et al. 1989, No. 9 [42] | 40 | 474 | 308 | 0.7 | 160,000 | 1600 | 0.0151 | 0.0230 |
| 15 | Tanaka et al. 1990, No. 7 [39] | 32.1 | 511 | 325 | 0.3 | 302,500 | 1650 | 0.0125 | 0.0210 |
| 16 | Ohno et al. 1984, L2 [47] | 24.8 | 362 | 325 | 0.03 | 160,000 | 1600 | 0.0142 | 0.0030 |
| 17 | Zhou et al. 1987, No. 104-08 [43] | 19.8 | 341 | 559 | 0.8 | 25600 | 160 | 0.0222 | 0.0070 |
| 18 | Zhou et al. 1987, No. 214-08 [43] | 21.1 | 341 | 559 | 0.8 | 25,600 | 320 | 0.0222 | 0.0070 |
| 19 | Zhou et al. 1987, No. 223-09 [43] | 21.1 | 341 | 559 | 0.9 | 25,600 | 320 | 0.0222 | 0.0180 |
| 20 | Zhou et al. 1987, No. 302-07 [43] | 28.8 | 341 | 559 | 0.7 | 25,600 | 480 | 0.0222 | 0.0070 |
| 21 | Kanda et al. 1988, 85STC-1 [48] | 27.9 | 374 | 506 | 0.11 | 62,500 | 750 | 0.0162 | 0.0040 |
| 22 | Kanda et al. 1988, 85STC-2 [48] | 27.9 | 374 | 506 | 0.11 | 62,500 | 750 | 0.0162 | 0.0040 |
| 23 | Kanda et al. 1988, 85STC-3 [48] | 27.9 | 374 | 506 | 0.11 | 62,500 | 750 | 0.0162 | 0.0040 |
| 24 | Arakawa et al. 1989, OA2 [49] | 31.8 | 340 | 249 | 0.18 | 32,400 | 225 | 0.0313 | 0.0020 |
| 25 | Muguruma et al. 1989, AL-1 [50] | 85.7 | 399.6 | 328.4 | 0.4 | 40,000 | 500 | 0.0380 | 0.0160 |
| 26 | Muguruma et al. 1989, AL-2 [50] | 85.7 | 399.6 | 328.4 | 0.63 | 40,000 | 500 | 0.0380 | 0.0160 |
| 27 | Mugumura et al. 1989, AH-2 [50] | 85.7 | 399.6 | 792.3 | 0.63 | 40,000 | 500 | 0.0380 | 0.0160 |
| 28 | Muguruma et al. 1989, BL-2 [50] | 115.8 | 399.6 | 328.4 | 0.42 | 40,000 | 500 | 0.0380 | 0.0160 |
| 29 | Muguruma et al. 1989, BH-2 [50] | 115.8 | 399.6 | 792.3 | 0.42 | 40,000 | 500 | 0.0380 | 0.0160 |
| 30 | Sakai et al. 1990, B1 [51] | 99.5 | 379 | 774 | 0.35 | 62,500 | 500 | 0.0243 | 0.0050 |
| 31 | Sakai et al. 1990, B2 [51] | 99.5 | 379 | 774 | 0.35 | 62,500 | 500 | 0.0243 | 0.0070 |
| 32 | Sakai et al. 1990, B4 [51] | 99.5 | 379 | 1126 | 0.35 | 62,500 | 500 | 0.0243 | 0.0050 |
| 33 | Sakai et al. 1990, B7 [51] | 99.5 | 339 | 774 | 0.35 | 62,500 | 500 | 0.0181 | 0.0050 |
| 34 | Amitsu et al. 1991, CB060C [52] | 46.3 | 441 | 414 | 0.74 | 77,284 | 323 | 0.0412 | 0.0090 |
| 35 | Atalay et al. 1975, No. 9 [53] | 33.3 | 363 | 392 | 0.26 | 93,025 | 1676 | 0.0163 | 0.0150 |
| 36 | Atalay et al. 1975, No. 11 [53] | 31 | 363 | 373 | 0.28 | 93,025 | 1676 | 0.0163 | 0.0150 |
| 37 | Atalay et al. 1975, No. 12 [53] | 31.8 | 363 | 373 | 0.27 | 93,025 | 1676 | 0.0163 | 0.0090 |
| 38 | Umehara et al. 1982, 2CUS [54] | 42 | 441 | 414 | 0.27 | 94,300 | 455 | 0.0301 | 0.0030 |
| 39 | Azizinamini et al. 1988, NC-2 [40] | 39.3 | 439 | 454 | 0.21 | 208,849 | 1372 | 0.0194 | 0.0220 |
| 40 | Azizinamini et al. 1988, NC-4 [40] | 39.8 | 439 | 616 | 0.31 | 208,849 | 1372 | 0.0194 | 0.0130 |
| 41 | Saatcioglu et al. 1989, U1 [55] | 43.6 | 430 | 470 | 0 | 122,500 | 1000 | 0.0321 | 0.0090 |
| 42 | Saatcioglu et al. 1989, U4 [55] | 32 | 438 | 470 | 0.15 | 122,500 | 1000 | 0.0321 | 0.0250 |
| 43 | Galeota et al. 1996, BA1 [56] | 80 | 430 | 430 | 0.2 | 62,500 | 1140 | 0.0151 | 0.0180 |
| 44 | Galeota et al. 1996, BA2 [56] | 80 | 430 | 430 | 0.3 | 62,500 | 1140 | 0.0151 | 0.0180 |
| 45 | Galeota et al. 1996, BA4 [56] | 80 | 430 | 430 | 0.2 | 62,500 | 1140 | 0.0151 | 0.0180 |
| 46 | Galeota et al. 1996, CA1 [56] | 80 | 430 | 430 | 0.2 | 62,500 | 1140 | 0.0151 | 0.0370 |
| 47 | Galeota et al. 1996, CA2 [56] | 80 | 430 | 430 | 0.3 | 62,500 | 1140 | 0.0151 | 0.0370 |
| 48 | Galeota et al. 1996, CA4 [56] | 80 | 430 | 430 | 0.3 | 62,500 | 1140 | 0.0151 | 0.0370 |
| 49 | Galeota et al. 1996, BB [56] | 80 | 430 | 430 | 0.2 | 62,500 | 1140 | 0.0603 | 0.0180 |
| 50 | Galeota et al. 1996, BB4 [56] | 80 | 430 | 430 | 0.3 | 62,500 | 1140 | 0.0603 | 0.0180 |
| 51 | Galeota et al. 1996, BB4B [56] | 80 | 430 | 430 | 0.3 | 62,500 | 1140 | 0.0603 | 0.0180 |
| 52 | Galeota et al. 1996, CB1 [56] | 80 | 430 | 430 | 0.2 | 62,500 | 1140 | 0.0603 | 0.0370 |
| 53 | Xiao et al. 1998, HC4-8L19-T10-0.1P [57] | 76 | 510 | 510 | 0.1 | 64,516 | 508 | 0.0355 | 0.0370 |
| 54 | Xiao et al. 1998, HC4-8L19-T10-0.2P [57] | 76 | 510 | 510 | 0.2 | 64,516 | 508 | 0.0355 | 0.0370 |
| 55 | Xiao et al. 1998, HC4-8L16-T10-0.1P [57] | 86 | 510 | 510 | 0.1 | 64,516 | 508 | 0.0246 | 0.0370 |
| 56 | Xiao et al. 1998, HC4-8L16-T10-0.2P [57] | 86 | 510 | 510 | 0.19 | 64,516 | 508 | 0.0246 | 0.0370 |
| 57 | Xiao et al. 1998, HC4-8L16-T6-0.1P [57] | 86 | 510 | 449 | 0.1 | 64,516 | 508 | 0.0246 | 0.0160 |
| 58 | Xiao et al. 1998, HC4-8L16-T6-0.2P [57] | 86 | 510 | 449 | 0.19 | 64,516 | 508 | 0.0246 | 0.0160 |
| 59 | Sugano. 1996, UC10H [58] | 118 | 393 | 1415 | 0.6 | 50,625 | 450 | 0.0186 | 0.0077 |
| 60 | Sugano. 1996, UC15H [58] | 118 | 393 | 1424 | 0.6 | 50,625 | 450 | 0.0186 | 0.0119 |
| 61 | Sugano. 1996, UC20H [58] | 118 | 393 | 1424 | 0.6 | 50,625 | 450 | 0.0186 | 0.0152 |
| 62 | Sugano. 1996, UC15L [58] | 118 | 393 | 1424 | 0.35 | 50,625 | 450 | 0.0186 | 0.0119 |
| 63 | Sugano. 1996, UC20L [58] | 118 | 393 | 1424 | 0.35 | 50,625 | 450 | 0.0186 | 0.0152 |
| 64 | Bayrak et al. 1996, ES-1HT [37] | 72.1 | 454 | 463 | 0.5 | 93,025 | 1842 | 0.0258 | 0.0320 |
| 65 | Bayrak et al. 1996, AS-3HT [37] | 71.8 | 454 | 542 | 0.5 | 93,025 | 1842 | 0.0258 | 0.0280 |
| 66 | Bayrak et al. 1996, AS-4HT [37] | 71.9 | 454 | 463 | 0.5 | 93,025 | 1842 | 0.0258 | 0.0510 |
| 67 | Bayrak et al. 1996, AS-5HT [37] | 101.8 | 454 | 463 | 0.45 | 93,025 | 1842 | 0.0258 | 0.0400 |
| 68 | Bayrak et al. 1996, AS-6HT [37] | 101.9 | 454 | 463 | 0.46 | 93,025 | 1842 | 0.0258 | 0.0670 |
| 69 | Bayrak et al. 1996, ES-8HT [37] | 102.2 | 454 | 463 | 0.47 | 93,025 | 1842 | 0.0258 | 0.0430 |
| 70 | Saatcioglu et al. 1999, BG-2 [59] | 34 | 455.6 | 570 | 0.43 | 122,500 | 1645 | 0.0195 | 0.0200 |
| 71 | Saatcioglu et al. 1999, BG-9 [59] | 34 | 427.8 | 580 | 0.46 | 122,500 | 1645 | 0.0328 | 0.0130 |
| 72 | Saatcioglu et al. 1999, BG-10 [59] | 34 | 427.8 | 570 | 0.46 | 122,500 | 1645 | 0.0328 | 0.0270 |
| 73 | Matamoros et al. 1999, C10-05N [60] | 69.6 | 586.1 | 406.8 | 0.05 | 41,209 | 610 | 0.0193 | 0.0100 |
| 74 | Matamoros et al. 1999, C10-05S [60] | 69.6 | 586.1 | 406.8 | 0.05 | 41,209 | 610 | 0.0193 | 0.0100 |
| 75 | Matamoros et al. 1999, C10-20N [60] | 65.5 | 572.3 | 513.7 | 0.21 | 41,209 | 610 | 0.0193 | 0.0100 |
| 76 | Matamoros et al. 1999, C5-20N [60] | 48.3 | 586.1 | 406.8 | 0.14 | 41,209 | 610 | 0.0193 | 0.0100 |
| 77 | Matamoros et al. 1999, C5-40N [60] | 38.1 | 572.3 | 513.7 | 0.36 | 41,209 | 610 | 0.0193 | 0.0100 |
| 78 | Matamoros et al. 1999, C5-40S [60] | 38.1 | 573.3 | 514.7 | 0.36 | 41,209 | 610 | 0.0193 | 0.0100 |
| 79 | Aboutaha et al. 1999, ORC3 [61] | 83 | 414 | 414 | 0.16 | 154,940 | 1829 | 0.0253 | 0.0070 |
| 80 | Thomsen et al. 1994, A3 [62] | 86.3 | 517.1 | 793 | 0.2 | 23,225.76 | 596.9 | 0.0245 | 0.0134 |
| 81 | Thomsen et al. 1994, B2 [62] | 83.4 | 455.1 | 793 | 0.1 | 23,225.76 | 596.9 | 0.0245 | 0.0152 |
| 82 | Paultre et al. 2000, No. 1006025 [63] | 93.3 | 430 | 391 | 0.28 | 93,025 | 2000 | 0.0215 | 0.0399 |
| 83 | Paultre et al. 2000, No. 1006040 [63] | 98.2 | 451 | 418 | 0.39 | 93,025 | 2000 | 0.0215 | 0.0399 |
| 84 | Paultre et al. 2000, No. 10013015 [63] | 94.8 | 451 | 391 | 0.14 | 93,025 | 2000 | 0.0215 | 0.0184 |
| 85 | Paultre et al. 2000, No. 10013025 [63] | 97.7 | 430 | 391 | 0.26 | 93,025 | 2000 | 0.0215 | 0.0184 |
| 86 | Paultre et al. 2001, No. 1206040 [64] | 109.2 | 446 | 438 | 0.41 | 93,025 | 2000 | 0.0215 | 0.0399 |
| 87 | Paultre et al. 2001, No. 1008040 [64] | 104.2 | 446 | 825 | 0.37 | 93,025 | 2000 | 0.0215 | 0.0298 |
| 88 | Paultre et al. 2001, No. 1005552 [64] | 104.5 | 446 | 744 | 0.53 | 93,025 | 2000 | 0.0215 | 0.0434 |
| 89 | Paultre et al. 2001, No. 1006052 [64] | 109.4 | 446 | 492 | 0.51 | 93,025 | 2000 | 0.0215 | 0.0399 |
| 90 | Bechtoula et al. 2002, D1N30 [65] | 37.6 | 461 | 485 | 0.3 | 62,500 | 625 | 0.0243 | 0.0109 |
| 91 | Bechtoula et al. 2002, D1N60 [65] | 37.6 | 461 | 485 | 0.6 | 62,500 | 625 | 0.0243 | 0.0109 |
| 92 | Bechtoula et al. 2002, L1N60 [65] | 39.2 | 388 | 524 | 0.57 | 360,000 | 1200 | 0.0169 | 0.0182 |
| 93 | ZHANG. 2015, Z1 [33] | 42.27 | 480 | 417.5 | 0.6 | 90,000 | 1750 | 0.0205 | 0.0180 |
| 94 | ZHANG, 2015, Z2 [33] | 42.27 | 480 | 417.5 | 0.3 | 90,000 | 1750 | 0.0205 | 0.0180 |
| 95 | ZHANG. 2015, Z3 [33] | 42.27 | 480 | 417.5 | 0.9 | 90,000 | 1750 | 0.0205 | 0.0180 |
| 96 | ZHANG. 2015, Z4 [33] | 42.27 | 480 | 417.5 | 0.9 | 90,000 | 1750 | 0.0205 | 0.0029 |
| 97 | ZHANG. 2015, Z5 [33] | 42.27 | 480 | 417.5 | 0.9 | 90,000 | 1750 | 0.0419 | 0.0180 |
| 98 | ZHANG. 2015, Z6 [33] | 42.27 | 480 | 417.5 | 0.6 | 90,000 | 1080 | 0.0205 | 0.0180 |
References
- Priestley, M. Performance based seismic design. Bull. N. Z. Soc. Earthq. Eng. 2000, 33, 325–346. [Google Scholar] [CrossRef]
- Sun, B.; Yan, P. Damage characteristics and seismic capacity of buildings during Nepal M s 8.1 earthquake. Earthq. Eng. Eng. Vib. 2015, 14, 571–578. [Google Scholar] [CrossRef]
- Chopra, A.K.; Kan, C. Effects of stiffness degradation on ductility requirements for multistorey buildings. Earthq. Eng. Struct. Dyn. 1973, 2, 35–45. [Google Scholar] [CrossRef]
- Ibarra, L.F.; Medina, R.A.; Krawinkler, H. Hysteretic models that incorporate strength and stiffness deterioration. Earthq. Eng. Struct. Dyn. 2005, 34, 1489–1511. [Google Scholar] [CrossRef]
- Park, Y.J.; Reinhorn, A.M.; Kunnath, S.K. IDARC: Inelastic Damage Analysis of Reinforced Concrete Frame–Shear-Wall Structures; National Center for Earthquake Engineering Research: Buffalo, NY, USA, 1987. [Google Scholar]
- Miramontes, D.; Merabet, O.; Reynouard, J. Beam global model for the seismic analysis of RC frames. Earthq. Eng. Struct. Dyn. 1996, 25, 671–688. [Google Scholar] [CrossRef]
- Ozcebe, G.; Saatcioglu, M. Hysteretic shear model for reinforced concrete members. J. Struct. Eng. 1989, 115, 132–148. [Google Scholar] [CrossRef]
- Sivaselvan, M.V.; Reinhorn, A.M. Hysteretic Models for Cyclic Behavior of Deteriorating Inelastic Structures; Multidisciplinary Center for Earthquake Engineering Research: Buffalo, NY, USA, 1999. [Google Scholar]
- Karayannis, C.G.; Golias, E.; Naoum, M.C.; Chalioris, C.E. Efficacy and Damage Diagnosis of Reinforced Concrete Columns and Joints Strengthened with FRP Ropes Using Piezoelectric Transducers. Sensors 2022, 22, 8294. [Google Scholar] [CrossRef] [PubMed]
- Kytinou, V.K.; Kosmidou, P.M.K.; Chalioris, C.E. Numerical analysis exterior RC beam-column joints with CFRP bars as beam’s tensional reinforcement under cyclic reversal deformations. Appl. Sci. 2022, 12, 7419. [Google Scholar] [CrossRef]
- Thomoglou, A.; Rousakis, T.; Karabinis, A. Numerical modeling of shear behavior of URM strengthened with FRCM or FRP subjected to seismic loading. In Proceedings of the 16th European Conference on Earthquake Engineering, Thessaloniki, Greece, 18–20 June 2018; pp. 18–21. [Google Scholar]
- Roufaiel, M.S.; Meyer, C. Analytical modeling of hysteretic behavior of R/C frames. J. Struct. Eng. 1987, 113, 429–444. [Google Scholar] [CrossRef]
- Chung, Y.S.; Meyer, C.; Shinozuka, M. Modeling of concrete damage. Struct. J. 1989, 86, 259–271. [Google Scholar]
- Youssef, M.; Ghobarah, A. Strength deterioration due to bond slip and concrete crushing in modeling of reinforced concrete members. Struct. J. 1999, 96, 956–966. [Google Scholar]
- Kunnath, S.K.; Reinhorn, A.M.; Park, Y.J. Analytical modeling of inelastic seismic response of R/C structures. J. Struct. Eng. 1990, 116, 996–1017. [Google Scholar] [CrossRef]
- Rahnama, M.; Krawinkler, H. Effects of Soft Soil and Hysteresis Model on Seismic Demands; John A. Blume Earthquake Engineering Center: Standford, UK, 1993; Volume 108. [Google Scholar]
- Sucuoglu, H.; Erberik, A. Energy-based hysteresis and damage models for deteriorating systems. Earthq. Eng. Struct. Dyn. 2004, 33, 69–88. [Google Scholar] [CrossRef]
- Lee, C.S.; Jeon, J.S. Adaptive hysteretic model for reinforced concrete columns including variations in axial force and shear span length. Earthq. Eng. Struct. Dyn. 2021, 50, 4001–4031. [Google Scholar] [CrossRef]
- Qu, Z.; Ye, L. Strength deterioration model based on effective hysteretic energy dissipation for RC-members under cyclic loading. In Proceedings of the Joint Conference Proceedings, 7th International Conference on Urban Earthquake Engineering (7CUEE) & 5th International Conference on Earthquake Engineering (5ICEE), Tokyo, Japan, 3–5 March 2010. [Google Scholar]
- Huang, C.; Li, Y.; Gu, Q.; Liu, J. Machine learning–based hysteretic lateral force-displacement models of reinforced concrete columns. J. Struct. Eng. 2022, 148, 04021291. [Google Scholar] [CrossRef]
- FEMA, P. Effects of Strength and Stiffness Degradation on Seismic Response. FEMA P440A 2009. Available online: https://www.nehrp.gov/pdf/femaP440A.pdf (accessed on 22 March 2023).
- Sivaselvan, M.V.; Reinhorn, A.M. Hysteretic models for deteriorating inelastic structures. J. Eng. Mech. 2000, 126, 633–640. [Google Scholar] [CrossRef]
- Elwood, K.J.; Eberhard, M.O. Effective Stiffness of Reinforced Concrete Columns. ACI Struct. J. 2009, 106, 476–484. [Google Scholar]
- LeBorgne, M.; Ghannoum, W. Calibrated analytical element for lateral-strength degradation of reinforced concrete columns. Eng. Struct. 2014, 81, 35–48. [Google Scholar] [CrossRef]
- Haselton, C.B.; Liel, A.B.; Taylor-Lange, S.C.; Deierlein, G.G. Calibration of model to simulate response of reinforced concrete beam-columns to collapse. ACI Struct. J. 2016, 113, 1141–1152. [Google Scholar] [CrossRef]
- Lee, C.S.; Han, S.W. Computationally effective and accurate simulation of cyclic behaviour of old reinforced concrete columns. Eng. Struct. 2018, 173, 892–907. [Google Scholar] [CrossRef]
- Dowell, O.; Seible, F.; Wilson, E.L. Pivot hysteresis model for reinforced concrete members. ACI Struct. J. 1998, 95, 607–617. [Google Scholar]
- Clough, R.W. Effect of Stiffness Degradation on Earthquake Ductility Requirements; Report 66-16, Structural and Materials Research; Structural Engineering Laboratory, University of California: Berkeley, CA, USA, 1966. [Google Scholar]
- Peng, F.; Han-Lin, Q.; Lie-Ping, Y. Discussion and definition on yield points of materials, members and structures. Eng. Mech. 2017, 34, 36–46. [Google Scholar]
- Zhang, G.; Sun, B.; Bai, W.; Zhang, H. Prediction of the Yield Performance and Failure Mode of RC Columns under Cyclic-Load by PSO-BP Neural Network. Buildings 2022, 12, 507. [Google Scholar] [CrossRef]
- Takemura, H.; Kawashima, K. Effect of Loading Hysteresis on Ductility Capacity of Reinforced Concrete Bridge Piers. J. Struct. Eng. 1997, 43, 849–858. [Google Scholar]
- Liu, B.; Bai, S.; Lai, M. Experimental study of low-cycle behavior of concrete columns. Earthq. Eng. Eng. Vib. 1998, 18, 82–89. [Google Scholar]
- Zhang, L.; Xie, X.; Zhang, H.; Mao, C. A new method for safety assessment of reinforced concrete frame structures after earthquakes by using damage index: Experimental research. Earthq. Eng. Eng. Dyn. 2015, 35, 15. [Google Scholar]
- Brown, S.H. Multiple linear regression analysis: A matrix approach with MATLAB. Ala. J. Math. 2009, 34, 1–3. [Google Scholar]
- Cameron, A.C.; Windmeijer, F.A. An R-squared measure of goodness of fit for some common nonlinear regression models. J. Econom. 1997, 77, 329–342. [Google Scholar] [CrossRef]
- Monti, G.; Spacone, E. Reinforced concrete fiber beam element with bond-slip. J. Struct. Eng. 2000, 126, 654–661. [Google Scholar] [CrossRef]
- Bayrak, O.; Sheikh, S. Confinement steel requirements for high strength concrete columns. In Proceedings of the 11th World Conference on Earthquake Engineering, Acapulco, Mexico, 23–28 June 1996. [Google Scholar]
- Ang, B.; Priestley, M.; Park, R. Ductility of Reinforced Bridge Piers under Seismic Loading; Report 81-83; University of Canterbury: Christchurch, New Zealand, 1981; Available online: https://ir.canterbury.ac.nz/bitstream/handle/10092/3594/Thesis_fulltext.pdf;jsessionid=43A0460A599DE4FC4092416C1F3D7676?sequence=1 (accessed on 22 March 2023).
- Tanaka, H. Effect of Lateral Confining Reinforcement on the Ductile Behaviour of Reinforced Concrete Columns. 1990. Available online: https://ir.canterbury.ac.nz/handle/10092/1241 (accessed on 22 March 2023).
- Azizinamini, A.; Johal, L.S.; Hanson, N.W.; Musser, D.W.; Corley, W.G. Effects of Transverse Reinforcement on Seismic Performance of Columns—A Partial Parametric Investigation. Project No. CR 1988. Available online: https://nehrpsearch.nist.gov/static/files/NSF/PB89148068.pdf (accessed on 22 March 2023).
- Zahn, F.A.; Park, R.; Priestley, M.J.N. Design of Reinforced Bridge Columns for Strength and Ductility; Report 86-7; Department of Civil Engineering, University of Canterbury: Christchurch, New Zealand, 1986; 330p. [Google Scholar]
- Watson, S. Design of Reinforced Concrete Frames of Limited Ductility; Report 89-4; Department of Civil Engineering, University of Canterbury: Christchurch, New Zealand, 1989; 232p. [Google Scholar]
- Zhou, X.; Satoh, T.; Jiang, W.; Ono, A.; Shimizu, Y. Behavior of reinforced concrete short column under high axial load. Trans. Jpn. Concr. Inst. 1987, 9, 541–548. [Google Scholar]
- Wight, J.K. Shear Strength Decay in Reinforced Concrete Columns Subjected to Large Deflection Reversals; University of Illinois at Urbana-Champaign: Champaign, IL, USA, 1973. [Google Scholar]
- Gill, W.D.; Park, R.; Priestley, M.J.N. Ductility of Rectangular Reinforced Concrete Columns With Axial Load; Report 79-1; Department of Civil Engineering, University of Canterbury: Christchurch, New Zealand, 1979; 136p. [Google Scholar]
- Soesianawati, M.T.; Park, R.; Priestley, M.J.N. Limited Ductility Design of Reinforced Concrete Columns; Report 86-10; Department of Civil Engineering, University of Canterbury: Christchurch, New Zealand, 1986; 208p. [Google Scholar]
- Ohno, T.; Nishioka, T. An experimental study on energy absorption capacity of columns in reinforced concrete structures. Doboku Gakkai Ronbunshu 1984, 1984, 23–33. [Google Scholar] [CrossRef]
- Kanda, M. Analytical study on elasto-plastic hysteretic behavior of reinforced concrete members. Trans. Jpn. Concr. Inst. 1988, 10, 257–264. [Google Scholar]
- Arakawa, T.; Arai, Y.; Mizoguchi, M.; Yoshida, M. Shear resisting behavior of short reinforced concrete columns under biaxial bending-shear. Trans. Jpn. Concr. Inst. 1989, 11, 317–324. [Google Scholar]
- Muguruma, H.; Watanabe, F.; Komuro, T. Applicability of high strength concrete to reinforced concrete ductile column. Trans. Jpn. Concr. Inst. 1989, 11, 309–316. [Google Scholar]
- Sakai, Y. Experimental Studies on Flexural Behavior of Reinforced Concrete Columns Using High-Strength Concrete; Japan Concrete Institute: Tokyo, Japan, 1990. [Google Scholar]
- Amitsu, S.; Shirai, N.; Adachi, H.; Ono, A. Deformation of reinforced concrete column with high or fluctuating axial force. Trans. Jpn. Concr. Inst. 1991, 13, 355–362. [Google Scholar]
- Atalay, M.B.; Penzien, J. The Seismic Behavior of Critical Regions of Reinforced Concrete Components as Influenced by Moment, Shear and Axial Force; Earthquake Engineering Research Center, University of California Berkeley: Berkeley, CA, USA, 1975. [Google Scholar]
- Umehara, H.; Jirsa, J.O. Shear Strength and Deterioration of Short Reinforced Concrete Columns Under Cyclic Deformations; PMFSEL Report No. 82-3; Department of Civil Engineering, University of Texas: Austin, TX, USA, 1982; 256p. [Google Scholar]
- Saatcioglu, M.; Ozcebe, G. Response of reinforced concrete columns to simulated seismic loading. Struct. J. 1989, 86, 3–12. [Google Scholar]
- Galeota, D.; Giammatteo, M.; Marino, R. Seismic resistance of high strength concrete columns. In Proceedings of the 11th World Conference on Earthquake Engineering, Acapulco, Mexico, 23–28 June 1996. [Google Scholar]
- Xiao, Y.; Martirossyan, A. Seismic performance of high-strength concrete columns. J. Struct. Eng. 1998, 124, 241–251. [Google Scholar] [CrossRef]
- Sugano, S. Seismic behavior of reinforced concrete columns which used ultra-high-strength concrete. In Proceedings of the Eleventh World Conference on Earthquake Engineering, Paper, Acapulco, Mexico, 23–28 June 1996; p. 1383. [Google Scholar]
- Saatcioglu, M.; Grira, M. Confinement of reinforced concrete columns with welded reinforced grids. Struct. J. 1999, 96, 29–39. [Google Scholar]
- Matamoros, A.B. Study of Drift Limits for High-Strength Concrete Columns; University of Illinois at Urbana-Champaign: Champaign, IL, USA, 1999. [Google Scholar]
- Aboutaha, R.; Machado, R. Seismic resistance of steel-tubed high-strength reinforced-concrete columns. J. Struct. Eng. 1999, 125, 485–494. [Google Scholar] [CrossRef]
- Thomson, J.H.; Wallace, J.W. Lateral load behavior of reinforced concrete columns constructed using high-strength materials. Struct. J. 1994, 91, 605–615. [Google Scholar]
- Legeron, F.; Paultre, P. Behavior of high-strength concrete columns under cyclic flexure and constant axial load. Struct. J. 2000, 97, 591–601. [Google Scholar]
- Paultre, P.; Légeron, F.; Mongeau, D. Influence of concrete strength and transverse reinforcement yield strength on behavior of high-strength concrete columns. Struct. J. 2001, 98, 490–501. [Google Scholar]
- Kono, S.; Watanabe, F. Damage evaluation of reinforced concrete columns under multiaxial cyclic loadings. In Proceedings of the Second US-JAPAN Workshop on Performance-Based Earthquake Engineering Methodology for Reinforced Concrete Building Structures, Hokkaido, Japan, 11–13 September 2000; pp. 221–231. [Google Scholar]
Disclaimer/Publisher’s Note: The statements, opinions and data contained in all publications are solely those of the individual author(s) and contributor(s) and not of MDPI and/or the editor(s). MDPI and/or the editor(s) disclaim responsibility for any injury to people or property resulting from any ideas, methods, instructions or products referred to in the content. |
© 2023 by the authors. Licensee MDPI, Basel, Switzerland. This article is an open access article distributed under the terms and conditions of the Creative Commons Attribution (CC BY) license (https://creativecommons.org/licenses/by/4.0/).