Article

Seismic Damage “Semaphore” Based on the Fundamental Period Variation: A Probabilistic Seismic Demand Assessment of Steel Moment-Resisting Frames

by
Sergio A. Díaz
1,
Luis A. Pinzón
2,3,*,
Yeudy F. Vargas-Alzate
4 and
René S. Mora-Ortiz
1
1
División Académica de Ingeniería y Arquitectura, Universidad Juárez Autónoma de Tabasco, Villahermosa, Tabasco 86040, Mexico
2
Scientific and Technological Research Center, Universidad Católica Santa María La Antigua, Panama City 0819, Panama
3
Sistema Nacional de Investigación (SNI), Secretaría Nacional de Ciencia, Tecnología e Innovación (SENACYT), Panama City 0824, Panama
4
Departament d’Enginyeria Civil y Ambiental, Universitat Politècnica de Catalunya Barcelona Tech (UPC), 08034 Barcelona, Spain
*
Author to whom correspondence should be addressed.
Buildings 2023, 13(4), 1009; https://doi.org/10.3390/buildings13041009
Submission received: 15 March 2023 / Revised: 3 April 2023 / Accepted: 7 April 2023 / Published: 11 April 2023
(This article belongs to the Special Issue Seismic Risk Analysis and Management of Structure Systems)

Abstract

:
During strong earthquakes, structural damage usually occurs, resulting in a degradation of the overall stiffness of the affected structures. This degradation produces a modification in the dynamic properties of the structures, for instance, in the fundamental period of vibration (T1). Hence, the variation of T1 could be used as an indicator of seismic structural damage. In this article, a seismic damage assessment in four generic typologies of steel buildings was carried focused on verifying the variation of T1. To do so, several seismic damage states were calculated using the maximum inter-story drift ratio, MIDR, and following the Risk-UE guidelines. Then, a series of probabilistic nonlinear static analyses was implemented using Monte Carlo simulations. The probabilistic approach allows one to vary the main mechanical properties of the buildings, thus analyzing in this research 4000 buildings (1000 building samples for each of the four generic typologies). The variation of T1 was estimated using the capacity spectrum, and it was related to the MIDR for each damage state. As a main result of this study, the expected variation of T1 for several damage states is provided. Finally, a proposal for a seismic damage preventive “semaphore” and fragility curves are presented. These results may be useful as parameters or criteria in the evaluation of on-site structural monitoring for steel buildings.

1. Introduction

Earthquakes can cause significant consequences in exposed regions to high seismic hazards. Some of these regions have vulnerable structures due to the low quality of materials and construction practice. This can be related to socioeconomic conditions or the scant interest of governments in compliance with the standards required in construction codes. An alternative to prevent the possible effects of earthquakes in cities is to undertake studies related to the seismic–structural vulnerability of structures [1,2,3]. Proper knowledge about the vulnerability of buildings is fundamental to help engineers in assessing and strengthening existing structures [4]. In this respect, seismic vulnerability studies allow the performance of structures to be analyzed against expected actions. For a building, this mainly depends on its characteristics (structural system, number of stories, among others) and the level of seismic actions to which it will be subjected [5].
Seismic vulnerability in buildings can be reduced by complying with the performance level control criteria of current structural codes [6,7]. Assessing code compliance can be carried out from two perspectives: (1) evaluating and monitoring the structural health, and (2) structural assessment through complex numerical models. The first approach is carried out with the instrumentation and monitoring of the building. Its objective is to verify the behavior of the structure accurately. In brief, the Structural Health Monitoring (SHM) process consists of measuring the evolution of representative structural parameters in a certain period of time. To do so, strategically located sensors are placed in the structure to be analyzed in order to collect temporary records of acceleration, velocity, or displacement, which serve to determine the fundamental vibration frequencies of the building. In this way, the information obtained helps plan maintenance activities, verify design hypotheses, reduce uncertainty about the structural elements, and guarantee structural safety on the damage control proposed by current regulations. These methodologies represent the most accurate way to study the structural vulnerability of a building. Still, they carry a high cost, which is why they are solutions for exceptional cases and not oriented to monitor an entire city [8,9,10,11]. The second approach is based on the determination of the structural response of buildings through numerical modelling using static or dynamic methods. Both types of analyses are powerful tools for understanding and quantifying the performance of structures for evaluating expected damage.
Current technological advances facilitate the processing and treatment of large amounts of data in a relative simplified manner. They allow complex probabilistic numerical models to be developed for civil structures and for nonlinear static (NLSA) and dynamic (NLDA) analyses to be computed affordably and in a reasonable amount of time.
In probabilistic approaches, both the uncertainties of seismic actions and building properties have been incorporated in previous studies [7,12] through computational algorithms, e.g., the Monte Carlo method [13,14,15,16]. As a result, a global view of the expected performance of buildings is obtained considering the main uncertainties in the implied variables.
The structural design codes regulate the buildings’ structural safety, the materials’ quality and the correct application of the design criteria. They also provide the design earthquake motion (design spectrum) and seismic parameters of the building (ductility Q, response modification Ro, redundancy ρ, and irregularity factors α). Furthermore, they suggest engineering demand parameters to control expected damages, e.g., the Maximum Inter-story Drift Ratio (MIDR) [17,18]. The MIDR is calculated as the maximum absolute difference in displacement between consecutive stories divided by the height at each level. This parameter has been related to the expected damage of buildings in several studies [17,19,20,21]. On the other hand, during strong earthquakes, structural damage usually occurs, resulting in a degradation of the overall stiffness of the affected structures. This degradation produces a modification in the dynamic properties of the structures, for example, in the fundamental period of vibration (T1). In the last decade, variation of T1 has been used as a parameter for seismic damage control, and several studies related to this topic have been developed. Regarding reinforced concrete buildings, research based on the evaluation of the fundamental period of undamaged and damaged structures [22,23,24], correlation of structural seismic damage with a fundamental period [23], prediction of the fundamental period of regular frame buildings [25], a fundamental-period-preserving retrofit procedure for low-rise buildings with supplemental inerters [26], and parametric studies on the variation of the fundamental period [27] have been carried out. As for steel buildings, researchers have proposed modifications to current formulations to approximate fundamental periods for seismic design of steel buildings assigned to high-risk categories that incorporate the change in system strength [28]. Furthermore, research related to the elongation of the period in buildings during seismic events has also been carried out [29]. These research studies show the importance of the T1 parameter as a damage indicator in seismic evaluations of different types of buildings. From the above, establishing objective limit values in MIDR and T1 parameters prevents damage, loss of functionality of the building, and human and economic losses due to high-intensity seismic action. These limit values range from moderate damage to the collapse of the building.
In line with the above, this research presents a proposal for a seismic damage preventive “semaphore” and fragility curves based on variations of T1. To develop these elements, a seismic damage assessment considering four generic typologies of the steel buildings located in Mexico is performed with the purpose of verifying the variation of T1. These buildings are located in two cities in Mexico, namely, Oaxaca City in Oaxaca state, and Tuxtla Gutiérrez City in Chiapas state. These are cities with very high and high seismic hazards, respectively [30]. Then, different seismic damage states are estimated using the MIDR and following the Risk-UE guidelines [31]. To do so, probabilistic nonlinear static analyses are implemented using Monte Carlo simulations. With the probabilistic approach, the uncertainty in the main mechanical properties of the four generic typologies of buildings is considered, basing this research on the study of 4000 building models (1000 building samples for each of the 4 typologies). The variation of T1 is estimated using the capacity spectrum, and it is related to the MIDR for each damage state.

2. Buildings

Low-rise (3-story) and mid-rise (7-story) steel buildings located in Oaxaca (OA) and Tuxtla Gutiérrez (TG) cities in Mexico were used as case studies. These buildings were designed for office purposes [32] following the MDOC-CFE [30] regulations for OA and TG cities. The dead (DL) and live (LL) load criteria of the NTCDS-RCDF [33] and the design standards ANSI/AISC 360-16 [34] were employed in the projection of these structures. Table 1 shows the considered loads, and Table 2 and Table 3 show the list of steel wide flange sections for beams and columns. Figure 1 shows a 2-D view of the main frames (Special Moment Frames, SMF). The SMFs satisfy the AISC criterion “strong-column–weak-beam”, and the structural sections of the beams and columns meet the slenderness criterion of the AISC-341-16 [34]. The beams consider continuous lateral bracing for their compression flanges. The slabs of the buildings are considered rigid with a composite deck system (concrete slab–steel deck with shear connectors). Connections between elements are fully restrained (FR) [34]. The modal analysis and seismic response evaluation were performed in SeismoStruct [35]. Table 4 shows the foremost characteristics of the modal analysis.
The modal characteristics show that the structural response of these buildings is dominated by their fundamental period of vibration. Therefore, it was expected that their seismic responses would be consistent using both NLSA and NLDA [7,15,36]. Based on the above and to simplify the probabilistic approach of this study, the analyses were carried out using the NLSA in SeismoStruct [35] and the capacity spectrum method of the ATC-40 [37]. The NLSA adopted are not novel like the NLDA, but that does not detract from the validity and simplicity, especially for evaluations of regular buildings with structural responses dominated by their first mode of vibration or fundamental period, as the buildings analyzed here [7,15,36]. The NLDA has advantages but entails greater complexity and high computational cost with probabilistic analysis if one does not use a well-established computational tool. The implementation of simple tools has been sought to carry out seismic evaluations in a practical way in the field of applied structural engineering [15,36,38].
The linear and non-linear behaviors of the beams and columns were modelled following the fiber approach, where each fiber is associated with uniaxial stress (σ)–strain (ε) relationships. Thus, the cross-section behavior is defined by a uniaxial bilinear σ-ε model with kinematic strain hardening, which is commonly used in the modelling of structural steel elements [35]. The deterministic five model-calibrating parameters used were as follows: Modulus of elasticity, Es = 2.00 × 10⁸ kN/m2; Yield strength, fy = 396,448.54 kN/m2; Strain hardening parameter, μ = 0.01; Fracture/buckling strain = 0.10, and Specific weight, γ = 78.00 kN/m3. Finally, two performance criteria of the sections were defined: (1) yielding of steel (εy), steel strains larger than the ratio between yield strength and modulus of elasticity (εy = fy/Es); and (2) fracture of steel (εu), steel strains larger than the fracture strain, which in this study was εu = 0.06.

3. Probabilistic Variables

The randomness in the mechanical properties of the cross-sections and the seismic actions represent the variables that provide more significant uncertainty in the structural response of buildings [16,39]. Thus, a set of probabilistic numerical models is generated to represent the random nature of the expected behavior of the buildings. These models consider the uncertainties in the mechanical properties of the steel W-type sections that are relevant to the seismic response. In summary, the three variables influencing the linear and non-linear response are (1) yield strength, fy; (2) modulus of elasticity, Es; and (3) fracture strain, εu. Table 5 shows the mean values ( μ ¯ ), the coefficients of variation (CVs), and standard deviations ( σ ¯ ) for each variable. The Monte Carlo method was used [40,41] to generate the random sets. In addition, mean values of the three variables were used to perform and conclude about deterministic approaches.
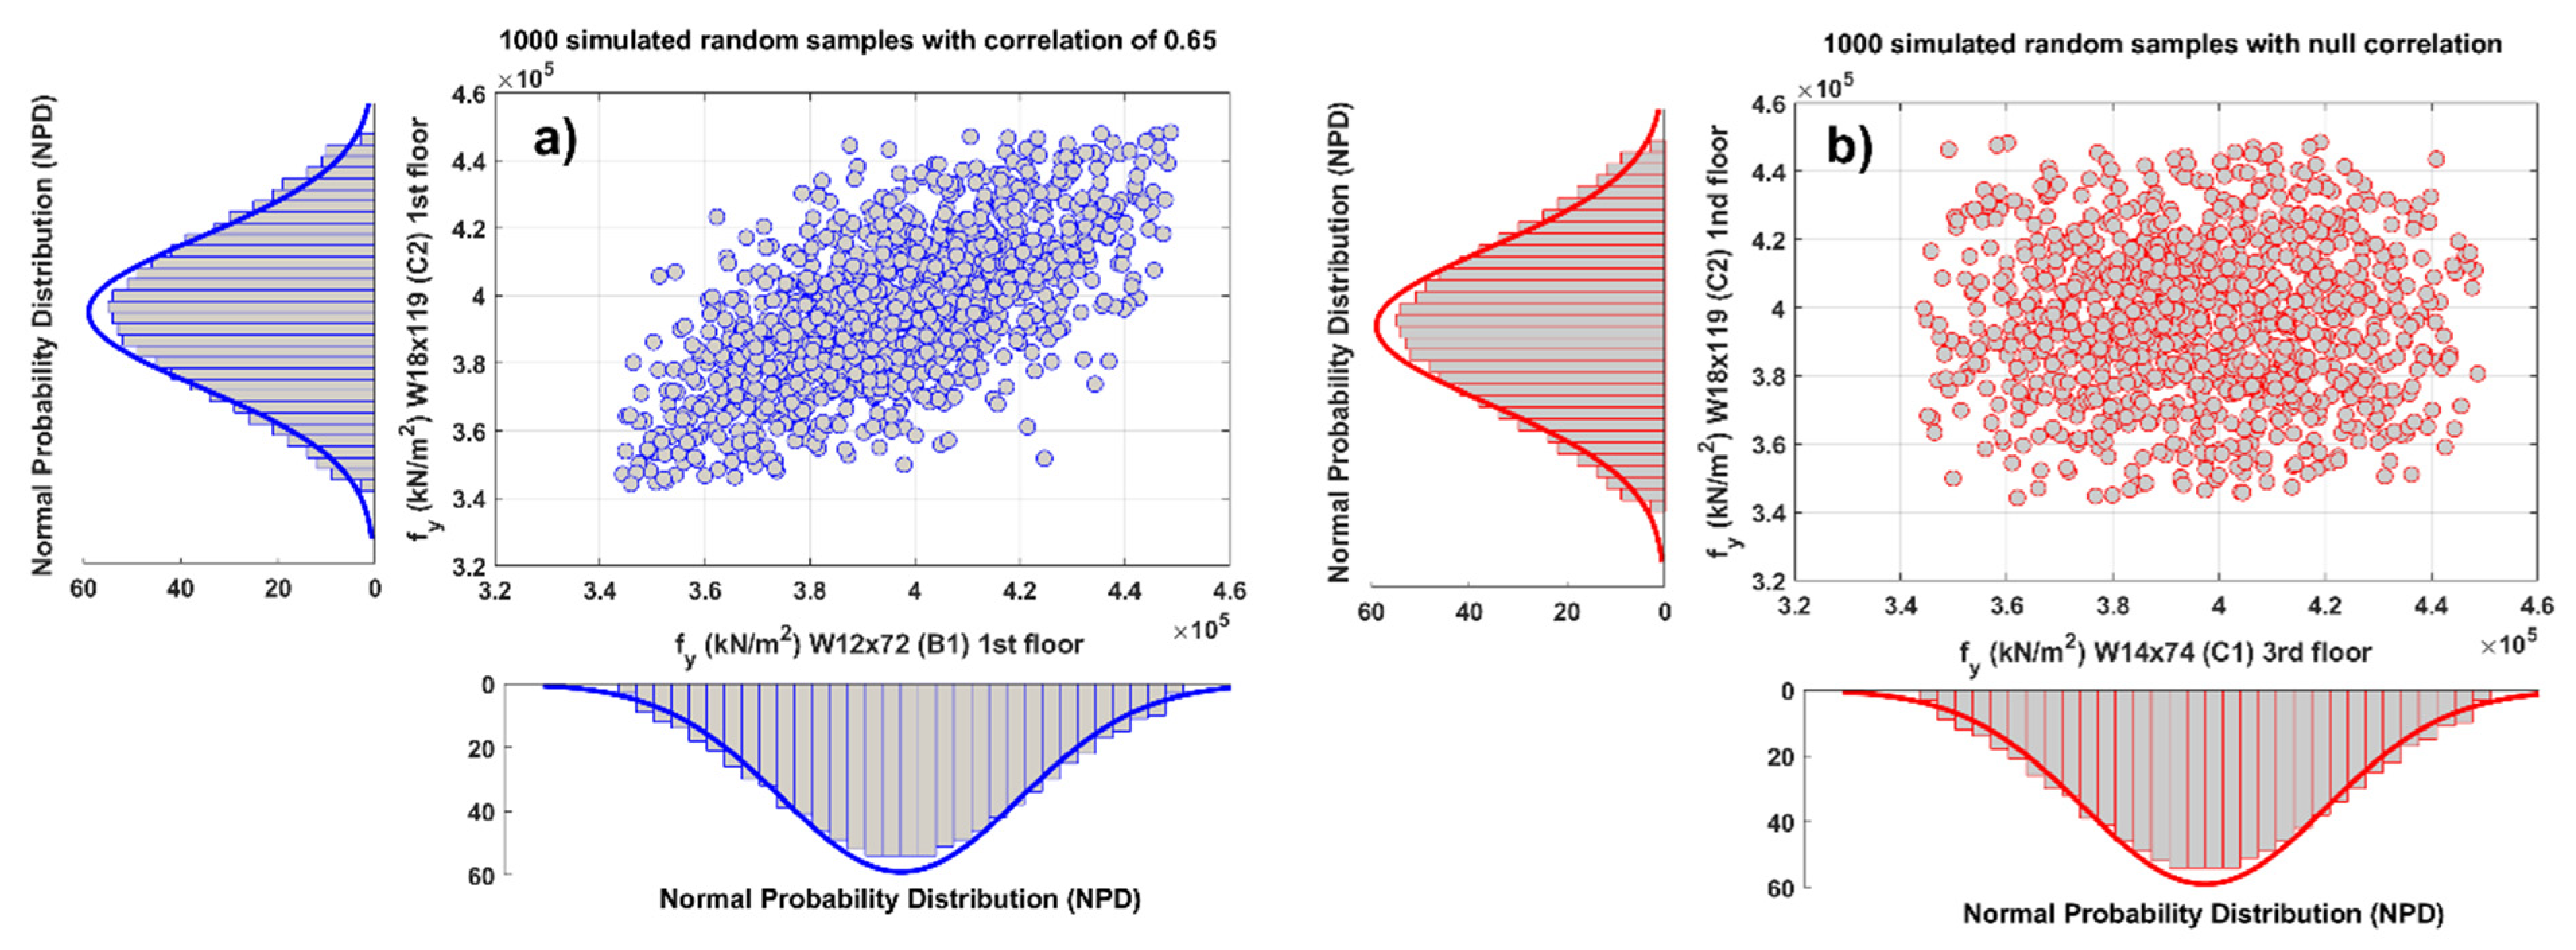
Variables shown in Table 5 follow a Normal Probability Distribution (NPD), and the sampling was limited to a range of μ ¯ ± 2 σ ¯ . Thus, overestimated, or underestimated values of the variables were excluded. Likewise, the steel sections (beams and columns) of the same story of the buildings were considered with a correlation of 0.65, since they could be from the same batch of steel production [14]. Sections of different stories were considered with null correlation. Therefore, a set of 1000 random samples for each of the three variables was generated. Figure 2 shows an example of the NPD with a 0.65 correlation and NPD with a null correlation of the variable fy in the beams and columns. Additionally, Figure 2 shows the assumed NPD and truncated NPD with the histogram of the samples obtained through the Monte Carlo method. Good agreement between the histogram of the samples and the target NPDs can be seen. As pointed out above, 1000 structural random samples were used. This number was determined as follows: Several random samples were generated according to the truncated NPD. For every 100 new samples, the mean value and the standard deviation of the overall samples were obtained. Once 1000 samples were reached, no significant variations were obtained in their mean value and standard deviation by adding more samples. Therefore, 1000 was considered an adequate number of samples representing the predefined truncated NPD. This was attributed to the fact that the Monte Carlo method is based on the Latin Hypercube Sampling (LHS) technique [44], and this LHS technique avoids duplicating case combinations so that fewer samples adequately represent the target NPD.
Finally, the probabilistic models were generated assigning the 1000 random variables of fy, Es, and εu to each of the beams and columns of the models. This process was carried out through a special function for creating multiple files (SPF Creator) in SeismoStruct [35]. In this research, 4000 steel buildings were analyzed.

4. Nonlinear Static Analysis

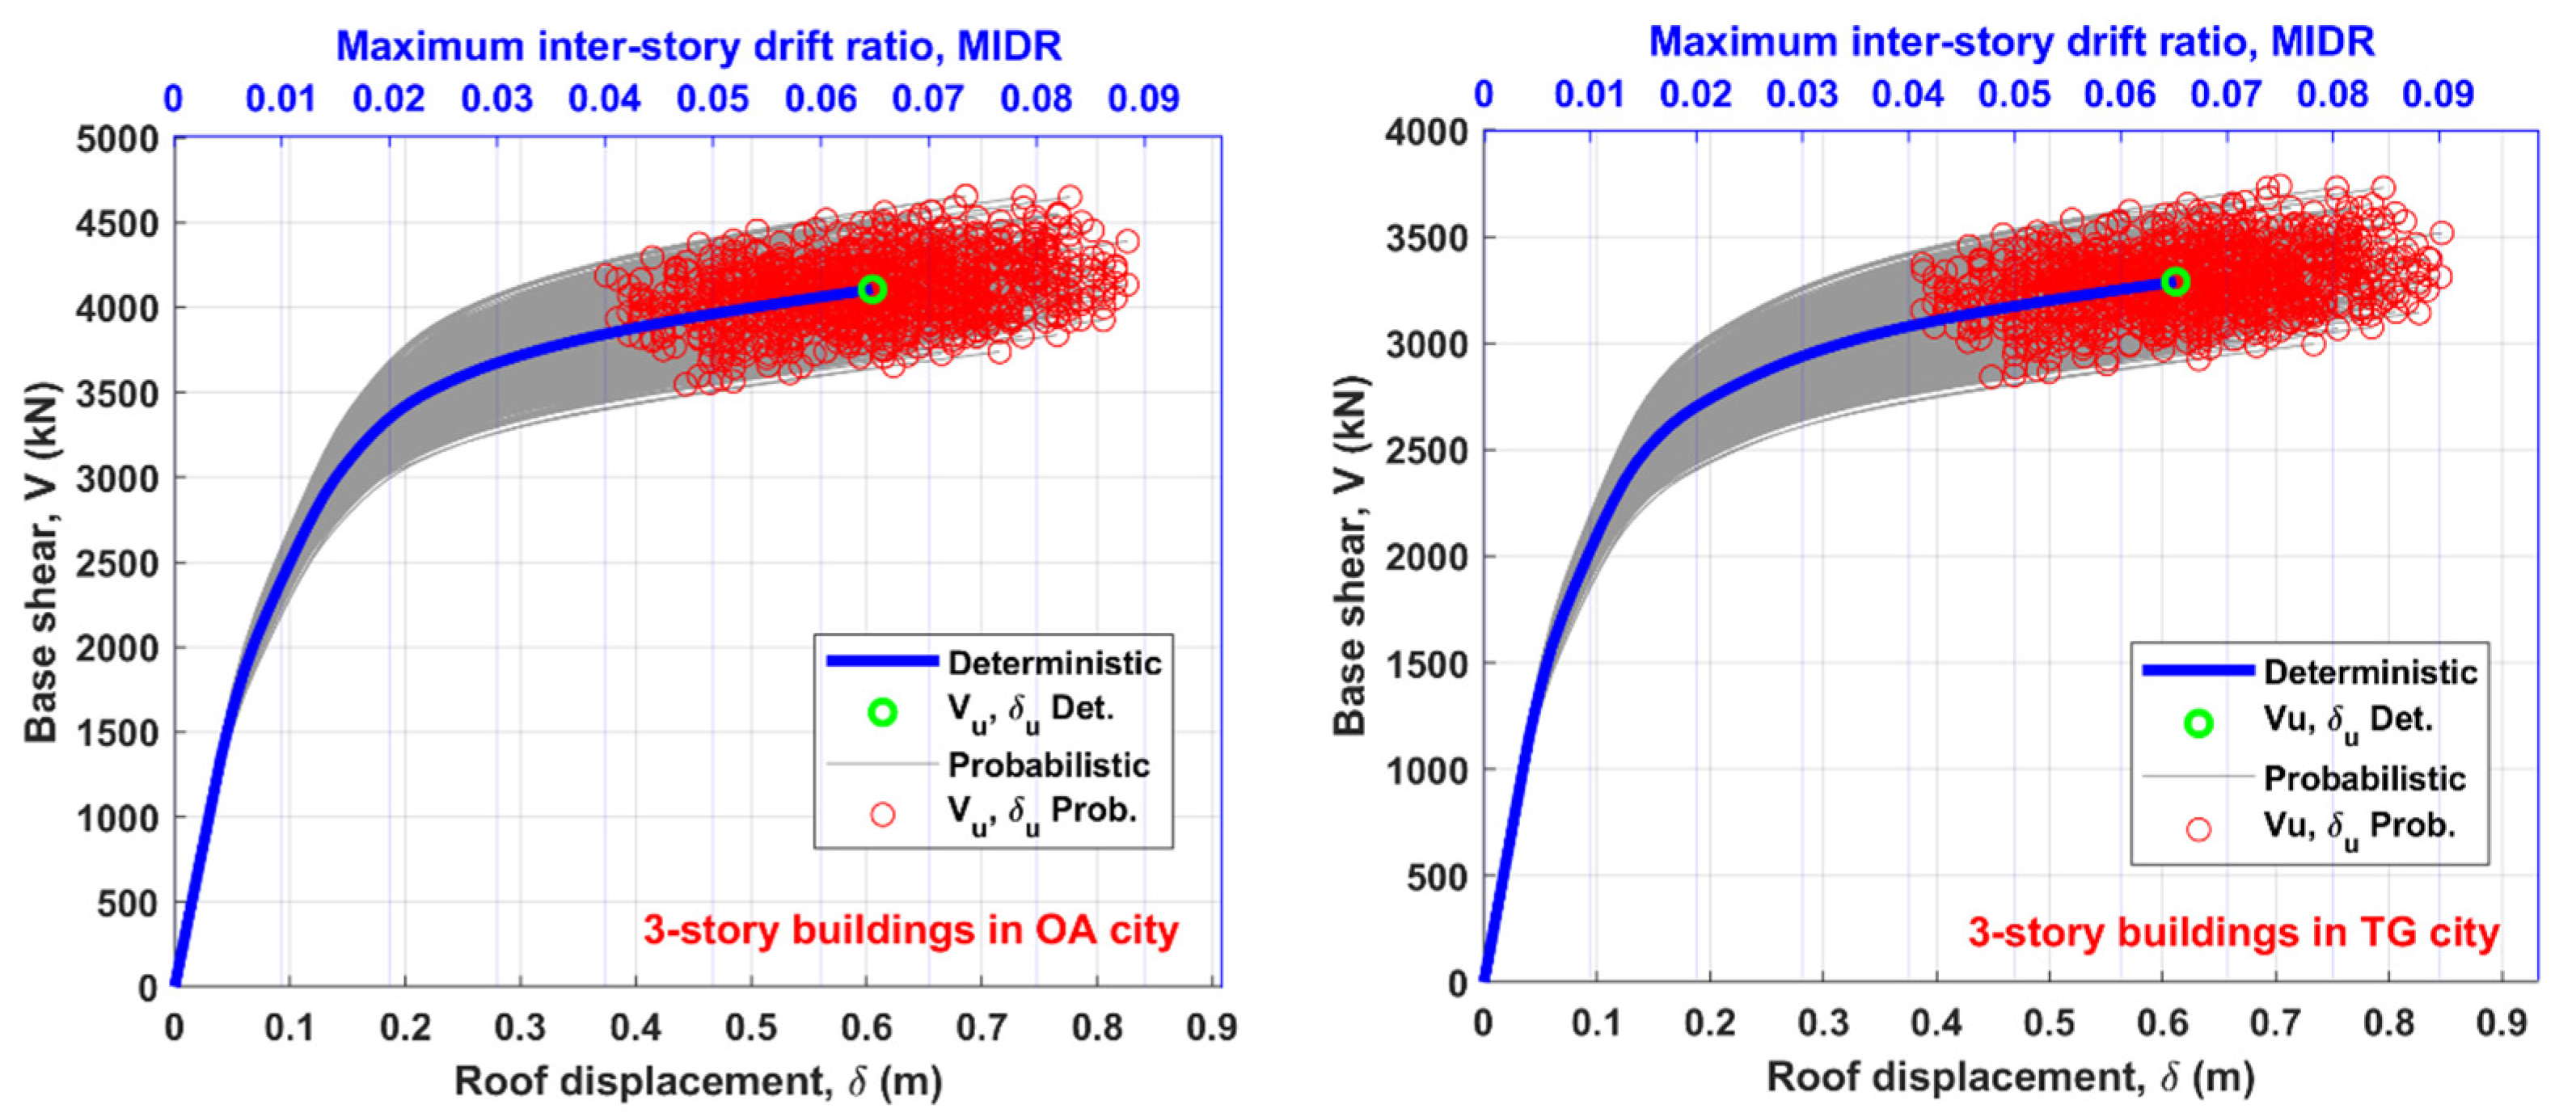
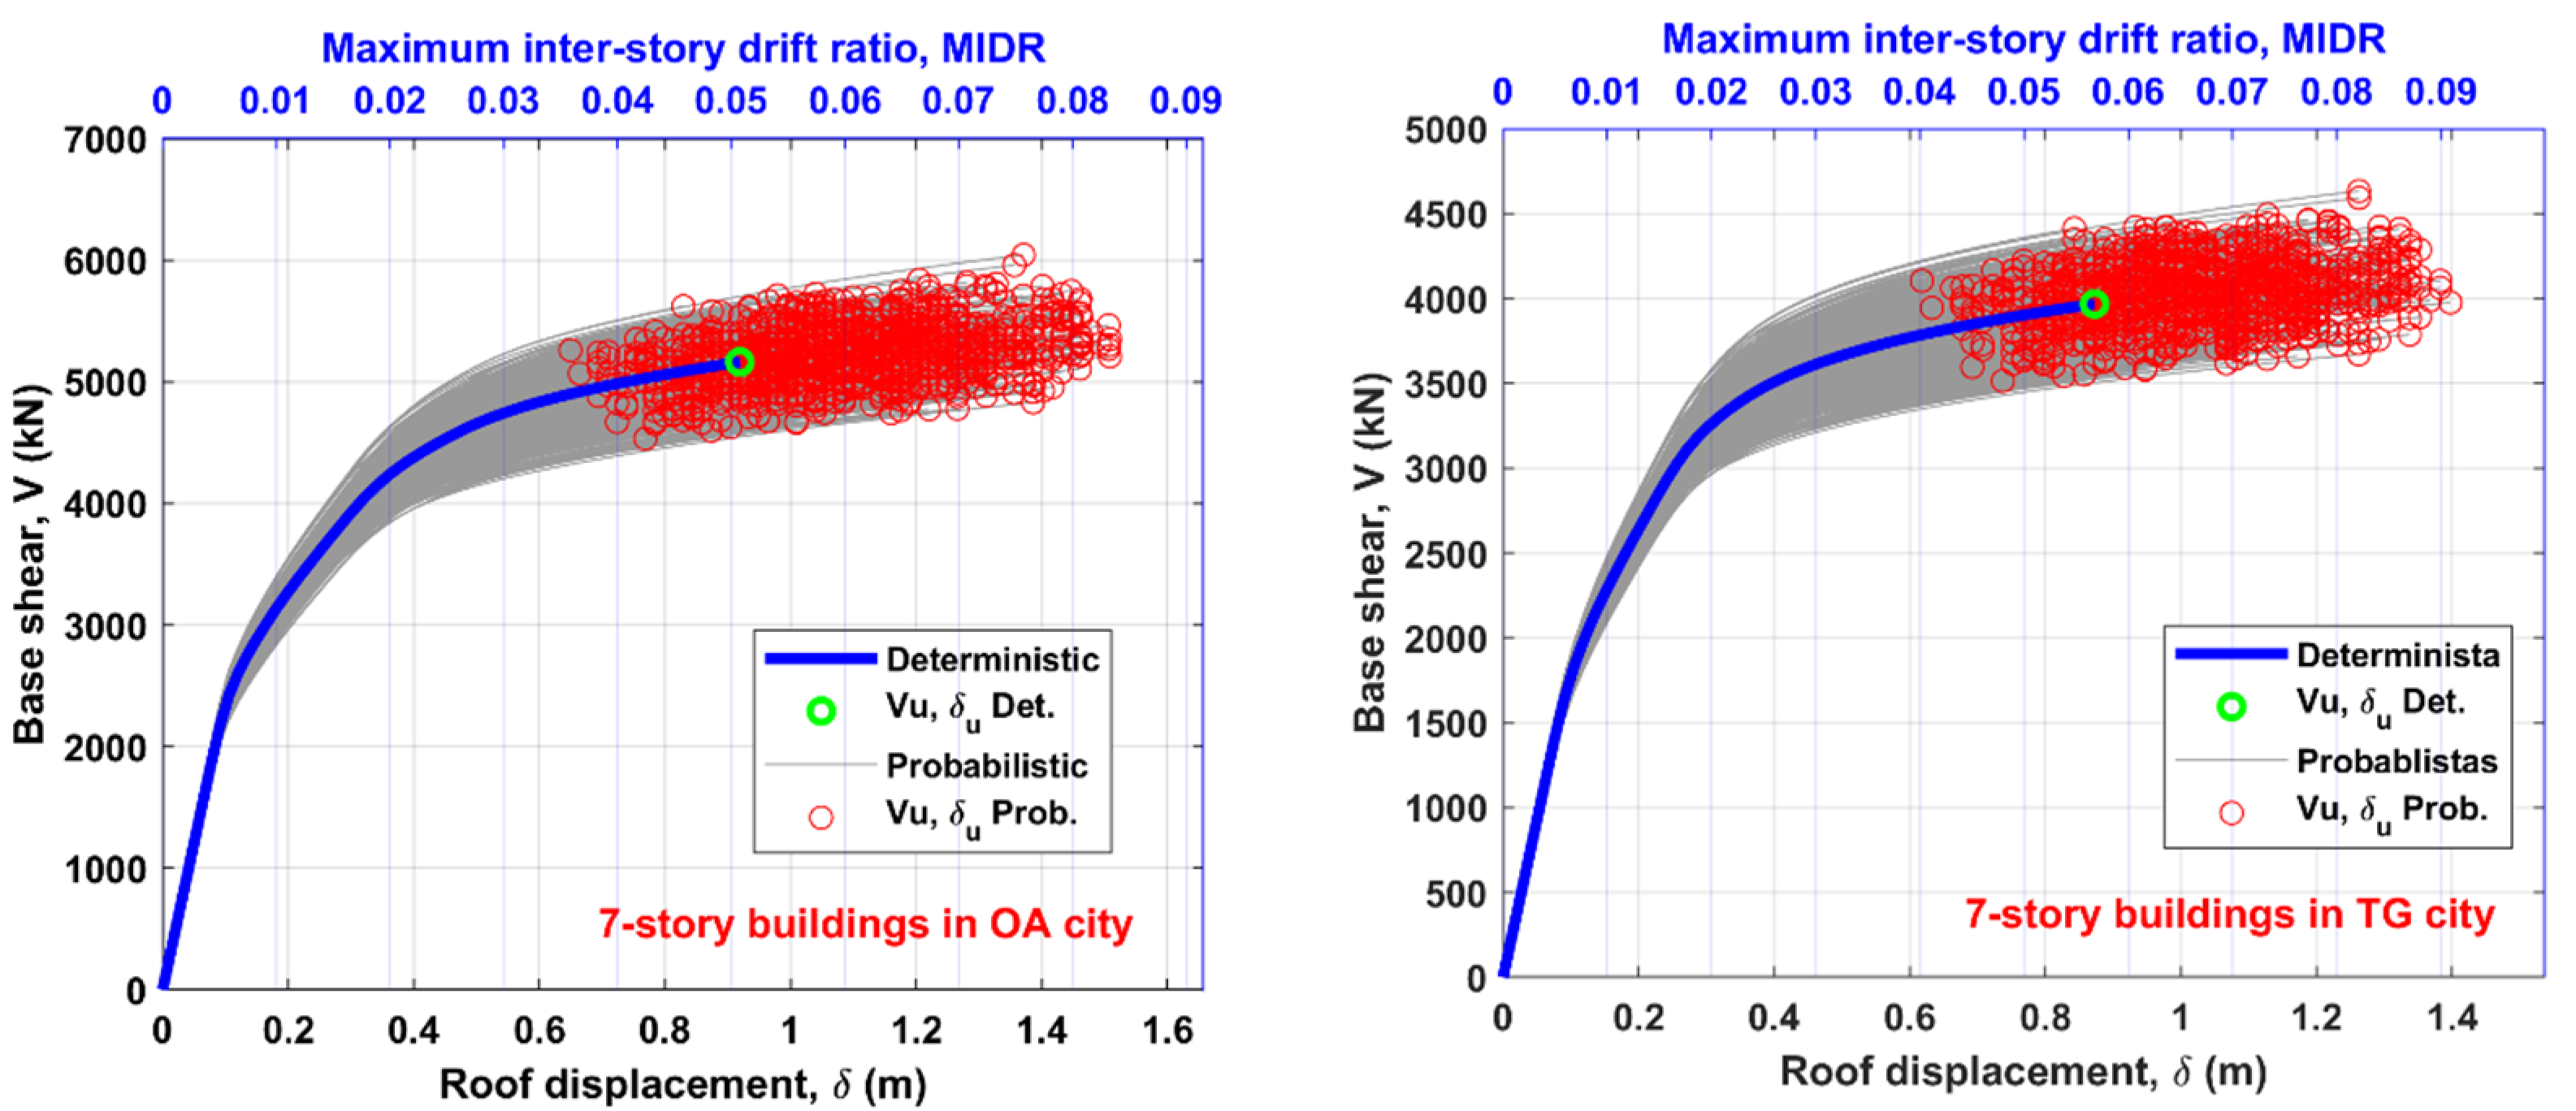
The generation of probabilistic models, the automatic execution, and the NLSA sequential analysis were implemented with the SeismoBatch function introduced in SeismoStruct [35]. Then, the output files of the analyses were extracted, and the probabilistic capacity curves of the four buildings studied were obtained. Figure 3 and Figure 4 show the capacity curves of the deterministic and probabilistic cases corresponding to the 3-story and 7-story buildings in OA and TG cities, respectively. The capacity curves were presented in the base shear (V)—roof displacement δ) and base shear (V)—maximum inter-story drift ratio (MIDR) formats.

5. Capacity Spectra and Damage States

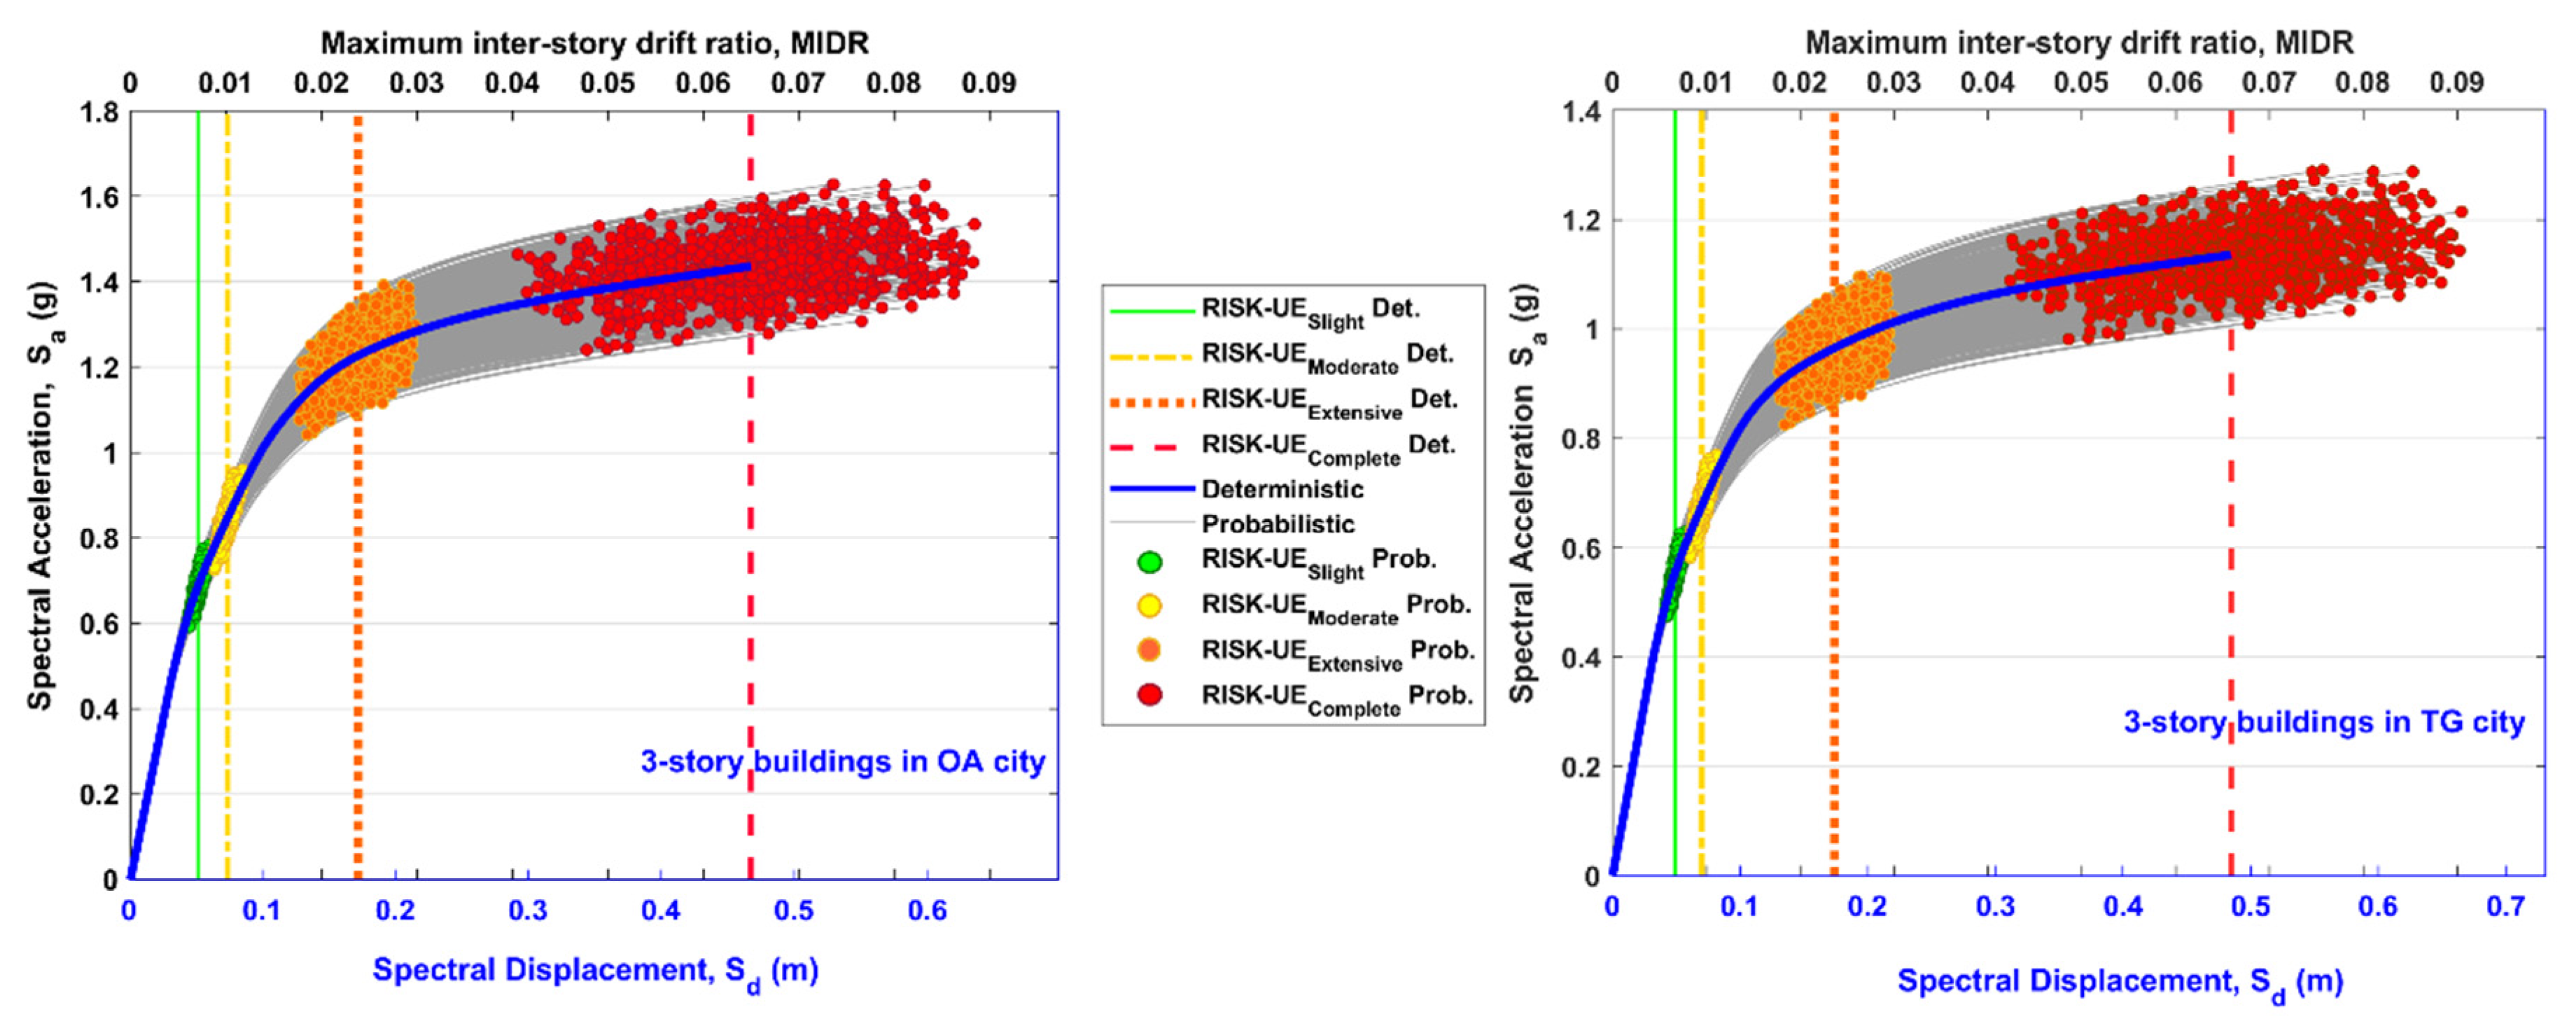
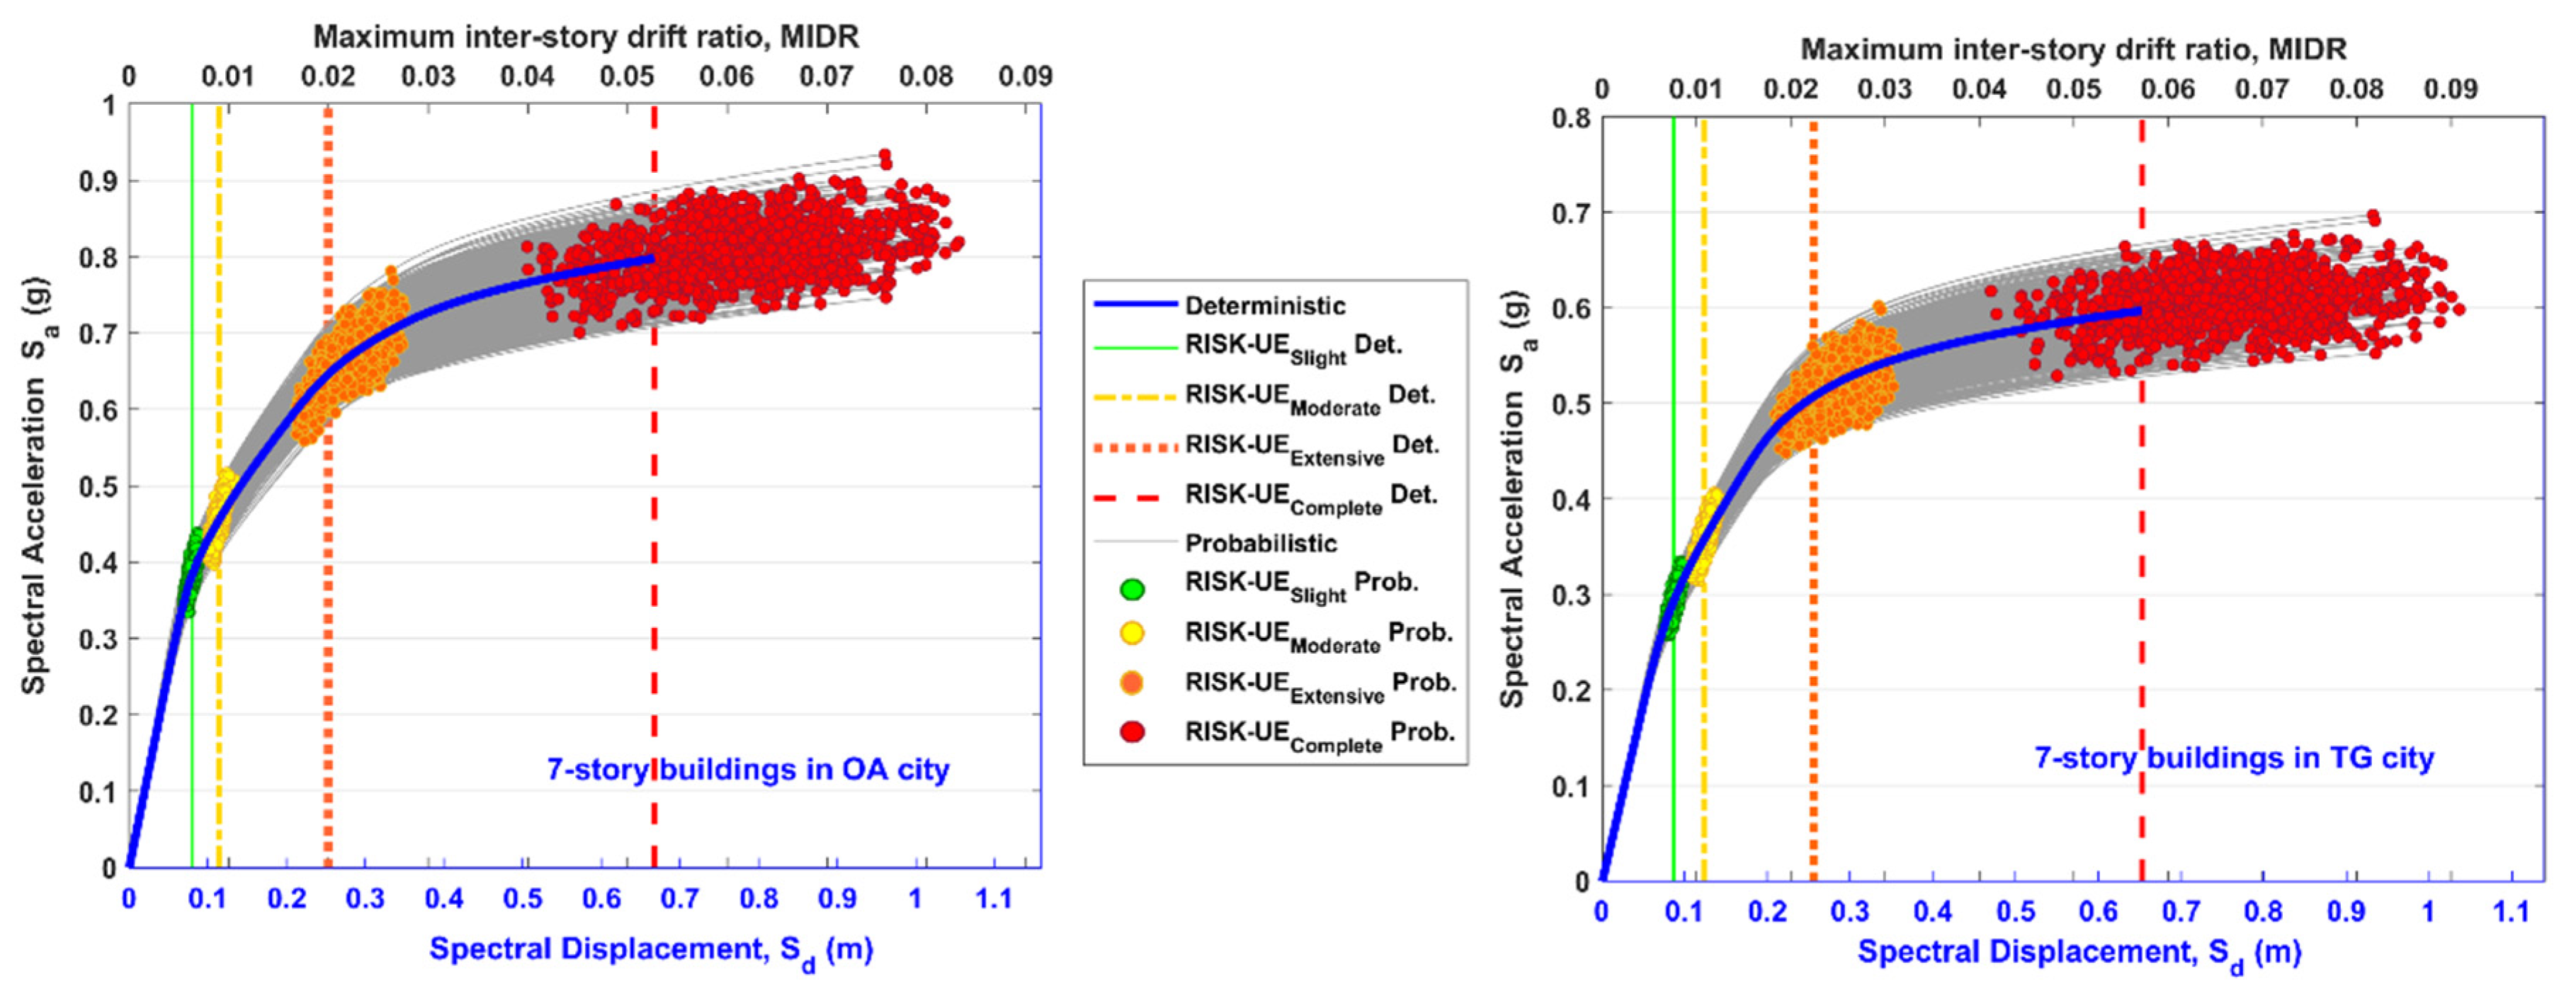
Based on the ATC-40 [37] and by considering the values from the modal analysis (Table 4), each capacity curve in V-δ format was transformed into the Capacity Spectrum (CS) in Spectral Acceleration (Sa)–Spectral Displacement (Sd), where Sd = δ/PF1, and Sa = V/(W*α1). Then, the four non-null damage states (DSnon-null) of the RISK UE guidelines [31] were obtained. These were determined based on the yield (Sdy) and ultimate (Sdu) spectral displacements as follows: Slight = 0.7Sdy, Moderate = Sdy, Extensive = Sdy + 0.25 (Sdu–Sdy), and Complete = Sdu. The following equation proposed by Diaz et al. [15] was used to calculate the yield point (Sdy and Say) of the capacity spectrum:
S dy = 2 A sc S du · S du K i · S du S au   and   S ay = K i · S dy
where the variables are characteristics of the capability spectrum: Ki is the initial slope, Asc is the area under the curve, and Sdu and Sau are the ultimate capacity points.
Finally, for the Sds of each non-null damage state, the respective MIDR value was obtained. Figure 5 and Figure 6 show the deterministic and probabilistic capacity spectrum of the buildings in OA and TG cities, in Sa–Sd and Sa–MIDR formats, together with the respective DSnon-null. Table 6 shows the minimum, mean, and maximum MIDR values from the probabilistic and the deterministic cases for the non-null damage states following the Risk-UE guidelines. The colors in the Table 6, Table 7, Table 8, Table 9, Table 10 and Table 11 indicate the DSnon-nulls [31]: slight damage (green color); moderate damage (yellow color); extensive damage (orange color) and complete damage (red color) and, are used in the conceptualization the Preventive “Semaphore” for Seismic Damage (PSSD) and fragility curves in the next sections.
Table 6. Minimum, mean, maximum probabilistic, and deterministic values of the MIDR for each DSnon-null from the Risk-UE guideline in the buildings.
CityStoriesMIDR (DSSlight)MIDR (DSModerate)
MinMaxMeanDet.MinMaxMeanDet.
Oaxaca (OA)30.00600.00830.00710.00700.00850.01180.01010.0102
70.00540.00740.00630.00630.00780.01060.00890.0090
Tuxtla Gutiérrez (TG)30.00560.00780.00670.00670.00800.01120.00950.0095
70.00660.00890.00760.00760.00940.01280.01080.0108
CityStoriesMIDR (DSExtensive)MIDR (DSComplete)
MinMaxMeanDet.MinMaxMeanDet.
Oaxaca (OA)30.01760.02980.02370.02390.04060.08840.06470.0650
70.01680.02760.02190.01990.03990.08320.06100.0527
Tuxtla Gutiérrez (TG)30.01750.02980.02370.02360.04240.09050.06620.0659
70.01840.03110.02240.02470.04120.09090.06640.0572

6. T1 Variation

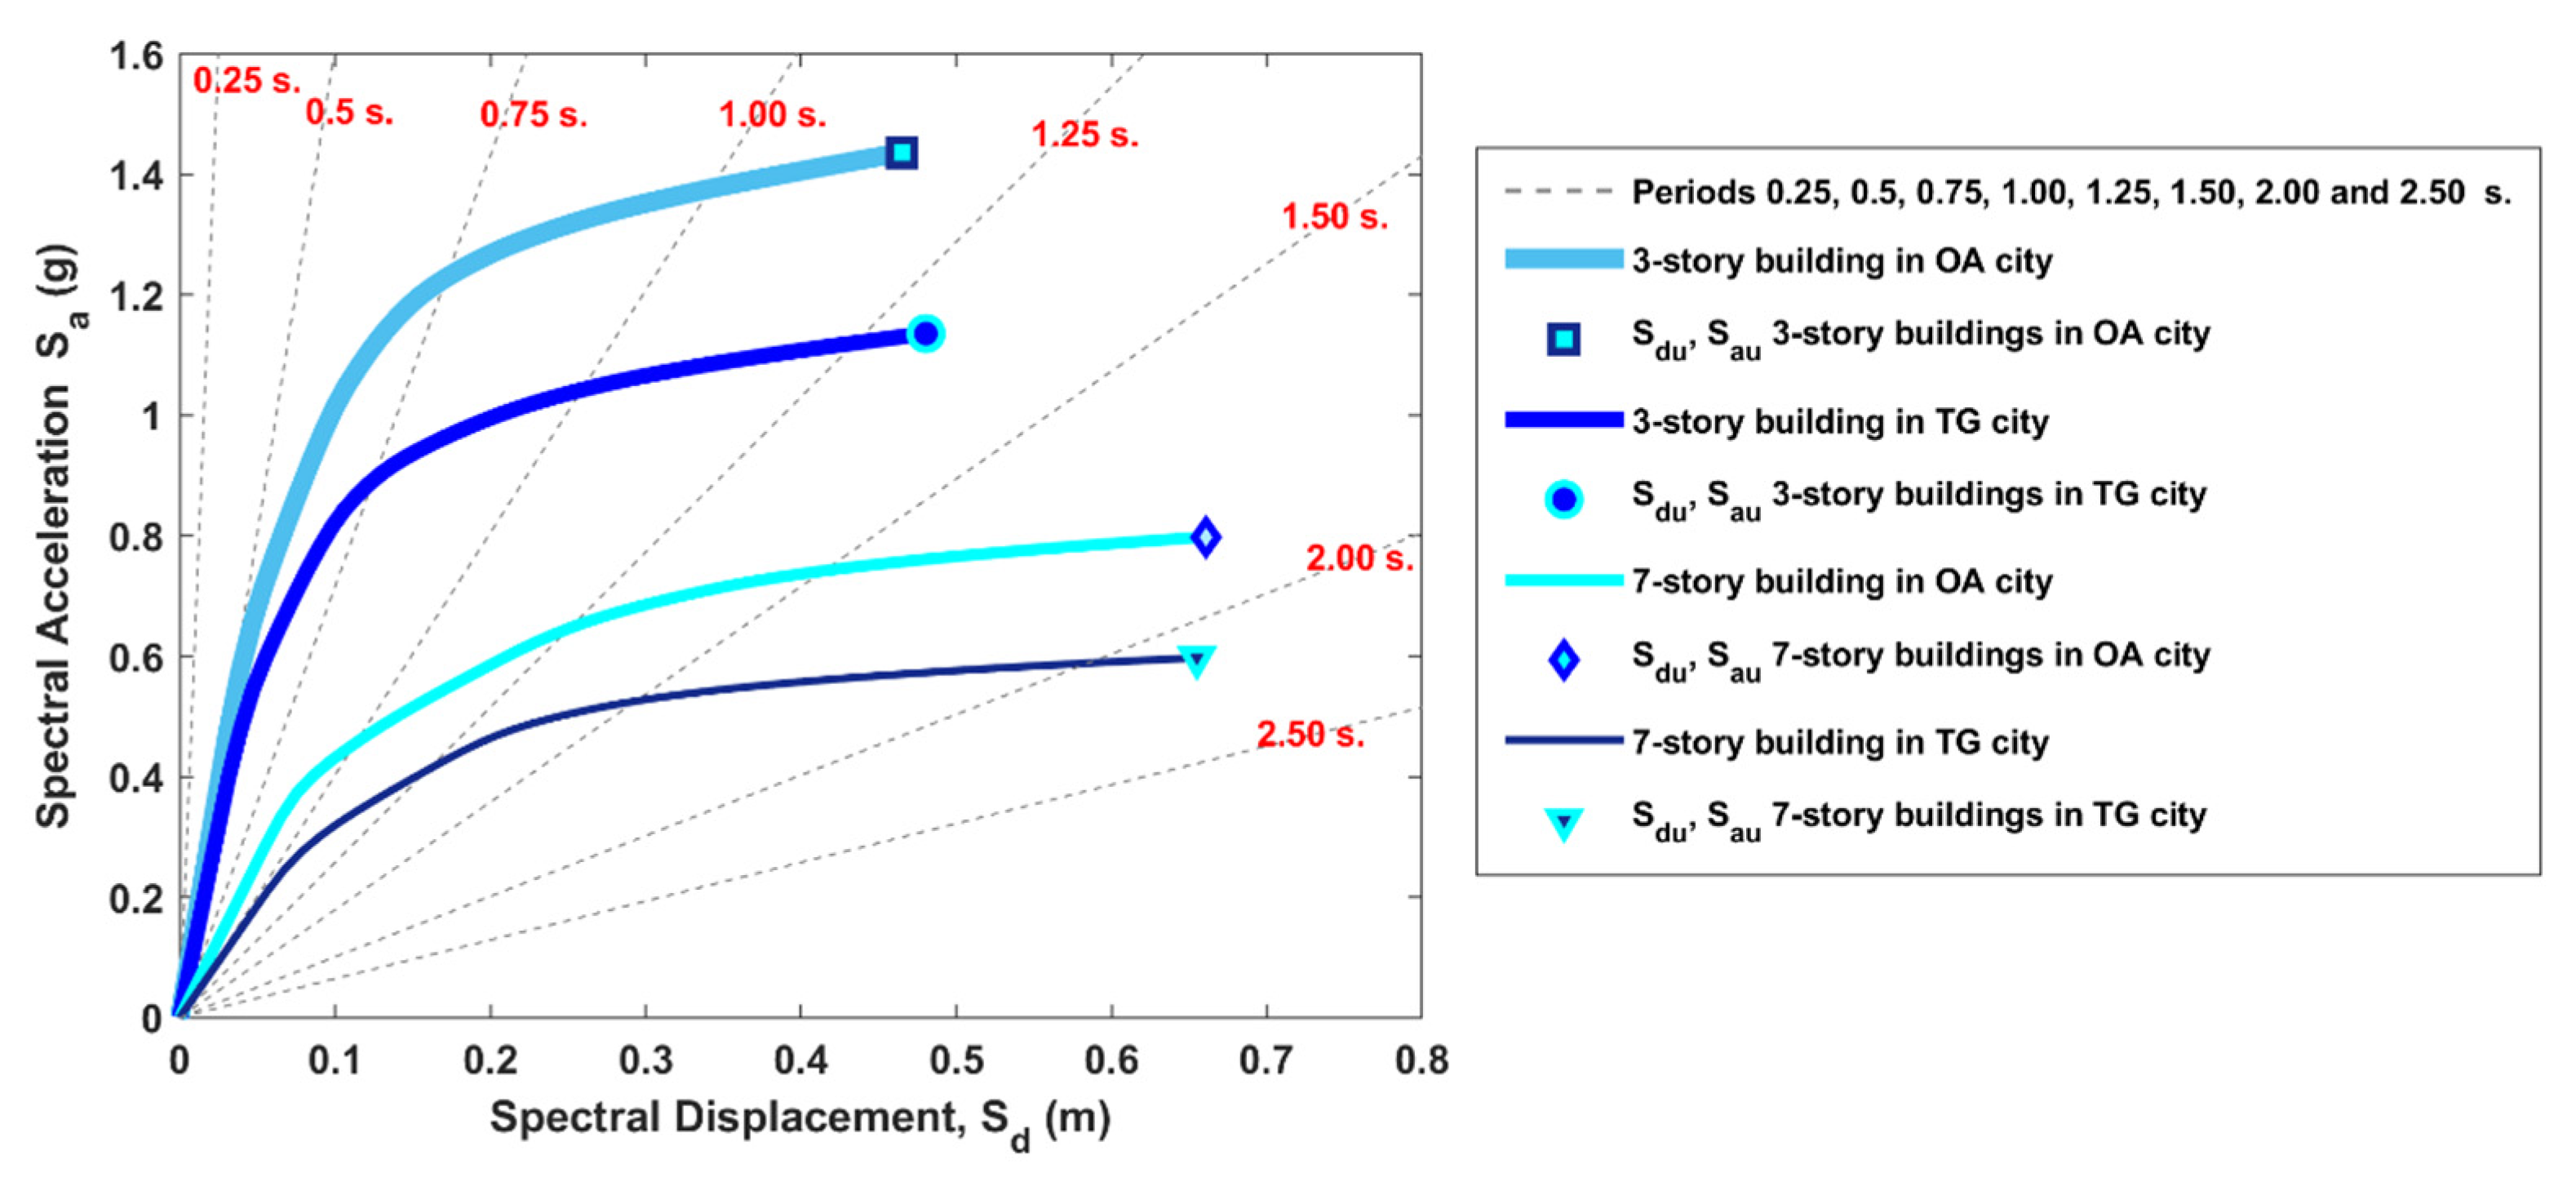
The initial slope of the capacity spectrum in Sa–Sd format is directly related to the fundamental natural period of vibration, T1, of the building, through the following equation [37]:
S dy = T 1 2 4 π 2 S ay × g
where g is the gravity of acceleration. Based on the above equation, the new fundamental period T1i for all points (Sai and Sdi) in the capacity spectrum can be obtained as follows:
T 1 i = 4 π 2     S di S ai     g = 2 π S di S ai     g
The representation of the different structural periods in Sa–Sd format can be plotted using diagonal lines. Each line that agrees with the initial slope of the capacity spectrum represents the fundamental period T1 of the building. In this way, the variation of the T1 period can be observed from the non-linear zone of the capacity spectrum, which is related to the structural damage of the building. Figure 7 shows the capacity spectrum in Sa–Sd format for the deterministic cases with the different values of period represented with dotted lines.
Equation (3) was used in both the deterministic and probabilistic capacity spectra for calculating the fundamental period T1i in the buildings. Figure 8 and Figure 9 show the T1i–MIDR relationship curves of the four buildings studied. The deterministic case (vertical lines) and probabilistic points of the four DSnon-null are also shown. The percentage increase in the T1i for the four DSnon-null of the deterministic case is also displayed. Additionally, vertical lines are plotted to indicate the MIDR of the service state (Sstate) and collapse prevention state (CPstate) defined by the Mexican Seismic Design Guide [30]. It was observed that the Sstate was lower than the deterministic and probabilistic cases of the DSSlight, while the CPstate was in the range of the DSExtensive. Thus, for the buildings studied here, Sstate limited the damage correctly, and CPstate agreed with the damage expected before collapse.
Table 7 shows the minimum, mean, and maximum values of the fundamental periods T1i from the probabilistic and the deterministic cases for each DSnon-null of the Risk-UE guidelines [31]. It was observed that the deterministic case agreed with the probabilistic mean.
Table 7. Minimum, mean, maximum probabilistic, and deterministic values of the T1i for each DSnon-null from the Risk-UE guideline in the buildings.
CityStoriesT1i (DSSlight)T1i (DSModerate)
MinMaxMeanDet.MinMaxMeanDet.
Oaxaca (OA)30.520.570.540.540.560.610.590.59
70.900.960.910.910.951.051.001.00
Tuxtla Gutiérrez (TG)30.570.620.590.590.610.670.640.64
71.051.141.091.091.131.231.181.18
CityStoriesT1i (DSExtensive)T1i (DSComplete)
MinMaxMeanDet.MinMaxMeanDet.
Oaxaca (OA)30.650.850.750.750.891.351.141.14
71.141.461.301.251.522.331.961.82
Tuxtla Gutiérrez (TG)30.730.960.850.851.031.551.301.30
71.301.661.481.431.742.662.242.10

7. Preventive “Semaphore” for Seismic Damage

Considering the fundamental period of the building, T1, as the starting point of the period variation in the capacity spectrum, the percentage increase of the period (% T1i(DSnon-null)) could be determined for each non-null damage state (DSnon-null = Slight; Moderate; Extensive and Complete) as follows:
%   T 1 i   DS non null = [ T 1 i   DS non null T 1 ] T 1 × 100
The %T1i (DSnon-null) of the deterministic case in the buildings is shown in Figure 8 and Figure 9. Furthermore, the %T1i (DSnon-null) was determined for the probabilistic cases of the buildings. Table 8 shows the obtained values.
Table 8. Minimum, mean, maximum probabilistic, and deterministic value of the %T1i for each DSnon-null from the Risk-UE guideline in the buildings.
CityStories%T1i (DSSlight)%T1i (DSModerate)
MinMaxMeanDet.MinMaxMeanDet.
Oaxaca (OA)33.62 8.10 6.11 5.8811.14 16.70 14.44 15.69
73.98 7.33 4.52 2.259.28 18.49 15.01 12.36
Tuxtla Gutiérrez (TG)33.29 7.24 5.50 5.3611.12 16.38 14.03 14.29
73.02 8.64 5.96 4.8110.7017.41 14.62 13.46
Average3.487.835.524.5710.5617.2514.5313.95
CityStories%T1i (DSExtensive)%T1i (DSComplete)
MinMaxMeanDet.MinMaxMeanDet.
Oaxaca (OA)325.94 64.59 45.79 47.0670.79162.16121.65123.53
729.55 69.48 48.77 40.4572.00172.17124.97104.49
Tuxtla Gutiérrez (TG)328.65 70.37 50.66 51.7979.60174.49131.76132.14
724.87 63.8943.8237.5066.55162.61118.09101.92
Average27.2567.0847.2644.2072.24167.86124.12115.52
Considering the average values of the %T1i (DSnon-null), from the probabilistic analysis in the four buildings studied, a Preventive “Semaphore” for Seismic Damage (PSSD) was proposed. Table 9 shows the proposal for low-rise and mid-rise steel buildings with a structural system of “Special Moment Frames, SMF”. In the PSSD presented, the following analogy between the DSnon-null from the Risk-UE guidelines [31] and the performance levels defined in the Vision 2000 report [45] was proposed:
  • Null damage ≈ Operational Limit (OL)
  • Slight damage (green color) ≈ Immediate Occupancy (IO)
  • Moderate damage (yellow color) ≈ Life Safety (LS)
  • Extensive damage (orange color) ≈ Collapse Prevention (CP)
  • Complete damage (red color) ≈ Complete Collapse (CC)
Likewise, a criterion of the expected damage or expected operating condition in the buildings is established when an increase in the %T1i is detected in an SHM assessment.
Table 9. Preventive “Semaphore” for Seismic Damage (PSSD) based on the average %T1i (DSnon-null) probabilistic of the four buildings studied.
PSSD (Risk-UE Guideline)Null
Damage
Slight
Damage
Moderate DamageExtensive DamageComplete Damage
PSSD (Vision 2000 Report)Operational Limit (OL)Immediate Occupancy (IO)Life Safety (LS)Collapse
Prevention (CP)
Complete Collapse (CC)
Minimum values%T1i<3.48%≥3.48%≥10.56%≥27.25%≥72.24%
Mean values<5.52%≥5.52%≥14.53%≥47.26%≥124.12%
Maximum values<7.83%≥7.83%≥17.25%≥67.08%≥167.86%
Considering the relationship between T1i and MIDR (Figure 8 and Figure 9) as a validation parameter of PSSD, it was observed that the green color was consistent with the MIDR of the service state (Sstate), whereas the orange color was consistent with the MIDR of the collapse prevention state (CPstate), both defined by the Mexican Seismic Design Guide [31]. In addition, the range of values presented by the PSSD was in accordance with the Structural Warning System (SWS) proposed in [46,47]. The SWS is a Structural Health Monitoring (SHM) system that has been developed in Mexico to evaluate instrumented buildings of less than 25 stories whose dynamic response is dominated by fundamental modes of vibration [48]. It should be noted that there is a need to perform tests in future studies to verify the accuracy and good engineering practicability of the PSSD in comparison with SHM in steel buildings with the characteristics of those studied here.

8. Fragility Curves

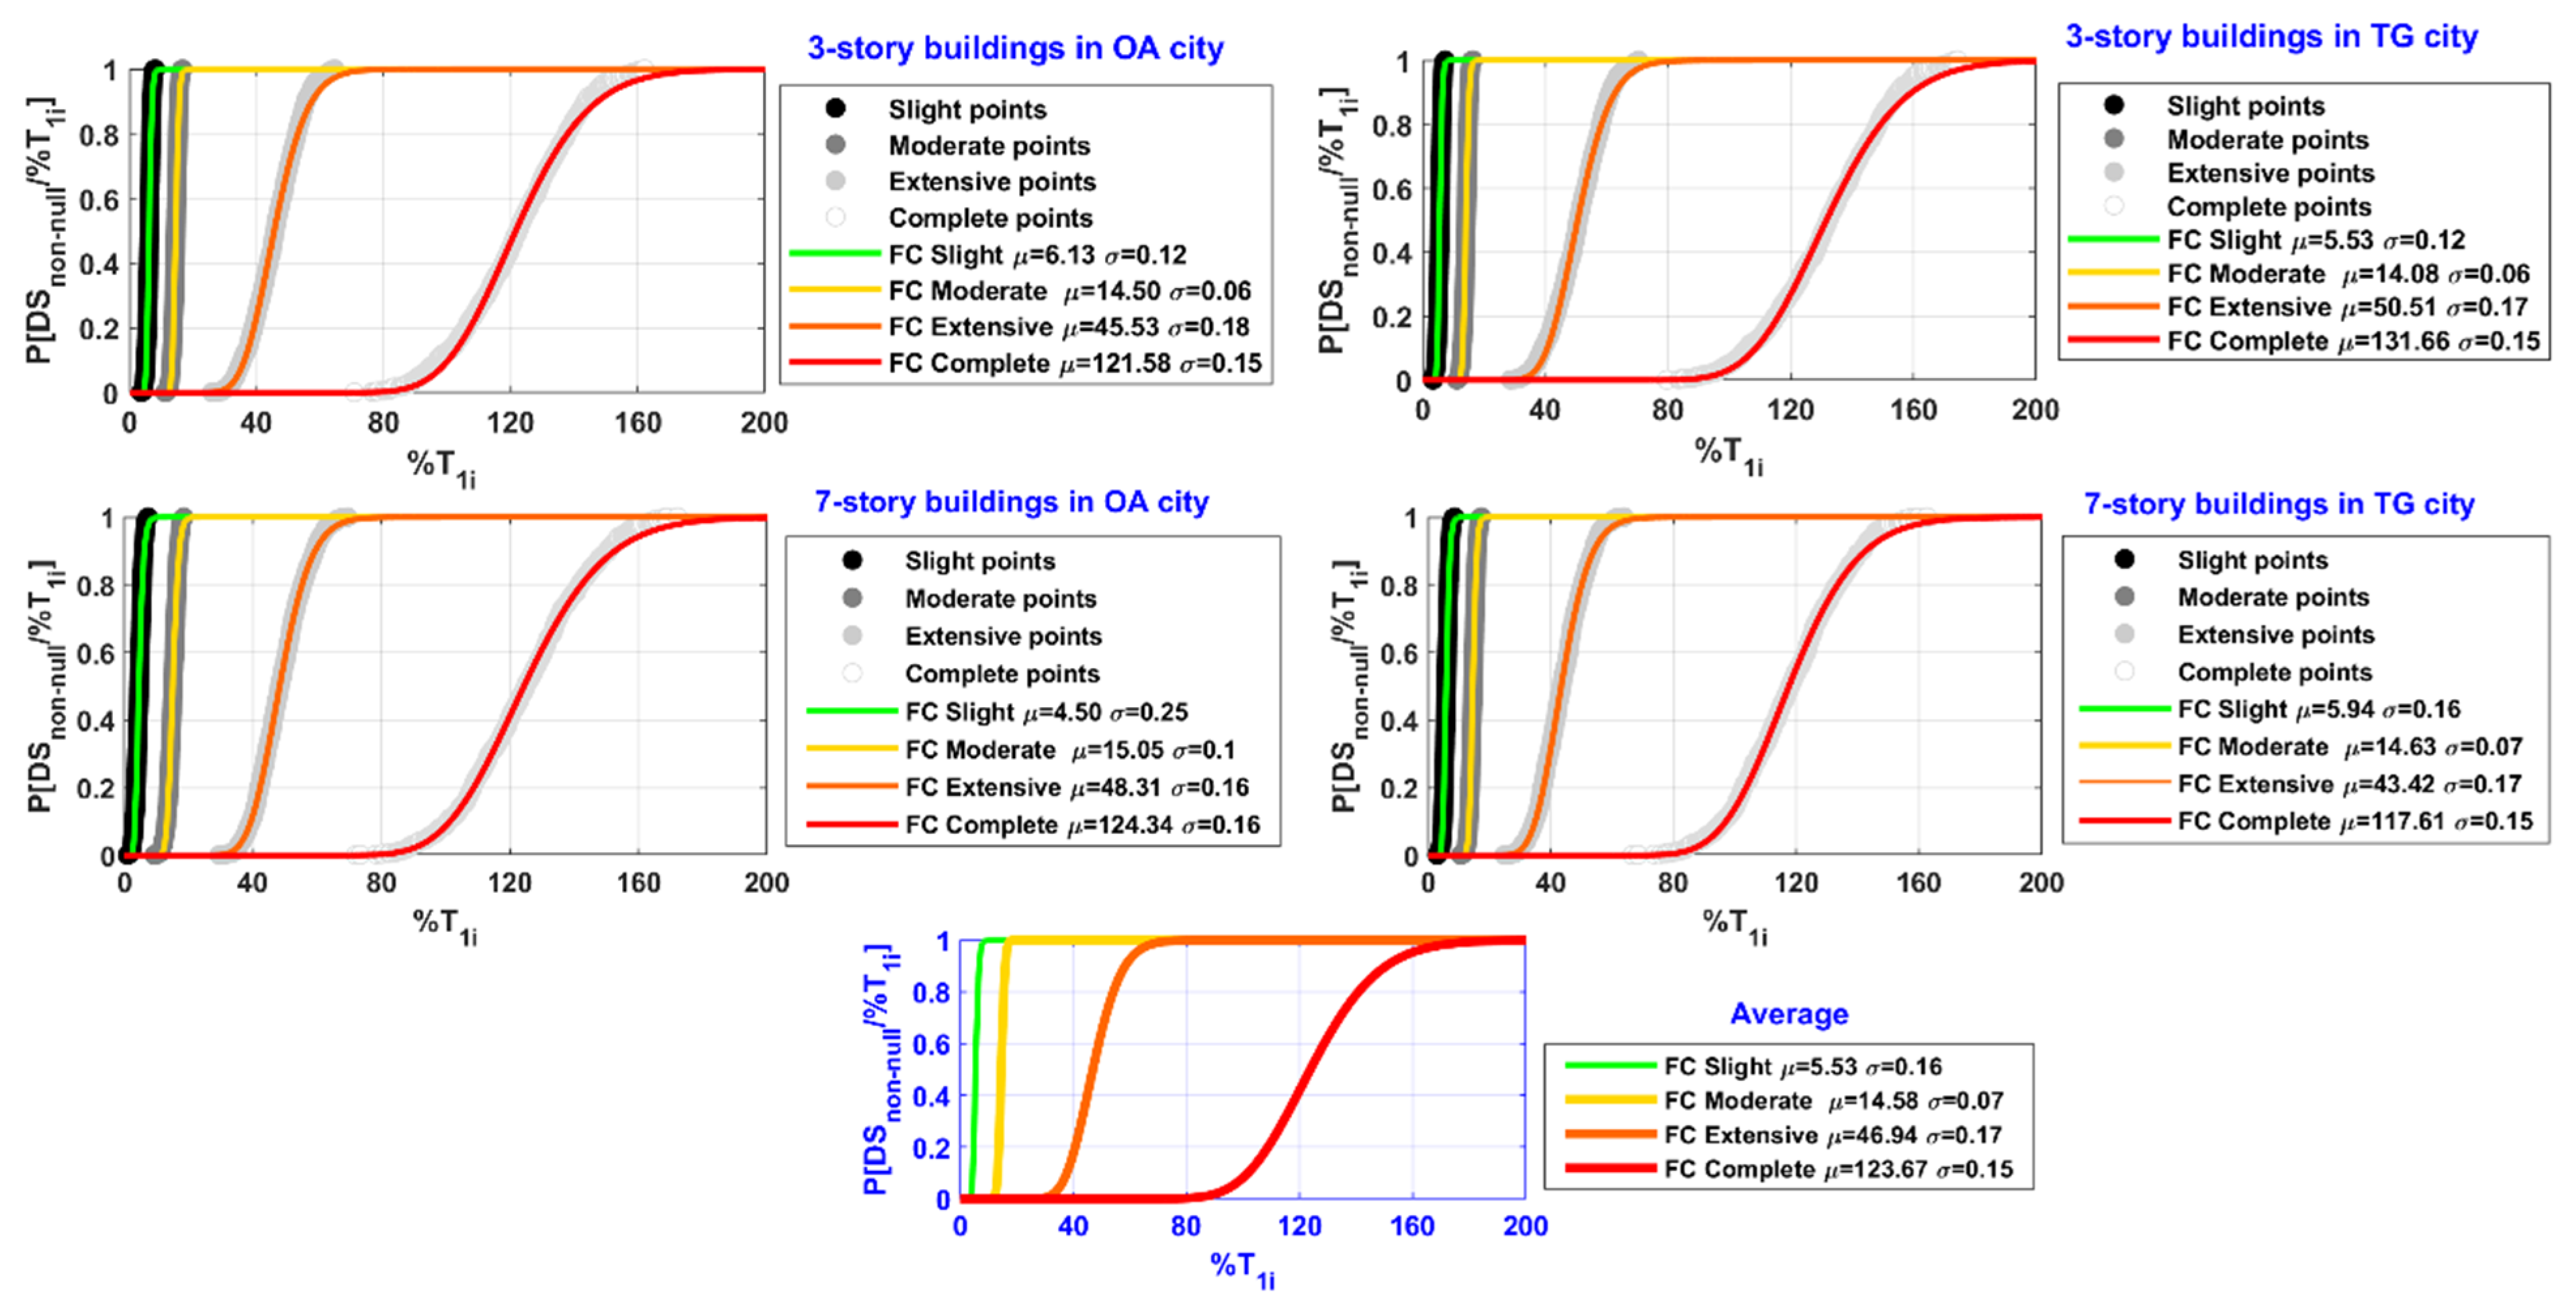
MIDR and %T1i clouds from the probabilistic analysis allowed for the development of Fragility Curves (FC) for each of the four damage states. In brief, the fragility curve represents the probability of the DSnon-null being exceeded as a function of the MIDR or %T1i (P[DSnon-null/MIDR or %T1i]). The FCs are obtained as follows: (i) each cloud is sorted in ascending order, and the number of points in the cloud is normalized from 0 to 1; and (ii) a Lognormal Cumulative Distribution function (Logncdf) is fitted using the Mean Squared Error (MSE). Then, the Logncdf function with lower MSE is used for fitting. Each Logncdf function corresponds to a fragility curve of each DSnon-null and is completely defined by the μ and σ parameters; μ is the mean value of the MIDR or %T1i thresholds, and σ represents its standard deviation. Table 10 and Table 11 present the m and s parameters obtained for each fragility curve of the studied buildings. Figure 10 and Figure 11 show the fragility curves as a function of the MIDR and %T1i for each DSnon-null following the Risk-UE guidelines [31].
Table 10. The μ and σ of the fragility curves (FC) as a function of the %T1i for the studied buildings.
CityStoriesFCSlightFCModerateFCExtensiveFCComplete
μ
(%T1i)
σμ
(%T1i)
σμ
(%T1i)
σμ
(%T1i)
σ
Oaxaca (OA)36.130.1214.500.0645.530.18121.580.15
74.500.2515.050.1048.310.16124.340.16
Tuxtla Gutiérrez (TG)35.530.1214.080.0650.510.17131.160.15
75.940.1614.670.0743.420.17117.610.15
Average5.530.1614.580.0746.940.17123.670.15
Table 11. The μ and σ of the fragility curves (FC) as a function of the MIDR for the studied buildings.
CityStoriesFCSlightFCModerateFCExtensiveFCComplete
μ
(MIDR)
σμ
(MIDR)
σμ
(MIDR)
σμ
(MIDR)
σ
Oaxaca (OA)30.0070.170.0100.050.0240.120.0640.17
70.0060.100.0090.070.0220.120.0610.16
Tuxtla Gutiérrez (TG)30.0060.140.0100.060.0240.120.0660.17
70.0080.180.0110.060.0250.120.0660.16
Average0.00680.150.0100.060.0240.120.0640.165
Figure 10. Probabilistic fragility curves of the DSnon-null for the buildings in OA and TG cities as functions of the %T1i.
Buildings 13 01009 g010
Figure 11. Probabilistic fragility curves of the DSnon-null for the buildings in OA and TG cities as functions of the MIDR.
Buildings 13 01009 g011

9. Discussion and Conclusions

This article presents a probabilistic study of the fundamental period (T1) variation of steel buildings based on seismic damage. One low-rise (3-story) and one mid-rise (7-story) steel building located in two cities in México were studied. The seismic performance of the buildings was obtained through probabilistic nonlinear static analyses. Uncertainties in the yield strength, fy, modulus of elasticity, Es, and ultimate strain, εu, of the structural sections were considered via Monte Carlo simulation. The T1 variation was estimated using the capacity spectrum [37], and the seismic damage was defined by the maximum inter-story drift ratio, MIDR, and damage states of the Risk-UE guidelines [31].
In the nonlinear static analysis of the buildings, the seismic actions are not considered as in nonlinear dynamic analysis. However, due to the number of stories and symmetry of the buildings analyzed, the structural response is dominated by their fundamental period of vibration. Thus, the compatibility of results between the static and dynamic approaches is assumed to be adequate. Moreover, the NLSA was performed by implementing a probabilistic approach, which provides a complete perspective of expected seismic performance considering the randomness in the main mechanical properties of the beams and columns of the buildings. In addition, the probabilistic clouds allow the trends and relationships between the variables of interest in the linear and non-linear performance of buildings to be analyzed.
Based on the classic ATC-40 equations, the T1 variation in the probabilistic capacity spectra of the buildings can be easily obtained and related to its respective MIDR for each DSnon-null of the Risk UE guidelines. As a result of this study, practical tools used for seismic assessment in low-rise and mid-rise steel buildings were proposed: (1) a Preventive “Semaphore” of Seismic Damage (PSSD), and (2) Fragility Curves (FCs). The PSSD proposes a percentage increase of the fundamental period (%T1i) for the four DSnon-null (slight, moderate, extensive, and complete) buildings analyzed here. The PSSD can be helpful as a reference or criteria to determine the health of the building through structural monitoring. Finally, the FC developed are an interesting contribution to determining the probabilities of exceedance of the DSnon-null thresholds. These FC have a novel approach based on MIDR or %T1i for seismic action in low-rise and mid-rise steel buildings with SMF structural systems. It should be noted that in order to spread this methodology, it would be necessary to carry out analyses with different structural typologies and number of stories and compare the results with on-site measurements.

Author Contributions

Conceptualization, methodology, software, validation, and formal analysis, S.A.D., L.A.P. and Y.F.V.-A. Investigation, resources, and data curation, R.S.M.-O. Writing—original draft preparation, S.A.D. Writing—review and editing, L.A.P. and Y.F.V.-A. Visualization, supervision, and project administration, S.A.D., L.A.P. and R.S.M.-O. Funding acquisition, L.A.P. All authors have read and agreed to the published version of the manuscript.

Funding

This study was funded by the Secretaría Nacional de Ciencia, Tecnología e Innovación (SENACYT) of Panama.

Data Availability Statement

Data are contained within the article.

Acknowledgments

L.A.P. would like to thank SENACYT and SNI for their support. S.A.D. and R.S.M.-O. thank the Academic Group: Risk Assessment and Sustainability of Civil Works (UJAT-CA-287) in the Universidad Juárez Autónoma de Tabasco (UJAT) and SNI-CONACYT in México for their support, and they thank Erick Garcia and Rosa Estrada, civil engineering students from the professional practices program at UJAT.

Conflicts of Interest

The authors declare no conflict of interest.

References

  1. Aguilar-Meléndez, A.; Pujades, L.G.; Barbat, A.H.; Ordaz, M.G.; De la Puente, J.; Lantada, N.; Rodríguez-Lozoya, H.E. A probabilistic approach for seismic risk assessment based on vulnerability functions. Application to Barcelona. Bull. Earthq. Eng. 2019, 17, 1863–1890. [Google Scholar] [CrossRef] [Green Version]
  2. Romero, D.Z.; Akbas, B.; Budiman, J.; Shen, J. Consideration of economic vulnerability in seismic performance evaluation of structures. Bull. Earthq. Eng. 2020, 18, 3351–3381. [Google Scholar] [CrossRef]
  3. Ramírez-Eudave, R.; Ferreira, T.M.; Vicente, R. Parameter-based seismic vulnerability assessment of Mexican historical buildings: Insights, suitability, and uncertainty treatment. Int. J. Disaster Risk Reduct. 2022, 74, 102909. [Google Scholar] [CrossRef]
  4. Ferreira, T.; Rodrigues, H. Seismic Vulnerability Assessment of Civil Engineering Structures at Multiple Scales. From Single Buildings to Large-Scale Assessment; A volume in Woodhead Publishing Series in Civil and Structural Engineering; Woodhead Publishing: Sawston, UK, 2022; pp. 1–383. [Google Scholar] [CrossRef]
  5. Li, S.Q.; Liu, H.B. Vulnerability prediction model of typical structures considering empirical seismic damage observation data. Bull. Earthq. Eng. 2022, 20, 5161–5203. [Google Scholar] [CrossRef]
  6. Barbat, A.H.; Carreño, M.L.; Pujades, L.G.; Lantada, N.; Cardona, O.D.; Marulanda, M.C. Seismic vulnerability and risk evaluation methods for urban areas. A review with application to a pilot area. Struct. Infrastruct. Eng. 2010, 6, 17–38. [Google Scholar] [CrossRef]
  7. Díaz, S.A.; Pujades, L.G.; Barbat, A.H.; Hidalgo-Leiva, D.A.; Vargas, Y.F. Capacity, damage and fragility models for steel buildings. A probabilistic approach. Bull. Earthq. Eng. 2018, 16, 1209–1243. [Google Scholar] [CrossRef] [Green Version]
  8. Roghaei, M.; Zabihollah, A. An Efficient and Reliable Structural Health Monitoring System for Buildings after Earthquake. APCBEE Procedia 2014, 9, 309–316. [Google Scholar] [CrossRef] [Green Version]
  9. Fujino, Y.; Siringoringo, D.M.; Ikeda, Y.; Nagayama, T.; Mizutani, T. Research and Imple-mentations of Structural Monitoring for Bridges and Buildings in Japan. Engineering 2019, 5, 1093–1119. [Google Scholar] [CrossRef]
  10. Alva, R.E.; Pujades, L.G.; González-Drigo, R.; Luzi, G.; Caselles, O.; Pinzón, L.A. Dynamic Monitoring of a Mid-Rise Building by Real-Aperture Radar Interferometer: Advantages and Limitations. Remote Sens. 2020, 12, 1025. [Google Scholar] [CrossRef] [Green Version]
  11. Gopinath, V.K.; Ramadoss, R. Review on structural health monitoring for restoration of heritage buildings. Mater. Today Proc. 2021, 43, 1534–1538. [Google Scholar] [CrossRef]
  12. Vargas-Alzate, Y.F.; Pujades, L.G.; Barbat, A.H.; Hurtado, J.E. An efficient methodology to estimate probabilistic seismic damage curves. J. Struct. Eng. ASCE 2019, 145, 04019010. [Google Scholar] [CrossRef] [Green Version]
  13. Vamvatsikos, D.; Fragiadakis, M. Incremental dynamic analysis for estimating seismic performance sensitivity and uncertainty. Earthq. Eng. Struct. Dyn. 2010, 39, 141–163. [Google Scholar] [CrossRef]
  14. Kazantzi, A.K.; Vamvatsikos, D.; Lignos, D.G. Seismic performance of a steel moment-resisting frame subject to strength and ductility uncertainty. Eng. Struct. 2014, 78, 69–77. [Google Scholar] [CrossRef] [Green Version]
  15. Díaz, S.A.; Pujades, L.G.; Barbat, A.H.; Vargas, Y.F.; Hidalgo-Leiva, D.A. Energy damage index based on capacity and response spectra. Eng. Struct. 2017, 152, 424–436. [Google Scholar] [CrossRef]
  16. Vargas-Alzate, Y.F.; Lantada, N.; González-Drigo, R.; Pujades, L.G. Seismic Risk Assessment Using Stochastic Nonlinear Models. Sustainability 2020, 12, 1308. [Google Scholar] [CrossRef] [Green Version]
  17. Pinzón, L.A.; Vargas-Alzate, Y.F.; Pujades, L.G.; Diaz, S.A. A drift-correlated ground motion intensity measure: Application to steel frame buildings. Soil Dyn. Earthq. Eng. 2020, 132, 106096. [Google Scholar] [CrossRef]
  18. Wang, F.; Shi, Q.X.; Wang, P. Research on the Physical Inter-story Drift Ratio and the Damage Evaluation of RC Shear Wall Structures. KSCE J. Civ. Eng. 2021, 25, 2121–2133. [Google Scholar] [CrossRef]
  19. Kenari, M.S.; Celikag, M. Correlation of Ground Motion Intensity Measures and Seismic Damage Indices of Masonry-Infilled Steel Frames. Arab. J. Sci. Eng. 2019, 44, 5131–5150. [Google Scholar] [CrossRef]
  20. Aljawhari, K.; Gentile, R.; Freddi, F.; Galasso, C. Effects of ground-motion sequences on fragility and vulnerability of case-study reinforced concrete frames. Bull. Earthq. Eng. 2021, 1, 6329–6359. [Google Scholar] [CrossRef]
  21. Vargas-Alzate, Y.F.; Hurtado, J.E.; Pujades, L.G. New insights into the relationship between seismic intensity measures and nonlinear structural response. Bull. Earthq. Eng. 2022, 20, 2329–2365. [Google Scholar] [CrossRef]
  22. Masi, A.; Vona, M. Experimental and numerical evaluation of the fundamental period of undamaged and damaged RC framed buildings. Bull. Earthq. Eng. 2010, 8, 643–656. [Google Scholar] [CrossRef]
  23. Anastasia, K.E.; Athanasios, I.K. Correlation of Structural Seismic Damage with Fundamental Period of RC Buildings. Open J. Civ. Eng. 2013, 3, 5–67. [Google Scholar] [CrossRef] [Green Version]
  24. Ditommaso, R.; Vona, M.; Gallipoli, M.R.; Mucciarelli, M. Evaluation and considerations about fundamental periods of damaged reinforced concrete buildings. Nat. Hazards Earth Syst. Sci. 2013, 13, 1903–1912. [Google Scholar] [CrossRef] [Green Version]
  25. Aninthaneni, P.V.; Dhakal, R.P. Prediction of Fundamental Period of Regular Frame Buildings. Bull. N. Z. Soc. Earthq. Eng. 2016, 49, 175–189. [Google Scholar] [CrossRef]
  26. Lu, W.-T.; Phillips, B.M. A fundamental-period-preserving seismic retrofit methodology for low-rise buildings with supplemental inerters. Eng. Struct. 2022, 266, 114583. [Google Scholar] [CrossRef]
  27. Sarma, S.; Sundar Das, T.; Bora, A.; Bharadwaj, K. Parametric Study on the Variation of Time Period of RC MRF Buildings. In Recent Advances in Earthquake Engineering; Lecture Notes in Civil Engineering; Kolathayar, S., Chian, S.C., Eds.; Springer: Berlin/Heidelberg, Germany, 2022; Volume 175, pp. 415–426. [Google Scholar] [CrossRef]
  28. Harris, J.L.; Michel, J.J.L. Approximate Fundamental Period for Seismic Design of Steel Buildings Assigned to High-Risk Categories. Pract. Period. Struct. Des. Constr. 2019, 24, 04019023. [Google Scholar] [CrossRef]
  29. Gallipoli, M.R.; Stabile, T.A.; Guéguen, P.; Mucciarelli, M.; Comelli, P.; Bertoni, M. Fundamental period elongation of a RC building during the Pollino seismic swarm sequence. Case Stud. Struct. Eng. 2016, 6, 45–52. [Google Scholar] [CrossRef] [Green Version]
  30. Comisión Nacional de Electricidad (CFE). MDOC-CFE. Manual de Diseño de Obras Civiles. Diseño por Sismos. 2015, pp. 1–745. Available online: https://www.gob.mx/ineel/articulos/manual-de-diseno-de-obras-civiles-diseno-por-sismo-logro-de-la-ingenieria-de-mexico (accessed on 3 April 2023).
  31. Milutinovic, Z.V.; Trendafiloski, G.S. Risk-UE An Advanced Approach to Earthquake Risk Scenarios with Applications to Different European Towns. 2003. Available online: https://cordis.europa.eu/project/id/EVK4-CT-2000-00014 (accessed on 3 April 2023).
  32. Arcos-Díaz, D.; Díaz, S.A.; Pinzón, L.A.; Jesús, H.; Mora-Ortiz, R.S. Seismic performance assessment based on the interstory drift of steel buildings. Lat. Am. J. Solids Struct. 2022, 19, e431. [Google Scholar] [CrossRef]
  33. Gaceta Oficial del Gobierno de México. NTCDS-RCDF. Norma Técnica Complementaria para la Revisión de la Seguridad Estructural de las Edificaciones de la Ciudad de México. 2017, pp. 1–712. Available online: https://smie.com.mx/smie-2022/informacion-tecnica/normas-tecnicas-complementarias.php (accessed on 3 April 2023).
  34. American Institute of Steel Construction. ANSI/AISC 360-16. Specification for Structural Steel Buildings. 2016. Available online: https://www.aisc.org/Specification-for-Structural-Steel-Buildings-ANSIAISC-360-16-Download (accessed on 3 April 2023).
  35. Seismosoft. SeismoStruct. Civil Engineering Software for Structural Assessment and Structural Retrofitting. 2021. Available online: https://seismosoft.com/products/seismostruct/ (accessed on 3 April 2023).
  36. Fernández, R.; Yamin, L.; D’Ayala, D.; Adhikari, R.; Reyes, J.C.; Juan Echeverry, J.; Fuentes, G. A simplified component-based methodology for the seismic vulnerability assessment of school buildings using nonlinear static procedures: Application to RC school buildings. Bull. Earthq. Eng. 2022, 20, 6555–6585. [Google Scholar] [CrossRef]
  37. Applied Technology Council. ATC-40. Seismic Evaluation and Retrofit of Concrete Buildings. 1996. Available online: https://www.atcouncil.org/pdfs/atc40toc.pdf (accessed on 3 April 2023).
  38. Pujades, L.G.; Vargas-Alzate, Y.F.; Barbat, A.H.; González-Drigo, J.R. Parametric model for capacity curves. Bull. Earthq Eng. 2015, 13, 1347–1376. [Google Scholar] [CrossRef] [Green Version]
  39. Jalayer, F.; De Risi, R.; Manfredi, G. Bayesian Cloud Analysis: Efficient structural fragility assessment using linear regression. Bull. Earthq. Eng. 2015, 13, 1183–1203. [Google Scholar] [CrossRef]
  40. Hurtado, J.E.; Barbat, A.H. Monte Carlo techniques in computational stochastic mechanics. Arch. Comput. Methods Eng. 1998, 5, 3–29. [Google Scholar] [CrossRef]
  41. Rubinstein, R.Y.; Kroese, D.P. Simulation and the Monte Carlo Method, 3rd ed.; John Wiley & Sons, Inc.: New York, NY, USA, 2016; pp. 1–414. Available online: https://onlinelibrary.wiley.com/doi/book/10.1002/9781118631980 (accessed on 3 April 2023).
  42. Schmidt, B.J.; Bartlett, F.M. Review of resistance factor for steel: Data collection. Can. J. Civ. Eng. 2002, 29, 98–108. [Google Scholar] [CrossRef]
  43. Bartlett, F.M.; Dexter, R.J.; Graeser, M.D.; Jelinek, J.J.; Schmidt, B.J.; Galambos, T.V. Updating standard shape material properties database for design and reliability. ASCI Eng. J. 2003, 40, 1–14. Available online: https://www.aisc.org/Updating-Standard-Shape-Material-Properties-Database-for-Design-and-Reliability (accessed on 3 April 2023).
  44. Iman, R.L. Appendix A: Latin hypercube sampling. In Encyclopedia of Statistical Sciences; Wiley: New York, NY, USA, 1999; Volume 3, pp. 408–411. [Google Scholar]
  45. Structural Engineers Association of California. SEAOC. Vision 2000: Performance Based Seismic Engineering of Buildings. 1995. Available online: https://www.seaoc.org/store/ViewProduct.aspx?id=11238558 (accessed on 3 April 2023).
  46. Aldama, B.D. Proceso Automatizado Para Determinar el Estado Estructural en Edificios Instrumentados. Master’s Thesis, Universidad Nacional Autónoma de México (UNAM), Ciudad de México, México, 2009. (In Spanish). [Google Scholar]
  47. Murià-Vila, D.; Aldama, B.D.; Loera, S. Structural warning for instrumented buildings. In Proceedings of the 14th European Conference on Earthquake Engineering, Ohrid, North Macedonia, 30 August–3 September 2010; Volume 2. Available online: https://www.tib.eu/en/search/id/TIBKAT:667434461/14th-European-Conference-on-Earthquake-Engineering?cHash=1727db18b7fdcc71af94e1729c032324 (accessed on 3 April 2023).
  48. Murià-Vila, D.; Aldama-Sánchez, B.D.; García-Illescas, M.Á.; Rodríguez Gutiérrez, G. Monitoring of a rehabilitated building in soft soil in Mexico and structural response to the September 2017 earthquakes: Part 1: Structural health monitoring system. Earthq. Spectra 2021, 37, 2737–2766. [Google Scholar] [CrossRef]
Figure 1. A 2-D view of the main frame evaluated of each building.
Buildings 13 01009 g001
Figure 2. An example of the (a) NPD with a 0.65 correlation and (b) NPD with a null correlation of the variable fy in the beams and columns in the low-rise (3-story) steel buildings in Oaxaca (OA).
Buildings 13 01009 g002
Figure 3. Deterministic and probabilistic capacity curves of the 3-story buildings in OA and TG cities.
Buildings 13 01009 g003
Figure 4. Deterministic and probabilistic capacity curves of the 7-story buildings in OA and TG cities.
Buildings 13 01009 g004
Figure 5. Deterministic and probabilistic capacity spectra of the 3-story buildings in OA and TG cities and their respective DSnon-null.
Buildings 13 01009 g005
Figure 6. Deterministic and probabilistic capacity spectra of the 7-story buildings in OA and TG cities and their respective DSnon-null.
Buildings 13 01009 g006
Figure 7. Capacity spectrum of the deterministic cases in OA and TG cities. The dotted lines represent different periods.
Buildings 13 01009 g007
Figure 8. Deterministic and probabilistic T1i–MIDR relationship curves of the 3-story buildings in OA and TG cities and their respective DSnon-null.
Buildings 13 01009 g008
Figure 9. Deterministic and probabilistic T1i–MIDR relationship curves of the 7-story buildings in OA and TG cities and their respective DSnon-null.
Buildings 13 01009 g009
Table 1. Dead and live loads of the 3- and 7-story buildings.
Load TypesStoryLoad (kN/m2)
Dead Load (DL)Inter-story6.5
Roof5.0
Live Load (LL)
(Office building)
Inter-story2.5
Roof1.0
Table 2. Steel W-type sections of the 3-story buildings.
CityColumnsBeams
C1C2B1
Oaxaca (OA)W14 × 74W18 × 119W12 × 72
Tuxtla Gutiérrez (TG)W16 × 67W18 × 97W14 × 48
Table 3. Steel W-type sections of the 7-story buildings.
CityColumnsBeams
C1C2C3B1B2
Oaxaca (OA)W16 × 100W18 × 192W21 × 201W12 × 53W14 × 61
Tuxtla Gutiérrez (TG)W16 × 89W18 × 119W21 × 147W14 × 61W16 × 57
Table 4. The main characteristics of the modal analysis of the 3- and 7-story buildings.
CityStoriesT1 (s) *PF1 *α1 *W (kN) *
Oaxaca (OA)30.511.300.89327.38
70.891.390.82831.04
Tuxtla Gutiérrez (TG)30.561.270.91325.89
71.041.330.84823.95
* T1: fundamental period; PF1: modal participation factor for T1; α1: modal mass coefficient; W: total weight of the building.
Table 5. Mean values and coefficients of variation of the variables used for probabilistic sampling with the Monte Carlo method.
Variable Mean   ( μ ¯ )   * Coefficients of Variation (CV) * Standard   Deviations   ( σ ¯ )   *
Yield strength, fy (kN/m2)396,448.540.06626,165.60
Modulus of elasticity, Es (kN/m2)200,000,0000.0397,800,000
Fracture strain, εu0.060.1550.0093
* Based on reports by Schmidt and Bartlett [42] and Bartlett et al. [43] for statistics of steel mechanical properties.
Disclaimer/Publisher’s Note: The statements, opinions and data contained in all publications are solely those of the individual author(s) and contributor(s) and not of MDPI and/or the editor(s). MDPI and/or the editor(s) disclaim responsibility for any injury to people or property resulting from any ideas, methods, instructions or products referred to in the content.