1. Introduction
1.1. Background
In terms of the amount of energy consumption of China, the household sector is second only to the industrial sector [
1]. In recent years, the amount of energy consumption per unit area of rural residential buildings has steadily increased, and the amount of electricity consumption per unit area has risen rapidly. Although there is still a significant gap between rural residential buildings and urban residential buildings, the former ones have a tendency to exceed the energy consumption of even townhouses. In the future, with the rapid development of the rural economy, research on energy-saving measures for rural residential buildings will become an important topic.
In the past research on building energy conservation, China has focused on improving the thermal performance of building envelopes and the equipment performance of electrical appliances. Envelope parameters such as the window size and orientation, glass type, thermal insulation, shading, and air-tightness can significantly affect the level of indoor thermal comfort [
2]. In addition to the envelope parameters [
3], household size is considered to be the most important predictor of energy consumption [
4], and the variables directly affected by household members have the strongest ability to explain the annual electricity consumption by the house. Buildings’ energy consumption is also related to the occupants’ energy consumption behavior [
5], with the energy-saving potential of residential buildings having been estimated to be in the range of 10–20% as the occupant’s behavior changes [
4].
In order to achieve more comfort and energy-saving effects, some scholars have studied the uncertainty of residential energy consumption, mainly by using a sensitivity analysis to analyze the main influencing factors for a multifactor analysis. Because thermal comfort is a state in which the occupants are satisfied with their surrounding environment, different evaluation indicators can significantly affect the indoor environment’s assessment results [
6]. Most existing green building standards require at least 80% acceptability to achieve satisfactory thermal comfort conditions [
6].
1.2. Energy Usage Behavior
At present, the energy consumption behavior of rural residential buildings in China is more inclined to “zoning” and “intermittent” energy use, and this approach can reduce the energy consumption of air conditioning by nearly one half [
7]. When one is using natural ventilation, indoor and outdoor ventilation play a very important role in indoor comfort [
5], and most of the residents’ behavior with respect to turning on the air conditioner is to “turn it on when you feel hot” [
8], so it is necessary to consider people’s “temperature tolerance” [
9]. Due to the differences in people’s tolerance to heat and cold, the cold energy consumption of the building can be reduced by up to 34.83%, and the heat energy consumption can be reduced by up to 24.92% compared with the normal indoor temperature [
10]. Due to the randomness of human behavior, the probability of there being people in every functional area of the house is not always the same [
11], and the probability distribution presents different laws over time [
12], for example, the probability of being in the bedroom in the morning and evening is high, and the probability of them being in the kitchen during the consumption of their meals is high. In addition, the gender of the respondents and the environmental variables also play important roles [
13]. Initially, researchers believed that users in cool and warm environments used less energy [
14]. The greater the gap between the indoor temperature and the human comfort range is, the higher the probability is of households turning on air conditioning [
15]. Rural residents generally use natural ventilation, such as open windows indoor sprinklers for cooling [
16]; air conditioning is not used often. In addition, air conditioning is usually used for cooling in summer. In general, the use of air conditioning in summer is common during the night when the temperature is relatively high from July to September and only for a few days in winter for heating [
17].
In addition, some scholars have studied the causes of window opening behavior and its relationship with energy consumption, finding that the indoor temperature [
18], rainfall [
19], the season and the window orientation [
10] and the indoor carbon dioxide concentration [
7] have obvious effects.
At present, the influence of age group and family model in rural areas has not been considered in the research on buildings’ energy consumption, and in addition to the available energy behavior [
4], the family model also has a great impact on the building’s energy consumption [
3].
In addition to the fact that energy use behavior has a large impact on energy consumption [
4], the structure of the home also has a large impact on the energy consumption of the building [
3]. The tolerance level of occupants to heat is related to their age, gender and economic conditions. The higher the tolerance to heat is, the lower the frequency of using air conditioning is, resulting in less energy consumption in the building [
20,
21].
1.3. Aims of this Research
In this study, the family patterns of rural households were explored through questionnaires and field surveys, and then the global sensitivity analysis of the actual energy use behavior of various generations was inputted into the model according to the questionnaire results. The highly sensitive parameter sequences affecting the buildings’ energy consumption rates and comfort in the corresponding household mode were determined by ranking the standardized regression coefficients and R2 values, and reasonable suggestions were made based on the conclusions.
A description of the structure of the paper has been included in the introduction:
Section 2 introduces the research framework and research methodology of this paper,
Section 3 introduces the basic information of the questionnaire,
Section 4 introduces the basic parameters of the model setup and the three most common household models based on the results of the research,
Section 5 introduces the validation of the model simulation data and the method of field research and data collection in the field,
Section 6 introduces the ranking of the SRC values of each influencing factor under the three models of building energy consumption and discomfort, and
Section 6 presents the conclusion, shortcomings and outlook.
2. Research Framework and Method
2.1. Research Framework
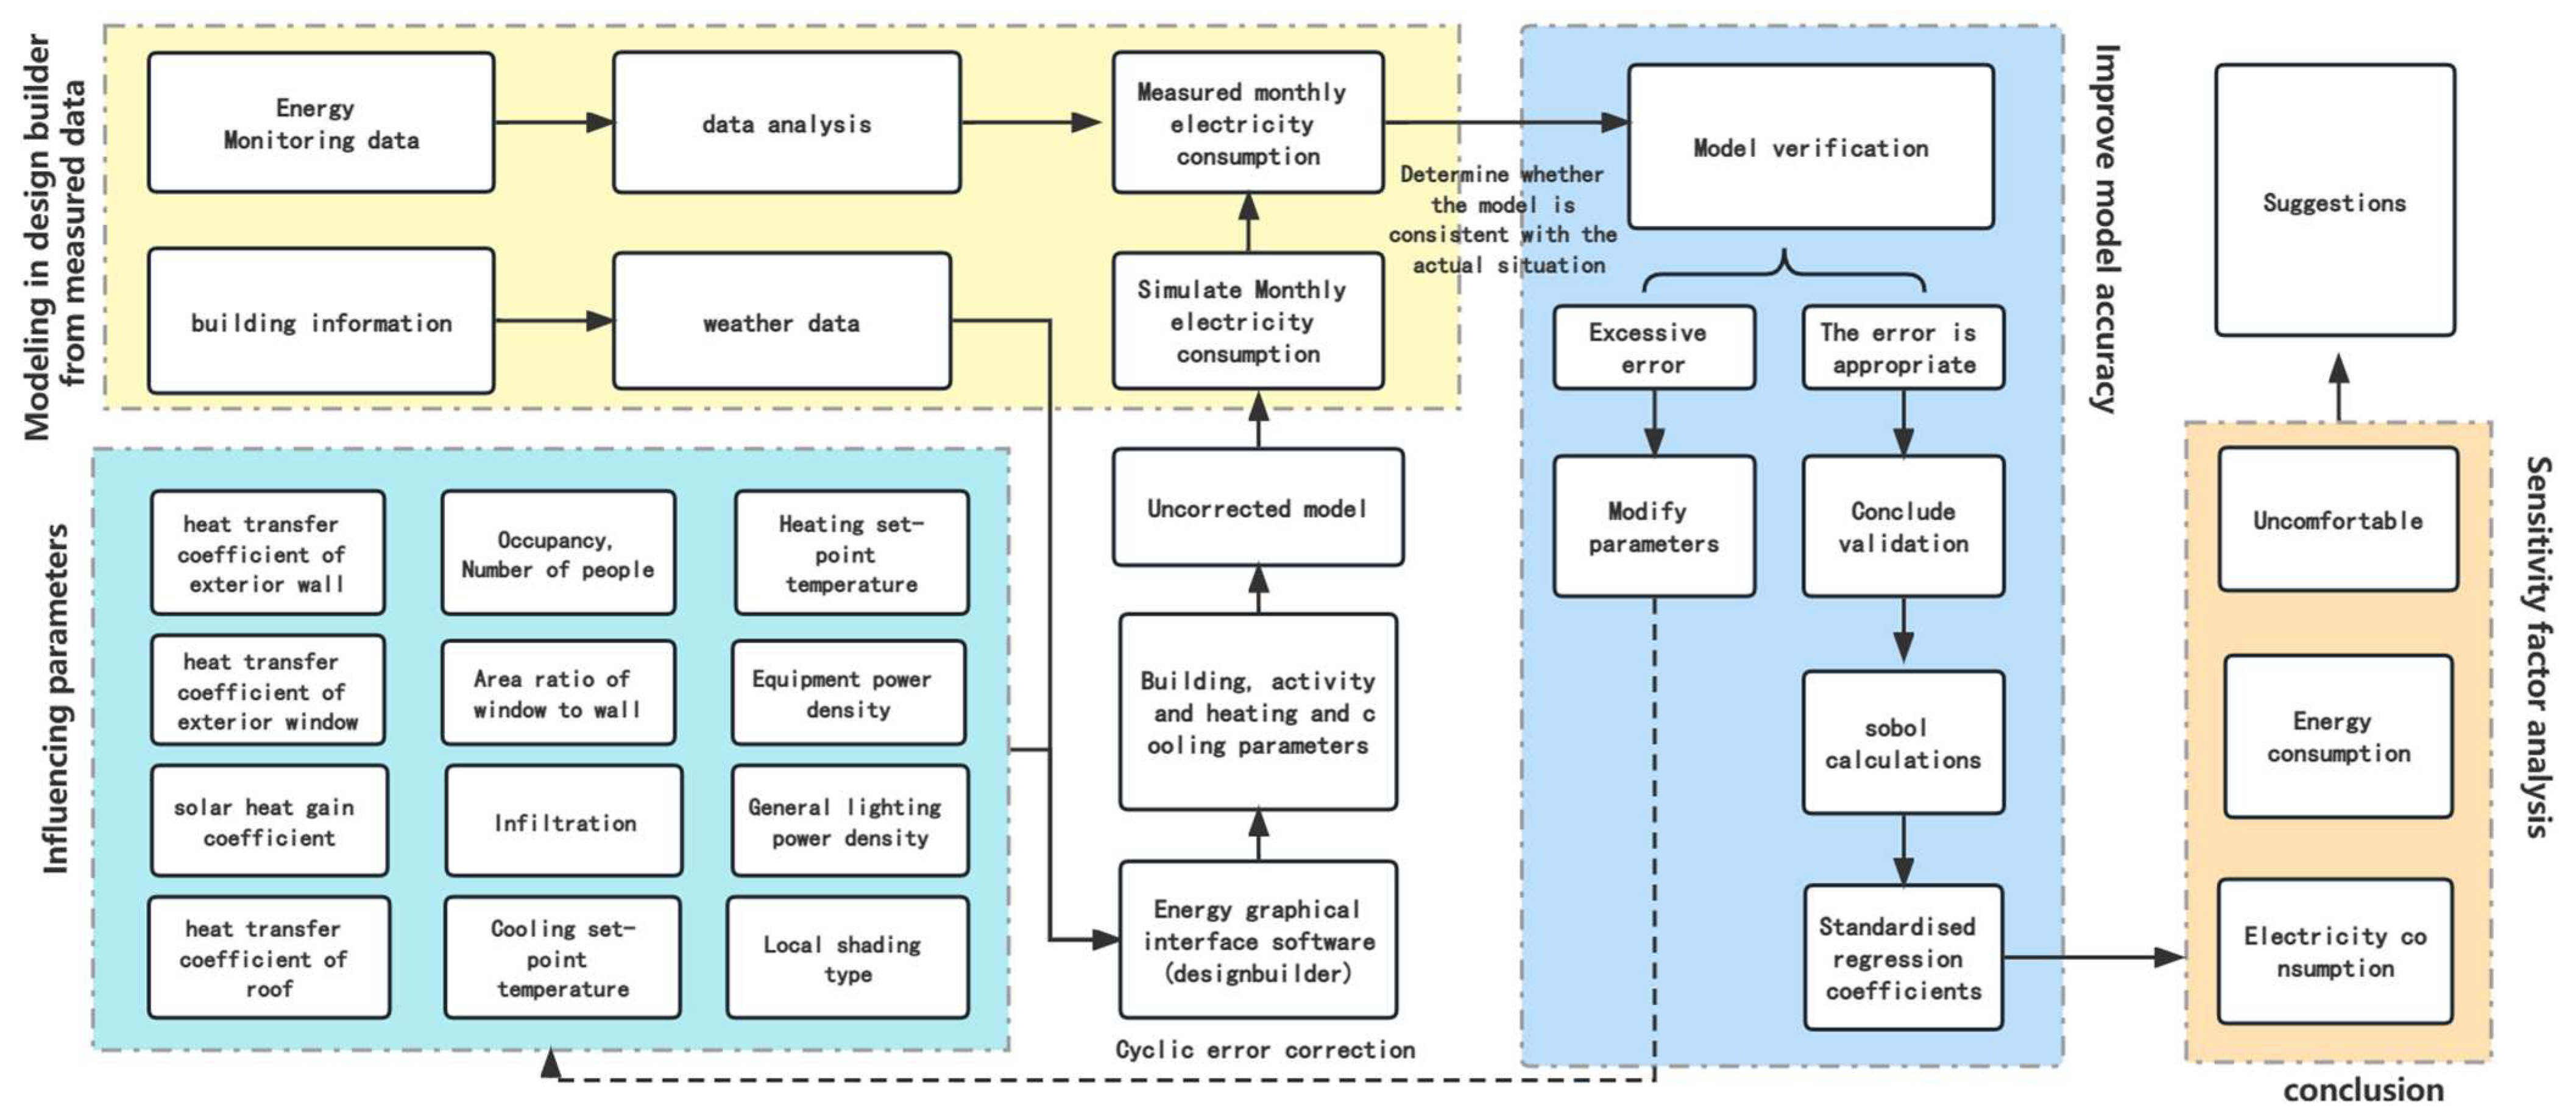
The research framework of this paper is shown in
Figure 1, and it mainly includes the following three steps:
Step 1: a questionnaire survey was conducted to understand the energy consumption characteristics, different household structures, and living habits and behaviors of rural people of different ages in southeast coastal areas of China.
Step 2: DesignBuilder software was used to establish a benchmark model of a typical rural house and verify its accuracy. By changing the design parameters in the global sensitivity analysis, the factors influencing the energy consumption and comfort of the residents of a typical house were determined.
Step 3: The simulated data were subjected to a sensitivity analysis, which is a method used to identify the relative importance of the input parameters; it is defined as “the study of how changes in the output of a model (numerical or otherwise) are qualitatively or quantitatively designated as different sources of change”. The purpose of a sensitivity analysis is to determine the links between the changes in the independent input parameters and the changes in the independent output variables. Sensitivity coefficients obtained through a sensitivity analysis can enhance one’s understanding of a model’s performance and its response to input changes, helping them to identify possible changes in order to improve the building’s performance. It can also identify important and unimportant parameters in the model, allowing them to customize the input variables and constraints to solve the optimization problems. Based on the results of the sensitivity analysis, corresponding measures were proposed. The framework of the study in this paper is shown in
Figure 1.
The power density of the electrical equipment in residential buildings, the time period of electrical equipment use (such as lamps, air conditioners and electric blankets), as well as the time period of each generation of people in the room and the time period of them being in each functional room in the room were collected through questionnaires and the researchers taking actual measurements. Then, we sorted them into the categories of the people’s activity parameters, the people’s and buildings’ base parameters, and the time period of them being in each functional room in inputted them into DesignBuilder to obtain the preliminary parameters of the simulated model.
2.2. Research Methods
In many cases, since a high thermal comfort level and a low energy consumption rate are two conflicting states, these problems are solved by applying various optimization methods [
22]. A common approach is multi-objective optimization (MOO), where the goal is to optimize the function of the variables that may be subject to various constraints; a typical MOO problem should contain optimization parameters, objective functions and constraints [
2].
In the parameter design phase, the input parameters have the same value probability; a uniform or discrete distribution can be selected, and the normal distribution is applied to the input variable that is not affected by the occupant’s behavior [
22]. In the early design phase, linear regression can be used as an effective simplified model, instead of energy simulation models [
23]. By establishing the behavioral patterns of human activity, such as changes in the temperature setpoints, we can see that air conditioning is activated only after reaching a specified cooling setpoint temperature, and a combination of sociodemographic and behavioral models can better explain the annual energy consumption of residential buildings [
6]. In addition to energy consumption, common target parameters include optimizing the amount of energy consumption [
24] and minimizing the life cycle costs, while improving the performance [
25], as well as the heating and cooling loads, the comfort level and electricity consumption rate.
Energy consumption was mainly simulated through energy consumption simulation analysis software, and we inputted the independent variables influencing energy consumption, mainly consisting of three parts: the input of the independent variables, the building simulation and the output of the response variable values by changing the independent variables and then changing the value of the strain variable; such a simulation process is called a forward simulation method [
26]. This study used a global sensitivity analysis by selecting 12 main influencing factors and calculating the standardized regression coefficient of each factor in the corresponding output value to determine the most important parameters.
The global approach can be further divided into four methods: regression, filter-based, variance-based and metamodel sensitivity analyses [
27]. Most of the global SAs in architectural applications use sampling-based Monte Cato analysis (MCA) [
28] and multiple regression methods to assess the sensitivity of miscellaneous input parameters [
6].
Multivariate global sensitivity analysis [
23] and uncertainty analysis [
29] can be used to construct thermal simulations by using a Monte Carlo analysis to study probabilistic phenomena, followed by approximately random sampling from multivariate parameter distributions using Latin hypercube sampling and an uncertainty analysis [
29]. To improve the computational efficiency, optimization can be performed by combining TRNSYS (Transient Systems Simulation Tool) and jEPlus+EA (EnergyPlus Simulation Manager for Parametric + Evolutionary Algorithms). For six different climatic applications in eight locations in Australia, the optimal solution varies for each climatic zone by using the envelope components as decision variables, and the best solution has a 27–31% higher LCC saving compared to that of the baseline [
2]. Optimization can be achieved by coupling a genetic algorithm [
25,
30] with a building simulation engine; through the optimization of multiple objectives (e.g., the cost and performance), the optimization tool stores the output variables and processes the data using the algorithm to generate Pareto-optimal solutions [
2,
24,
31].
When one is considering the interactions between the variables, the commonly used methods include FAST (Fourier amplitude sensitivity testing) and Sobol; the FAST method only considers the nonlinear effects, and it does not consider the interaction effects, while the Sobol method can decompose all of the output variances, which means that no output variance is left in the analysis. The Sobol method requires a long calculation time [
27].
The results of the sensitivity analysis are usually very dependent on the range of values of the influencing parameters. Three different probability density functions are usually employed: uniform, log-normal and normal distributions [
32].
The method used in this study was variance-based sensitivity analysis (often referred to as the Sobol method or Sobol index) as a form of global sensitivity analysis. Working within a probabilistic framework, this method decomposes the variance of the output of a model or system into scores that are attributable to the input or input set, can measure the sensitivity of the entire input space (i.e., it is a global method) and can be used to process nonlinear responses.
Since different influencing factors tend to affect one another, global sensitivity analysis can effectively reduce the error [
33]. The current sensitivity analysis focuses on global sensitivity analysis, which is divided into four methods: regression, screen-based, variance-based [
27] and metamodel sensitivity analyses [
34]. For the regression methods, Latin hypercube sampling is suitable for a wide range of use cases due to its efficient layering nature. Another commonly used technique in the regression methods is the stepwise method, in which all of the R
2 values obtained from the stepwise multiple regression are judged, and the data represent the proportion of energy consumption that can be explained by the influencing factors of the independent variable, such as the R
2 value being equal to 0.95, which means that 95% of the change in energy consumption can be explained by the changes in the participating influencing factors [
35].
The evaluation coefficient used in this study was the standardized regression coefficient (SRC), which is usually used to answer the question of which independent variables have a greater influence on the dependent variable in the multiple regression analysis [
23], where the variables have different units of measurement, which can also be considered as a general measure of the size of the effect, quantifying the magnitude of the effect of one variable on another variable. However, the standardized regression coefficients of each parameter obtained for the same building in different environments are almost always different. Therefore, it is not possible to extrapolate the coefficients of the parameters of the buildings in other cases.
3. Questionnaire Survey
A total of 872 questionnaires were collected family research questionnaires, of which 441 were valid, with an efficiency rate of 50.6%, including a total of 1172 individual research questionnaires from family members.
- 2.
Structure of the questionnaire:
The main population of this questionnaire is aged from 40 to 50 years old, accounting for 36.5%, while 8.7% of the people are under 20 years old, 16.9% of the people are between 20 and 30 years old, 9.3% of the people are between 30 and 40 years old, 12.4% of the people are between 50 and 60 years old and 6.8% of the people are over 60 years old.
- 3.
The main contents of the questionnaire:
The participants’ age, gender and income and whether they use heating equipment in winter, whether they use cooling equipment in summer, the duration of heating in winter, the duration of cooling in summer and the duration of being in a room were included.
- 4.
Data composition of the questionnaire, The sample size distribution of the questionnaire in each city in Zhejiang Province is shown in
Figure 2.
The data sources of this paper are mainly concentrated in various cities of Zhejiang Province, among which 120 questionnaires in Wenzhou and 89 questionnaires in Hangzhou were filled out. The original questions of the questionnaire are shown in
Appendix A.
- 5.
Data results of the questionnaires:
According to the questionnaire data, 30.5% of the people do not heat their homes in winter, 69.5% of the people heat their homes in winter, and the heating in winter mainly “turned on before going to bed and turned off after going to bed”, accounting for 49.36% of the population; in summer, 72.6% of the people perform cooling measures in summer, while 29.4% of the people do not perform cooling measures. In the summer, cooling behavior occurred mainly when they were sleeping, accounting for 48.39%.
There are significant urban–rural differences in the human thermal comfort levels, and younger people have a higher thermal tolerance than adults do [
36]. At the same time, the difference in thermal comfort zones between urban and rural residents also causes the energy use behavior of rural and urban residents to differ significantly [
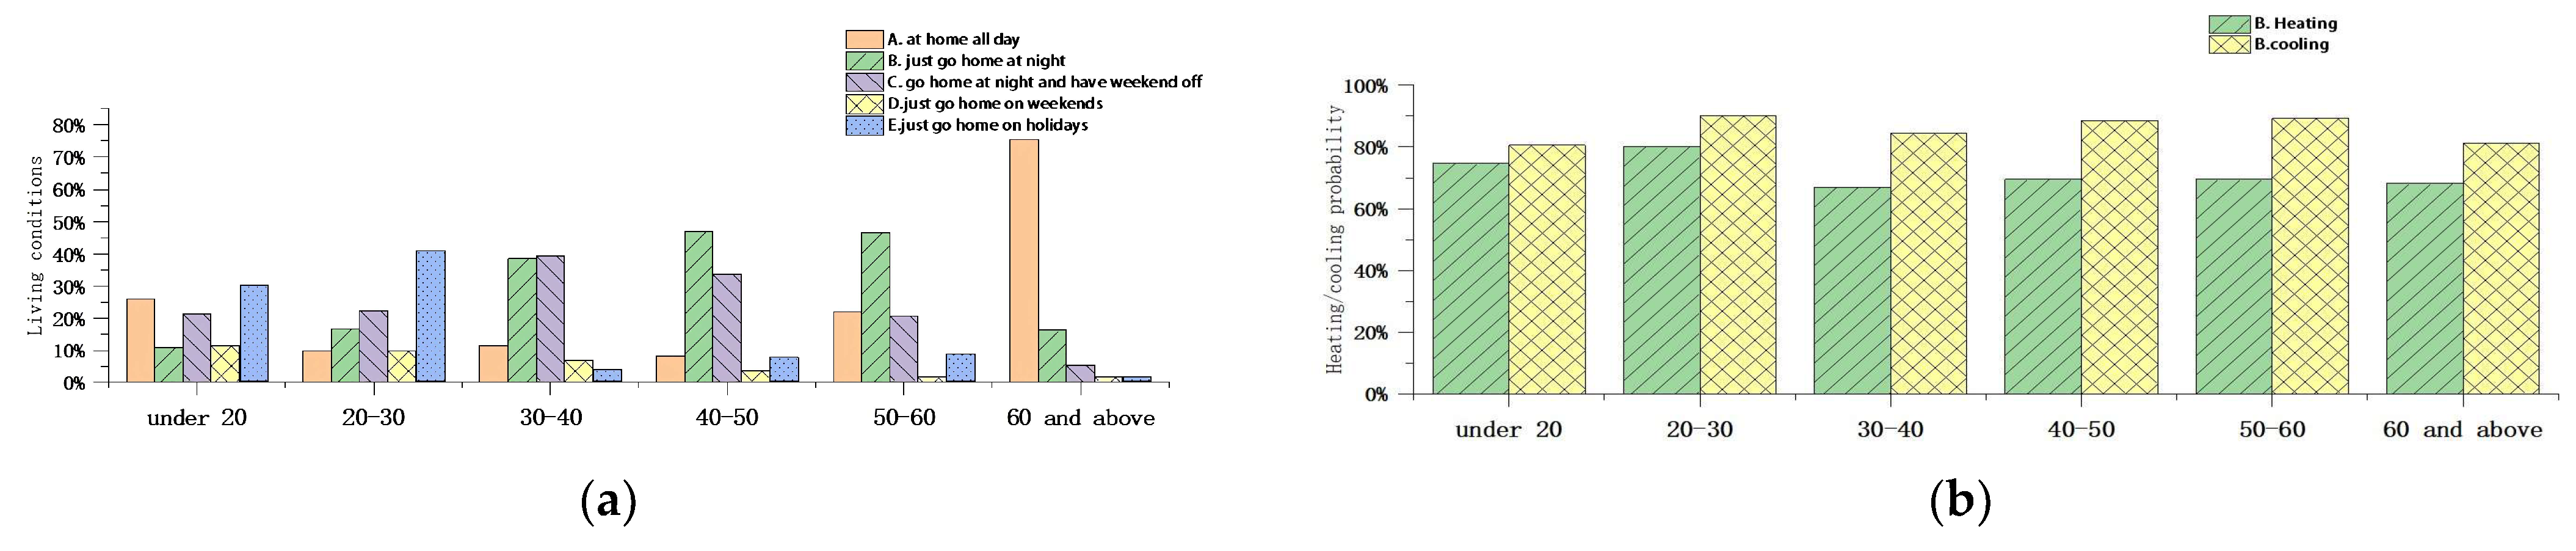
37]. In order to explore whether there is a gap between people’s activity patterns and energy use behaviors at different ages, we took rural dwellings in Zhejiang Province as the survey object, conducted a questionnaire survey and investigated the family situation and personal information of the inhabitants in Zhejiang’s rural dwellings through questionnaire surveys in 2021~2022. In order to ensure the accuracy and representativeness of the questionnaire results, a total of 872 household survey questionnaires were collected and analyzed, of which 441 were valid questionnaires, reflecting an effective rate of 50.6%, along with 1172 individual survey questionnaires from family members. The results of the questionnaire on the differences in energy usage behaviors by different age groups are shown in
Figure 3.
For the older age group, the proportion of people who do not usually go home or go home on weekends is becoming smaller and smaller, showing an overall uniform downward trend.
The probability of people under the age of 20 going out to work during the day and returning home at night, except at the weekends, was 10.8%, which then reached a peak of 39.4% with increasing age, before steadily decreasing.
According to the figure, the probability of people of different ages being in a given room is very different, and the distribution of the types of people under the age of 20 is more uniform. People aged 20 to 30 years more often did not go home at usual times or go home on holidays. The 30–40-year-old group most commonly went out to work during the day and went home at night, except on the weekends, and worked during the day, went home at night and took weekends off. Compared with the people aged 30 to 40 years, people aged 40 to 50 years were more likely to go out to work during the day and go home at night, except at the weekends. People aged 50 to 60 years mainly tended to go out to work during the day and come home at night, except at the weekends. People over 60 years of age were generally at home all day, and the probability of them being in a given room was the highest.
As shown in
Figure 3, in all of the age groups, the probability of using energy in summer was 12% higher than that in winter, overall, and it can be seen from
Figure 1 that the impact of age on heating and cooling behaviors shows a similar trend, rising from 20 to 25 years old, rapidly declining from the ages of 25 to 35, and then displaying a trend of first rising, and then declining from the ages of 35 to 60. People aged 20–30 years have the highest probability of heating and cooling their homes in winter and summer, respectively. It can be seen that there is a significant gap between the mode of activity and the energy use behavior of the people of different ages.
The questionnaires in the Zhejiang Province in China were used to list the possible family patterns in a permutation, with each generation having two working lifestyles: one where no one worked, and they stayed at home, and the other one, where the occupants worked and returned home on the weekends or holidays. Considering that the first 11 patterns already accounted for 95% of the questionnaire results, the remaining proportion of family patterns in the “first generation employment” situation does not affect the first three most common family patterns.
Based on the questionnaire survey results, the composition ratio of the members of different family models is shown in
Table 1. As can be seen from the table, the top three rural family model types are Model 1, Model 2 and Model 3, accounting for 49%, 8% and 8%, respectively. This result can be used as a typical family model type for the analysis and simulation.
4. Establish Simulation Model
Commonly used energy consumption simulation software platforms include EnergyPlus [
38,
39], ESP-r, TRNSYS, DOE2, OpenStudio [
40], jEPlus and SimLab [
41]. The DesignBuilder platform used in this study is based on EnergyPlus, which was the core, which studies the degree of influence of the sensitivity coefficient of the family model on various factors influencing rural residential buildings’ energy consumption and simulates changes in heating energy consumption, cooling energy consumption, total electricity and comfort level by changing each influencing factor, calculating the simulation data and analyzing the calculated standardized regression coefficients to obtain the importance ranking of each influencing parameter.
4.1. Establishment of Typical Models
4.1.1. Personnel Activity Parameters
The conditions for simulating the energy use periods of the first generation residents are. 8:00 p.m. to 6:00 a.m., air conditioning is used in summer and not in winter; the indoor temperature setting of the bedroom is 26 °C in summer; the winter room is used to calculate the air temperature change for 1 time/h; the summer room is used to calculate the air temperature change for 1 time/h.
The second- and third-generation residents’ energy use time periods take place at 7:00 p.m.~7:00 a.m. The winter indoor temperature setpoint in the living room is 18 °C; the summer indoor temperature setpoint is 26 °C.
4.1.2. Three Typical Family Patterns
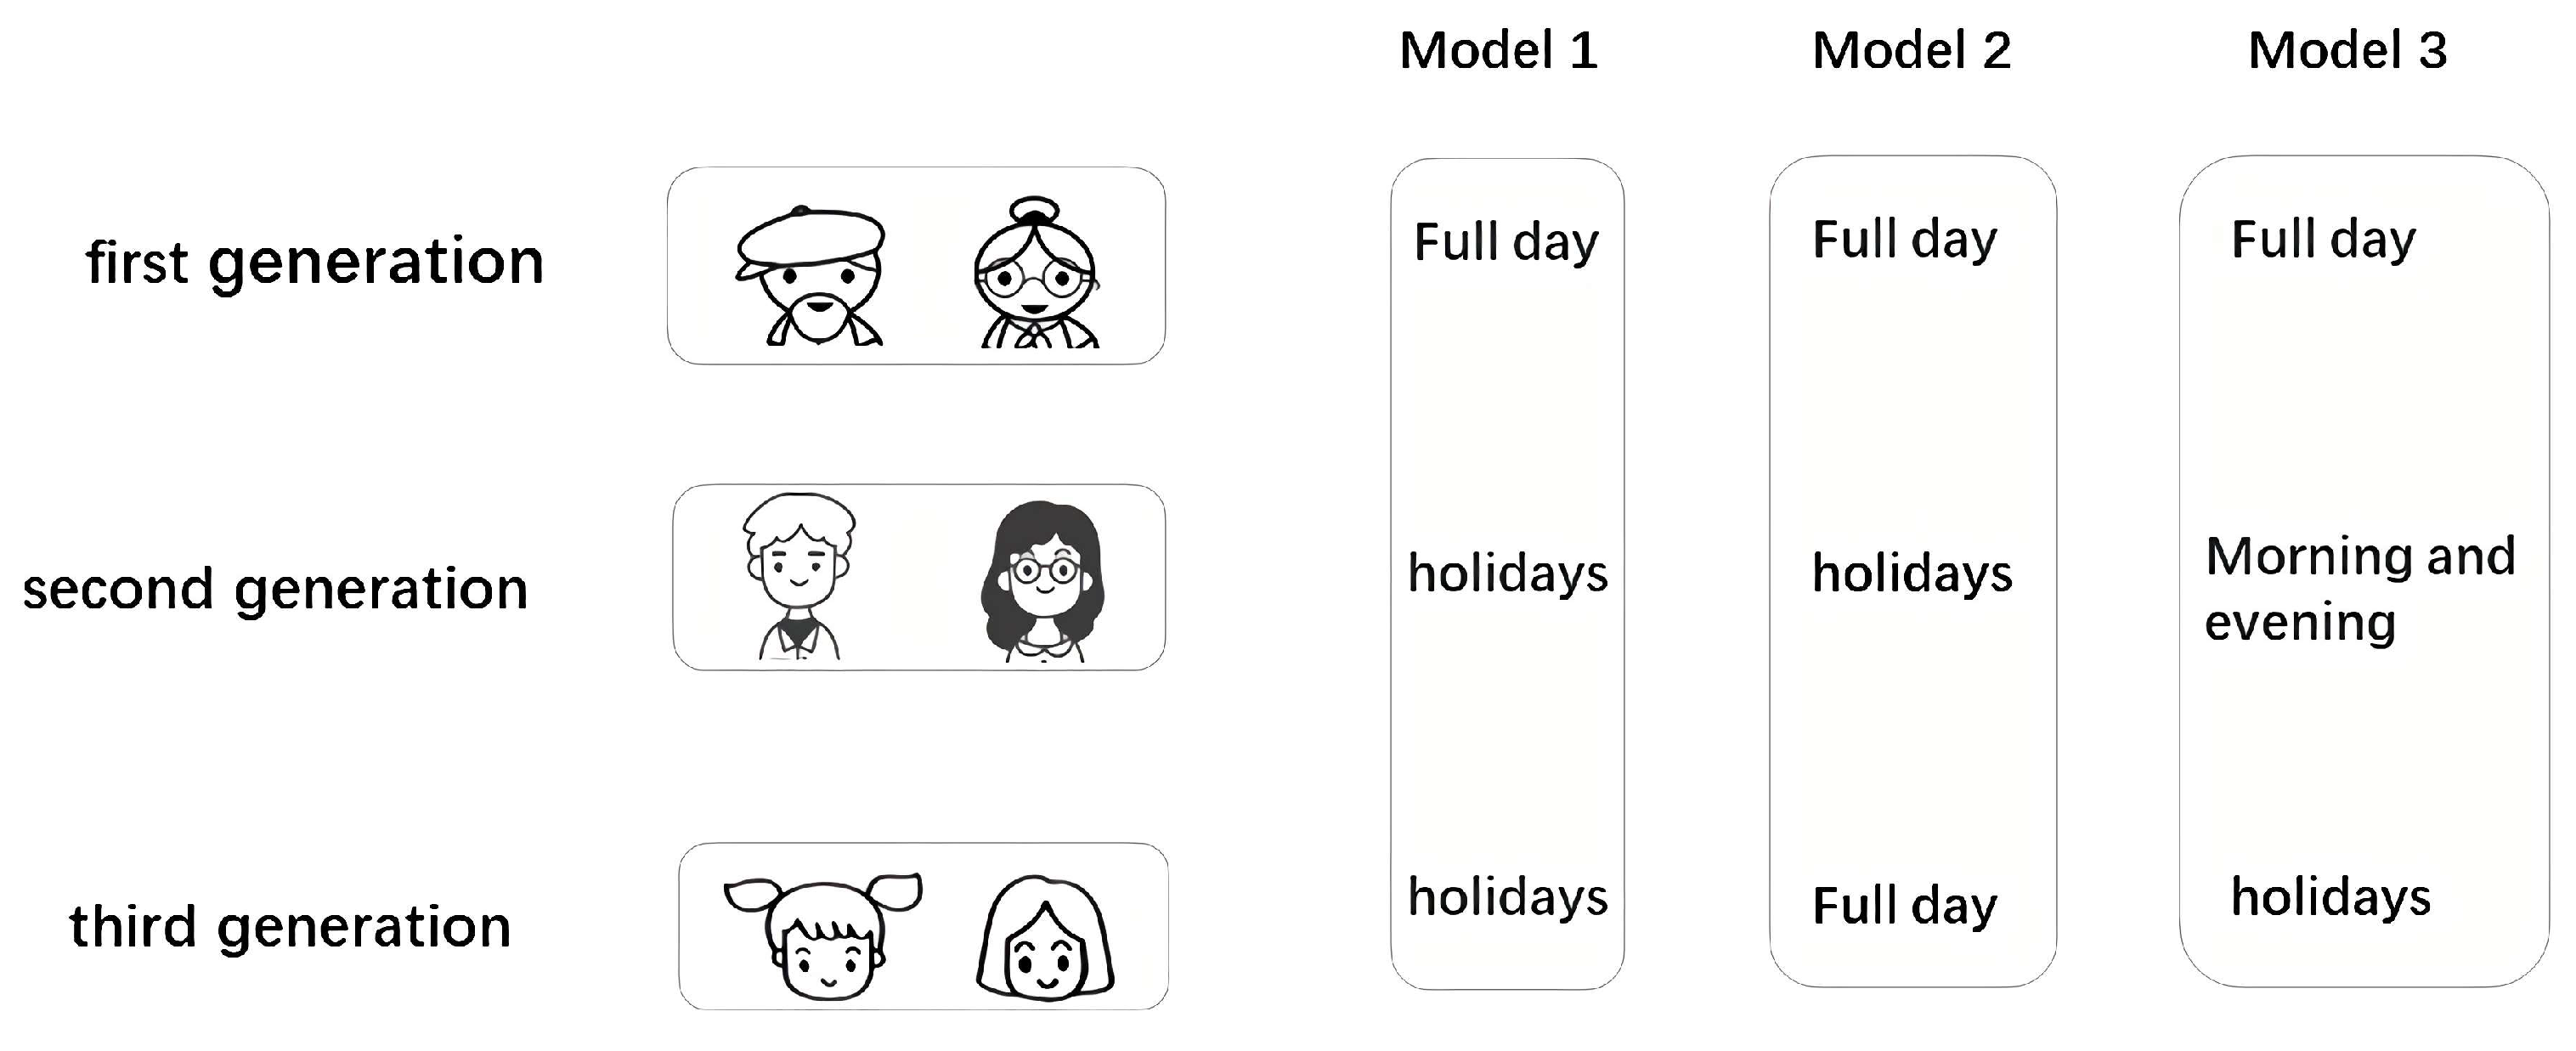
As shown in
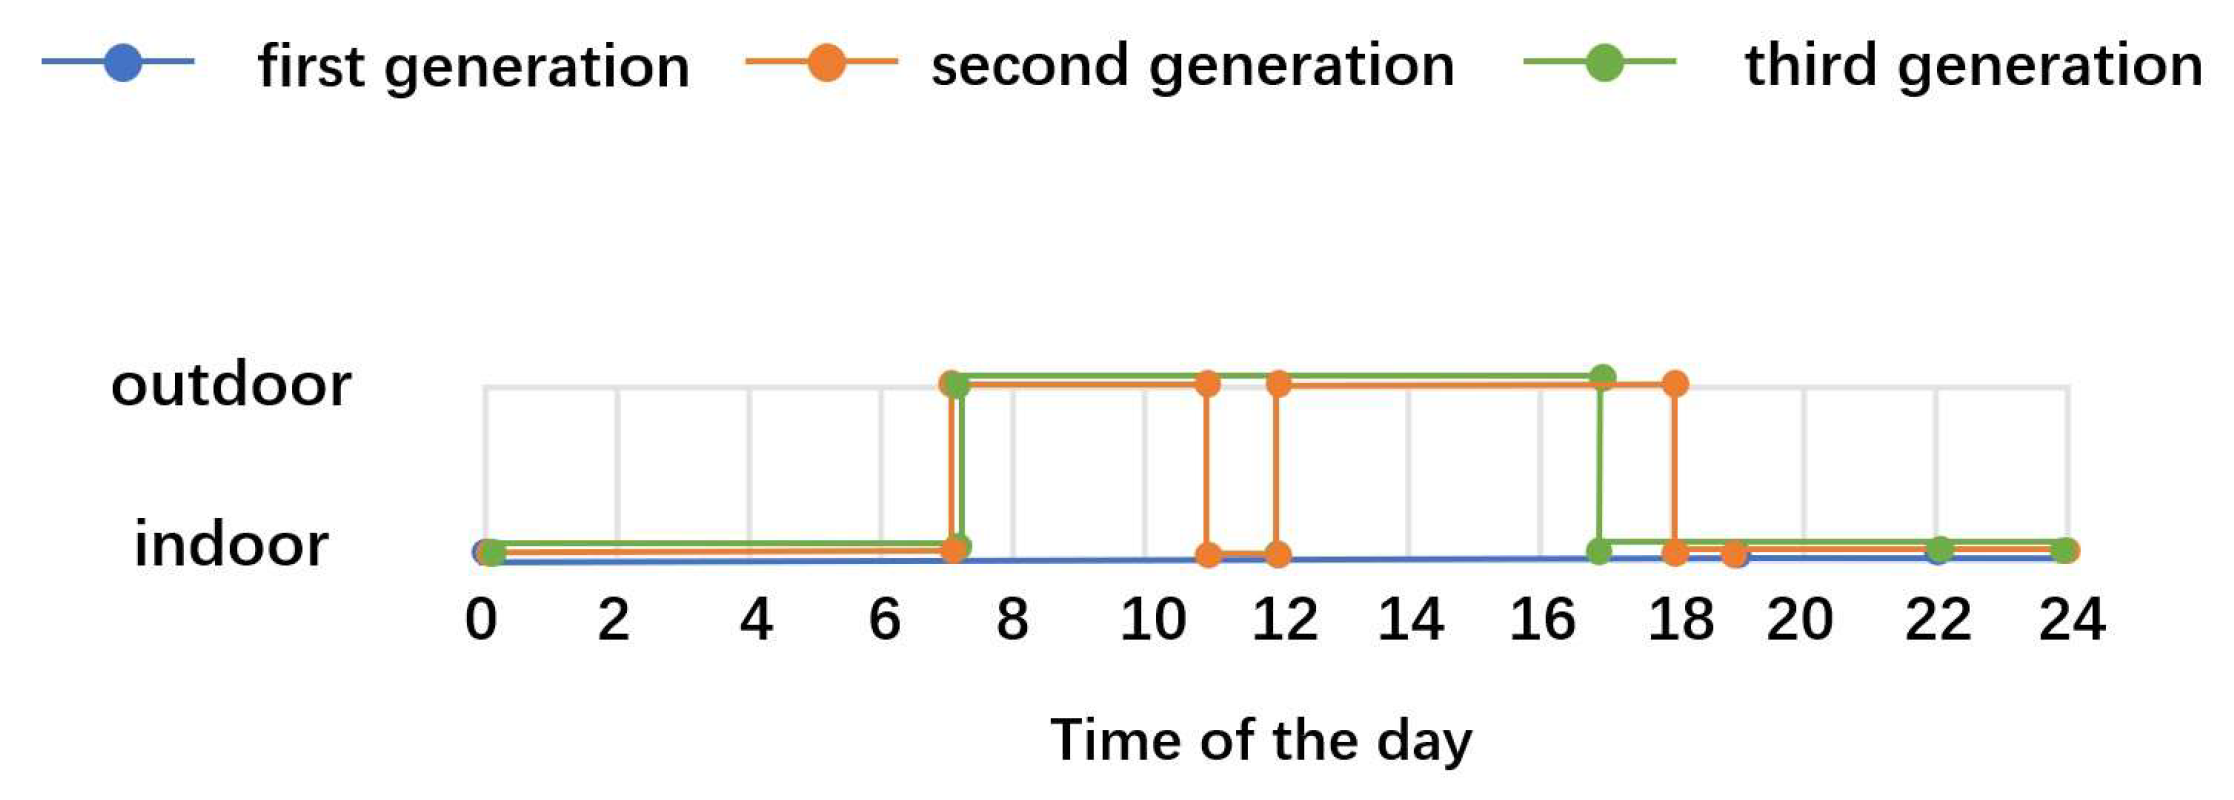
Figure 4, through the survey questionnaire of the actual situation, the three most common family models were selected. Due to the phenomenon of population outflow, the most common scenario in the Zhejiang Province region is first-generation residents living alone, while the second-generation residents go out to work and return home on holidays or New Year, and the third-generation residents go out to school or work, returning home for winter and summer vacation or holidays. (This means that in the mock-up’s schedule, the person is in the room is during summer and winter hours and holidays, while the rest of the time, they are not in the building, which means that no energy is used, and the room is in a natural ventilation mode).
In the case of Model 2, the first-generation residents help to raise the third-generation residents, and the second-generation residents go out to work to provide for the living costs of all three generations.
In Model 3, the first-generation residents live at home; the second-generation residents work nearby, go to work during the day and come home from work at night; the third-generation residents go to school or work.
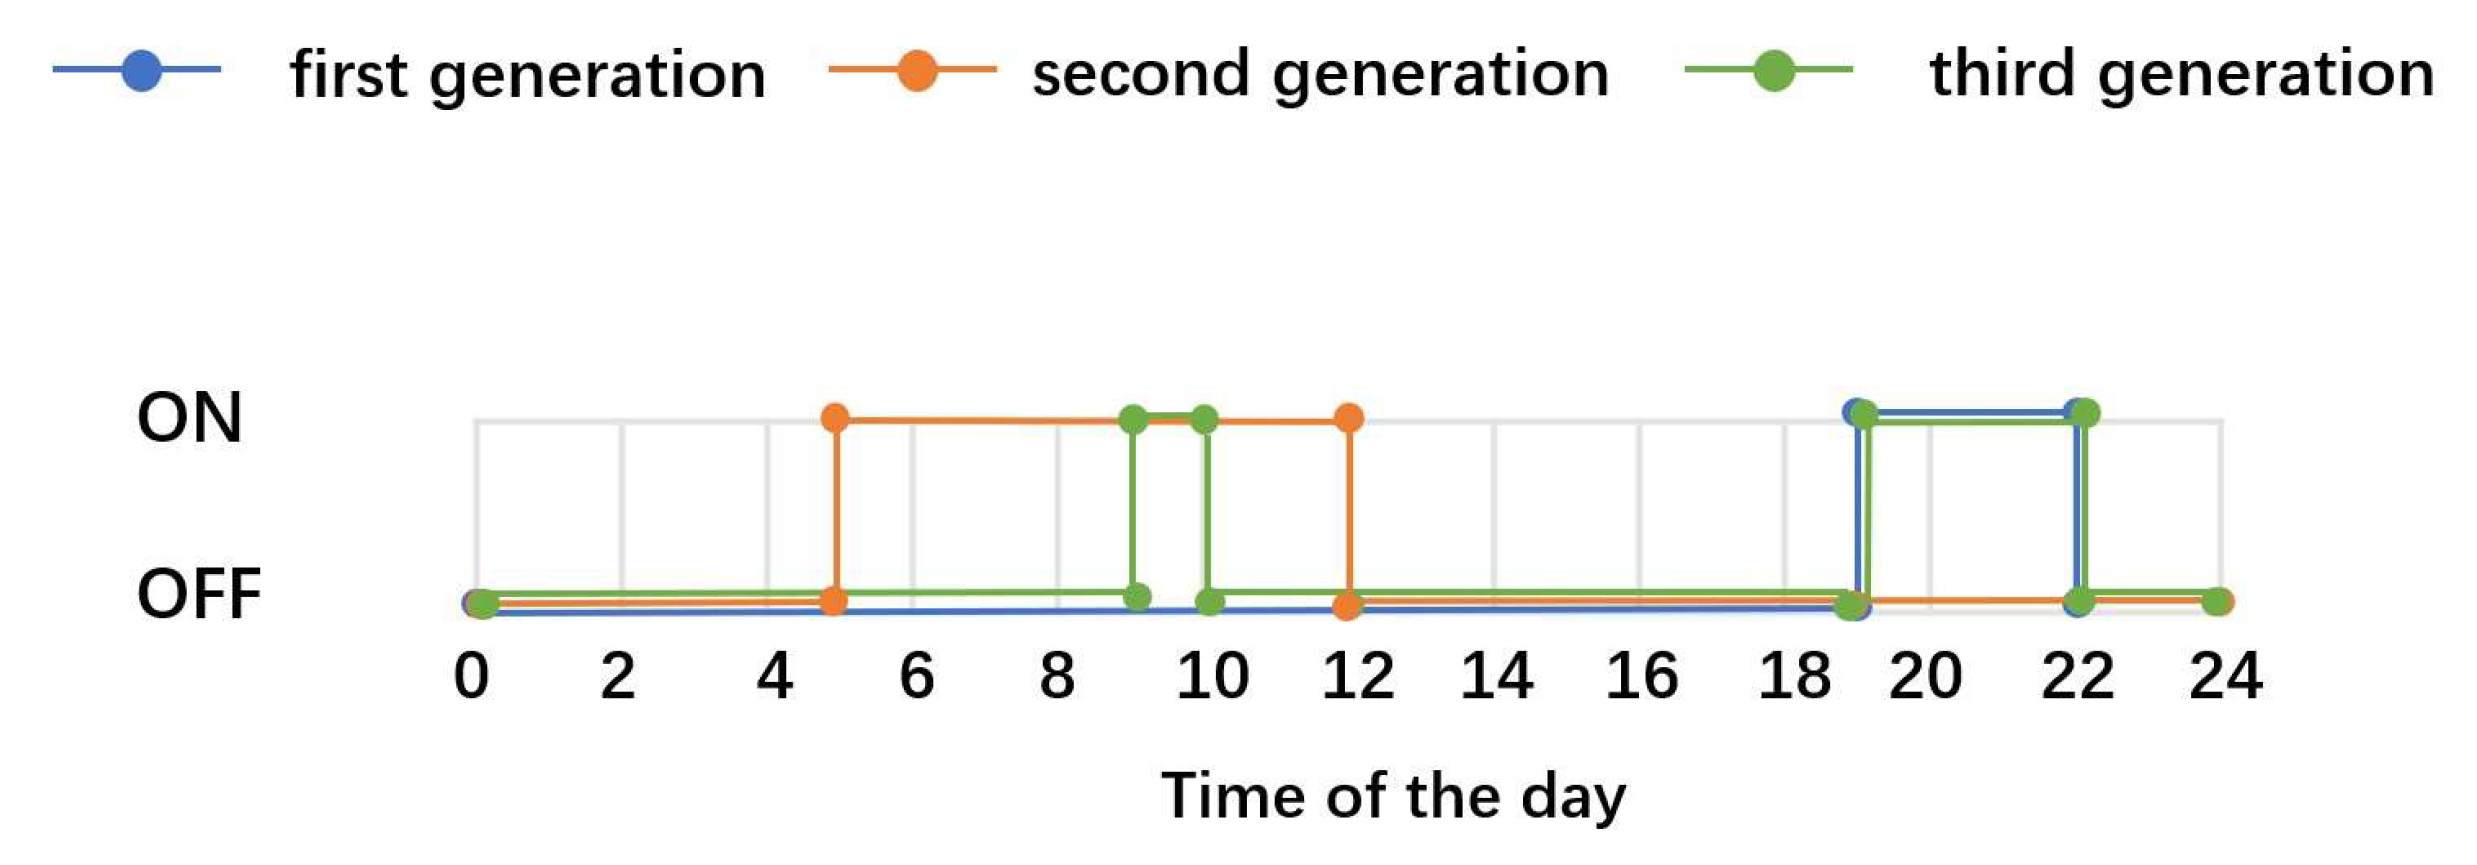
4.1.3. Energy Use Behavior and Schedule of Time Spent in the Room
After an on-site investigation, the residents’ electrical use time and time spent in the rooms were obtained, as shown in
Figure 5,
Figure 6 and
Figure 7.
Through the field survey questionnaire and the measured results from the field for different functional rooms in residential buildings, reliable parameters can be provided using the energy consumption simulation software based on the actual energy consumption behavior of different generations of people, and
Table 2 shows the basic parameter settings in each room of a typical house:
4.2. The Input Parameters for Simulation
At present, the selection of residential sensitivity parameters mainly focuses on the envelope, equipment use, and inhabitants’ behavior. The commonly involved independent variables include the window solar heat gain coefficient, the window-to-ground ratio, the external obstacles and overhang projection fraction [
38], the building shape, the window-to-exterior-wall area, the thermophysical properties of the building materials, insulation, air penetration, natural flux [
42], envelope color, the setpoint temperature, the area height [
29], internal loads, the outdoor environment, equipment and schedules [
23], the building orientation, the equipment and systems, weather, the occupants [
43], the building layout, lighting [
6], the energy-efficiency measures, the energy system design parameters and the construction quality [
40].
In terms of the envelope, the overhang ratio and building orientation are two parameters that have been considered as highly sensitive in previous studies of buildings in hot climate regions [
40]. The window solar heat gain coefficient and window-to-ground ratio are considered to be the two most influential passive design factor target parameters [
38]. Building loads are mainly affected by the residential density, lighting loads and equipment loads [
38]. The most sensitive design parameters to the annual cooling energy load of low-rise apartment buildings are natural passage, the window area and the solar thermal gain coefficient of glass [
42]. In predominantly cold climates, the type of window has a greater impact on reducing the amount of energy used, and the most sensitive parameters for the cooling load are the north-facing window’s shading factor, type and area. In predominantly hot climates, wall insulation has been found to be a more effective strategy [
41].
When one is considering the building’s form, H-shaped buildings use less energy than L-shaped, rectangular, triangular, T-shaped and U-shaped buildings do [
43].
When the inhabitants’ behavior is taken into account, larger household sizes, higher occupancy rates, lower wall insulation thermal resistance and smaller airflow rates can reduce the end-use energy consumption [
4].
After optimization through a sensitivity analysis, the model optimized according to the SA cooling indicators achieved overall energy savings of 41.6% compared to that of the benchmark building [
38].
Frequently involved target variables include the number of thermal discomfort hours (TDH), the number of daylight unsatisfied hours (DUH), the life cycle cost (LCC) [
2,
25], energy use, the thermal comfort level and the amount of daylight [
41].
The DesignBuilder hourly weather data were obtained from the weather section of the EnergyPlus website and processed using the DesignBuilder weather data translator. This is mainly because the climate data needed for this paper are available in DesignBuilder’s weather files for all parts of the world.
In addition to the basic parameters of the building and weather data, the other 12 parameters affecting the energy consumption and comfort of the building are considered to be important influencing parameters, and the detailed influencing parameters are shown in
Table 3.
5. Model Calibration and Validation
5.1. Field Survey
The SRCs with the same design parameters vary greatly from each other in different climatic zones [
2], as well as in cities in different climatic zones [
23,
40]. Therefore, the conclusions of this paper cannot be extrapolated to dwellings under different climatic conditions.
According to the data from the official website of the local government, the village is located at 30°64′ east (longitude) and 120°08′ north (latitude), The general characteristics of the climate are: abundant precipitation, synchronized light and temperature, mild climate, and more pronounced vertical climate. The city’s annual average temperature is 12.2 to 17.3°C. The coldest January average temperature is −0.4 to 5.5 °C, the hottest July average temperature is 24.4 to 30. 8 °C, and the average relative humidity is over 80%. The winds change seasonally, with northwesterly winds prevailing in the winter and southeasterly winds prevailing in the summer, and the monsoon transition period is between March and September, with northeasterly and easterly winds prevailing. The annual average wind speed is 1.7~3.2 m/s.
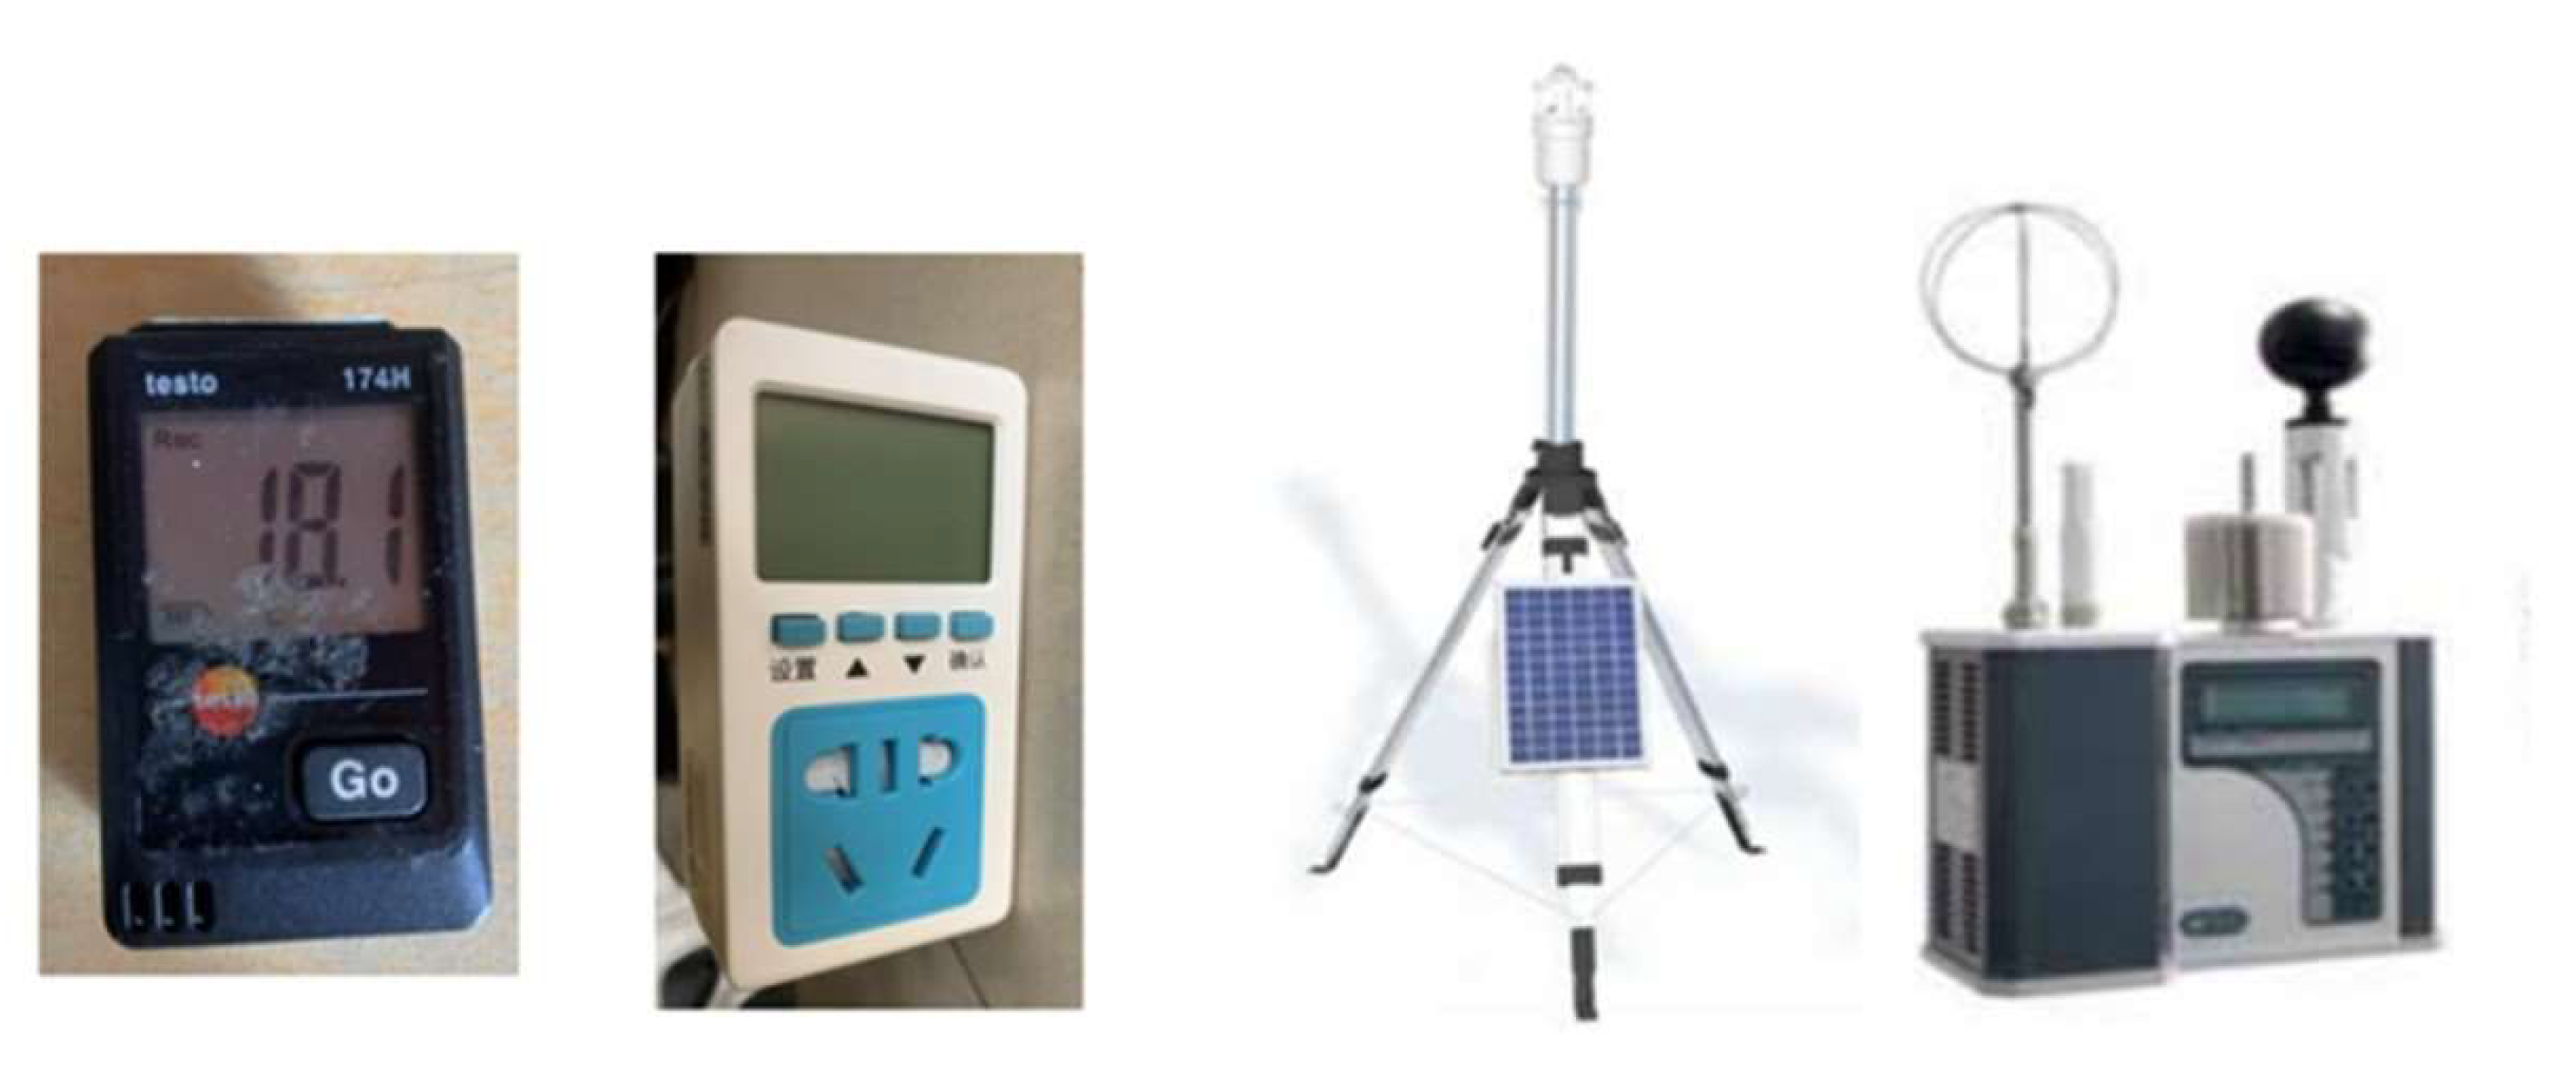
In 2021, the authors conducted field data measurements in a house in Zhangluwan Village using a testo thermometer to record the room temperature and humidity, an illuminance meter to record the level of room illumination, a power outlet to record the amount of electricity consumption by the major appliances, a government power website to obtain the monthly electricity consumption data for each home and a tape measure to map the building plans and elevations
The measured rooms include the main activity space and some special spaces. The former one refers to a room that occupant mainly uses, such as the bedroom, living room, guest room and other spaces. The latter ones refer to rooms with relatively special spaces, such as courtyards, attics, sunrooms, etc. The measuring instrument is set at a height of 1.5 m. In order to prevent human interference and not affect the daily life of the occupants, the measuring instrument was fixed to the furniture, and the data were recorded every fifteen minutes.
From left to right, the temperature and humidity meter, power socket, small weather station and indoor air quality detector are shown in
Figure 8.
5.2. Measurement Object
The selected household sample needs to meet the following criteria:
The building materials, structure, building form, year of construction and plan of the house are represented;
The household must have a complete equipment system, including both heating and cooling equipment, and the residents must be willing to adjust the indoor temperature through the use of this equipment and set the air conditioning temperature within a suitable range;
Family members must return to live at home within a fixed cycle and have a regular schedule;
The members of the household must be willing to provide information on the behavioral habits, number, gender, age, etc., of the family members.
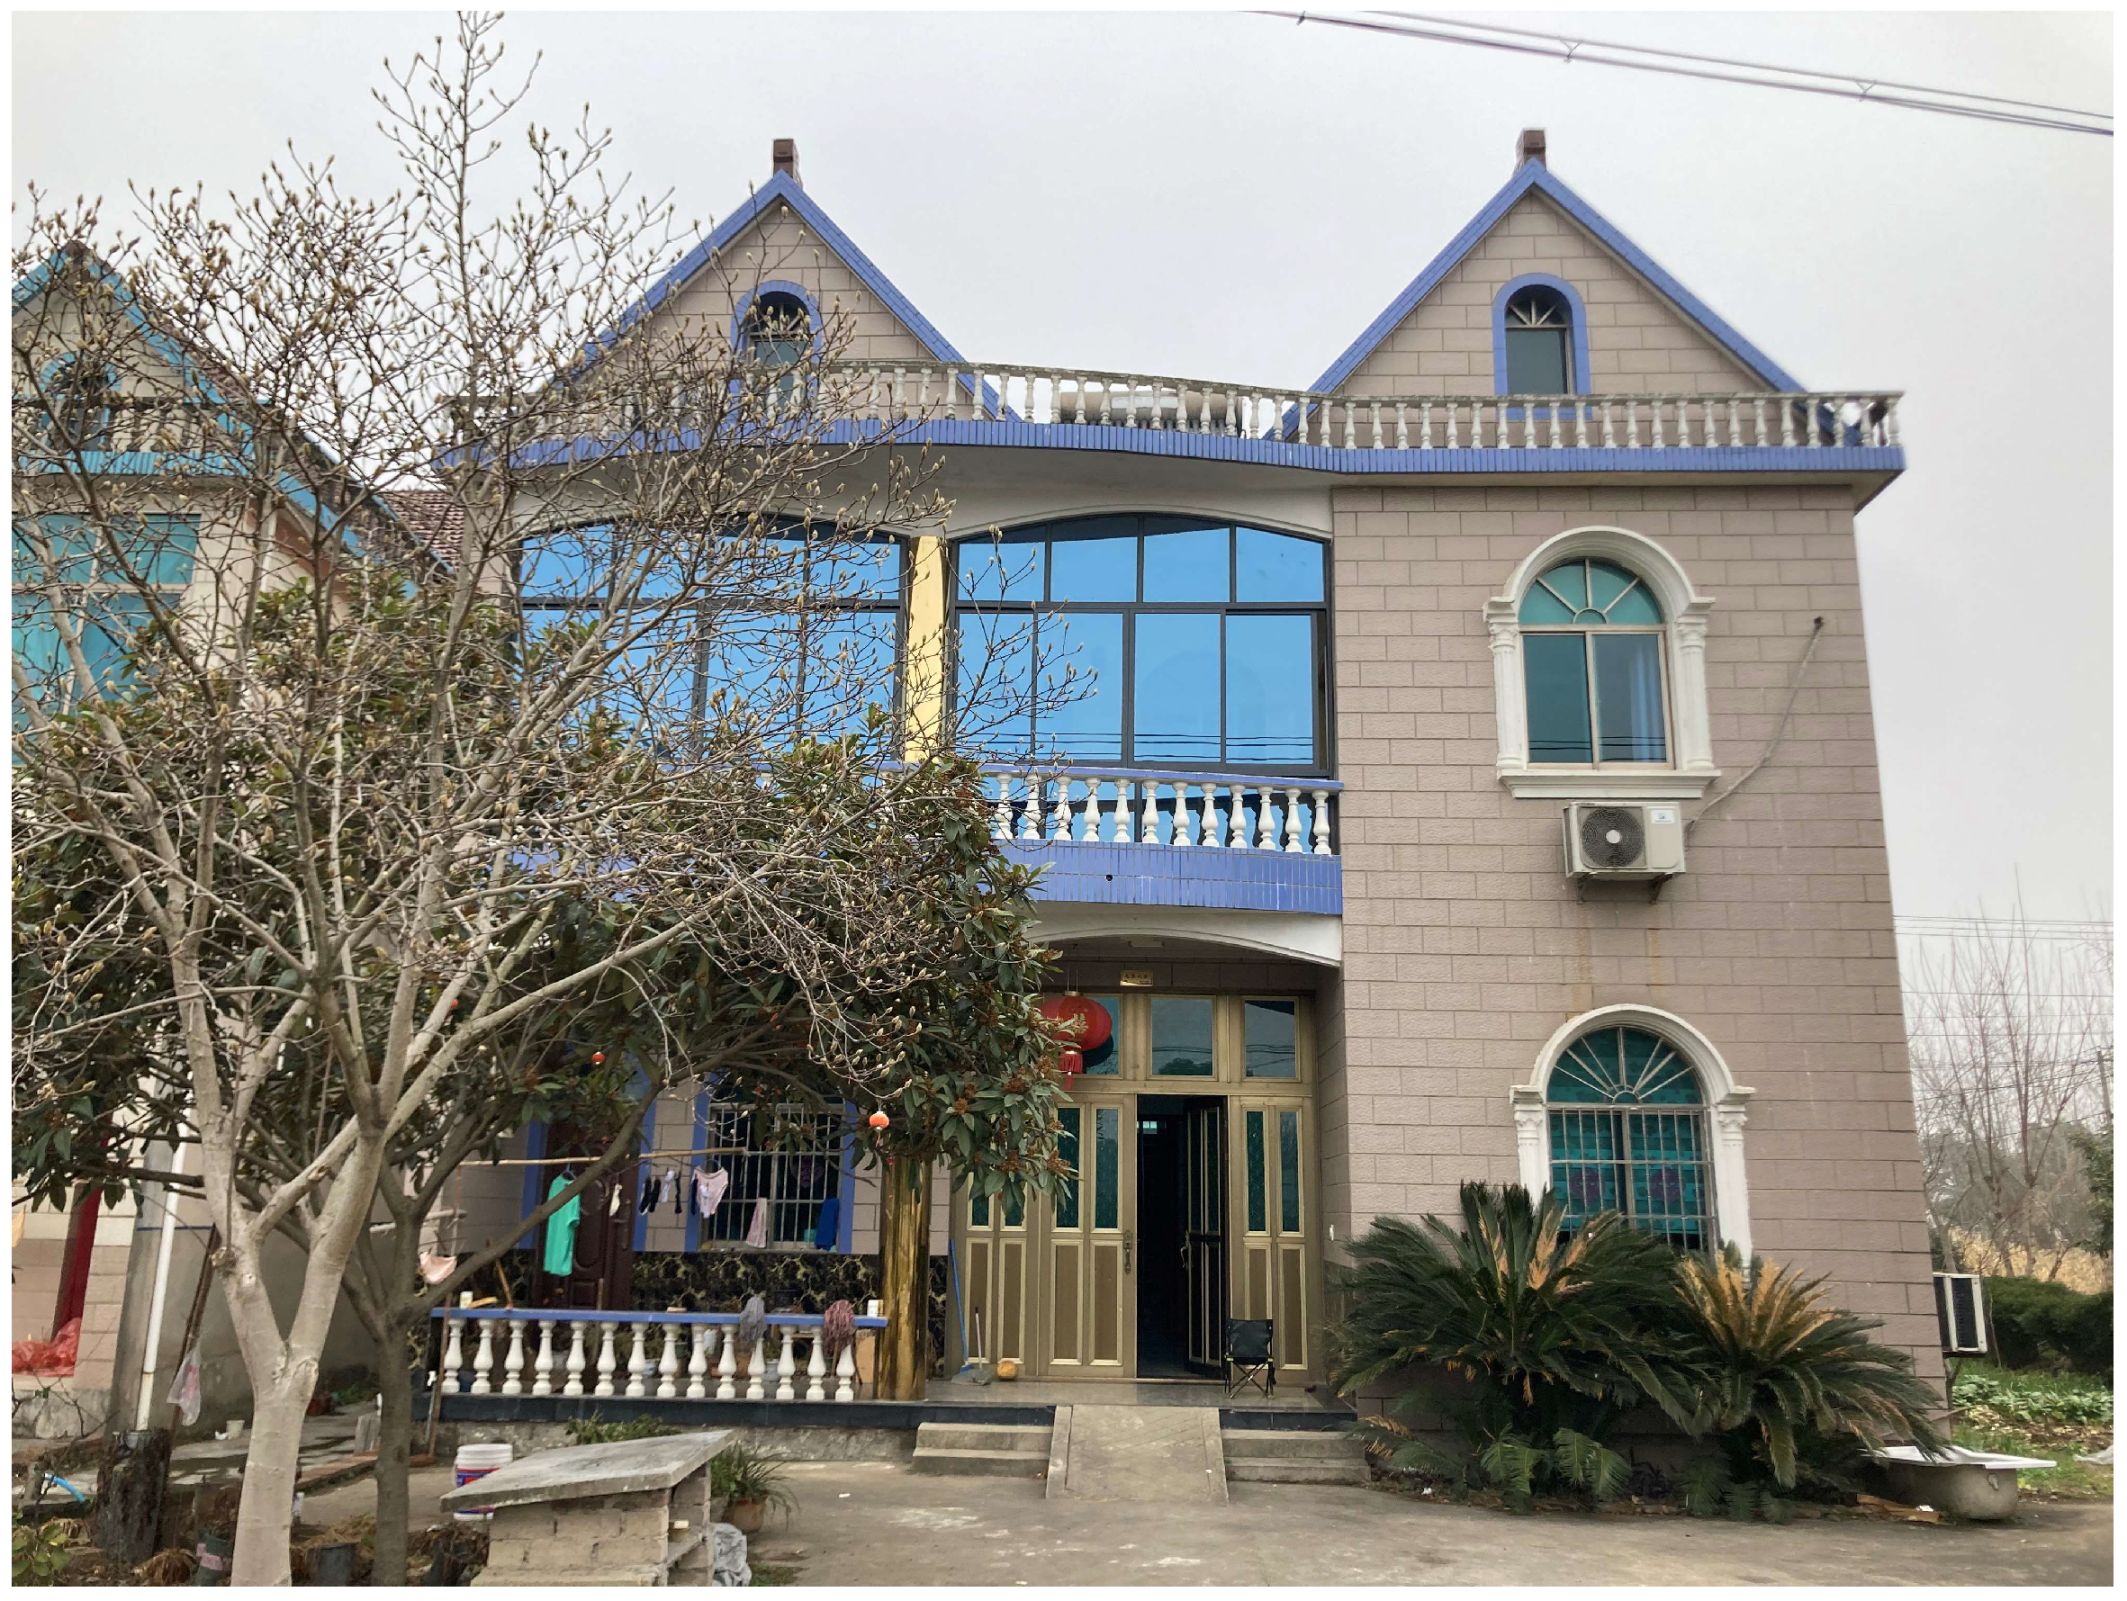
As shown in
Figure 9, the dwelling studied in this study is located in a village in Huzhou City, Zhejiang Province, where this type of dwelling is very common and has a fairly universal character. The dwelling selected for testing is shown in
Figure 5, and the basic information about the dwelling is shown in
Table 4.
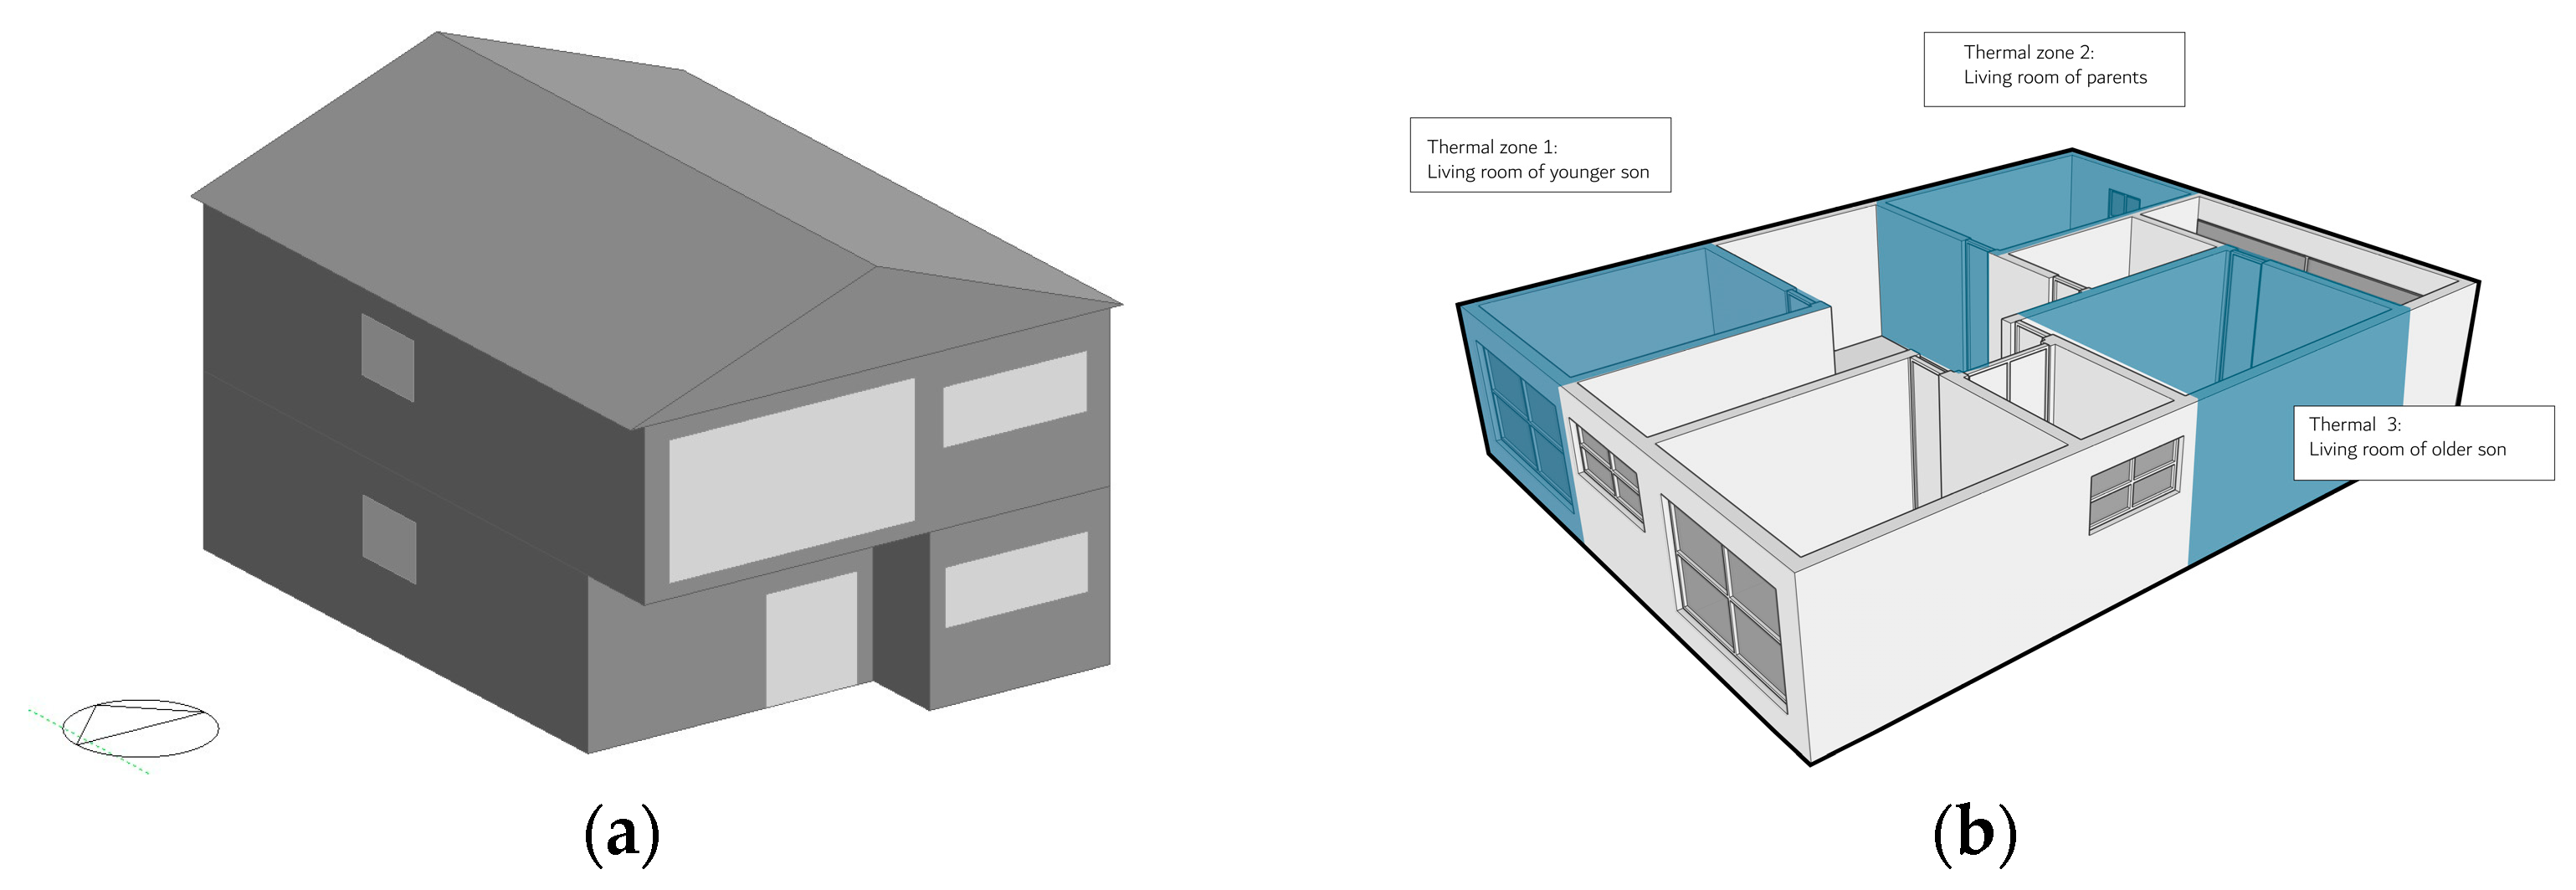
Figure 10 shows the floor plan of the house, which was built in 2000. The main rooms are located on the first and second floors, and the composition of the occupants is a typical three-generation household: the family mainly consists of a grandmother who lives at home, along with two parents who go out to work during the day and return home at night. Their two sons, who go to school in other places, usually do not go home. The house consumes a little hot water, and it has both solar and electric water heaters.
5.3. Model Validation
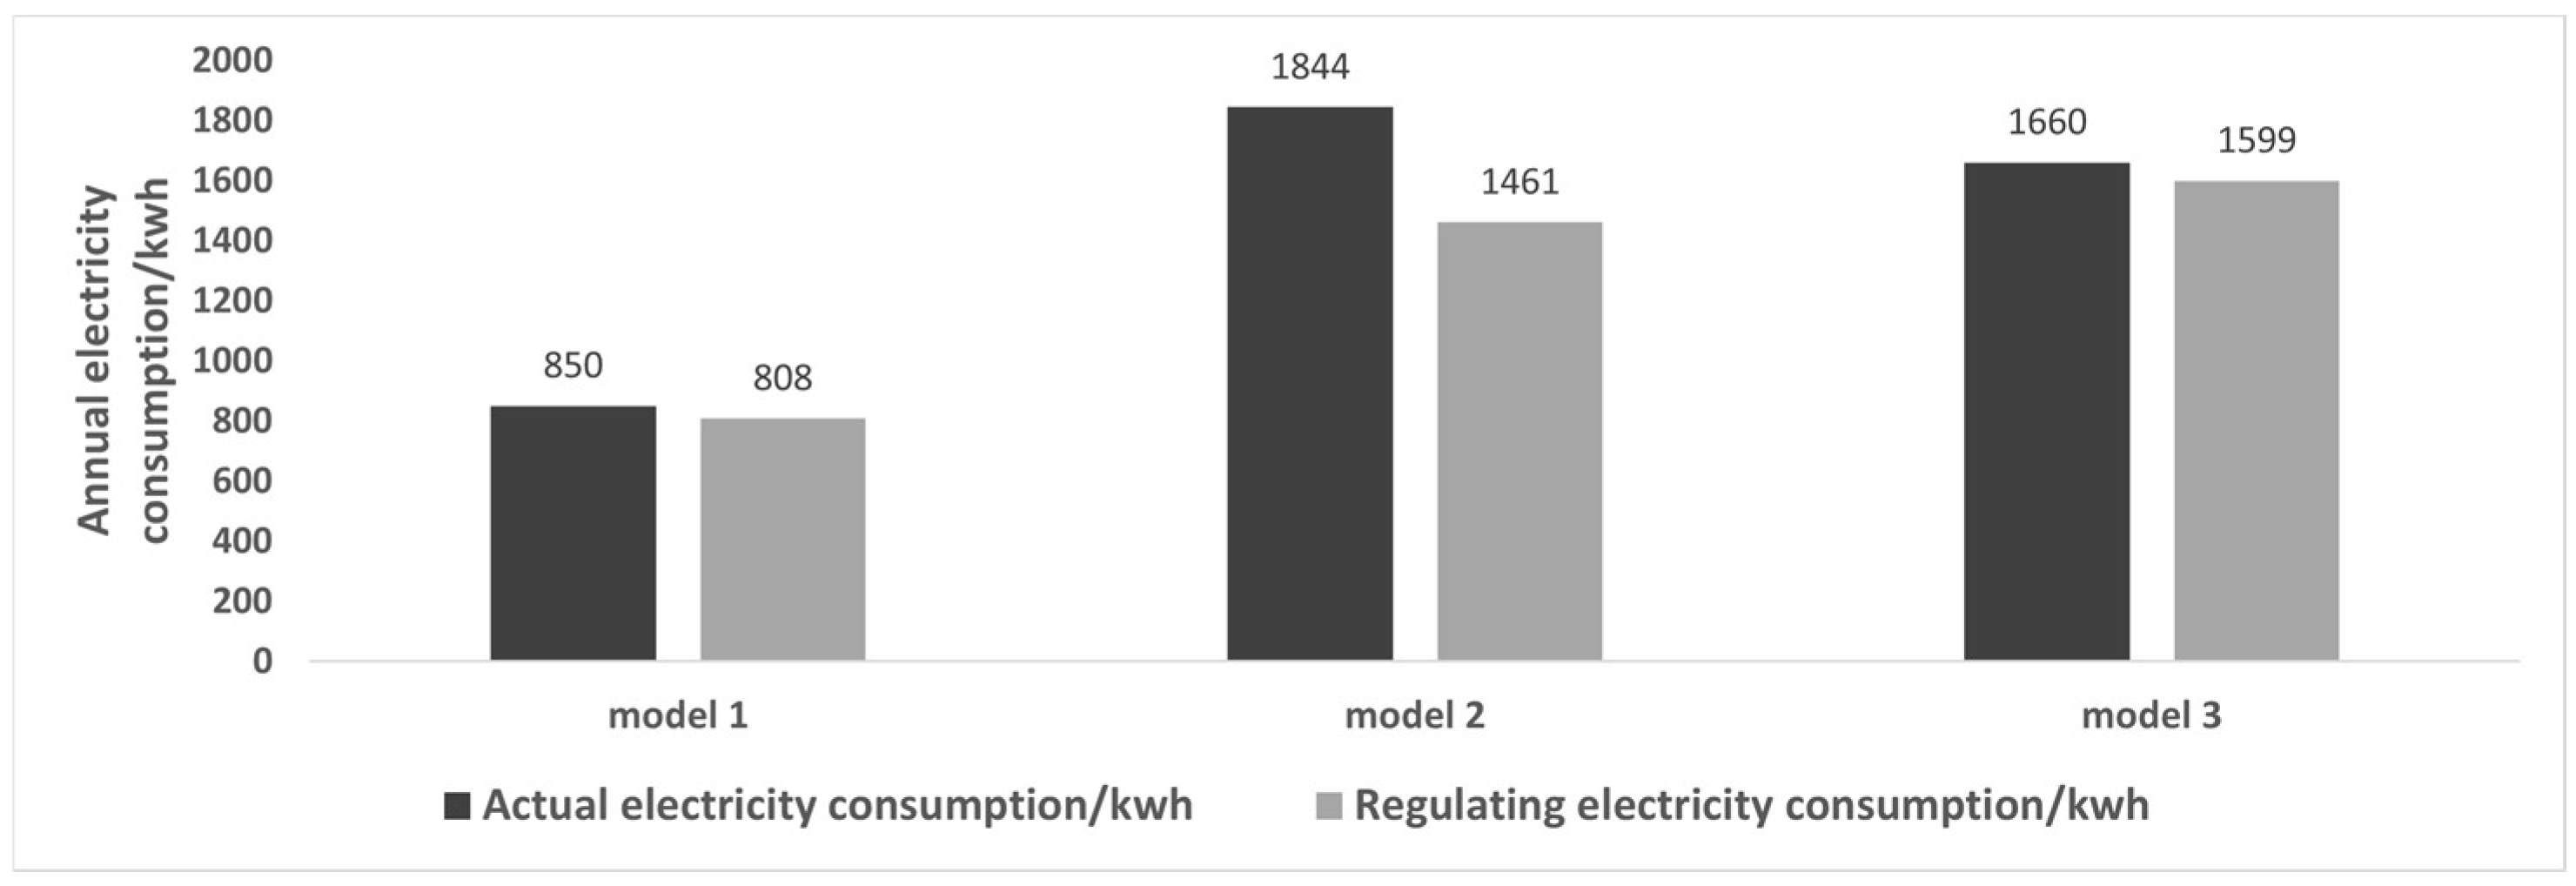
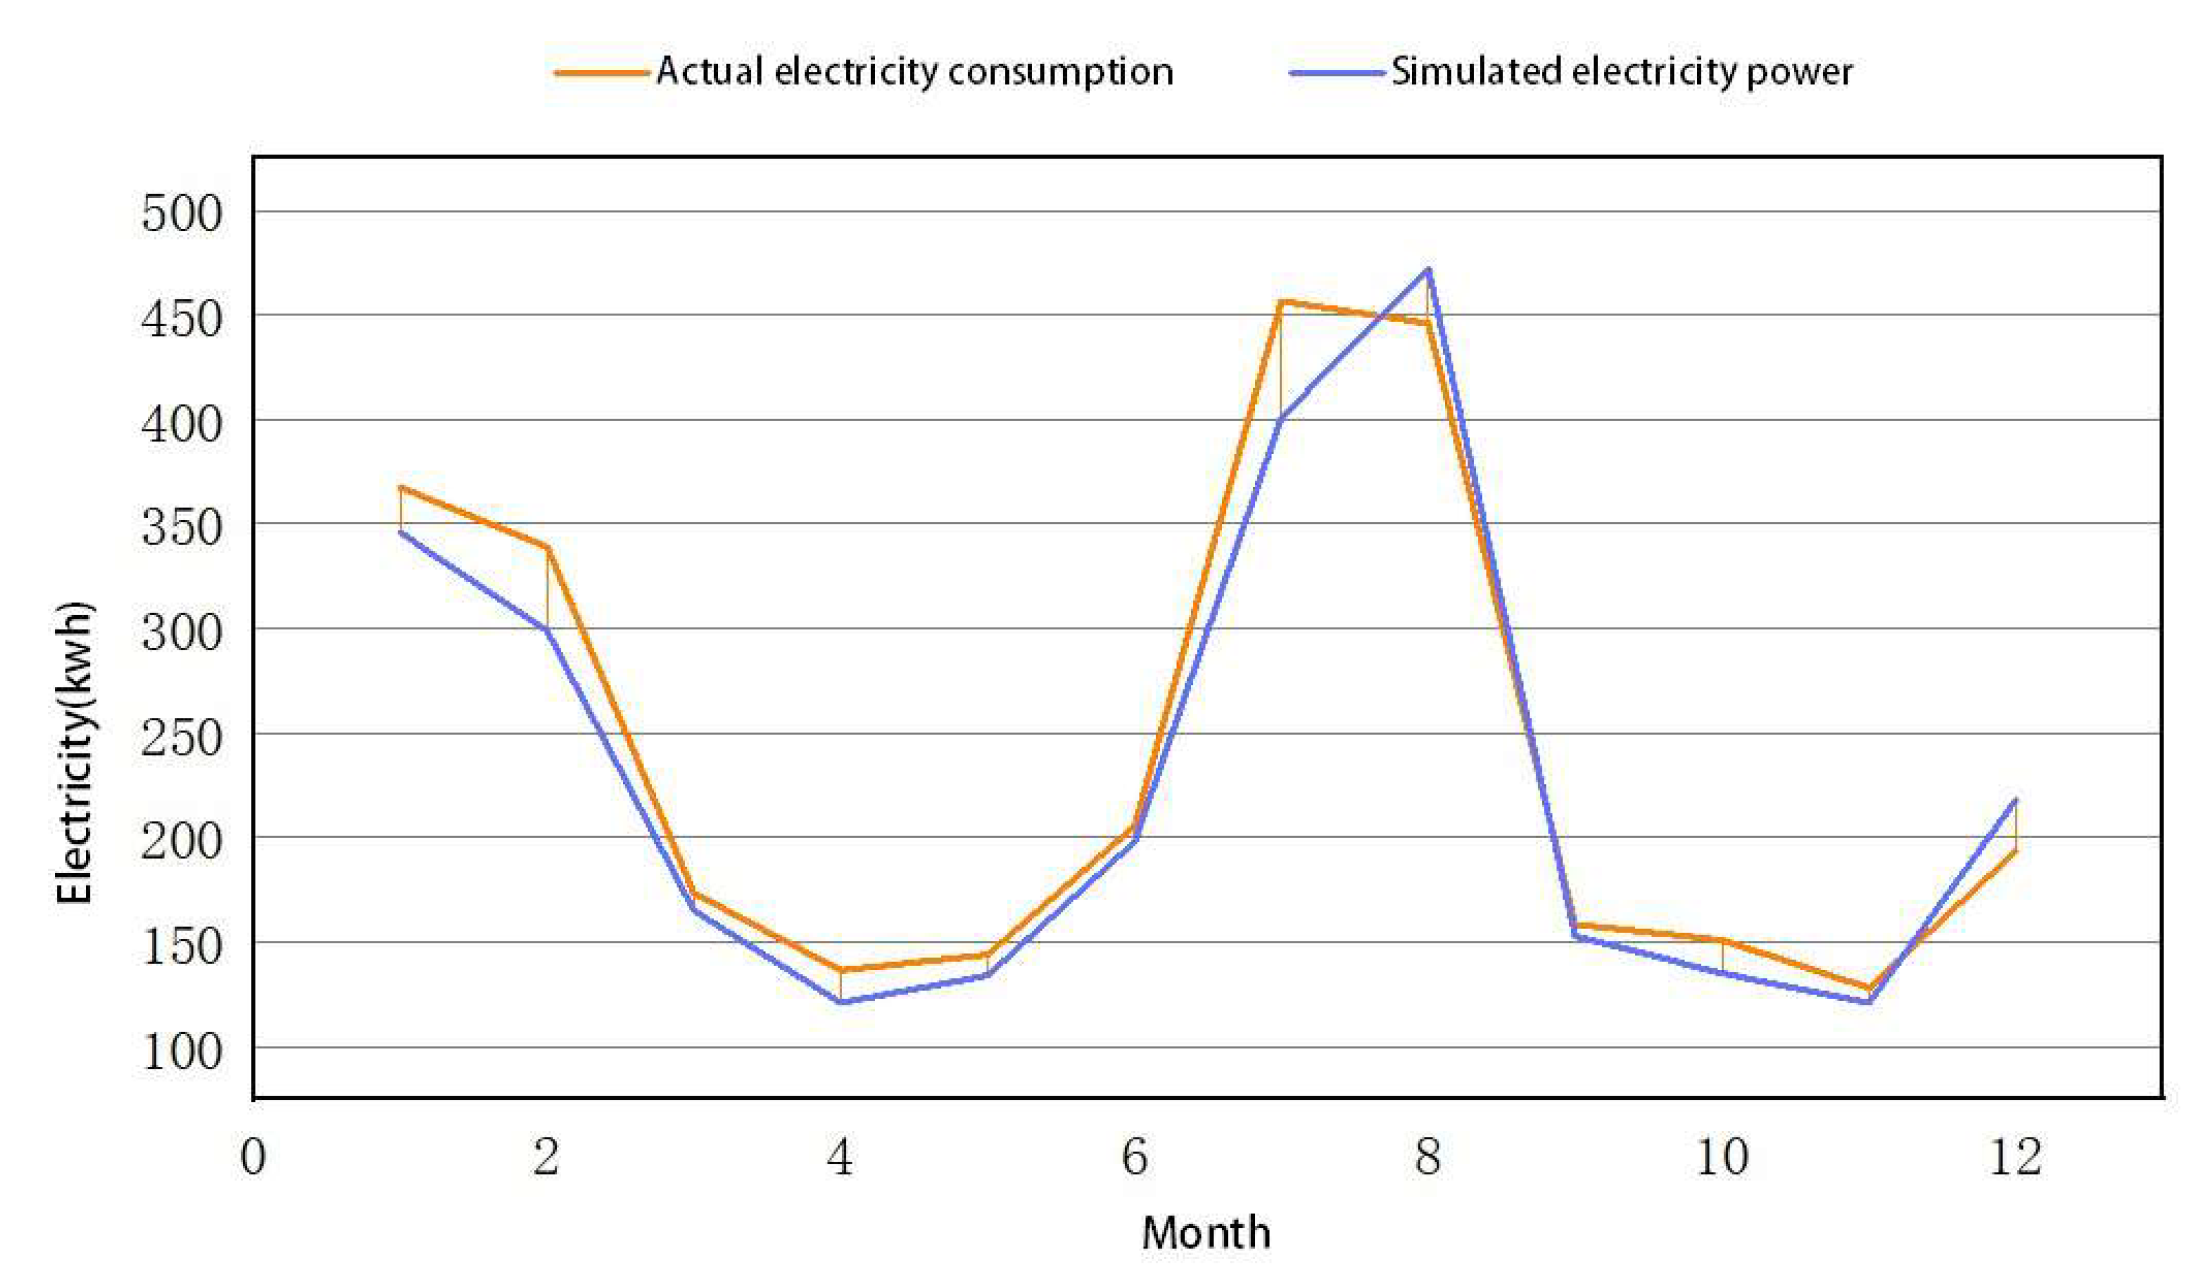
After comparing the actual energy consumption behavior with the annual power consumption according to the specification, as shown in
Figure 11, the difference in power consumption for Model 2 is relatively large, and the difference between the other modes is small.
The annual electricity consumption of buildings in the three models according to their respective codes is 4.9%, 20.8% and 3.7% lower than the actual annual electricity consumption of the buildings in the three models studied, respectively.
Through the field survey of a typical building and based on actual data, the simulation using DesignBuilder software was used to establish the typical activity of the household’s occupants. Based on the users’ energy consumption behavior, the significance of the factors affecting residential energy consumption was further analyzed. The model diagram of the house under investigation in the software and the main energy using rooms on the second floor are shown in
Figure 12.
The model can be verified by comparing the indoor air temperature and electricity consumption from day to day and month to month; in this study, the building simulation and measured electricity consumption were selected for verification.
CVRMSE can be used to calibrate the models that measure the building’s performance; it indicates the instability of the relationships between the variables observed during the baseline period. This yields the coefficient of variation of the input value relative to the output value. As shown in
Table 5, The actual and simulated power gap for each month is within an acceptable range.
As shown in
Figure 13, by comparing the measured indoor temperature changes with the software simulation data of 2021, we found that the monthly electricity consumption data of typical residential buildings are consistent with the measured data in terms of trends, and another indicator was introduced: the coefficient of variation of the root mean square error (CVRMSE), which is always positive and can maximize the impact of important deviations. The CVRMSE calculation process is shown in Equation (1):
where
M represents the measured energy consumption data,
S represents the simulated energy consumption data and
n is the number of data (month-by-month data,
n = 12).
We calculated that the root mean square error coefficients of the residential buildings meet the requirements of 15% hourly error set out by the FEMP (Federal Energy Management Program) [
44], so the data obtained via the simulation have high confidence.
6. Results
6.1. Energy Consumption
The high sensitivity factors of energy consumption in urban dwellings are not exactly the same as those in rural house; in [
45], the shading coefficient and window to wall ratio were the most vital factors in summer, and the wall heat transfer coefficient and shape coefficient were the most vital factors in winter, while the high sensitivity coefficients of rural dwellings had to be varied according to the specific climatic conditions and the differences between the buildings and the occupants due to various differences in construction methods, people’s energy use behavior and household patterns.
When we were optimizing both low energy consumption (small size) and visual comfort (large size), there is a clear contradiction in the window size [
45], as well as a clear linear relationship between the performance of the building’s maintenance structure and its cost, with price being one of the very sensitive factors in rural areas. The marginal effect of the thermal performance of some building structures as they continue to improve [
38,
46] is one of the constraints on the optimization of energy consumption.
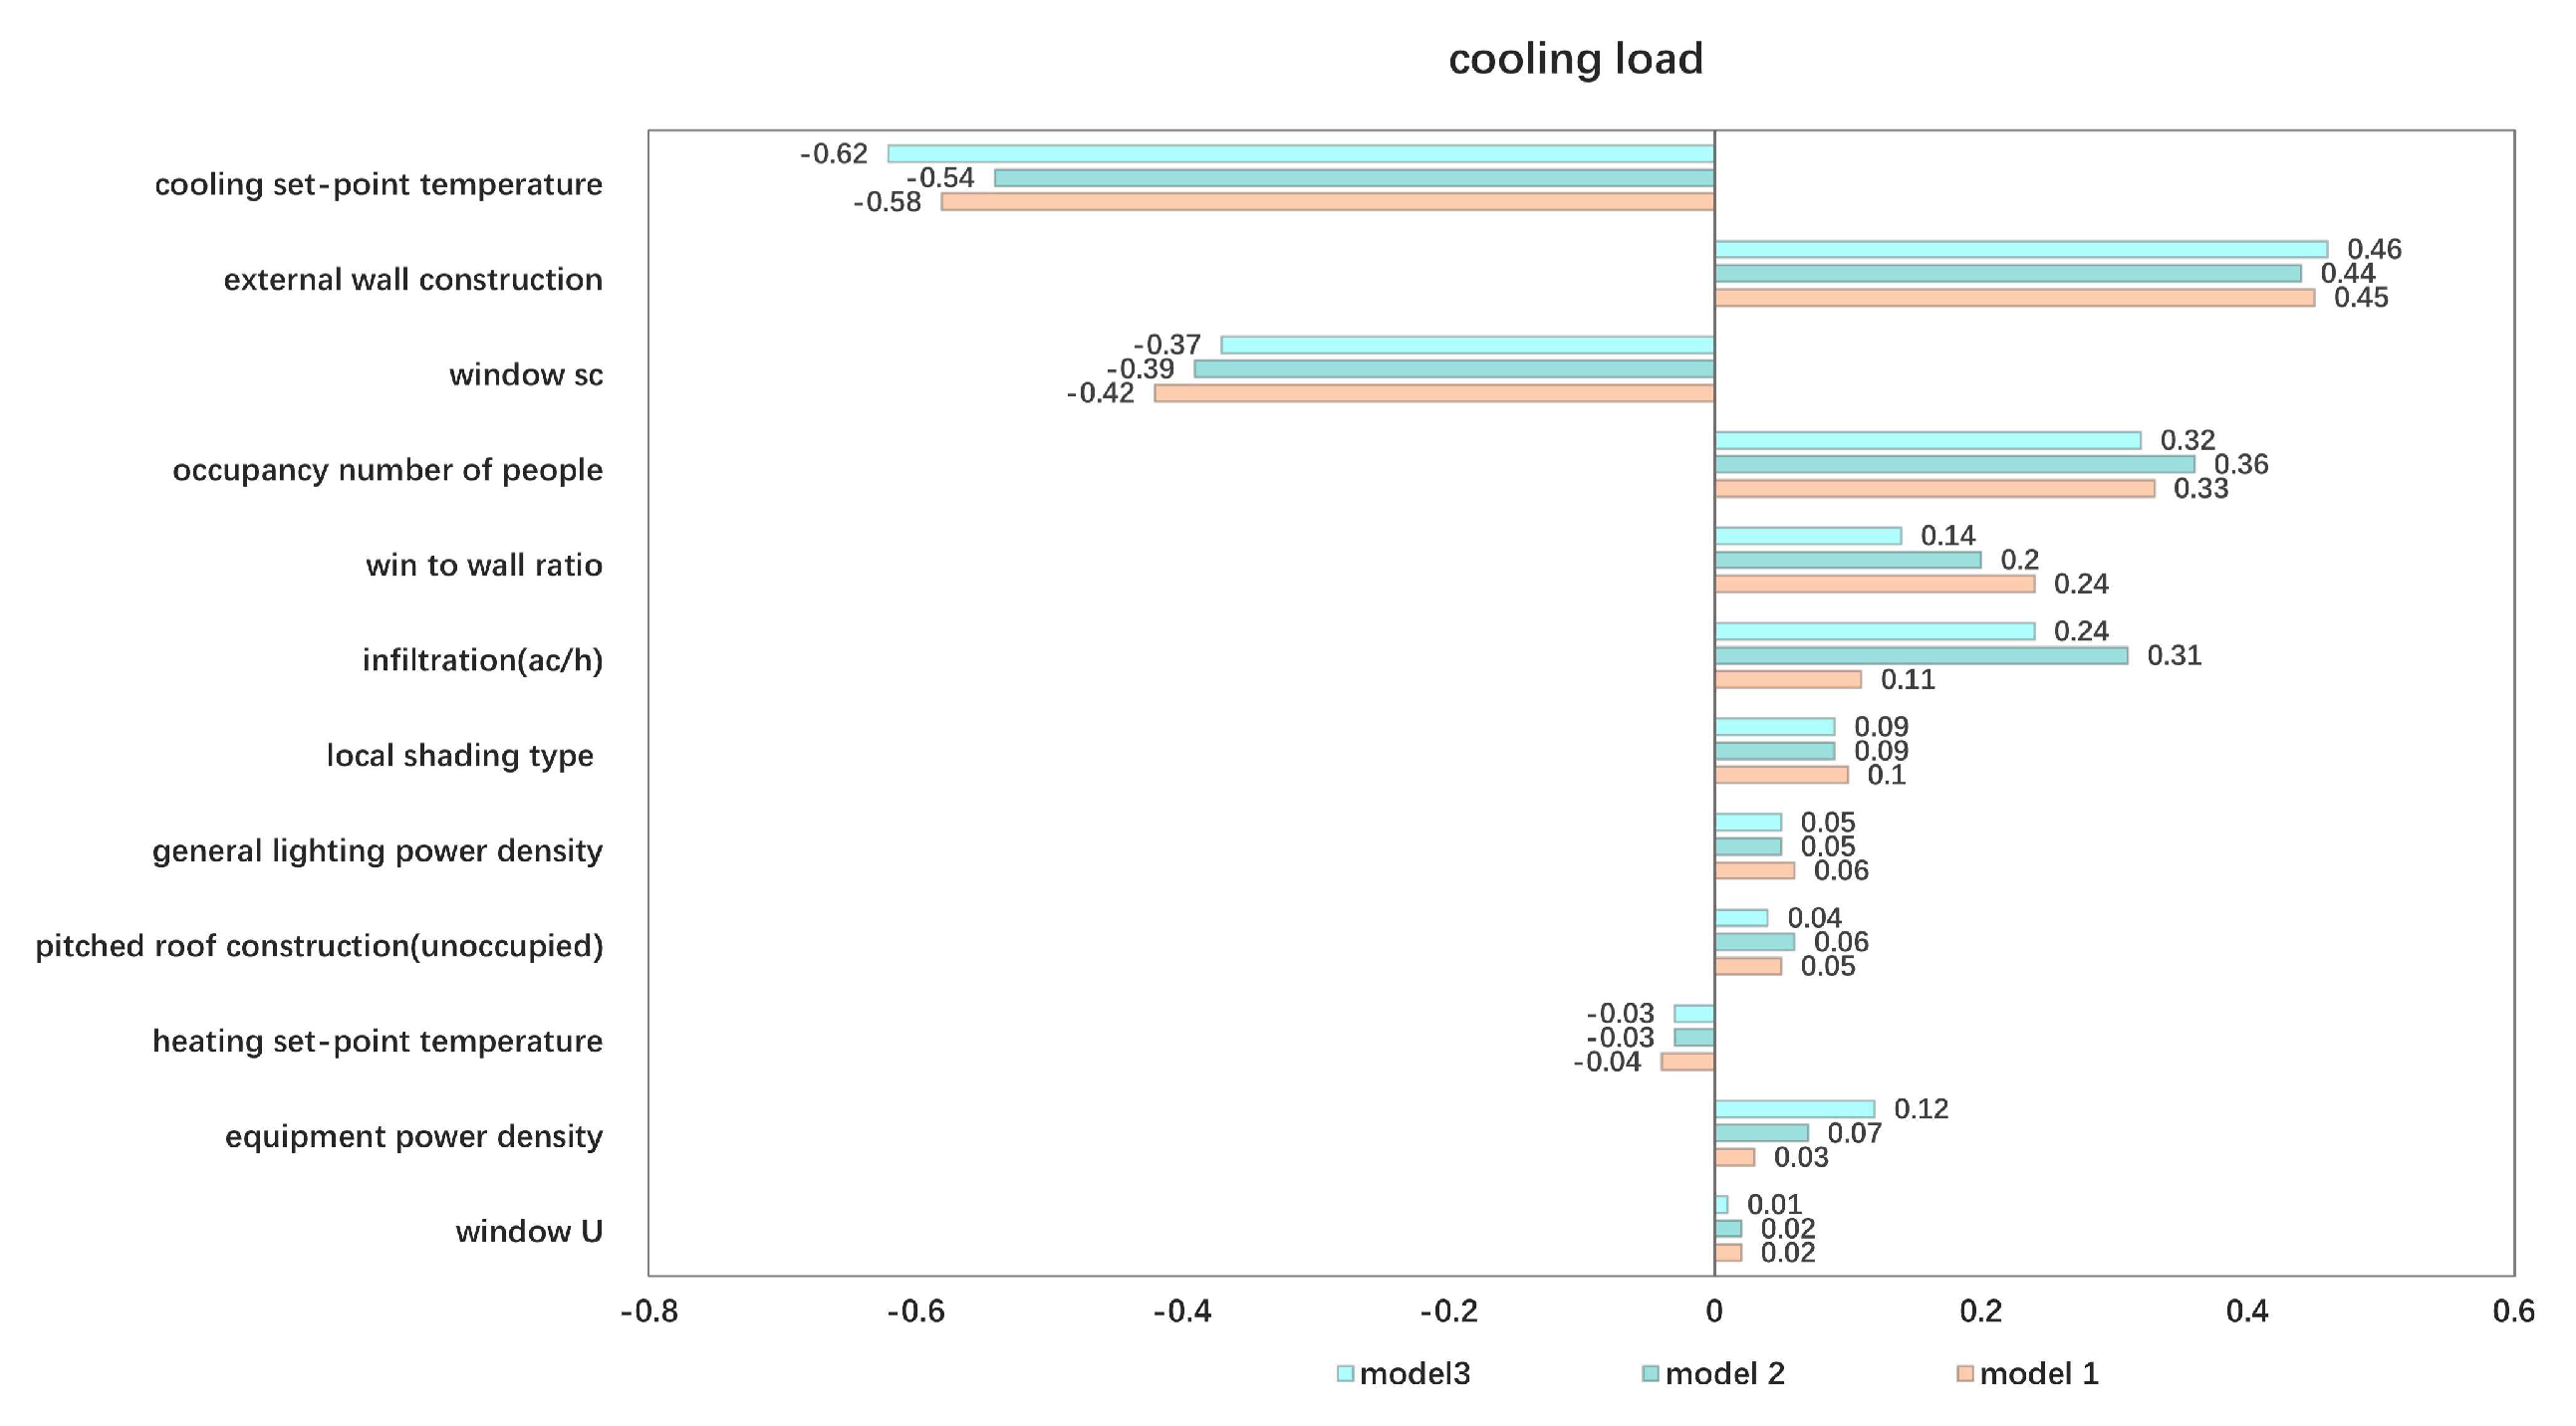
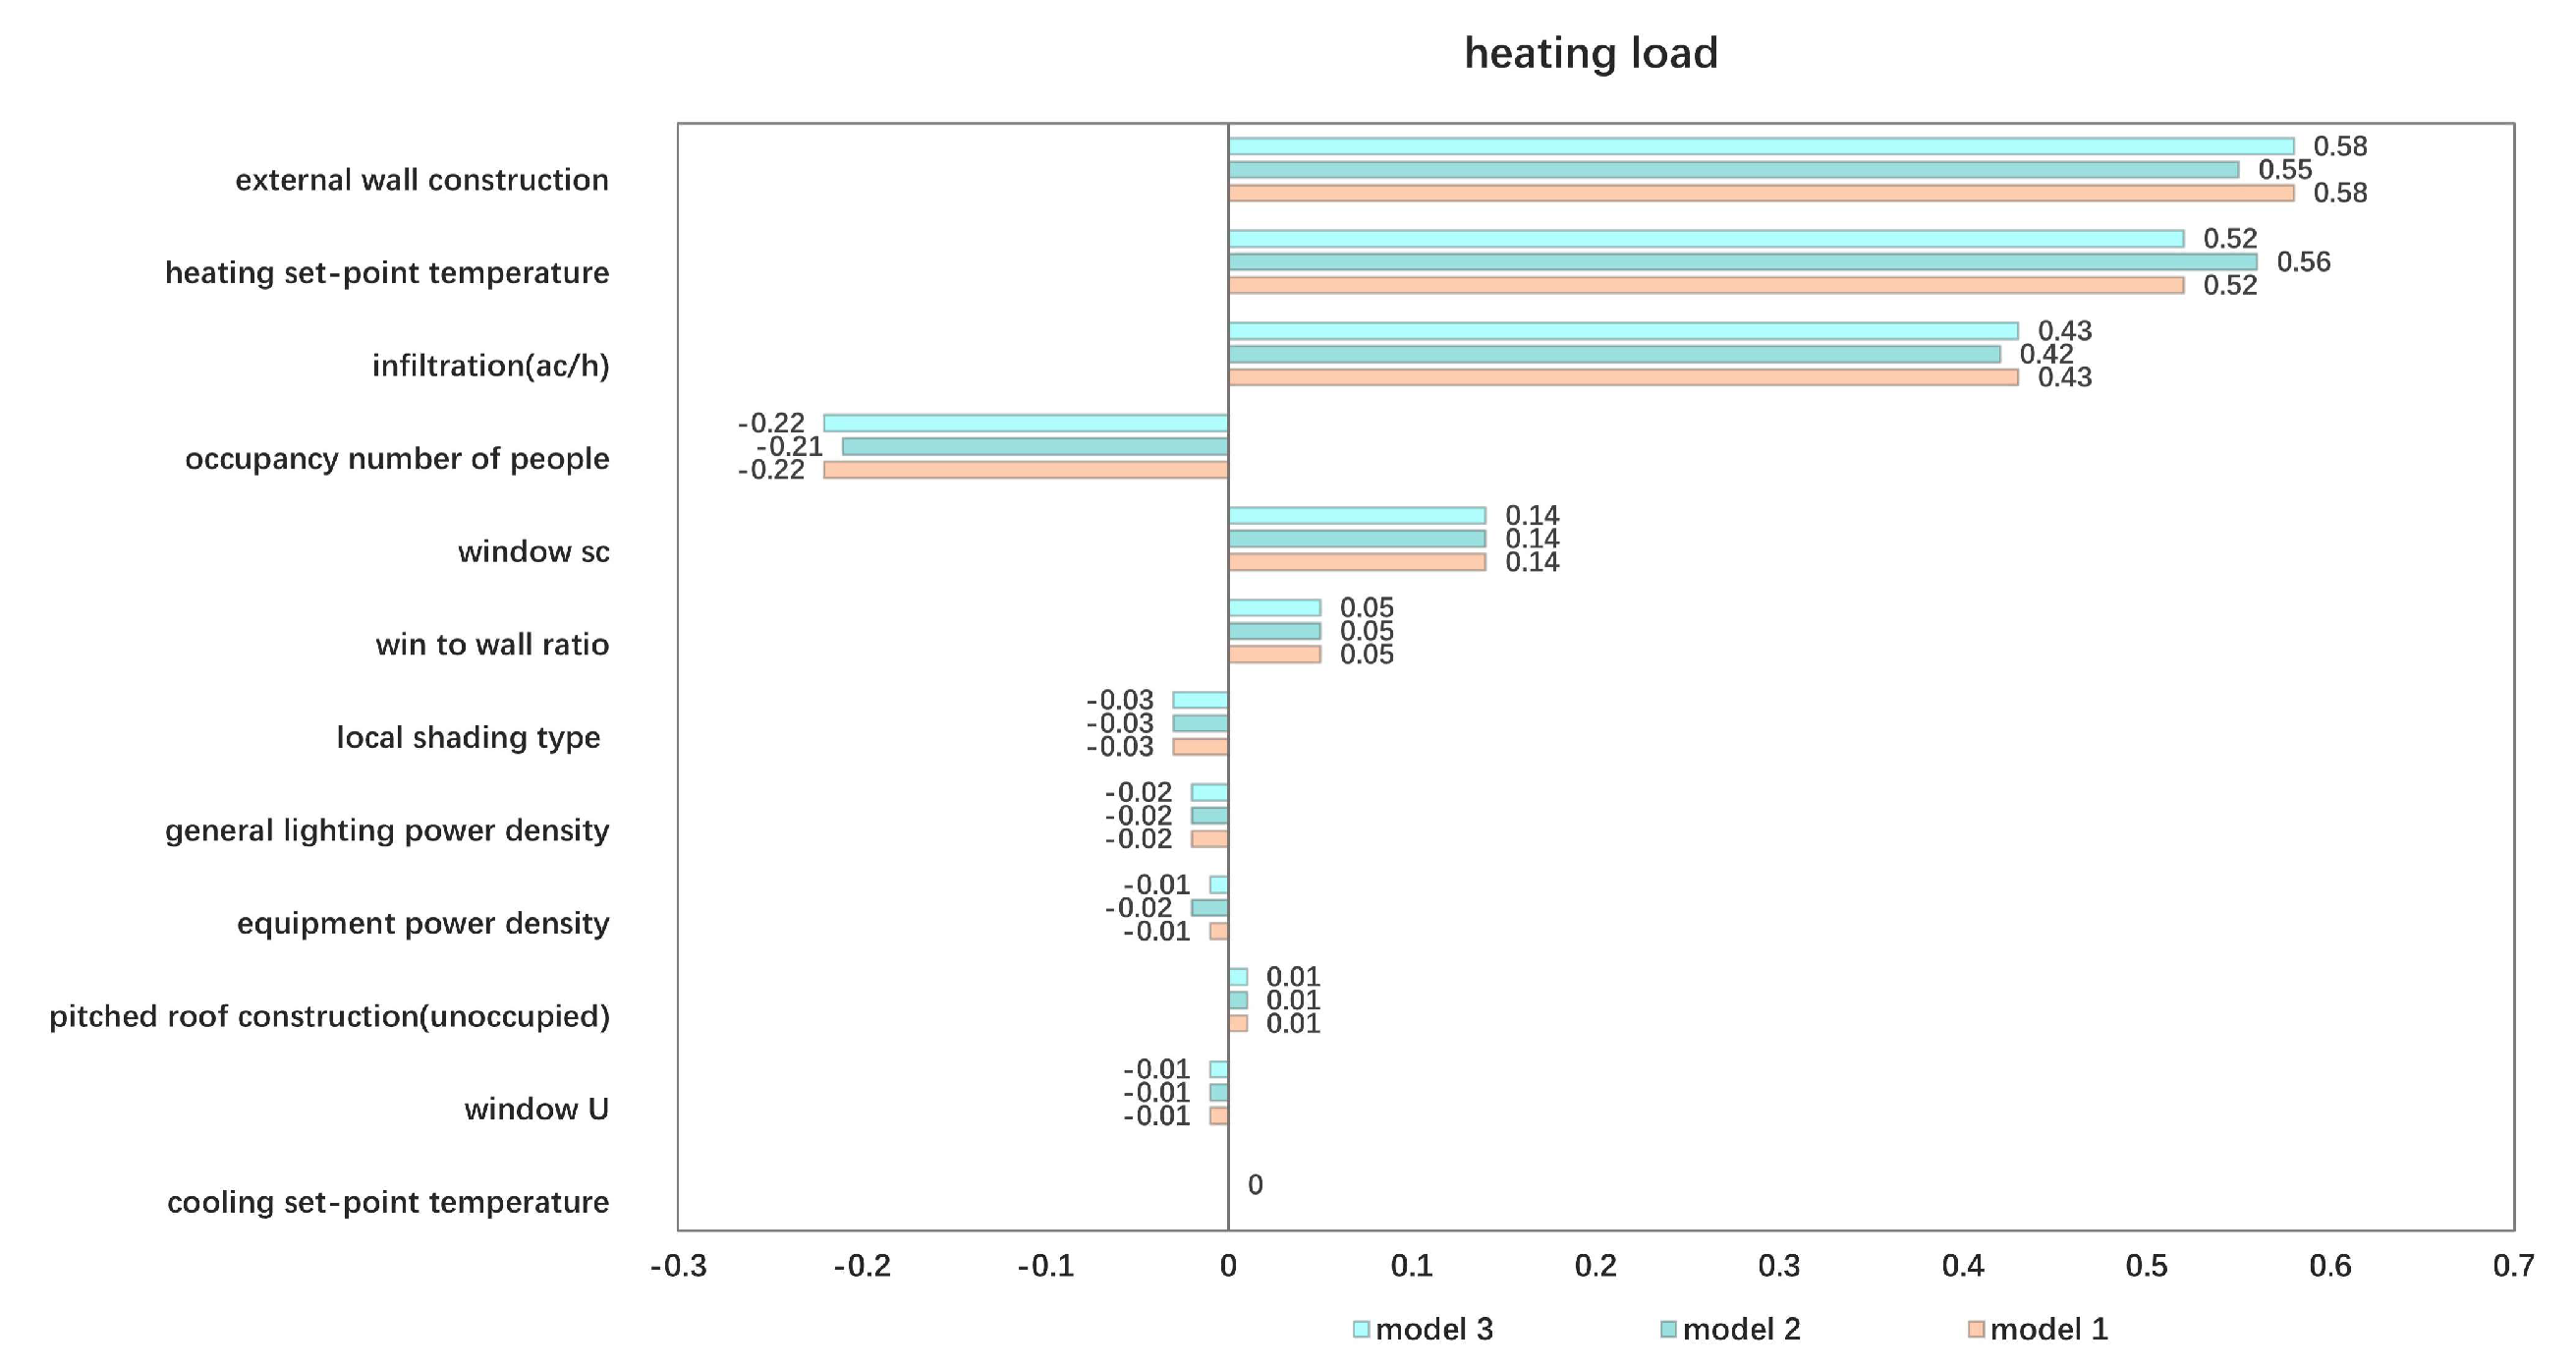
SRCs can be used to provide quantitative measurements of parameter sensitivity. The ranking of the parameters is determined by their influence on the heating and cooling loads. In this study, the SRCs were chosen to calculate the sensitivity of each influencing parameter: when the value of an SRC is greater than 0, it means that the trend of the corresponding output value tends to change in the same direction as the change in the input value, and when the value of SRC is less than 0, it means that the change in the input and output values tend to go in opposite directions. The SRC values of each influencing factor of building cooling, heating and total electricity consumption in the three modes are ranked as shown in
Figure 14,
Figure 15 and
Figure 16.
The results of the sensitivity analysis of different household patterns are shown in
Figure 14, including the most important parameters influencing the annual cooling energy load. In the corresponding real-world situation, the plot can help us to understand which impact parameters have the highest priority, and the numerical size of the SRC shows the effect of increasing or decreasing the values of these parameters.
In this study, if the influencing parameters with SRCs that are greater than 0.1 are defined as parameters with a large impact on residential energy consumption, then the parameters with the greatest impact on the cooling load were the cooling setpoint temperature, the heat transfer coefficient of the exterior wall, the heat transfer coefficient of the exterior windows, the solar heat gain coefficient, the number of occupants, the area ratio of windows to walls and infiltration. The most influential parameters were the same in all three family modes, and the importance order of the parameters was essentially the same, with only a slight numerical difference. In addition, improving the cooling setpoint temperature is very important for reducing the cooling energy consumption, along with reducing the heat transfer coefficient of the exterior wall and increasing the window shading coefficient during the design or renovation process. The sensitivity analysis results of cooling energy consumption can be used as a guide, but the results cannot provide an energy saving reference for residential buildings located in different climates or with large physical differences.
The parameters with the greatest influence on the heating load were the heat transfer coefficient of the exterior wall, the heating setpoint temperature, infiltration, the number of occupants and the solar heat gain coefficient, which is similar to the cooling load in all three modes. The order of importance of the parameters was also essentially the same. In addition, reducing the heat transfer coefficient of the exterior wall and reducing the heating setpoint temperature had obvious effects on reducing the heating load of the residential buildings.
The sensitivity analysis in each mode yielded R
2 values between 0.89 and 0.99 for heating regression, between 0.89 and 0.93 for cooling regression and between 0.78 and 0.83 for the total charge. Overall, the stepwise regression model showed a good fit with heating. In Model 1, because only the first-generation residents spent a long time at home, and according to the results of surveys and questionnaires, they used less heating and cooling equipment, but the length and time period of use of lighting equipment were more regular, the general lighting power density showed high sensitivity to the total electricity usage. In addition, reducing the heat transfer coefficient of the exterior wall and the equipment power density had a significantly reduced the electricity consumption of residential buildings. In Model 2, due to the high frequency of use of electrical equipment by the third generation, the equipment power density showed high sensitivity to the total amount of electricity. In Model 3, the first and second generations lived together, but there were large differences in the energy use behavior of the people of different generations, and the general lighting power density and equipment power density showed higher sensitivity in the results. The SRC values of each influencing factor of discomfortable in the three modes are ranked as shown in
Figure 14,
Figure 15 and
Figure 16.
6.2. Discomfortable
Comfort refers to the comprehensive evaluation of people’s satisfaction with the objective environment from the physiological and psychological aspects. As it is affected by various factors and conditions, comfort will present different results due to individual differences, and it is difficult to quantify, so under different comfort evaluation standards, the conclusion will be quite different.
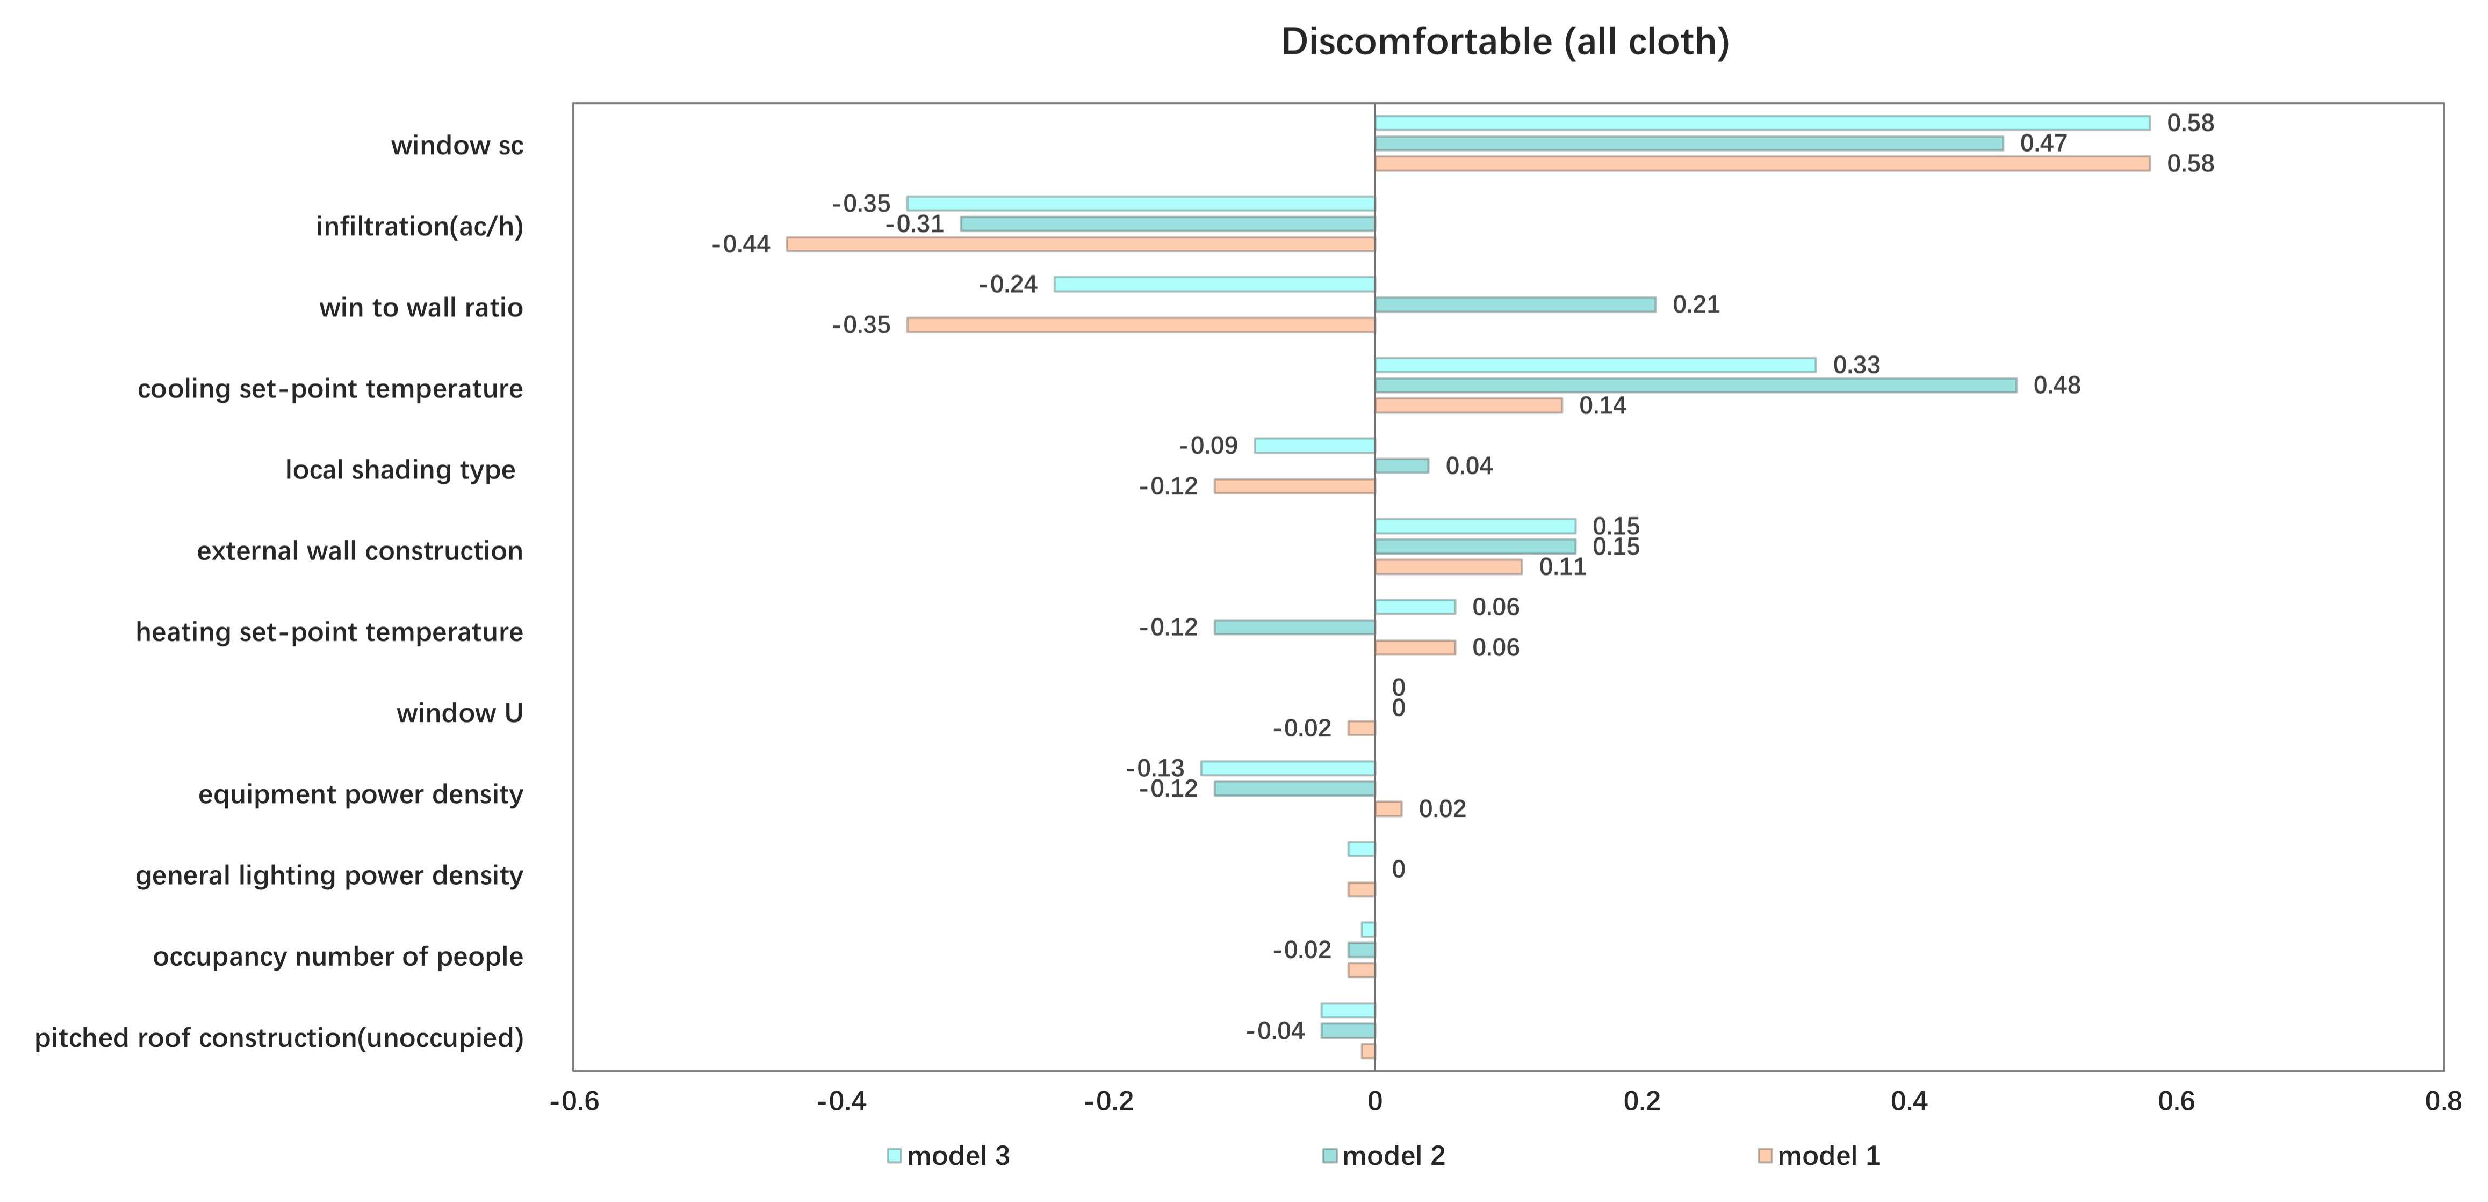
Figure 17 and
Figure 18 show the SRC values of each influencing factor for discomfort under two different evaluation criteria.
As shown in the picture 17, In terms of the comfort of residential housing, the sensitivity of each parameter in each mode is greater than the sensitivity of energy consumption, and under the All-Cloth discomfort standard, each mode’s solar heat gain coefficient shows more sensitivity to discomfort. However, in Model 2, because the third generation uses air conditioners more frequently, and the cooling energy consumption is much higher than the heating energy consumption, the cooling setpoint temperature also shows more sensitivity. In Model 1, the top three most sensitive influencing factors were the solar heat gain coefficient, infiltration the and window-to-wall area ratio. In Model 2, they were the cooling setpoint temperature, the solar heat gain coefficient and infiltration, while in Model 3, they were the solar heat gain coefficient, infiltration and the cooling setpoint temperature. The sensitiv-ity coefficients of each parameter in residential housing differ in their importance in different household patterns due to differences in the energy usage behaviors among intergenerational populations. It is worth noting that in Models 1 and 3, reducing the window-to-wall area ratio can improve comfort, while in Model 2, increasing the window-to-wall area ratio can improve comfort. Similarly, under the influence of local shading type and heating setpoint temperature, within a certain range, Model 2 improves comfort in the opposite way to those of the other two modes. One possible explanation is that in Model 2, the third generation spends more time in the rooms and uses energy more frequently, leading to a larger increase in energy consumption than that of the other two generations, resulting in a significant difference between the high sensitivity factors of energy consumption in this model and those of the other two models.
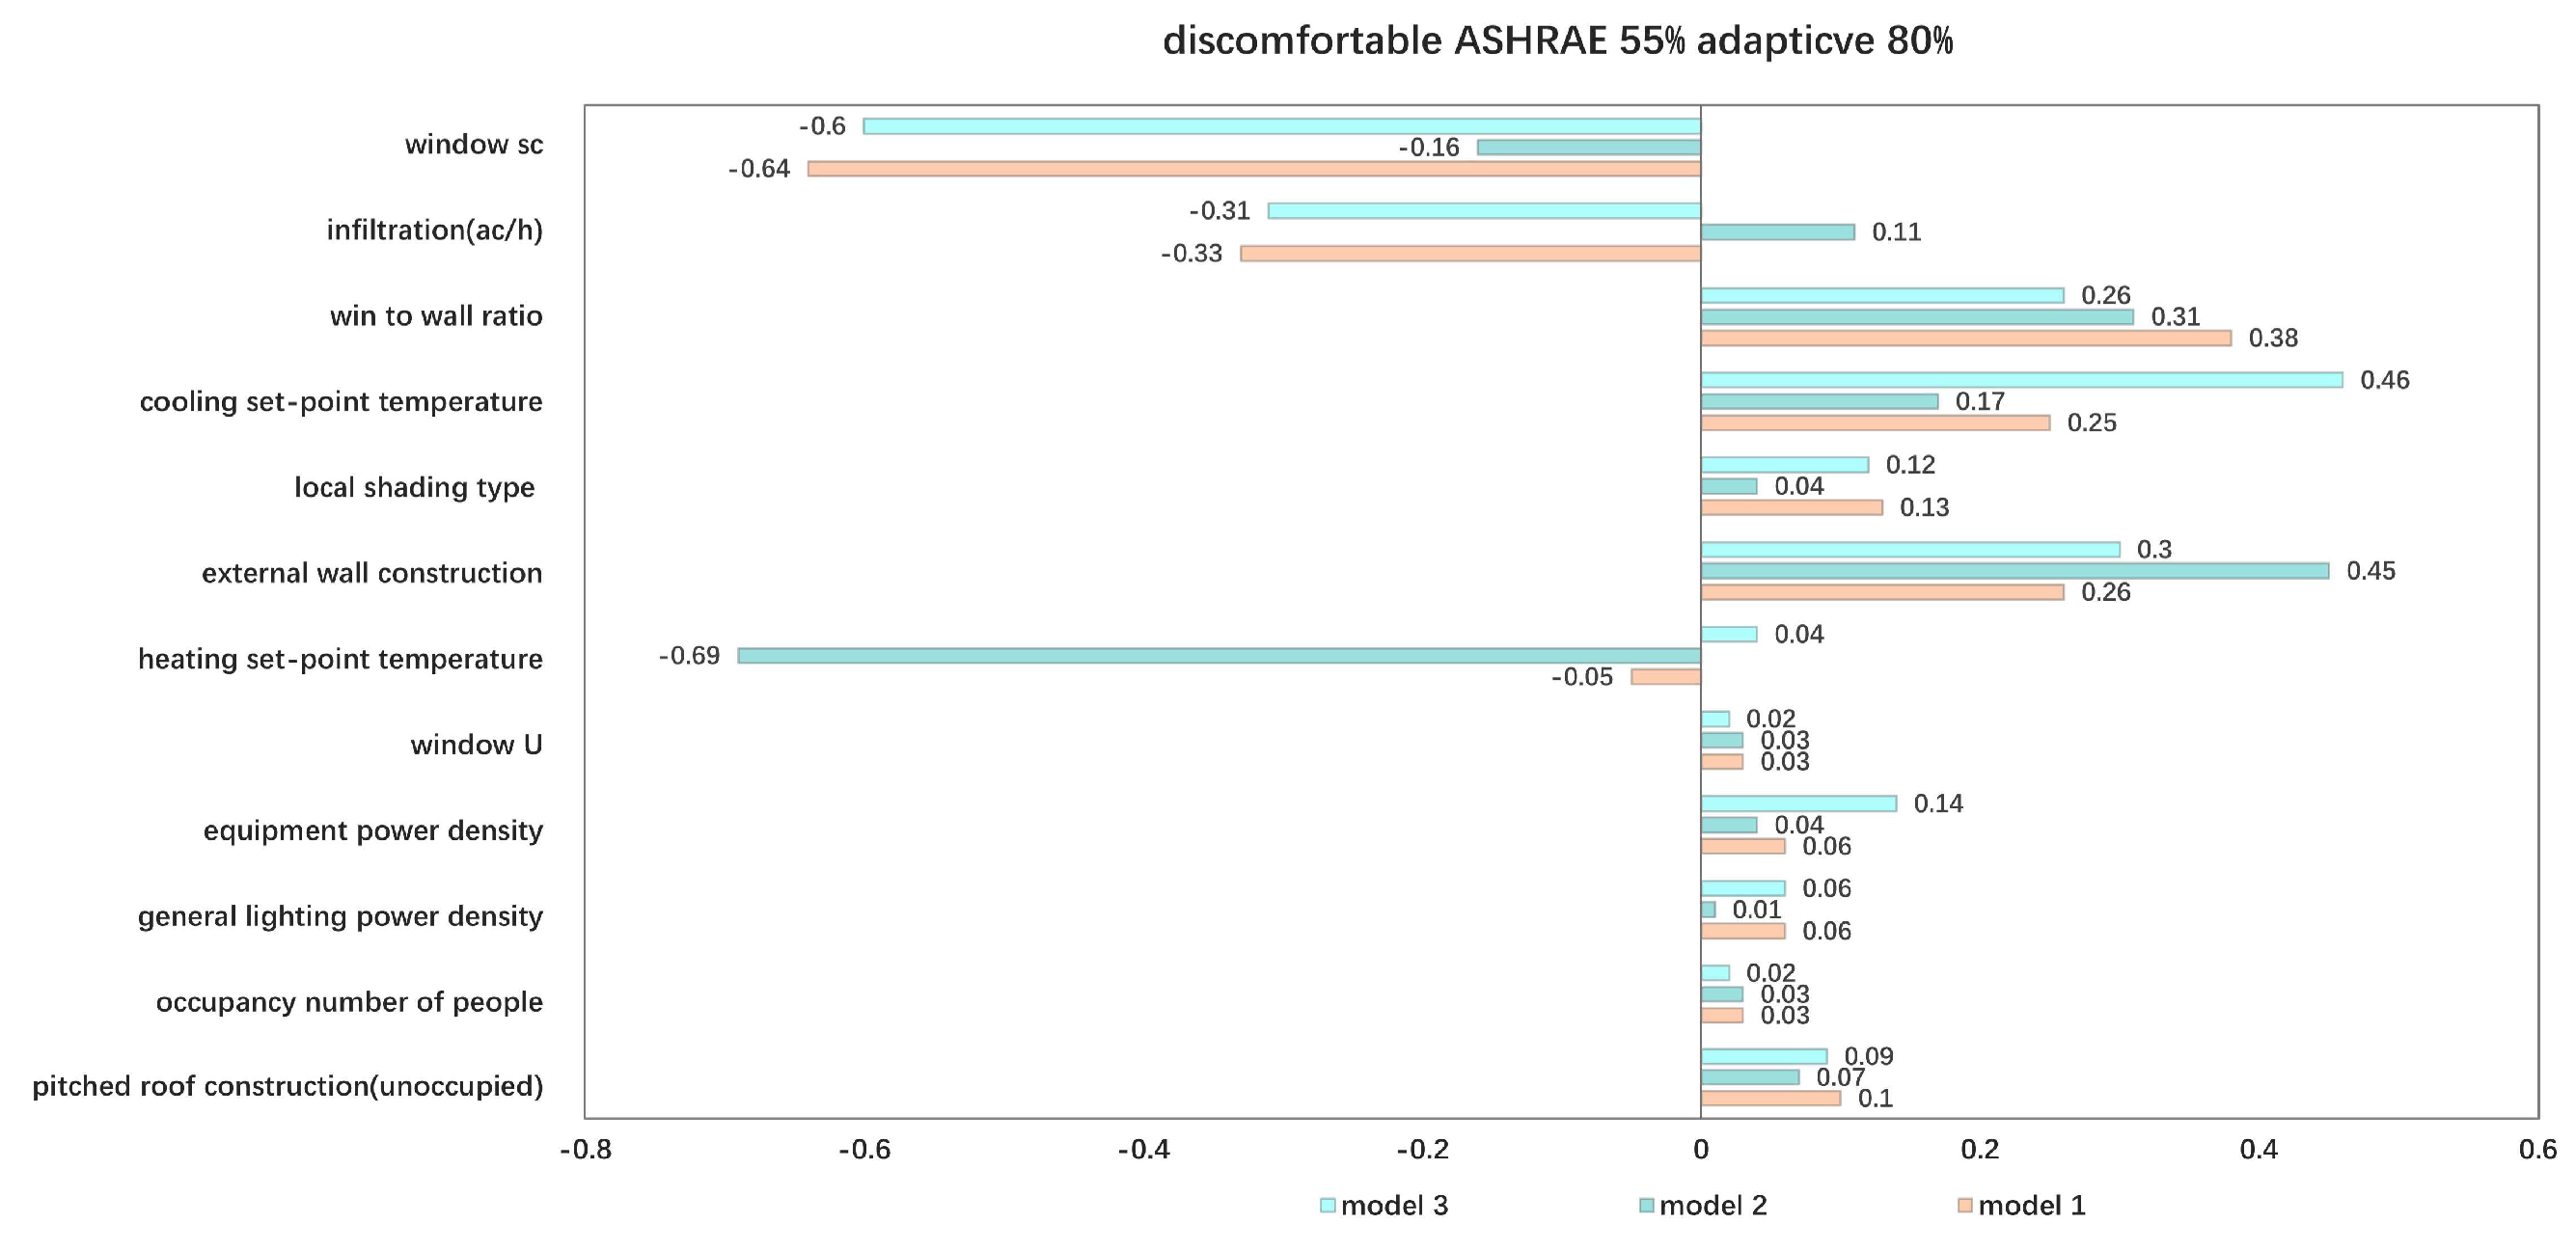
As shown in the picture 18, Under the ASHRAE 55 discomfort standard, the solar heat gain coefficient in Models 1 and 3 showed more sensitivity to comfort. However, in Model 2, the results were different from the All-Cloth discomfort standard. The heating setpoint temperature showed more sensitivity. Under different comfort criteria, the most sensitive parameters exhibited by Model 2 were completely different.
In Model 1, the top three most sensitive factors were the solar heat gain coefficient, the window-to-wall area ratio and infiltration; in model 2, they were the heating setpoint temperature, the heat transfer coefficient of the exterior wall and the window-to-wall area ratio; in Model 3, they were the solar heat gain coefficient, the cooling setpoint temperature and infiltration. The sensitivity coefficients of each parameter of residential housing differ in their importance in different household patterns due to differences in energy use behavior among intergenerational populations. Among them, it is worth noting that in Models 1 and 2, reducing filtration can improve comfort, while in Model 3, increasing filtration can improve comfort. Additionally, under the influence of the heating setpoint temperature, within a certain range, Model 2 improves comfort in the opposite way to those of the other two models.
7. Conclusions
The impact of the users’ energy consumption is often ignored in the study of traditional rural energy consumption in the Zhejiang Province region. Thus, this study explores the factors influencing rural residential energy consumption. Taking rural dwellings in Zhejiang Province as the survey object, our models were established, and based on DesignBuilder energy consumption simulation and sensitivity analysis, the trends of sensitivity coefficients of 12 influencing factors in three different typical intergenerational family modes were explored. From this research, this paper mainly draws the following conclusions:
With the integration of the measured data and the simulation modeling methods, the optimization of building energy consumption and energy saving using multiparameter sensitivity analysis provides better data, and the modeling and measurement of energy consumption are conducive to estimating the optimization of energy consumption in each household type, while the optimization direction is indicated by discomfort reports.
In this study, the correlation between the residential observational data and the simulation data was used to supplement the simulation data with some factors influencing energy use behaviors, such as the cooling and heating setpoint temperatures.
The optimization of energy consumption and comfort based on measured energy consumption between the houses helps them to reduce their energy consumption.
The gap between the month-to-month power data of the simulated data showed a good fit with the measured data. Based on the simulation results, this study compared the effects of different household types on energy saving and comfort, proposing a home energy-saving scheme based on the actual household type.
The simulation results show that the effect of a high cooling setpoint temperature, a smaller heat transfer coefficient of the exterior wall and a large heat transfer coefficient of the exterior windows on reducing the cooling load was obvious in all three modes. Meanwhile, reducing the heat transfer coefficient of the exterior wall, heating setpoint temperature and infiltration had a significant inhibitory effect on the heating load.
After the optimization of the power, Model 1 showed the most sensitivity to general lighting power density, while Models 2 and 3 had the greatest sensitivity to the equipment power density.
At the same time, in terms of the comfort of the house, when the simulation was aimed at All-Cloth discomfort, Models 1 and 3 showed the most sensitivity to the solar heat gain coefficient, while the cooling setpoint temperature had the greatest impact on the total amount of power in Model 2. Under the ASHRAE 55 discomfort standard, the solar heat gain coefficient had a large influence on comfort in Models 1 and 3, but in Model 2, the results were different, with the heating setpoint temperature showing the most sensitivity. Under different comfort criteria, the most sensitive parameters exhibited by Model 2 were completely different.
In terms of the recommendation for optimizing the total amount of power, the total amount of power should be reduced by decreasing the general lighting power density in Model 1 of the residential house and decreasing the equipment power density in Models 2 and 3 to reduce the total amount of power.
This paper highlights the potential to combine simulation models and measured data to suggest energy saving measures, while also divulging residential energy use behaviors and other available information about dwellings. Sensitivity analyses can highlight the most important factors for energy savings that researchers and engineers can calculate based on the actual composition of the household in order to guide solutions in future energy-related impact assessment studies. This paper provides quantitative energy-saving recommendations in the design and retrofit phases, with many important prospects.
The standardized regression coefficients for each parameter obtained for the same building in different environments and for different buildings in the same environment are almost different, so it is not possible to analogously extrapolate the coefficients of the parameters of buildings in other situations. If sufficient data and research are available in the future, it may be possible to subdivide the different types of buildings in different climatic zones and specifically rank the sensitivity coefficients, and these findings can guide the construction and renovation phases of residential buildings in the future to optimize building energy consumption in a targeted manner.
Author Contributions
Conceptualization, M.W.; methodology, M.W.; validation, C.C.; investigation, M.W., C.C., C.S., Y.H., M.Z., H.W., L.H. and D.B.J.; resources, M.W.; data curation, C.C.; writing—original draft preparation, C.C.; writing—review and editing, M.W. and C.C.; visualization, C.C.; supervision, M.W.; project administration, M.W. All authors have read and agreed to the published version of the manuscript.
Funding
This research was funded by Zhejiang Provincial Natural Science Foundation of China under Grant No.LQ19E080022.
Informed Consent Statement
Informed consent was obtained from all subjects involved in the study.
Data Availability Statement
The data presented in this study are available on request from the corresponding author.
Acknowledgments
This research was supported by Zhejiang Provincial Natural Science Foundation of China under Grant No.LQ19E080022. We also glad to give our special thanks to the villagers and interviewees who helped us during the survey.
Conflicts of Interest
The authors declare no conflict of interest.
Appendix A
Zhejiang Rural Housing Questionnaire.
Meter Number (User Number): ________
Name of Head of Household: ________
House Number: Nature Village: ________
A. 1 persons; B. 2 persons; C. 3 persons; D. 4 persons; E. 5 persons; F. 6 persons; H. 7 persons; G. 8 people and above.
- 2.
Family belongs to ________ (residence).
A. 1 generation; B. 2 generation; C. 3 generation; D. 4 generation.
- 3.
Current housing use: ________.
A. Pure residence; B. Overall rental; C. Lower business + upper residence; D. Handicraft processing + residence; E. Agricultural product processing + residence.
- 4.
Old housing use: ________ .
A. Pure residence; B. Overall rental; C. Lower business + upper residence; D. Handicraft processing + residence; E. Agricultural product processing + residence.
- 5.
The old house was built during ________.
A. Qing dynasty and before; B. Republican period; C. from 1950s to1980s; D. 1980~1999; E. 2000~2010; F. 2010-present day.
- 6.
Compared to the old house, the appliances in your home (used): ________ .
A. Increased; B. There is no difference from before; C. Reduced.
- 7.
If it increased, please list these electrical appliances ________.
A. Wall-mounted air conditioner; B. underfloor heating; C. electric heaters; D. Central air conditioning; E. Refrigerator; F. Entertainment equipment such as TVs and speakers; G. washing machine; H. Sweeper, layer suction; I. Electric water heater.
- 8.
If reduced, please tick the reduced appliances ________.
A. Wall-mounted air conditioner; B. underfloor heating; C. electric heaters; D. Central air conditioning; E. Refrigerator; F. Entertainment equipment such as TVs and speakers; G. washing machine; H. Sweeper, layer suction; I. Electric water heater.
A Male; B. Female.
- 2.
Education: ________.
A Did not go to school; B. Primary school; C. Junior High School; D. High school; E. University and above.
- 3.
Age: ________.
A. 20 or less; B. 20~30; C. 30~40; D. 40~50; E. 50~60; F. 60 or above.
- 4.
Occupation: ________ .
Number of outings (per week): A. I basically do not go out; B. I go out occasionally (less than 3 times); C. I go out often (more than 3 times).
- 5.
Life and work status: ________.
A. I am at home all day; B. I go out to work during the day and go home at night, except on the weekends; C. I go out to work during the day, go home at night, and go home on the weekend; D. I usually do not go home or go home on weekends; E. I do not go home on weekdays, but I go home on holidays.
- 6.
Average annual income (last 3 years): ________.
A. 5,000 or less; B. 5~100,000; C. 10~190,000; D. 20~500000; E. 5 00,000 or more.
- 7.
Whether to heat in winter: ________.
A. No; B. Yes.
If answer is “yes”, in which way (multiple selections possible): ________ . Among them, the most used one is: ________.
A. Stove (roasting fire); B. Air conditioning; C. Electric heater; D. Electric blanket.
- 8.
Whether to cool in summer: ________.
A. No; B. Yes.
If answer is “yes”, in which way (multiple selections possible): ________ . Among them, the most used are: ________.
A. Air conditioning; B. Electric fan; C. Fan.
- 9.
Air conditioning use________ (if not used, do not fill in): summer/winter use month/; Exact time:/.
The air conditioning temperature is set at °C in summer and °C in winter.
- 10.
Heating and cooling in the house: ________ Summer/Winter:/.
A. Very hot; B. Heat; C. Slightly warm; D. Comfort; E. Slightly cooler; F. Cold; G. It is cold.
- 11.
Evaluation of thermal comfort in the house: summer/winter:/.
A. Very comfortable; B. Relatively comfortable; C. General; D. Uncomfortable; E. Very uncomfortable.
- 12.
How much time you spend indoors compared to the old house: ________ .
A. Added; B. No difference from before; C. Reduced.
- 13.
If it is increased, it is because ________.
A. More comfortable indoors; B. The outdoor environment has deteriorated; C. The public space for communication is reduced.
- 14.
If it decreases, it is because ________.
A. Uncomfortable indoors; B. The outdoor environment has been improved; C. Increased public space for communication.
- 15.
What else do you think needs to be improved in the new house?
A. Thermal insulation performance, improve indoor comfort in winter; B thermal insulation performance, improve indoor comfort in summer; C. sound insulation performance between upstairs and downstairs and next room; D. increase the size of the garden in front of and behind the house; E. increase the size of the communication space in the community; F. miscellaneous.
References
- Ding, Q.; Cai, W.; Wang, C.; Sanwal, M. The relationships between household consumption activities and energy consumption in china—An input-output analysis from the lifestyle perspective. Appl. Energy 2017, 207, 520–532. [Google Scholar] [CrossRef]
- Naji, S.; Aye, L.; Noguchi, M. Multi-objective optimisations of envelope components for a prefabricated house in six climate zones. Appl. Energy 2021, 282, 116012. [Google Scholar] [CrossRef]
- Gul, M.S.; Patidar, S. Understanding the energy consumption and occupancy of a multi-purpose academic building. Energy Build. 2015, 87, 155–165. [Google Scholar] [CrossRef]
- Na Tran, L.; Gao, W.; Ge, J. Sensitivity analysis of household factors and energy consumption in residential houses: A multi-dimensional hybrid approach using energy monitoring and modeling. Energy Build. 2021, 239, 110864. [Google Scholar] [CrossRef]
- Zhang, Y.; Bai, X.; Mills, F.P. Characterizing energy-related occupant behavior in residential buildings: Evidence from a survey in Beijing, China. Energy Build. 2020, 214, 109823. [Google Scholar] [CrossRef]
- Chen, X.; Yang, H.; Wang, Y. Parametric study of passive design strategies for high-rise residential buildings in hot and humid climates: Miscellaneous impact factors. Renew. Sustain. Energy Rev. 2017, 69, 442–460. [Google Scholar] [CrossRef]
- Andersen, R.; Fabi, V.; Toftum, J.; Corgnati, S.P.; Olesen, B.W. Window opening behaviour modelled from measurements in Danish dwellings. Build. Environ. 2013, 69, 101–113. [Google Scholar] [CrossRef]
- Zhang, Y.; Barrett, P. Factors influencing occupants’ blind-control behaviour in a naturally ventilated office building. Build. Environ. 2012, 54, 137–147. [Google Scholar] [CrossRef]
- Pérez-Lombard, L.; Ortiz, J.; Pout, C. A review on buildings energy consumption information. Energy Build. 2008, 40, 394–398. [Google Scholar] [CrossRef]
- Zhang, Y.; Barrett, P. Factors influencing the occupants’ window opening behaviour in a naturally ventilated office building. Build. Environ. 2012, 50, 125–134. [Google Scholar] [CrossRef]
- Gadenne, D.; Sharma, B.; Kerr, D.; Smith, T. The influence of consumers’ environmental beliefs and attitudes on energy saving behaviours. Energy Policy 2011, 39, 7684–7694. [Google Scholar] [CrossRef]
- Yun, G.Y.; Kim, H.; Kim, J.T. Effects of occupancy and lighting use patterns on lighting energy consumption. Energy Build. 2012, 46, 152–158. [Google Scholar] [CrossRef]
- Andersen, R.V.; Toftum, J.; Andersen, K.K.; Olesen, B.W. Survey of occupant behaviour and control of indoor environment in Danish dwellings. Energy Build. 2009, 41, 11–16. [Google Scholar] [CrossRef]
- Huang, F.; Liu, J.; Wang, Z.; Shuai, C.; Li, W. Of jobs, skills, and values: Exploring rural household energy use and solar photovoltaics in poverty alleviation areas in China. Energy Res. Soc. Sci. 2020, 67, 101517. [Google Scholar] [CrossRef]
- Yohanis, Y.G.; Mondol, J.D.; Wright, A.; Norton, B. Real-life energy use in the UK: How occupancy and dwelling characteristics affect domestic electricity use. Energy Build. 2008, 40, 1053–1059. [Google Scholar] [CrossRef]
- Wu, S.; Zheng, X.; You, C.; Wei, C. Household energy consumption in rural China: Historical development, present pattern and policy implication. J. Clean. Prod. 2019, 211, 981–991. [Google Scholar] [CrossRef]
- Haldi, F.; Robinson, D. On the behaviour and adaptation of office occupants. Build. Environ. 2008, 43, 2163–2177. [Google Scholar] [CrossRef]
- Yun, G.Y.; Steemers, K. Time-dependent occupant behaviour models of window control in summer. Build. Environ. 2008, 43, 1471–1482. [Google Scholar] [CrossRef]
- Haldi, F.; Robinson, D. Interactions with window openings by office occupants. Build. Environ. 2009, 44, 2378–2395. [Google Scholar] [CrossRef]
- Bae, C.; Chun, C. Research on seasonal indoor thermal environment and residents’ control behavior of cooling and heating systems in Korea. Build. Environ. 2009, 44, 2300–2307. [Google Scholar] [CrossRef]
- Jian, Y.; Liu, J.; Pei, Z.; Chen, J. Occupants’ tolerance of thermal discomfort before turning on air conditioning in summer and the effects of age and gender. J. Build. Eng. 2022, 50, 104099. [Google Scholar] [CrossRef]
- Ignjatovic, M.; Blagojevic, B.; Stojiljkovic, M.; Mitrovic, D.; Andjelkovic, A.; Ljubenovic, M. Sensitivity analysis for daily building operation from the energy and thermal comfort standpoint. Therm. Sci. 2016, 20, 1485–1500. [Google Scholar] [CrossRef]
- Hygh, J.S.; DeCarolis, J.F.; Hill, D.B.; Ranjithan, S.R. Multivariate regression as an energy assessment tool in early building design. Build. Environ. 2012, 57, 165–175. [Google Scholar] [CrossRef]
- Tokarik, M.S.; Richman, R.C. Life cycle cost optimization of passive energy efficiency improvements in a Toronto house. Energy Build. 2016, 118, 160–169. [Google Scholar] [CrossRef]
- Sanquist, T.F.; Orr, H.; Shui, B.; Bittner, A.C. Lifestyle factors in U.S. residential electricity consumption. Energy Policy 2012, 42, 354–364. [Google Scholar] [CrossRef]
- Zhang, X.; Zhang, X. Comparison and sensitivity analysis of embodied carbon emissions and costs associated with rural house construction in China to identify sustainable structural forms. J. Clean. Prod. 2021, 293, 126190. [Google Scholar] [CrossRef]
- Tian, W. A review of sensitivity analysis methods in building energy analysis. Renew. Sustain. Energy Rev. 2013, 20, 411–419. [Google Scholar] [CrossRef]
- Østergård, T.; Jensen, R.L.; Maagaard, S.E. Early Building Design: Informed decision-making by exploring multidimensional design space using sensitivity analysis. Energy Build. 2017, 142, 8–22. [Google Scholar] [CrossRef]
- Yıldız, Y.; Arsan, Z.D. Identification of the building parameters that influence heating and cooling energy loads for apartment buildings in hot-humid climates. Energy 2011, 36, 4287–4296. [Google Scholar] [CrossRef]
- Rosso, F.; Ciancio, V.; Dell’Olmo, J.; Salata, F. Multi-objective optimization of building retrofit in the Mediterranean climate by means of genetic algorithm application. Energy Build. 2020, 216, 109945. [Google Scholar] [CrossRef]
- Ebrahimi-Moghadam, A.; Ildarabadi, P.; Aliakbari, K.; Fadaee, F. Sensitivity analysis and multi-objective optimization of energy consumption and thermal comfort by using interior light shelves in residential buildings. Renew. Energy 2020, 159, 736–755. [Google Scholar] [CrossRef]
- Heiselberg, P.; Brohus, H.; Hesselholt, A.; Rasmussen, H.; Seinre, E.; Thomas, S. Application of sensitivity analysis in design of sustainable buildings. Renew. Energy 2009, 34, 2030–2036. [Google Scholar] [CrossRef]
- Naji, S.; Aye, L.; Noguchi, M. Sensitivity analysis on energy performance, thermal and visual discomfort of a prefabricated house in six climate zones in Australia. Appl. Energy 2021, 298, 117200. [Google Scholar] [CrossRef]
- Jaffal, I.; Inard, C. A metamodel for building energy performance. Energy Build. 2017, 151, 501–510. [Google Scholar] [CrossRef]
- Hopfe, C.J.; Hensen, J.L.M. Uncertainty analysis in building performance simulation for design support. Energy Build. 2011, 43, 2798–2805. [Google Scholar] [CrossRef]
- Gong, X. Study on indoor thermal environment and thermal comfort of farm houses in Hezhou region in summer. Eng. J. Wuhan Univ. 2022, 55, 372–379. [Google Scholar] [CrossRef]
- Yang, Z.; Zhang, W.; Qin, M.; Liu, H. Comparative study of indoor thermal environment and human thermal comfort in residential buildings among cities, towns, and rural areas in arid regions of China. Energy Build. 2022, 273, 112373. [Google Scholar] [CrossRef]
- Chen, X.; Yang, H.; Zhang, W. A comprehensive sensitivity study of major passive design parameters for the public rental housing development in Hong Kong. Energy 2015, 93, 1804–1818. [Google Scholar] [CrossRef]
- Figueiredo, A.; Figueira, J.; Vicente, R.; Maio, R. Thermal comfort and energy performance: Sensitivity analysis to apply the Passive House concept to the Portuguese climate. Build. Environ. 2016, 103, 276–288. [Google Scholar] [CrossRef]
- Li, H.; Wang, S.; Cheung, H. Sensitivity analysis of design parameters and optimal design for zero/low energy buildings in subtropical regions. Appl. Energy 2018, 228, 1280–1291. [Google Scholar] [CrossRef]
- Gagnon, R.; Gosselin, L.; Decker, S. Sensitivity analysis of energy performance and thermal comfort throughout building design process. Energy Build. 2018, 164, 278–294. [Google Scholar] [CrossRef]
- Yildiz, Y.; Korkmaz, K.; Özbalta, T.G.; Arsan, Z.D. An approach for developing sensitive design parameter guidelines to reduce the energy requirements of low-rise apartment buildings. Appl. Energy 2012, 93, 337–347. [Google Scholar] [CrossRef]
- Asadi, S.; Amiri, S.S.; Mottahedi, M. On the development of multi-linear regression analysis to assess energy consumption in the early stages of building design. Energy Build. 2014, 85, 246–255. [Google Scholar] [CrossRef]
- Pan, Y.; Yang, Y. Building performance gaps and building energy model calibration. Energy Effic. Build. Engl. Chin. 2021, 49, 1–12. [Google Scholar]
- Ochoa, C.E.; Aries, M.B.C.; van Loenen, E.J.; Hensen, J.L.M. Considerations on design optimization criteria for windows providing low energy consumption and high visual comfort. Appl. Energy 2012, 95, 238–245. [Google Scholar] [CrossRef]
- Yu, J.; Tian, L.; Yang, C.; Xu, X.; Wang, J. Sensitivity analysis of energy performance for high-rise residential envelope in hot summer and cold winter zone of China. Energy Build. 2013, 64, 264–274. [Google Scholar] [CrossRef]
Figure 1.
Research framework.
Figure 1.
Research framework.
Figure 2.
Map of questionnaire data sources.
Figure 2.
Map of questionnaire data sources.
Figure 3.
(a) Probability of differently aged people’s activities in winter; (b) probability of heating by people of different ages in summer and winter. Under 20 years old: n = 154; 20.30 years: n = 221; 30.40 years: n = 102; 40.50 years: n = 387; 50.60 years: n = 131; over 60 years old: n = 135 (n refers to the number of people within this age bracket who answered this questionnaire).
Figure 4.
Rural household models.
Figure 4.
Rural household models.
Figure 5.
Time schedule of air conditioner being on/off.
Figure 5.
Time schedule of air conditioner being on/off.
Figure 6.
Time schedule of lighting being on/off.
Figure 6.
Time schedule of lighting being on/off.
Figure 7.
Time schedule of residents staying at home.
Figure 7.
Time schedule of residents staying at home.
Figure 8.
Some of the appliances used.
Figure 8.
Some of the appliances used.
Figure 9.
The field survey object.
Figure 9.
The field survey object.
Figure 10.
(a) Plan of first floor; (b) plan of second floor.
Figure 10.
(a) Plan of first floor; (b) plan of second floor.
Figure 11.
Code and actual annual building electricity consumption rates.
Figure 11.
Code and actual annual building electricity consumption rates.
Figure 12.
(a) Aerial view of the residence in DesignBuilder; (b) the main energy using room on the 2nd floor of the residence.
Figure 12.
(a) Aerial view of the residence in DesignBuilder; (b) the main energy using room on the 2nd floor of the residence.
Figure 13.
Comparison of measured and simulated monthly electricity consumption in a typical residential home.
Figure 13.
Comparison of measured and simulated monthly electricity consumption in a typical residential home.
Figure 14.
SRC for each parameter for the cooling load.
Figure 14.
SRC for each parameter for the cooling load.
Figure 15.
SRC for each parameter for the heating load.
Figure 15.
SRC for each parameter for the heating load.
Figure 16.
SRC of each parameter on electricity consumption.
Figure 16.
SRC of each parameter on electricity consumption.
Figure 17.
SRC for each parameter for discomfortable (All- Cloth).
Figure 17.
SRC for each parameter for discomfortable (All- Cloth).
Figure 18.
SRC for each parameter for 55% of discomfortable ASHRAE.
Figure 18.
SRC for each parameter for 55% of discomfortable ASHRAE.
Table 1.
Family Composition.
Table 1.
Family Composition.
| Model | 1 | 2 | 3 | 4 | 5 | 6 | 7 | 8 | 9 | 10 | 11 |
|---|
| Households | 49% | 8% | 8% | 6% | 2% | 2% | 4% | 6% | 4% | 2% | 4% |
| Grandparents | ● | ● | ● | ● | N | N | N | ● | ● | ● | ○ |
| Parents | ○ | ○ | ● | ● | ● | ○ | ● | ○ | N | ● | ○ |
| Grandchildren | ○ | ● | ○ | ● | ○ | ● | ● | N | N | N | ○ |
Table 2.
The basic parameter settings in the building room.
Table 2.
The basic parameter settings in the building room.
| Room Type | Lighting Power (W/㎡) | Number of People in the Room
(Person/Room) | Metabolic Rate (W/Person) | Temperature Setpoint (°C) | Device Power (W/m2) |
|---|
| Summer | Winter |
|---|
| Bedroom | 7 | 2 | 100 | 26 | 18 | 13 |
| Living room | 7 | Determined by mode | 100 | 26 | 18 | 13 |
| Dining room | 7 | Determined by mode | 110 | 26 | 18 | 13 |
| Kitchen | 7 | 3 | 160 | / | / | 13 |
Table 3.
Range of intervals for the base line and simulated values of each parameter.
Table 3.
Range of intervals for the base line and simulated values of each parameter.
| NO. | Types of Input Parameter | Unit | Based
Value | Range of
Values | Distribution Step Size | Number of Steps |
|---|
| A | Heat transfer coefficient of exterior wall | W/(m2·K) | 2.2 | 0.4~2.6 | 0.2 | 14 |
| B | Heat transfer coefficient of exterior window | W/(m2·K) | 6.4 | 1.5~3.5 | 0.5 | 5 |
| C | Solar heat gain coefficient | / | 0.8 | 0.2~0.8 | 0.2 | 4 |
| D | Heat transfer coefficient of roof | W/(m2·K) | 6.0 | 0.5~6.0 | 0.5 | 12 |
| E | Area ratio of window to wall | % | 30 | 15~65 | 5 | 11 |
| F | Infiltration | Ac/h | 0.5 | 0.1~0.8 | 0.1 | 8 |
| G | Cooling setpoint temperature | °C | 16 | 26~28 | 1 | 3 |
| H | Heating setpoint temperature | °C | 28 | 18~22 | 1 | 5 |
| I | Equipment power density | W/m2 | 4.3 | 4–12 | 1 | 9 |
| J | General lighting power density | W/m2 | 7 | 0~10 | 1 | 11 |
| K | Occupancy number of people | Each | 2 | 0~2 | 1 | 3 |
| L | Local shading type | m | 1 | 0~2 | 0.2 | 8 |
Table 4.
Basic information about the residence.
Table 4.
Basic information about the residence.
| NO. | Residential Information | Two-Story House |
|---|
| A | Year of construction | 2000 |
| B | Family members | 1 grandmother, 2 parents, and 2 sons |
| C | Floor space (m2) | 140 |
| D | Total floor area (m2) | 292 |
Table 5.
Monthly measured and simulated electricity consumption data for residential home.
Table 5.
Monthly measured and simulated electricity consumption data for residential home.
| Time | Actual Electricity Consumption (kwh) | Simulated Electrical Power (kwh) | CVRMSE |
|---|
| Dec 21 | 193.5 | 218 | 11.2% |
| Nov 21 | 128 | 121 | 5.8% |
| Oct 21 | 151 | 135 | 11.9% |
| Sep 21 | 158.5 | 153 | 3.6% |
| Aug 21 | 446 | 472 | 5.5% |
| Jul 21 | 456.5 | 401 | 13.8% |
| Jun 21 | 205.5 | 198 | 3.8% |
| May 21 | 144 | 134 | 7.5% |
| Apr 21 | 136.5 | 121 | 12.8% |
| Mar 21 | 173.5 | 165 | 5.2% |
| Feb 21 | 339 | 299 | 13.4% |
| Jan 21 | 367.5 | 346 | 6.2% |
| Disclaimer/Publisher’s Note: The statements, opinions and data contained in all publications are solely those of the individual author(s) and contributor(s) and not of MDPI and/or the editor(s). MDPI and/or the editor(s) disclaim responsibility for any injury to people or property resulting from any ideas, methods, instructions or products referred to in the content. |
© 2023 by the authors. Licensee MDPI, Basel, Switzerland. This article is an open access article distributed under the terms and conditions of the Creative Commons Attribution (CC BY) license (https://creativecommons.org/licenses/by/4.0/).


 ,
, 


