1. Introduction
The modeling of existing unreinforced masonry (URM) buildings addressed to seismic assessment is affected by many uncertainties. Those ascribable to aleatory variables (e.g., mechanical parameters, as discussed in [
1]) are the ones most commonly included, but epistemic uncertainties play a crucial role as well (see [
2,
3,
4,
5]). Examples of epistemic uncertainties for URM buildings are the stiffness of diaphragms and their connection to masonry walls, the effectiveness of the wall-to-wall connection, the actual efficiency of structural aseismic devices such as tie-rods, etc. Although the accurate knowledge of the building under examination constitutes the first essential requisite to properly address the modeling choices [
6,
7], the capability of models to simulate the large variety of structural details and configurations that may be observed in any single existing building is likewise crucial to correctly transfer these data into numerical simulations.
Recently, [
8] provided a comprehensive review of the critical aspects of the nonlinear modeling of URM structures, covering various modeling strategies (i.e., equivalent frame (EF) approaches and 2D and 3D finite element (FE) procedures based on continuous, discrete, and micro-mechanical approaches, as also classified in [
9]) and various aspects (i.e., in-plane and out-of-plane responses of masonry, the wall-to-wall connection, the diaphragm’s role).
Among the latter ones, and particularly in the case of EF models, which this paper focuses on, the modeling capability of properly accounting for the effectiveness of the wall-to-wall connection emerged as one of the most relevant requisites. In fact, if the connection between walls is good, a possible redistribution of forces among intersecting piers may occur, generating the so-called “flange effect” (i.e., forming piers with L-, C-, T-, or I-shaped cross-sections). This effect potentially affects both the in-plane and the out-of-plane strength of URM walls, since both depend on the axial load, but this paper focuses only on the repercussions on their in-plane response.
Various experimental campaigns conducted both at the scale of single masonry panels [
10,
11,
12,
13,
14,
15] and at the structural level [
16,
17,
18,
19] highlighted potential issues associated with the “flange effect”. In addition, various numerical investigations based on refined FE models highlighted the relevance of the topic [
20,
21]. However, these works have investigated the issue more at the scale of single components than from the perspective of systematically assessing the repercussions at a global scale or for deriving simplified modeling strategies to be implemented in EF models, as instead is the main goal of this paper.
One relevant outcome is that, especially in the presence of big flanges, it is not correct to consider all the width as effective. Many contributions are present in the literature [
22,
23,
24] that are addressed in determining the effective flange width in shear walls made by reinforced concrete and reinforced masonry, while very few are the ones focused on URM buildings. In [
25], a simplified expression has been proposed that aims to assess the compressive length in the presence of flanged sections. In [
26], a simple geometric approach based on the “rule of the 45°” has been outlined for the identification of the effective flange width in URM walls. Instead, in [
27], empirical rules have been proposed that establish the effective width as “N” times the thickness of the web (
s in
Figure 1a), where the value of N is differentiated as a function of the effectiveness of the wall-to-wall connection (if poor, average, or good) and the position of the piers connected (if at a corner—leading to an L-section shape—or at an internal intersection—leading to a T-section shape) (see
Figure 1a). Furthermore, indications are provided by the codes [
28,
29], which substantially depend on the geometry of the interacting walls.
Figure 1b illustrates those proposed in Eurocode 6 [
28] and adopted as a reference in this paper for the applications illustrated in
Section 4 and
Section 5. In particular, according to such criteria, the length of any interacting wall that may be considered to act as a flange is the thickness of the shear wall plus, on each side of it, where appropriate, the lesser of the following:
- (i)
htot/5, where htot is the overall height of the shear wall;
- (ii)
Half the distance between the shear walls (when connected by the intersecting wall), ls;
- (iii)
The distance to the end of the wall;
- (iv)
Half the clear height (h);
- (v)
Six times the thickness of the intersecting wall, t.
The numerical simulations available in the literature [
4,
5,
30] confirmed that the adoption of different approaches for modeling orthogonal walls in the EF models (i.e., perfect coupling or total decoupling between them) may produce significant differences in results, such as causing even different outcomes of the design/assessment; these differences are mainly related to those consequent into the pushover curves generated by nonlinear static analyses to interpret the global response of a 3D building. According to what has been recently reviewed by [
8] (where further details are provided),
Figure 2 illustrates the alternative modeling options commonly adopted in EF models to simulate the connection among intersecting piers:
- -
Case (a)—the perfect kinematic coupling, by connecting the two piers to the same node, thanks to a rigid offset (the result is a condensation of the total number of degrees of freedom);
- -
Case (b)—the use of a rigid link;
- -
Cases (c) and (d)—the adoption of “equivalent elastic beams”, which allow different degrees of connection to be simulated;
- -
Cases (e) and (f)—the stiffness of the in-plane loaded pier is perfectly connected to an orthogonal pier with an effective width, which is assumed to be the collaborating part of the flange [
27]; depending on the direction of loading, the “effective flange width” considered collaborating with the “web” of the composite section may vary (as shown in
Figure 2, cases (e) for a shear force in the y-direction and (f) for the x-direction);
- -
Case (g)—the connection between the orthogonal walls is modeled through zero-length elements; this is the approach adopted in the equivalent frame model proposed by [
31,
32] and implemented in OpenSees [
33].
Among these alternative strategies, options (c) and (d) illustrated in
Figure 2 appear to be an effective and practice-oriented approach to managing this epistemic uncertainty, because all piers are included in the EF model with the total size and the partial contribution to the flange effect is not modeled by considering an effective width but by assuming an elastic shear connection between the intersecting piers, through an equivalent beam. However, there are no specific indications in the literature about how to properly calibrate the stiffness of these beams, accounting for the geometry and materials of collaborating masonry portions, nor whether this approach allows for proper reproductions of both the stiffness and strength of the 3D configuration. In [
5,
30], some practical applications of calibration are reported with the aim of defining the following: firstly, an “upper bound value” of the stiffness of the equivalent beams able to reproduce the same solution obtained in the case of perfect coupling; secondly, a “lower bound value” corresponding to the case of fully decoupled walls. Once these limits values are defined, a sensitivity analysis may be performed to quantify the influence of various levels of effectiveness of the wall-to-wall connection on pushover curves’ results. In [
5], it has been also proven that, if consistent hypotheses are adopted, different software packages and alternative options lead to analogous results.
Such an approach presupposes that the strength verification of piers may still refer to the rectangular section responding in-plane (a) by considering the influence of the flange only for the computation of the normal stress redistribution. Moreover, a systematic consideration of the effective width of flanges depending on their dimensions is not included (b) and, in most cases, the full coupling is assumed by default options of the software package by considering that all of the flange may interact, regardless of its actual dimension; this may produce an overestimation of the flange effect, since it is unrealistic to consider all the width as effective, especially if it is significant. Indeed, hypotheses (a) and (b) are still debated in the literature. For example, in [
26] an analytical model to evaluate the in-plane response of URM piers with single-flange and fixed-free conditions has been formulated. According to this proposal, a specific model—based on a proper modification of that called the “effective pier model”—is developed to investigate the effects of flanges on the lateral strength of a non-rectangular section URM pier. Through this “modified” effective pier model, the maximum strength is computed in the case of the cantilever pier on the basis of four primary failure modes, namely rocking, bed-joint sliding, toe crushing, and diagonal tension. This model was successively revised by [
13] considering the case of piers with flanges on both ends.
Within this general context, the goal of this paper is twofold. Firstly, the research question on the suitability of using the in-plane strength criteria proposed in the literature for piers with a rectangular section even in the presence of flanges is discussed (
Section 3). To this aim, the results of nonlinear finite element analyses of simple systems are used as a reference (
Section 2). Secondly, a practice-oriented analytical formulation is proposed to assess the stiffness of the equivalent beam to be introduced for reproducing the flange effect (
Section 4). Finally, the effectiveness of such a formulation is tested by using both simple systems (
Section 5), characterized by piers with T- or I-shaped cross-sections and complex 3D structures inspired by real URM existing buildings (
Section 6). In all these cases, nonlinear analyses are made by adopting equivalent frame models developed by the Tremuri software package version 2.2.20 [
34].
2. Examined Configurations and Reference Solutions by Finite Element Modeling
The examined case studies (
Figure 3) are represented by three I- and T-shaped sections, hereinafter referred to as I-1, I-2, I-3, T-1, T-2, and T-3.
The web panel always has the same geometry while the dimension of the flanges is progressively increased passing from I-1 to I-3. As a consequence, the resulting sections are characterized by different relative ratios of axial stiffness and flexural stiffness between the flanges and the web.
All the introduced case studies were modeled using both of the following:
- -
In ABAQUS, by using the Concrete Damage Plasticity (CDP) model [
35] and fully integrated (2 × 2 × 2 integration points) 8-node linear brick elements;
- -
In Tremuri [
34], by using the multilinear constitutive law for masonry panels proposed by [
36] and recently validated by simulating the actual response of complex buildings in [
37,
38,
39].
The CDP model is an isotropic model that uses concepts of damaged elasticity in combination with tensile and compressive plasticity. The uniaxial stress–strain curves in tension and compression represent the main input of the constitutive law (which depends on the variables summarized in
Table 1) and two distinct damage variables in tension (
dt) and compression (
dc) are introduced. Although the model was originally developed for concrete and isotropic quasi-brittle materials, since then it has been successfully used also in many applications addressing the analysis of masonry structures [
40,
41,
42,
43].
As highlighted in [
44] and [
8], a crucial point in using finite element models—especially if used as a reference for a consistent comparison with other modeling strategies such as the EF models—is the proper calibration of the parameters on which the adopted constitutive law is based. In this paper, the calibration of parameters is based on the procedure outlined by specific steps in [
8] and in-depth exemplified in [
45]. The calibration is made at the scale of single panels characterized by a rectangular cross-section (panel 1, 1.12 × 0.16 × 1.35 m
3 and panel 2, 2.66 × 0.16 × 1.35 m
3) and by assuming as “target behavior” for the calibration the one predicted by simplified code-based strength criteria available in the literature [
46,
47] to interpret the main failure modes that are expected to occur in masonry piers. The latter are the ones usually implemented in the EF model that directly work at the panel scale. In particular, the following strength criteria have been assumed as a reference in this research: the one proposed by [
48] for interpreting the diagonal shear cracking failure mode; the one adopted in the Italian Structural Code [
49] for interpreting the flexural failure mode. These criteria are illustrated in
Figure 4 together with their analytical expressions. Then, the calibration procedure presupposes a comparison of the response of the pier simulated by the FE model not only in terms of strength but also in terms of the elastic stiffness, post-peak behavior, and displacement capacity estimated for different values of the applied axial load. Interested readers are invited to refer to [
45] for further details, while
Figure 5 summarizes the values herein adopted as resulting from such a calibration process. Moreover, in this phase, a set of preliminary analyses aimed at assessing the influence of the mesh dimension on the convergence process has also been performed. It led to the adoption of a geometry of the brick elements approximatively equal to 10 × 10 × 12.5 cm, which provides almost the same results in terms of base shear-displacement curves and occurred damage of a more refined mesh, guaranteeing at the same time a higher computational efficiency.
Moreover,
Figure 6 shows the outcome of such a calibration for the two panels, by referring to both configurations of cantilever and fixed–fixed end rotation and varying the axial load applied on the top of piers. The results show a very good agreement between the numerical simulations carried out through the FE and EF models, demonstrating the capability of the CDP model to correctly reproduce the failure domain of URM piers without flanges.
Once the calibration process was completed, the same parameters were adopted for the numerical simulation of the simple schemes in
Figure 3. Moreover, for them, both the cantilever and the fixed–fixed end rotation configurations have been analyzed. Lateral load monotonic analyses were performed under the assumption of control displacement and by considering different increasing compression levels
σ/
fc. The applied values are reported in
Table 1, in particular, in the case of the cantilever boundary condition, six values ((
σ/
fc)
i,
i = 1, …, 6) were explored; for the fixed–fixed scheme, a further value has been considered to better investigate the region of the failure domain associated with flexural failure. The vertical load was always applied only on the web; consequently, the flanges bear just their weight.
3. Preliminary Analyses Made by the FE Models to Address the Legitimacy of Using the in-Plane Strength Criteria for Piers with a Rectangular Cross-Section
This section debates the legitimacy of using the in-plane strength criteria proposed in the literature for piers with a rectangular section.
To this aim, after the execution of the lateral load FE analyses on all configurations introduced in
Section 2, (see also [
50] for some preliminary results on I-shaped systems), the following entities were determined:
The maximum total base shear (Vy,tot), as the sum of the reaction forces at the base of the whole section (i.e., including flanges);
The maximum base shear (Vy,W), as the sum of the reaction forces associated only with the web panel.
Figure 7 illustrates the comparison between the failure domain of the web panel and the values of
Vy,tot (black dots) and
Vy,W (white dots), respectively, as estimated by the performed FE analyses. The failure domain is defined through the strength criteria illustrated in
Figure 4.
The values of
Vy,tot and
Vy,W represented in
Figure 7 correspond to the axial load value
Napp evaluated as the sum of the axial load applied at the top section and half the web weight. This is equivalent to assume that the vertical load applied at the top section remains on the web panel without any redistribution between the web and the flanges.
From these graphs, the following emerges:
The distance in the vertical direction between each black dot and the corresponding white dot quantifies the contribution to the global strength given by the flanges. This contribution is not always modeled in models based on the EF approach; therefore, in this way, the associated error may be quantified. It comes out that, by accounting also the contribution of the flanges, the maximum base shear increases, on average, by 15%; such a result is, in percentage, substantially similar for both the static schemes and the different applied axial loads that have been investigated. However, it should be highlighted that in the case of flanges with higher width (which is plausible, for example, in the presence of old masonry buildings) this contribution may be more significant. As also discussed in [
5], the contribution of panels loaded “out-of-plane” may be neglected for walls with thicknesses lower than 0.4 m, by providing anyhow conservative results. Conversely, for greater thicknesses, such contribution progressively becomes more significant; thus, neglecting it could lead to appreciable variations in the pushover curve, in terms of the overall base shear capacity, initial stiffness, and also ultimate displacement capacity.
White dots correspond to the values of Vy,W, which are those that have to be compared with the failure domain of the web panel represented in the graphs. In particular, it is possible to observe that, in the initial part of the domain, they are higher than the predictions of the flexural failure criterion. That especially happens for the I-2 and I-3 configurations (where the flange is longer); conversely, it is less significant when the flange is rather short (I-1). This phenomenon occurs in both the considered static schemes, even if it is more pronounced in the presence of the cantilever boundary condition, since in this case the part of the domain with a prevailing flexural response is more extended.
By examining the part of the domain mainly affected by the shear failure, the Vy,W values are almost in agreement with the predictions of the shear failure criterion in the case of the fixed–fixed static scheme, while they are always lower when considering the cantilever boundary condition.
In
Figure 8, a different type of representation is proposed by way of example for the case of the cantilever static scheme. More specifically, the values of
Vy,W (white dots) are represented in correspondence with the actual axial load acting after the application of the vertical loads in the mid-section of the web panel (
NW,eff).
NW,eff was computed from the FE model by integrating the vertical stresses on the mid-cross-section of the web. Conversely, the values of
Vy,tot (black dots) are still represented as in the previous graph and, therefore, in correspondence of
Napp. This explains the shifting between the black and the white dots, which refer to the same analysis.
In this way, by examining the white dots, it is possible to see the actual axial load and the actual maximum base shear referring to the web panel. That is of main interest in the view of an EF approach where pier panels are modeled as in-plane elements and the behavior of a flanged section addresses the correct estimate of the shear and the normal force acting on the in-plane loaded panel.
The results in
Figure 8 highlight the following:
The distance in the horizontal direction between the white and the black dot, for a fixed analysis, provides a measure of the difference between the actual axial load acting in the mid-section of the web (NW,eff) and the axial load that would act in this section if no redistribution between the web and the flanges occurred (NW,app). Since this difference is not negligible, this result suggests that the axial load applied at the top section of the web redistributes, moving in part to the two flanges. This effect is visible for all the configurations, and thus for all the examined length of the flange; however, it is slightly higher when considering I-2 and I-3 than in the case in which the flange is shorter (I-1);
By looking at the dots representing Vy,W, which are now referred to the correct value of axial load acting on the web panel, it may be observed that they correctly reproduce, in all the three examined configurations, the strength domain of the web panel. This is particularly true when the highest values of applied vertical load are examined (i.e., where, according to the strength domain, the shear failure is expected);
The discrepancies in the initial part of the domain already observed in the previous graphs are still present and even emphasized. For low applied axial loads, the values of Vy,W are higher than what was expected; that is particularly evident for the configurations where the flange is longer (I-2 and I-3). In both these cases, they are closest to the shear failure criterion instead of the flexural one.
This last observation can be explained by considering that the presence of the flange tends to inhibit the flexural failure of the web panel, avoiding the associated rocking mechanism. Consequently, when applying low axial loads, the web is interested in the development of shear cracks rather than pure flexural failures, which is interested only by the base section partialization. This especially happens when the length of the flange is higher (I-2, I-3); in fact, in these cases, thanks to its not negligible weight compared to that of the web, the flange provides a more significant contribution to counterbalance the overturning of the web panel. Conversely, when the length of the flange is significantly lower than that of the web (I-1), the inhibition of the flexural failure does not happen. That is confirmed by
Figure 8, where the values of
Vy,W (white dots) in the initial part of the domain are substantially closer to the flexural failure criterion; the slight overestimation is justified by the fact that the constitutive model employed in the FE analyses also includes the tensile strength of the material, while the strength criterion adopted for the flexural failure neglects this contribution.
These observations are confirmed by the damage pattern detected in I-1, I-2, and I-3 (cantilever static scheme), which is illustrated in
Figure 9 for two different values of applied axial load ((
σ/
fc)
2 and (
σ/
fc)
4). The results obtained for I-1 when applying (
σ/
fc)
2 point out a pure flexural failure occurs, with the partialization of almost all the base section.
This is consistent with the fact that, as already observed, the associated value of
Vy,W is substantially close to the predictions of the flexural strength criterion (
Figure 8). Moving to I-2 and I-3, it is worth noting that, even for the lowest applied vertical load ((
σ/
fc)
2), which corresponds to the very beginning of the failure domain, the web panels are already interested in the development of shear cracks, and a pure flexural failure does not occur; this is due to the flange subjected to tension that minimizes the rocking phenomenon and the partialization of the base section of the web. For a higher level of applied axial load ((
σ/
fc)
4), in I-1 shear cracks start to develop, but the partialization of the base section is still evident and still interests quite a significant part of the base section; conversely, in I-2 and I-3 an almost vertical crack develops starting from the center of the panel.
The results examined in this section stress that, by assuming to the ability to effectively capture the actual axial load acting in the web panel, the strength criteria currently adopted in the EF models for the in-plane loaded panel can almost correctly predict its maximum strength. Therefore, the main issue to be addressed is the actual EF model’s capability of evaluating the actual vertical load acting on the web panel after the redistribution that occurs between it and the flanges. That is important and of primary relevance after the application of the dead loads and, possibly, also during the analysis. The second part of this paper is addressed to deepen this issue.
Finally, the results suggest that, when the flange is sufficiently long compared to the in-plane loaded panel, the flexural criterion is likely to not develop and only the one describing the shear failure should be used, also for the lower values of the applied vertical load. A more in-depth investigation of this aspect is out of the scope of this paper, but these results outline useful directions for orienting experimental tests in the future. As a confirmation of that, other works from the literature confirm this result [
14].
4. Proposal of the Practice-Oriented Analytical Formulation
This section proposes a practice-oriented analytical formulation to calibrate the equivalent stiffness of the shear connection between two orthogonal piers, simulated by beams in an equivalent frame model. This shear connection depends on the relative size and position of the two piers, and it is not rigid even in the case of a complete masonry interlocking, since the complex 3D assembly of the piers should not behave as a single beam with the conservation of a plane section. This shear connection may be obtained by the equivalent beams introduced in
Figure 2 (cases (c) and (d)).
In the case of the minimum assembly constituted by two orthogonal piers (characterized by width—
l - and thickness-
t), depending on the horizontal load direction, one will act as a web (the one mainly behaving in-plane) and the other as a flange.
Figure 10 depicts some possible configurations of connected piers, typical of piers at the intersection of external and internal walls (case (a)), at the corner intersection (case (b)) or at the intersection of two internal walls (case (c)). Of course, in the more general case, piers can be connected to another wall at the other end. The problem also depends on the distance
d between the centroid of the web (pier that is loaded in-plane) and the middle plane of the flange. In the following, the flange effect refers to the systems of
Figure 10 loaded along the X direction. If the direction Y is considered, a flange effect should be considered for cases (b) and (c), by assuming
d =
dy and considering the flange and the web are exchanged.
An analogy may be established between the overall flexural behavior of the 3D assembly of two piers and the case of a composite beam, made by a beam coupled by a slab fixed by shear connectors. In the following, reference has been made to the formulation originally introduced by [
51] to analyze the structural behavior of composite wood–concrete beams with flexible shear connectors. The problem was solved by imposing the equilibrium and congruence equations to the composite section of
Figure 11a, where the timber beam constitutes the original existing floor and the thin concrete slab is introduced as a strengthening solution.
Figure 11b summarizes, from a kinematic and static point of view, the behavior of such a composite section. Under the hypothesis of linear elastic behavior, the differential equations may be expressed as a function of the classic three generalized displacements of the 2D beam, with the addition of the relative displacement
δ between the timber and concrete sections. In [
51], such an equation has been solved by assuming proper boundary conditions and obtaining a closed-form solution to design the steel shear connectors to be used to guarantee the proper coupling of the two parts.
In the case of a pier with a flange, the question is to evaluate the property of the shear connection (shear stiffness of the beam to be implemented in the equivalent frame model) that can simulate the actual behavior of the 3D assembly of piers. An analogy is established between such a timber–concrete composite section and the web–flange system made by interacting piers; in this case, δ is the relative vertical displacement between the two piers at their intersection, but it represents—as concentrated—the actual deformation of the web and flange piers, which do not maintain a plain section.
Let us introduce
Kz, which expresses the stiffness of the “equivalent” shear connection between the two piers, i.e., the stiffness affecting such a vertical relative displacement. By changing such a stiffness, it is possible to pass from the condition of full coupling (
) to the limit case of almost independent piers (
). In general, the value of Kz depends on the stiffness of the two piers, the web and the flange, and the distance from the latter to the centroid of the web. Similarly to what was introduced in [
51], the dimensionless parameter
ω is then introduced to regulate this transition and to account for the geometrical and mechanical variables playing a role in the phenomenon:
where
h is the interstory height;
AW and
JW are the area and moment of inertia of the web (
and
, respectively);
AF and
JF the area and moment of inertia of the flange (
and
, respectively);
EW and
EF are the Young’s moduli of masonry characterizing the two piers;
d, as already introduced, is the distance between the centroid of the web and the middle plane of the flange; and finally,
is a dimensionless factor. Since the thickness is usually limited—if compared to the width of piers whose flange effect may be relevant (
)—and by considering that sometimes the out-of-plane stiffness is neglected, the term
may be reasonably assumed to be equal to 0. Under this specific assumption, it results in the following:
Section 4 illustrates some parametric analyses carried out on simple systems to address reference values to be adopted for
ω.
In practical applications made by numerical models, such a shear stiffness is modeled through the equivalent beam connected to the nodes at the top of the web and flange piers; it simulates the interlocking spread along the overall interstory height
h. According to the beam theory, the shear stiffness of this beam may be expressed as follows:
where
lB and
AB are the length and the transversal area of the equivalent beam, respectively. The equivalent beam is assumed as made by the same material of the web (shear modulus
GW, Poisson coefficient
νW). It is then possible to compute the area
AB from Equations (1) or (2):
The value of AB thus depends on the following: the geometrical features of intersecting piers; the distance between the nodes that the beam is connected to (which defines its length lB); and, through the ω parameter, the degree of connection that has to be introduced in order to consider that the 3D assembly does not behave as a single beam with a flange.
The moment of inertia of the equivalent beam must be very high to make the contribution of the flexural deformability negligible. To this aim, the ratio between flexural and shear stiffness should be assumed to be higher than 10 (
):
As mentioned in the Introduction, the equivalent frame modeling of masonry buildings usually assumes a rigid connection between piers at the intersection of masonry walls, but this overestimates the global stiffness and determines an incorrect estimate of the generalized forces in the two piers, with consequently a wrong evaluation of the failure conditions. Therefore, it is necessary to provide a proper shear connection between the two piers when the flange effect is expected to be relevant, that is, in the following cases:
- (i)
If the web (pier loaded in-plane) is characterized by large dimensions;
- (ii)
If the distance d is large (in cases (a) and (b) of
Figure 10);
- (iii)
The flange area is “big” compared to that of the web.
For the evaluation of the proper shear stiffness of the equivalent beam, Equation (4) provides the area, which depends on the geometry and material properties of the 3D assembly, but it is necessary to assume the correct value of the dimensionless parameter ω. In the following section, it is demonstrated, by a comparison between the results for FE and EF models, that a constant reference value of ω may be assumed for all relevant cases.
It is worth noting that in most of the 3D assemblies of masonry piers the calibration of the connecting equivalent beams should be evaluated in both directions, where the web and the flange are exchanged. In the end, only one equivalent beam may be introduced, by adopting as the shear stiffness the lower or the average between the values of Kz in the two directions X and Y, evaluated by Equations (1) or (2).
5. Application of the Formulation to Simple Masonry Piers with Flanges
In the following, the results obtained on the I-shaped 3D assemblies introduced in
Section 2 are first examined. It is worth recalling that the FE numerical model simulates a condition of good wall-to-wall connection, and all models refer to the cantilever scheme.
The comparison between the FE and EF models is carried out by adopting different representations to investigate the axial load redistribution effects, namely, the following:
Figure 12 shows the evolution of the axial load (
N) on the three piers of the I-shaped assemblies (I-1, I-2, and I-3), i.e., the web (in blue) and two flanges (in orange, the compressed one, and in red, the one subjected to tension), versus the horizontal displacement applied on the top of the system (
dtop). The solid line refers to the reference FE solution, while the various dotted lines illustrate the sensitivity of the results to increasing values of
ω (i.e., 1, 3, 5, and 100). The results are illustrated for two of the examined compressive stress states (i.e., the ones induced by the axial loads applied on the top of the web corresponding to an average stress
σ equal to 0.2 and 0.5 MPa).
Figure 13 depicts the percentage error of the axial force on the web computed by the EF model just after the application of vertical loads (
dtop = 0) versus the reference value obtained by the FE model. This error is illustrated, for different values of
ω, as a function of the investigated average compressive stress.
Figure 14, analogously to
Figure 13, illustrates the percentage error in the estimation of the axial force by also considering its variation until the attainment of the maximum shear on the web panel. The error is estimated by considering the average value within the range of horizontal top displacements from 0 up to 6.75 mm.
This first set of results addresses the issue concerning the definition of the reference value of ω associated with a good wall-to-wall condition and ability of reproducing the most reliable redistribution of axial forces between the web and the two flanges.
Figure 13 highlights a not negligible effect of
ω; thus, the calibration of the equivalent beam may potentially significantly affect the results. It emerges that the reference value of
ω, which minimizes the error, just after the application of the vertical load, is 3. Values higher than 10 and lower than 1 significantly alter the initial redistribution of axial forces alternatively producing a strong underestimation (even higher than 40%) or overestimation (up to 20%) of the axial load acting on the web.
It has been verified that the value of
ω = 100 exactly reproduces the condition of perfect connection, illustrated in
Figure 2 by cases (a) and (b). Indeed, in this case, the axial load acting after the application of the dead loads in the web (
NW,0) and the flanges (
NF,0) may be easily and analytically estimated as a function of the axial stiffness of each panel:
where
NTOT is the total axial load acting at the base section (including the applied vertical load and the total weight of the 3D assembly),
AF is the area of the cross-section of one flange and
AW is the area of the cross-section of the web. Similarly, the bending moment acting on one flange
MF,i, considering the i-th step of the incremental analysis, may be obtained as follows:
where
Vih is the total bending moment (
Vi is the base shear and
h the height of the piers),
JW is the moment of inertia of the web panel, with respect to its centroid, and
JF is the moment of inertia of the flange (by considering only the transfer contribution). By considering that
MF,i can be expressed also as the product of the axial load variation Δ
NF,i occurring in one flange with respect to
NF,0 multiplied by its distance with respect to the centroid of the section (
lW/2), it is possible to also make explicit the value of Δ
NF,i and thus estimate the value
NF,i of the vertical load acting on the two flanges of the I-shaped cross-section at the
i-th incremental step of the application of the horizontal load:
From
Figure 12, it emerges that, regarding the transfer of axial forces, the error obtained by considering
ω equal to 100 is in particular very relevant from the web to the flange in which the axial force is reduced by the application of the horizontal force. This effect is more evident as the flange increases.
When considering the results referring to the compression level
σ = 0.2 N/mm
2 (
Figure 12a), the redistribution of
N between the web and the flange in compression is, for all the examined case studies, higher than when applying a more significant axial load (
Figure 12b). For example, by examining what happens to I-1, it may be noted that, when considering the lower compression level (
σ = 0.2 N/mm
2), the significant redistribution between the web and the flange (approximatively occurring for
dtop between 1.5 mm and 2.5 mm) is due to the partialization of the base section of the web panel, which produces a consequent increment of the axial load in the compressed flange. After that, due to a significant concentration of compression damage in the flange (crushing), the axial load comes back to the web (
dtop > 2.5 mm). On the contrary, when applying
σ = 0.5 N/mm
2, since the rocking mechanism is no more activated, the axial load acting at the base section of the web is almost constant during the analysis and the main redistribution occurs between the two flanges. Such a transfer of actions, which occurs in the case of a low compressive load being applied, is not captured by the EF model; therefore, for low values of
σ more significant percentage errors are founded, regardless of the assumed value of
ω (see
Figure 14).
By summing up, the adoption of a rigid connection produces results in the redistribution effects, which are still acceptable only when the dimension of the flange is limited with respect to the dimension of the web (percentage error with respect to the reference FE solution equal to almost 15%). However, when the dimension of the flange increases with respect to the dimension of the web, this strategy leads to an overestimation of the axial load acting on the flanges and, consequently, to an underestimation of the one acting on the web: the percentage error of the EF approach with respect to the reference solution increases up to 50%. This may imply repercussions appreciable also in the simulation of the seismic response of complex systems as discussed in
Section 6.
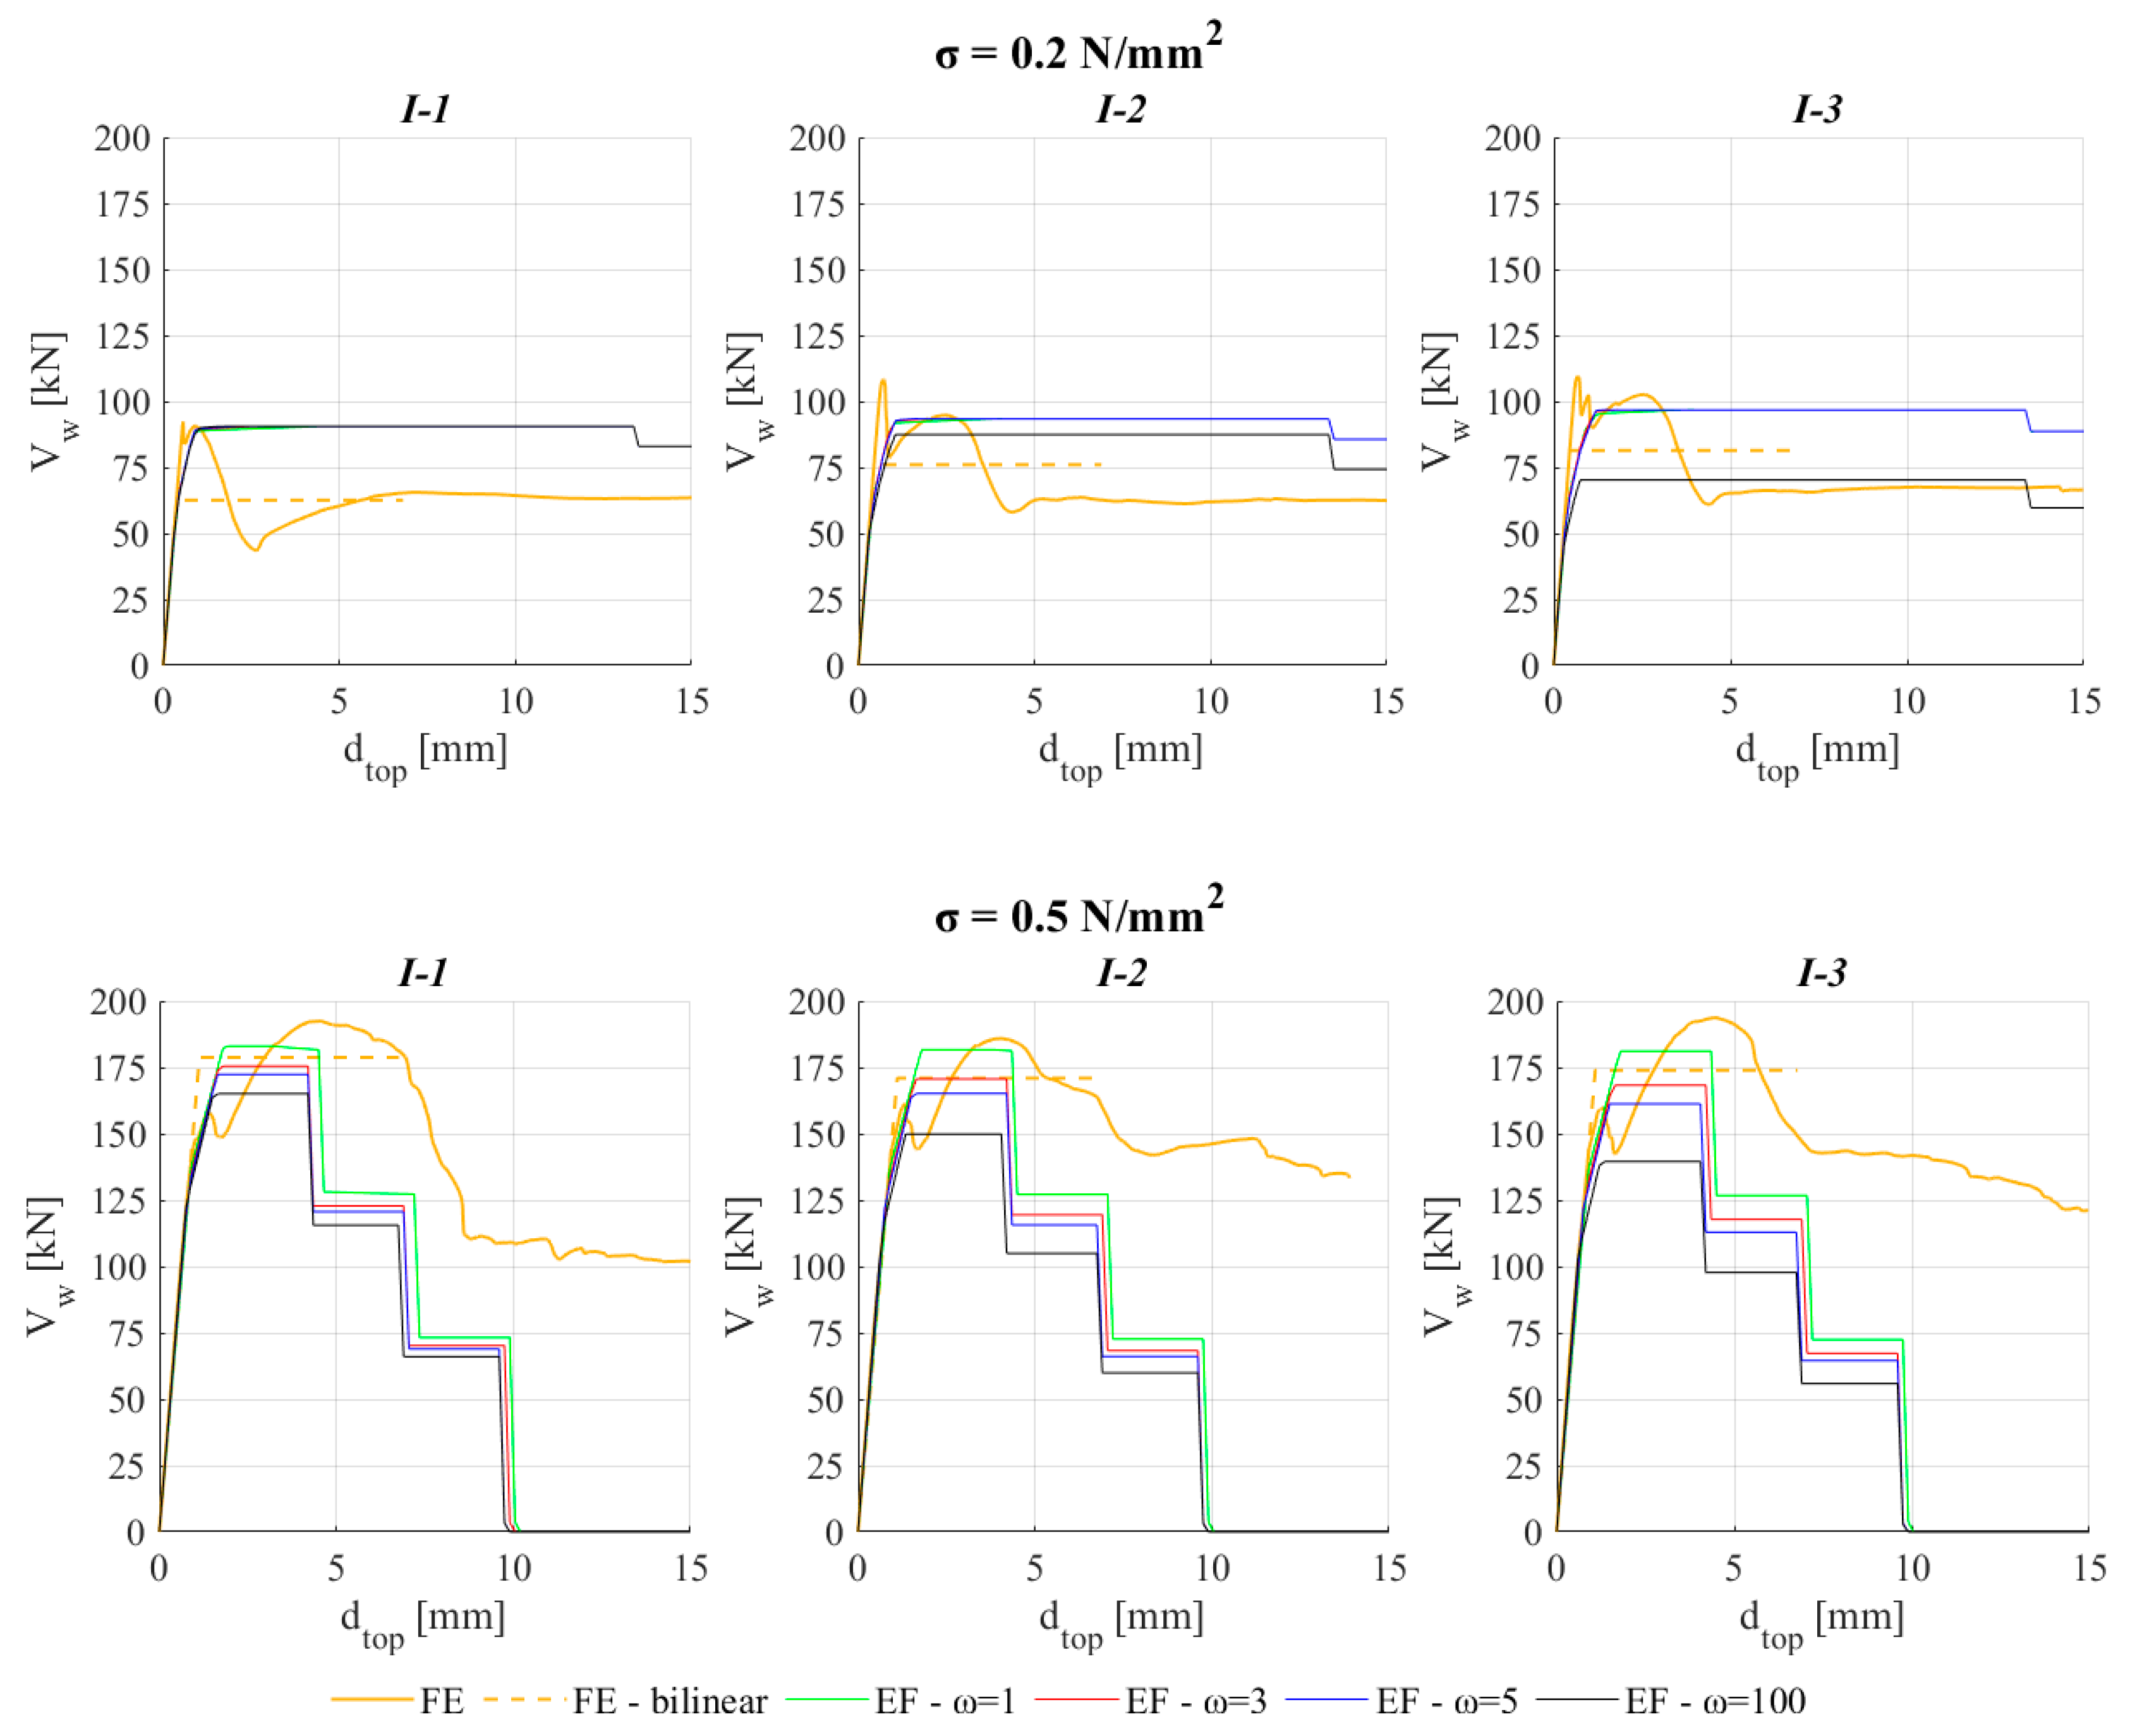
Figure 15 illustrates the base shear (
VW) versus horizontal top displacement (
dtop) curve varying the examined I-shaped systems and the assumed values of
ω; the base shear only refers, for both FE and EF models, to the contribution of the web. This figure aims to highlight the repercussions of the estimate of axial load on the strength capacity of the in-plane loaded pier. In the graphs, the dotted orange lines are the equivalent bilinear idealization of the pushover curve obtained by the FE model, just to also refer to a representation more similar to the one provided by the EF model. This idealized curve has been derived by evaluating the following: (i) the initial stiffness at a base shear equal to 0.7 times the maximum value; (ii) the equivalent yield base shear under the hypothesis of imposing the equivalence of the areas under the original curve and the equivalent bilinear, up to a displacement equal to the attainment of the ultimate drift of web (
dtop = 6.75 mm). As it is possible to observe, by using the value of
ω equal to 3 or 5, the strength capacity is also well captured, as a logical consequence of what is already discussed in
Section 3.
Figure 16, similarly to
Figure 13 and
Figure 14, illustrates the percentage error of the estimate of the base shear provided by the EF model computed with respect to the maximum base shear (a) or the equivalent yield base shear (b) of the FE model. Once again, the figure highlights that the adoption of the above-mentioned values for
ω allows for also reducing the error in the estimate of the shear strength capacity. Please consider that in the case of low values of the average compressive stress
σ, i.e., where the error is still significant regardless of the value adopted for
ω, the inconsistency is due to the fact that in the EF model the strength capacity is estimated as the minimum between the flexural and shear strength criterion while the results discussed in
Section 2 suggest that the presence of the flange may alter the occurrence of the pure flexural behavior.
Finally,
Figure 17 and
Figure 18 illustrate some results for the case of the T-shaped 3D assemblies. The format adopted is analogous to
Figure 12 and
Figure 13. The results substantially confirm what was already discussed in the case of the I-shaped system, although for the T-shaped one the influence on the
ω choice appears relevant only on the initial axial force estimate. Moreover, in this case, the reference value, which allows for the reproduction of the redistribution of the FE model, is between 3 and 5.
6. Application of the Formulation to Complex Systems
The strategy outlined in the previous sections has been implemented for the pushover analysis of two complex buildings with the aim of exemplifying how the proposed value of the parameter
ω is appropriate for the calibration of the flange effect in EF numerical models aimed to the seismic assessment of existing URM buildings. The case studies, namely the Pizzoli’s town hall and the former courthouse of Fabriano (
Figure 19), consist of two structures instrumented by a permanent accelerometric monitoring system [
52,
53], which were hit by the Central Italy 2016/17 earthquake. Very accurate data on the structural details and the actual seismic response were available for both buildings, which are dominated by a box-type behavior and characterized by a good wall-to-wall connection. The two-story Pizzoli’s town hall is made by cut stone with running bands in solid bricks and floors made by steel beams and hollow flat blocks with r.c. infill; moreover, r.c. ring beams are present at both levels. The four-story former courthouse of Fabriano presents an irregular plan; the walls are made of regular masonry of three different typologies (stone masonry, solid-brick masonry, and stone masonry with an external brick face, named as M1/M2/M3 in
Figure 19), while the horizontal diaphragms are of four typologies, which mostly combine H steel beams with various types of hollow brick elements and RC slabs. For both buildings, EF numerical models were available, previously developed by the authors through the Tremuri software [
34].
Figure 20 illustrates the equivalent frame idealization of some walls of both numerical models, where the equivalent beams connecting the piers with the flanges are also visible. The masonry panels where the nonlinear behavior is concentrated are the elements in orange (the piers, vertical elements) and green (the spandrels, horizontal masonry coupling beams), while the cyan portions correspond to rigid nodes. Further information is available in [
39,
54,
55] for the Pizzoli’s town hall and in [
38], for the former courthouse of Fabriano. In particular, an in-depth investigation of the various aleatory and epistemic uncertainties, which intrinsically may affect the numerical modeling and the validation of models against the available experimental data (i.e., ambient vibration measurements and recordings of real seismic events), has been carried out. Starting from these models, in this paper, the shear connections between intersecting piers are estimated by adopting the analytical approach presented in
Section 3 and by verifying the sensitivity of achievable results to different values of the parameter
ω. Of course, once the proper modeling of the flange effect is obtained, on the basis of the geometric and structural details of the 3D assemblies, a further refinement of the model calibration would be necessary to improve the structural dynamic identification, but this is out of the scopes of the paper.
Figure 21 and
Figure 22 illustrate the sensitivity of the dynamic properties of numerical models in terms of either error on the natural frequency estimate and Modal Assurance Criterion (MAC, [
56]), for the first five modes; for both comparisons, the target reference consists of the data available from the ambient vibration measurements carried out by the Department of Civil Protection once the monitoring system was installed and made available in previous research [
53]. It is worth recalling that values of MAC as close as possible to 1 indicate a good match between experimental and numerical data. In particular, the following values of
ω have been investigated:
The value 100, which has proven equivalent to the limit case of rigid link coupling elements or full vertical coupling (in fact, it has been verified that achieved results are analogous to this modeling option). This value may potentially be responsible for overestimating the flange effect;
The value of 5, which is the reference value proposed to be representative of a good wall-to-wall connection, on the basis of the results discussed at
Section 4;
The value of 1, which is assumed as the first tentative value for the case of a poor wall-to-wall connection;
The value of 0.1, which has been proven equivalent to the limit case of the full decoupling of intersecting elements (in fact it has been verified that a further decrease does not affect the results more).
As already mentioned, the actual structural details of the two buildings justify the adoption of a good wall-to-wall connection; thus, it is expected that the assumption of ω equal to 5 is the more reliable for these case studies. As a confirmation of that, this value is the one that minimizes the error and maximizes the MAC values. This is particularly evident for the former courthouse of Fabriano, for which moving away from 5 makes the results worsen significantly, both in terms not only of frequency errors but also of modal shapes. The Pizzoli’s case study appears less sensitive to ω at least in the elastic range; that emerges particularly from the check on modal shapes, which are almost insensitive to ω.
Figure 23 and
Figure 24 instead show the sensitivity to
ω in the case of nonlinear static analyses (pushover curves) carried out in X and Y directions, respectively, and by assuming a horizontal load pattern proportional to masses. It may be observed how the base shear strength capacity of Pizzoli’s case study is significantly affected by the degree of flange connection. The amount of variation in the results depends also on the specific architectural configuration of the buildings and on the role of piers mostly affected by the flange effect in equilibrating the external forces. To better investigate this issue and by referring to the Y direction,
Figure 25 shows the results of the case studies of Fabriano’s (a) and Pizzoli’s (b), respectively:
On the top, the variation on the axial force acting on the piers after the application of vertical loads in the cases in which ω is equal to 100 (in red) or 0.1 (in blue) measured with respect to the case of ω = 5;
On the bottom, the rate of the horizontal forces equilibrated by each pier (computed in correspondence of the maximum base shear of the pushover curve).
The results of
Figure 25 highlight how in the case of Pizzoli’s town hall the piers mostly affected by the axial force redistribution induced by the flange effect are also those carrying most of the shear forces.
7. Conclusions
Firstly, the interpretation of the results obtained on simple flanged systems by the FE approach allowed the demonstration that the failure domains employed for describing the maximum strength of in-plane loaded panels are still effective even if reference is made to the rectangular cross-section of the web. This is valid under the assumption to be able to correctly capture the vertical load redistribution between the web and the flanges and so to correctly estimate the axial load acting on the web panel. The results suggest that further investigations on the reliability of strength domains are only necessary in the case of low values of axial load and significant dimensions of the flange, since in these situations the rocking phenomenon in the web panel may be altered. In these cases, the maximum strength detected in the web panel does not follow the failure criterion referring to the flexural failure in the associated strength domain but is closer to the shear failure criterion. This suggests that only the criterion for shear failure should be considered if a compressed flange is present. However, this topic should be further investigated before a robust proposal for practice-oriented applications.
The above-mentioned outcomes have suggested the possibility of modeling the flange effect in EF models by connecting intersecting piers by an equivalent beam with a properly calibrated shear stiffness, to reproduce the correct vertical load redistribution and, consequently, the shear strength.
A practice-oriented analytical formulation has been proposed to evaluate the stiffness of the equivalent connecting beam, as a function of the geometric features of the web and the flanges of the 3D assembly of masonry piers. An extended parametric analysis has been performed to validate the effectiveness of the proposed formulation, through a comparison with accurate nonlinear FE analyses of different 3D assemblies. The dimensionless ω parameter is the key factor to correctly redistribute the vertical load, and the reference value equal to 5 may be used in all cases.
It is worth noting that the proposed formulation is aimed to calibrate the contribution of flanges connected to masonry panels (piers) that are in-plane loaded, in the case of a good interlocking between the intersecting piers. A rigid connection would overestimate the flange effect (when the flange is very big with respect to the web) while the proposed elastic stiffness of the equivalent beam can account for the contribution provided by the “so-called” effective width of the flange.
The sensitivity of the global response of masonry buildings to the quality of the wall-to-wall connection was also investigated since, in old masonry buildings, a bad or intermediate interlocking between intersecting piers is often present, since masonry walls are often of different types (i) or made at different times (ii) or already cracked (iii). Typical examples of (i) and (ii) consist of perimetral walls made of irregular masonry (e.g., by stone blocks) and internal walls of regular masonry (e.g., made by solid or hollow bricks). Instead, cracks typical of the case (iii) may be the consequence both of foundation settlements or damage induced by seismic events (in some cases also of low–moderate entity). To model this issue, the shear stiffness of the connecting equivalent beam should be reduced with respect to that provided by the proposed formulation. This may be obtained by introducing a second shear stiffness, in series with the one of Equation (3), or by properly reducing the dimensionless parameter ω. The preliminary investigations made in this paper suggest the adoption of a value equal to 1 for the case of intermediate–poor connections and 0.1 for simulating the condition of perfect decoupling.
The results here obtained allow us to provide some useful directions that could be considered in the EF models and towards which the future development of this research will be addressed. Parametric analyses have been performed on piers with symmetrical I-shaped cross-sections, but the piers included in a real masonry building may also have C-, L-, and T-shaped cross-sections; therefore, these situations should also be investigated to further confirm or extend these considerations.


