Article

An Experimental Study of the Applicability of the Outdoor Air Enthalpy Difference Method for Air Source Heat Pumps in Operation through In Situ Measurements

Hanil Mechanical & Electrical Consultants, Seoul 07271, Republic of Korea
*
Author to whom correspondence should be addressed.
Buildings 2023, 13(2), 448; https://doi.org/10.3390/buildings13020448
Submission received: 23 December 2022 / Revised: 19 January 2023 / Accepted: 2 February 2023 / Published: 6 February 2023
(This article belongs to the Special Issue Building Energy and Sustainability)

Abstract

:
This study aimed to evaluate the applicability of the outdoor air enthalpy difference method for air source heat pumps (ASHP) in operation through quantitative analysis using field tests. In this context, field measurements were performed on a single ASHP, and the results were compared with other in situ measurement methods. The main results are as follows. The analysis of the distribution of the discharge temperature of the outdoor unit suggested that the temperature between the hub and tip on the outlet of the outdoor unit can represent the discharge temperature, enabling further simplification of measurement procedures. The mean error of the average cooling capacity using the outdoor air enthalpy difference method was 8% compared to that of the in situ refrigerant enthalpy difference method. In summary, the in situ outdoor unit air enthalpy difference method may require additional measurements to increase reliability, but considering the advantage of relatively easy measurement, it is considered suitable for short-term in situ diagnosis of ASHP performance.

1. Introduction

Low-carbon green growth has attracted attention in the field of architecture in the Republic of Korea [1]. Particularly, green remodeling is recognized as a key technology to reducing building energy consumption [2]. A total of 97% of domestic buildings are small- and medium-sized with a total floor area of 3000 m2 or less, and a considerable number of buildings are old that require an improvement in energy performance [3,4]. Such old buildings mainly use air-source heat pumps (ASHP) as a cooling system [5]. Specifically, it is evident that ASHP must be managed for building energy efficiency. However, in the domestic diagnosis process, ASHP performance evaluation depends on the qualitative evaluation of field investigators and there is no clear measurement method to use in the field [6,7,8]. Hence, we paid attention to the field measurement of ASHP as the first step toward the possible field audit of HVAC systems.
In building energy audits, the rated coefficient of performance (COP) or the performance curve provided by the manufacturer is used for ASHP performance [9]. However, in actual buildings, the performance of ASHP in operation is different from the rated performance [10], and errors of 11 to 24% were confirmed for heaters in a study by Michael, in 2021, in the heating period [11]. The simplest method to identify the operation performance of ASHP is to use the monitoring data of the sensor embedded in it. This method is widely used, including in ASHP failure diagnosis through the application of statistical or machine learning techniques [12,13,14,15,16]. However, to use this method it is necessary to acquire long-term data using a separate monitoring system. Since it is difficult to obtain past data from old buildings and a building energy audit is performed over a short period of less than 1 week, the monitoring-based methodology is difficult to apply in the field.
Because of this, various studies were conducted to measure the performance of ASHP in the field. Theoretically, the performance of ASHP can be evaluated by measuring the air enthalpy difference between the indoor and outdoor units or the enthalpy difference of the refrigerant. In Korea, the air enthalpy method is mainly used for field measurements of ASHP. Won, in 2009, presented the air volume distribution characteristics at the inlet and outlet of the indoor unit using the multi-point measurement method in the PAC performance test [17]. Han, in 2013, and Cho, in 2005, measured the air enthalpy difference by installing a temperature and humidity logger at the center of the inlet and outlet of each indoor unit for a multi-heat pump system [18,19].
Many constraints persist when measuring the air temperature and air volume in buildings under unsteady conditions. Thus, overseas studies were actively conducted on measurement methods in the refrigerant cycle. Zhang, in 2019, proposed an in situ measurement method in the refrigerant cycle and confirmed an error of 15% and 13% in the cooling and heating capacities, respectively, compared to the values measured using the air enthalpy method in a laboratory [20]. Xiao, in 2022, proposed an improved in situ measurement method to respond to the two-phase suction condition of the refrigerant and confirmed an error of 15 to 18% compared to that of the air enthalpy method in a laboratory [21]. Tran, in 2012, 2013, and 2021, also performed an in situ measurement experiment based on the energy balance in the compressor and confirmed an accuracy of 4 to 10% compared to that of the air enthalpy method [22,23,24]. Methods for in situ measurements of ASHP have been developed, but the examination cases that considered accessibility to short-term measurements are still insufficient.
As such, we conducted field tests using the conventional refrigerant measurement method in our previous study (2022), and only partial-load performance in some measurement environments could be confirmed in buildings in operation despite the complexity of measurement. Additionally, there were limitations in performing measurements for more than a day when ASHP was installed outside the building [8]. The consideration of these constraints revealed that it is necessary to examine a universal measurement method rather than focusing on increasing accuracy for applicability to the actual audit process.
In this study, for the activation of in situ diagnosis of ASHP, which is the main energy consumption factor in small- and medium-sized buildings, the applicability of the conventional in situ measurement method in the actual building energy audit process was analyzed to propose a measurement method suitable for the field. For this, measurement variables were simplified considering various constraints in the field, and the accuracy of the three measurement methods was quantitatively analyzed.

2. Methods and Procedure

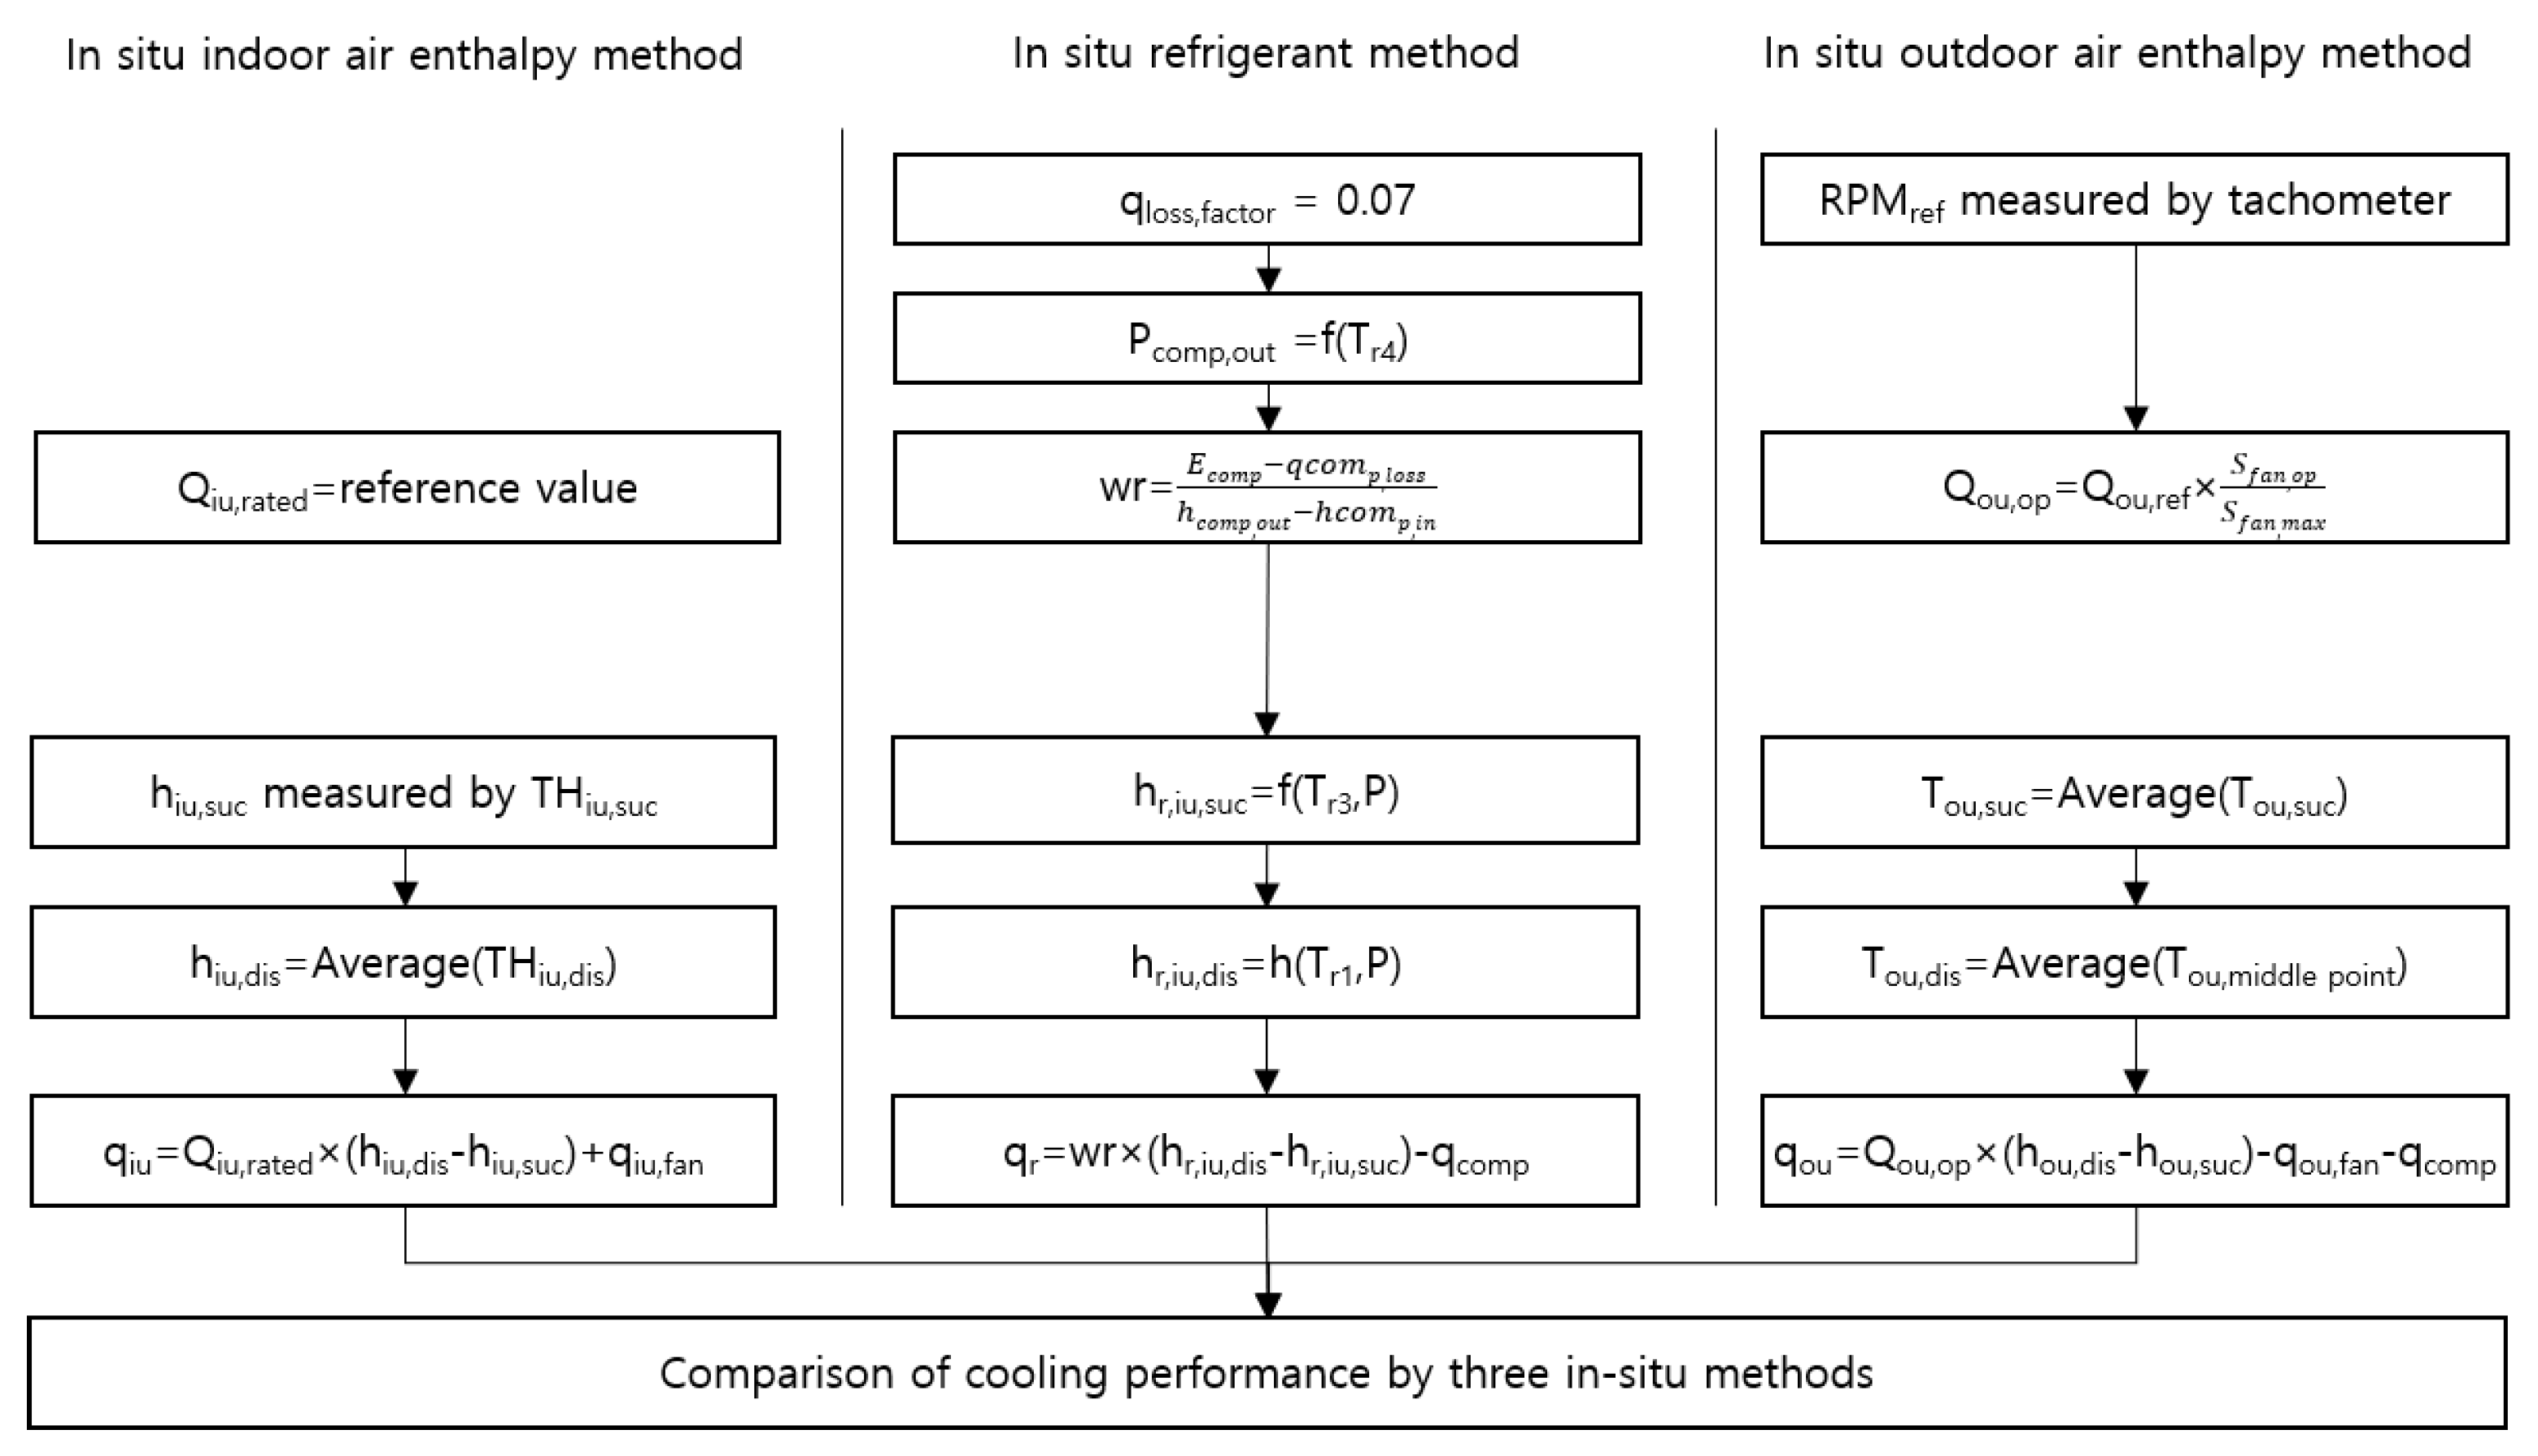
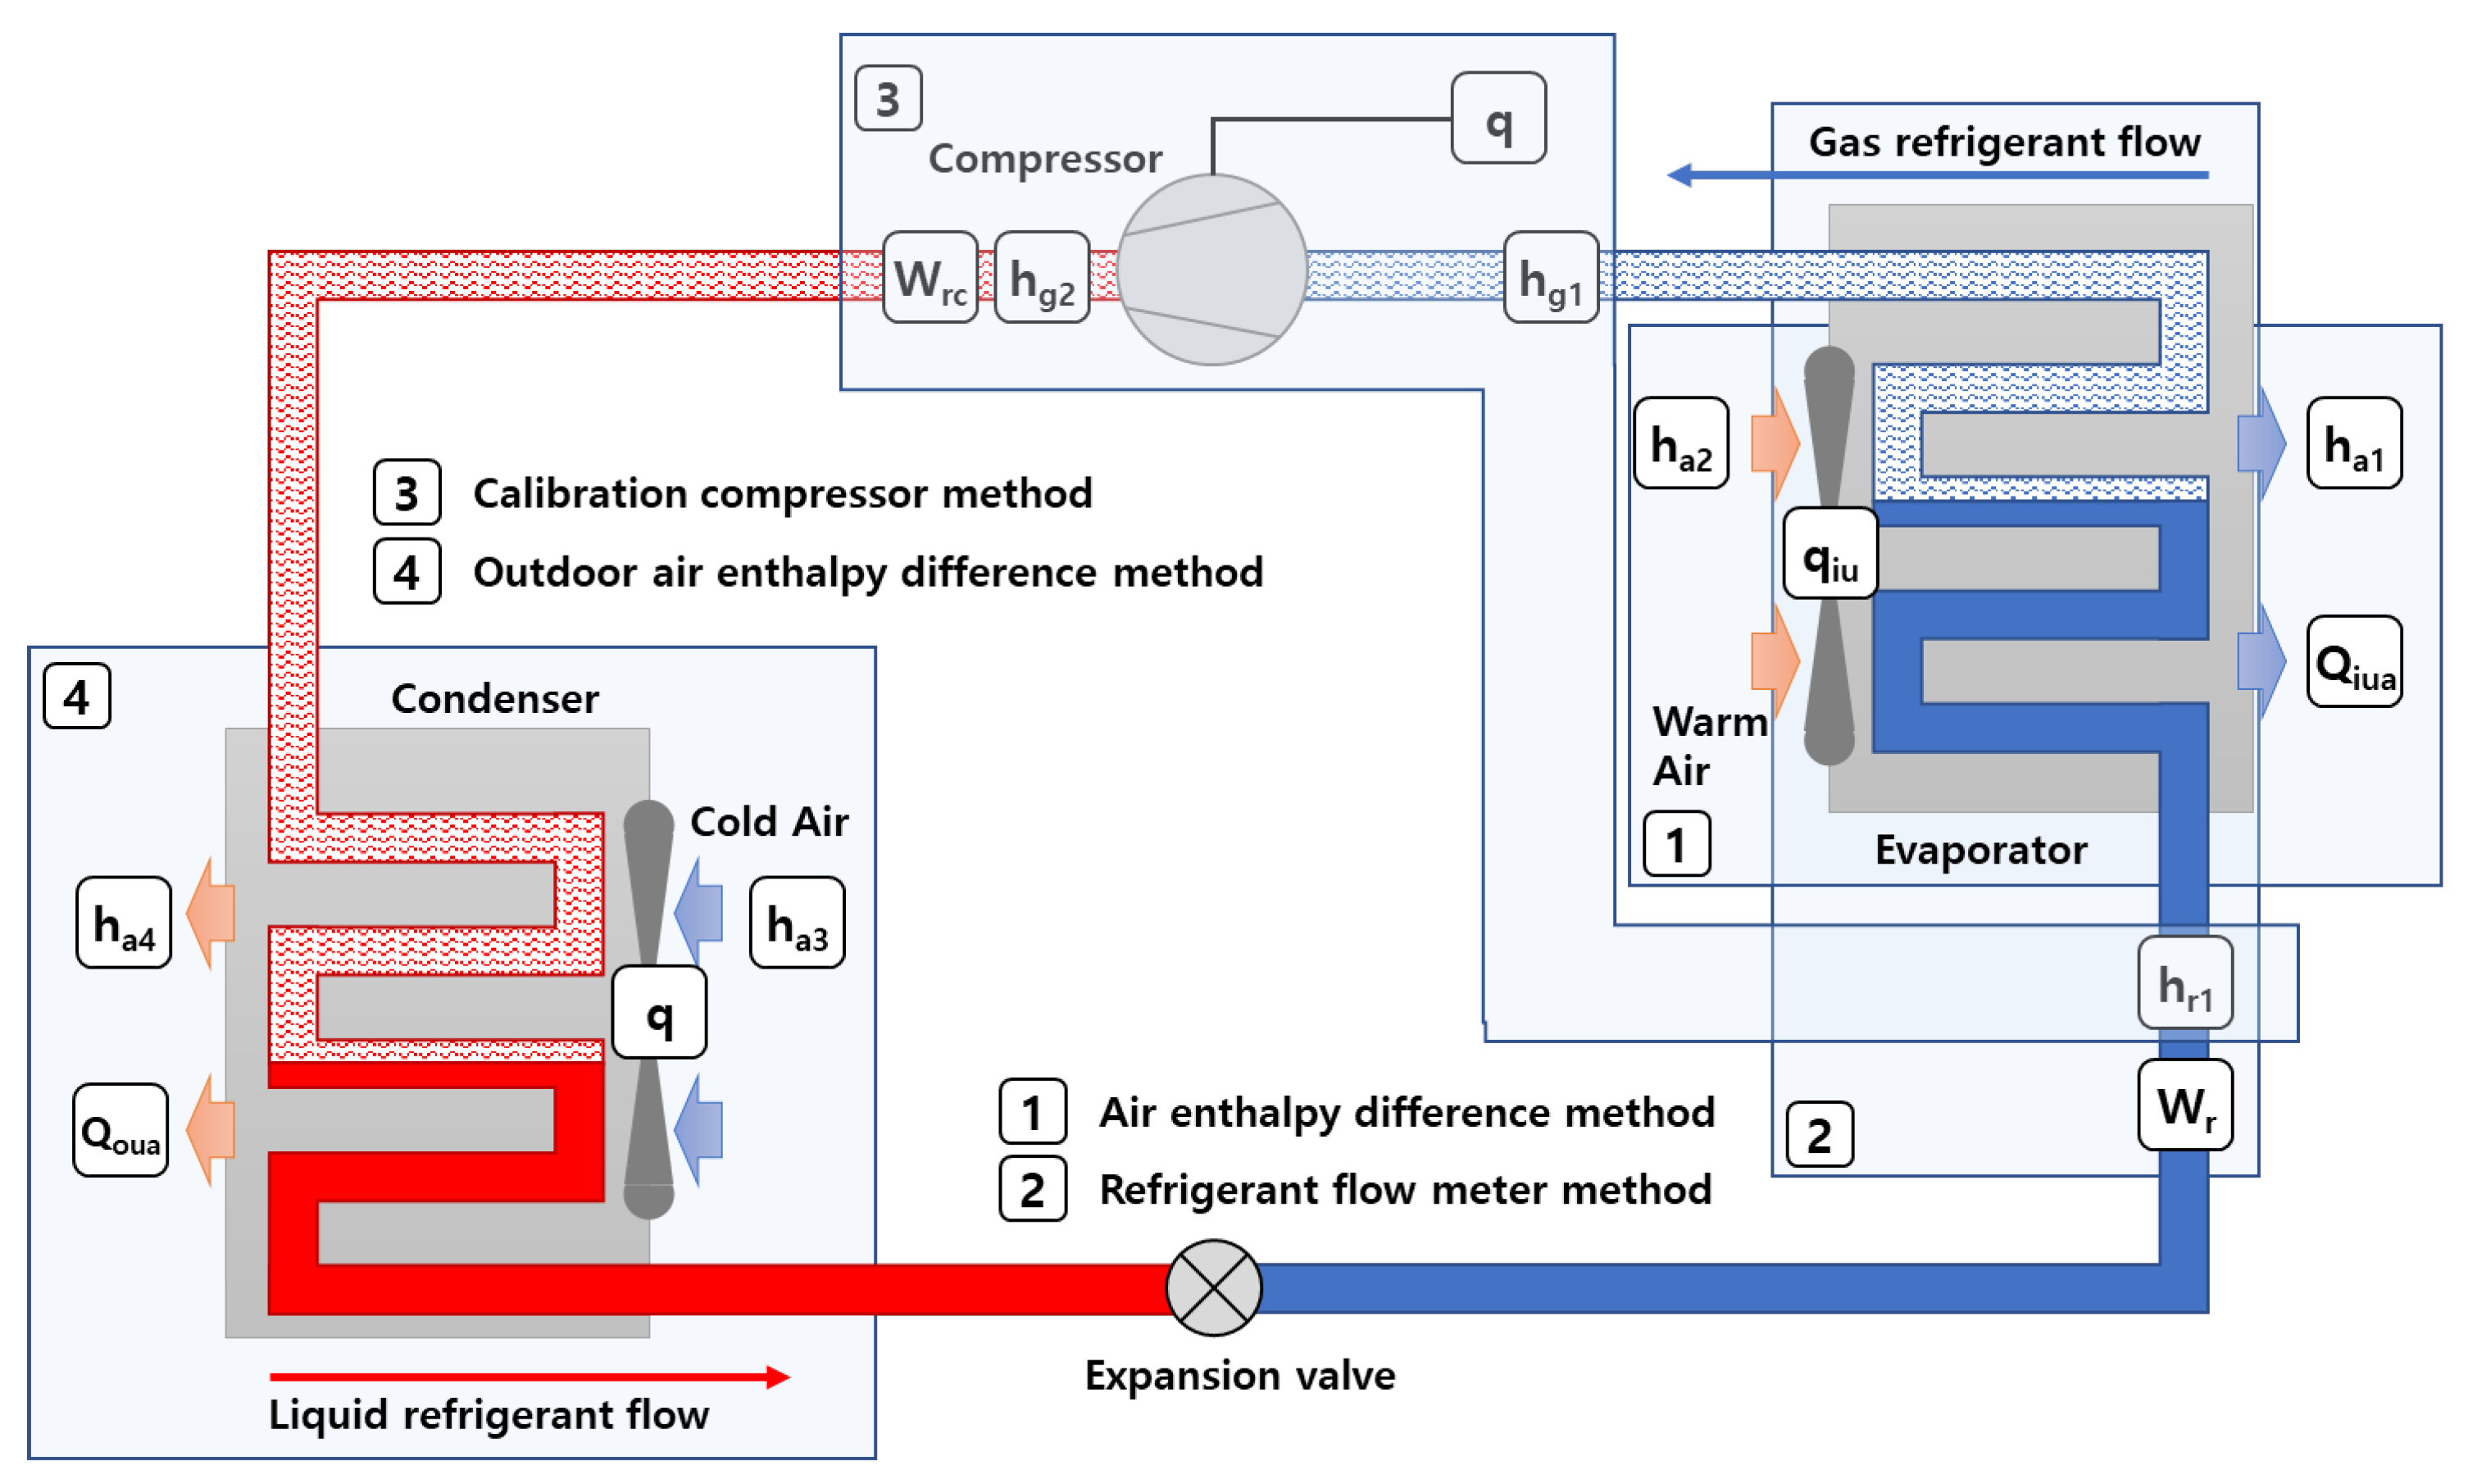
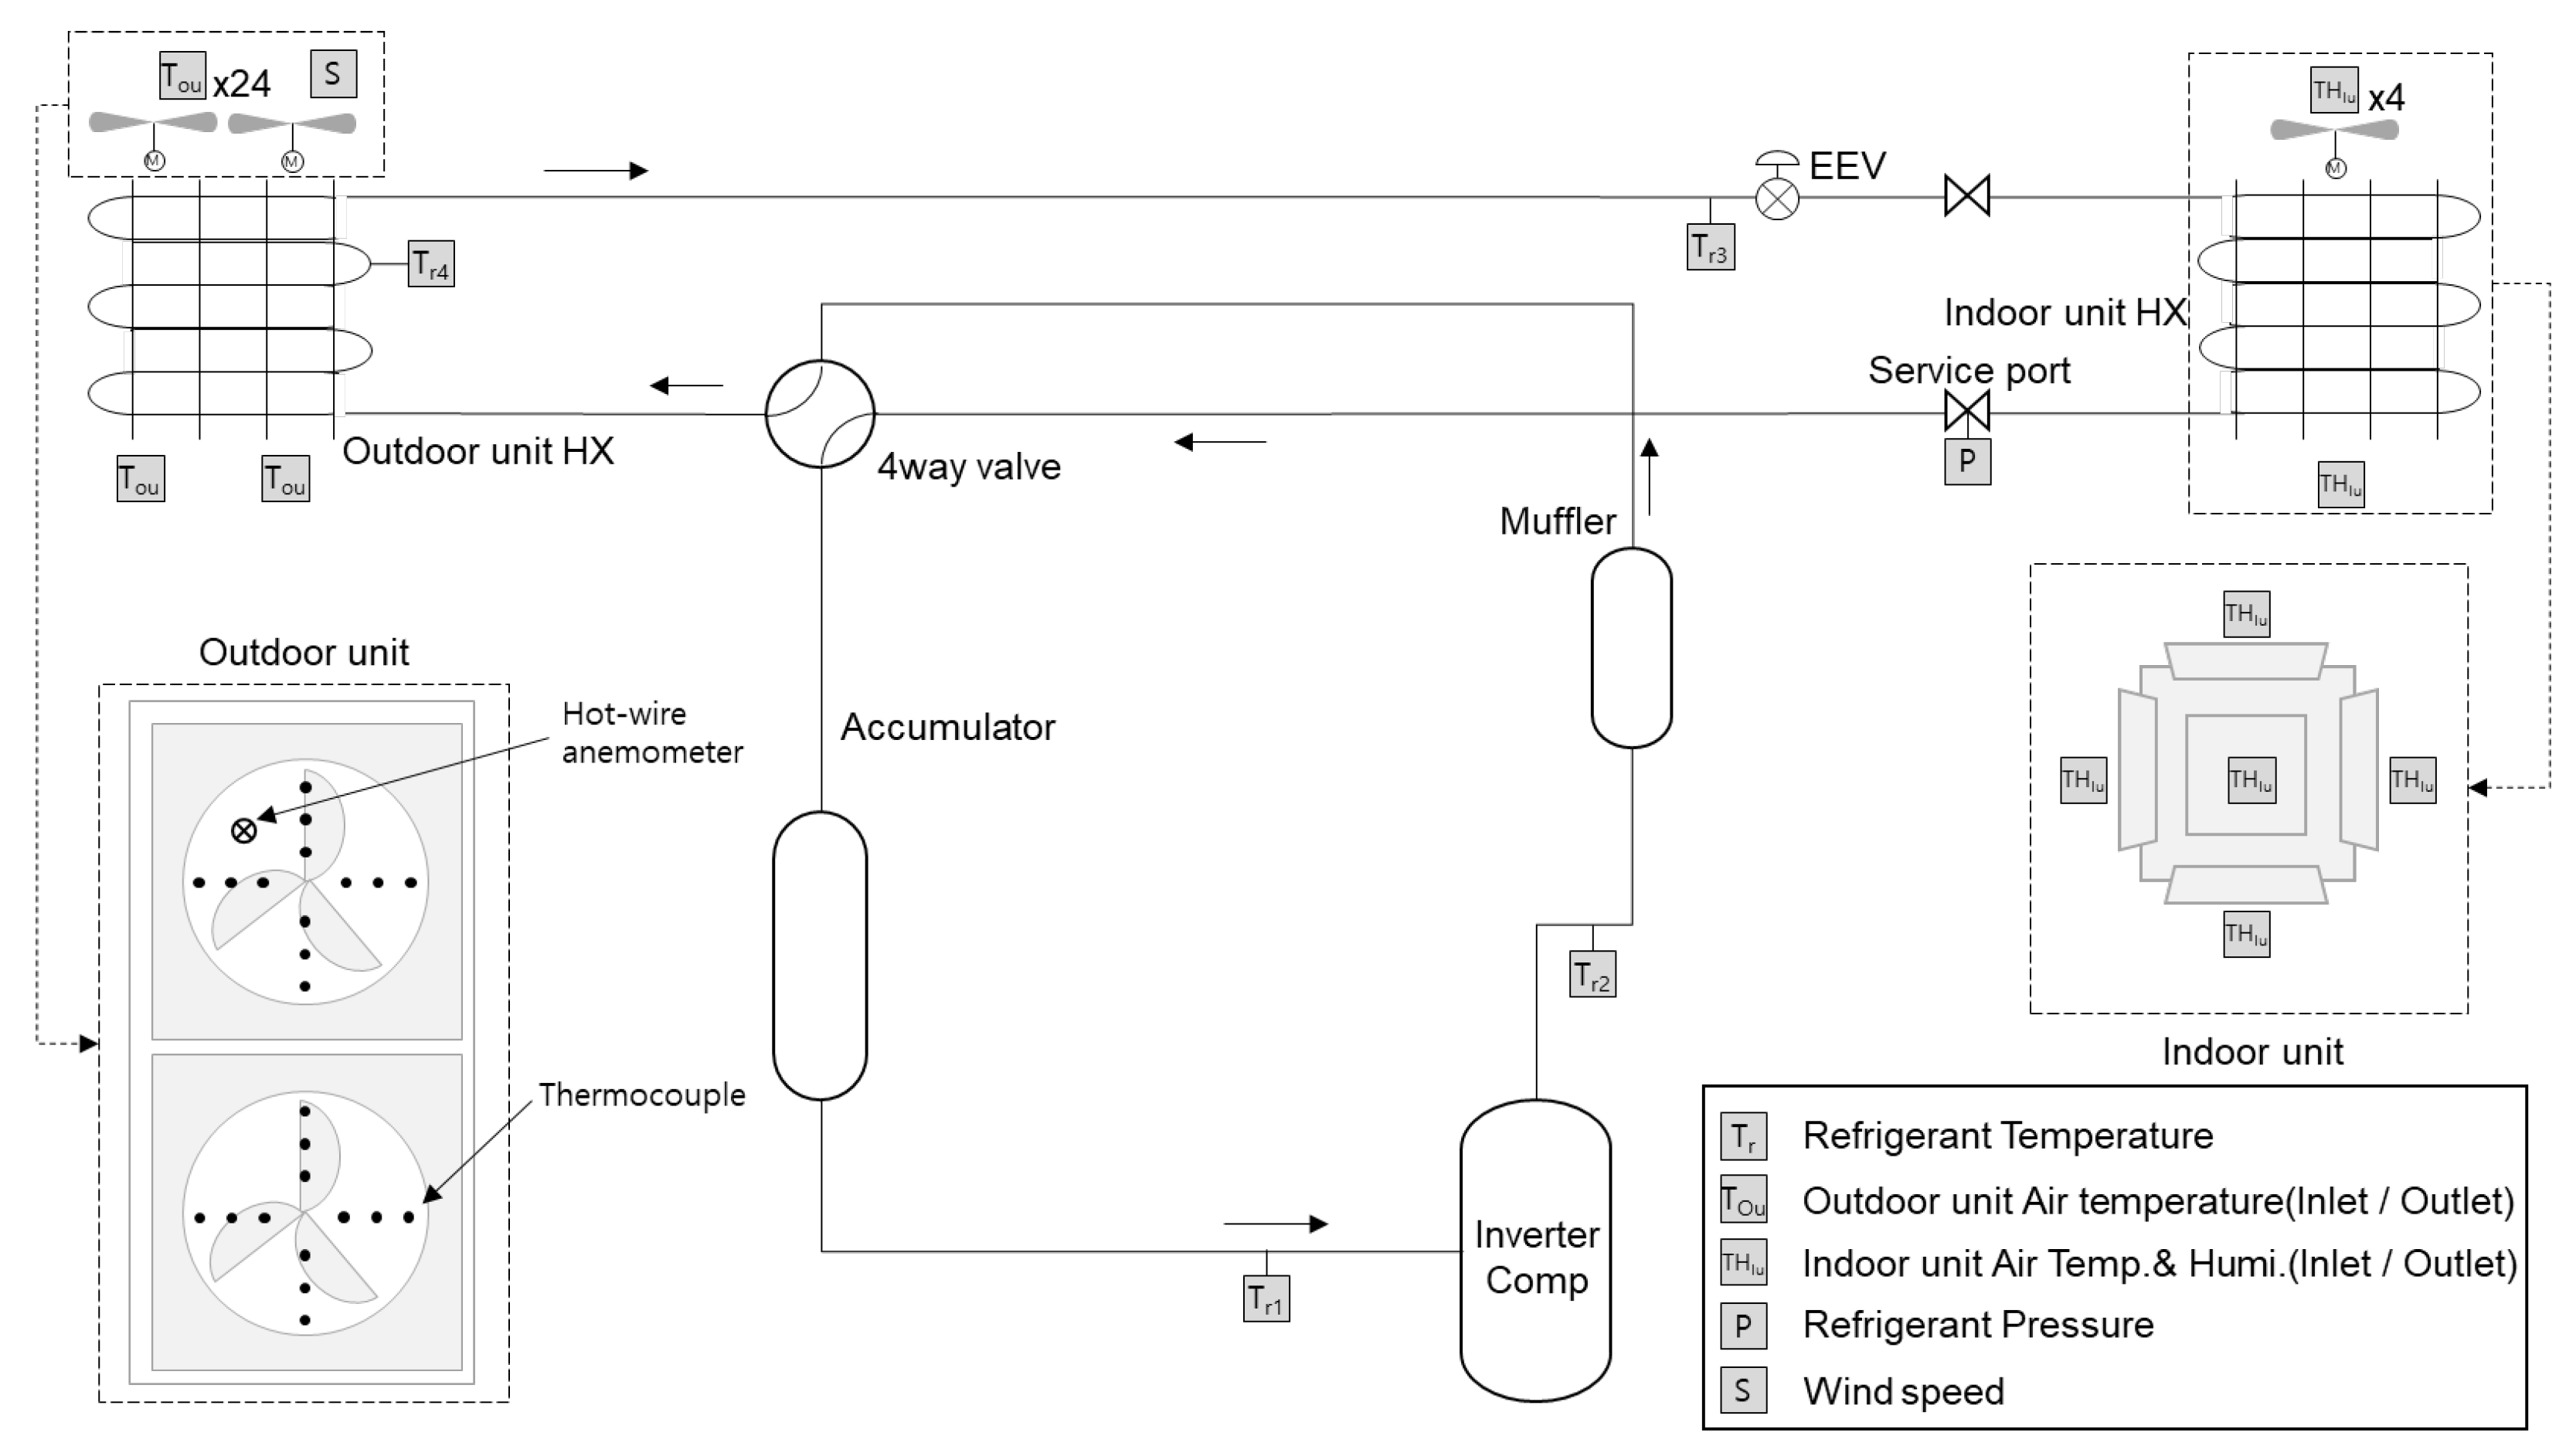
2.1. Reference Measurement Method of ASHP Cooling Capacity

As shown in Figure 1, the performance of ASHP can be measured through either the air or refrigerant enthalpy difference methods [25]. Generally, the cooling capacity is evaluated using an air enthalpy difference method for indoor units. However, this method has limits in measuring the cooling capacity simultaneously when there are multiple indoor units, so a method to measure the heat released by the outdoor unit has also been proposed [26]. The cooling performance of the indoor and outdoor units can be calculated using Equations (1) and (2), respectively.
qcooling,iu = (ha1 − ha2) × Qa,iu + qiu
qcooling,ou = (ha3 − ha4) × Qa,ou − qou
The refrigerant enthalpy difference method is defined by the difference in refrigerant enthalpy at the inlet and outlet of the indoor unit, and the refrigerant mass flow rate can be either directly measured or calculated. Because the uncertainty of the flow rate increases depending on the refrigerant’s quality, the refrigerant’s quality must be examined during measurement [27]. The degree of superheat is set as an indicator for determining the condition of the refrigerant. In the refrigerant enthalpy difference method, the cooling capacity is calculated using Equation (3).
qcooling,r = wr × (hr2 − hr1) − qc

2.2. Experimental Procedure

Experiments were conducted according to the methods mentioned in previous studies [8,17,23], including the in situ indoor air enthalpy, in situ refrigerant, and in situ outdoor air enthalpy methods. The average value of multi-point measurement was used as the air temperature of the indoor and outdoor units, and airflow rates that were difficult to measure directly were derived referring to the rated performance. Unlike in the laboratory, the flow rate of the refrigerant cannot be directly measured in the field; therefore, a method for estimating the flow rate of the refrigerant is needed. Generally, the refrigerant flow rate is calculated using the relevant variables, according to Equation (4).
wr = (Ecomp − qcomp,loss)/(hr4 − hr3)
An important variable in this calculation is compressor heat loss, consisting of convective and radiative heat loss [28]. Previous studies have suggested two ways to determine heat loss: direct measurement or defining it as a constant. The direct measurement method measures the surface temperature of the compressor and the ambient air temperature [20,24]. Another method consists of referring to compressor power consumption. A previous study confirmed that the compressor heat loss was 3–10% of the power consumption, and even if the heat loss changed up to 50%, it did not significantly affect the flow rate calculation [29]. In general, in ASHP, the compressor is wrapped with insulation to increase the compression efficiency, which can be a factor of error in the direct measurement because the thermal performance of the insulator is often unknown. Therefore, in this experiment, the heat loss rate was defined as a constant of 7% based on the results of previous studies to ensure field responsiveness.
Tests according to each method were conducted simultaneously, and two in situ air enthalpy difference methods were compared with the in situ refrigerant enthalpy difference method, which is considered to be relatively accurate. The calculation procedure for each measurement method is shown in Figure 2.

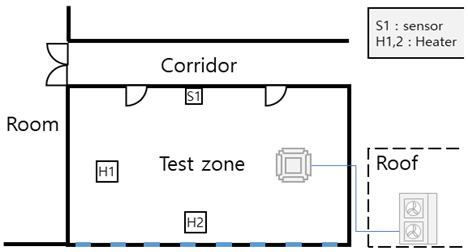
2.3. Overview of the Experiment
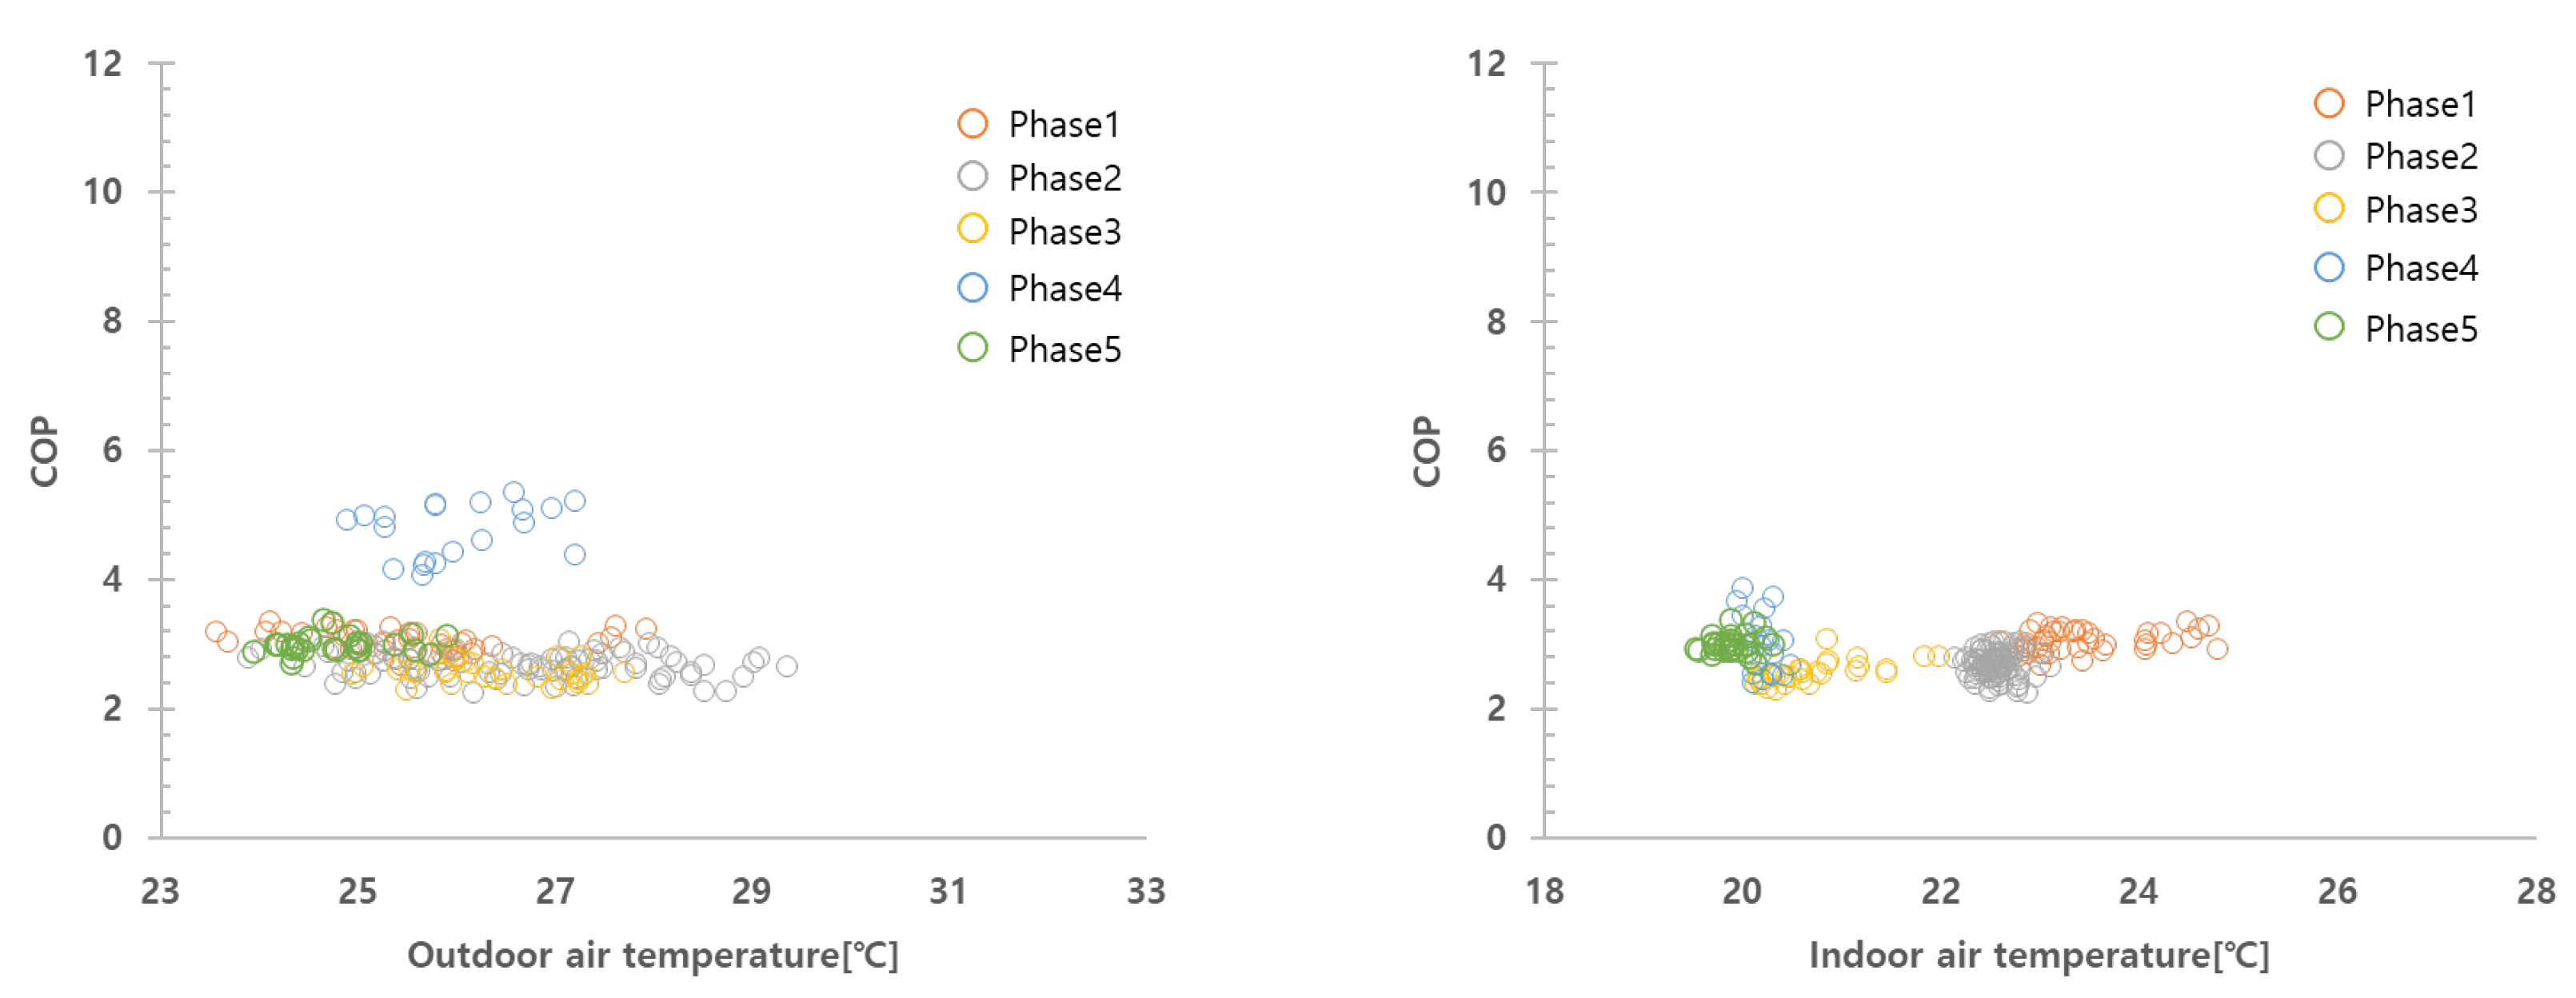
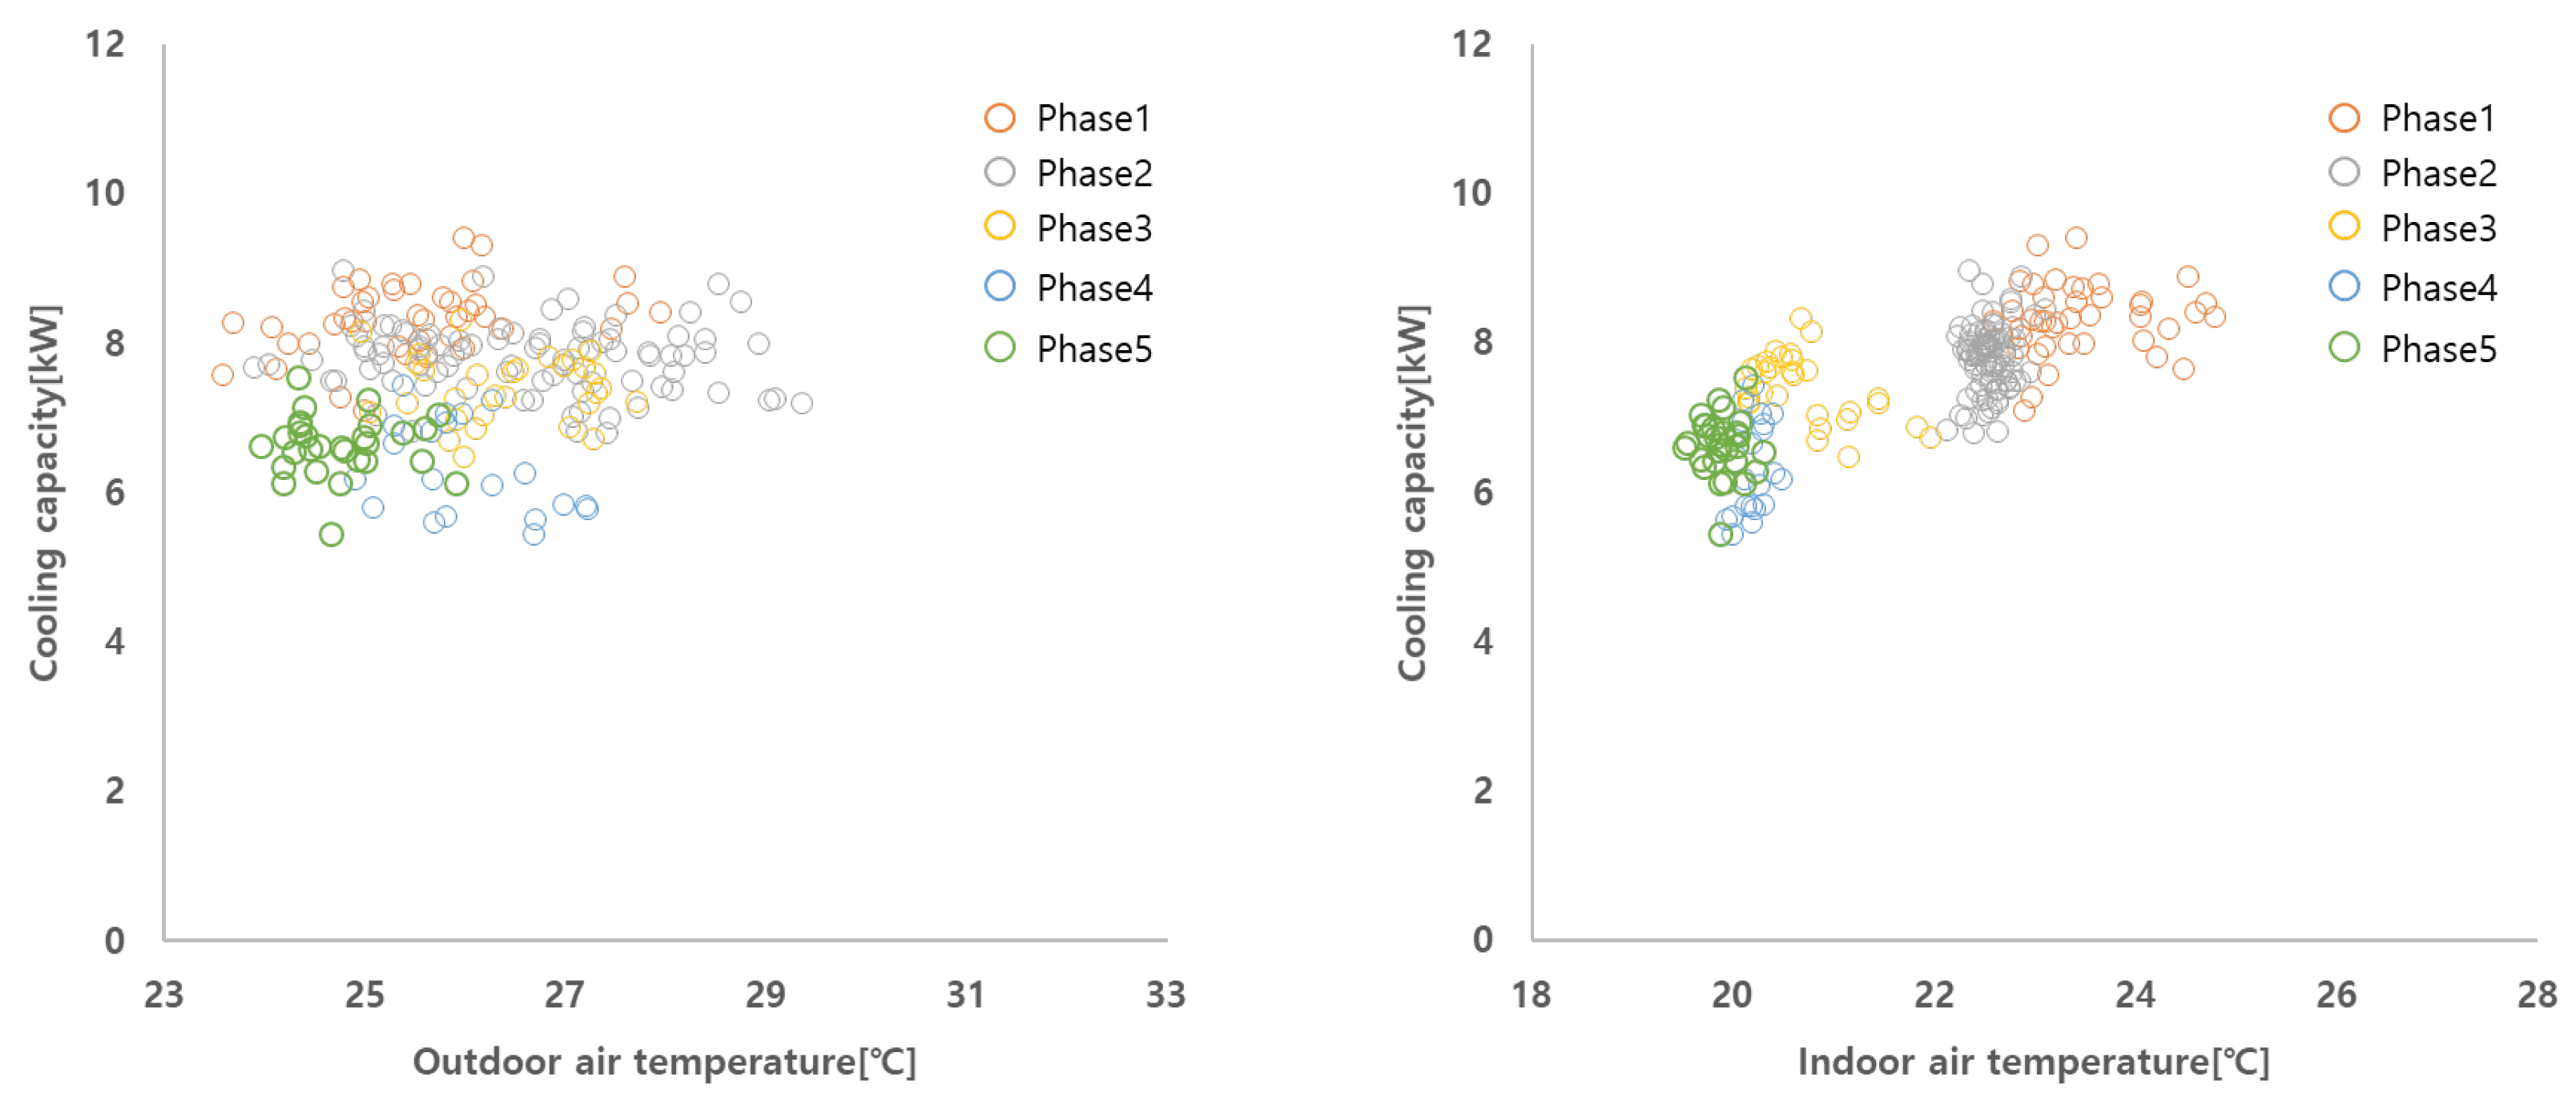
The experiment was conducted on an ASHP installed in a meeting room of a public building located in Gyeonggi-do, Republic of Korea. The installed ASHP consisted of a 4-way ceiling-mounted indoor unit and an inverter outdoor unit, with a rated cooling capacity of 7.2 kW (Table 1). The lifespan of the outdoor unit installed on the roof was only 2 years; hence, no performance degradation due to aging was considered. Because on-site audit is mainly aimed at evaluating passive performance, it often occurs in an intermediary period of the entire schedule The experiment was also performed on 21 September 2022 when the external load was not large, and it was limited to the cooling mode of ASHP. Therefore, to generate an appropriate cooling load, two electric heaters with a capacity of 3 kW were used as internal heating elements. Both electric heaters were operated at the beginning of the experiment, and one was then turned off in the middle of the experiment to check the effect of partial load. Considering the outdoor temperature, the indoor temperature was set at 22 °C, and the data from 13:20 to 16:50, when the indoor temperature was lower than the outdoor air temperature, was used for analysis (Figure 3). The average temperature difference between indoors and outdoors during the measurement period was 2.4 °C, lower than the test standard of 8 °C (Table 2). To evaluate the accuracy of the measurement results, the cooling load of the test zone was estimated through simulation.
Design documents were referred to for the U-value among the input conditions, and field measurements were used for internal heating elements, SHGC, and infiltration. The analysis results showed that the reference cooling load is 7.2 kW. Table 1 shows the input conditions.
Figure 4 shows the location of the sensors installed for the measurement of the cooling capacity. To measure the air enthalpy in the indoor unit, a total of five temperature and humidity sensors were installed at each inlet and outlet. In the case of the outdoor unit, the intake and discharge air temperatures were measured at multiple points using a T thermocouple, because the discharge temperature distribution is known to be inaccurate. The intake air temperature was measured at a single point, while the discharge air temperature was measured at 12 points per fan from the center point of the circular blower. When applying the in situ refrigerant enthalpy method, temperature sensors were installed before and after the compressor and before the expansion valve. The pressure of the refrigerant cycle was measured by installing a pressure sensor in the service port. In this experiment, the compressor suction pressure was defined as the pressure measured at the service port of the gas pipe. In the target system, the service port of the liquid pipe was located behind the electronic expansion valve, making it difficult to use it as a measuring point. Therefore, the compressor discharge pressure was calculated using the temperature measured in the outdoor unit heat exchanger. The accuracy of the sensor used in the experiment is shown in Table 3.

3. Results

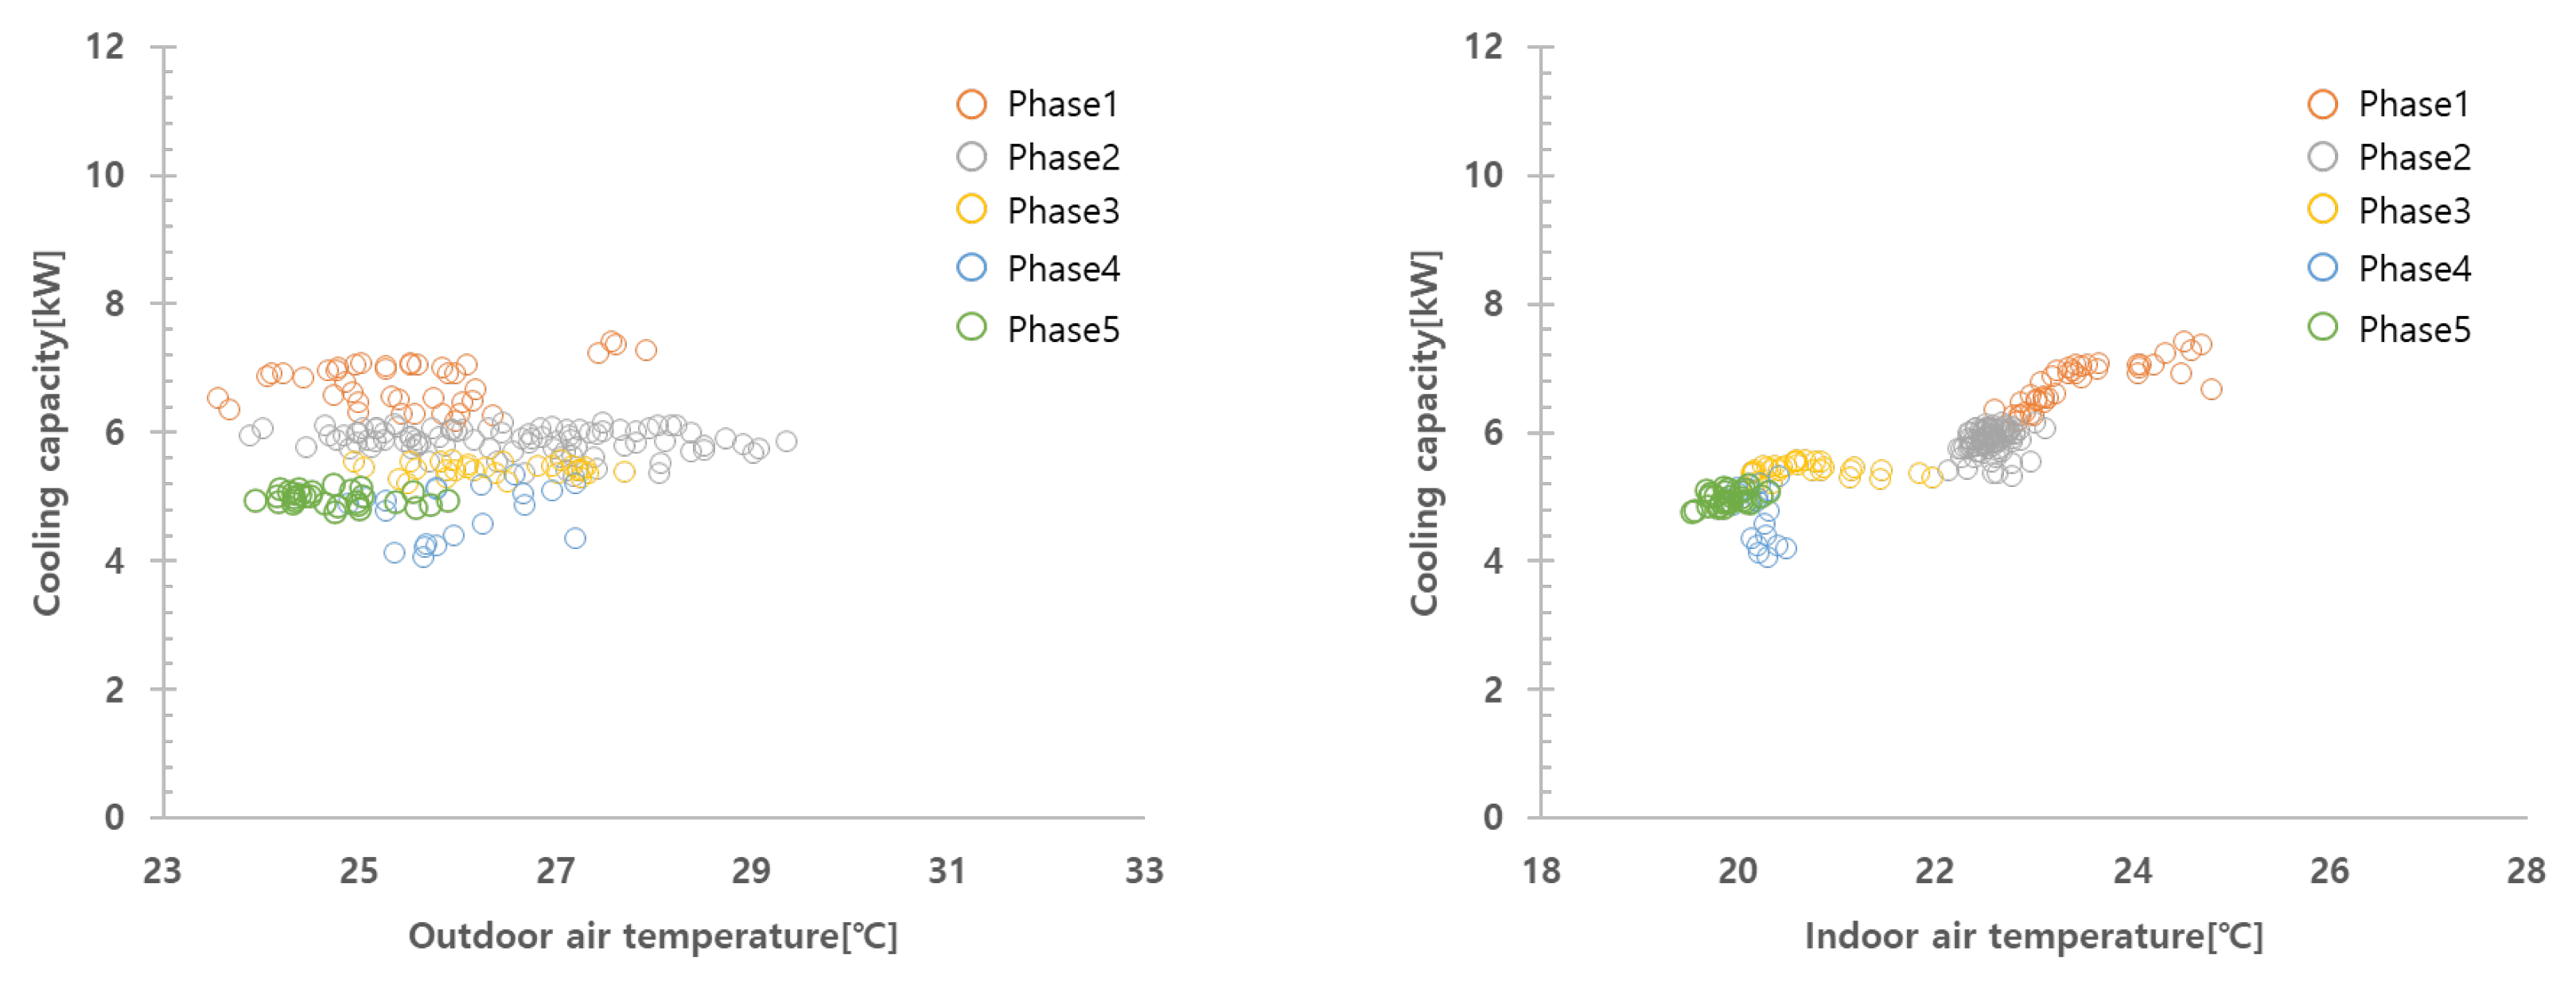
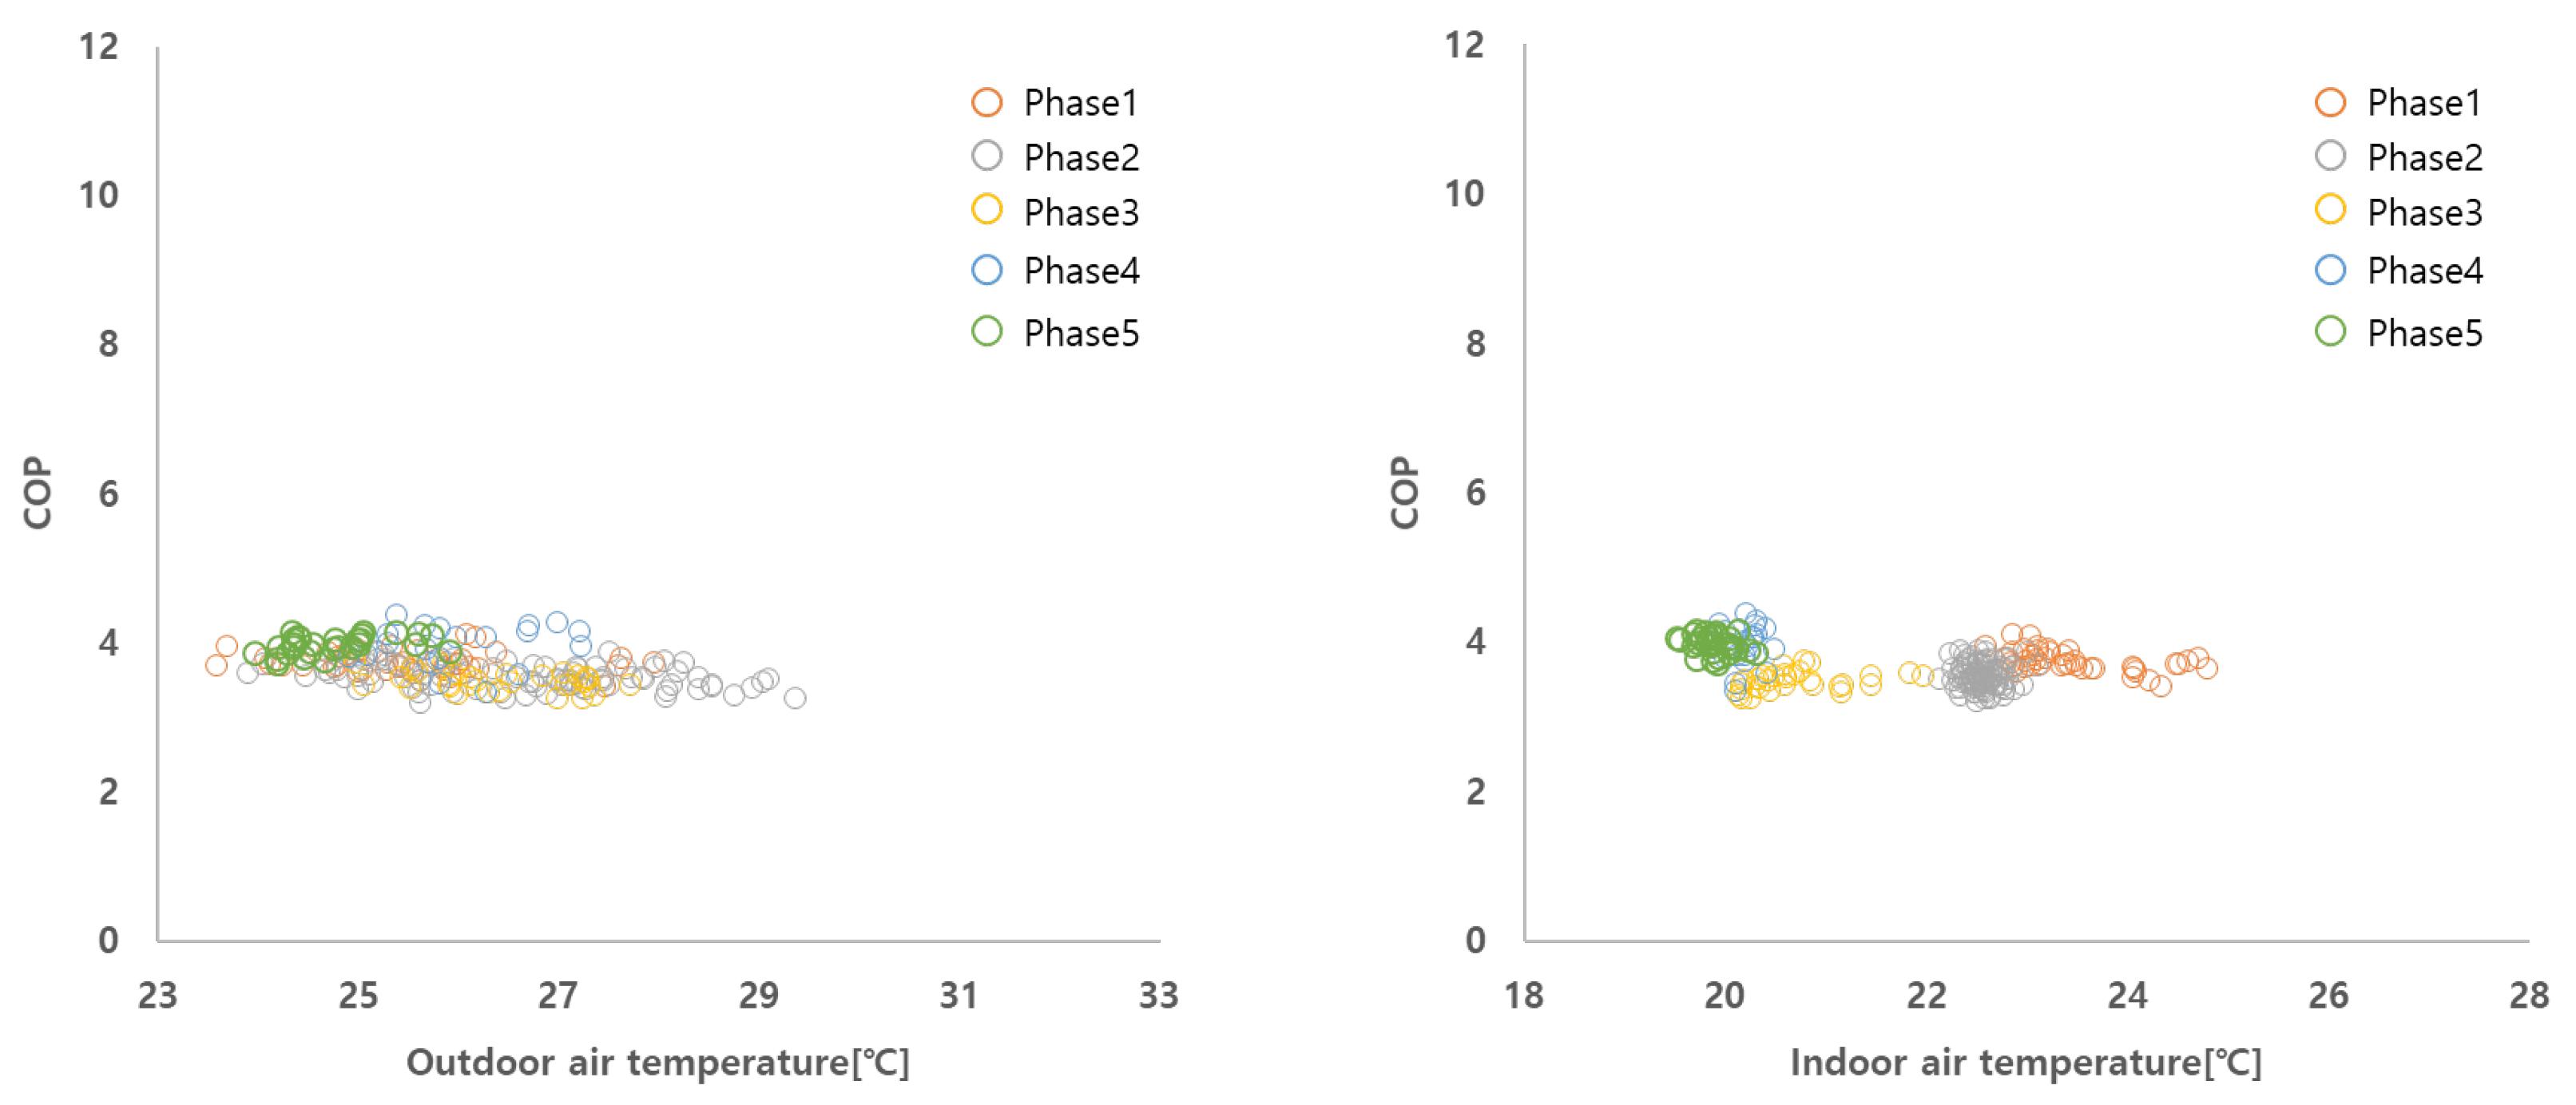
3.1. Cooling Performance Measured by In Situ Indoor Unit Air Enthalpy Difference Method

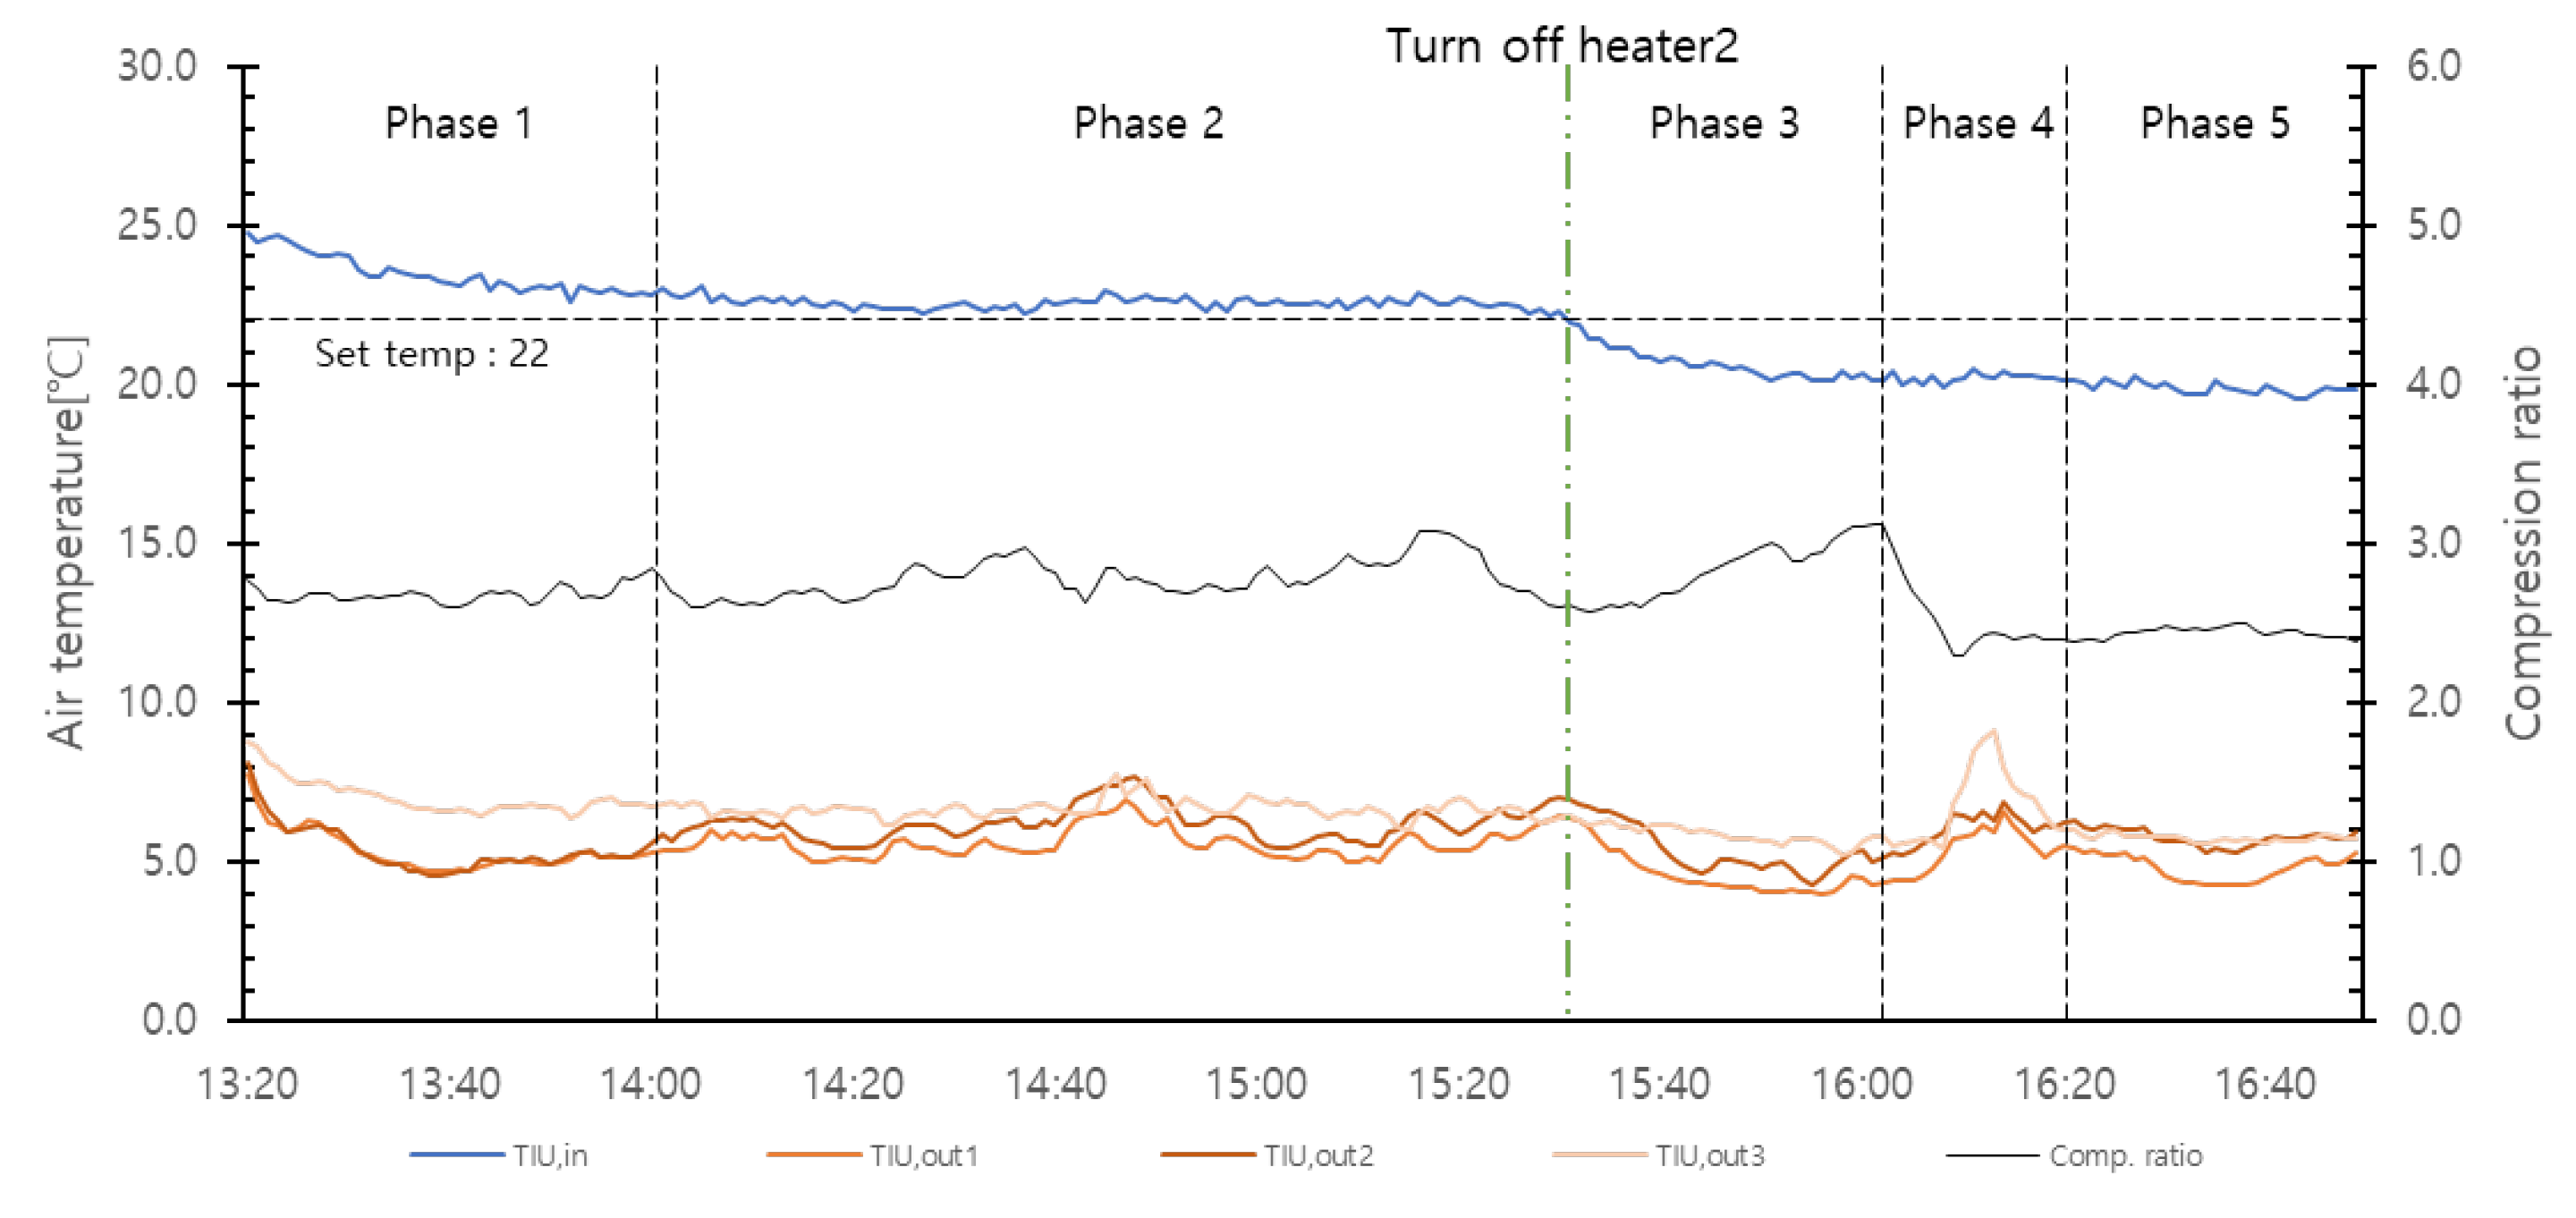
3.1.1. Analysis of Measuring Variable

To simplify the measurement procedure, the indoor unit airflow rate was fixed during the experiment, and the design air flow rate described in the design specification was applied. The amount of heat absorption of the indoor unit must be defined to calculate the cooling capacity, which is generally represented by the power consumption of the blower calculated by the following law of similarity using the air flow rate defined above. Table 4 shows the set air flow rate and power consumption of the indoor unit blower.
Eiu,fan = Eiu,rated × (Qiu,op/Qiu,rated)3
The air temperature difference in the indoor unit was measured using sensors installed at the center points of the inlets and outlet, among which data from three points (excluding one point where data was lost during measurement) was used for analysis.
The status of the cooling operation was divided into five phases based on the intake temperature of the indoor unit and the compression ratio of the compressor(Figure 5). Phase 1 was the initial operation step, in which the temperature dropped to the set temperature of 22 °C and the temperature difference between the outlet points was relatively large. Phase 2 was the stabilization step of the room temperature to be maintained at the set temperature, in which the temperature at each outlet point exhibited little difference. Phases 3 and 4 were the sections for load fluctuation; as the internal load decreased, the compression ratio of the compressor decreased, and the discharge temperature fluctuation increased. Subsequently, it stabilized again (Phase 5), wherein the intake temperature was maintained at 20 °C (lower than the set temperature). The temperature difference between the outlet points in this phase was approximately 1 °C, which is not small, considering the outlet temperature. Therefore, measuring the temperature of each outlet to increase the reliability of in situ measurements is considered necessary.

3.1.2. Analysis of Cooling Performance

Based on the measured physical values, the cooling capacity of ASHP and COP were calculated using Equations (6) and (7). Indoor and outdoor temperatures are the main variables that determine the control and operation performance of ASHP. Therefore, changes in cooling capacity and COP were analyzed based on the outdoor and indoor unit intake temperatures.
qcooling,iu = (hiu,dis − hiu,suc) × Q,iu + qiu,fan
COPiu = qcooling,iu/Etotal
Examining the distribution of cooling capacity according to the indoor and outdoor temperatures during the operation period, the capacity of measured ASHP did not have a significant effect on the outdoor air temperature, but it varied linearly according to the intake temperature of the indoor unit. However, when it was converted into COP, COP was found to be similar in all phases regardless of the change in the intake temperature of the indoor unit. In addition, COP tended to decrease as the outdoor temperature decreased (Figure 6 and Figure 7).
The cooling capacity calculation results showed that the cooling capacity in the stabilization sections (Phases 2, 5) was clustered without a large error. The cooling capacity of Phase 2 was approximately 5.9 kW, which was 18% lower than the cooling load. In Phase 5, the cooling capacity of ASHP decreased by 0.9 kW while that of the cooling load decreased by 2.78 kW, and the indoor temperature was found to be approximately 2 °C lower because more cold energy was supplied than the required cooling load.

3.2. Cooling Performance Calculated by In situ Refrigerant Enthalpy Difference Method

Based on the measured physical values, the cooling capacity of ASHP and COP were calculated using Equations (8) and (9) and then analyzed under the same conditions as in the in situ indoor unit method.
qcooling,rf = (hr,dis − hr,suc) × Q,iu + qiu,fan
COPr = qcooling,rf/Etotal
The cooling capacity and COP according to indoor and outdoor temperatures showed similar trends to those of the in situ indoor unit method (Figure 8 and Figure 9). However, the fluctuation range of cooling capacity by phase was larger than that of the in situ indoor unit method. In addition, although it was linearly proportional to the indoor temperature at the outset, we confirmed that clusters formed according to the change in load conditions. The reason for this is believed to be the effects of various variables on the calculation of the flow rate, such as power consumption, compressor heat loss, and compressor discharge pressure calculation. This is different from the in situ indoor unit method, in which air flow rate and power consumption were applied as constants.
In Phase 2, the measured average cooling capacity was 7.8 kW, showing an error of 9% compared to that of the cooling load. Considering that the error of the in situ refrigerant measurement method performed in the laboratory in the previous study [20] ranged from 10 to 15%, relatively effective results could also be obtained in the field. It was also found that the in situ refrigerant measurement method with a more complex measurement procedure is more accurate than the indoor unit air enthalpy difference method.

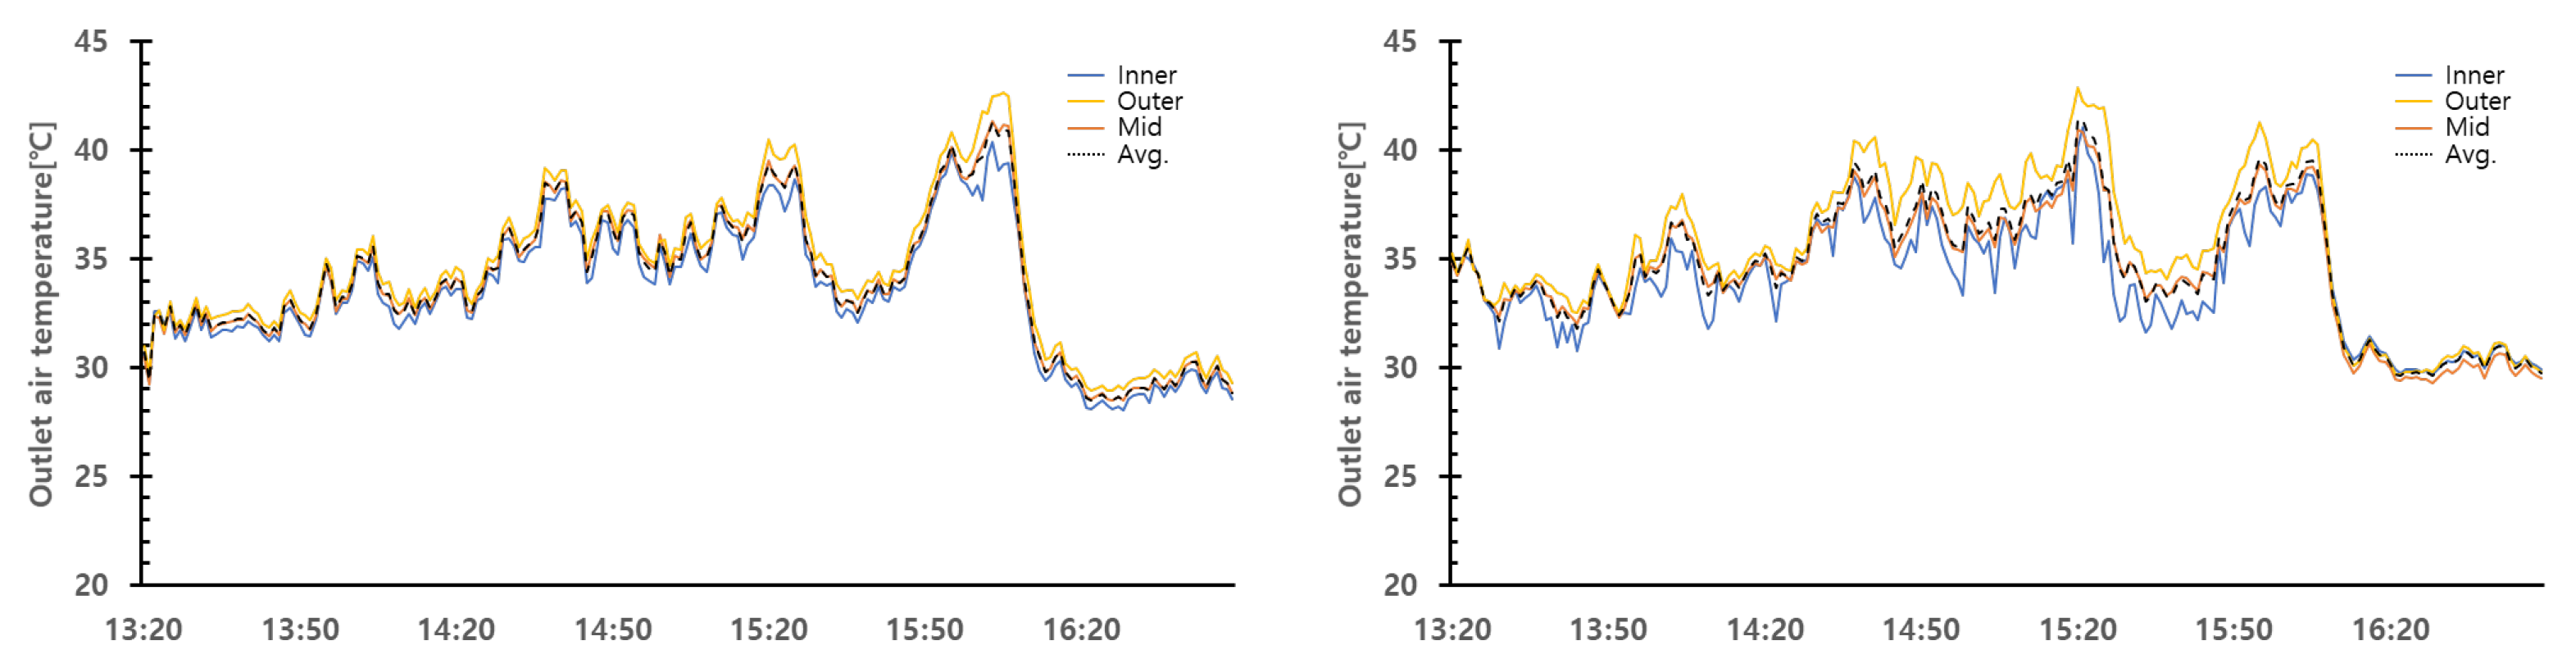
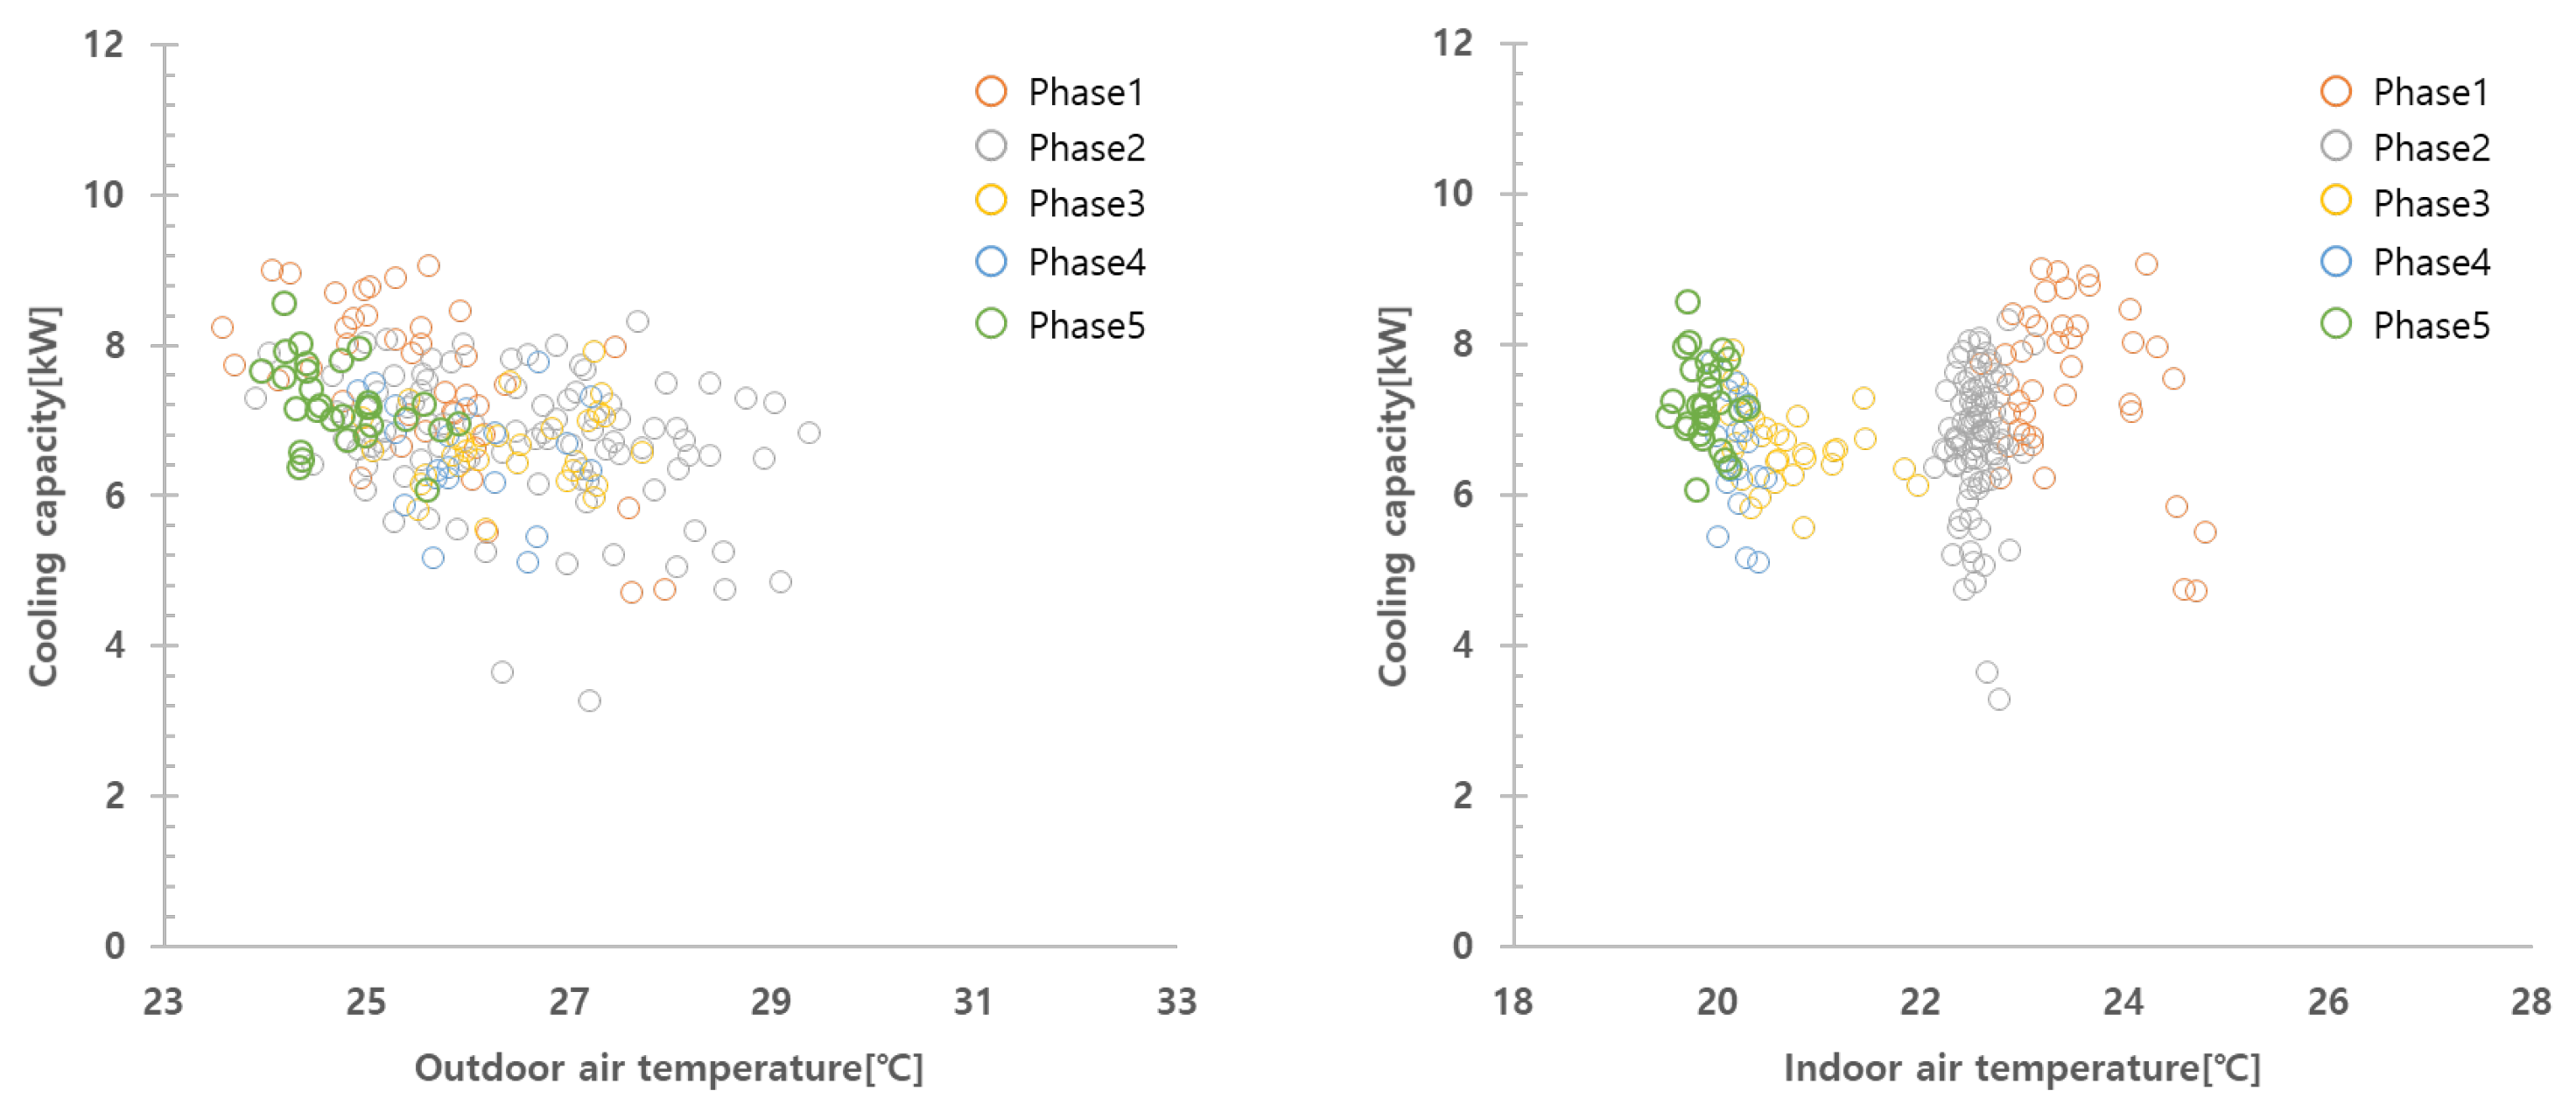
3.3. Cooling Performance Calculated by In Situ Outdoor Unit Air Enthalpy Difference Method

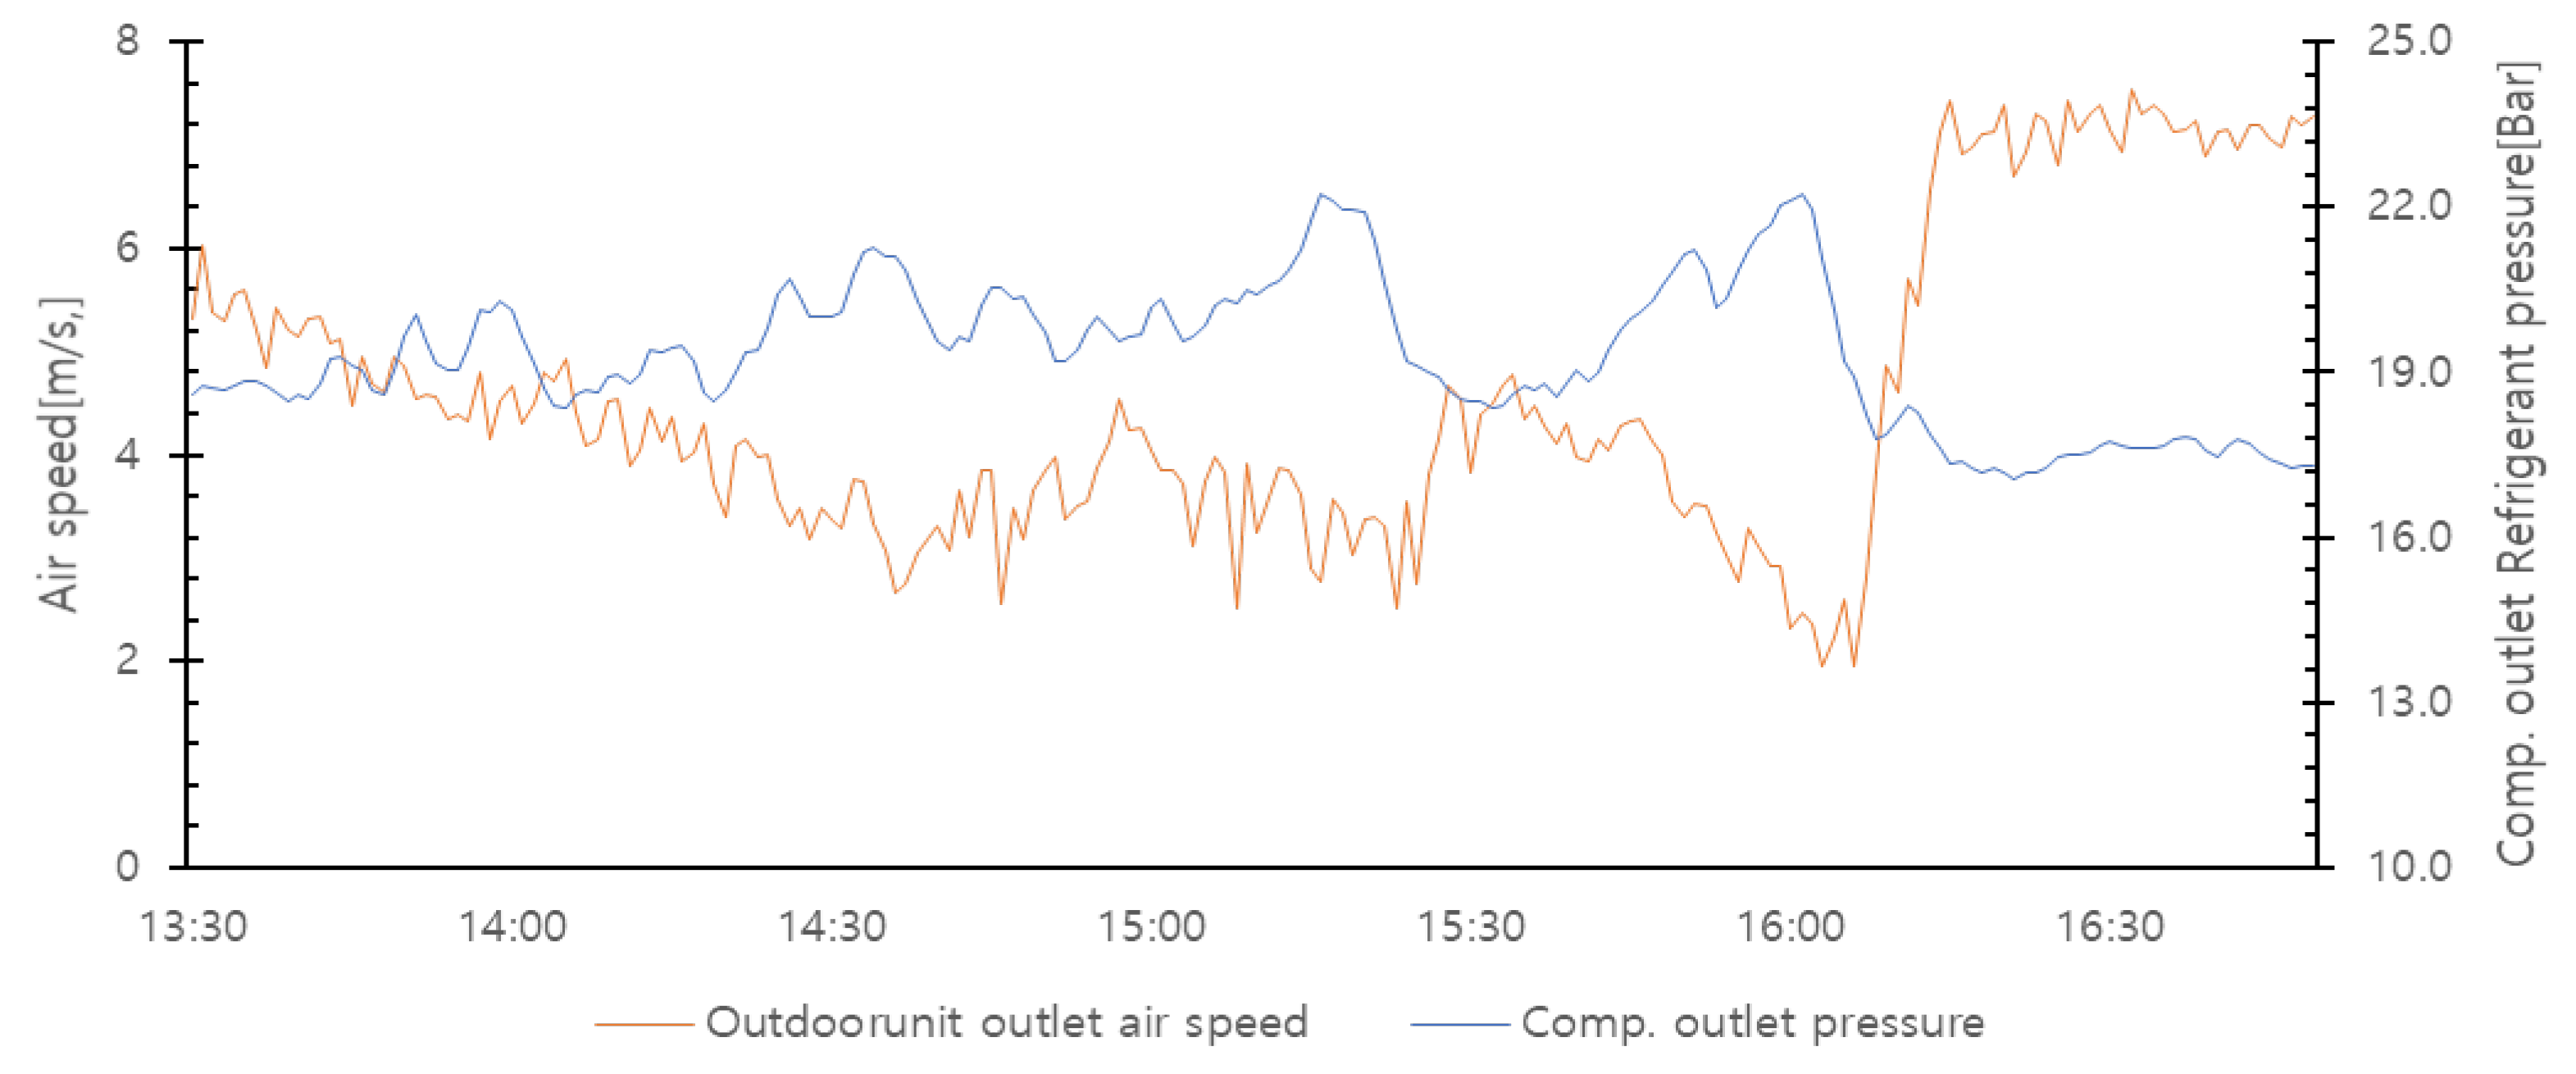
3.3.1. Analysis of Measuring Variable

The outdoor unit of the target consisted of two fans with a rated speed of 720 RPM. When examining the operational state of the fan, the initial RPM was measured to be 560 and 550 for the upper and lower fans, respectively, and no difference in performance was observed. The reference value of the airflow rate of the outdoor unit was calculated according to Equation (10), based on the similitude law, and the results are shown in Table 5.
Qou = Qou,rated × (RPMou,m/RPMou,rated)
A non-contact rotational speed measurement device mainly used in field diagnosis facilitated the measurement of the number of rotations at a specific point in time but had limitations in recording continuous rotational speed. In addition, it was impossible to use it for the outdoor unit in operation due to the grill at the front of the fan. Therefore, to record the change in air flow rate, we used the wind speed of the representative point in the outlet as the calibration data. In general, the airflow rate of the outdoor unit was linearly controlled to increase the compressor refrigerant discharge pressure to an appropriate pressure. Figure 10 shows the wind speed of the discharge air from the outdoor unit and the discharge pressure of the refrigerant from the compressor. The air velocity discharged from the outdoor unit at the measurement site was inversely proportional to the change in the discharge pressure of the compressor refrigerant, similar to that observed for the control characteristics. Considering this, the wind speed at the target point would be able to represent the change in fan rotation speed. Accordingly, to determine the cooling capacity, the airflow rate discharged from the outdoor unit was calculated using Equation (11).
Qou,op = Qou × (Sfan,m/Sfan,max)
Axial flow fans commonly used in outdoor units show a large difference in airflow movement between the hub and fan tip [31]. In addition, a dual fan has a difference in the height of the hub, inducing a flow difference due to centrifugal force [32]. To examine the effect of the airflow on the discharge temperature, the temperature measured at a total of 12 points—three points each on the top, bottom, left, and right sides based on the center—was analyzed. The difference between points was smallest in the center of the tip (mean error: −1–1%) and hub and increased in the order of the tip and hub. The lower fan also showed the smallest deviation in the center (mean error: −2–2%), but the deviation was larger in the tip than in the hub (Figure 11). Figure 12 shows the average discharge temperature and the overall average temperature of the hub, center, and tip of the upper and lower fans. It shows that the average temperatures of both the upper and lower fans were almost the same as the temperature of the central part. When the temperature was measured at the center of the tip and the hub, the effect of airflow imbalance could be relatively less represented; therefore, it can be used as a representative value of the discharge temperature.

3.3.2. Analysis of Cooling Performance

In the cooling cycle, the heat dissipation of the condenser was the value obtained by adding the heat gain by the compressor to the heat absorption of the evaporator. When calculating the cooling capacity, the heat gain by the compressor must be excluded. Therefore, the cooling capacity and COP of the in situ outdoor unit method were calculated according to the following equations.
qcooling,ou = (hou,dis − hou,suc) × Qou − qou,fan − qcomp
COPou = qcooling,ou/Etotal
Figure 13 and Figure 14 show cooling capacity and COP distribution according to indoor and outdoor temperatures. Unlike other measurement methods that had a linear correlation with the change in indoor temperature, the cooling capacity measurement result obtained by the in situ outdoor unit air enthalpy difference method showed a linear correlation with the outdoor temperature. In Phase 2, the measured cooling capacity was 6.7 kW, showing an error rate of only 7%. The method exhibited higher accuracy than that by the indoor unit air enthalpy difference method under full load condition, indicating that it can be used in the field.
Looking at the COP according to the outdoor air temperature, other measurements showed the same trend of decreasing COP with increasing outdoor temperature. According to the test results of ASHP of the same standard [33], the COP decreased by 0.07 every time the outdoor temperature increased by 1 °C. However, while the reduction range of the in situ indoor unit air enthalpy difference method was 0.08 and that of the in situ refrigerant enthalpy difference method was close to 0.09, the in situ outdoor unit air enthalpy difference method was confirmed to be sensitive to outdoor temperature with the reduction range of 0.27. Additionally, other measurement methods showed relatively constant results even with changes in internal load conditions, but the in situ outdoor unit method showed higher COP in Phases 4 and 5, where the operation was at partial load. This is because of the abnormal operation of the outdoor blower as the discharge pressure was abnormally lowered owing to the reduced compression ratio caused by the sudden decrease in the internal load. Considering the above error factors, the current methods have limitations in confirming dynamic change characteristics, although confirming approximate performance was possible. Therefore, to reduce the measurement error in the future, it would be necessary to review variables that are complexly related to the airflow rate and intake heat amount, such as the power consumption of the outdoor unit blower.

4. Discussion

Field diagnosis for building remodeling requires evaluation of various energy factors in a short period of time, and ASHP diagnosis can only be performed under such a premise. Previously, we presented the results of three ASHP performance measurement methods available in the field. To meet the needs in the field, each method was tested by simplifying the measurement procedure for air volume and heat penetration considering the test conditions. While such simplification may cause errors in measurement results, it has the advantage of being universally applicable in various fields. In the meantime, we considered the risk of simplification preventing the appropriate reflection of the characteristics of ASHP. Therefore, the cooling capacity measurement results according to the three methods were analyzed based on the superheat condition, one of the main performance factors of ASHP, and are shown in Figure 15.
As the degree of superheat of the ASHP increased, the refrigerant flow rate into the compressor decreased, thereby reducing the cooling capacity. The values measured using the three methods were inversely proportional to the degree of superheat. The decrease shown in each measurement method was relatively similar. This indicates that, although each method may have a certain error, it can respond to the operational characteristics of the ASHP.
Figure 16 and Figure 17 show the results of measuring cooling capacity using the in situ indoor unit and outdoor unit air enthalpy difference methods compared to the in situ refrigerant enthalpy difference method. The aging of ASHP, required for remodeling decision-making, can be evaluated by the average performance of the measurement period. The cooling capacity measured in the refrigerant cycle was 7.6 kW during the measurement period, which showed an error of 24% from the result measured in the indoor unit (5.8 kW). Phases 2 and 5, where the room temperature was stabilized, showed a similar error range of 25%. The cooling capacity measured at the outdoor unit had a relatively large fluctuation range for each section but showed an error of only 8% compared to the measurement in the refrigerant cycle when compared with the average value for the entire period.
As such, the accuracy of the in situ measurement method for ASHP was quantitatively reviewed through field tests. Although this experiment had a limitation due to the tests being performed only at a single site, it is meaningful in that the possibility of measuring performance in outdoor units was confirmed, which has not been previously attempted owing to inaccuracy. In this test, preparing for the measurement of the refrigerant cycle took 6 h, including the prior preparation, but only took less than 1 h to prepare for the measurement on the outdoor unit. In addition, in the case of indoor unit measurement, the preparation period and cost greatly increase if the number of units to be measured simultaneously increases, which may cause inconvenience to occupants. Considering these points, the in situ outdoor unit air difference method is considered to be applicable for a general-purpose field diagnosis if more cases of increasing accuracy are secured.

5. Conclusions

This study aimed to evaluate the applicability of the outdoor air enthalpy difference method for air source heat pumps (ASHP) in operation through quantitative analysis using short-term field tests. The cooling capacity of a single inverter ASHP was measured using three representative measurement methods, and comparative analyses were conducted on their results. The results are summarized as follows.
(1)
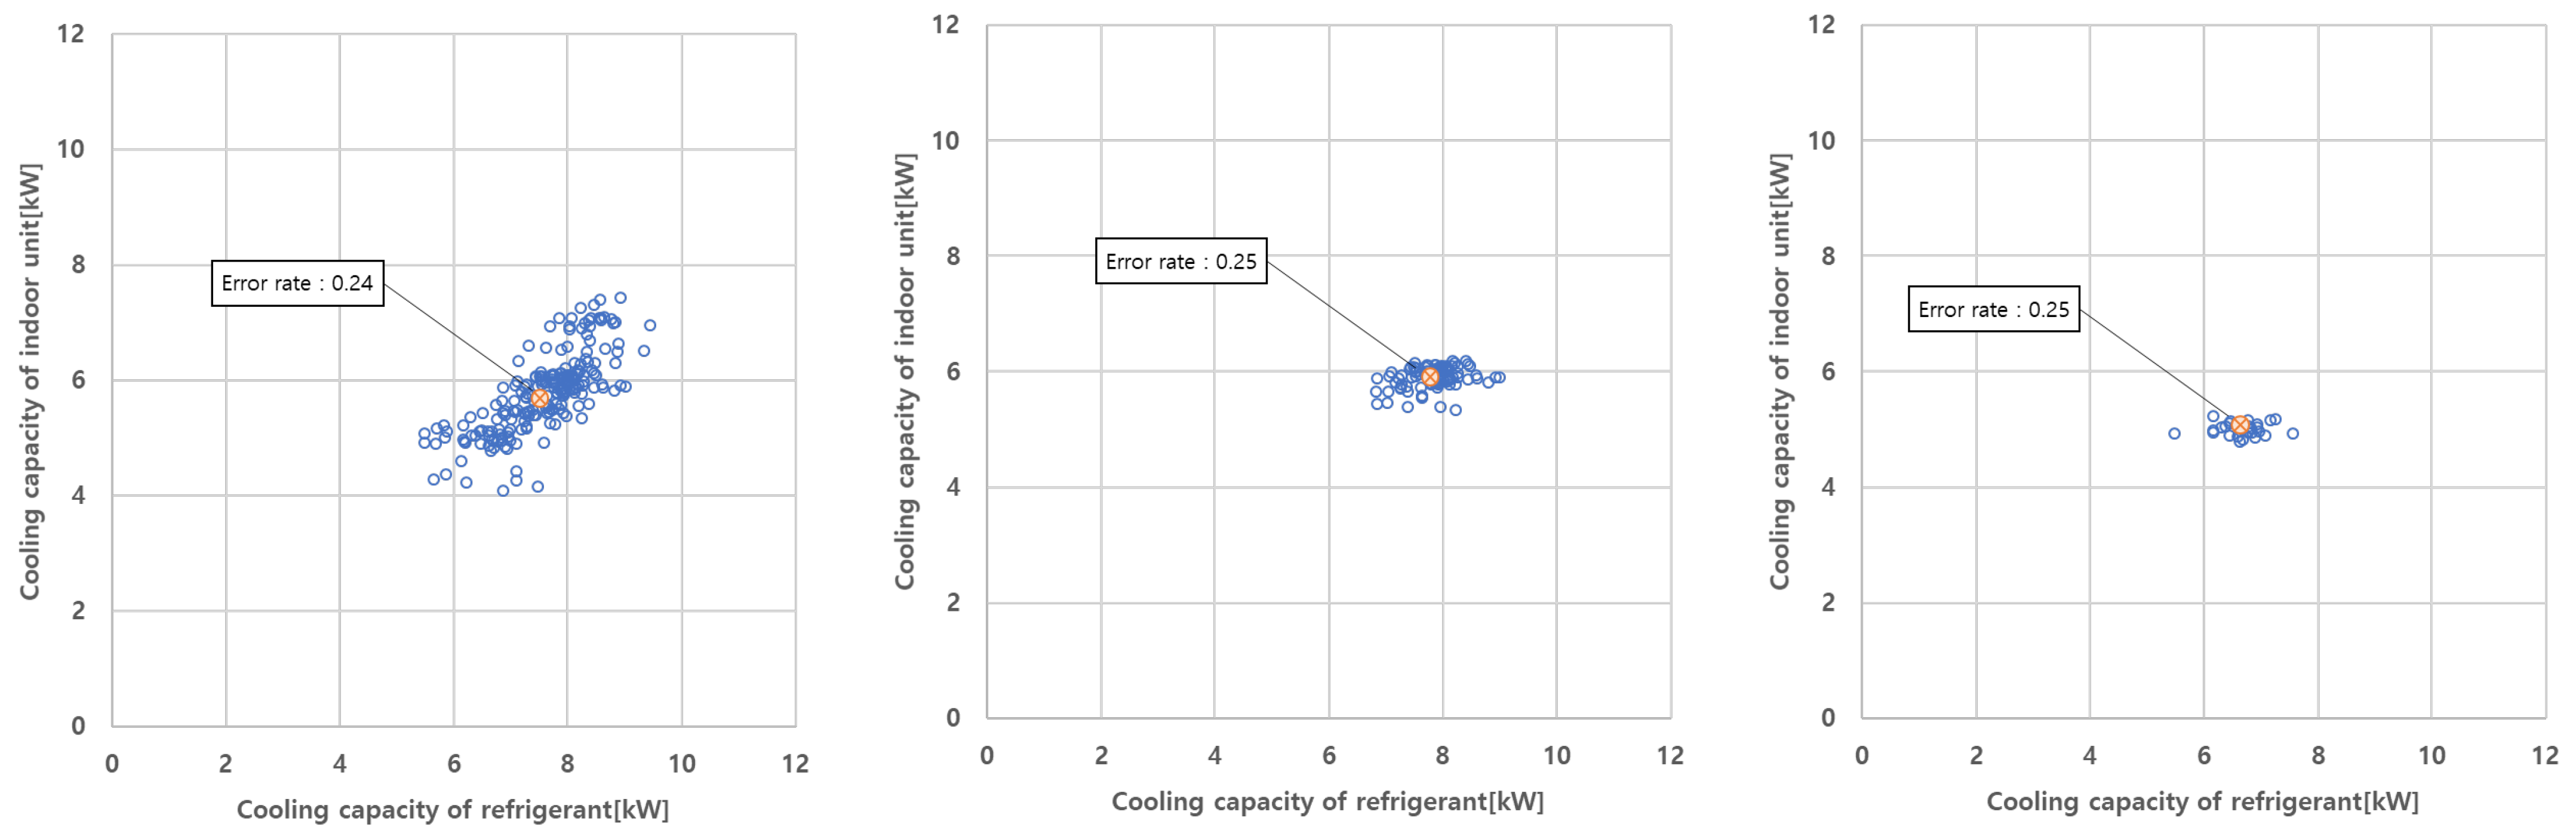
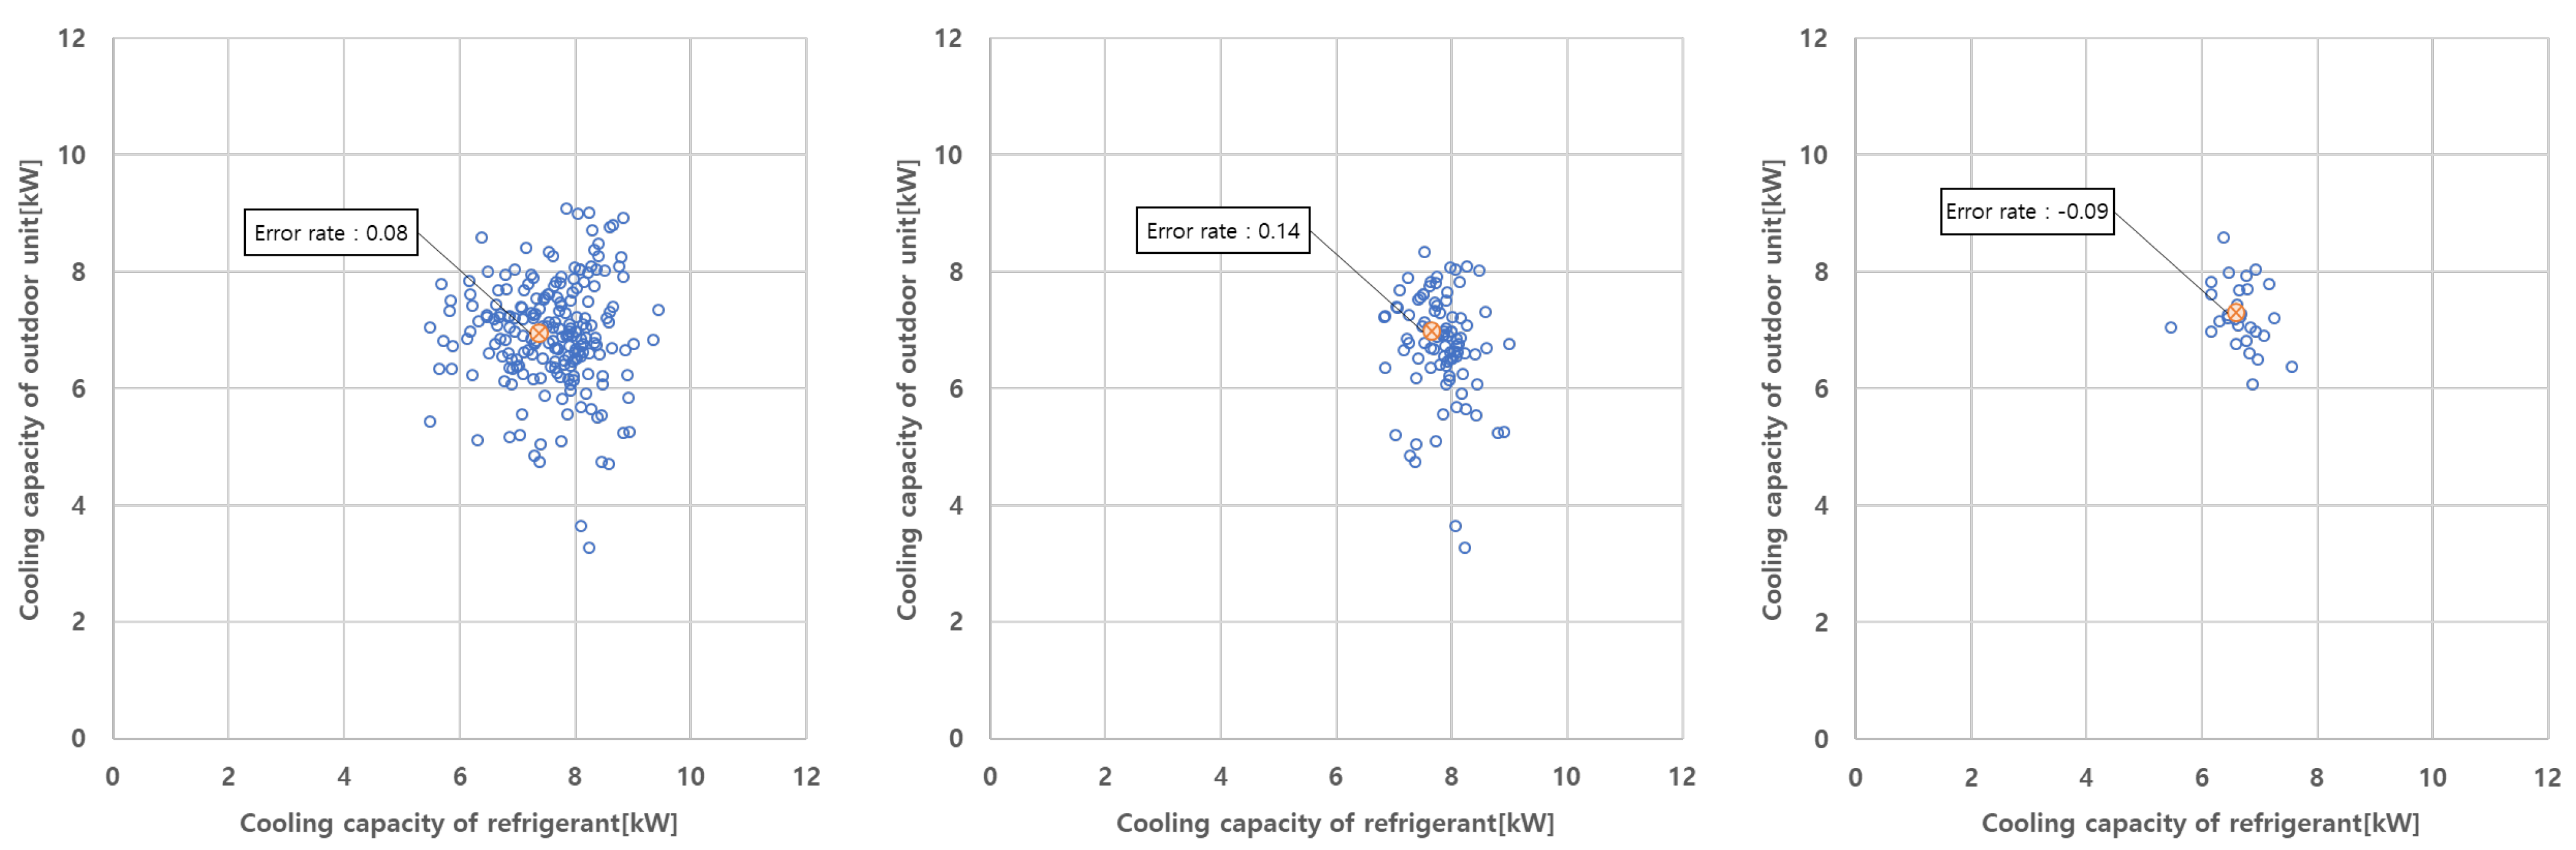
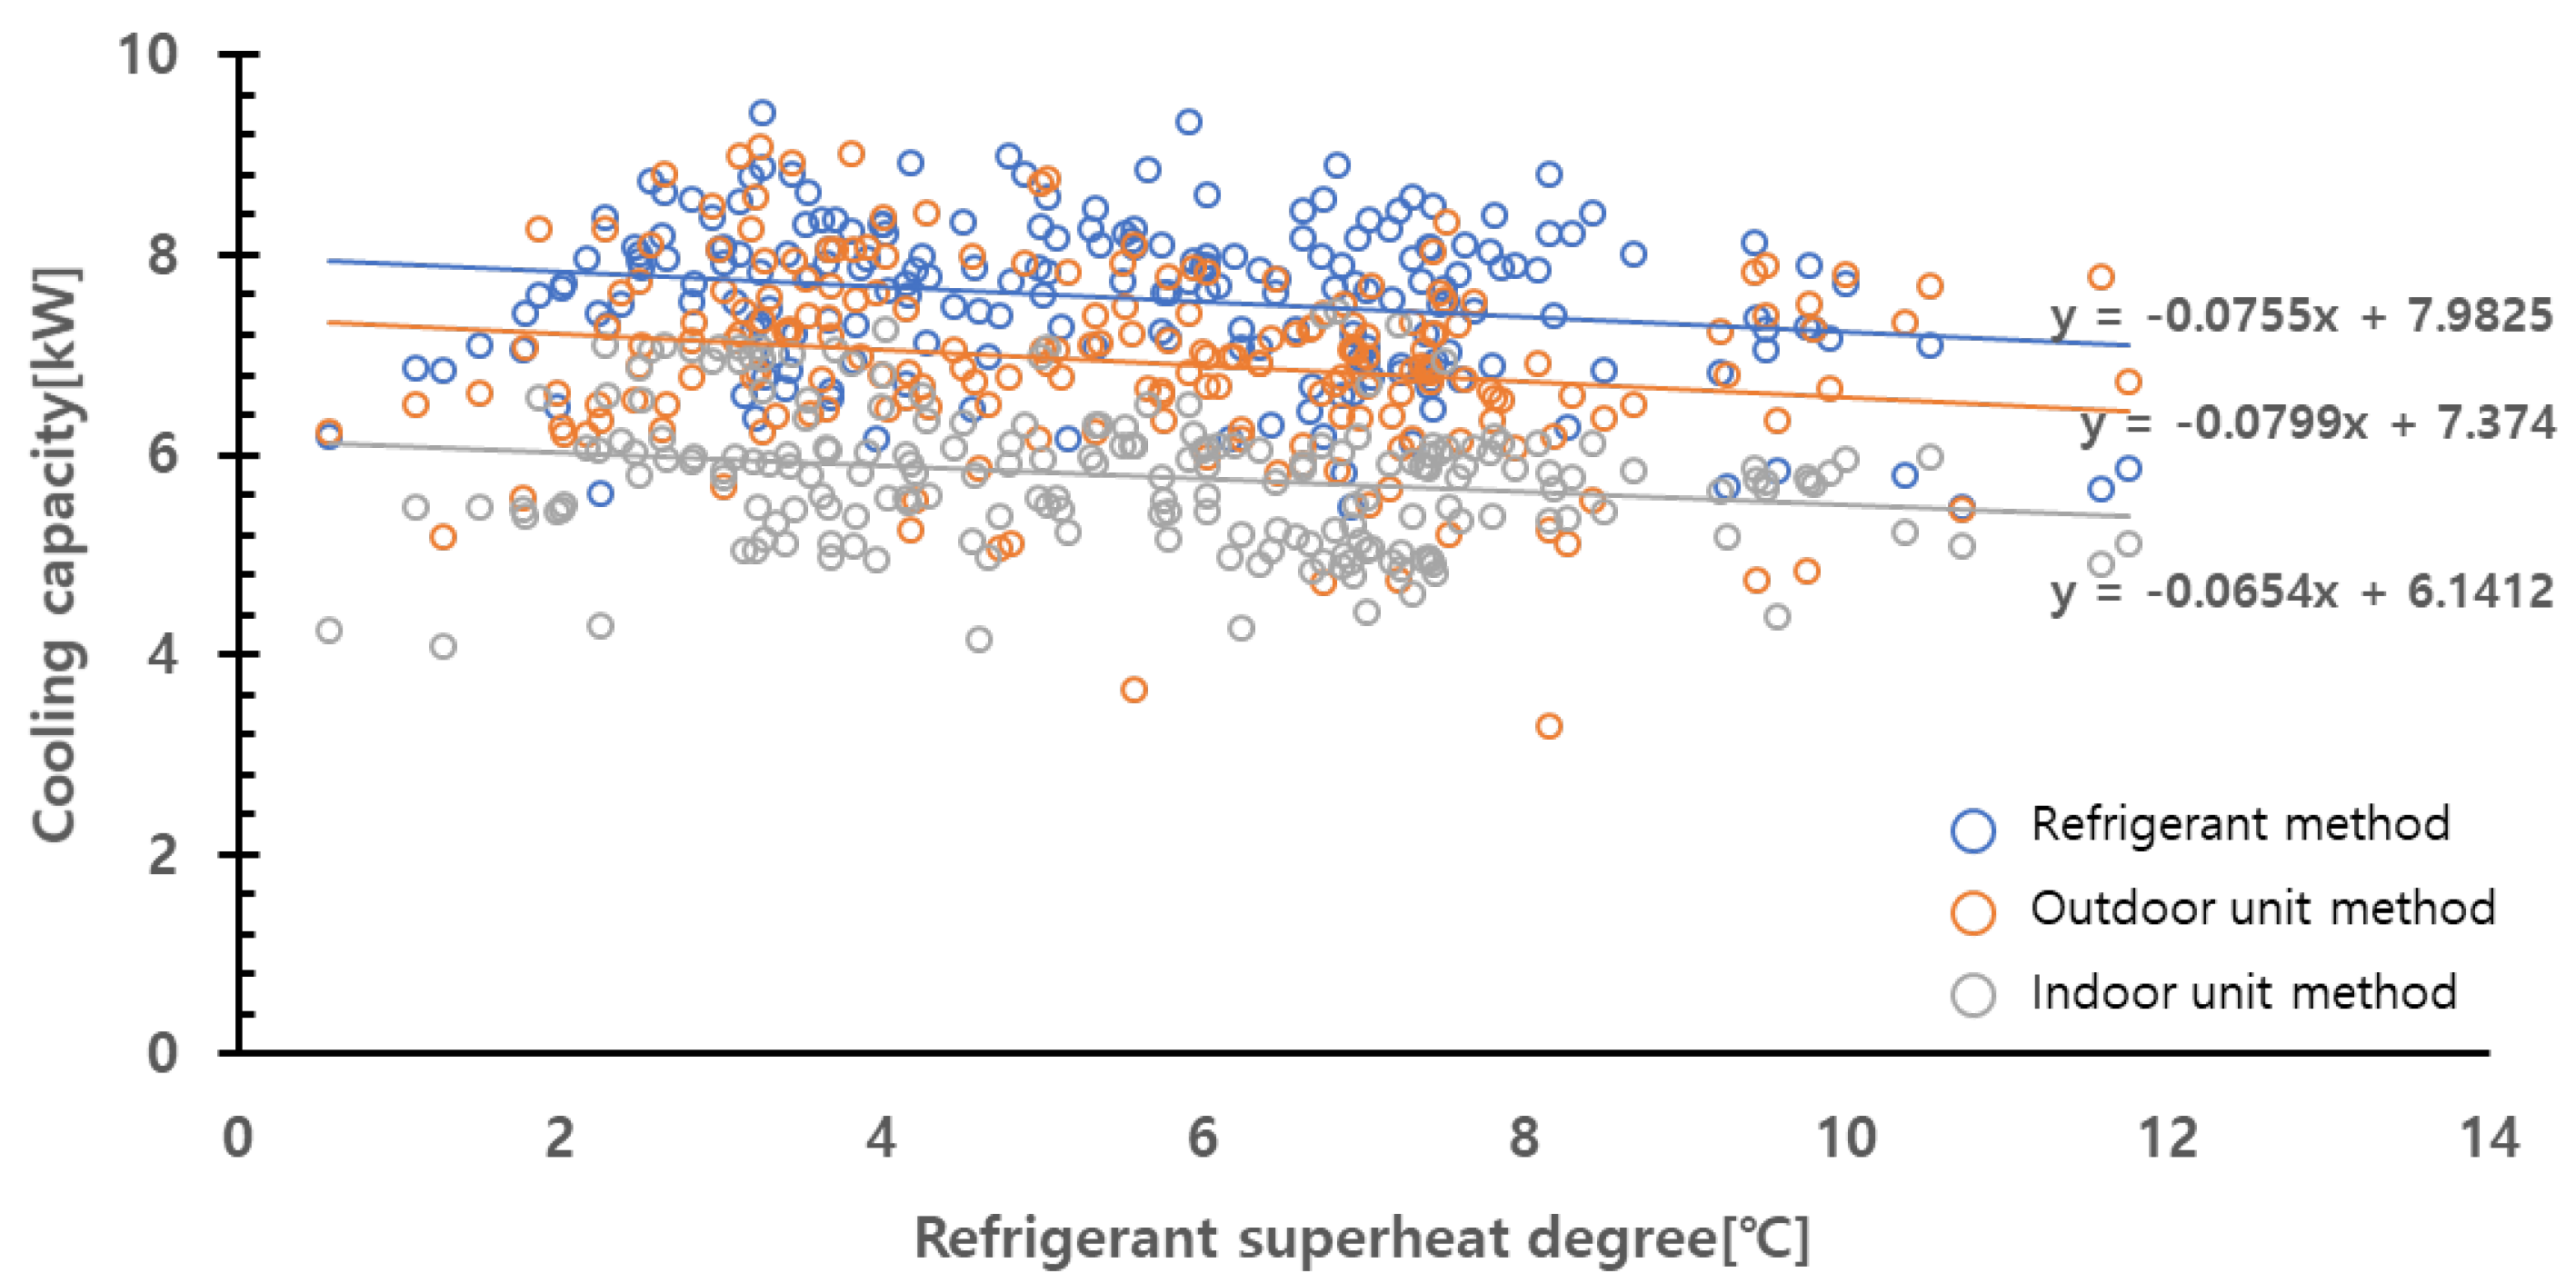
In Phase 2, the errors of the three measurement methods compared to the reference cooling load were 7% for the outdoor unit method, 9% for the refrigerant method, and 18% for the indoor unit method, which confirmed that the outdoor unit method had the lowest error.
(2)
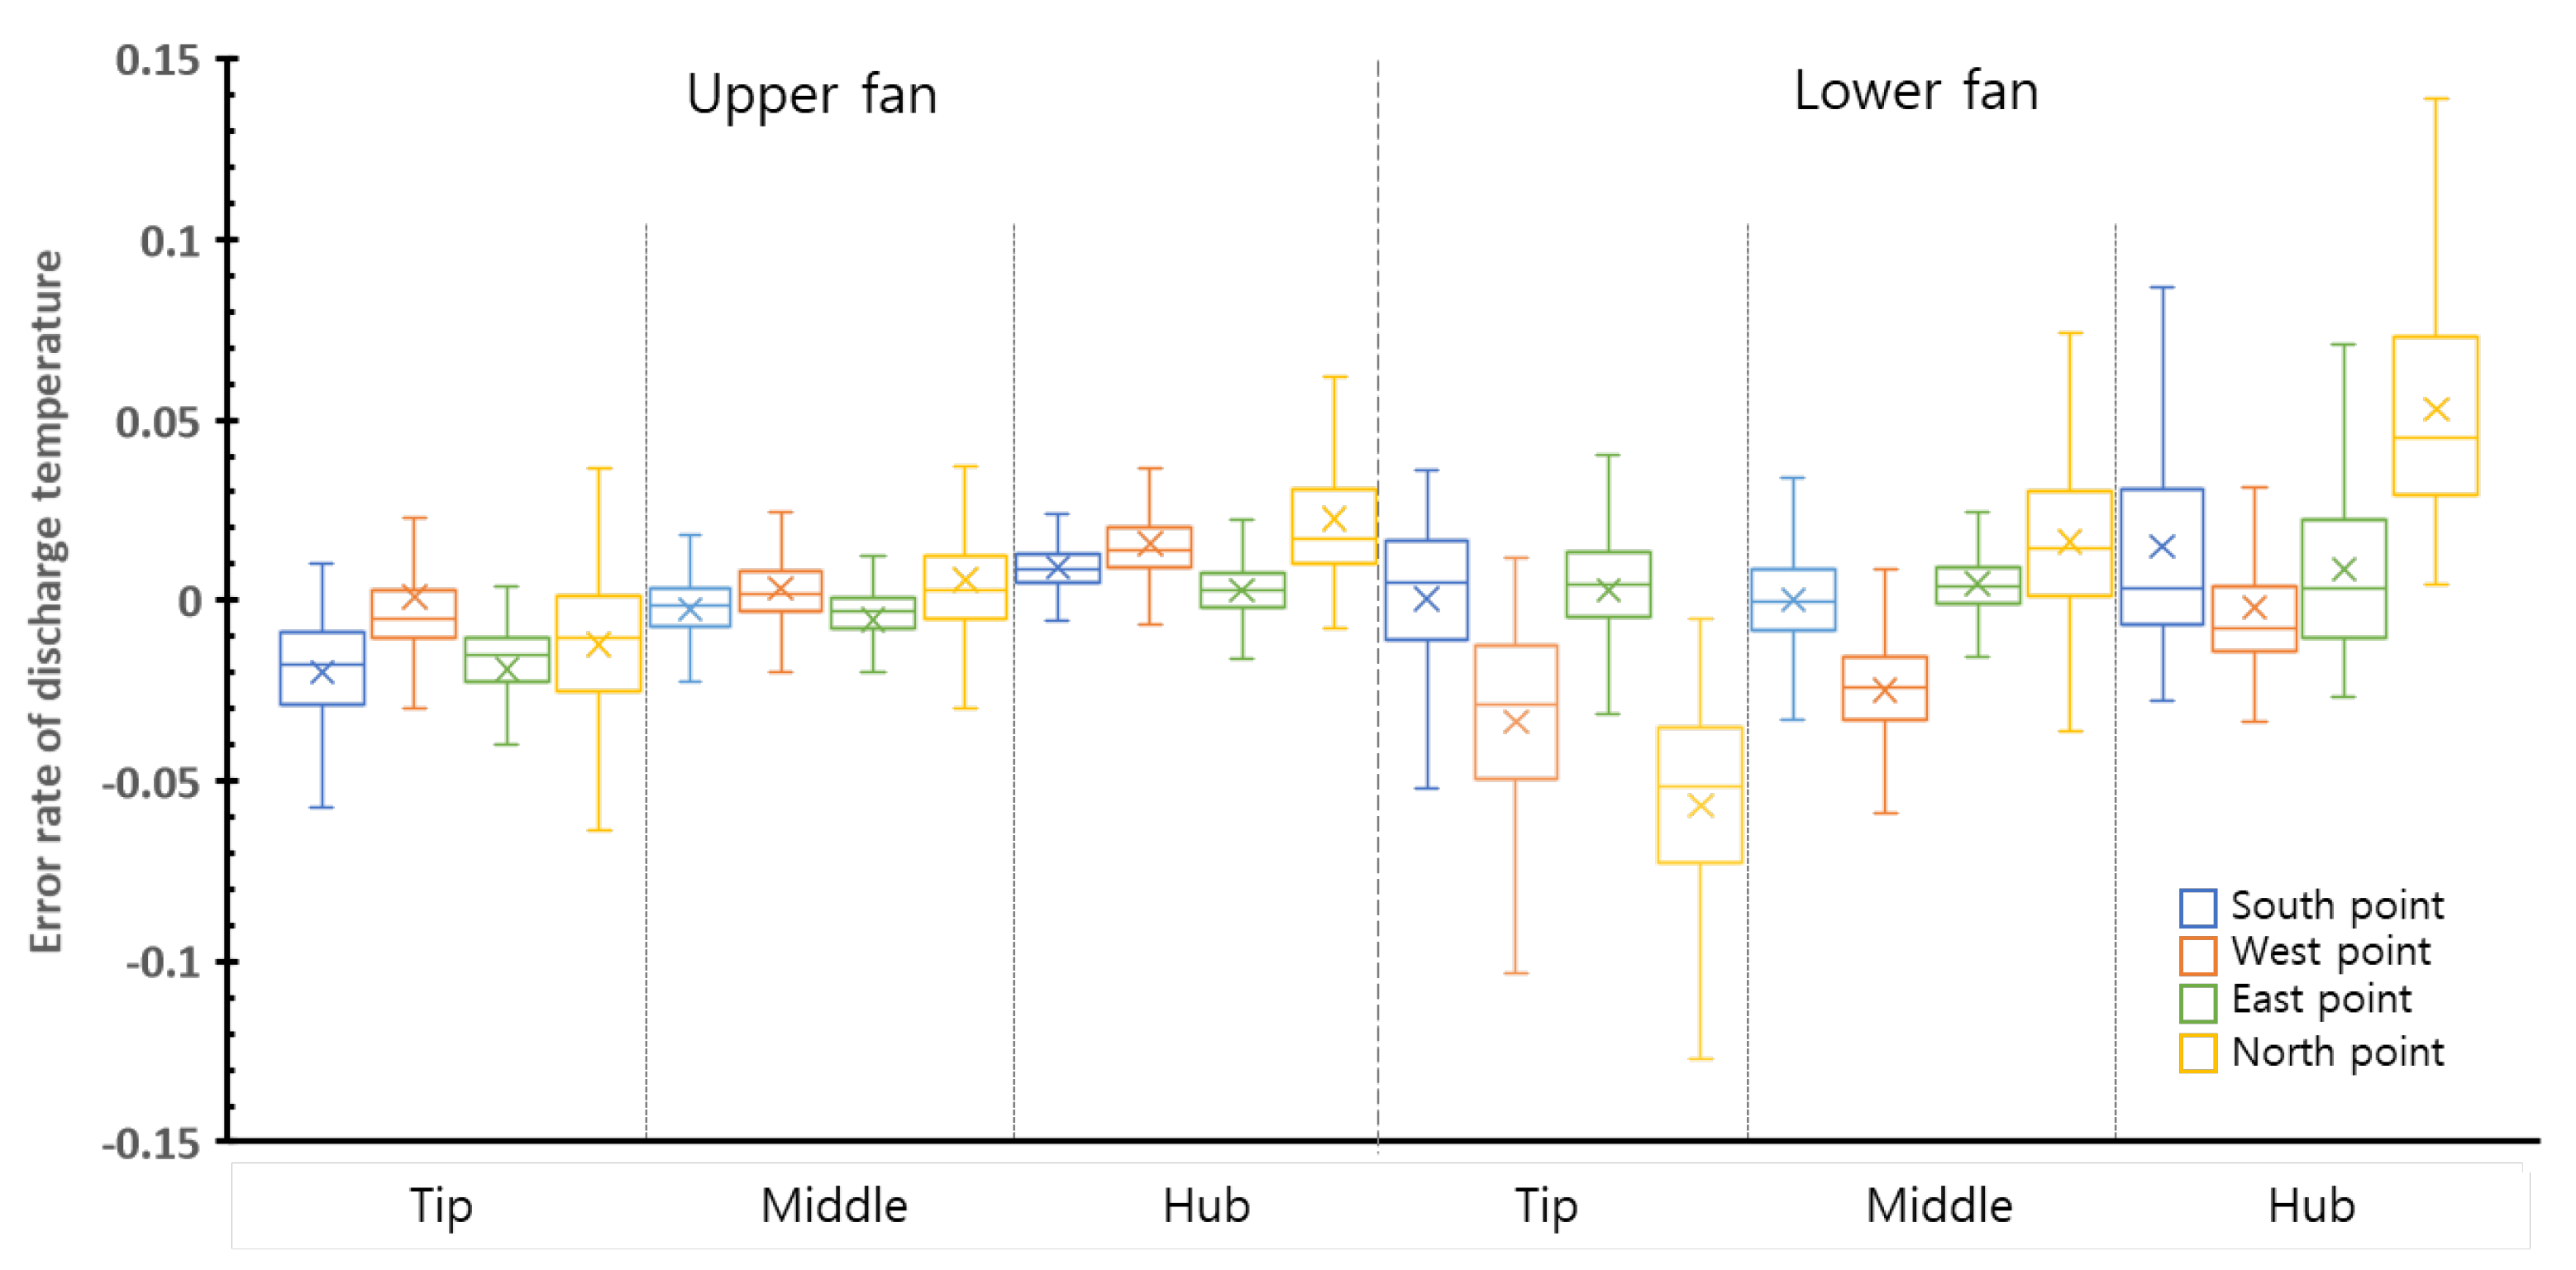
The distribution of the discharge temperature of the outdoor unit showed a large difference in the measurement location between the section where the blower rotates at high speed and the section at low speed. However, the temperature of the middle part of the hub and the tip showed relatively little variation per measurement point and was almost identical to the average temperature. Therefore, it is considered that the middle part temperature measurement can replace the multi-point measurement to simplify the measurement method.
(3)
When measuring the dynamic performance using the outdoor air enthalpy difference method, the limitation of the correction method using airflow rate was confirmed, leading to the conclusion that the power quality of the outdoor unit blower must be measured to correct the air flow rate and intake heat.
(4)
The average cooling capacity measurement result using the in situ outdoor unit method had an error level of only 8% compared to that of the in situ refrigerant enthalpy difference method. Considering this fact and the difficulty of measurement, the in situ outdoor unit method is judged to be more suitable for the field to evaluate the ASHP performance on the day of measurement.
This study has limitations when considering the results of this study to be universal as it is based on the experiment at a single site for a simple single-inverter type system without a complicated control process. However, this study presents an important achievement that can contribute to future research on in situ measurement methods of ASHP field performance by confirming the reliability level of the simplified method considering the equipment and measurement conditions used in the actual diagnosis site. This study also confirmed field applicability and supplementary points. Future studies are planned to present the possibility of using the in situ outdoor unit air enthalpy difference method more clearly by accumulating data from various field experiments and multi-VRF systems.

Author Contributions

Conceptualization, T.A.; Data curation, J.H.; Formal analysis, J.S.; Investigation, J.S. and J.H.; Methodology, J.S.; Project administration, T.A.; Writing original draft, J.S.; Writing review & editing, T.A. All authors have read and agreed to the published version of the manuscript.

Funding

This work was supported by a Korea Institute of Energy Technology Evaluation and Planning (KETEP) grant funded by the Korean government (MOTIE)(No.20202020800360).

Data Availability Statement

Not applicable.

Conflicts of Interest

The authors declare no conflict of interest.

Abbreviations

qcoolingcooling capacity, kW
qcompheat gain by compressor, kW
qfanheat gain by fan, kW
COPcooling COP
hair enthalpy, kJ/kg
hrrefrigerant enthalpy, kJ/kg
Qair flow rate, m3/h
Wrrefrigerant flow rate, g/h
Prefrigerant pressure, Bar
Sair speed, m/s
Epower consumption, kW
RPMrefreference RPM of outdoor unit blower, r/min
Subscript
iuindoor unit
ououtdoor unit
ratedrated capacity
disdischarge value
sucsuction value
totaltotal value
mmeasuring value
opoperation period value
maxmax value
lossheat loss

References

  1. Republic of Korea. Concerned, Raised Plan of 2030 National Greenhouse Gas Reduction Goals (NDC); Presidential Commission on Carbon Neutrality and Green Growth: Sejong, Republic of Korea, 2021.
  2. Kim, Y.S. Performance and Future Planning of Green Remodeling for Public Buildings. Arch. Urban 2021, 43, 73–75. [Google Scholar]
  3. Byun, C.H. Statistical Yearbook of Molti; Ministry of Land, Infrastructure and Transport: Sejong, Republic of Korea, 2020; p. 159.
  4. Lee, Y.J.; Jeong, J.H.; Song, D.S. Examination on the Operational Characteristics of the System air conditioners during the Heating. In Proceedings of the SAREK 2010 Summer Annual Conference, Pyeongchang, Republic of Korea, 23–25 June 2010; pp. 169–174. [Google Scholar]
  5. Gallup Korea daily Opinion. Available online: http://www.gallup.co.kr/gallupdb/reportContent.asp?seqNo=942 (accessed on 10 January 2023).
  6. Lee, J.H.; Kim, S.H.; Kim, J.H.; Yoo, S.H.; Song, D.S.; Jeong, H.G. Diagnosis and remodeling of an aged library building for zero-energy certification. J. Korean Inst. Arch. Sustain. Environ. Build. Syst. 2018, 12, 345–360. [Google Scholar]
  7. Ministry of Infrastructure and Transport. Practice Guidebook of Mechanical Equipment Act; Ministry of Infrastructure and Transport: Sejong, Republic of Korea, 2020.
  8. Son, J.W.; Hong, J.H.; Aum, T.Y. A Pilot study on In-situ Measurement Method for Cooling Performance of Air-source Heat Pump. J. Arch. Inst. Korea 2022, 38, 201–207. [Google Scholar]
  9. Korea Land & Housing Corporation. White Paper on Green Remodeling Support Project for Public Buildings; Korea Land & Housing Corporation: Jinju, Republic of Korea, 2018. [Google Scholar]
  10. Carroll, P.; Chesser, M.; Lyons, P. Air source heat pumps field studies: A systematic literature review. Renew. Sustain. Energy Rev. 2020, 134, 1–12. [Google Scholar] [CrossRef]
  11. Chesser, M.; Lyons, P.; O’Reilly, P.; Carroll, P. Air source heat pump in-situ performance. Energy Build. 2021, 251, 1–9. [Google Scholar] [CrossRef]
  12. Xiao, H.; Yang, Z.; Shi, J.; Wang, B.; Shi, W. Method for performance metering of indoor units in variable refrigerant flow systems based on built-in sensors. Appl. Therm. Eng. 2021, 196, 1–13. [Google Scholar] [CrossRef]
  13. Yoon, S.M. Virtual sensing in intelligent buildings and digitalization. Autom. Constr. 2022, 143, 1–20. [Google Scholar]
  14. Noh, K.J.; Kim, J.Y.; Kang, E.C.; Park, H.M.; Lee, E.J. Cooling performance evaluation study of dual-source heat pump system. Korea Soc. Geothemal Energy Eng. 2007, 3, 1–9. [Google Scholar]
  15. Yang, D.H.; Kwan, Y.C. Experimental study on cooling performance characteristics of 2 room simultaneous operation of multi-A/C. J. Korean Soc. Mech. Technol. 2018, 20, 612–617. [Google Scholar] [CrossRef]
  16. Lee, C.H.; Nah, H.S.; Hwang, S.W. Cooling performance evaluation of air source heat pump system in low energy house. J. Korean Soc. Mech. Technol. 2012, 14, 77–84. [Google Scholar]
  17. Won, A.N.; Ichikawa, T.; Yoshida, S.; Sadohara, S. Study on Running Performance of a Split-type Air Conditioning System Installed in the National University Campus in Japan. J. Asian Arch. Build. Eng. 2009, 8, 579–583. [Google Scholar] [CrossRef]
  18. Han, S.Y.; Kim, S.H.; Jang, H.I.; Lee, S.H.; Suh, S.J. An Experimental Study on Applicability of a Multiplex Heat Pump System in the Kindergarten. Korean J. Air-Condition. Refrig. Eng. 2013, 25, 540–547. [Google Scholar] [CrossRef]
  19. Cho, H.G.; Cho, K.N.; Yoo, H.S.; Hong, H.K. Field Performance of Variable Capacity Heat Pump Systems with Multi-indoor Units during Cooling Season. In Proceedings of the SAREK Conference, Pyeongchang, Republic of Korea, 29 June–1 July 2005; pp. 1137–1142. [Google Scholar]
  20. Zhang, G.; Liu, W.; Xiao, H.; Shi, W.; Wang, B.; Li, X.; Cao, Y. New method for measuring field performance of variable refrigerant flow systems based on compressor set energy conservation. Appl. Therm. Eng. 2019, 154, 530–539. [Google Scholar] [CrossRef]
  21. Xiao, H.; Shi, J.; Yang, Z.; Wang, B.; Shi, W.; Li, M. Precision improvement method for onsite performance measurement of variable refrigerant flow system. Build. Environ. 2022, 208, 1–16. [Google Scholar] [CrossRef]
  22. Tran, C.T.; Riviere, P.; Marchhio, d.; Arzano-Daurelle, C. Refrigerant-based measurement method of heat pump seasonal performances. Int. J. Refrig. 2012, 35, 1583–1594. [Google Scholar]
  23. Tran, C.T.; Riviere, P.; Marchio, D.; Arzano-Daurelle, C. In Situ Measurement Methods of Air to Air Heat Pump Performance. Int. J. Refrig. 2013, 36, 1442–1455. [Google Scholar] [CrossRef]
  24. Tran, C.T.; Noel, D.; Riviere, P.; Arzano, C. In-situ Method for Air to Air Heat Pump Seasonal Performance Determination including Steady-state and Dynamic Operations. Int. J. Refrig. 2021, 127, 239–249. [Google Scholar] [CrossRef]
  25. KS C 9306; Air Conditioners. Korean Standard Association: Seoul, Republic of Korea, 2017.
  26. KS B ISO 15042; Multi-Split Air-Conditioner. Korean Standard Association: Seoul, Republic of Korea, 2018.
  27. Fukuta, M.; Morishita, S.; Nishihata, K.; Motozawa, M. Quality measurement of refrigerant two-phase flow in refrigeration cycles. Flow Meas. Instrum. 2021, 77, 1–9. [Google Scholar] [CrossRef]
  28. Goossens, M.; Teuillieres, C.; Riviere, P.; Cauret, O.; Marchio, D. An instrumented method for the evaluation of compressor heat losses in heat pumps on-field. In Proceedings of the 12th IEA Heat Pump Conference, Rotterdam, The Netherland, 22 June 2017; Volume 2017, pp. 1–9. [Google Scholar]
  29. Klas Berglof, M.S. Methods and potential for on-site performance validation of air conditioning, refrigeration, and heat pump systems. In Proceedings of the IEA Conference in Las Vegas, Las Vegas, NV, USA, 30 May–2 June 2005. [Google Scholar]
  30. AHRI Standard 210/240; Performance Rating of Unitary Air-Conditioning & Air-Source Heat Pump Equipment. Air-Conditioning, Heating, & Refrigeration Institute: Arlington, VA, USA, 2017; p. 19.
  31. Abu Talib, A.R.; Jaafar, A.A.; Abdul Jalil, N.A.; Mokhtar, A.S. Flow measurements downstream of an axial flow fan inside an outdoor air conditioning unit. Int. J. Eng. Technol. 2007, 4, 44–56. [Google Scholar]
  32. Kim, Y.H.; Jeong, J.H.; Lee, J.H. Analysis on performance of axial flow fan for outdoor unit of air-conditioner: Flow characteristics. Int. J. Fluid Mach. Syst. 2010, 13, 30–35. [Google Scholar]
  33. LG Electronics Inc. Total HVAC Solustion Provider: Engineering Product Data Book; LG Electronics Inc.: Seoul, Republic of Korea, 2021; p. 6. [Google Scholar]
Figure 1. Conceptual diagram of measurement of ASHP cooling capacity.
Buildings 13 00448 g001
Figure 2. Schematic showing the calculation procedure of in situ methods.
Buildings 13 00448 g002
Figure 3. Indoor and outdoor environmental conditions of the test zone.
Buildings 13 00448 g003
Figure 4. Sensing point of ASHP to measure cooling capacity.
Buildings 13 00448 g004
Figure 5. Distribution of air temperature and compression ratio during the test period.
Buildings 13 00448 g005
Figure 6. Cooling capacity calculated by in situ indoor unit air enthalpy difference method.
Buildings 13 00448 g006
Figure 7. Cooling COP calculated by in situ indoor unit air enthalpy difference method.
Buildings 13 00448 g007
Figure 8. Cooling capacity calculated by in situ refrigerant enthalpy difference method.
Buildings 13 00448 g008
Figure 9. Cooling COP calculated by in situ refrigerant enthalpy difference method.
Buildings 13 00448 g009
Figure 10. Distribution characteristic of outdoor unit outlet air speed.
Buildings 13 00448 g010
Figure 11. Error rate of outdoor unit outlet air temperature.
Buildings 13 00448 g011
Figure 12. Distribution of outdoor unit outlet air mean temperature (left: upper fan, right: lower fan).
Buildings 13 00448 g012
Figure 13. Cooling capacity calculated by in situ outdoor unit air enthalpy difference method.
Buildings 13 00448 g013
Figure 14. Cooling COP calculated by in situ outdoor unit air enthalpy difference method.
Buildings 13 00448 g014
Figure 15. Cooling capacity by refrigerant superheats degree.
Buildings 13 00448 g015
Figure 16. Cooling capacity calculated by in situ indoor unit air enthalpy difference method compared to in situ refrigerant enthalpy difference method (left, total period; mid, Phase 2; right, Phase 5).
Buildings 13 00448 g016
Figure 17. Cooling capacity calculated by in situ outdoor unit air enthalpy difference method compared to the in situ refrigerant enthalpy difference method (left, total period; mid, Phase 2; right, Phase 5).
Buildings 13 00448 g017
Table 1. Overview of the test zone.
DiagramOverview
Buildings 13 00448 i001Zone Area [m2]84
Zone Height [m]2.5
U-value Avg. [W/m2K]0.3142
SHGC0.27
Infiltration [ACH]0.5
Lighting Density [W/m2]10
Heater Capacity [kW]2.78 × 2 ea
Cooling Load [kW]7.2
ASHP Capacity [kW]7.2
RefrigerantR410A
Table 2. Indoor and outdoor environment state.
Air StateAHRI Standard [30]KS Standard [25]Measurement
100%75%100%MAXMINAVG
Indoor AirDB26.726.727 ± 0.326.322.323.9
Outdoor AirDB3527.535 ± 0.330.023.726.3
Table 3. Accuracy of measuring sensor.
ClassificationAccuracy
Temperature of refrigerant±0.25 °C
Pressure of refrigerant±0.5%
Air temperature of indoor unit±0.5 °C
Air humidity of indoor unit±0.5%
Air temperature of outdoor unit±0.2 °C
Air speed of outdoor unit±4%
Table 4. Information of indoor unit blower.
ClassificationAirflow Rate [CMM]Power [W]
Rated1952.5
Operation1737.6
Table 5. Information of outdoor unit blower.
ClassificationUpper FanLower FanAvg.Total
RPMRated7207207201440
Measured5605505551110
Air flow rate
[CMM]
Rated606060120
Expected46.745.846.392.5
Disclaimer/Publisher’s Note: The statements, opinions and data contained in all publications are solely those of the individual author(s) and contributor(s) and not of MDPI and/or the editor(s). MDPI and/or the editor(s) disclaim responsibility for any injury to people or property resulting from any ideas, methods, instructions or products referred to in the content.

