Abstract
An epoxy-coated reinforcement geopolymer concrete structure with good durability and energy-saving properties can be formed by combining epoxy-coated reinforcement and geopolymer concrete. The bond strength is the precondition for the two to work together. In this paper, 13 beam specimens (11 epoxy-coated reinforcements and 2 ordinary deformed reinforcements) were designed to investigate the influence of the strength of geopolymer concrete, diameter of the reinforcement, bonding length and type of reinforcement on the bond performance between reinforcement and geopolymer concrete. The test results show that the ultimate bond strength of the epoxy-coated reinforcement (ECR) and geopolymer concrete decreased by 7.32% and 14.76%, respectively, when the rebar diameter increased from 14 mm to 16 mm and then to 20 mm. The ultimate bond strength between ordinary threaded reinforcement and geopolymer concrete was slightly higher than that between ECR and geopolymer concrete. When the length of the bond section is small or the concrete strength is low, the beam specimen is prone to the failure of the reinforcement pullout. The specimen with the larger reinforcement diameter is prone to concrete splitting failure. However, the specimens with medium bond length and small reinforcement diameter suffered from pull-out failure after concrete splitting. In this paper, based on the test data, the bond-slip constitutive model of ECR and geopolymer concrete was established, and the bond-slip curve obtained by this model was in good agreement with the measured curve. In addition, the calculation formula of the ultimate bond strength between ECR and geopolymer concrete was also proposed in this paper, which can provide theoretical reference for the engineering application of geopolymer concrete.
1. Introduction
With the rapid development of the national economy and the continual improvement in infrastructure construction, greater importance has been attached to environmental protection and sustainable development, along with economic development. The production of ordinary Portland cement (OPC), which is a key concrete cementing material, consumes a significant amount of energy and emits CO2 and dust into the atmosphere [1]. In order to solve the problems of the sustainable development of concrete and environmental pollution, many scholars have changed adhesives, added materials (such as nanomaterials [2]) to concrete or developed new materials. Bilek et al. [3] discussed the alkali activating agent composed of potassium hydroxide-modified silicic acid modulus and sodium silicate. By changing the content of the activator and the water cement ratio, they found that the curing mode had an impact on the alkali activating material. Ibrahim YE et al. [4] used silica fume as an auxiliary cementing material to mitigate the negative impact of date palm fiber (DPF) on concrete strength and porosity. The study found that the water absorption of concrete increased with the increase of DPF content, and silica fume significantly improved the mechanical strength of concrete. Khan K et al. [5] evaluated the nano silica-modified concrete using a new method based on scientific metrological analysis and pointed out that the optimal dosage of nano silica is 2–3%, which is beneficial, and the mechanical strength can be improved by 20–25%. Geopolymer concrete is produced from industrial waste such as fly ash and slag at room temperature or high temperature with the assistance of alkali-activated aluminosilicate [6,7]. It is more eco-friendly [8,9] and energy efficient [10,11] and exhibits higher performance [12] than OPC. Therefore, the eco-friendly geopolymer concrete is a promising alternative to ordinary silicate concrete [13]. The corrosion of reinforcement is a key factor that causes structural failure, having led to frequent concrete structural failure in marine engineering, municipal engineering and construction engineering [14,15,16]. To extend the service life of reinforced concrete structures and guarantee the overall safety and stability of structures, China spends an enormous amount of money every year to alleviate reinforcement corrosion [17,18,19]. Hence, the engineering sector has attempted to adopt stainless steel reinforcement, fibre-reinforced polymer (FRP) or ECR to alleviate corrosion. Stainless steel reinforcement is resistant to corrosion, but it is expensive [20]. FRP reinforcement offers favourable corrosion resistance and strength, but it is characterized by poor structural ductility [21]. ECR is resistant to corrosion, more ductile than FRP reinforcement, and less expensive [22]; thus, it is considered more promising.
Epoxy resin coating brings about changes in the surface state of the reinforcement; as a result, the bond performance between reinforcement and concrete changes [23,24,25,26]. Furthermore, since there are differences in performance between geopolymer concrete and ordinary concrete [27], the bonding law between ordinary concrete and reinforcement is not completely applicable to geopolymer concrete. Accordingly, it is essential to study the bond performance between coated reinforcement and geopolymer concrete to apply coated reinforcement-geopolymer concrete structures to real projects. Scholars in China and around the world have studied the bond performance between geopolymer concrete and reinforcement, but most of them have relied on centre pull-out tests. For instance, Yuan Xiaohui et al. [28] fabricated six geopolymer concrete-reinforcement centre pull-out specimens and compared the bond performance between geopolymer concrete and a plain round bar with the bond performance between geopolymer concrete and threaded reinforcement. Zhang Haiyan et al. [29] performed centre pull-out tests on 24 reinforcement-geopolymer concrete bond specimens; investigated the effects of the compressive and splitting strength of geopolymer concrete, the type and diameter of the reinforcement, the thickness of the concrete cover, the reinforcement bond length and other factors on the reinforcement-geopolymer concrete bond performance; and compared such bond performance with the bond performance between reinforcement and ordinary reinforced concrete. Romanazzi et al. [30] took into account the effects of bond length and studied the bond-slip behaviour between reinforcement, glass fibre-reinforced polymer (GFRP) reinforcement and geopolymer concrete through 24 centre pull-out tests. Dahou et al. [31] compared the bond performance between geopolymer concrete, ordinary concrete and reinforcement at different ages and identified the relationship between the bond strength and compressive strength of geopolymer concrete. The studies above suggest that geopolymer concrete is equivalent or superior to ordinary concrete under the same conditions.
A centre pull-out test device is relatively simple and easy to analyse, but the external load applied to the specimen during the test is quite different from the actual form of force; hence, the local extrusion force at the loading end of the specimen when an external load is applied has a certain impact on the reliability of the result, while beam tests can better reflect the actual situations in projects. Moen et al. [32] analysed the law of influence of an ECR on the bond strength through beam tests. The results suggested that the presence of an epoxy coating effectively reduced the chemical adhesion between reinforcement and concrete, but it did not affect the maximum mechanical interaction and maximum bond strength. Liliana et al. [33] tested 70 ECR-concrete beam specimens. The results suggested that beam specimens without hoop reinforcement underwent brittle failure and that their ductility was significantly improved when they were furnished with hoop reinforcements. An appropriate arrangement of hoop reinforcements in high-strength concrete could favourably solve problems such as wide cracks and low ductility of the specimen. Few studies have examined the bond performance between ECR and geopolymer concrete. Due to their respective merits, geopolymer concrete and ECR are promising in marine engineering and municipal engineering. Thus, it is of great significance to study the bond performance between ECR and geopolymer concrete. For this reason, our research group [34] performed beam tests on 13 bond-slip specimens to study the effects of the reinforcement diameter, geopolymer concrete strength, reinforcement type and bond length on the bond performance between reinforcement and geopolymer concrete. The group built a bond-slip constitutive model and inferred the formula for computing the ultimate bond strength between ECR and geopolymer concrete, which offers a theoretical reference for the engineering application of geopolymer concrete.
2. Test Design
2.1. Test Material
The raw materials for geopolymer concrete preparation included granite fragments of 10–30 mm in size, medium sand with a fineness modulus of 2.70, S95 ground granulated slag, metakaolin, solid flake sodium hydroxide, sodium silicate and TG retarding water reducer. See the Table 1. above for the measured cube compressive strength and splitting tensile strength of geopolymer concrete at different ages. The size gradation of the sand and gravel is shown in Table 2. The chemical composition of S95 slag powder and metakaolin measured by XRF is shown in Table 3. The alkali activator was an 8 mol/L mixture of sodium hydroxide solution and sodium silicate solution; the sodium hydroxide solution was prepared 24 h in advance, thoroughly cooled and mixed with sodium silicate solution. The water-binder ratio of geopolymer concrete was 0.40 and 0.50; refer to Table 4 for the mix ratios.

Table 1.
Test results of geopolymer concrete material properties.
Table 2.
The basic properties of coarse aggregate (granite crushed stone).
Table 3.
Chemical composition of slag powder and metakaolin %.
Table 4.
Mixture ratio of geopolymer concrete kg/m3.
The pull-out reinforcements for the test included HRB400 ECR with diameters of 14 mm, 16 mm and 20 mm and HRB400 ordinary threaded reinforcement with a diameter of 20 mm. HRB335 ordinary threaded reinforcement with a diameter of 8 mm was used as an erection bar and hoop reinforcement. See Table 5 for the key performance data for the reinforcements.
Table 5.
Main performance parameters of reinforcement.
2.2. Specimen Design
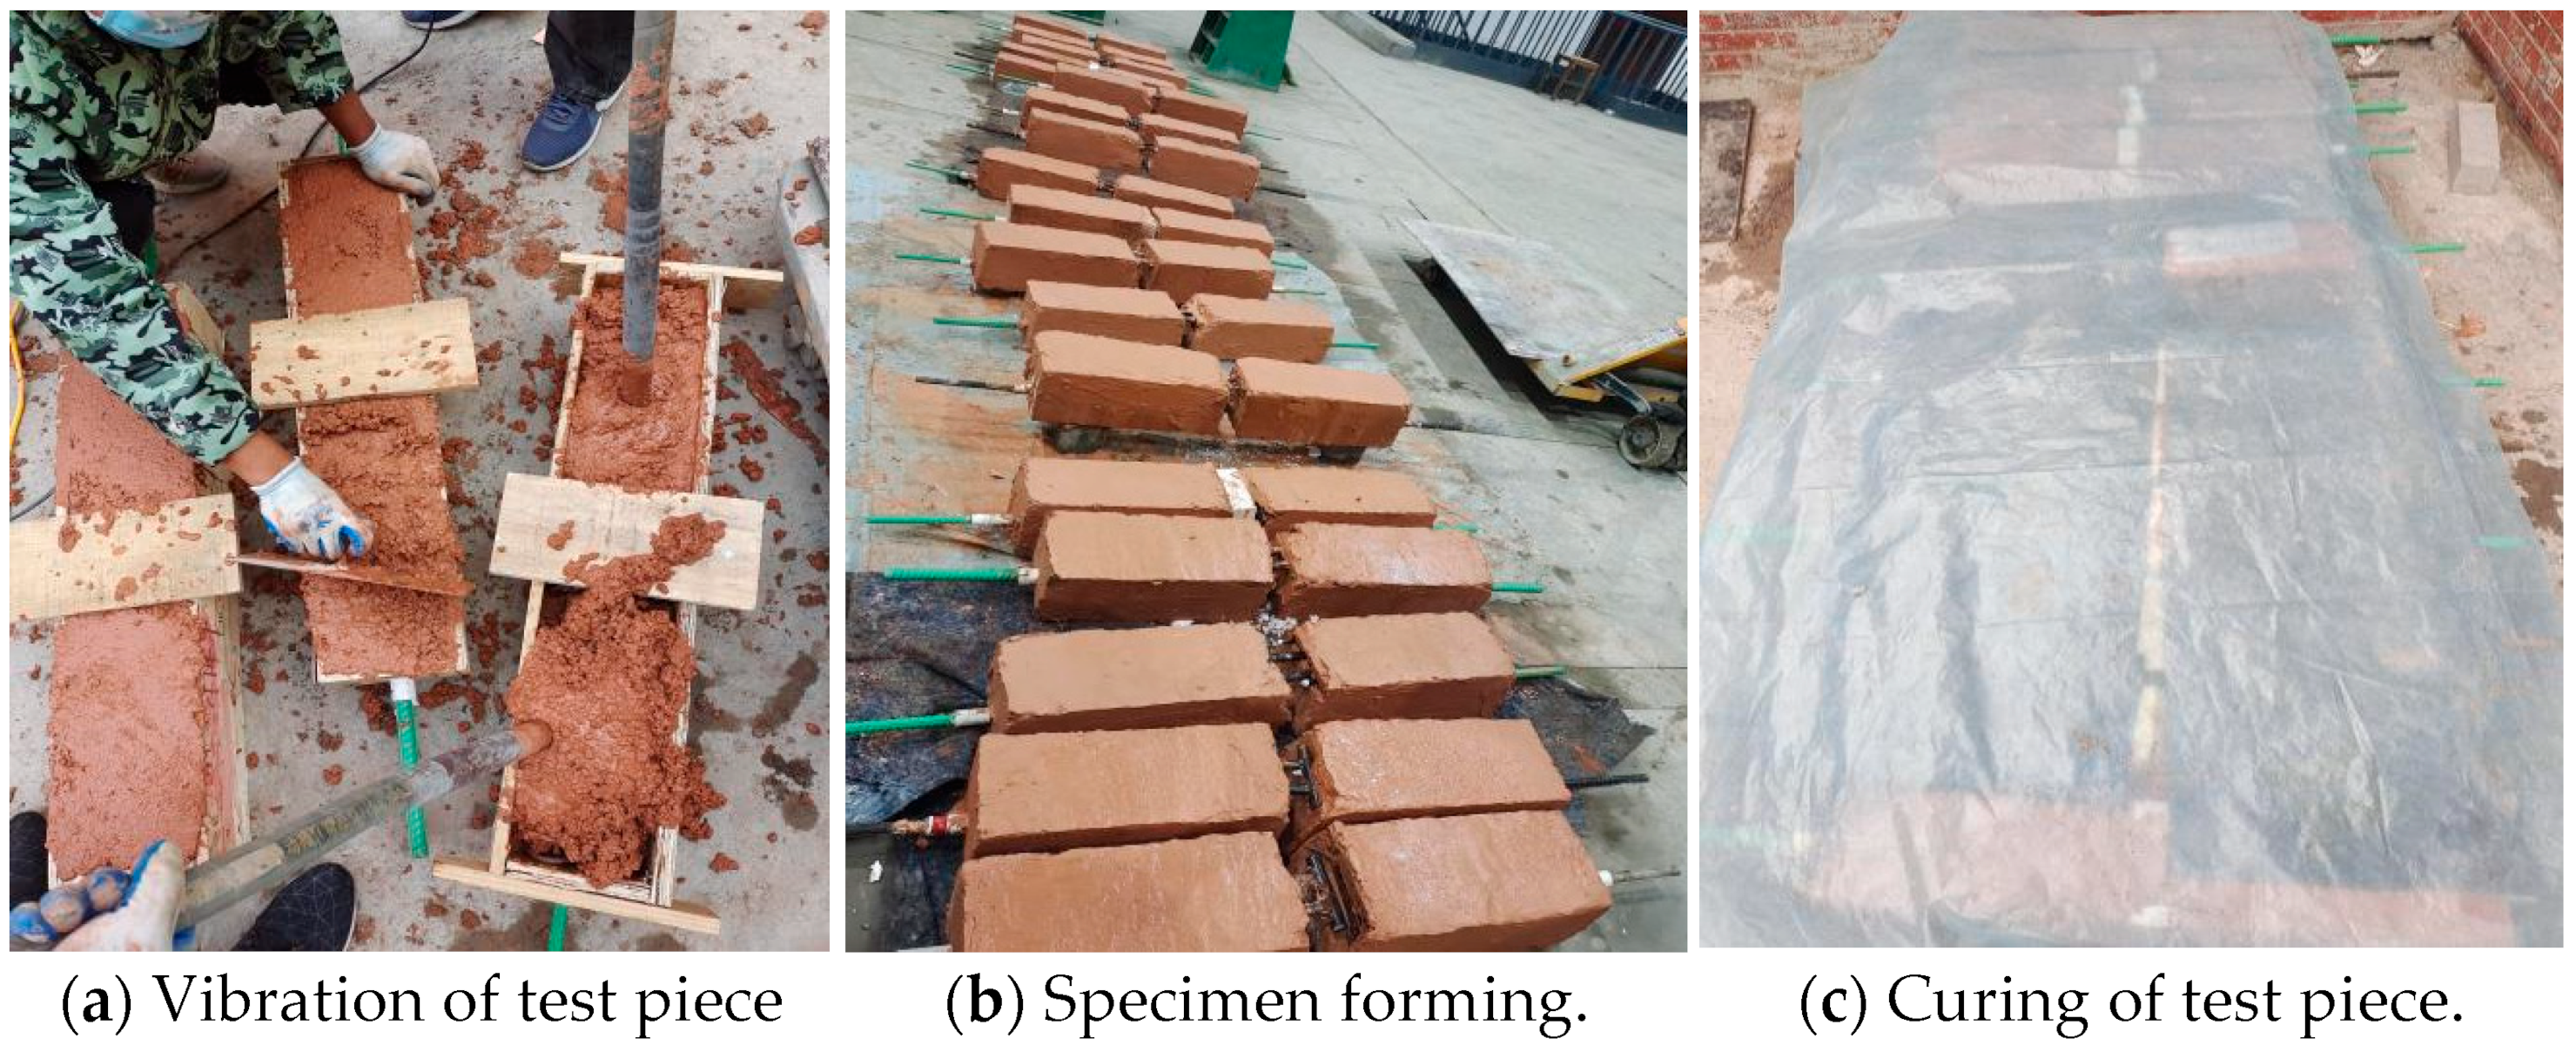
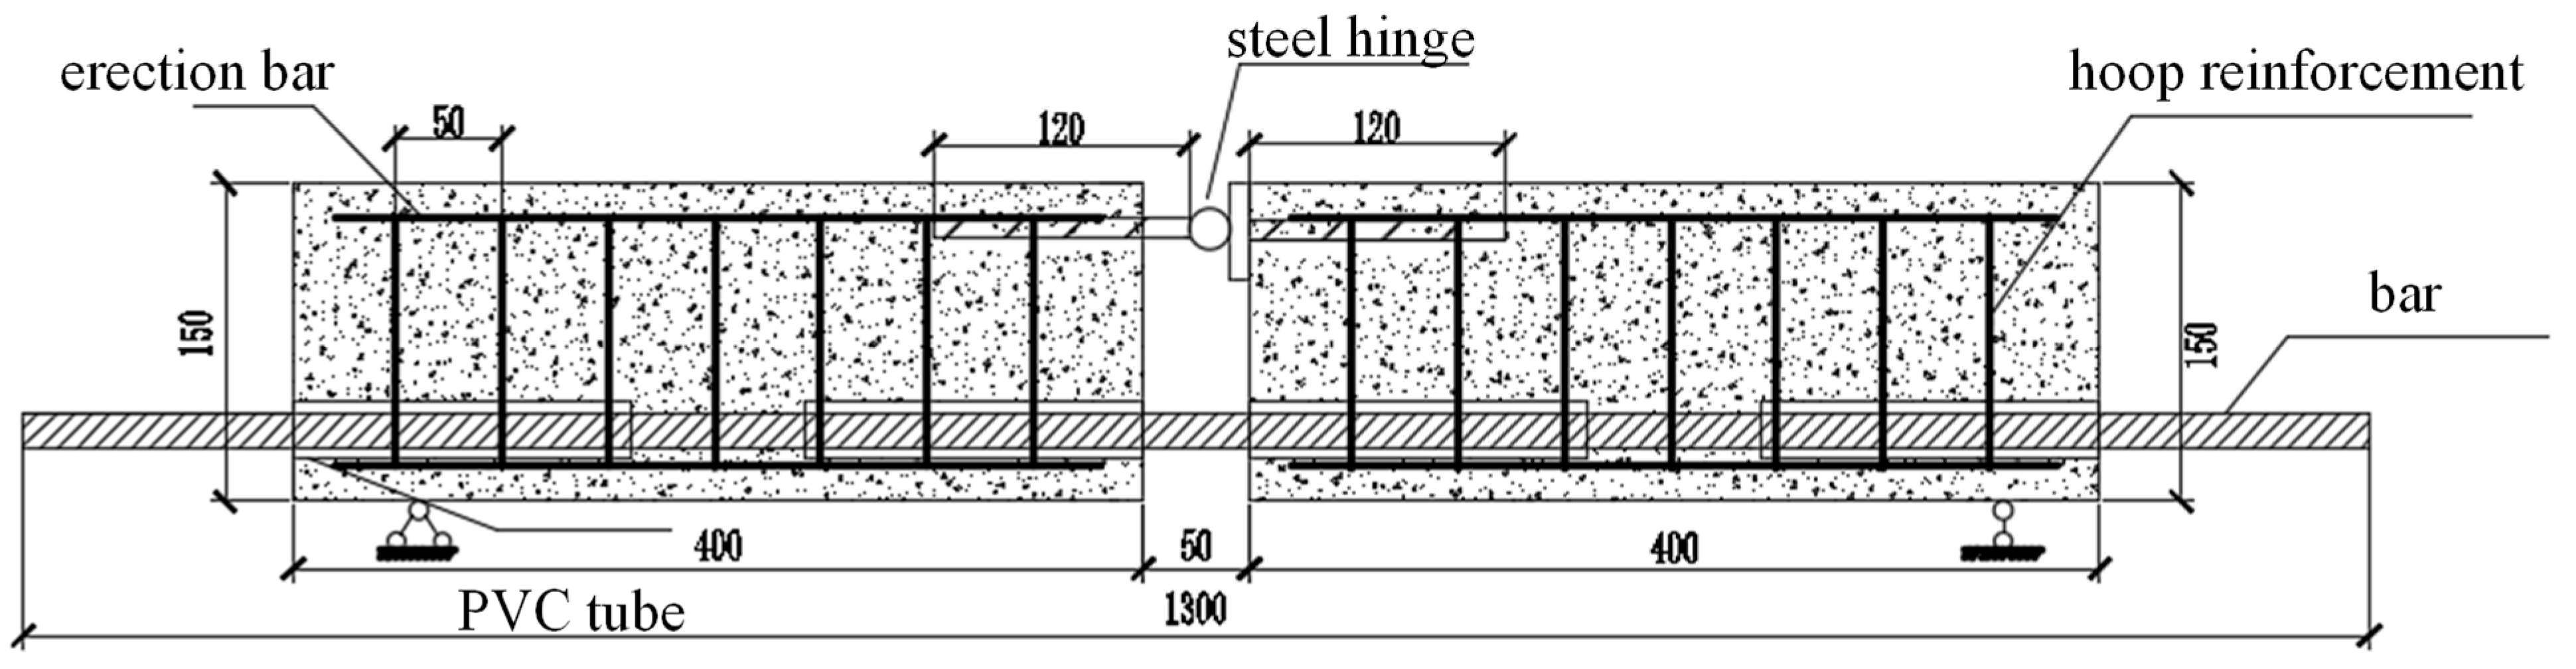
With an overall size of 150 mm × 150 mm × 850 mm, the beam specimens were composed of left and right halves, between which was a gap of 50 mm; they were connected to the bottom tensile reinforcement via a steel hinge in the compression zone. Seven annular hoop reinforcements of 8 mm in diameter were evenly arranged at a spacing of 50 mm in each beam, and four HRB335 erection bars with a diameter of 8 mm and a length of 360 mm were arranged longitudinally in the hoop reinforcement corners. The thickness of the concrete cover was 20 mm. The sample preparation process is shown in Figure 1. The whole beam, composed of two half beams, was connected by the middle steel strand. The steel strand of this structural form is simple in fabrication, clear in structure and can make the force arm clear. It is convenient to calculate the tensile force of reinforcement according to the test load and can effectively limit its horizontal displacement. The length of the drawn reinforcement in the beam specimen was 1300 mm. In order to avoid the influence of bearing reaction force and make the bond stress in the bond section of the test piece evenly distributed, the test was carried out by means of local bond of reinforcement. First, the rebar bonding area was set in the middle of the two blocks. The nonbonding zone of the pull-out reinforcement was separated from the geopolymer concrete through a PVC tube, both ends of which were blocked with a foaming agent to avoid ingress of mortar into the tube during pouring. Figure 2 shows the dimensions of the specimens and the reinforcement configuration.
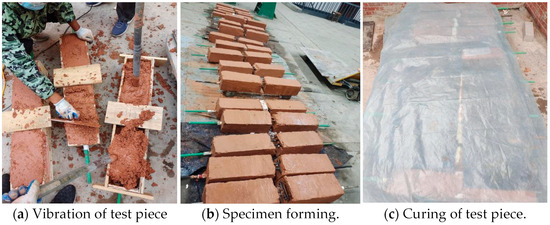
Figure 1.
Sample preparation process.
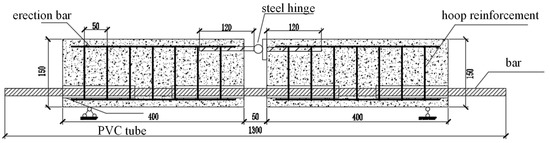
Figure 2.
Size and reinforcement of the beam specimen (unit: mm).
The beam specimens were divided into four groups (13 pieces in total). For Groups A, B, C and D, the effects of the geopolymer concrete strength, reinforcement diameter, reinforcement type and bond length on the bond performance between reinforcement and geopolymer concrete were investigated, respectively. The specimen groups and detailed parameters are shown in Table 6. Among them, the number of GC45-20-5d-H specimens in Group B and GC45-20-5d-H specimens in group D have been included in other groups. The specimens were denoted by the parameters; for instance, for specimen GC45-14-5d-H, “GC45” indicates geopolymer concrete with a strength grade of C45, “14” denotes a reinforcement diameter of 14 mm, “5d” indicates that the length of the bond segment between the reinforcement and geopolymer concrete is five times the reinforcement diameter and “H” represents ECR. In addition, “P” stands for ordinary threaded reinforcement.
Table 6.
Details of specimens for the beam test.
To determine the compressive strength and splitting tensile strength of geopolymer concrete, the beam specimens were formed into 100 mm × 100 mm × 100 mm cube blocks as per the Standard for Test Method of Mechanical Properties on Ordinary Concrete. The beam specimens and cube specimens were released at 72 h and 24 h after pouring, respectively, and then cured at room temperature for 28d for testing.
2.3. Test Process and Loading Device
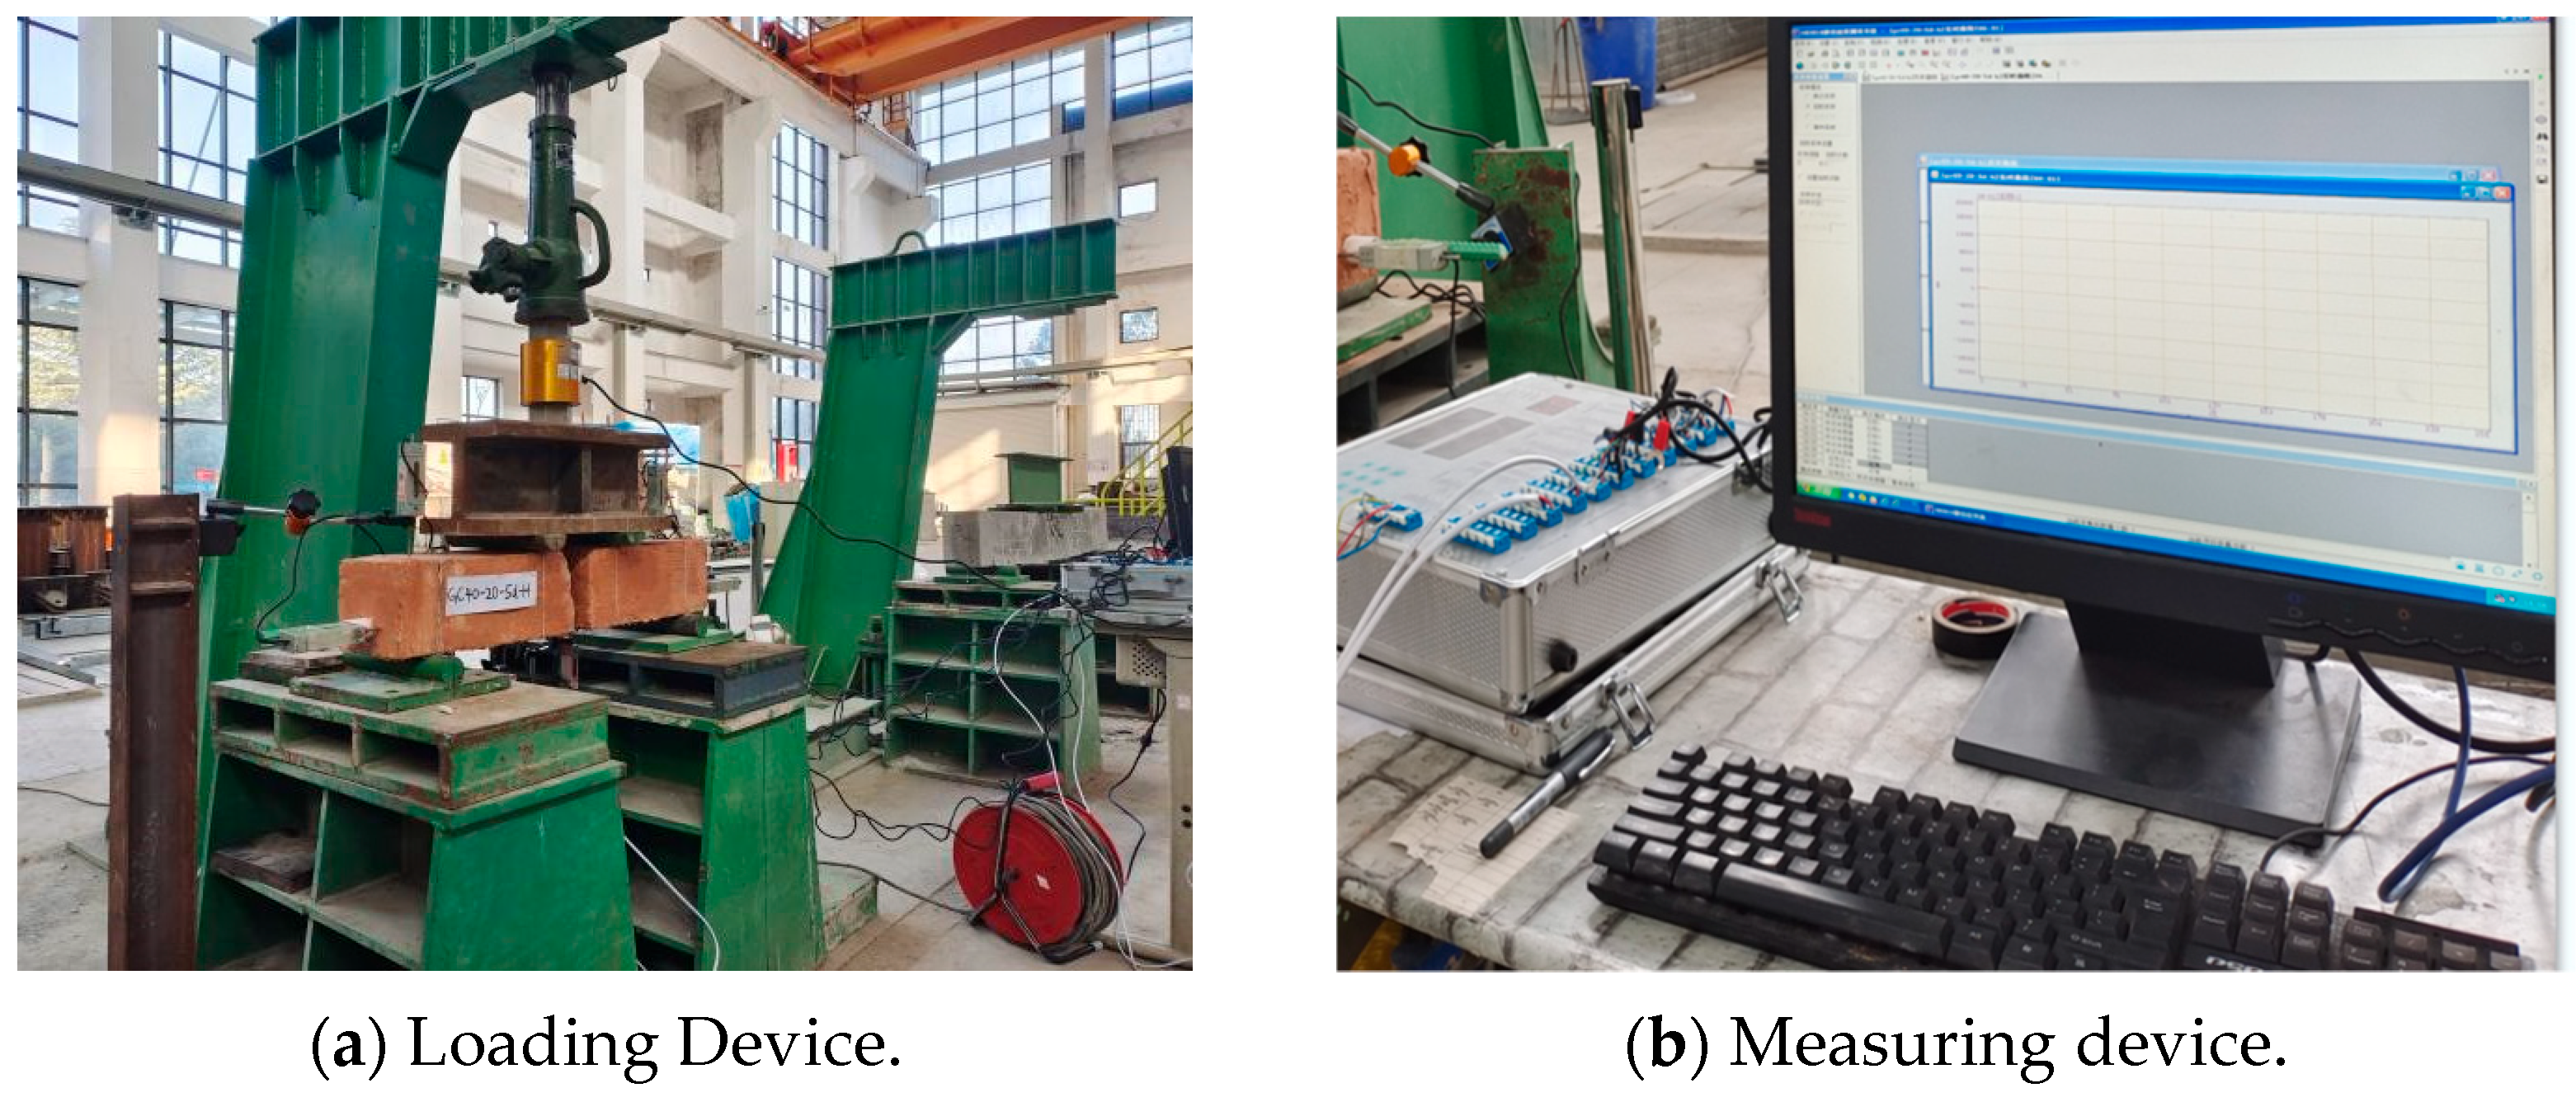
The data of the load, displacement and strain in the beam test were recorded by the Donghua DH3818 digital automatic acquisition instrument. The schematic diagram of loading device and measuring device is shown in Figure 3. Before the test, balance and zero adjustment were carried out to check the operating condition of the instrument. During the loading process, the slip and deflection changes of the specimen were closely observed, as well as whether there were cracks on the beam surface. If there was a crack, the load at the time of the crack was quickly recorded next to the crack, and the crack condition was observed. The beam test was performed following the Standard for Test Method of Concrete Structures. Stepped loading was performed using a 50t manual split hydraulic jack with a 50 t BLR-1 load cell, and the dead weight of the specimen was neglected. Preloading was conducted to check if the support was stable and if the instruments and loading equipment were in good condition, and the meters were zeroed before the start of the test. The beam specimens were controlled to be stressed within the elastic range during preloading to avoid cracks and other forms of loading residual values. The formal loading was at a step of 5 kN. To accurately obtain the test data and respect the fact that stress relaxation may occur in the reinforcement under external forces, the loading of each step lasted for 5 min, and the load and displacement data were acquired after stabilization; then, the next step of loading was started, which proceeded until the specimen failed. Since the two beam halves were not necessarily perfectly symmetrical with each other when the specimen failed, the test ended when one of them exhibited shear/bending/bonding failure features or when the load dropped rapidly and remained unbearable after reloading. In addition, when the specimen failed, the test was stopped to keep the researchers and instruments safe before the reinforcement broke.
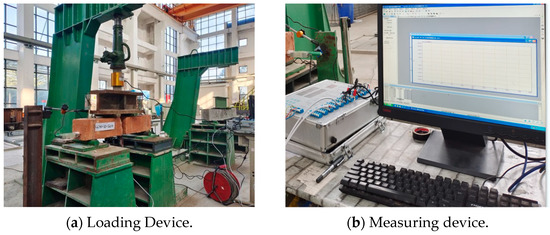
Figure 3.
Schematic diagram of the loading device and measuring device.
Figure 4 shows the loading and measuring devices. In the figure, displacement meters ① and ⑥ were used to measure the free end slip of the pull-out reinforcement; displacement meters ② and ⑤ were used to measure the vertical displacement of the two beam halves at the support; displacement meters ③ and ④ were used to determine the mid-span deflection of the beam; and strain gauges ⑦ and ⑧ were used to measure the strain in the pull-out reinforcement.
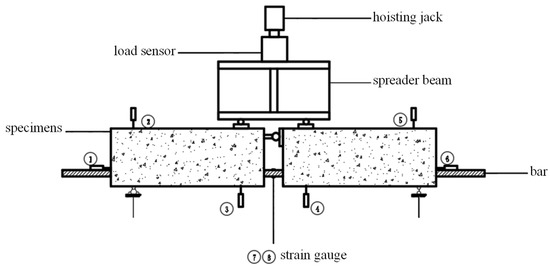
Figure 4.
Test loading device.
3. Test Results and Analysis
3.1. Failure Mode
The beam specimens exhibited three failure modes during the test, i.e., reinforcement pull-out failure, concrete splitting failure and concrete splitting-reinforcement pull-out failure (hereinafter referred to as “split-pull-out failure”).
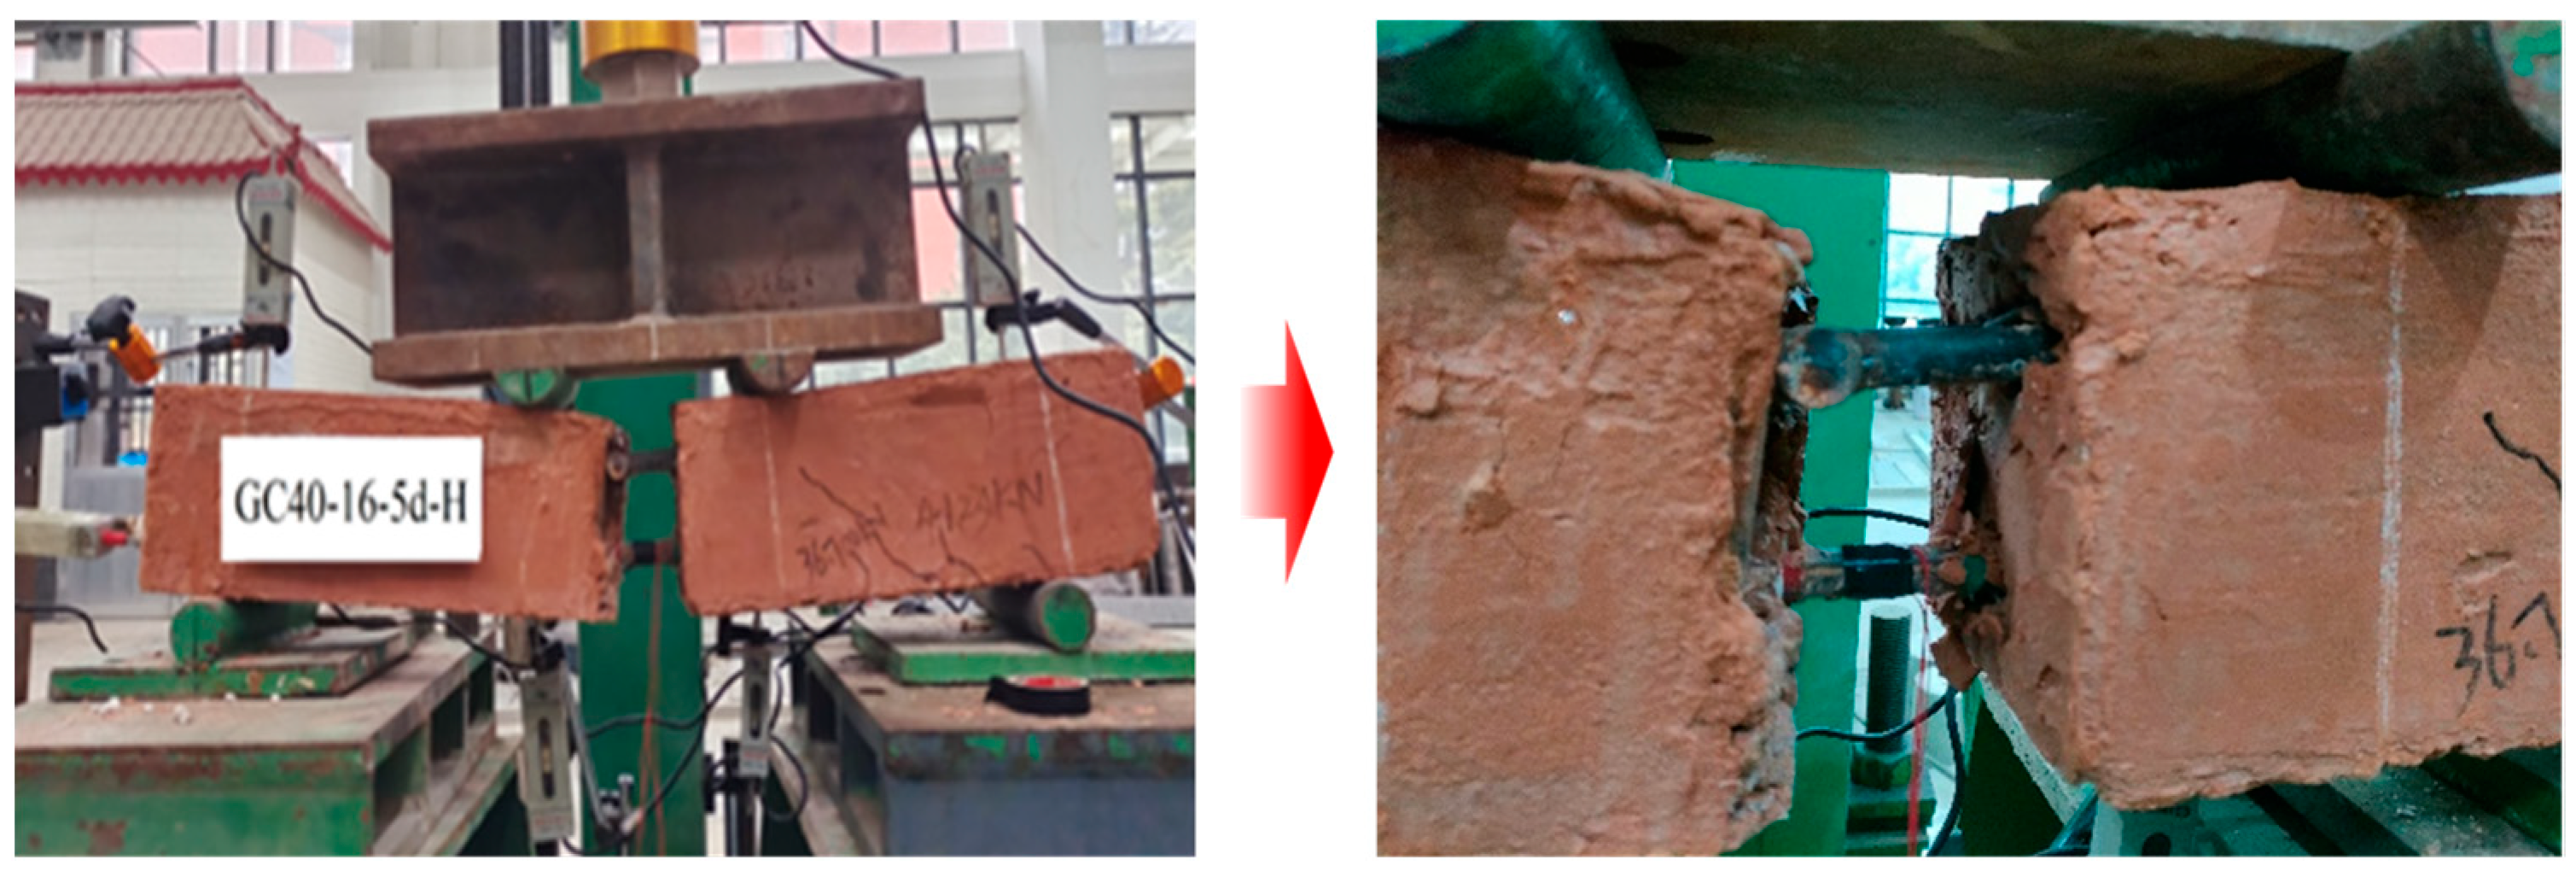
Reinforcement pull-out failure: As the external load continued to increase, the free end slip of the reinforcement increased progressively, as did the distance between the two beam halves. The concrete between the reinforcing ribs was damaged, and the reinforcement was pulled out slowly and exhibited certain ductility. However, no obvious cracks were observed on the surface of the specimen. Such failure principally took place in specimens of shorter lengths or lower concrete strength in the pull-out reinforcement bond zone, e.g., specimens GC45-14-5d-H, GC45-16-5d-H and GC40-16-5d-H. Specimen GC40-16-5d-H was taken as an example of the failure mode; see Figure 5.

Figure 5.
Steel bar pull-out failure (specimen GC40-16-5d-H).
Concrete splitting failure: Under external loads, large cracks developed suddenly and extended rapidly in the specimen, forming splitting cracks due to the inadequate concrete strength. The specimen failed without any precursors and showed obvious brittleness. The splitting cracks extended longitudinally from the loading point and then extended obliquely at 45° from the steel hinge joint to the bottom support, finally running through it. There was no obvious slip at the free end of the reinforcement, but the concrete at the bottom of the beam fell off. Such failure principally took place in specimens with a large reinforcement diameter, e.g., specimens GC40-20-5d-H, GC45-20-5d-H and GC45-20-5d-P. Specimen GC40-20-5d-H was taken as an example of the failure mode; see Figure 6.
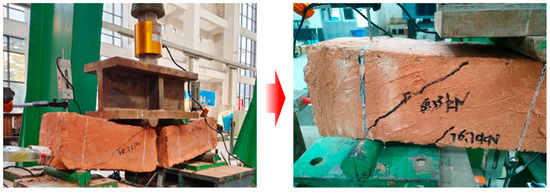
Figure 6.
Concrete splitting failure (specimen GC40-20-5d-H).
Split-pull-out failure: There were obvious splitting cracks on the surface of the specimens when they failed, and the free end of the reinforcement slipped significantly. However, the specimens did not split into two. One kind of crack occurred at the support or bond of the beam type specimen, which was inclined 45° to the axis of the reinforcement and was connected with the transverse crack in the anchorage zone at the bottom of the beam. Another type of crack extended along the centre of the beam bottom. Generally, cracks were found in half of the beam specimen. The other half of the beam did not show obvious cracks until the end of the test. The splitting cracks extended diagonally at 45° from the loading point, gradually widened and extended to the support, and finally formed penetrating cracks. Such failure principally took place in specimens with a medium length and a small reinforcement diameter in the bond segment, e.g., specimen GC40-16-7d-H. See Figure 7 for the specific failure modes.
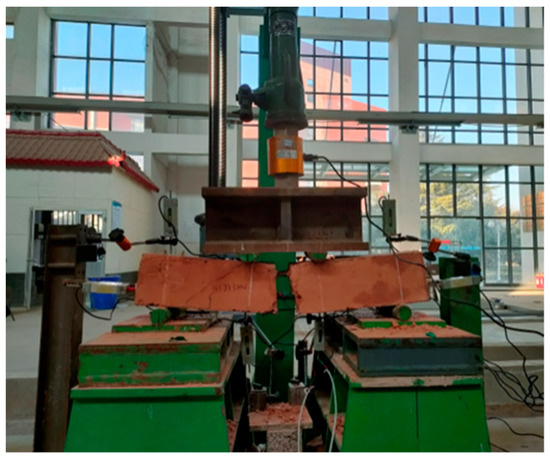
Figure 7.
Splitting-pull-out failure (specimen GC40-16-7d-H).
3.2. Factors Affecting the Bond Performance between Reinforcement and Geopolymer Concrete
3.2.1. Calculation of the Bond Strength
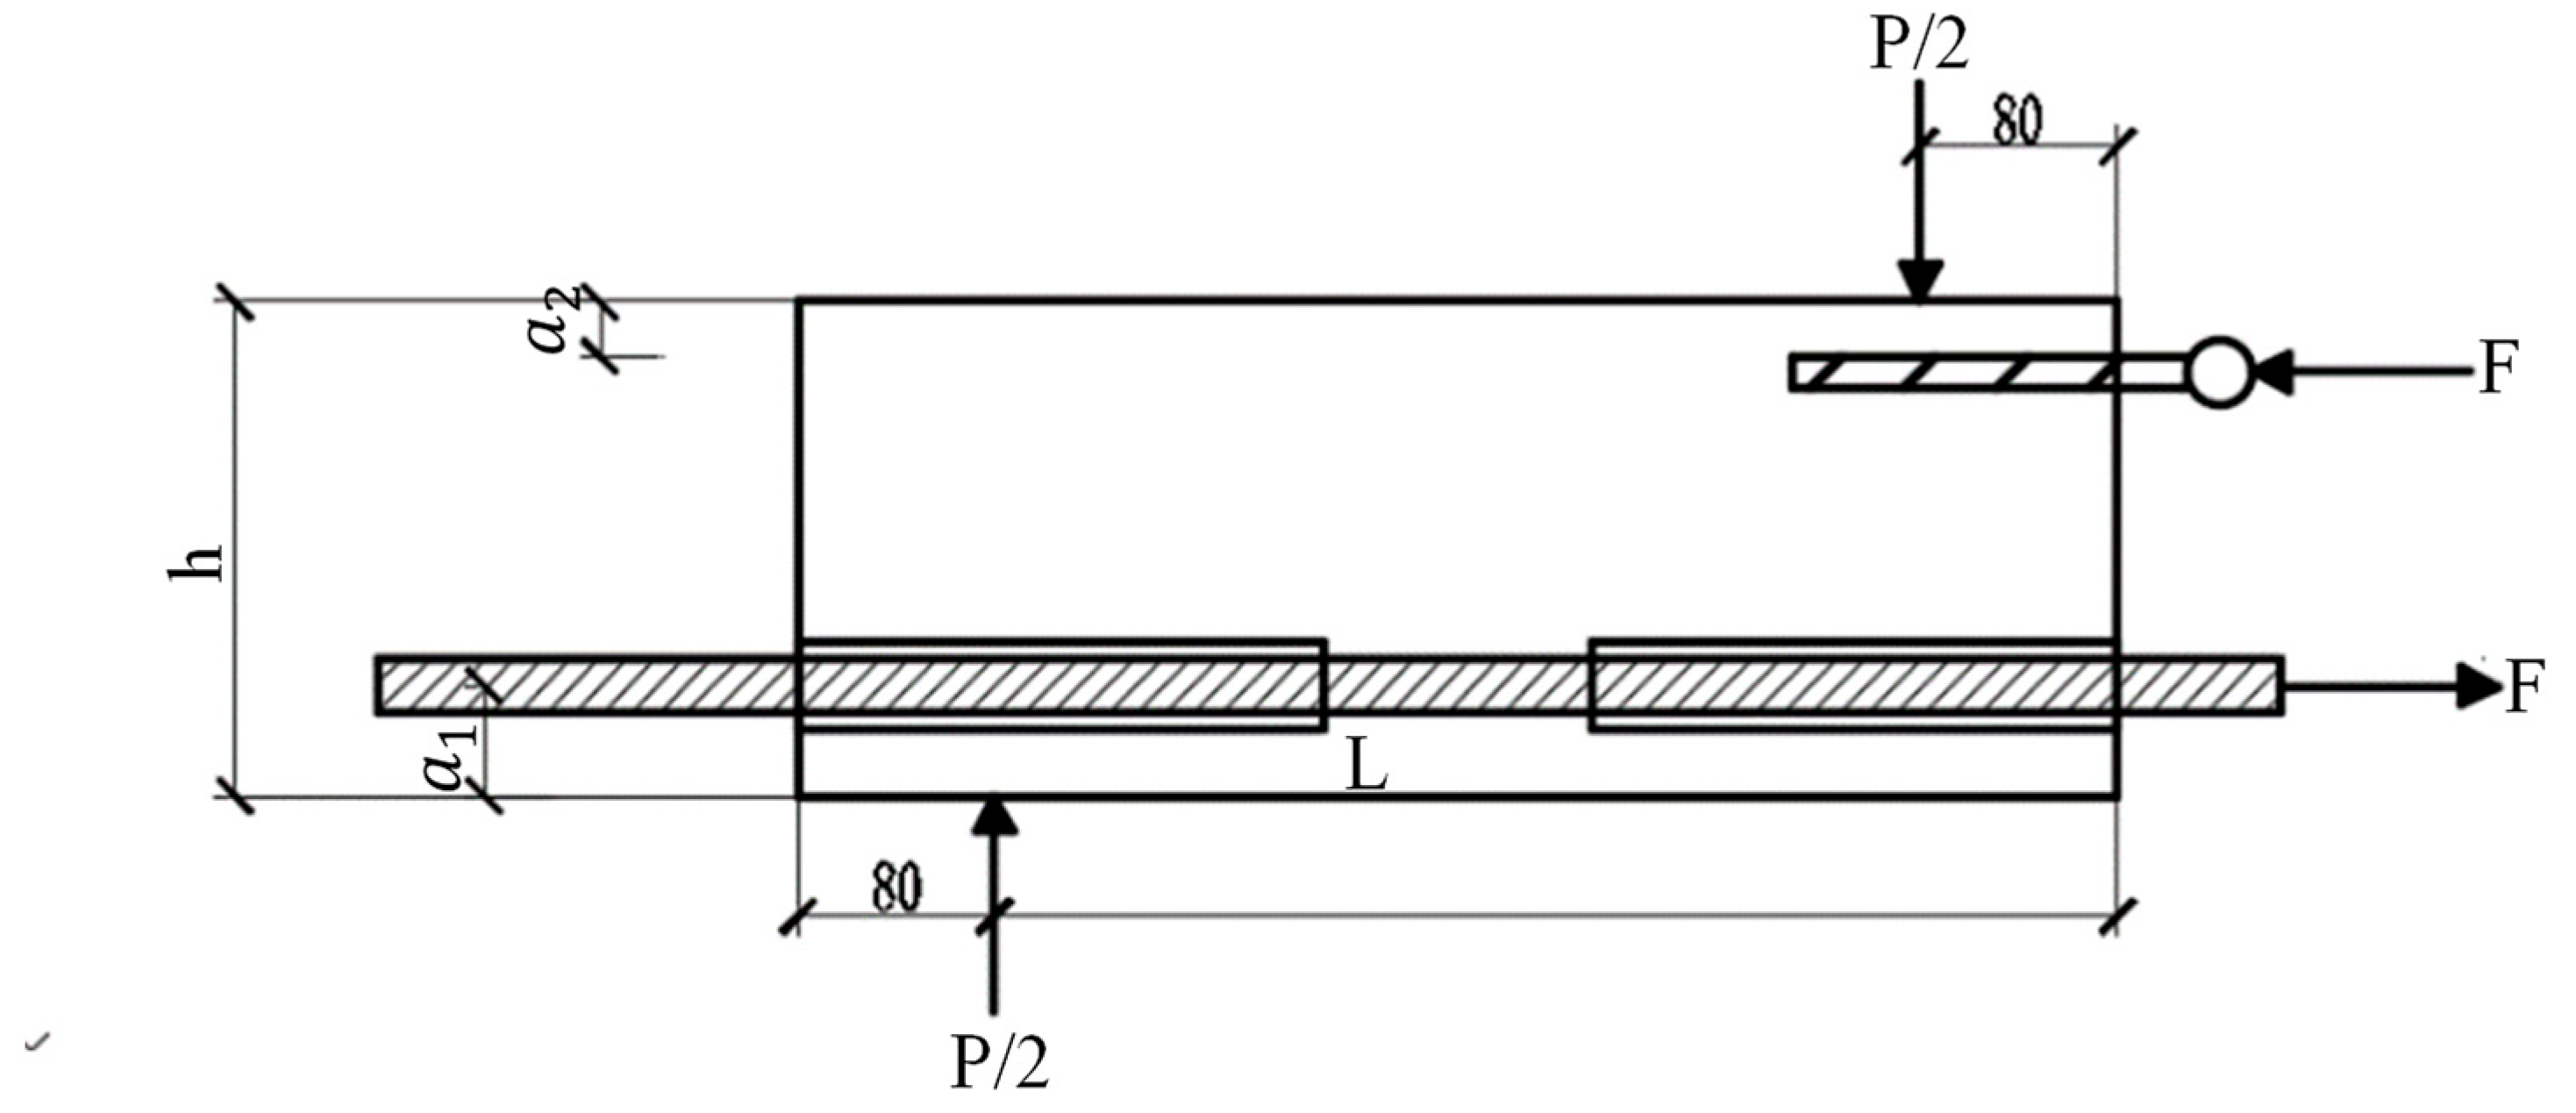
The left beam half was isolated and used for the stress analysis (Figure 8). F denotes the steel hinge force on the left beam half. The tension F of the pull-out reinforcement is determined based on moment balance conditions:
where P denotes the test load in kN; L represents the horizontal distance from the loading action line to the support (L = 240 mm); and a1 is the distance from the centroid line of the pull-out reinforcement to the beam bottom face. The thickness of the reinforcement cover is 20 mm, and the hoop reinforcement diameter is 8 mm. If the diameter of the pull-out reinforcement is 14 mm, then a1 = 35 mm. If the diameter of the pull-out reinforcement is 16 mm, then a1 = 36 mm. If the diameter of the pull-out reinforcement is 20 mm, then a1 = 38 mm. a2 is the distance between the steel hinge centre and beam top face (a2 = 20 mm), and h stands for the height of the beam specimen (h = 150 mm).

Figure 8.
Force analysis diagram of the left half beam.
The computational equation of the ultimate bond strength is as follows:
where τu represents the ultimate bond strength in MPa; Fu denotes the ultimate tension (kN) corresponding to ultimate load Pu; d is the diameter of the pull-out reinforcement in mm; and la is the bond length in mm.
3.2.2. Strength of Geopolymer Concrete
The specimens of Group A were fabricated from the ECR of 20 mm in diameter and geopolymer concrete with various mix ratios, which were used to analyse the effect of geopolymer concrete strength on the bond performance between reinforcement and geopolymer concrete. Table 7 shows the test results of the specimens of Group A.
Table 7.
Test results of specimens in Group A.
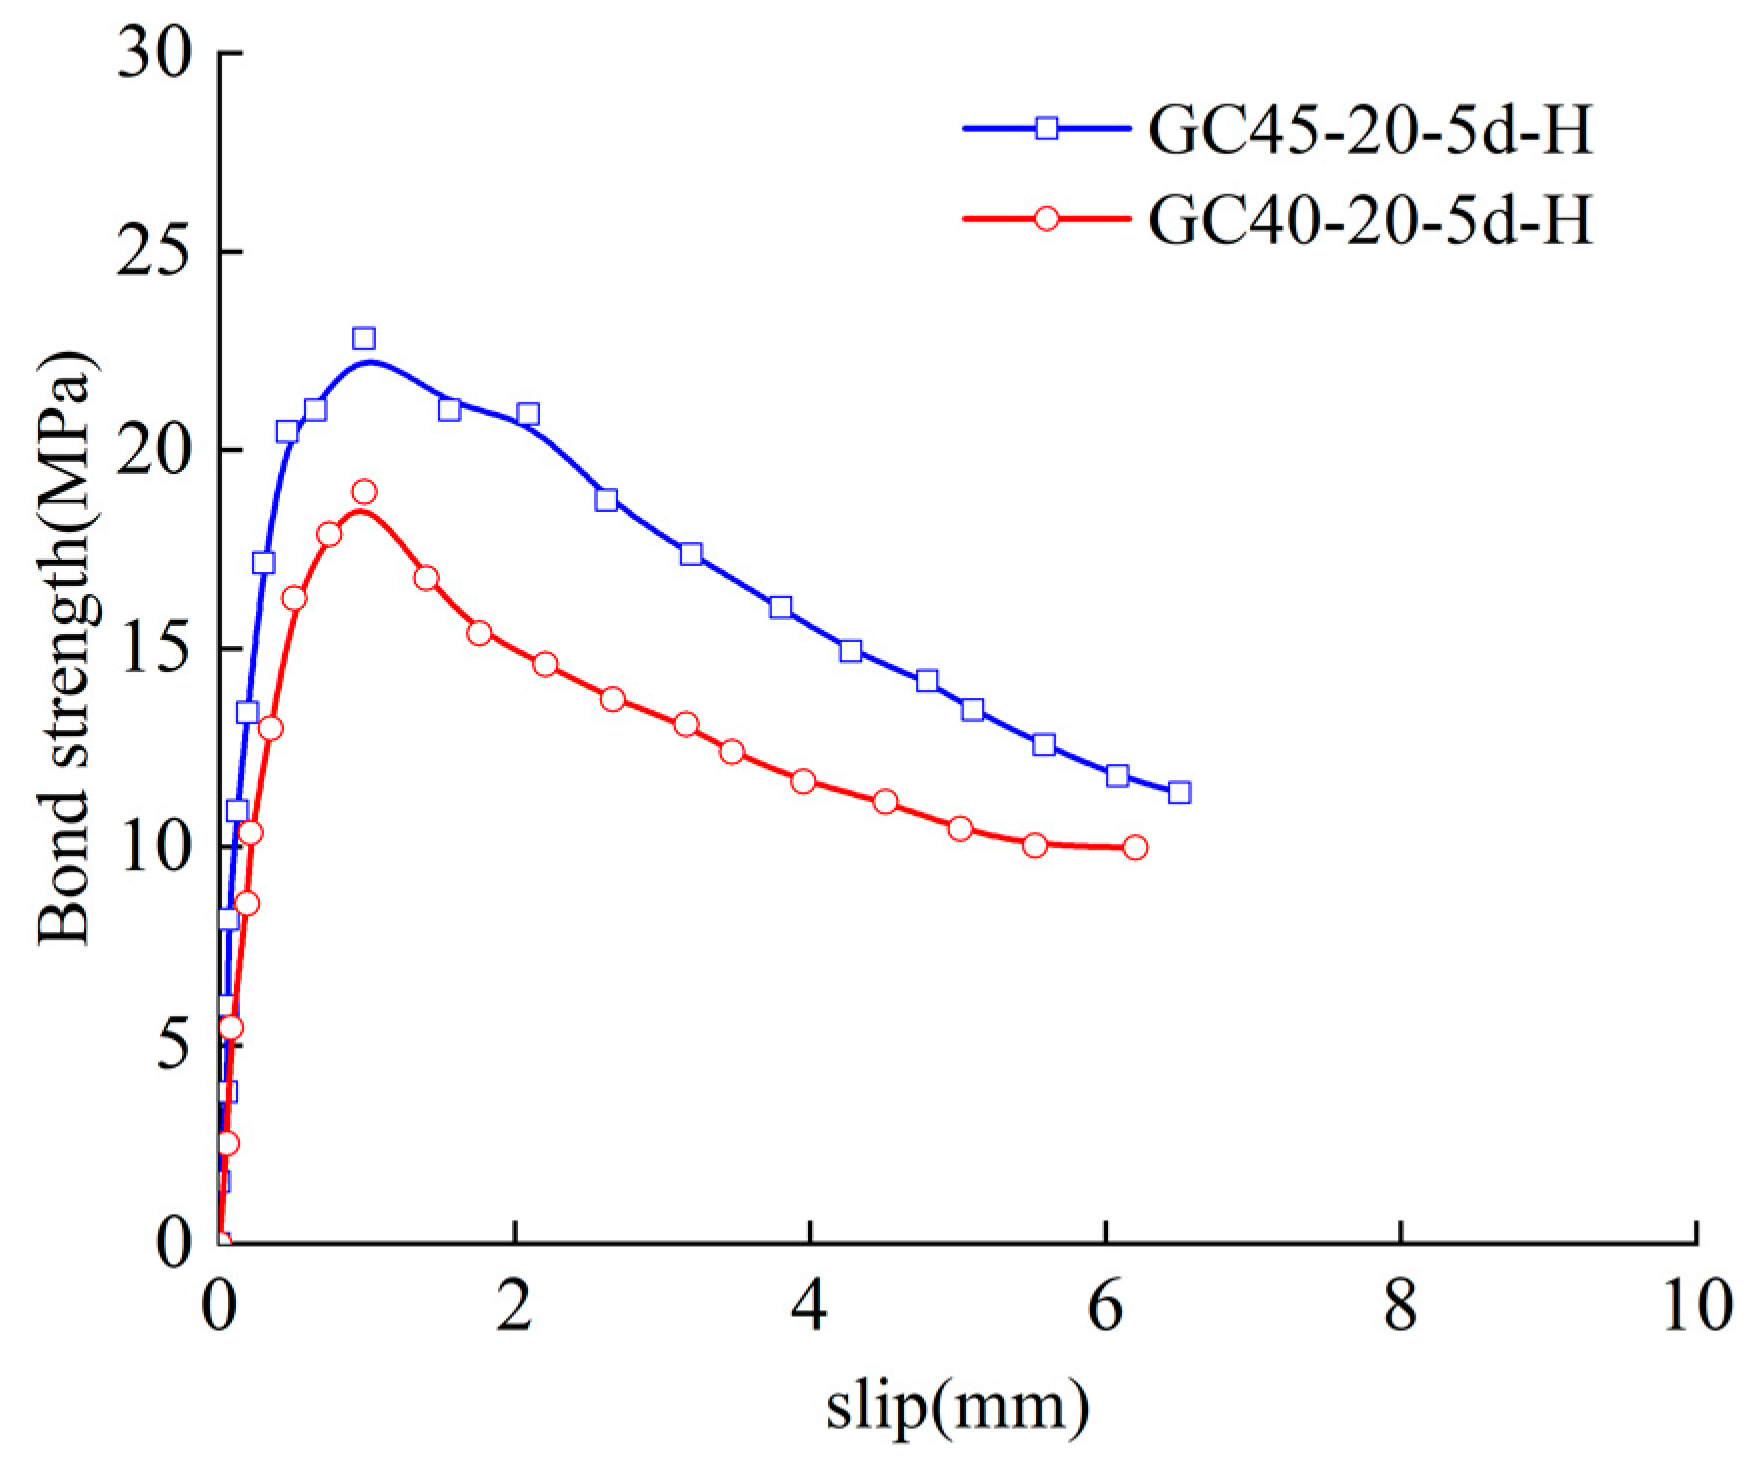
As shown in Table 7, the ultimate bond strength between ECR and geopolymer concrete increased with the rise of the geopolymer concrete strength. The ultimate bond strength of specimen GC45-20-5d-H was 16.97% higher than that of specimen GC40-20-5d-H, largely due to the fact that the increase in geopolymer concrete strength brought about an increase in the chemical adhesion, mechanical interaction and frictional resistance between the ECR and the geopolymer concrete.
Figure 9 illustrates the bond-slip curves of beam specimens of various strengths. As illustrated in Figure 9, the microslip segment and slip segment of the bond-slip curves of specimens GC45-20-5d-H and GC40-20-5d-H grew linearly with a large slope; the bond strength increased sharply, but the slip at the free end of the reinforcement was less significant. In the split segment, the increase in the bond strength slowed down, while the free end slip of the reinforcement increased progressively. When the ultimate bond strength was reached, the specimen underwent split failure and the bond strength decreased progressively; the free end slip of the reinforcement increased substantially, and the curve came to its descending segment.
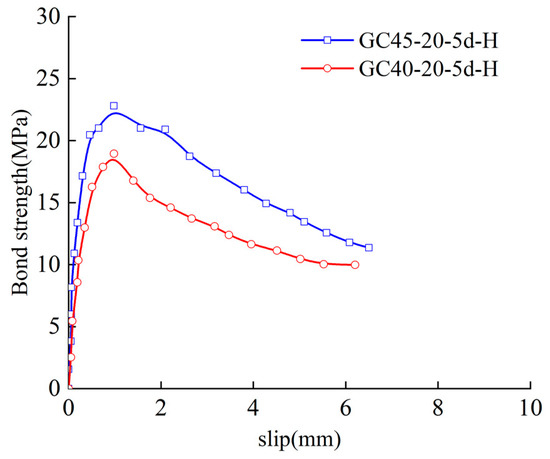
Figure 9.
Bond-slip curves of specimens with different concrete strength.
3.2.3. Reinforcement Diameter
The specimens of Group B were used to study the effect of reinforcement diameter on the bond performance between ECR and geopolymer concrete. The test results of the specimens of Group B are shown in Table 8.
Table 8.
Test results of specimens in Group B.
As shown in Table 8, the ultimate bond strength between ECR and geopolymer concrete decreased as the reinforcement diameter increased. The ultimate bond strength of specimen GC45-20-5d-H was 14.76% lower than that of GC45-16-5d-H, while the ultimate bond strength of specimen GC45-16-5d-H was 7.32% lower than that of GC45-14-5d-H. Furthermore, specimen GC45-20-5d-H underwent concrete splitting failure, with two main causes. First, as the diameter of the ECR increased, the initial damage to the interface between reinforcement and concrete worsened, which gradually decreased the ability of the geopolymer concrete to hold the reinforcement and accelerated splitting failure in the geopolymer concrete. Second, under the action of longitudinal stress, the Poisson effect resulted in a slight reduction in the bond strength; as the reinforcement diameter increased, the reduction increased, which brought about a decrease in the friction force and mechanical interaction of the reinforcements with larger diameters.
Figure 10 presents the bond-slip curves of three specimens with diameters of 14 mm, 16 mm and 20 mm. As illustrated in Figure 10, the microslip segment of the bond-slip curve increased linearly. The curve began to increase nonlinearly in the slip segment as the free end slip of the reinforcement increased. Upon arrival at the ultimate bond strength, the bond strength of each specimen continued to decrease, while the free end slip of the reinforcement increased sharply. Then, the curve came to its descending segment, where the reinforcements of specimens with diameters of 14 mm and 16 mm were pulled out slowly (longer descending segment). The specimen with a diameter of 20 mm exhibited splitting cracks, corresponding to a shorter descending segment.
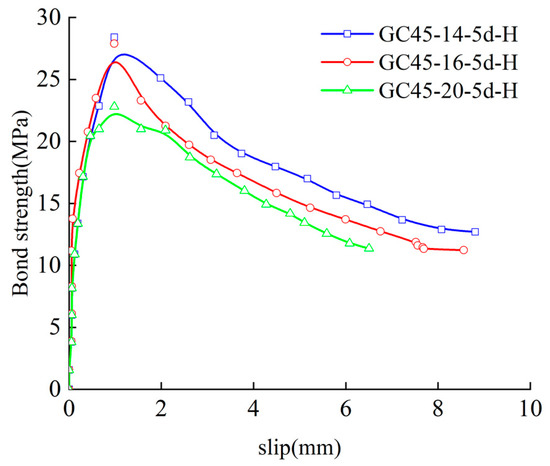
Figure 10.
Bond-slip curves of specimens with different reinforcement diameters.
3.2.4. Bond Length
The specimens of Group C shared the same water-binder ratio and reinforcement diameter, but their bond lengths were different. Table 9 presents the test results of the specimens of Group C.
Table 9.
Test results of specimens in Group C.
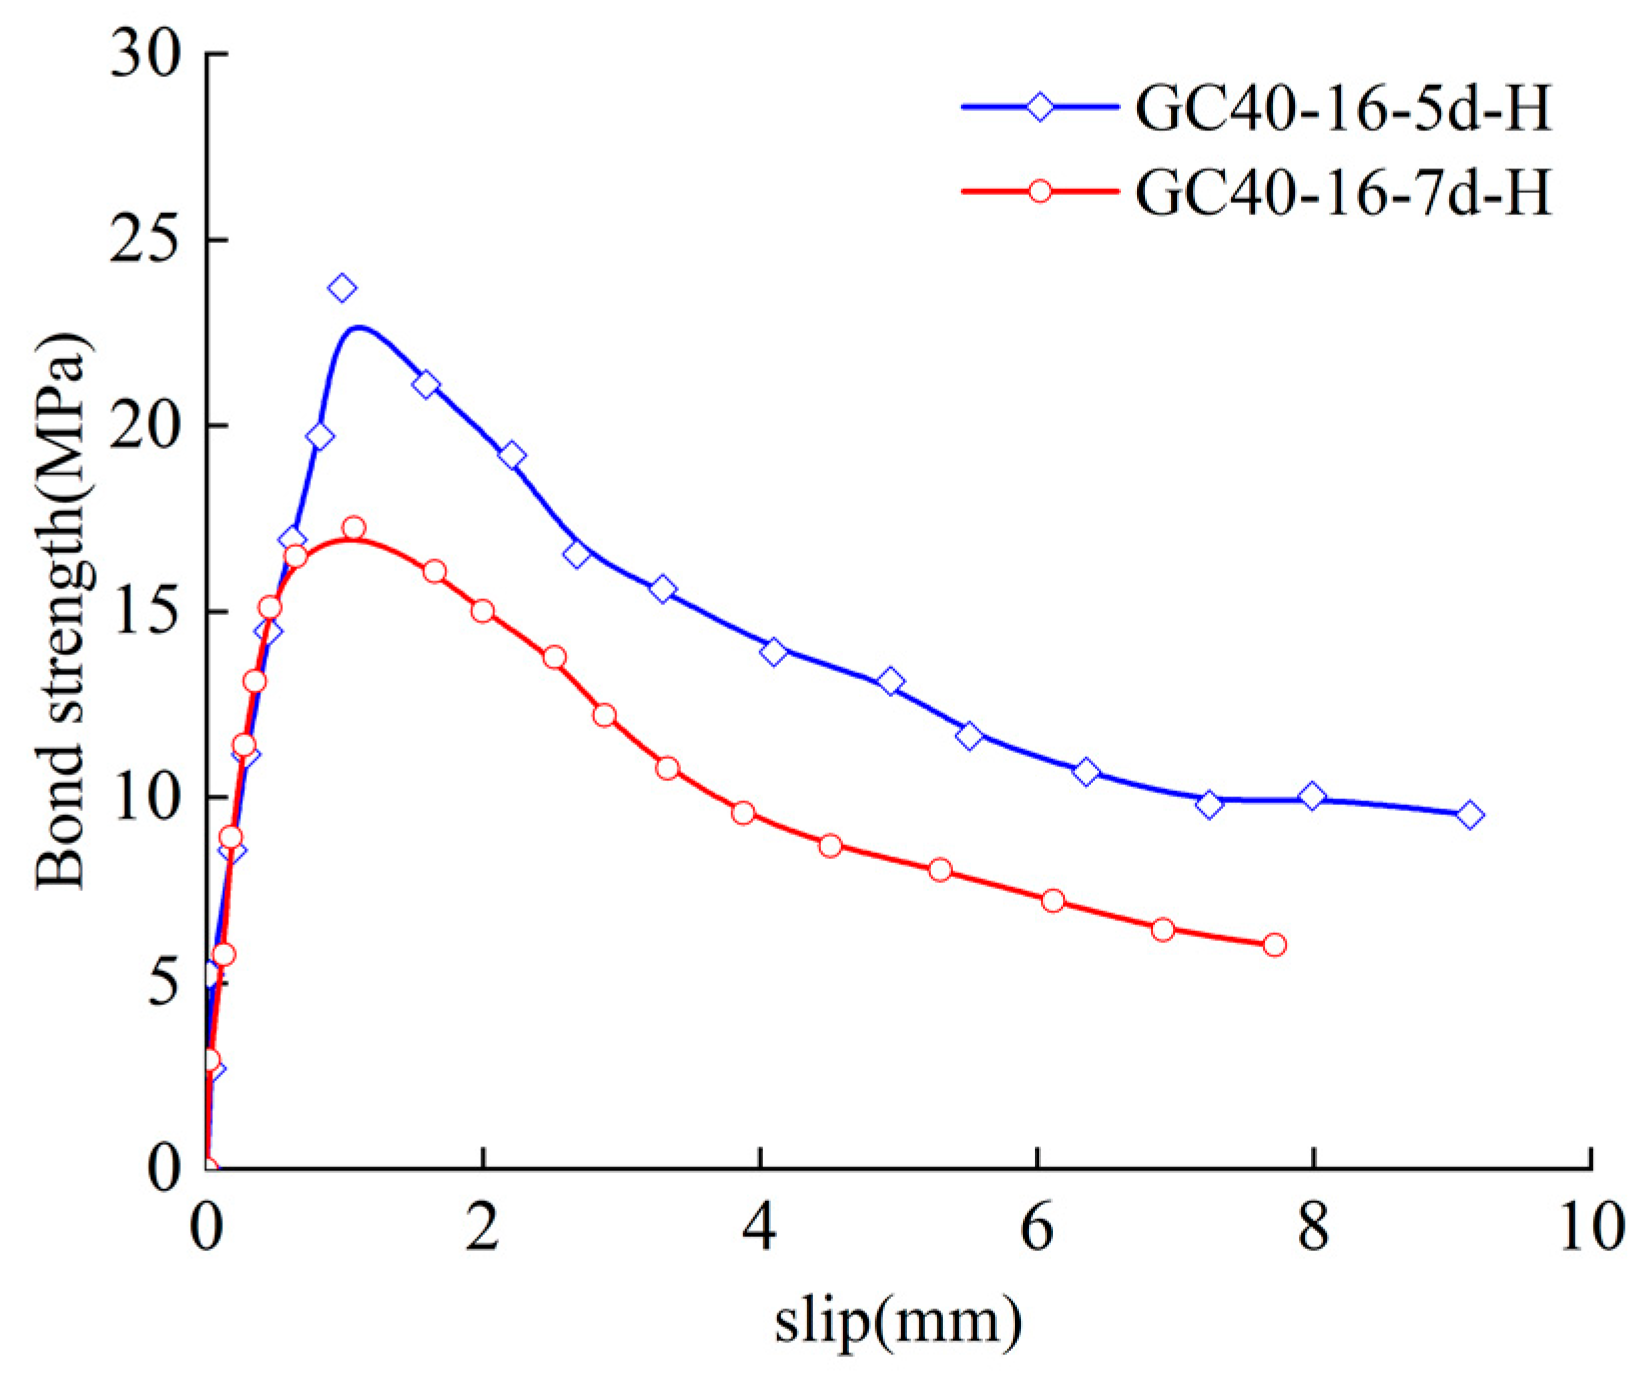
According to Table 9, the ultimate bond strength between the ECR and geopolymer concrete decreased as the bond length of the reinforcement increased. The ultimate bond strength of specimen GC40-16-7d-H was 25.80% lower than that of specimen GC40-16-5d-H because the ultimate bond strength is the mean ultimate bond strength within the reinforcement bond segment; as the ultimate load and bond length increased, the stress distribution in the ECR and geopolymer concrete became more uneven over the range of the bond length, resulting in the decrease in the ultimate bond strength.
Figure 11 illustrates the bond-slip curves of specimens with bond lengths of 5d and 7d. As illustrated in Figure 11, the bond-slip curves of GC40-16-5d-H and GC40-16-7d-H included an ascending segment, descending segment and residual segment. In the ascending segment, the bond strength was linearly related to the free end slip of the reinforcement, and the bond strength increased faster, while the free end slip of the reinforcement was extremely nonsignificant. The descending segment of specimens in which the reinforcement was pulled out was long and gentle, and the descending segment of specimens with split-pull-out failure was short and steep. In the residual segment, the bond strength tended to a fixed value, while the reinforcement slip continued to increase; in addition, the shorter the bond, the higher the residual bond strength.
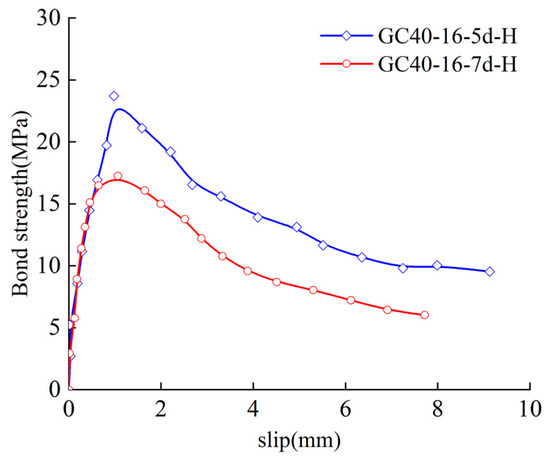
Figure 11.
Bond-slip curves of specimens with different bond lengths.
3.2.5. Reinforcement Type
The specimens of Group D were used to study the difference in the bond performance between ECR and steel bar of the same diameter with geopolymer concrete. Table 10 shows the test results of the specimens of Group D.
Table 10.
Test results of specimens in Group D.
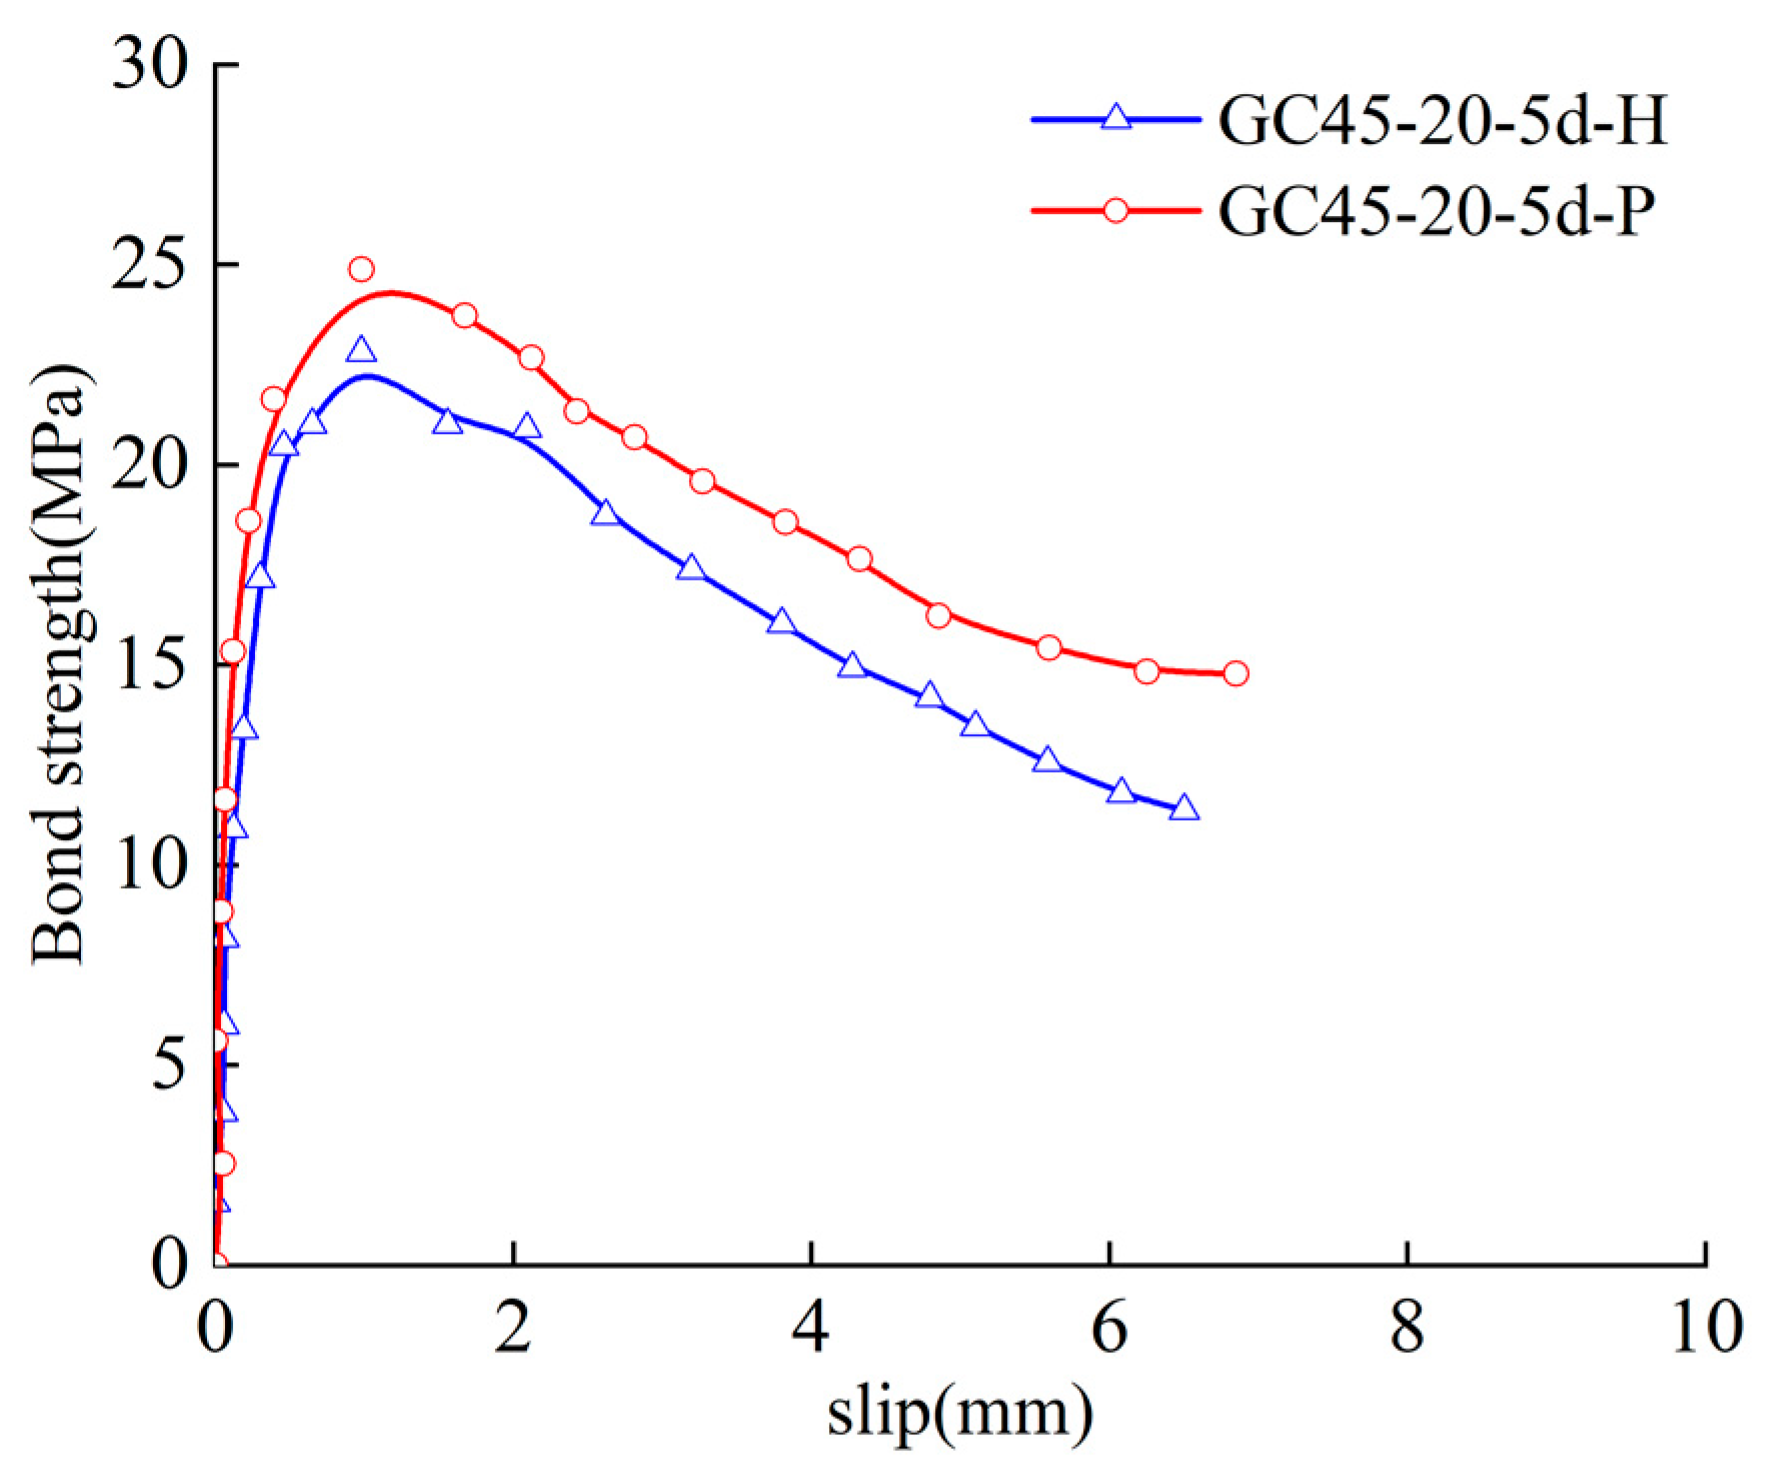
As shown in Table 10, all specimens underwent concrete splitting failure, which demonstrated that the type of reinforcement did not affect the failure mode of the specimen. Furthermore, the ultimate bond strength of the specimen with ECR was lower than that of the specimen with ordinary threaded reinforcement. The bond strength of specimen GC45-20-5d-H was 11.37% lower than that of specimen GC45-20-5d-P because the epoxy coating reduced the chemical adhesion and friction between the reinforcement and geopolymer concrete, which caused the bond strength of the ECR to be lower than that of the ordinary threaded reinforcement. The failure modes of the two specimens are consistent. It shows that the bonding property of epoxy-coated reinforced geopolymer concrete is slightly lower than that of ordinary reinforced concrete. However, the two kinds of steel bars do not change the failure mode of beam specimens.
Figure 12 illustrates the bond-slip curves of specimens with various types of reinforcement. As illustrated in Figure 12, in the microslip segment, the bond strength increased rapidly, and the free end of the reinforcement underwent microslip; as a result, the bond-slip curve increased in a straight line. In the slip stage, as the free end slip of the reinforcement increased, the curve slope of the ordinary threaded reinforcement was greater than that of the ECR. Upon arrival at the ultimate bond strength, the curve came to its descending segment, and the curve slopes of both descending segments were almost the same, while the bond strength of ordinary threaded reinforcement was higher than that of the ECR at all times.

Figure 12.
Bond-slip curves of specimens with different reinforcement types.
3.2.6. Bond-Slip Constitutive Model
Bond-slip models regarding reinforcements and ordinary concrete have been extensively studied in China and around the world [35,36], but bond-slip constitutive models of reinforcements and geopolymer concrete are rarely studied. Borrowing ideas from the bond-slip constitutive models of ECR and seawater-sea sand concrete presented in the literature [37], this paper proposes using the following three-stage model to describe the bond-slip relationship between ECR and geopolymer concrete based on the test data for the paper:
Ascending segment:
Descending segment:
Residual segment:
where α, k and λ are constants, which were assigned values of 0.419, 0.459 and 0.350, respectively; τ is the bond strength; τu represents the ultimate bond strength; τr denotes the bond strength of the residual segment; su is the slip value corresponding to the ultimate bond strength; and sr represents the slip value of the residual segment.
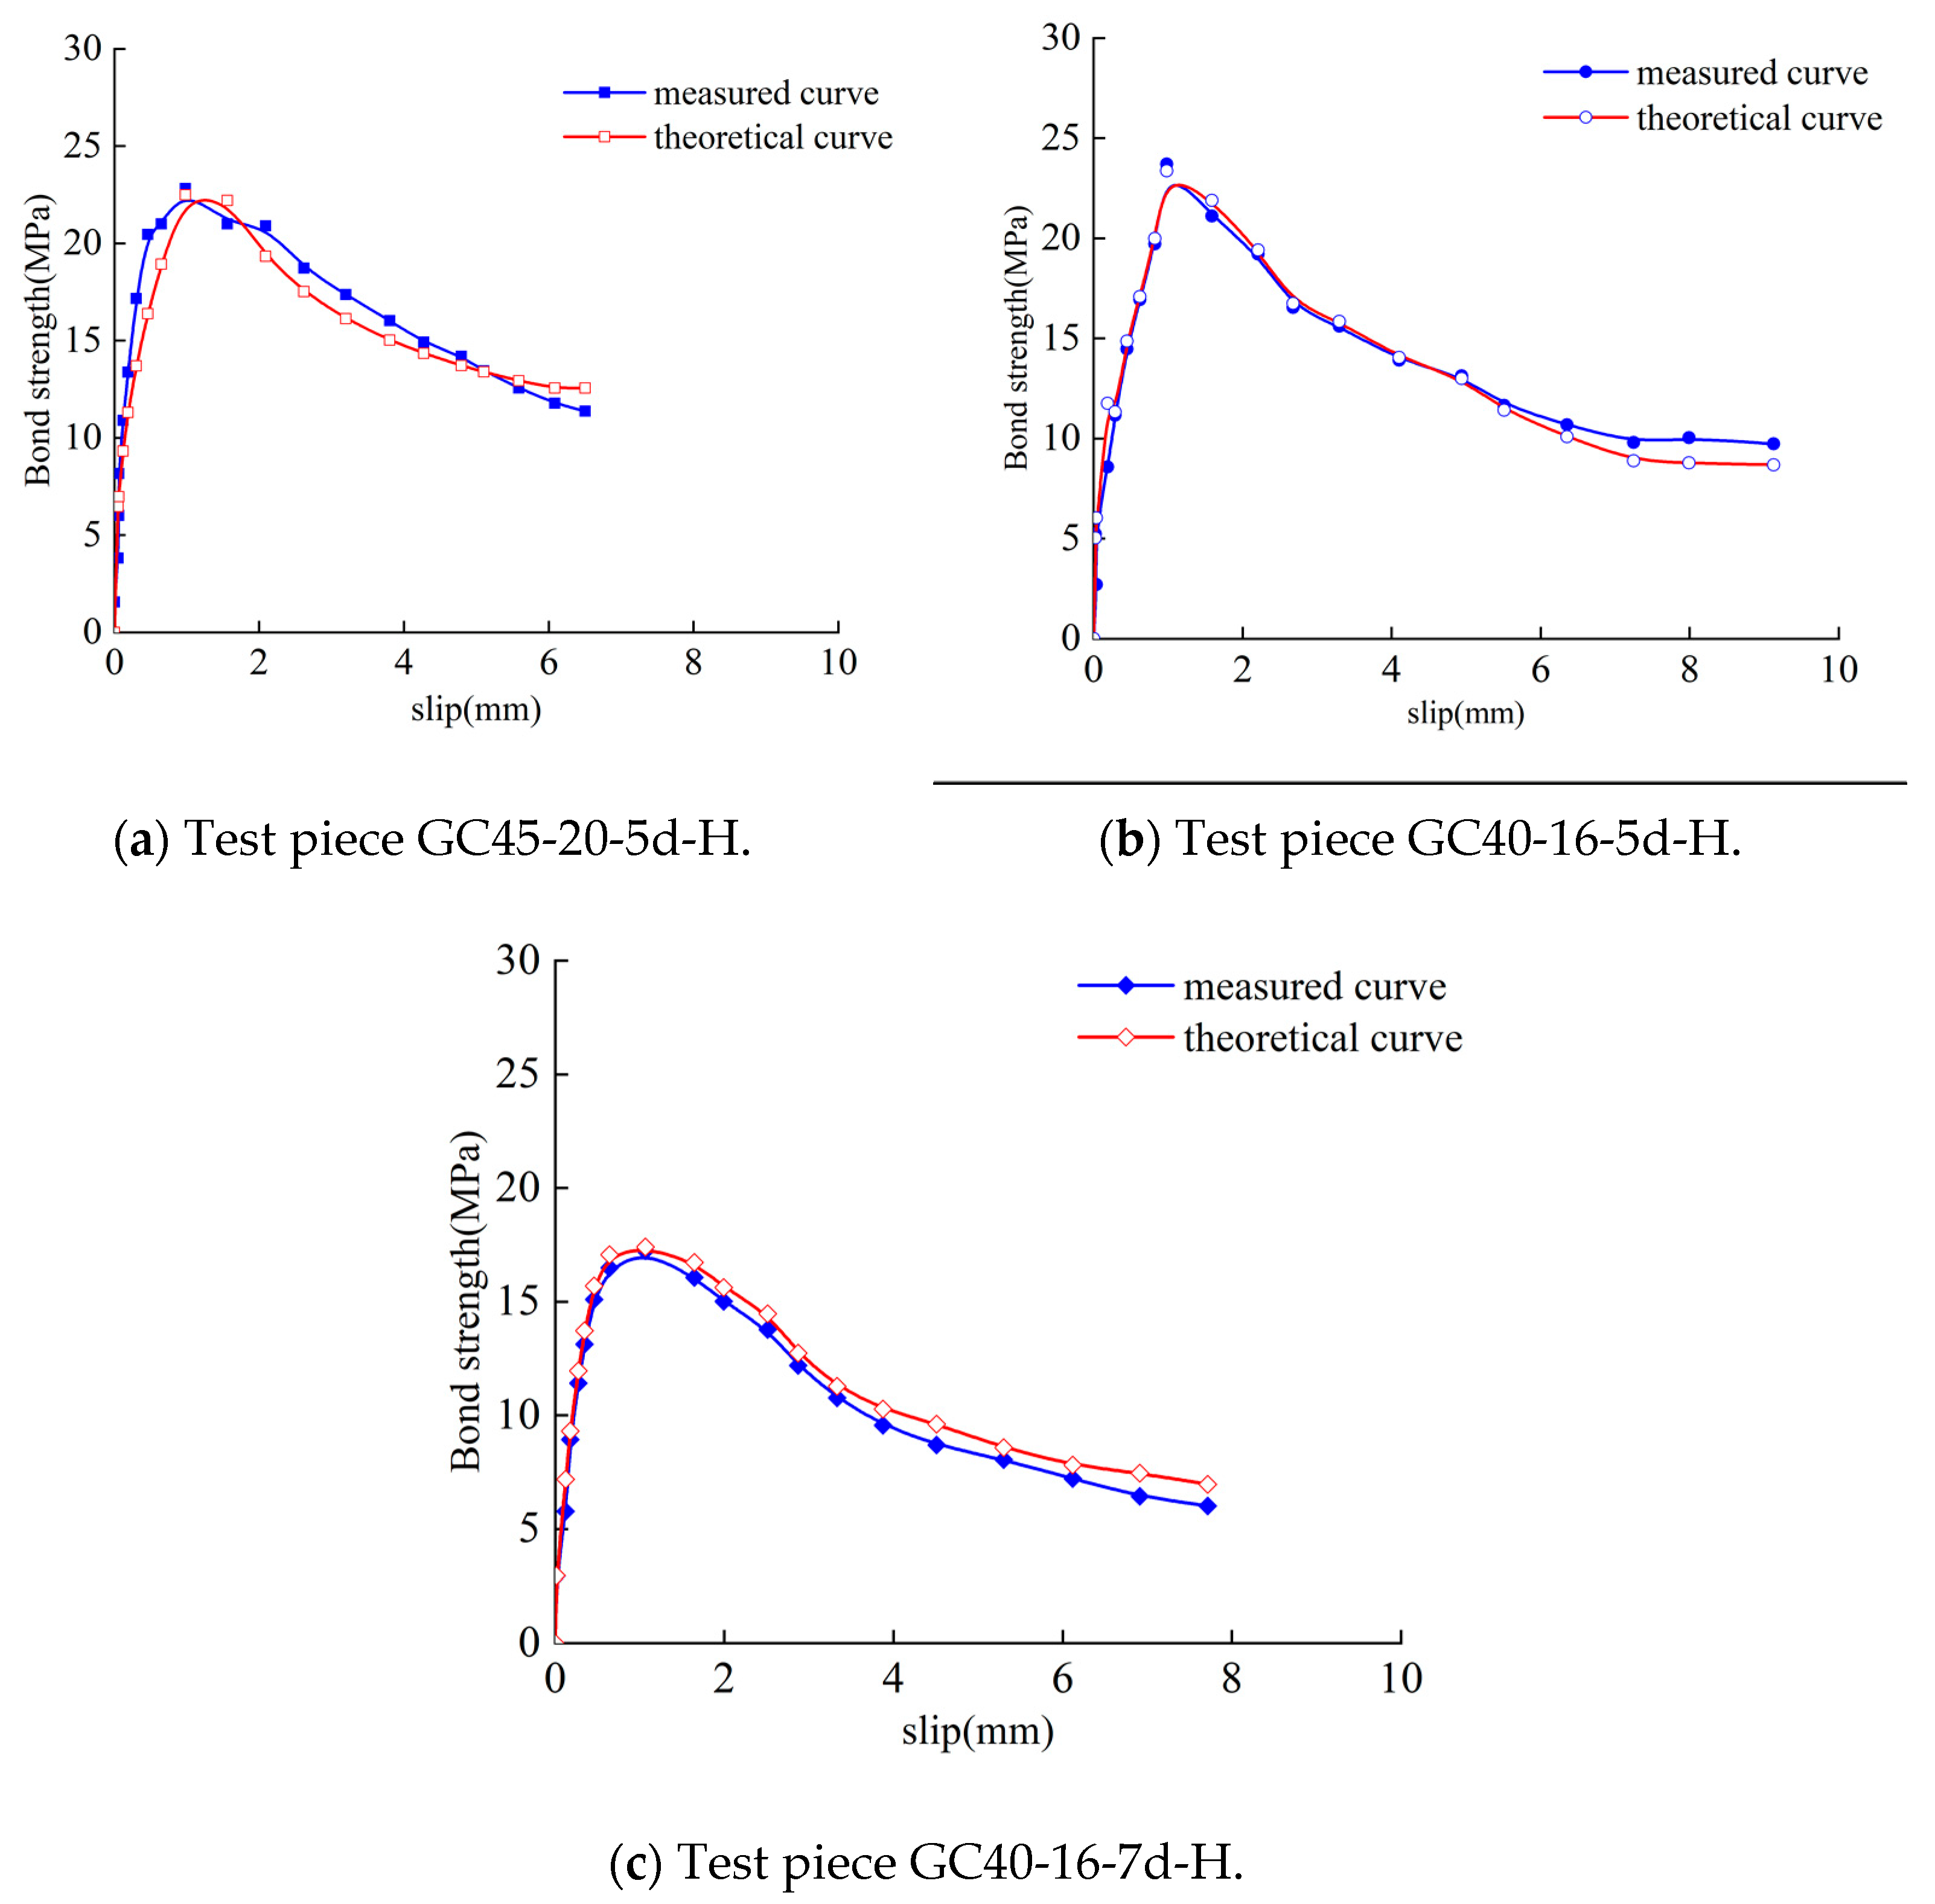
Figure 13 presents a comparison between the measured bond-slip curves of some specimens and the theoretical curves plotted with the abovementioned bond-slip constitutive models. The specimens corresponding to Figure 13a underwent concrete splitting failure; the specimens corresponding to Figure 13b underwent reinforcement pull-out failure; and the specimens corresponding to Figure 13c underwent split-pull-out failure. As shown in Figure 13, the ascending segments of the measured curves and theoretical curves of the specimens exhibited a high degree of overlap for different concrete strengths and bond lengths, and the overall fit was favourable. The bond-slip constitutive model built in this paper can favourably predict the bond performance between ECR and geopolymer concrete.
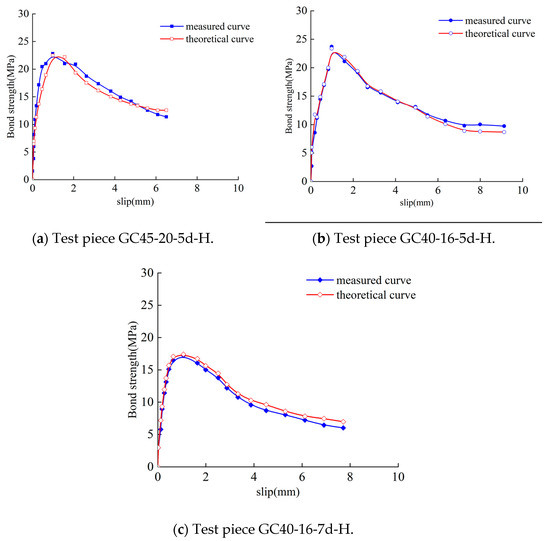
Figure 13.
Comparison of the bond-slip test and theoretical curves.
3.2.7. Computational Formula of the Ultimate Bond Strength
The ultimate bond strength can accurately reflect the ultimate state of the bond performance between reinforcement and concrete; thus, it is beneficial to the design of structural components. Xu Youlin et al. [38] were the first to propose the computational equation of the ultimate bond strength between reinforcement and concrete by considering factors such as the reinforcement diameter, bond length and relative thickness of the concrete cover; see Equation (6).
where τu is the ultimate bond strength in MPa; d represents the reinforcement diameter in mm; la is the bond length in mm; c is the cover thickness in mm; fts is the splitting tensile strength in MPa; and ρsv is the stirrup ratio.
Equation (7) was proposed for computing the ultimate bond strength between ECR and geopolymer concrete based on the test data and Equation (6).
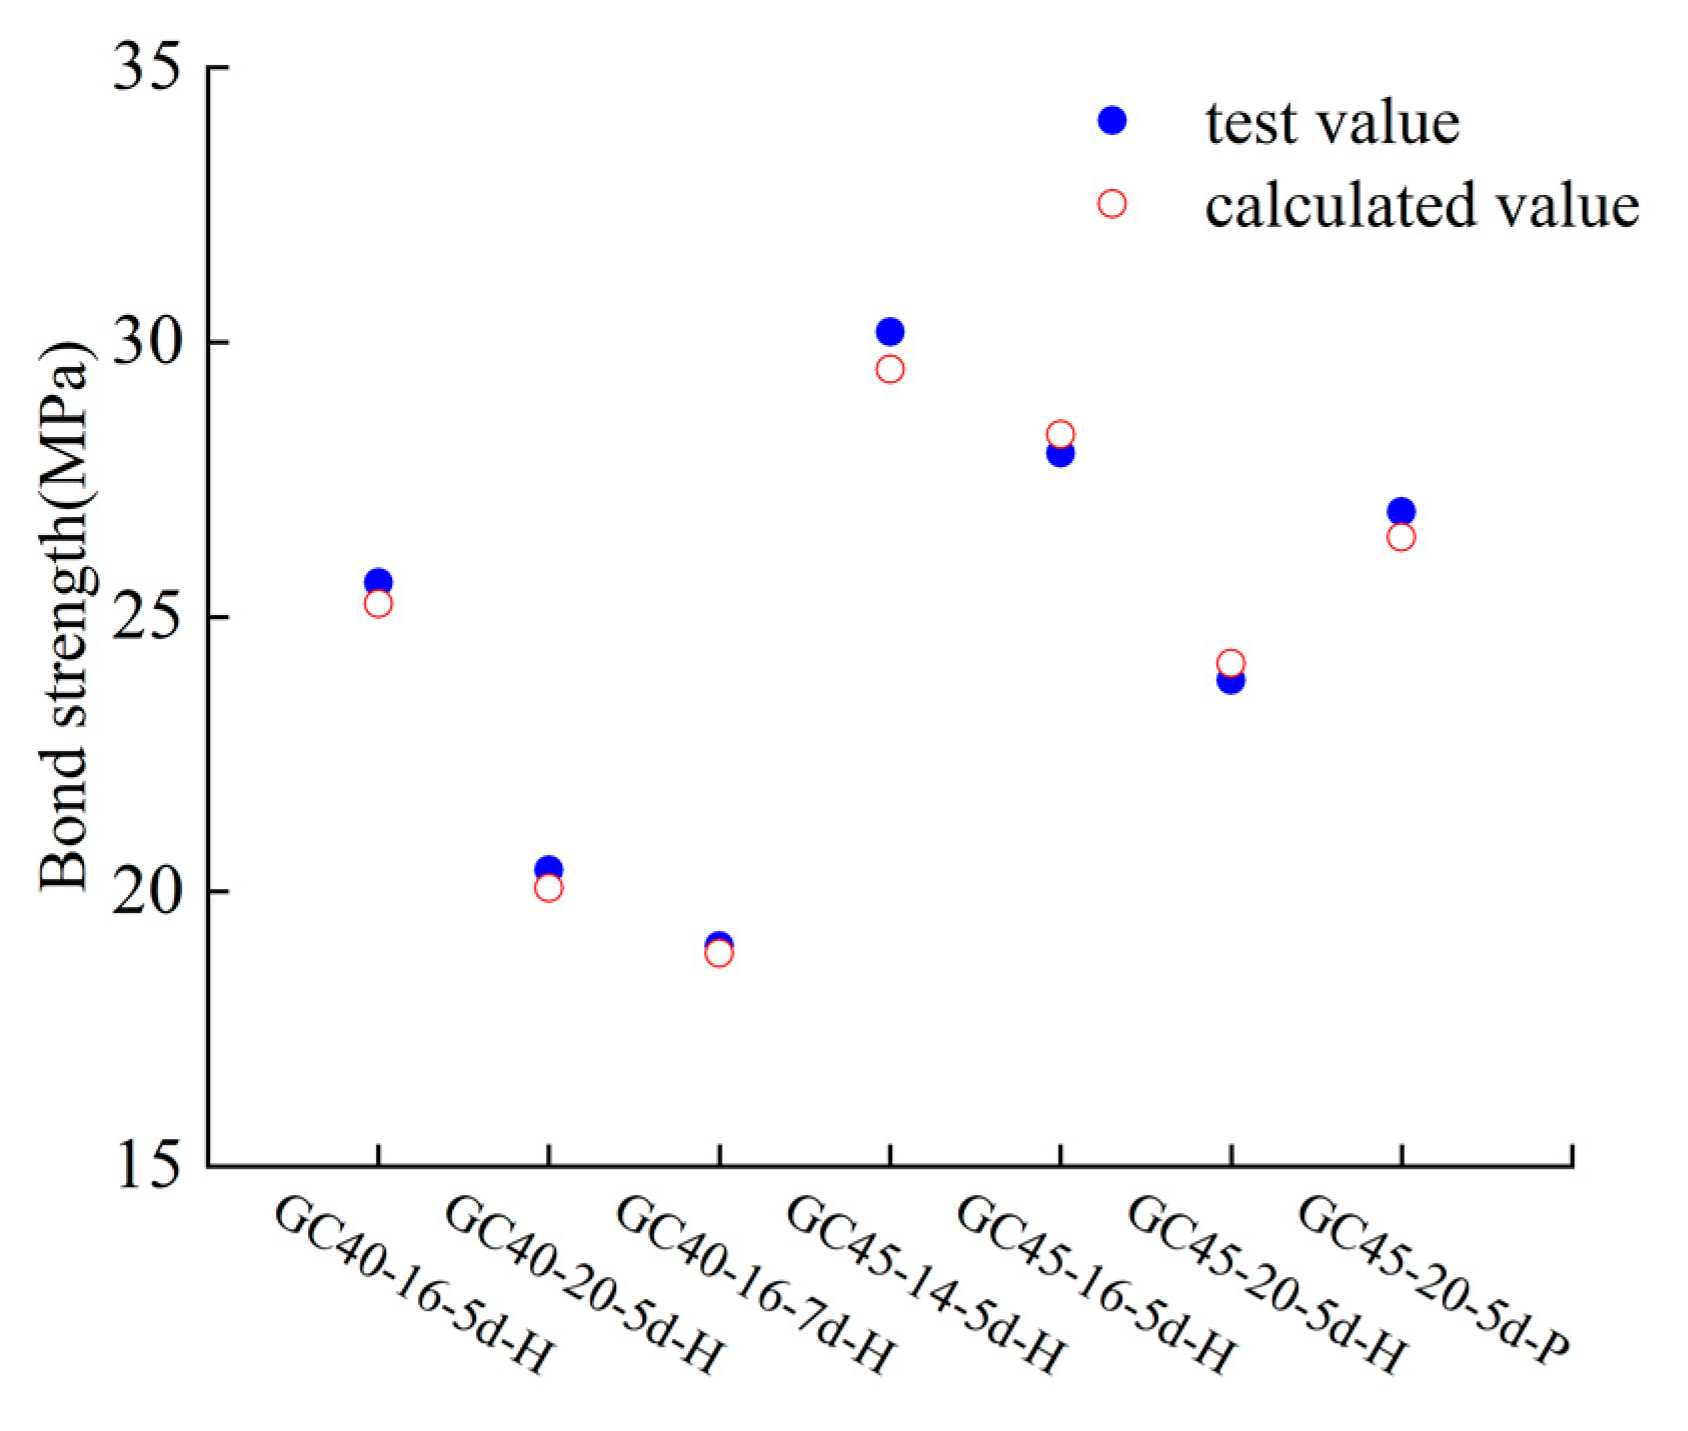
The comparison results between the computed and test values of the ultimate bond strength are plotted in Figure 14 based on Equation (7), and the correlation coefficient was 0.988. As shown in Figure 14, there was a small gap and good fit between the computed and test values of the ultimate bond strength; hence, Equation (7) can favourably predict the ultimate bond strength between ECR and geopolymer concrete, thereby offering a theoretical basis for analysing such bond performance.
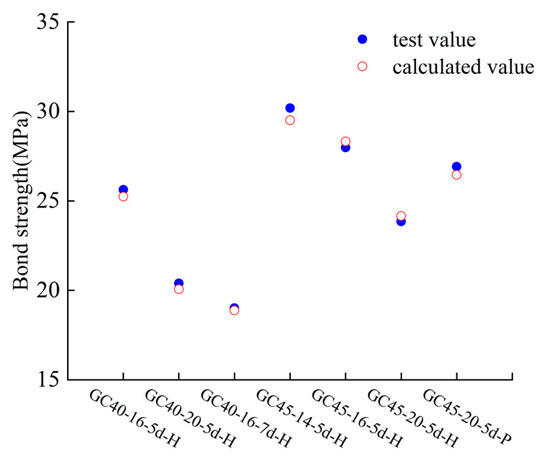
Figure 14.
Comparison between calculated and experimental values of ultimate bond strength.
4. Conclusions
The effects of the geopolymer concrete strength, reinforcement diameter, bond length and reinforcement type on the bond performance between reinforcement and geopolymer concrete were studied through beam tests of 13 specimens, and the following conclusions were drawn:
(1) The beam specimens exhibited three failure modes, i.e., reinforcement pull-out failure, concrete splitting failure and concrete splitting-reinforcement pull-out failure. Among them, the pull-out failure of reinforcement mostly occurred in the specimens with smaller bond length and concrete strength. The splitting failure of concrete usually occurred in the specimens with larger rebar diameter. The pull-out failure of reinforcement after concrete splitting occurred mostly in the specimens with medium bond length and small rebar diameter. The two control factors, reinforcement diameter and bond length, play a key role in the failure mode of beam specimens. The failure mode of epoxy-coated reinforcement and ordinary reinforcement is the same, which is the splitting failure of geopolymer concrete.
(2) The bond slip curves of beam specimens in this test mainly included the micro slip, slip, pull-out and residual stages. The curve of the micro slip stage increased linearly with the increase of external load. The curve of the slip stage showed a nonlinear growth trend with the increase of external load. The curve of the pull-out stage showed a downward trend with the reduction of external load. In the residual stage, the load was basically stable, and the curve was basically parallel to the horizontal axis. The ultimate bond strength between ECR and geopolymer concrete increased with the increase in the geopolymer concrete strength and decreased with the increase in the reinforcement diameter and bond length. In addition, the ultimate bond strength between ECR and geopolymer concrete was lower than that between ordinary threaded reinforcement and geopolymer concrete.
(3) The results of the bond-slip constitutive models for ECR and geopolymer concrete and the computational formula of the ultimate bond strength established in this paper were in good agreement with the test results. It can be used to study the bonding property of epoxy-coated reinforced geopolymer concrete.
Author Contributions
Conceptualization, Z.M.; theoretical analysis and writing original draft, Q.Y.; indoor experiment; Z.C.; data processing. All authors have read and agreed to the published version of the manuscript.
Funding
This work was financially supported by the National Natural Science Foundation of China (grant number 52278184) and the National Key Research and Development Program of China (grant number 2019YFD1101004).
Data Availability Statement
Not applicable.
Conflicts of Interest
The authors declare no conflict of interest.
References
- Xue, L.L.; Li, H.B.; Gao, Y.L. Study on bond behavior between geopolymer concrete and steel bars. Bull. Chin. Ceram. Soc. 2020, 39, 2724–2731. [Google Scholar]
- Zhang, P.; Han, S.; Golewski, G.L.; Wang, X. Nanoparticle-reinforced building materials with applications in civil engineering. Adv. Mech. Eng. 2020, 12, 1687814020965438. [Google Scholar] [CrossRef]
- Bilek, V.; Sucharda, O.; Bujdos, D. Frost resistance of alkali-activated concrete—An important pillar of their sustainability. Sustainability 2021, 13, 473. [Google Scholar] [CrossRef]
- Ibrahim, Y.E.; Adamu, M.; Marouf, M.L.; Ahmed, O.S.; Drmosh, Q.A.; Malik, M.A. Mechanical Performance of Date-Palm-Fiber-Reinforced Concrete Containing Silica Fume. Buildings 2022, 12, 1642. [Google Scholar] [CrossRef]
- Khan, K.; Ahmad, W.; Amin, M.N.; Nazar, S. Nano-Silica-Modified Concrete: A Bibliographic Analysis and Comprehensive Review of Material Properties. Nanomaterials 2022, 12, 1989. [Google Scholar] [CrossRef]
- Singh, N.B.; Middendorf, B. Geopolymers as an alternative to Portland cement: An overviews. Constr. Build. Mater. 2020, 237, 2–15. [Google Scholar] [CrossRef]
- Singh, B.; Ishwarya, G.; Gupta, M.; Bhattacharyya, S.K. Geopolymer concrete: A review of some recent Developments. Constr. Build. Mater. 2015, 85, 78–90. [Google Scholar] [CrossRef]
- Farhan, K.Z.; Johari, M.A.M.; Demirboğa, R. Assessment of important parameters involved in the synthesis of geopolymer composites: A review. Constr. Build. Mater. 2020, 264, 2–28. [Google Scholar] [CrossRef]
- Noushini, A.; Aslani, F.; Castel, A.; Gilbert, R.I.; Foster, S. Compressive stress-strain model for low-calcium fly ash-based geopolymer and heat-cured Portland cement concrete. Cem. Concr. Compos. 2016, 73, 136–146. [Google Scholar] [CrossRef]
- Zhang, P.; Zheng, Y.X.; Wang, K.; Zhang, J. A review on properties of fresh and hardened geopolymer Mortar. Compos. Part B Eng. 2018, 152, 79–95. [Google Scholar] [CrossRef]
- Lyon, R.; Balaguru, P.N.; Foden, A. Fire-resistant alumino silicate composites. Fire Mater. 1997, 21, 67–73. [Google Scholar] [CrossRef]
- Kong, D.L.Y.; Sanjayan, J.G.; Sagoe-Crentsil, K. Comparative performance of geopolymers made with metakaolin and fly ash after exposure to elevated temperatures. Cem. Concr. Res. 2007, 37, 1583–1589. [Google Scholar] [CrossRef]
- Leonelli, C.; Benito, P.; Medri, V.; Vaccari, A. Geopolymers: A new and smart way for a sustainable Development. Appl. Clay Sci. 2013, 73, 1. [Google Scholar]
- Li, B.; Zang, S.Y.; Wang, H. Study on the steel structure corrosion rate of concrete structure in marine. J. Shandong Univ. Technol. (Nat. Sci. Ed.) 2021, 35, 18–23. [Google Scholar]
- Wang, Q.; Jiang, B.; Xu, S.; He, M.; Jiang, Z.; Li, S.; Wei, H.; Xiao, Y. Roof-cutting and energy-absorbing method for dynamic disaster control in deep coal mine. Int. J. Rock Mech. Min. Sci. 2022, 158, 105186. [Google Scholar] [CrossRef]
- Wang, Q.; Gao, H.; Jiang, B.; Li, S.; He, M.; Qin, Q. In-situ test and bolt-grouting design evaluation method of underground engineering based on digital drilling. Int. J. Rock Mech. Min. Sci. 2021, 138, 104575. [Google Scholar] [CrossRef]
- Ju, X.L.; Wu, L.J.; Liu, M.W.; Zhang, H.; Liu, T.T. Service Life Prediction for Reinforced Concrete Wharf Considering the Influence of Chloride Erosion Dimension. Mater. Rep. 2021, 35, 24075–24080. [Google Scholar]
- Feng, X.G.; Lu, X.; Lu, X.Y.; Yang, Y.S.; Lu, F. Corrosion Rate of Stainless Steel Rebar in Coral Concrete Prepared with Seawater. J. Build. Mater. 2021, 24, 1322–1327. [Google Scholar]
- Xu, P.L.; Xiao, X.; Yin, G. Numerical Simulation on Seismic Performance Deterioration of Rein-forced Concrete Columns Subjected to Chloride and Sulfate Attack. J. Disaster Prev. Mitig. Eng. 2021, 41, 376–384. [Google Scholar]
- Wu, X.P. Analysis of Compressive Bearing Capacity of Stainless Steel Reinforced Concrete Based on Micro-Mechanics; Zhengzhou University: Zhengzhou, China, 2021. [Google Scholar]
- Wang, Z.; Zhao, X.L.; Xian, G.; Wu, G.; Raman, R.K.S.; Al-Saadi, S.; Haque, A. Long-term durability of basalt-and glass-fibre reinforced polymer (BFRP/GFRP) bars in seawater and sea sand concrete environment. Constr. Build. Mater. 2017, 139, 467–489. [Google Scholar] [CrossRef]
- Nie, R.; Huang, Y.; Li, X.; Sun, H.; Li, D.; Ying, J. Bond of epoxy-coated reinforcement to seawater coral aggregate concrete. Ocean Eng. 2020, 208, 107350. [Google Scholar] [CrossRef]
- Xu, Y.L.; Liu, L.X. Experimental study on bond anchorage performance of epoxy coated steel bars. Build. Struct. 1998, 6, 16–18. [Google Scholar]
- Zhang, P. Bond and Anchorage Performances of Epoxy Resin Reinforcement. Port Wat Erway Eng. 2002, 9, 29–31. [Google Scholar]
- Wang, Q.; Xu, S.; Xin, Z.; He, M.; Wei, H.; Jiang, B. Mechanical properties and field application of constant resistance energy-absorbing anchor cable. Tunn. Undergr. Space Technol. 2022, 125, 104526. [Google Scholar] [CrossRef]
- Wang, Q.; Xu, S.; He, M.; Jiang, B.; Wei, H.; Wang, Y. Dynamic mechanical characteristics and application of constant resistance energy-absorbing supporting material. Int. J. Min. Sci. Technol. 2022, 32, 47–458. [Google Scholar] [CrossRef]
- Wang, S.Y. Application research of new building materials in modern high-rise building. Shanxi Archit. 2015, 41, 88–90. [Google Scholar]
- Yuan, X.H.; Lu, Z.A.; Fan, X.C.; Zhang, C.Y. Inorganic Polymer Concrete-steel Bar Pullout Reinforcemen Study. J. Wuhan Univ. Technol. 2013, 35, 117–122. [Google Scholar]
- Zhang, H.Y.; Yan, J.; Wu, B. Study on bond behavior between geopolymer concrete and steel bars. China Civ. Eng. J. 2016, 49, 107–115. [Google Scholar]
- Romanazzi, V.; Leone, M.; Aiello, M.A.; Pecce, M.R. Bond behavior of geopolymer concrete with steel and GFRP bars. Compos. Struct. 2022, 300, 116150. [Google Scholar] [CrossRef]
- Dahou, Z.; Castel, A.; Noushini, A. Prediction of the steel-concrete bond strength from the compressive strength of Portland cement and geopolymer concretes. Constr. Build. Mater. 2016, 119, 329–342. [Google Scholar] [CrossRef]
- Moen, C.D.; Sharp, S.R. Bond properties between concrete and corrosion-resistant reinforcing steels. ACI Struct. J. 2016, 113, 383. [Google Scholar] [CrossRef]
- Anda, D.L.; Courtier, C.; Moehle, J.P. Bond strength of prefabricated epoxy-coated reinforcement. ACI Struct. J. 2006, 103, 383. [Google Scholar]
- Su, Y.Q. Beam Test Study on Bond Performance between Geopolymer Concrete and Epoxy Coated Reinforcement; Shandong University of Science and Technology: Shandong, China, 2022. [Google Scholar]
- Ministry of Housing and Urban Rural Development of the People’s Republic of China. Standard for Test Methods of Physical and Mechanical Properties of Concrete: GB/T 50081-2019[S]; China Construction Industry Press: Beijing, China, 2019.
- Cosenza, E.; Manfredi, G.; Realfonzo, R. Behavior and Modeling of Bond of FRP Rebars to Concrete. J. Compos. Constr. 1997, 2, 40–51. [Google Scholar] [CrossRef]
- Liang, R.; Huang, Y. Experimental study on bond performance between high strength steel rebar and ultra-high performance concrete. J. Build. Struct. 2022, 43, 294–302. [Google Scholar]
- Xu, Y.L.; Liu, X.; Zeng, D.G.; Guan, P.W. Anchorage Properties and Design Proposals for Epoxy Resin Coated Steel Bars. Port Waterw. Eng. 1999, 8, 33–53. [Google Scholar]


Disclaimer/Publisher’s Note: The statements, opinions and data contained in all publications are solely those of the individual author(s) and contributor(s) and not of MDPI and/or the editor(s). MDPI and/or the editor(s) disclaim responsibility for any injury to people or property resulting from any ideas, methods, instructions or products referred to in the content. |
© 2023 by the authors. Licensee MDPI, Basel, Switzerland. This article is an open access article distributed under the terms and conditions of the Creative Commons Attribution (CC BY) license (https://creativecommons.org/licenses/by/4.0/).