Article

An Analysis of Real-Time Measured Solar Radiation and Daylight and Its Energy Implications for Semi-Transparent Building-Integrated Photovoltaic Façades

by
Danny H. W. Li
1,
Emmanuel I. Aghimien
1,* and
Khalid Alshaibani
2
1
Building Energy Research Group, Department of Architecture and Civil Engineering, City University of Hong Kong, Kowloon, Hong Kong
2
Department of Architecture, College of Architecture and Planning, Imam Abdulrahman Bin Faisal University, Dammam 3412, Saudi Arabia
*
Author to whom correspondence should be addressed.
Buildings 2023, 13(2), 386; https://doi.org/10.3390/buildings13020386
Submission received: 27 December 2022 / Revised: 19 January 2023 / Accepted: 27 January 2023 / Published: 31 January 2023

Abstract

:
For analyzing cooling loads, day-lighting, and building-integrated photovoltaic (BIPV) systems, solar radiation and daylight illuminance data are required. However, these data are sparse. Furthermore, studies have shown that the energy potential of building-integrated photovoltaic (BIPV) systems for the entire building skin (BS) and unconventional orientations, such as east, west, and north need further exploration. Thus, this study presents findings from measured solar data and an energy analysis of semi-transparent BIPV. Firstly, solar radiation and daylight data measured from June 2019 to May 2020 in Hong Kong are presented. The analyzed solar-radiation data were used to determine the solar-energy potential of BIPV for BS and the four principal building orientations (i.e., N, E, S and W). With a simple analytical approach, the solar data’s building-energy implications for semi-transparent BIPV were assessed. The findings showed that the annual average horizontal global-, diffuse-, and direct-irradiance values were 291.8, 164.3, and 127.5 W/m2/day, respectively. Similarly, 120, 72, and 107 klux were obtained as the peak global, diffuse, and direct illuminance, respectively. Furthermore, the results show the potential of using BIPV on the entire BS in Hong Kong. It was also observed that a semi-transparent BIPV façade integrated with daylight-linked lighting controls could offer significant energy savings in electric lighting and cooling while also producing energy. In particular, BIPV façades with a large window-to-wall ratio (WWR) of 80% can provide an overall energy benefit of up to 7126 kWh.

1. Introduction

Studies show that the building sector contributes 40% of the world’s total energy consumption and accounts for 30% of the total CO2 emissions [1,2]. To improve building energy efficiency, energy consumption can be reduced, and renewable energy resources can be increased [3]. The balance between the energy consumption in a building and the energy produced by its renewable energy systems is referred to as the net-zero energy [4]. Over time, interest in net-zero-energy buildings (NZEBs) and energy-efficient designs [5] has grown. However, even if various energy-efficient measures are utilized in a building, energy is still required to power the building. Thus, in NZEBs, renewable energy technologies, such as photovoltaic (PV) panels, are encouraged [6]. Photovoltaic panels directly convert solar energy into electricity [7]. A variation of PV panels in the form of semi-transparent building-integrated photovoltaic (BIPV) panels can replace a window or roof, or act as a building skin (BS) for electricity generation and reduce lighting energy expenditure and cooling requirements [8].
Using PV on the roofs of high-rise buildings may not generate sufficient energy to meet these buildings’ electricity demands, making the building façades better alternatives [9]. Thus, studies on the benefits of façade BIPVs have been conducted [8]; however, BIPV is still generally adopted for southern façades in the northern hemisphere [10]. This is because south façades generally have higher levels of solar radiation than any other building surface in the northern hemisphere. More recently, studies showed the potential for BIPV in other façades and the entire building skin (BS) [10,11]. The BS is the enclosure through which the building interacts with the environment [12]. It forms the part of a building that can be used for energy production and daylight transmission [13]. Furthermore, Gholami and Rostavik [11] asserted that adopting BIPV for the entire BS reimburses investment costs.
The geographical solar energy potential of BIPV cannot be accessed without the availability of solar radiation datasets [14]. Over time, interest in generating large solar-radiation data to evaluate renewable energy prospects, such as BIPV, has arisen [15]. Hence, various approaches, such as deriving solar data from satellite data [16], using estimating models [17] and long-term measurement [18], have been proposed. However, data measurement is the most effective and accurate method [15]. A major setback is that, despite the significance of solar data, solar radiation and daylight are infrequently measured [15]. Hence, with the increasing interest in using BIPV on building façades and BS, solar radiation and daylight data are required for buildings’ energy analysis [19]. Furthermore, building-performance simulation is a commonly used energy-assessment method [19]. However, due to the complexities of using simulation tools, building designers prefer simpler alternatives [20]. Hence, a simpler method would provide a more straightforward approach to building energy assessment.

Problem Statement and Objectives

In Hong Kong and other sub-tropical regions, there is a continuous rise in buildings’ energy consumption, especially for lighting and cooling [21]. Furthermore, the building envelope accounts for 55% of the peak cooling loads for office buildings in Hong Kong [22]. This percentage could be attributed to the common use of large window areas with tinted glass in Hong Kong office buildings [23]. Furthermore, To et al. [22] stated that there are relatively few NZEBs in most cities with subtropical climates. Mah et al. [24] also noted that there is slow growth in the adoption of PV electricity generation in Hong Kong and other cities with subtropical climates. Thus, analyzing the potential of solar energy for BIPV, especially for the BS, would be helpful in the adoption of BIPV in building-envelope designs.
Previously, Wong et al. [25] examined the solar energy potential on roof surfaces in Hong Kong. The study identified the possibility of rooftop PV designs in Hong Kong. Furthermore, upon analyzing the energy consumption in a high-rise residential building in Hong Kong, Qin and Pan [26] recommended using overhangs and vertical BIPV to counterbalance the energy consumed by the building. Strictly speaking, more work on the analysis of the solar energy potential of BIPV for vertical façades is required. Moreover, since Gholami and Rostavik [10] identified the merits of BIPV for the entire building skin, a study that investigates the energy potential of BIPV as a building material for the whole BS in Hong Kong would be useful, since none currently exist. Furthermore, the different components of solar radiation and daylight have various effects on global solar radiation. It would be interesting to determine the contribution of these components along various orientations. Such information would also help harness the various components during passive solar design and the design of solar conversion systems. Interestingly, this analysis is not available in previous studies in Hong Kong [27,28,29].
Furthermore, previous works on measured solar-radiation and daylight data in Hong Kong presented data measured between 1991 and 2000 [27,28,29]. However, solar energy is affected by climatic changes brought about by CO2 emissions [30]. Given the global climate change experienced in the 21st century (i.e., from 2001 until the present) [31], a more recent analysis would better explain the current climatic and weather situation in Hong Kong. Such recent measurements would also help to form short-term energy predictions [17]. Thus, this study investigates solar energy’s potential for BIPV in Hong Kong by analyzing recent measured solar radiation and daylight data. Furthermore, to allow informed energy-efficient façade designs, an analysis of solar radiation in relation to building façades and BS is provided. As a further deviation from previous works in Hong Kong, the effect of façades and architectural parameters such as the solar-heat-gain coefficient, lighting transmittance (VT), window-to-wall ratio (WWR), and internal gains from lighting was carried out using a comparative energy analysis of the four principal orientations. The energy analysis provides a better understanding of the benefits of semi-transparent BIPVs for façade design compared to other fenestration systems commonly adopted in sub-tropical cities, such as Hong Kong. As mentioned in Section 1, building designers prefer a simple approach to assessing building-energy performance. Thus, the analysis was conducted using a simple, yet effective method. The objectives of this study, which distinguish it from previous studies [23,27,28,29,32], are to: (1) analyze the measured solar-radiation and daylight data; (2) evaluate the components of incident solar radiation in BS and façades; (3) determine the contribution of each solar component to global radiation; (4) assess the effect of building orientation on the irradiance of façades and BS; and (5) investigate the building-energy implications of the analyzed data in terms of cooling and lighting requirements and BIPV energy output.

2. Materials and Methods

2.1. Data Measurement

Hourly meteorological data measured between June 2019 and May 2020 were used in the analysis. The solar irradiance and daylight data were obtained from the City University of Hong Kong’s measurement station. To assist with high-precision measurement of horizontal illuminance and irradiance, the STR -22G sun tracker was installed. Furthermore, the MS-80 pyranometer provided the vertical irradiance data at a response time of <0.5 secs. At a range of 0.01 to 299,900 lux, the T-10M illuminance sensor provided vertical-illuminance data. For sky classification, an EKO MS 300LR sky scanner gave a record of sky-luminance measurement. Moreover, the horizontal measuring instrument was newly purchased when the measurement was carried out in 2019. Hence, the instruments had the manufacturer’s calibration. However, a reference sensor was used to calibrate the vertical sensors, and the measurement was performed under unobstructed sky conditions. When both reference and calibrated sensors were compared, good correlations with a coefficient of determination (R2) above 0.99 were obtained. The measuring instruments are presented in Figure 1. All measurements covered data recorded between sunrise and sunset. To remove erroneous data, quality control was carried out, as described in [33].

2.2. Method and Procedures

2.2.1. Data Measurement

The study’s first objective was achieved through a descriptive analysis of the measured horizontal and vertical solar irradiance data. Similarly, the outdoor illuminance data were also analyzed and presented. The results of these analyses were presented using the frequency of occurrence (FOC) and cumulative frequencies (CF) plots.

2.2.2. Solar Radiation on Building Skins

The incident solar radiation on BS and various façades were evaluated for the second objective. The analysis aimed to determine the solar energy potential of BIPV for the BS and different orientations. The previously analyzed vertical data were used for the four building façades, while the horizontal data were used for the roof. However, to derive the annual solar irradiance on the building skin (BS), Gholami and Røstvik [10]’s method was adopted. This approach considers the incident radiation on the BS as the average solar radiation on the different orientations of a building. In this study, the orientations are the four building façades and the roof. As a further step, the contribution of the solar components to the incident global radiation (GVT) for the BS and different orientations were analyzed. As in objective two, the analyzed solar radiation data were used in this analysis and the percentage contribution of each component was presented. This step was intended to solve the third objective.

2.2.3. Relationship between Solar Radiation and Building Orientation

This analysis provides information on the amount of incident radiation on a building’s vertical surface when it is oriented between 0 to 350 degrees. To investigate orientation effects on solar radiation for objective four, it was assumed that a building is rotated clockwise from 0 to 350 degrees. Consequently, the corresponding vertical global values for each rotating angle were determined. For this analysis, the measured vertical data (i.e., 0°, 90°, 180° and 270°) were obtained from measuring instruments. These data correspond to the north (N), east (E), south (S), and west (W) data. However, values for the other orientations were derived from numerical modeling. For modeling the vertical global illuminance (GVL), Equation (1) was applied.
G V L = B V L + D V L + R V L
where BVL is the vertical direct-beam illuminance (klx), DVL is the vertical sky-diffuse illuminance (klx) and RVL is the ground-reflected illuminance on a vertical surface (klx).
The DVL can be calculated numerically from the CIE standard skies using the Tregenza approach [34]. For this approach, the measured sky-luminance data and the horizontal diffuse illuminance were used. Based on the identified CIE standard skies, the vertical sky component (VSC) was used to calculate the sky-diffuse illuminance. The VSC is the ratio of vertical sky-diffuse illuminance (DVL) to unobstructed horizontal sky-diffuse illuminance (DV). The VSC was obtained from Equation (2).
V S C = A 1 exp { [ ( 180 / π ) χ B 1 C 1 ] 2 } + A 2 exp { [ ( 180 / π ) χ B 2 C 2 ] 2 }
where χ is the scattering angle of the sky patch (degrees), A1, B1, C1, A2, B2, and C2 are coefficients for Skies 2, 4 and 6 to 15 [35]. Furthermore, constant values of 40, 46 and 50% were used to calculate Skies 1, 3 and 5, respectively. This is because the VSC for Skies 1,3 and 5 is independent of sky orientation. All constant values and coefficients for the CIE standard skies are shown in Table 1.
As in the definition of VSC, DVL was obtained by multiplying the derived VSC and DV. With the diffuse illuminance (DVL) derived, the diffuse irradiance (DVT) was obtained using the luminous efficacy (K) approach in Equation (3) [36].
K = D V L D V T ( l m / W )
Furthermore, in addition to K for the N, E, S and W, which can be obtained from measurements, K for other orientations were obtained from linear interpolations.
Generally, Equation (1) can also be used for modeling GVT [37]. Hence, the direct beam irradiance (BVT) and vertical ground-reflected irradiance (RVT) can replace BVL and RVL in Equation (1). The BVT was obtained from the measured horizontal direct component and solar position. Li et al. [37] provide a comprehensive modeling approach for GVL or GVT. With BVT, DVT and RVT obtained, GVT values for the other façades were derived from Equation (1).

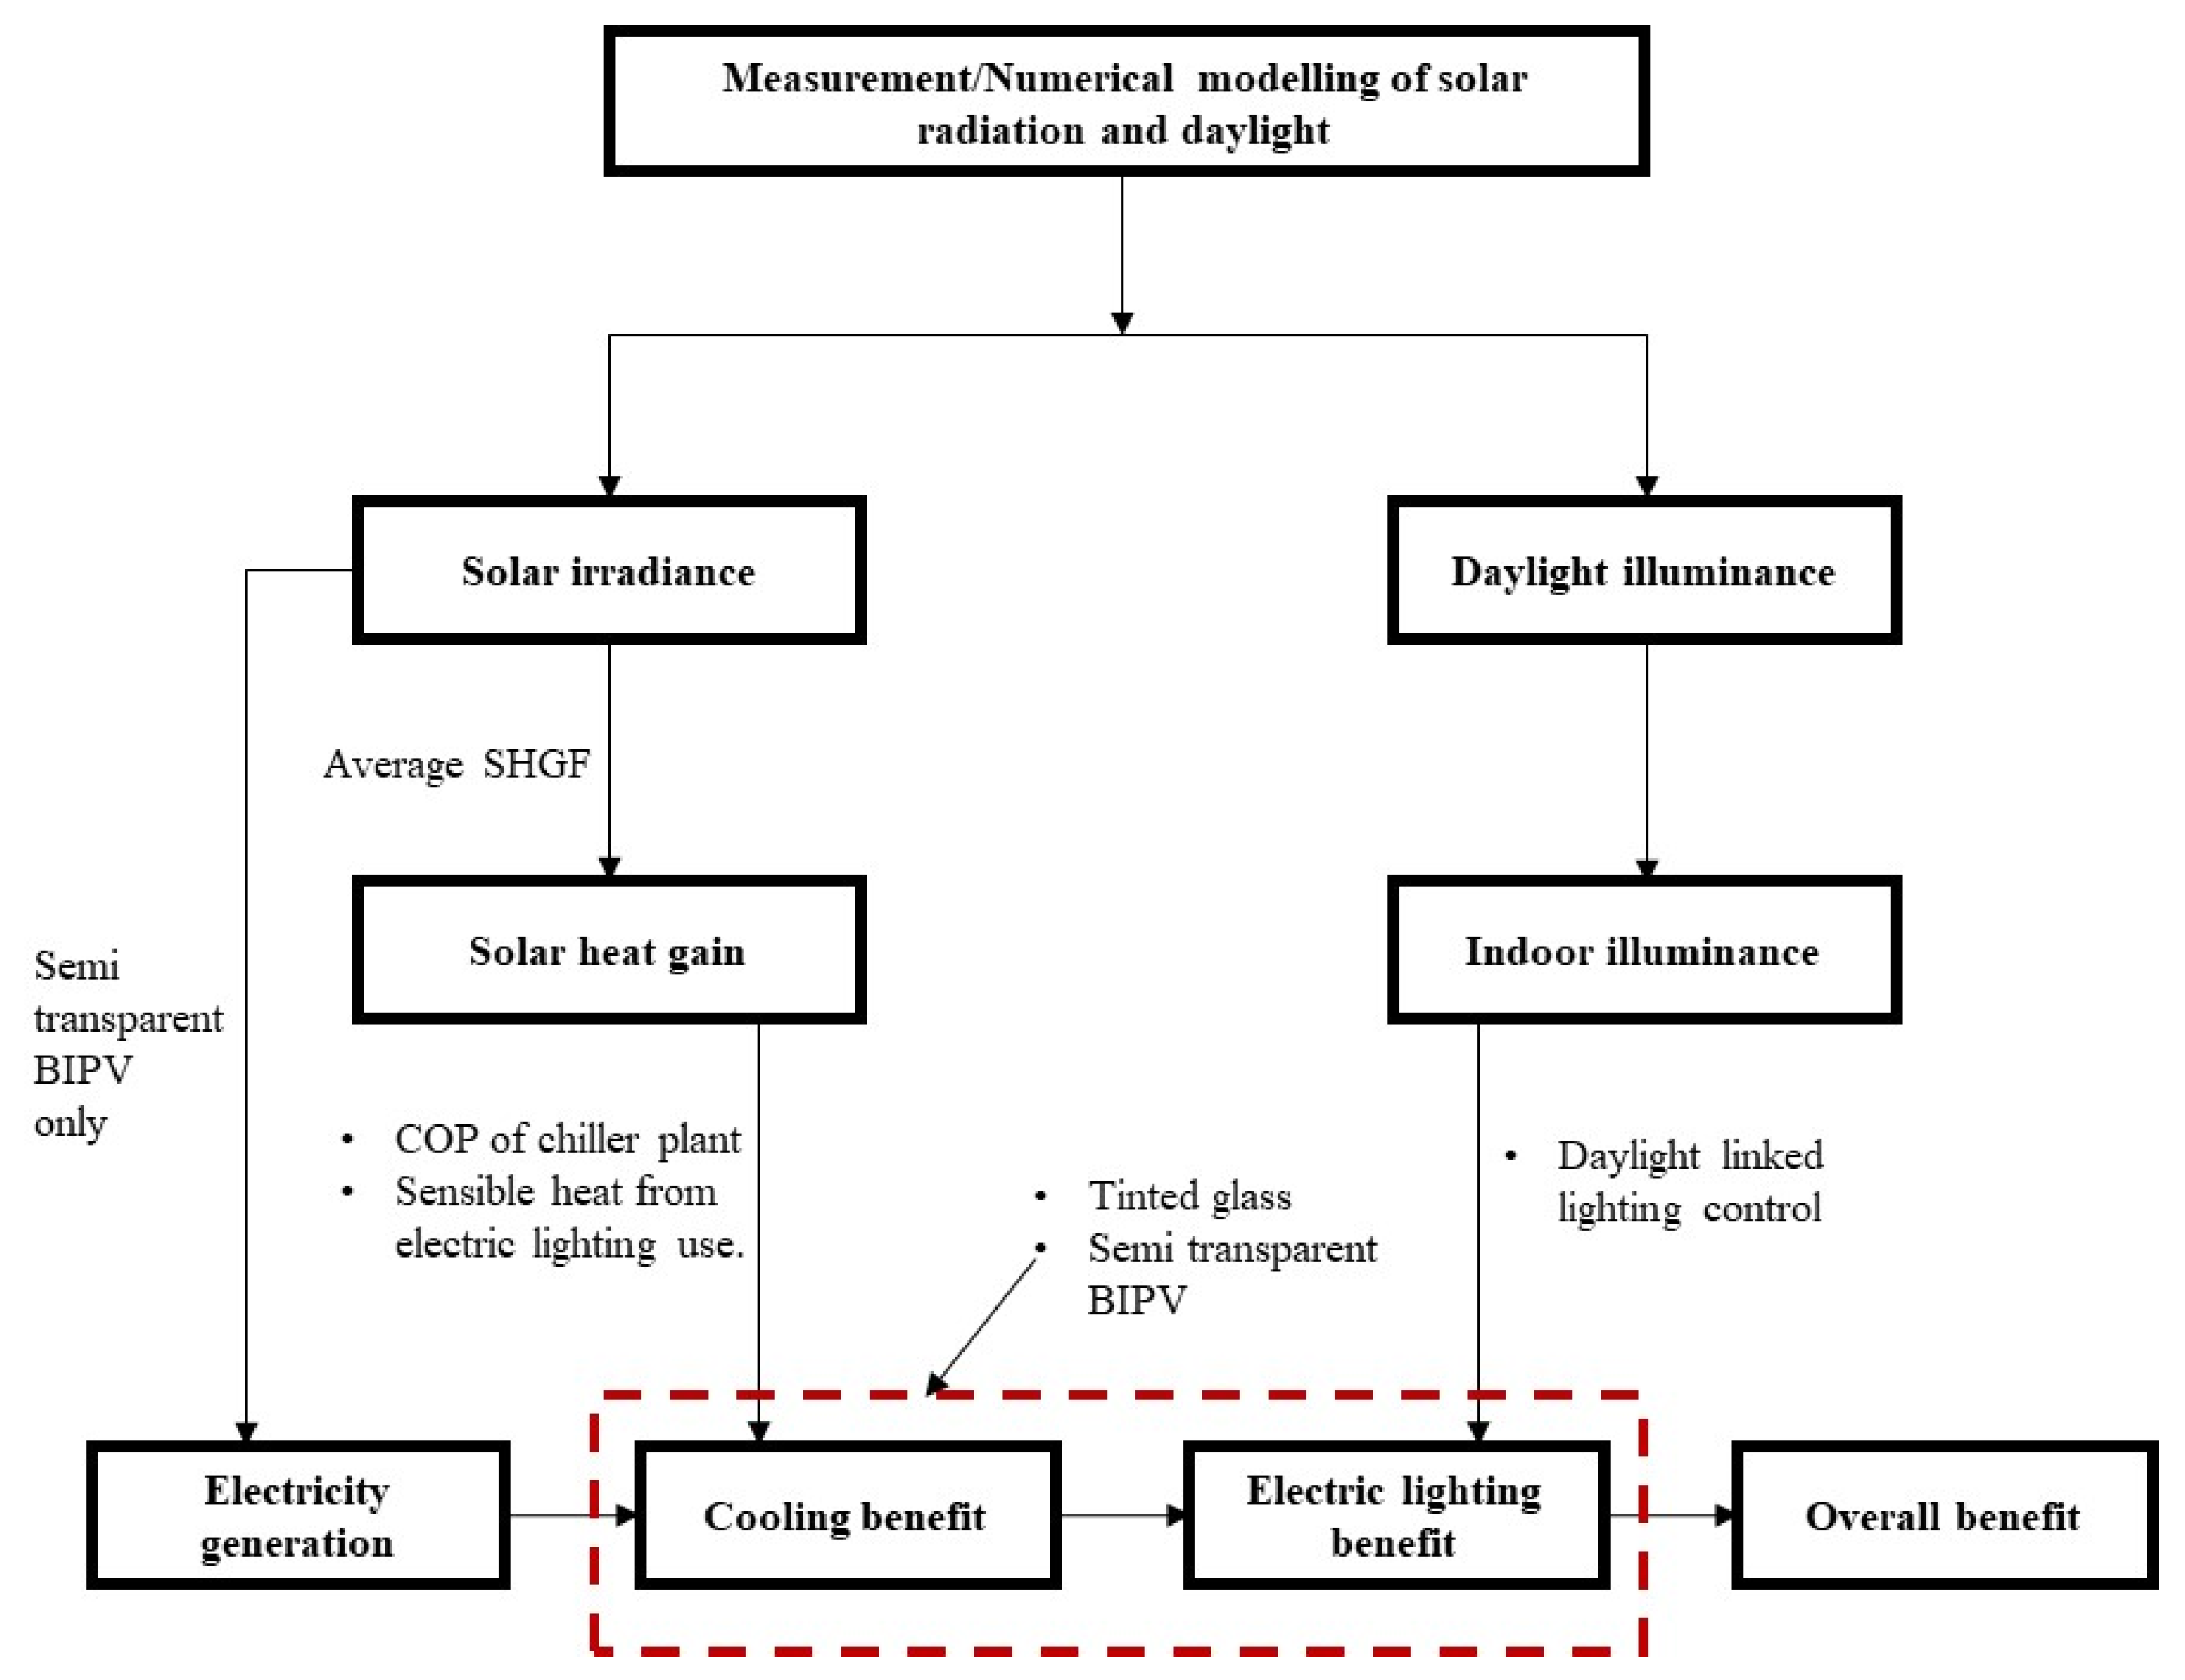
2.2.4. Energy Implications of Solar Data for Semi-Transparent BIPV

For the last objective, the energy implications of the solar irradiance and illuminance data for semi-transparent BIPV were determined. The assessment was conducted in terms of day-lighting, cooling and electricity generation in a generic air-conditioned office using the flow chart in Figure 2. The ambient temperature (Ta) and wind data used for the analysis were obtained from the Hong Kong Observatory.
Note: Overall benefit is the sum of energy benefits from BIPV, cooling and daylighting-linked lighting control

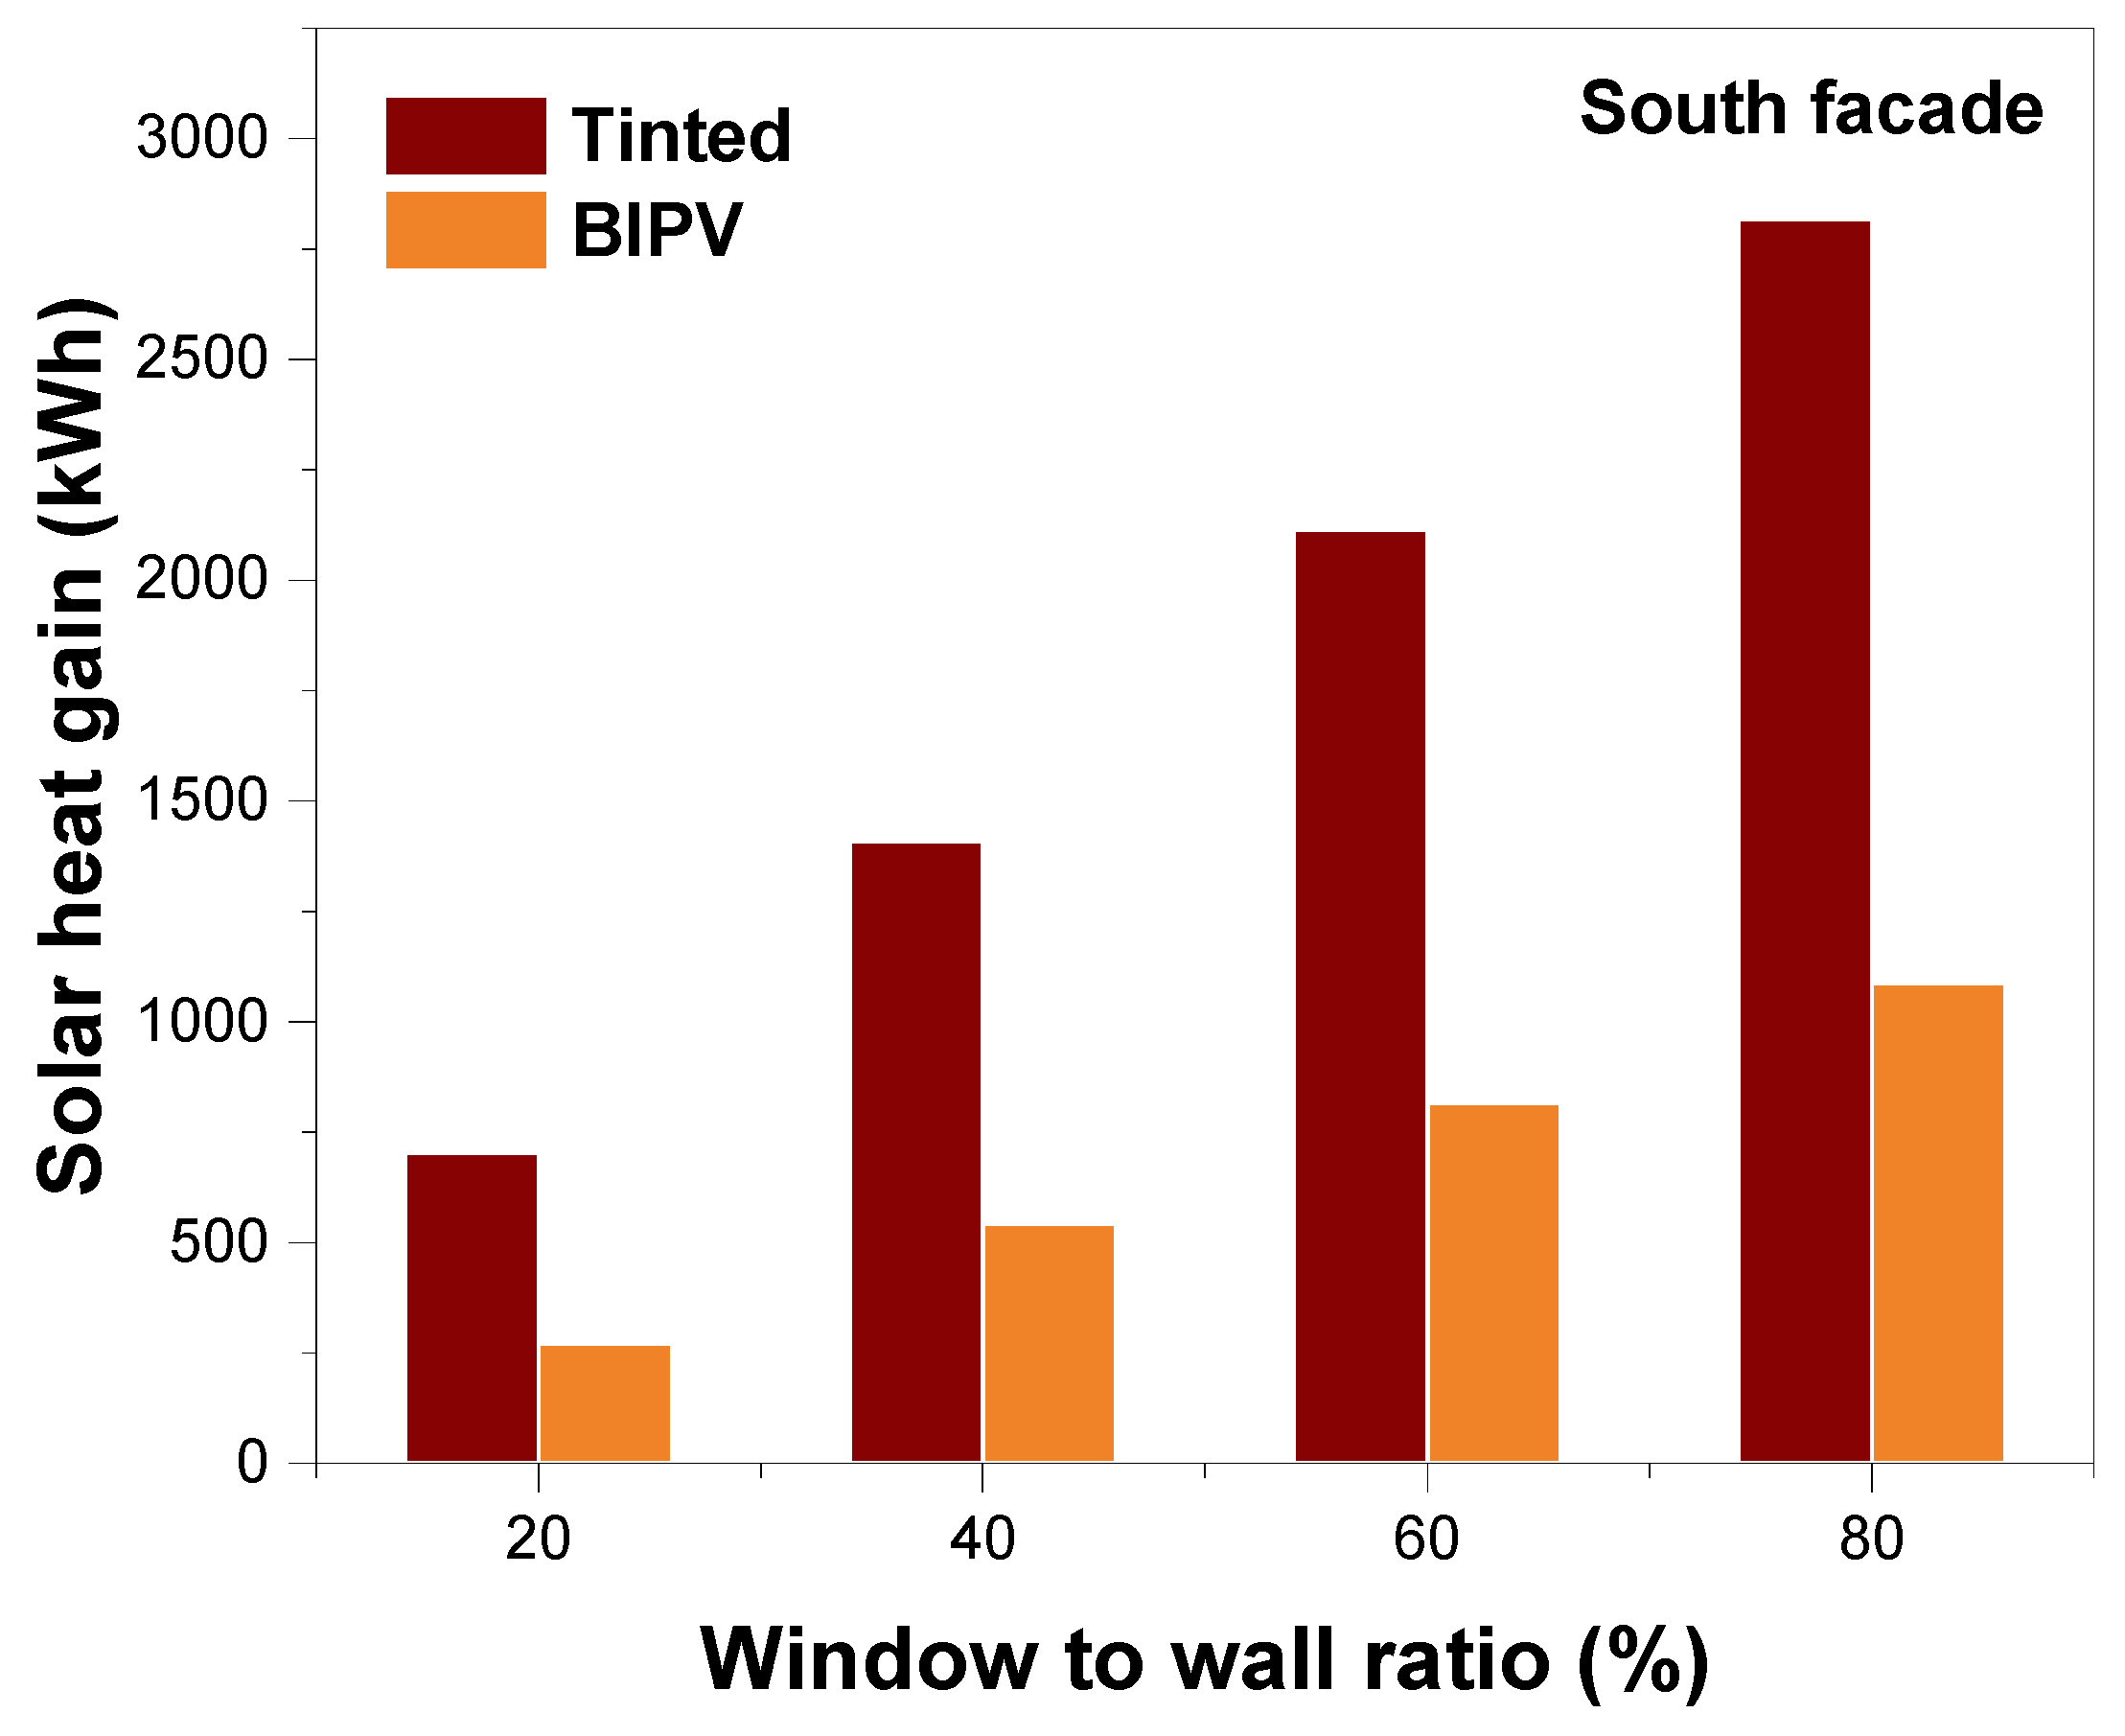
Solar-Heat-Gain Factors (SHGFs)

Solar-heat-gain factor is required for determining cooling load and is expressed as:
S H G F = B V T ( τ b + N i α b ) + I V ( 0.799 + 0.0544 N i )
where Iv is the sum of hourly diffuse and reflected radiation on the vertical glazing (W/m2); BVT is the hourly direct beam radiation on the vertical glazing (W/m2); Ni is the inward-flowing fraction of the absorbed radiation; τb is the transmittance of the reference glazing for direct beam radiation; and αb is the absorption of the reference glazing for direct beam radiation. The procedures for determining SHGFs in Li and Lam [27] were used. Upon determining the vertical SHGFs, the average SHGFs were calculated as follows:
Average SHGF = [ j = 1 N ( i = 1 n S H G F ) ] / ( 10 N )
where n is the number of daylight hours per day, and N is the number of days in the averaging period.

Daylight-Linked Lighting Control

To determine the lighting requirement, the electric-lighting savings due to daylighting control for the year (E) and cooling season (Ec) were determined using Equations (6) and (7).
E = L P D × A f × H × F s / 1000
E C = L P D × A f × H × F s / 1000
where LDP is the installed lighting-power density (W/m2), Af is the floor area (m2), and H is the total hours of operation of electric lighting (hour). Furthermore, Fs represents the annual fractional electric energy saving, while Fs’ is the fractional energy saving for determining the cooling load due to electric-lighting reduction in cooling seasons. To determine Fs, the minimum-light-output ratio (Rf), the fractional power consumption (Rw) and the average illuminance (Ein) are needed. When Ein exceeds the design illuminance (Es) times (1 − Rf), the fractional energy saving (Fs) is;
F s = 1 R w
However, if Ein is less than Es (1 − Rf), Fs becomes:
F s = ( 1 R w ) E i n ( 1 R f ) E s
The Rf of 0.05 and the Rw of 0.2 were adopted to determine Fs. Lastly, by changing the input values to those of the cooling season, the same procedure for calculating Fs was used for Fs’. The average illuminance (klux) on all the room surfaces is described as [38];
E i n = E v A w × V T A i n ( 1 R )
where Ev is the vertical illuminance on the window façade (lux), Ein is the average illuminance on all the room surfaces (lux), Aw is the window area (m2), Ain is the total area of indoor surfaces (m2), and R is the mean reflectance of all indoor surfaces.

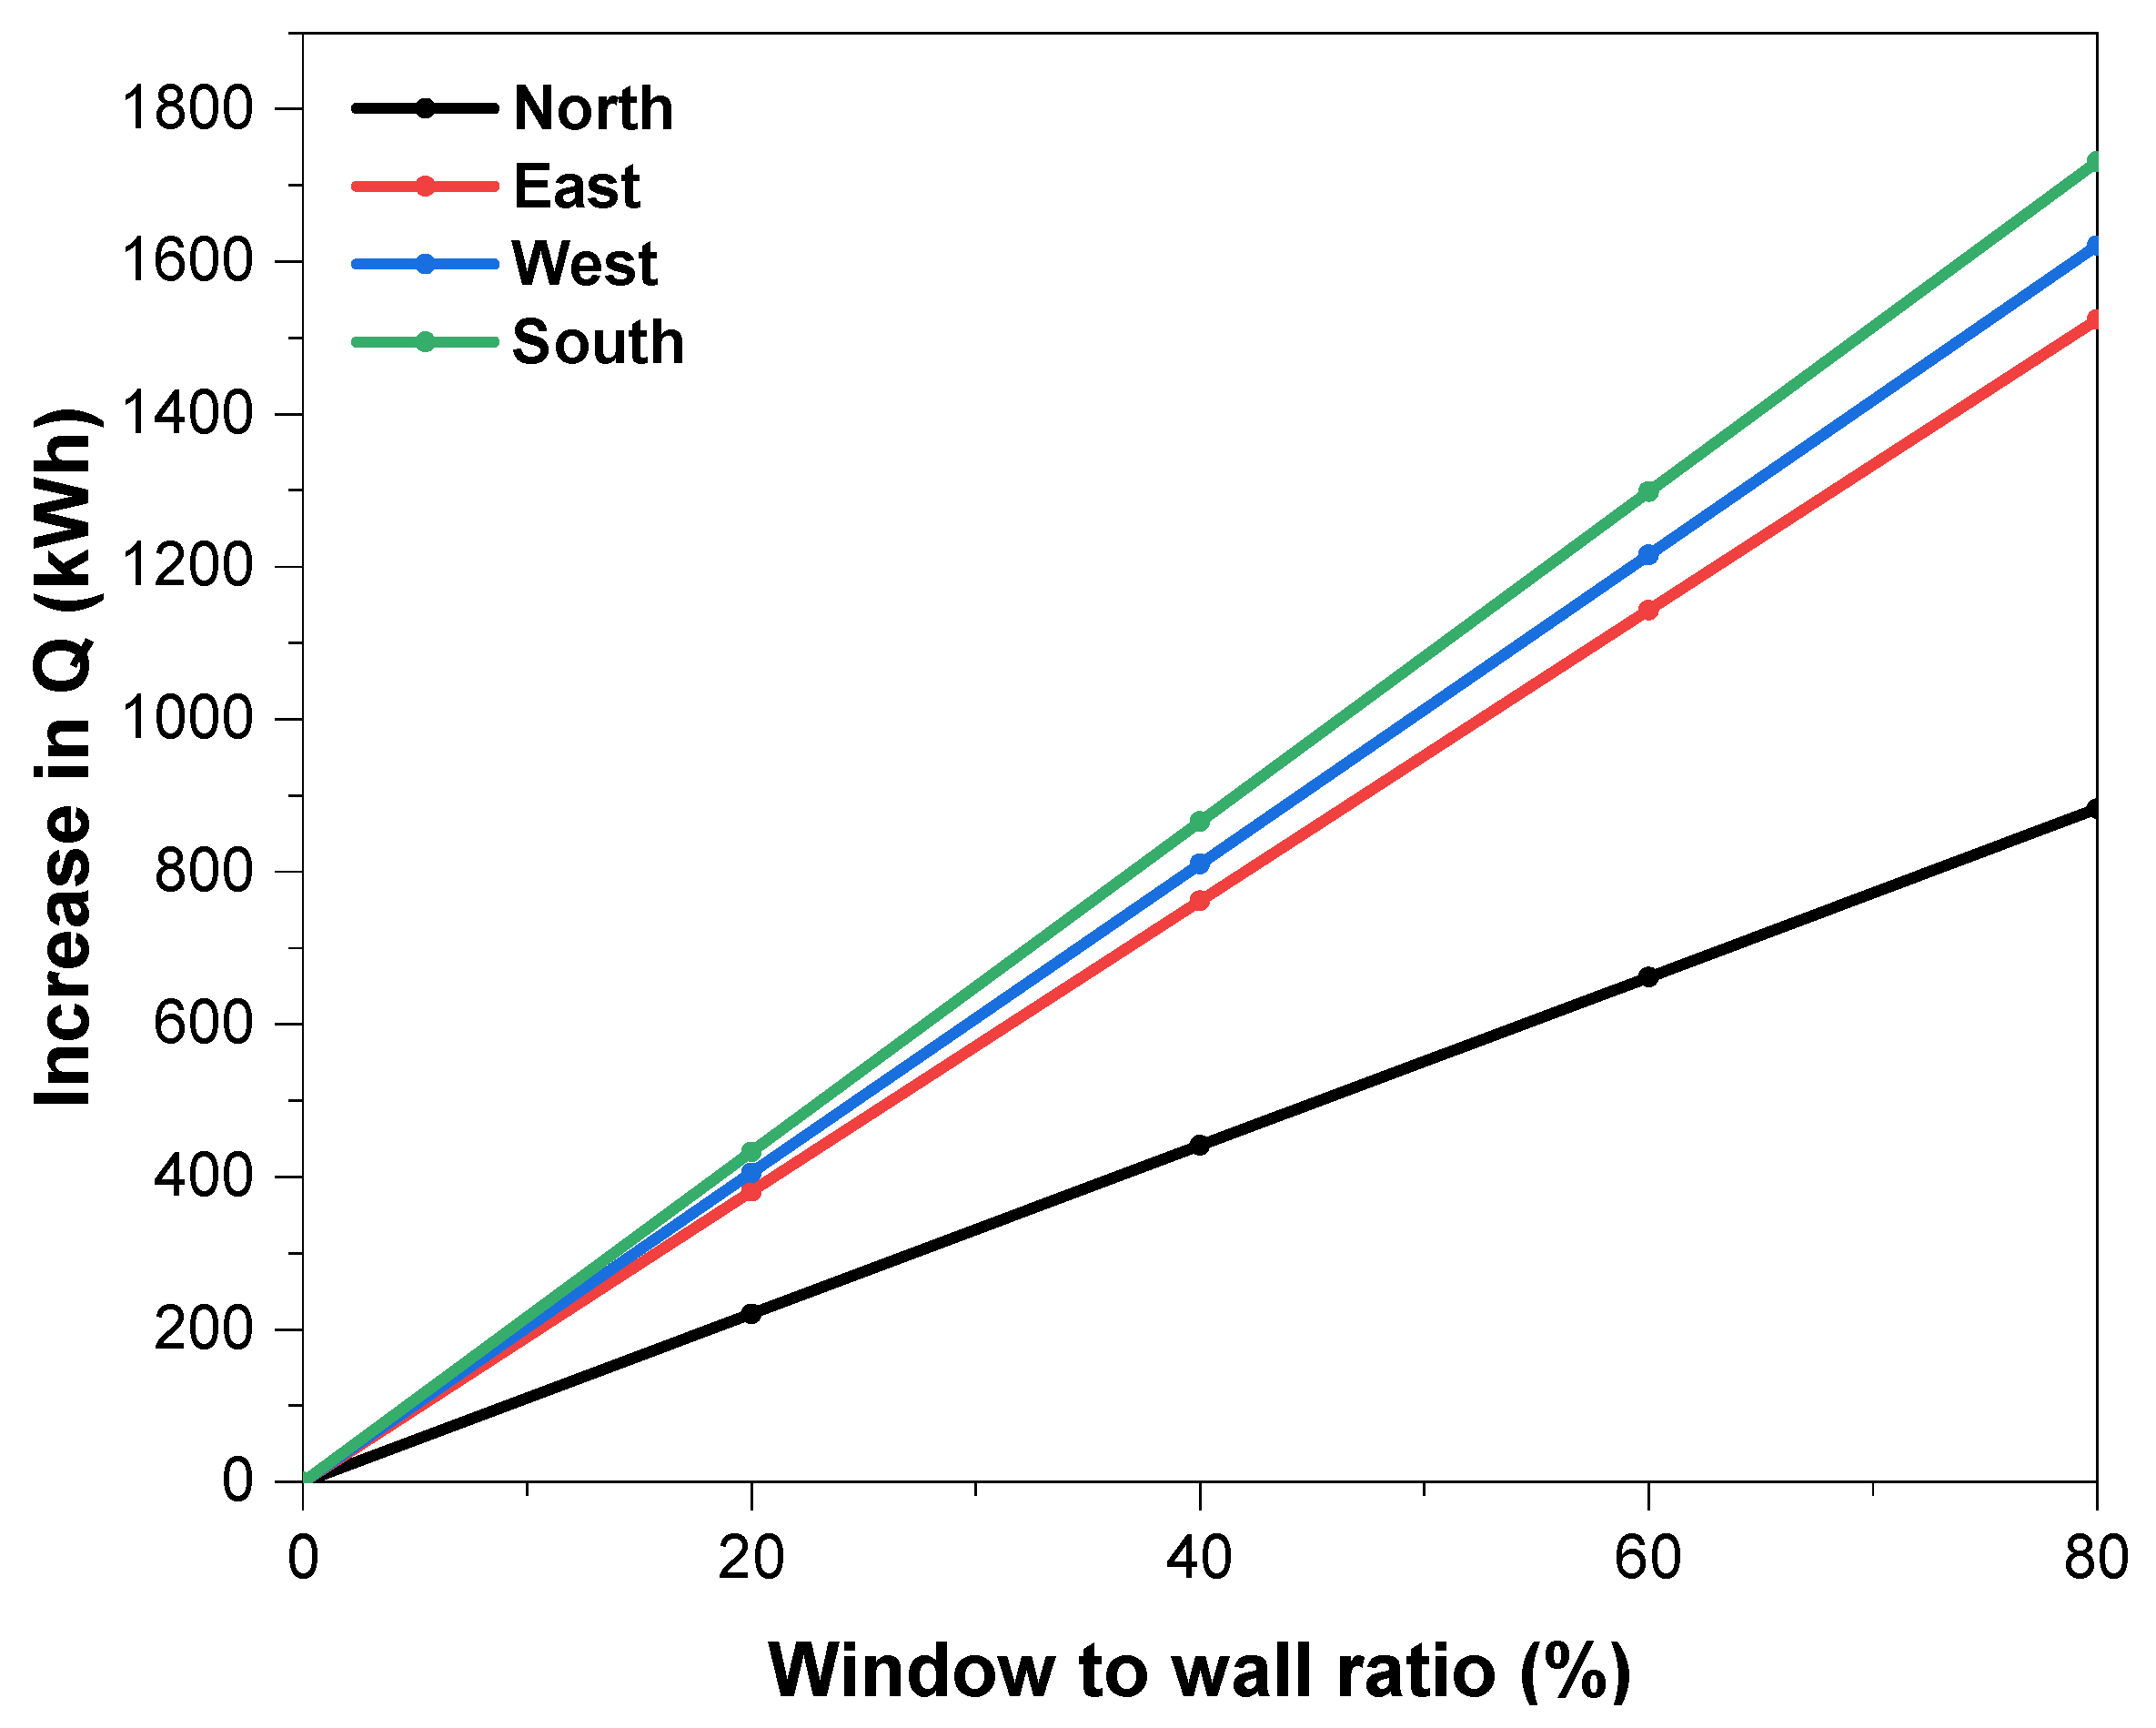
Solar Heat Gain (Q) and Cooling Requirements during the Cooling Season

For cooling requirements, the Q for the 9-month cooling season was determined. The 9-month cooling season was used since, in Hong Kong, most office buildings require cooling from mid-March to mid-November due to high internal loads. The Q is given as;
Q = [ ( A v e r a g e   S H G F × A w × S C × H ) / 100 ] × 5.5 / 7
where Q = solar heat gain (kWh), Aw = window area (m2), SC = glass shading coefficient, H = 10 × N = total number of hours. The 5.5/7 is the assumed 5-1/2-day working week.
Therefore, the cooling requirement during cooling seasons was evaluated based on the Q via the window and the reduction in sensible heat from reduced electric-lighting use (i.e., Ec). The result was divided by the coefficient of performance (COP) of the air-conditioning system. Furthermore, only about 75% of the electric power for a LED lamp is converted to heat [39]. Therefore, a 75% reduction in sensible heat during the nine-month cooling season was used in this calculation.

Electricity Generation Due to Semi-Transparent BIPV Panels

The output (Ep) of the BIPV in kWh/m2 was derived from Equation (12);
E P = A P y p P R ( H P H S T P ) ( 1 + δ p ( T a T S T P ) )
where Ap is the total solar-panel area (m2), yp is the efficiency of the PV (%), PR is the performance ratio (%), Hp is the solar radiation (kWh/m2), HSTP is the standard solar radiation of the PV (kWh/m2), δp is the temperature coefficient of power (%), Ta is the hourly ambient temperature (°C), and TSTP is the standard temperature (°C). Assumed values for yp, PR, HSTP, δp, and TSTP were 10%, 0.75, 1 kWh/m2, 0.001 and 25 °C, respectively. These values were based on standards provided by [40,41,42].

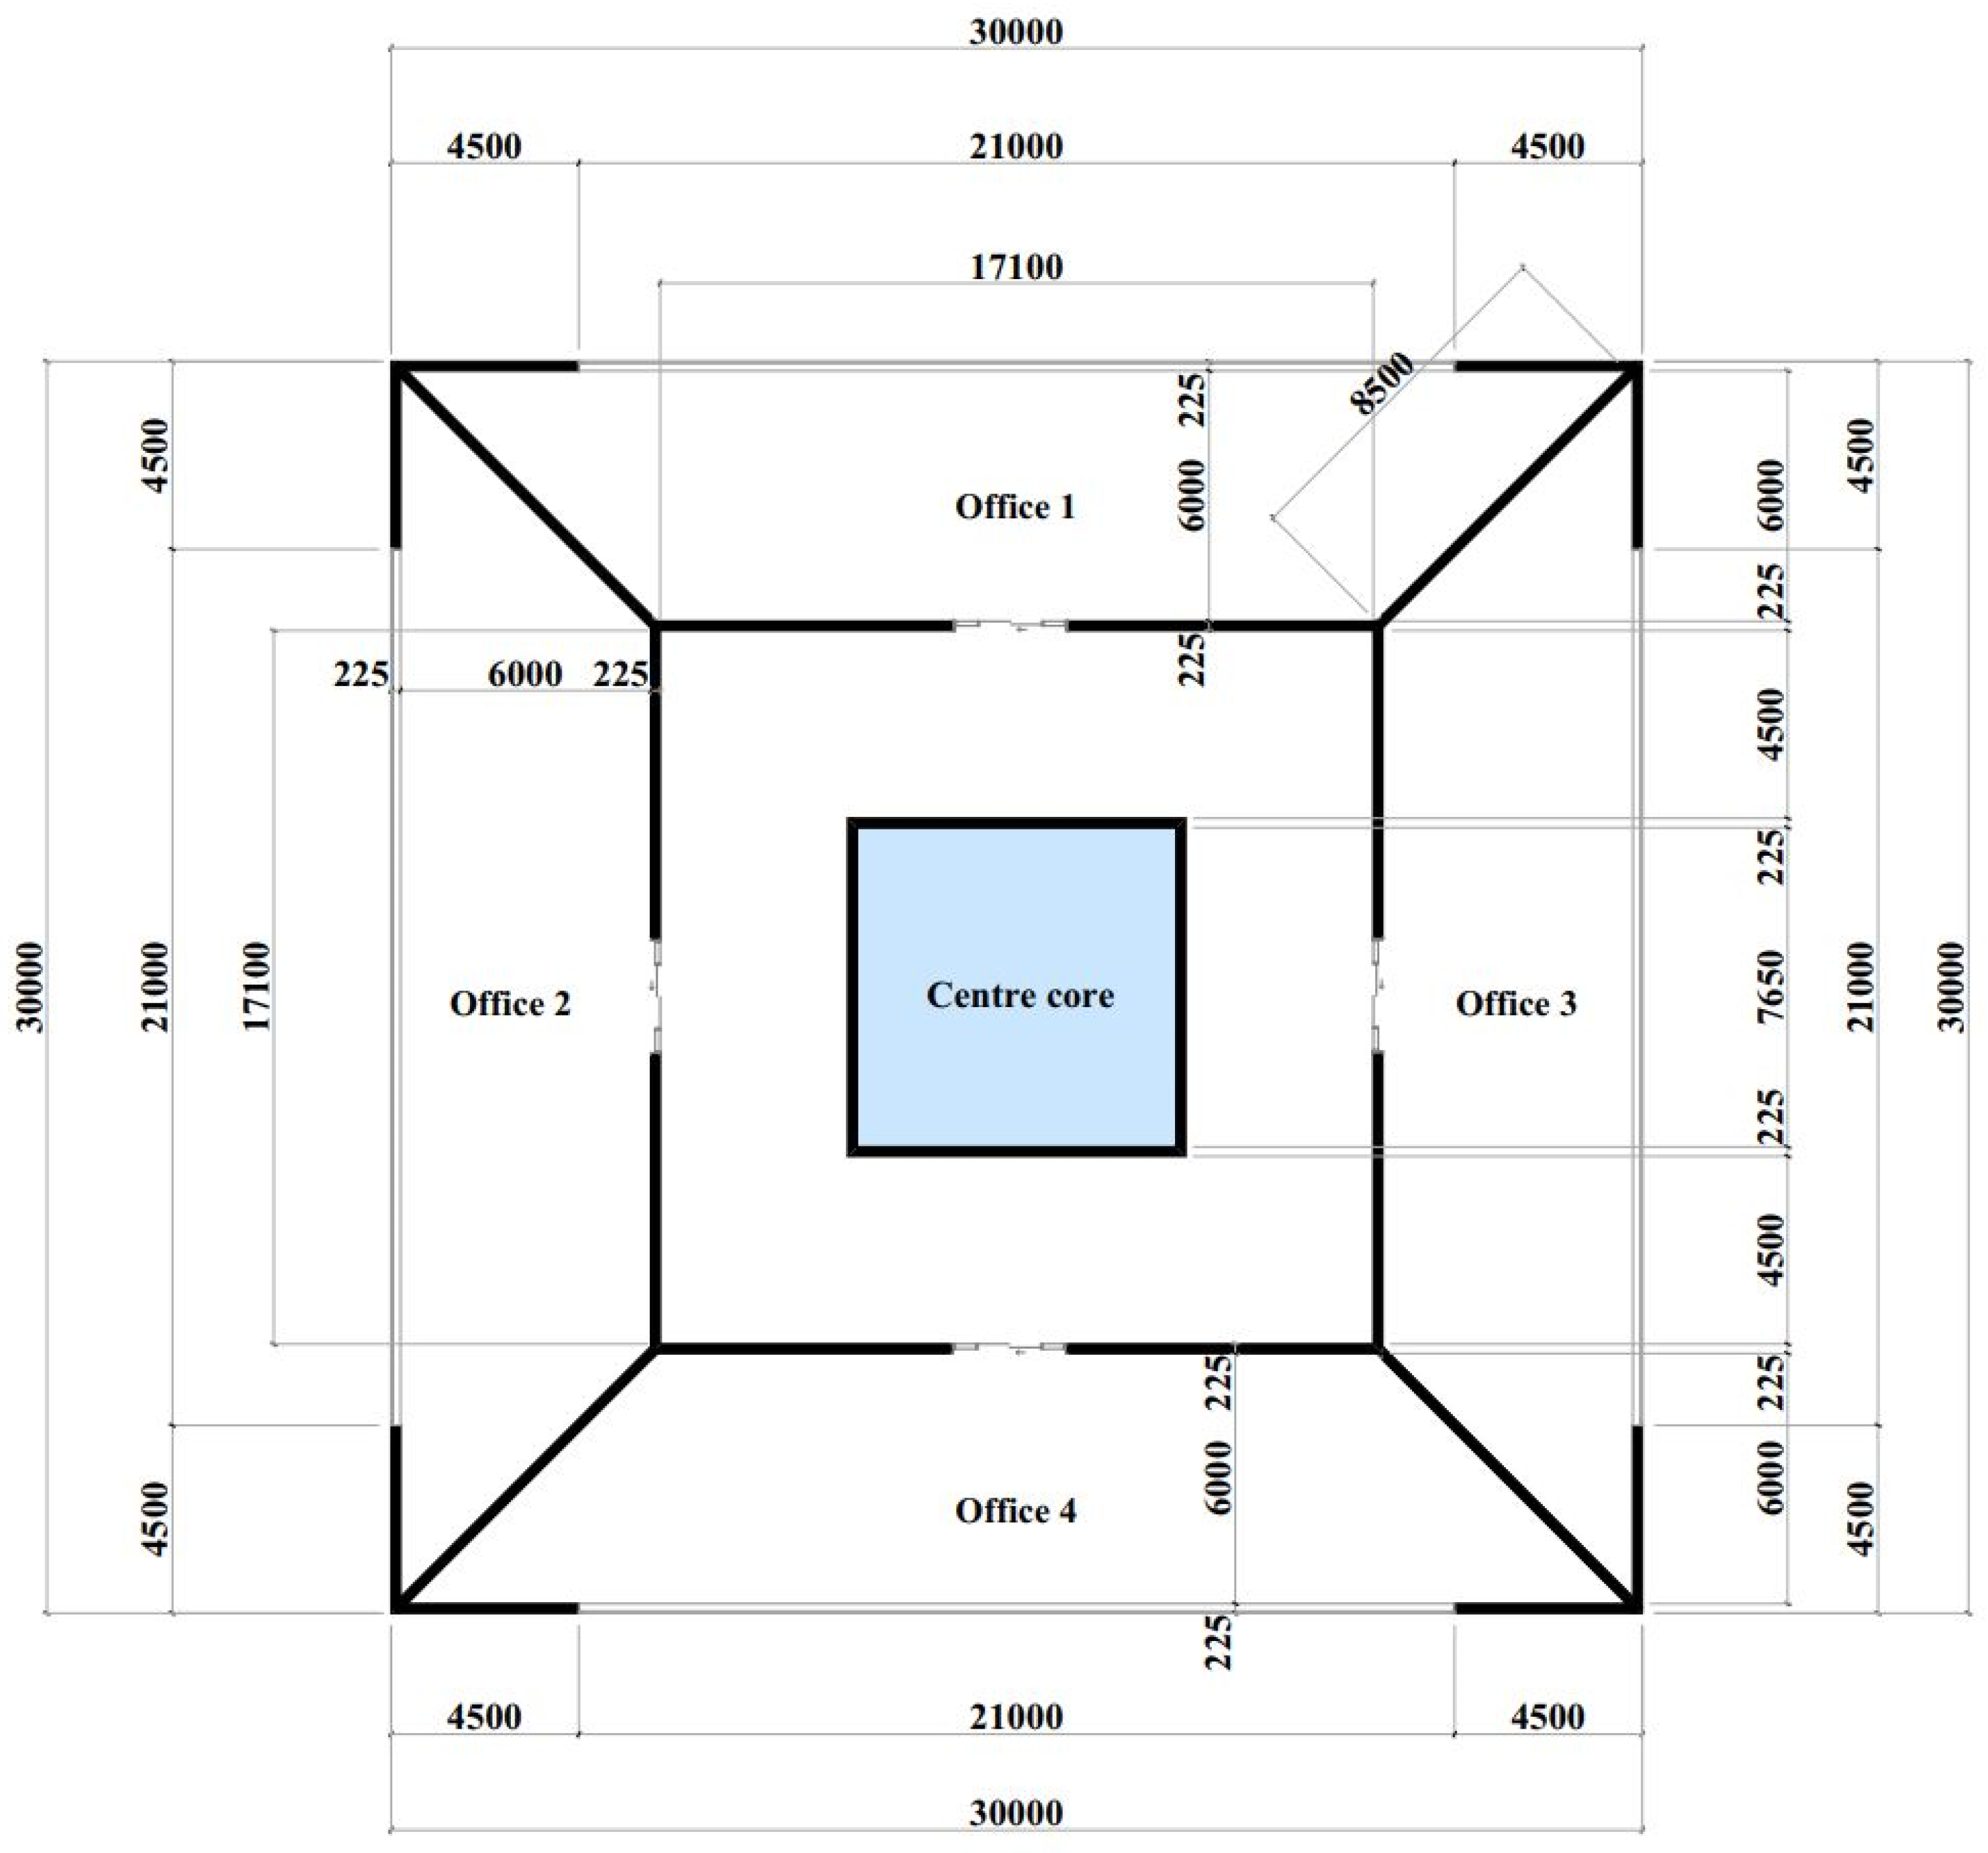
2.2.5. Base Case Study

A generic 30-storey office building with typical floor plans of 30 m by 30 m by 3.5 m was assumed. Four similar trapezoid-shaped offices in each building’s orientation, as shown in Figure 3, were evaluated. Each office has base dimensions of 30 m by 17.1 m and equal leg dimensions of 8.5 m. The working hours and days were 10 h (8:00 to 18:00) and 5-1/2 days per working week, respectively. A water-cooled chiller system with COP of 5.0 was adopted, while the area-weighted mean reflectance (R) for all the internal surfaces was 0.5. The indoor-design illuminance was 500 lux with a light-emitting diode (LED) installed lighting-power density (LPD) of 20 W/m2. For simplicity, the lighting output was assumed to be proportional to the light load, as suggested in [23]. An internal shading device was assumed to reduce the SC and VT by 75% and 60% when solar intensity was greater than 95 W/m2. Furthermore, the typical office’s assumed description is similar to that of the other offices. Assumed values were adopted from previous studies [23,43]. The COP was based on the range of water-cooled chillers [44]. Three cases were assessed to evaluate the influence of façade and design properties on energy use, as shown in Table 2. The first case had a tinted-glass-window façade without daylight-linked control. In the second case, daylight-linked control was included, while in the third case, the tinted glass with daylight-linked control was replaced with BIPV. The overall energy benefits of all cases were compared.

3. Results and Discussion

3.1. Results of Analyzed Solar Radiation and Daylight Illuminance

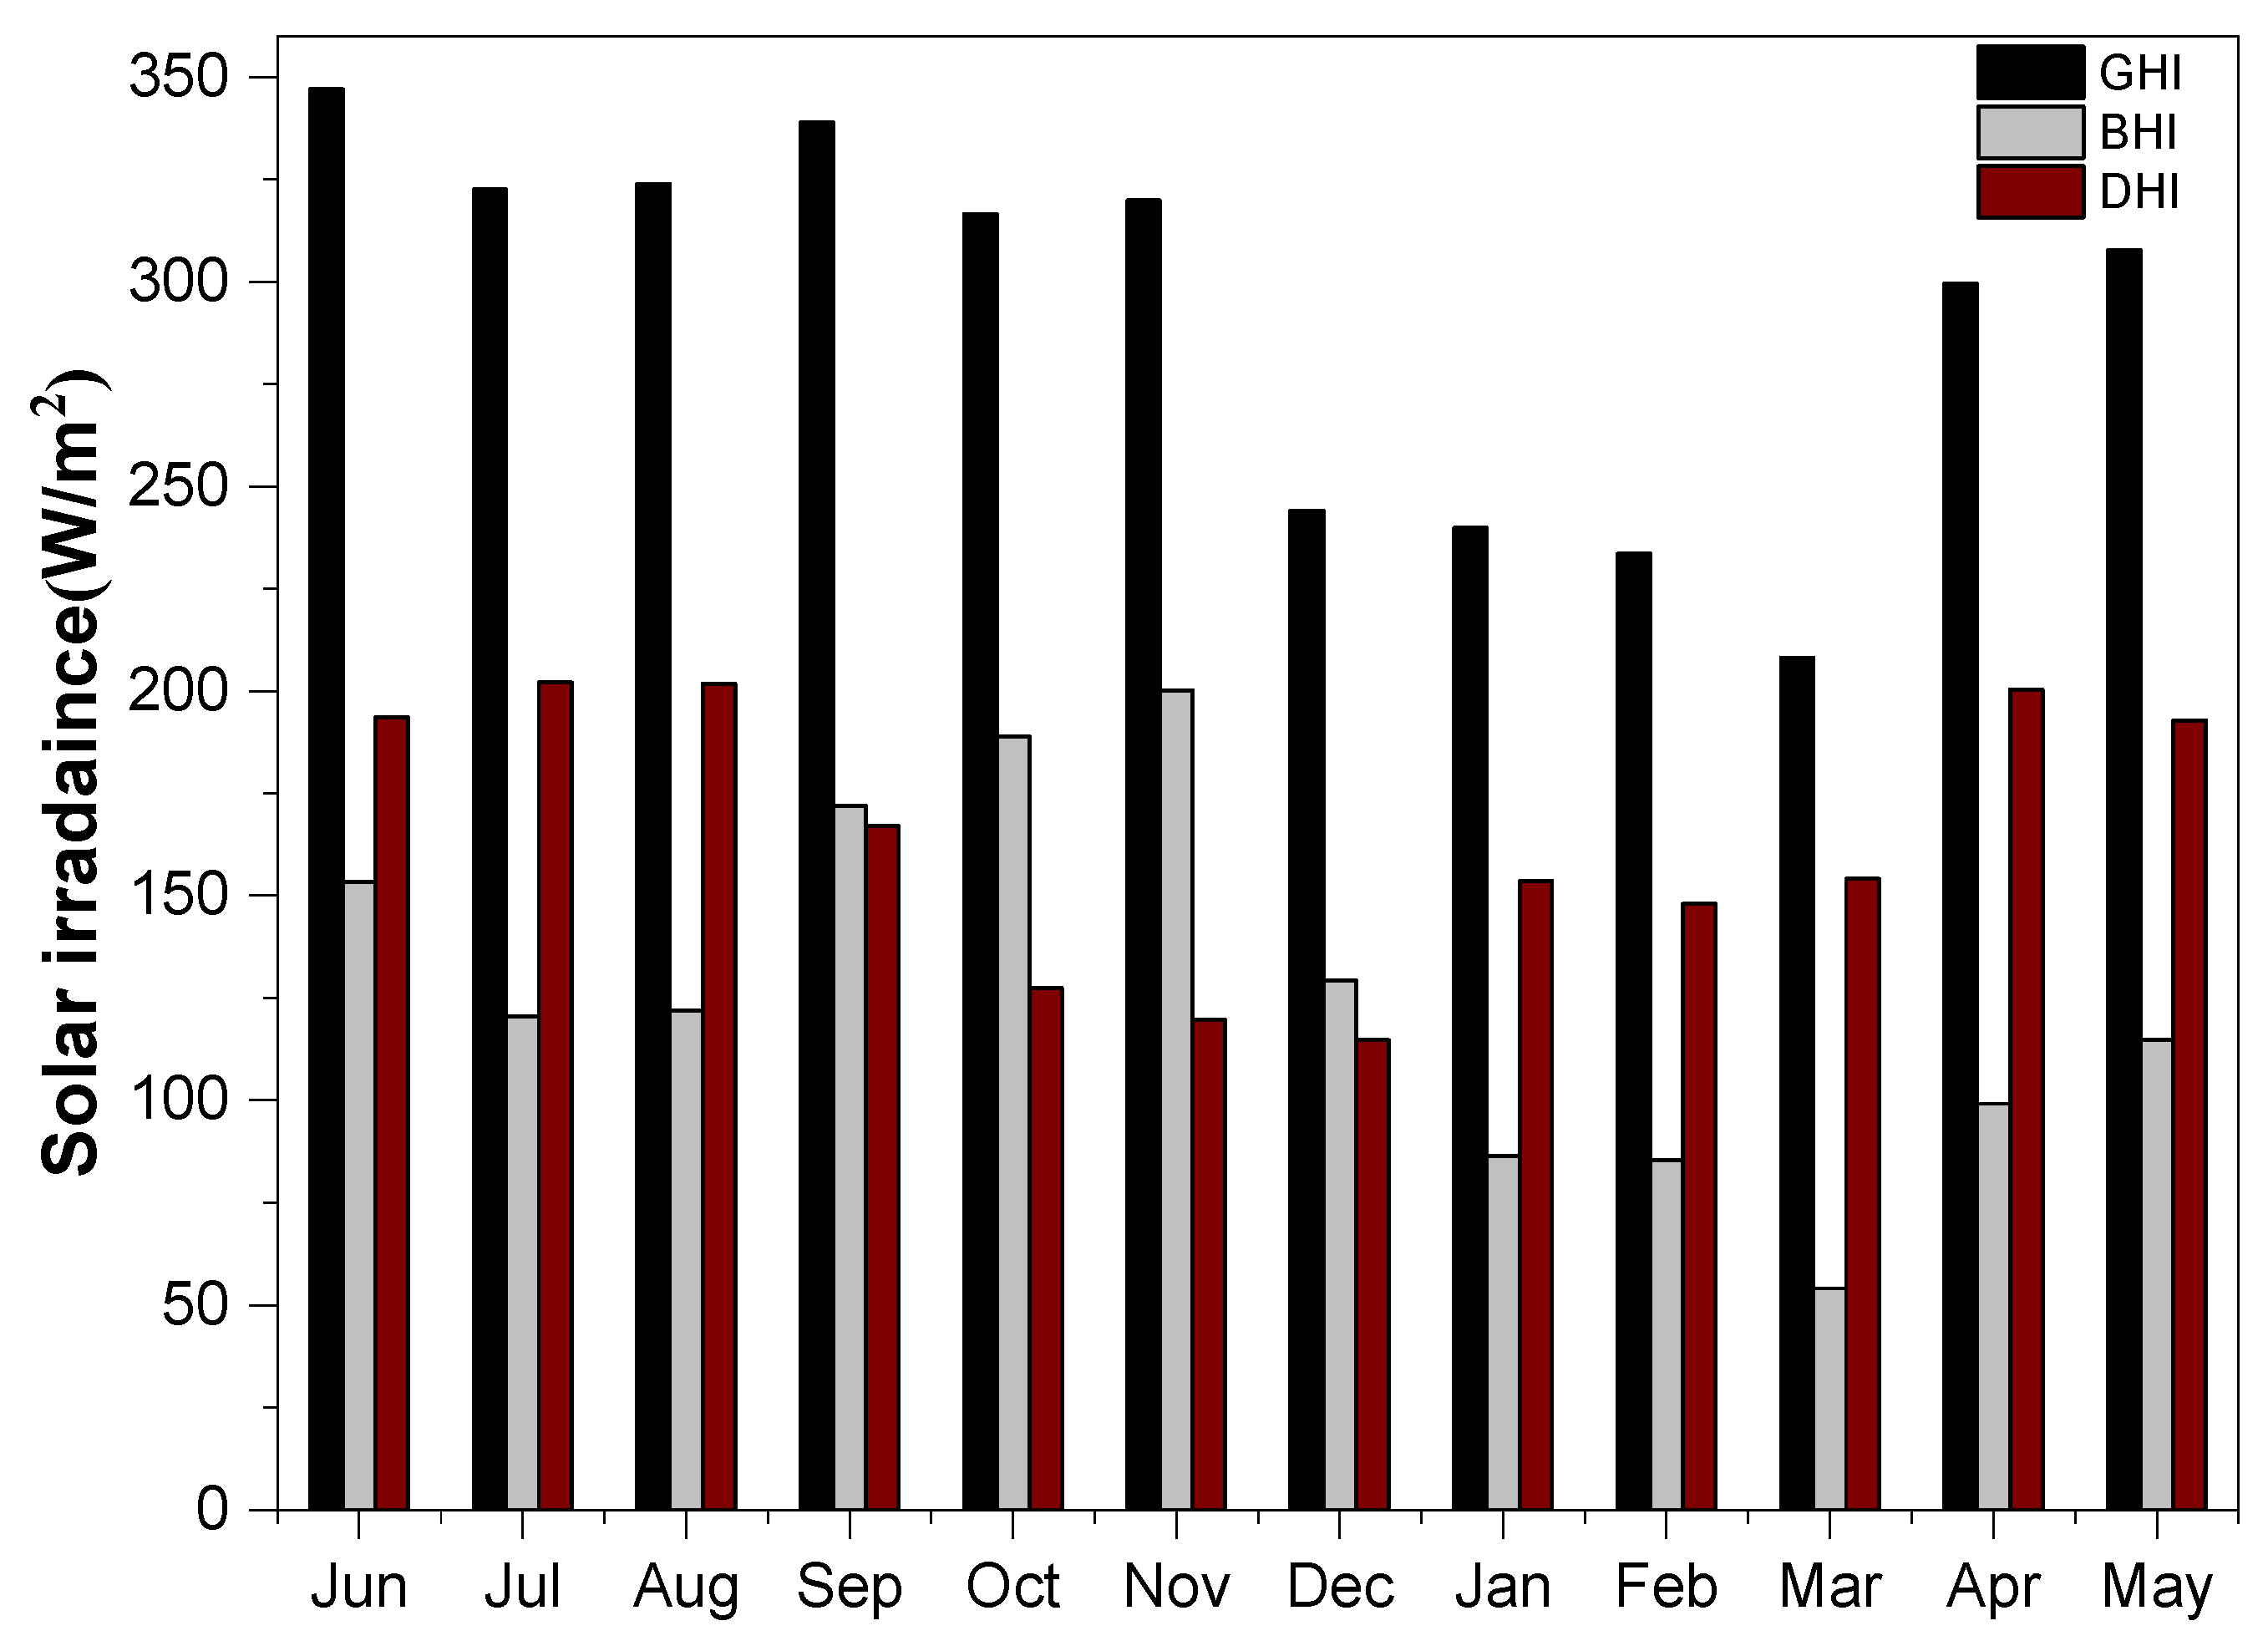
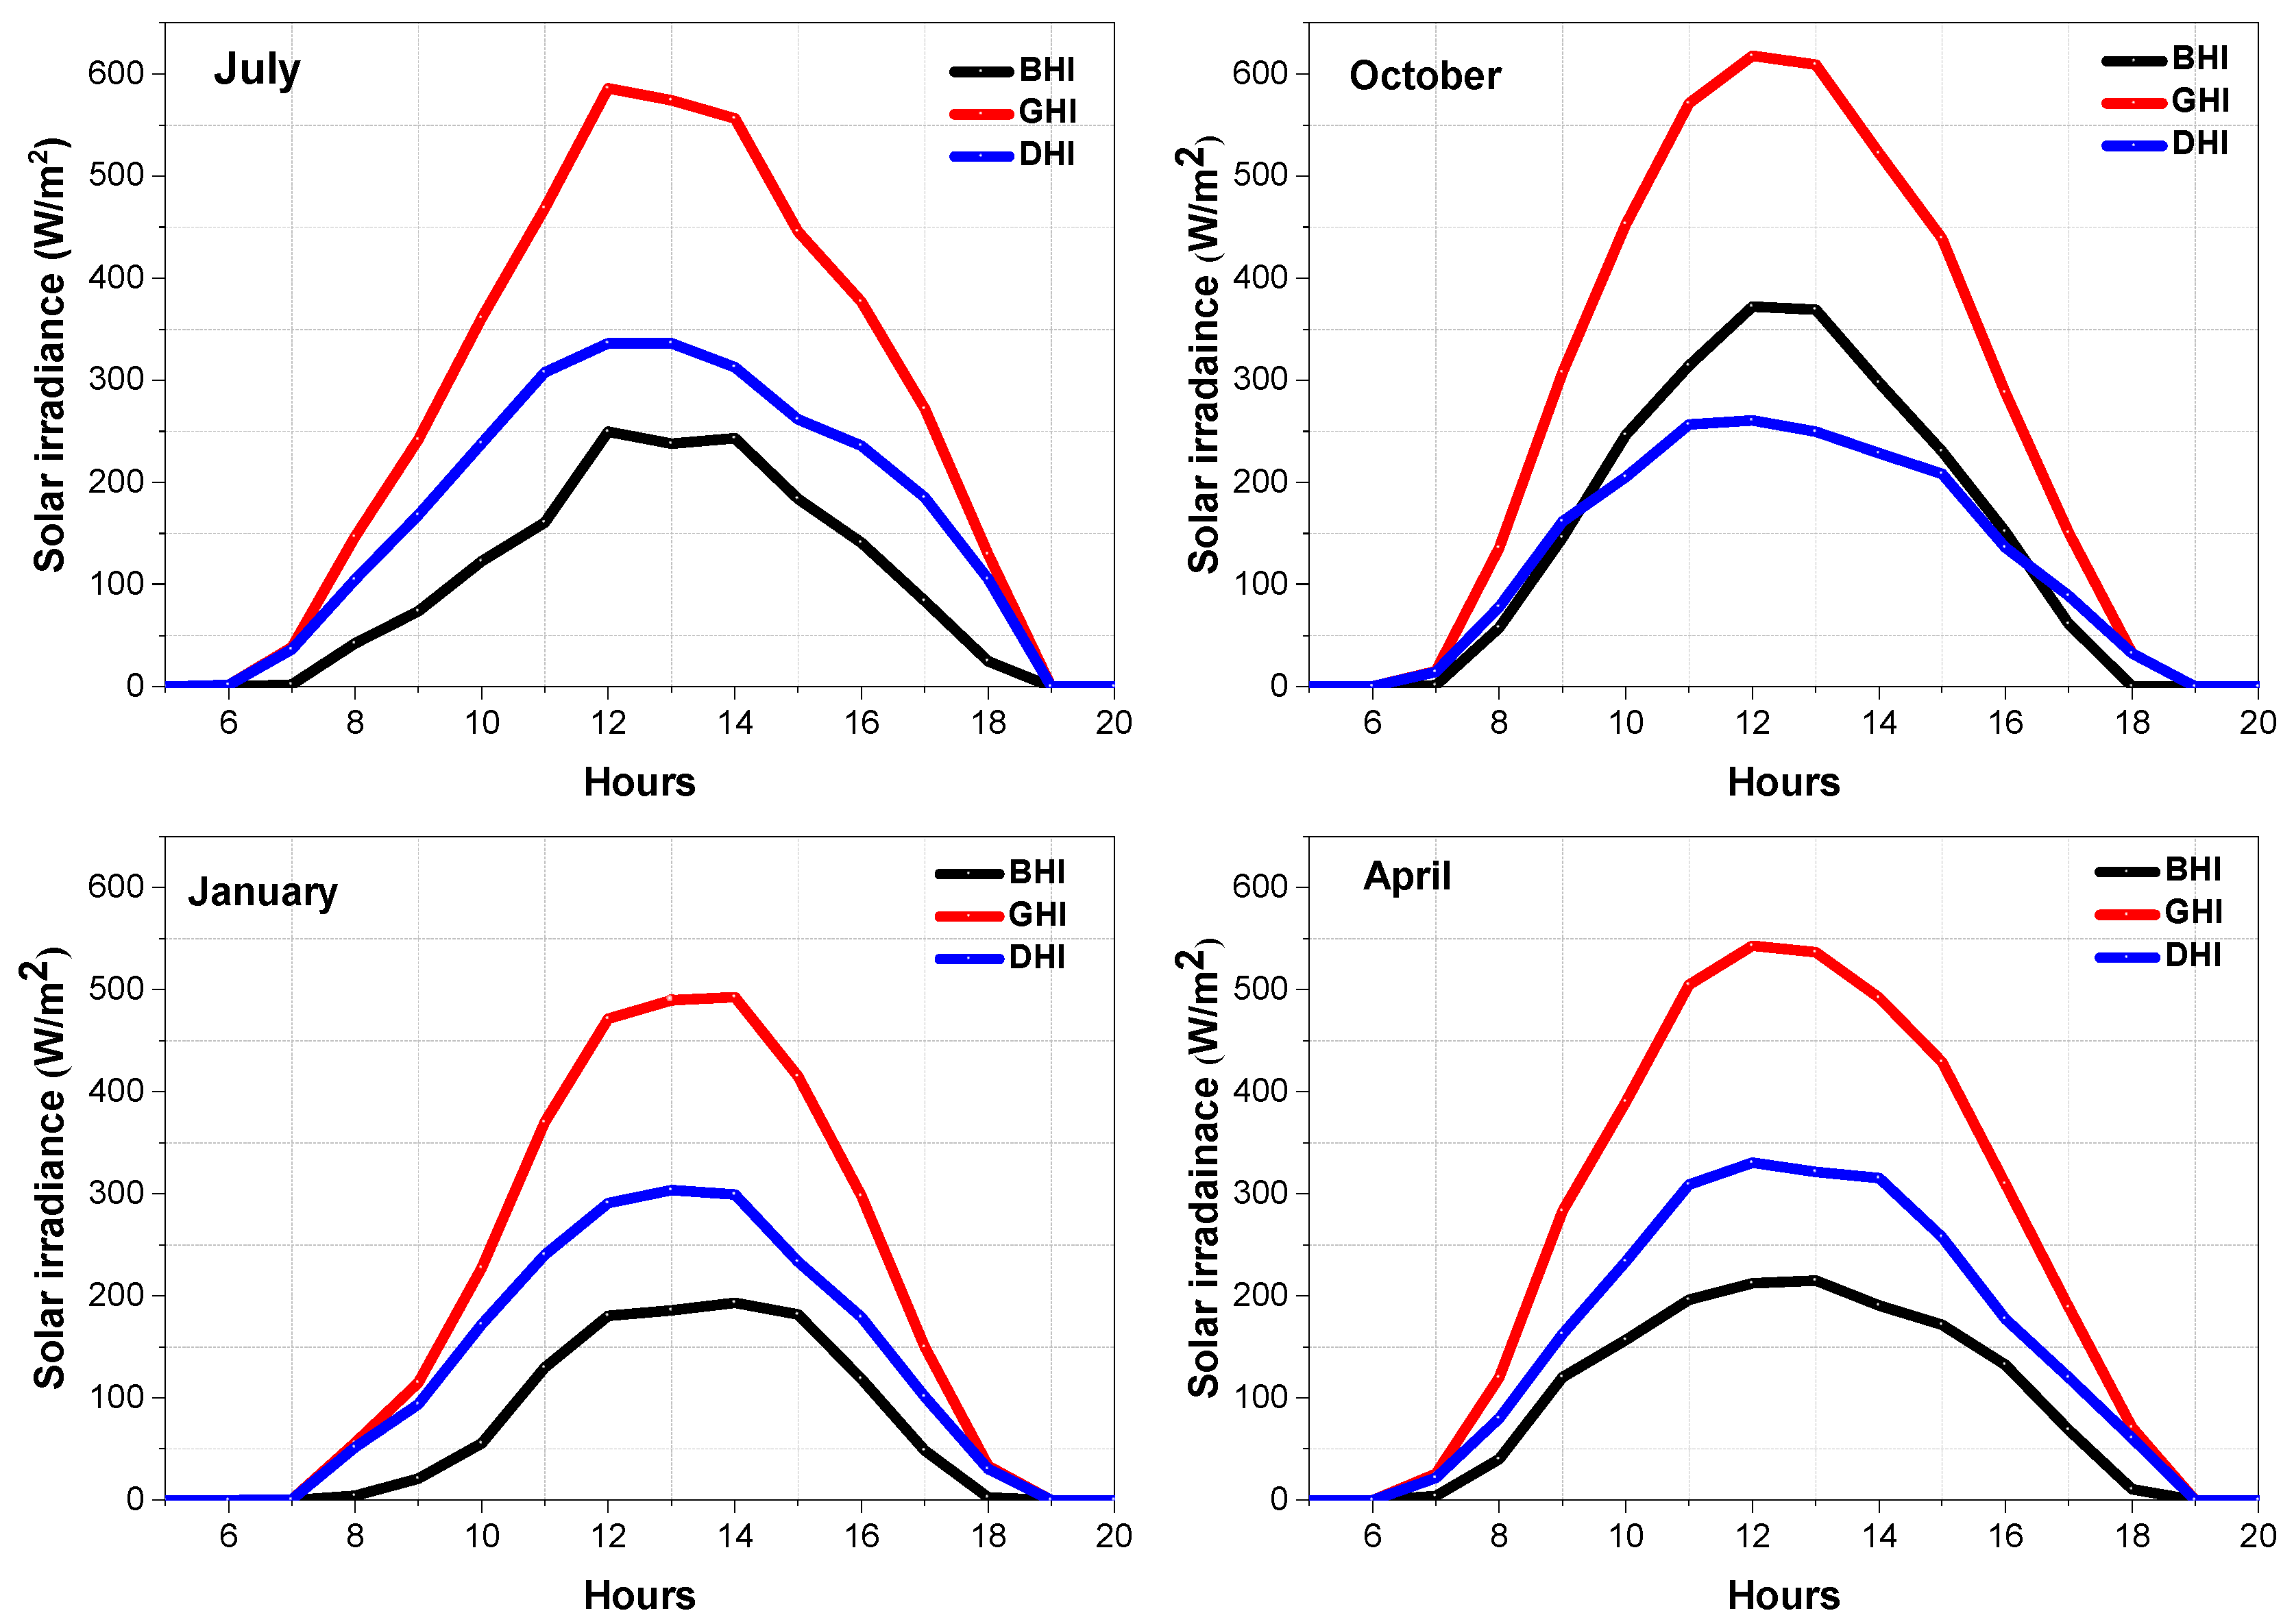
3.1.1. Monthly Average Daily and Hourly Solar Radiation on a Horizontal Surface

The monthly average of the daily direct, global and diffuse horizontal solar radiation is presented in Figure 4. The global (GHI) values ranged from 208.1 W/m2/day in March to 346.9 W/m2/day in June, the diffuse (DHI) values varied between 114.7 W/m2/day in December to 202.1 W/m2/day in July, while the direct (BHI) values spanned from 54.0 W/m2/day in March to 200.2 W/m2/day in November. Due to the lengthy duration of daytime in the summer and the high solar altitude, the GHI from June to September was higher than in other months. By contrast, the short length of the days in the winter, the low solar altitude, and the unstable weather conditions in the spring were mostly responsible for the low GHI from December to March. Furthermore, there was a high proportion of the diffuse component in the months with low GHI (i.e., January to March). Lastly, the annual average GHI, DHI and BHI were 291.8 W/m2/day, 164.6 W/m2/day and 127.2 W/m2/day, respectively.
Figure 5 shows the monthly hourly solar radiation for January, April, July and October, representing winter, spring, summer and autumn, respectively. The peak GHI appeared at noon for July and April. In October and January, the peak GHI was found at 13:00 and 14:00, respectively. Furthermore, there was a significant difference between BHI and DHI in the other months. For example, the BHI was greater than the DHI in October. This was likely due to the clear sky usually experienced during autumn. By contrast, April has more DHI than BHI. This finding was due to the cloudy and unstable sky conditions in the spring season.

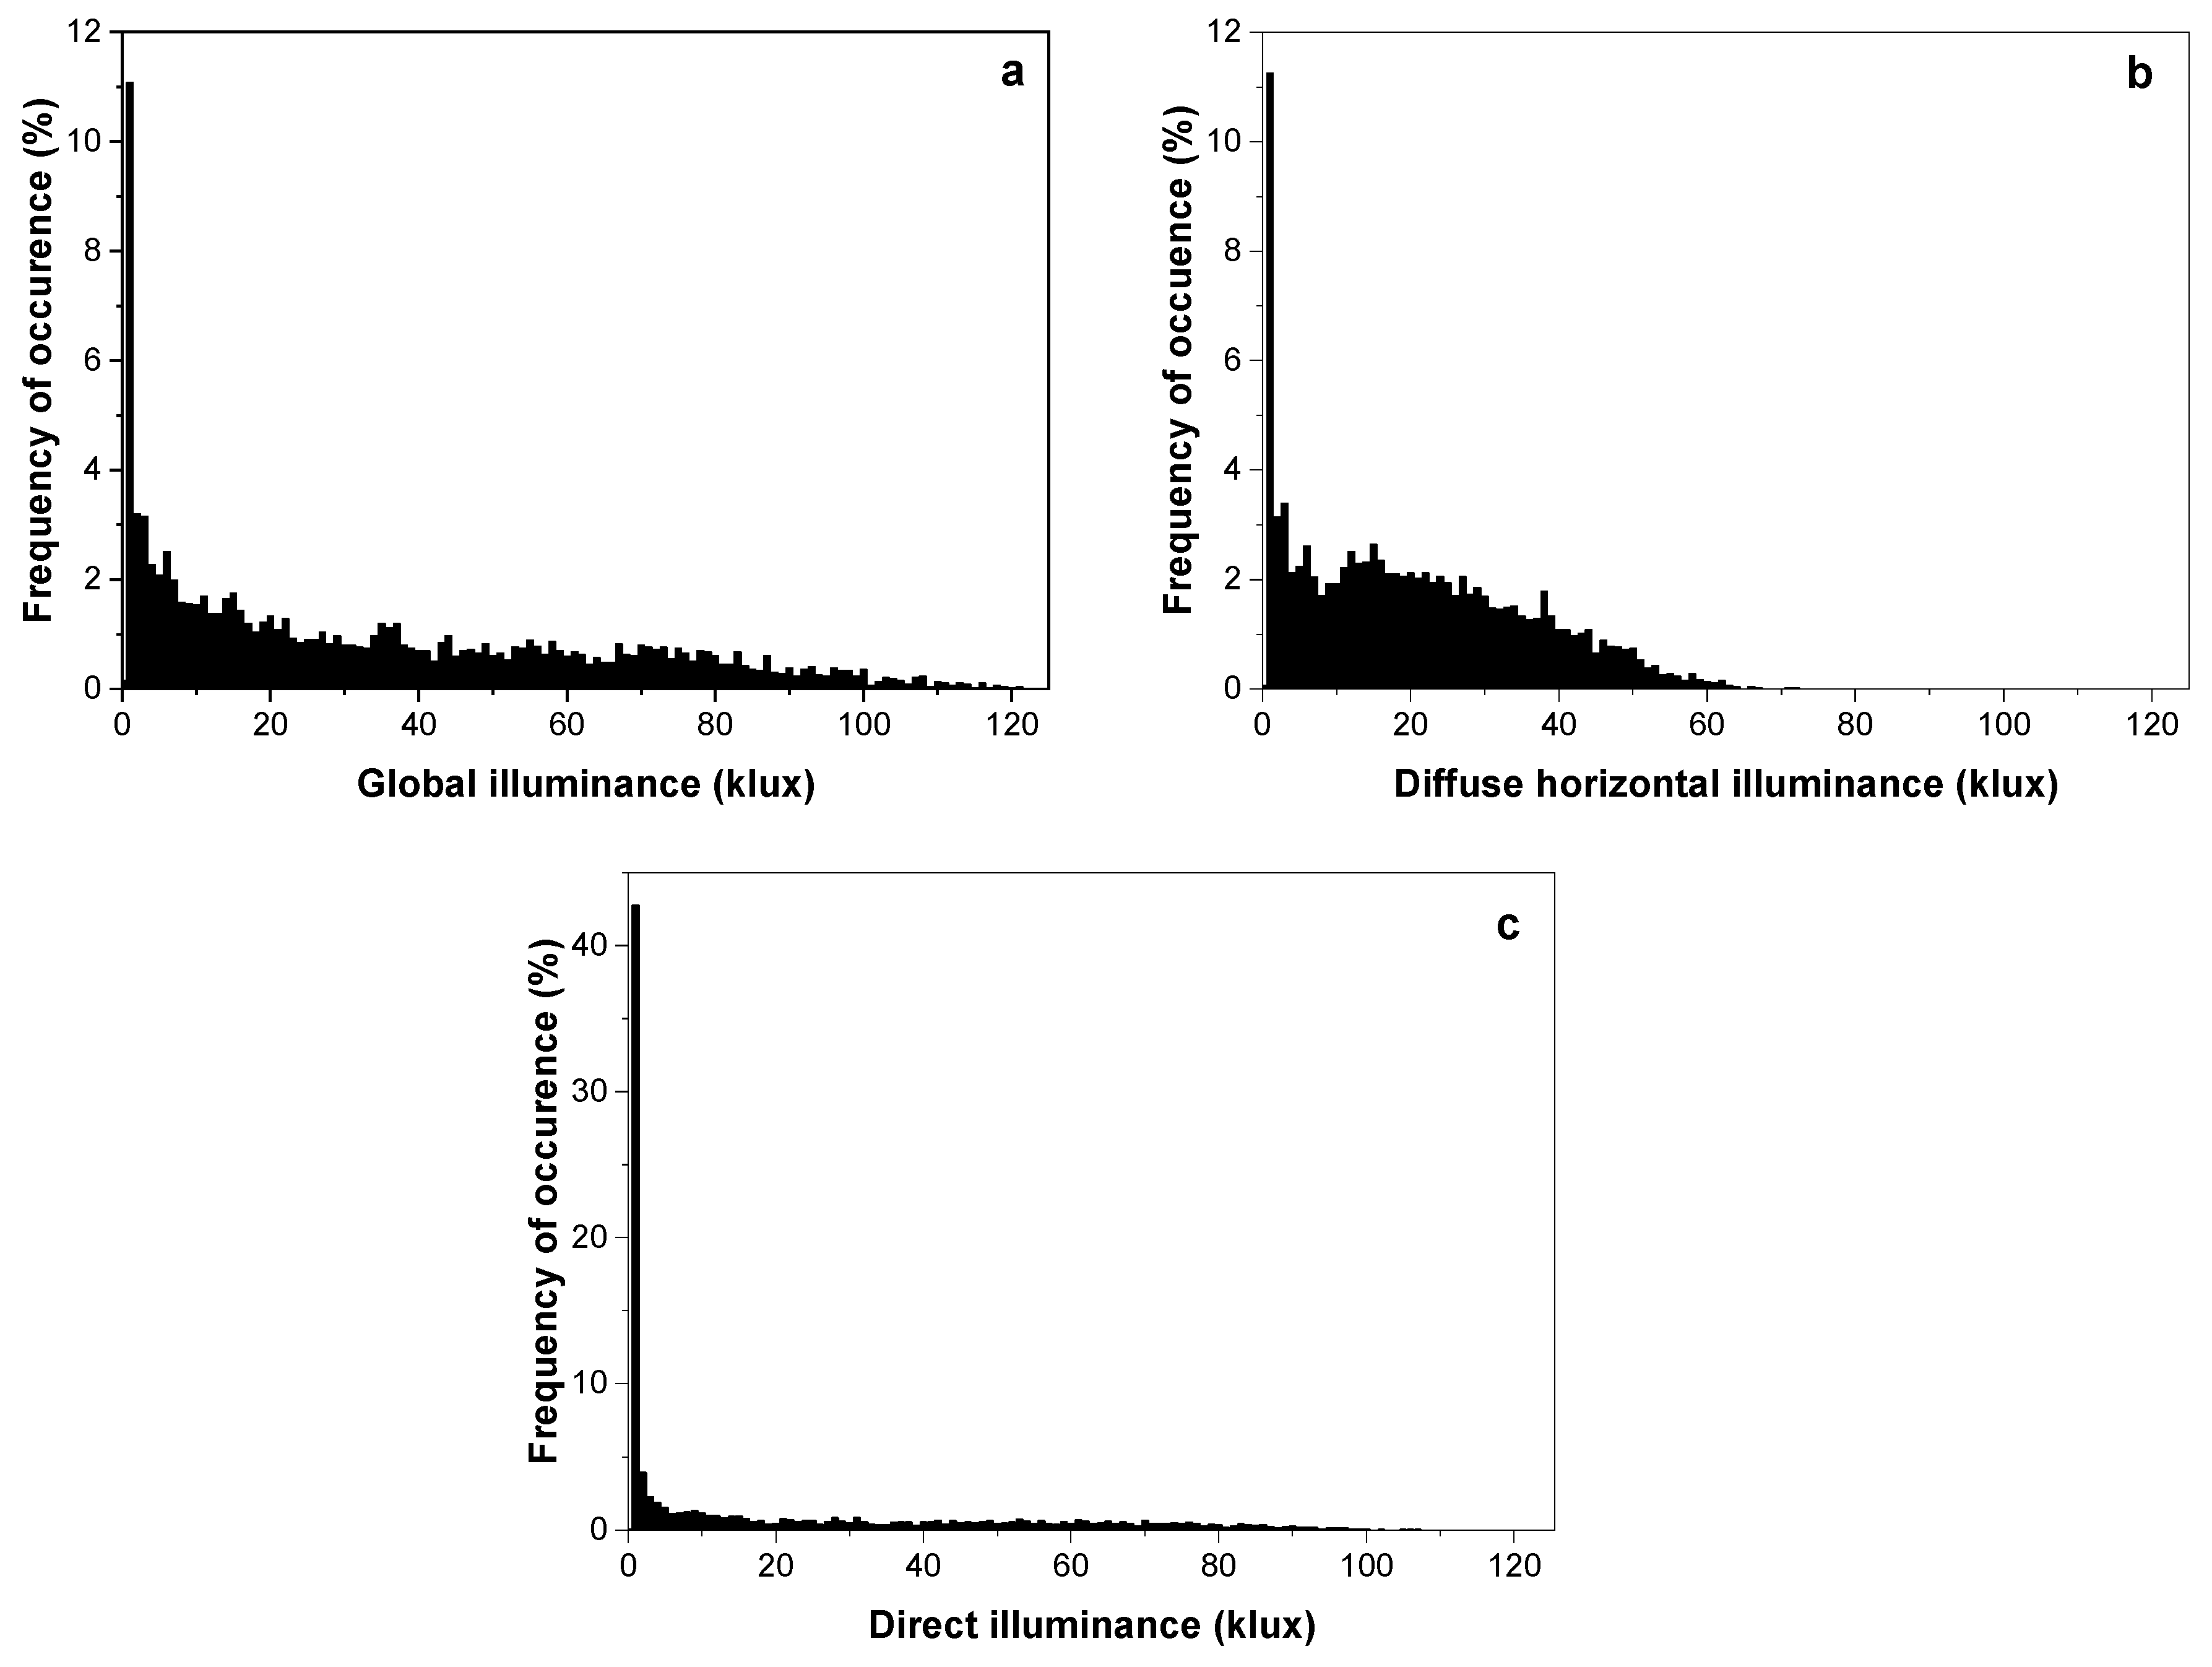
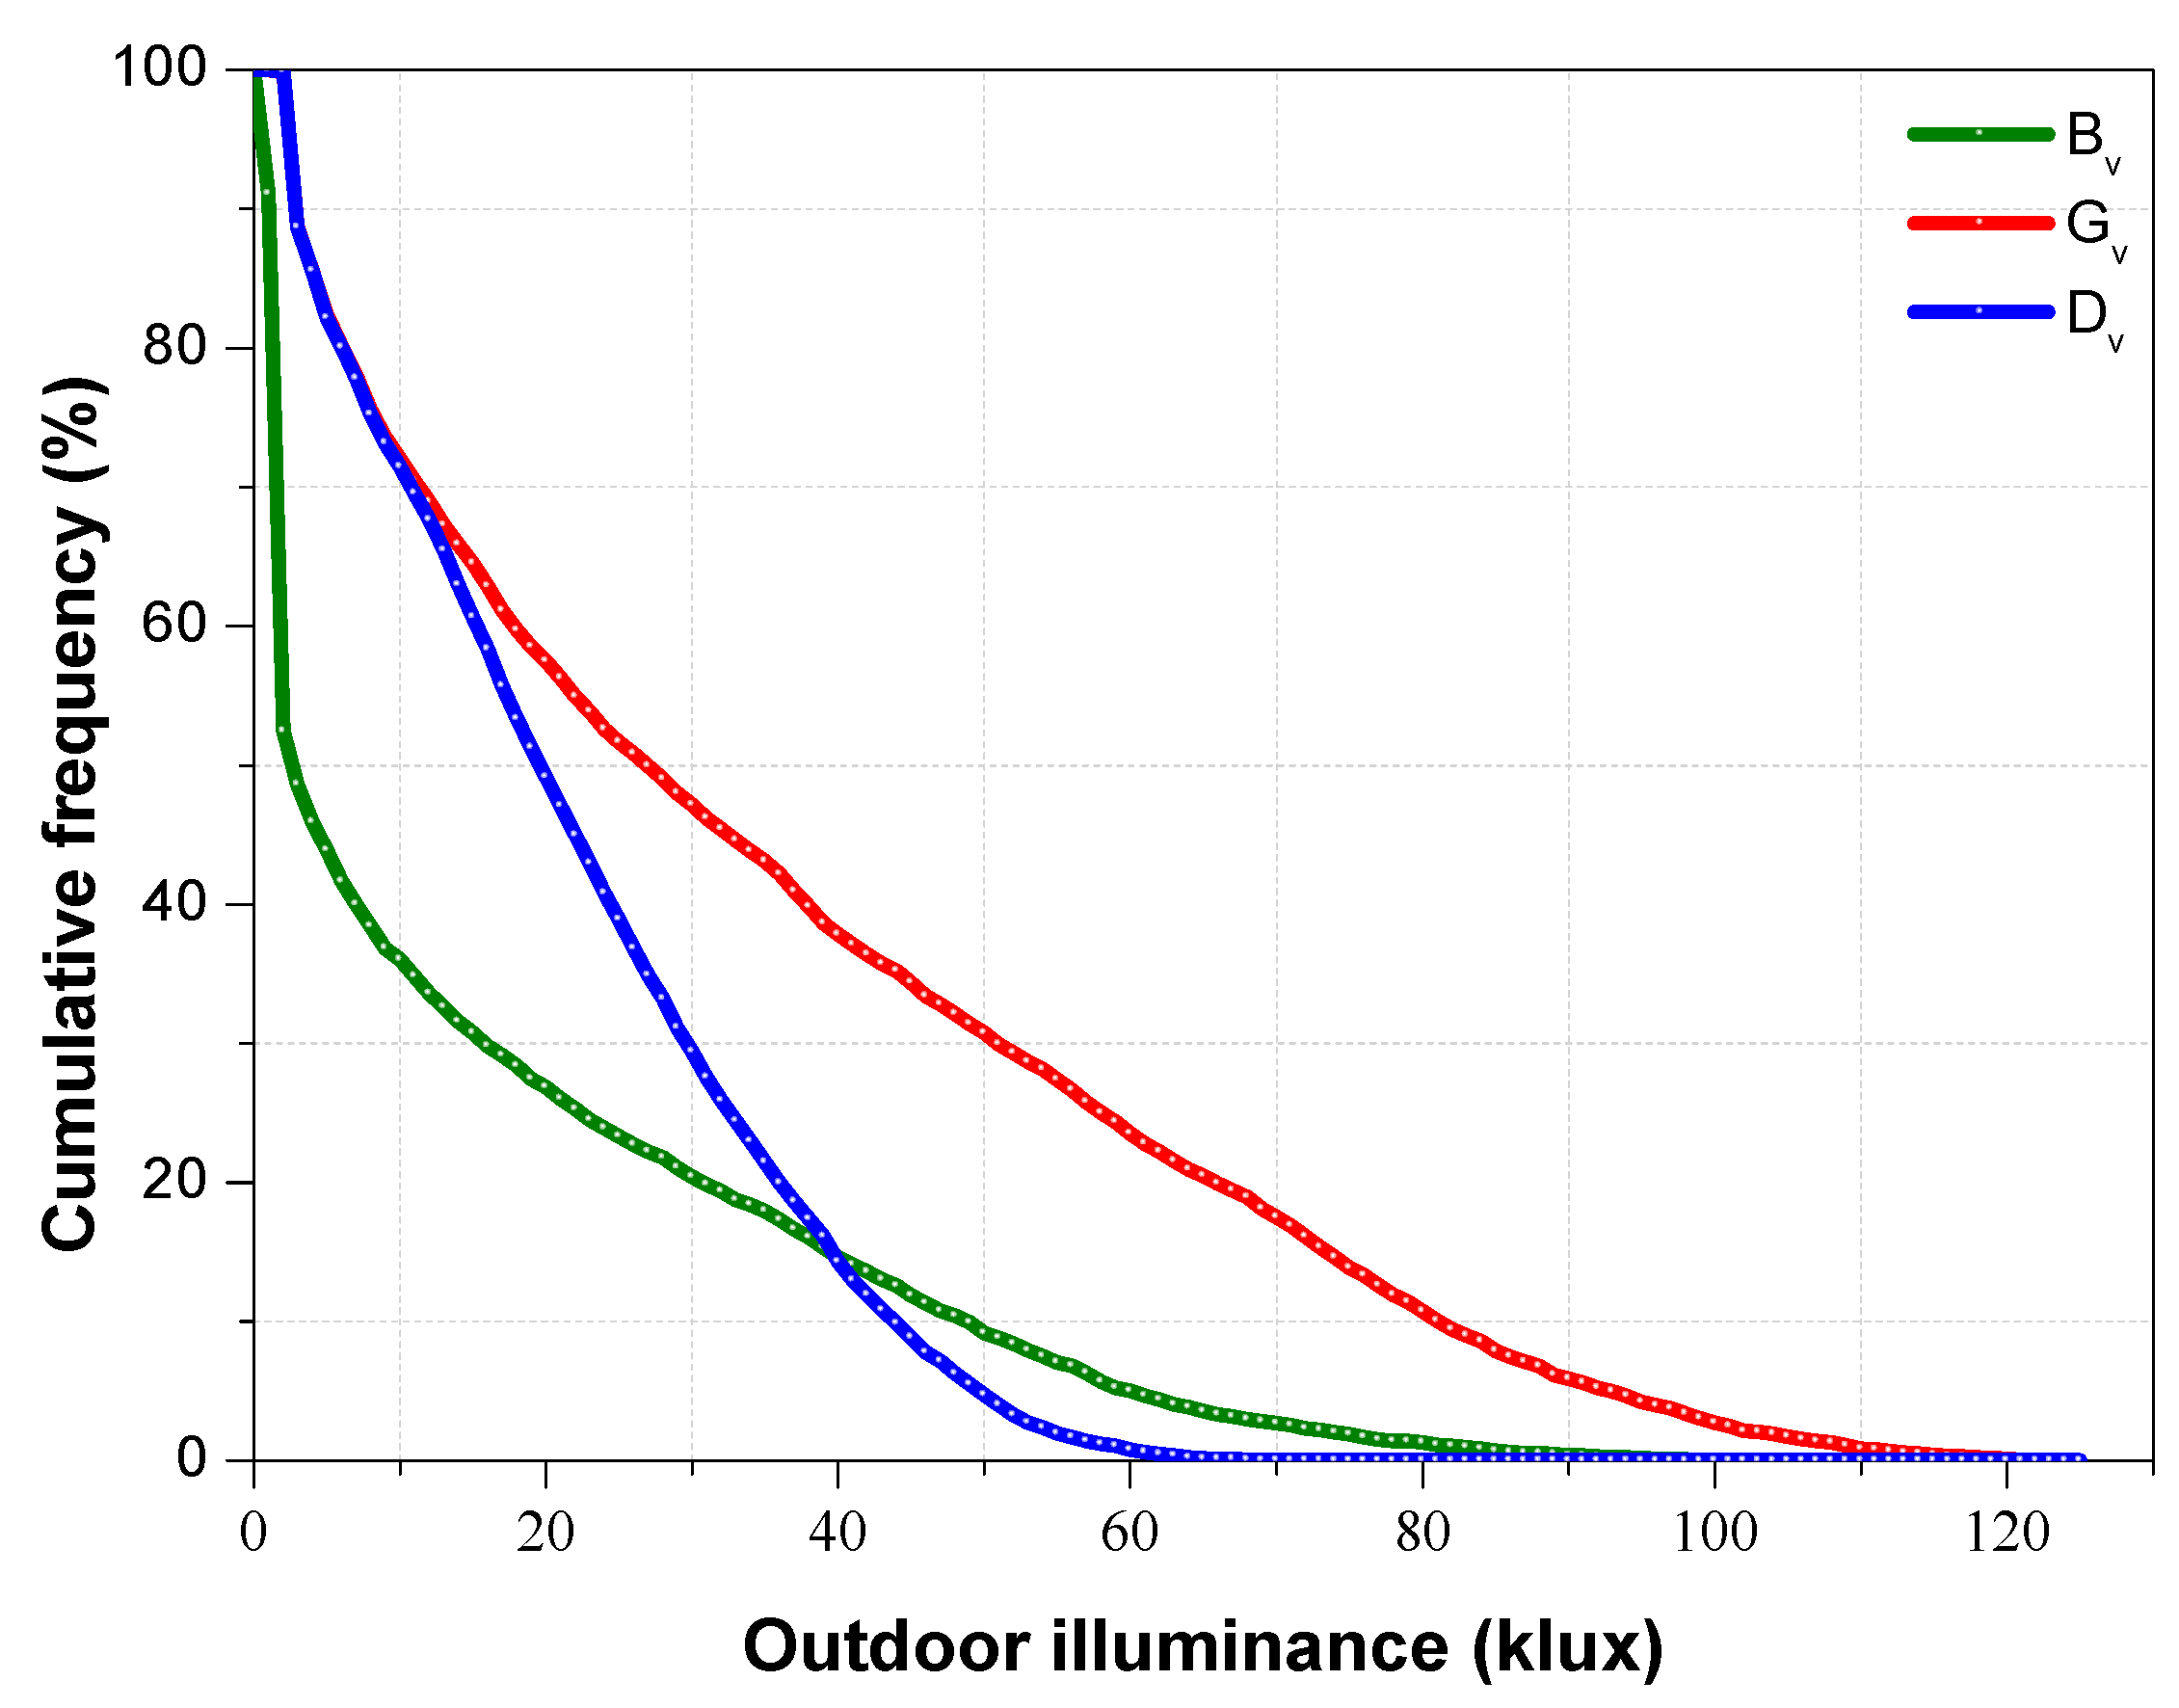
3.1.2. Horizontal Outdoor Daylight Illuminance

The FOC for the hourly horizontal global (Gv), direct (Bv) and diffuse illuminance (Dv) at an interval of 1 klux is shown in Figure 6. The Gv ranged from about 0.1 klux to 120 klux, with a peak of about 11.1%. The Dv trend was similar to that of the Gv and its spread terminated at about 72 klux. In addition to the peak Gv and Dv values, which lay at about 11.1%, all other peaks were below 4%. The Bv՚s trend was different from those of the Gv and Dv. Its spread ranged from 0.1 klux to about 107 klux, and its peak value lay around 38.6%. Generally, the Gv, Bv, and Dv all had a single peak value of about 1 klux. This single peak was mainly attributed to the appearance of daylight illuminance around sunrise and sunset.
The CF provides information on the solar energy availability at different thresholds. Figure 7 presents the CF for the hourly Gv, Bv, and Dv. The findings show that the Gv was about 25 klux for about 50% of the time. This implies that for about 50% of the time, daylight alone can provide a room with a 2% daylight factor and an indoor-design illuminance of 500 klux or more, irrespective of the sky conditions. Compared to the Gv and Dv, the CF of the Bv was much lower, with its spread terminating at about 100 klux. However, Bv is often excluded from day-lighting designs due to glare and thermal discomfort. Due to its higher luminous efficacy, Dv is regarded as more energy-efficient than Bv [15]. As a result, Dv is frequently employed in day-lighting applications. The maximum Dv was about 70 klux, which was about 60% of the maximum global illuminance.

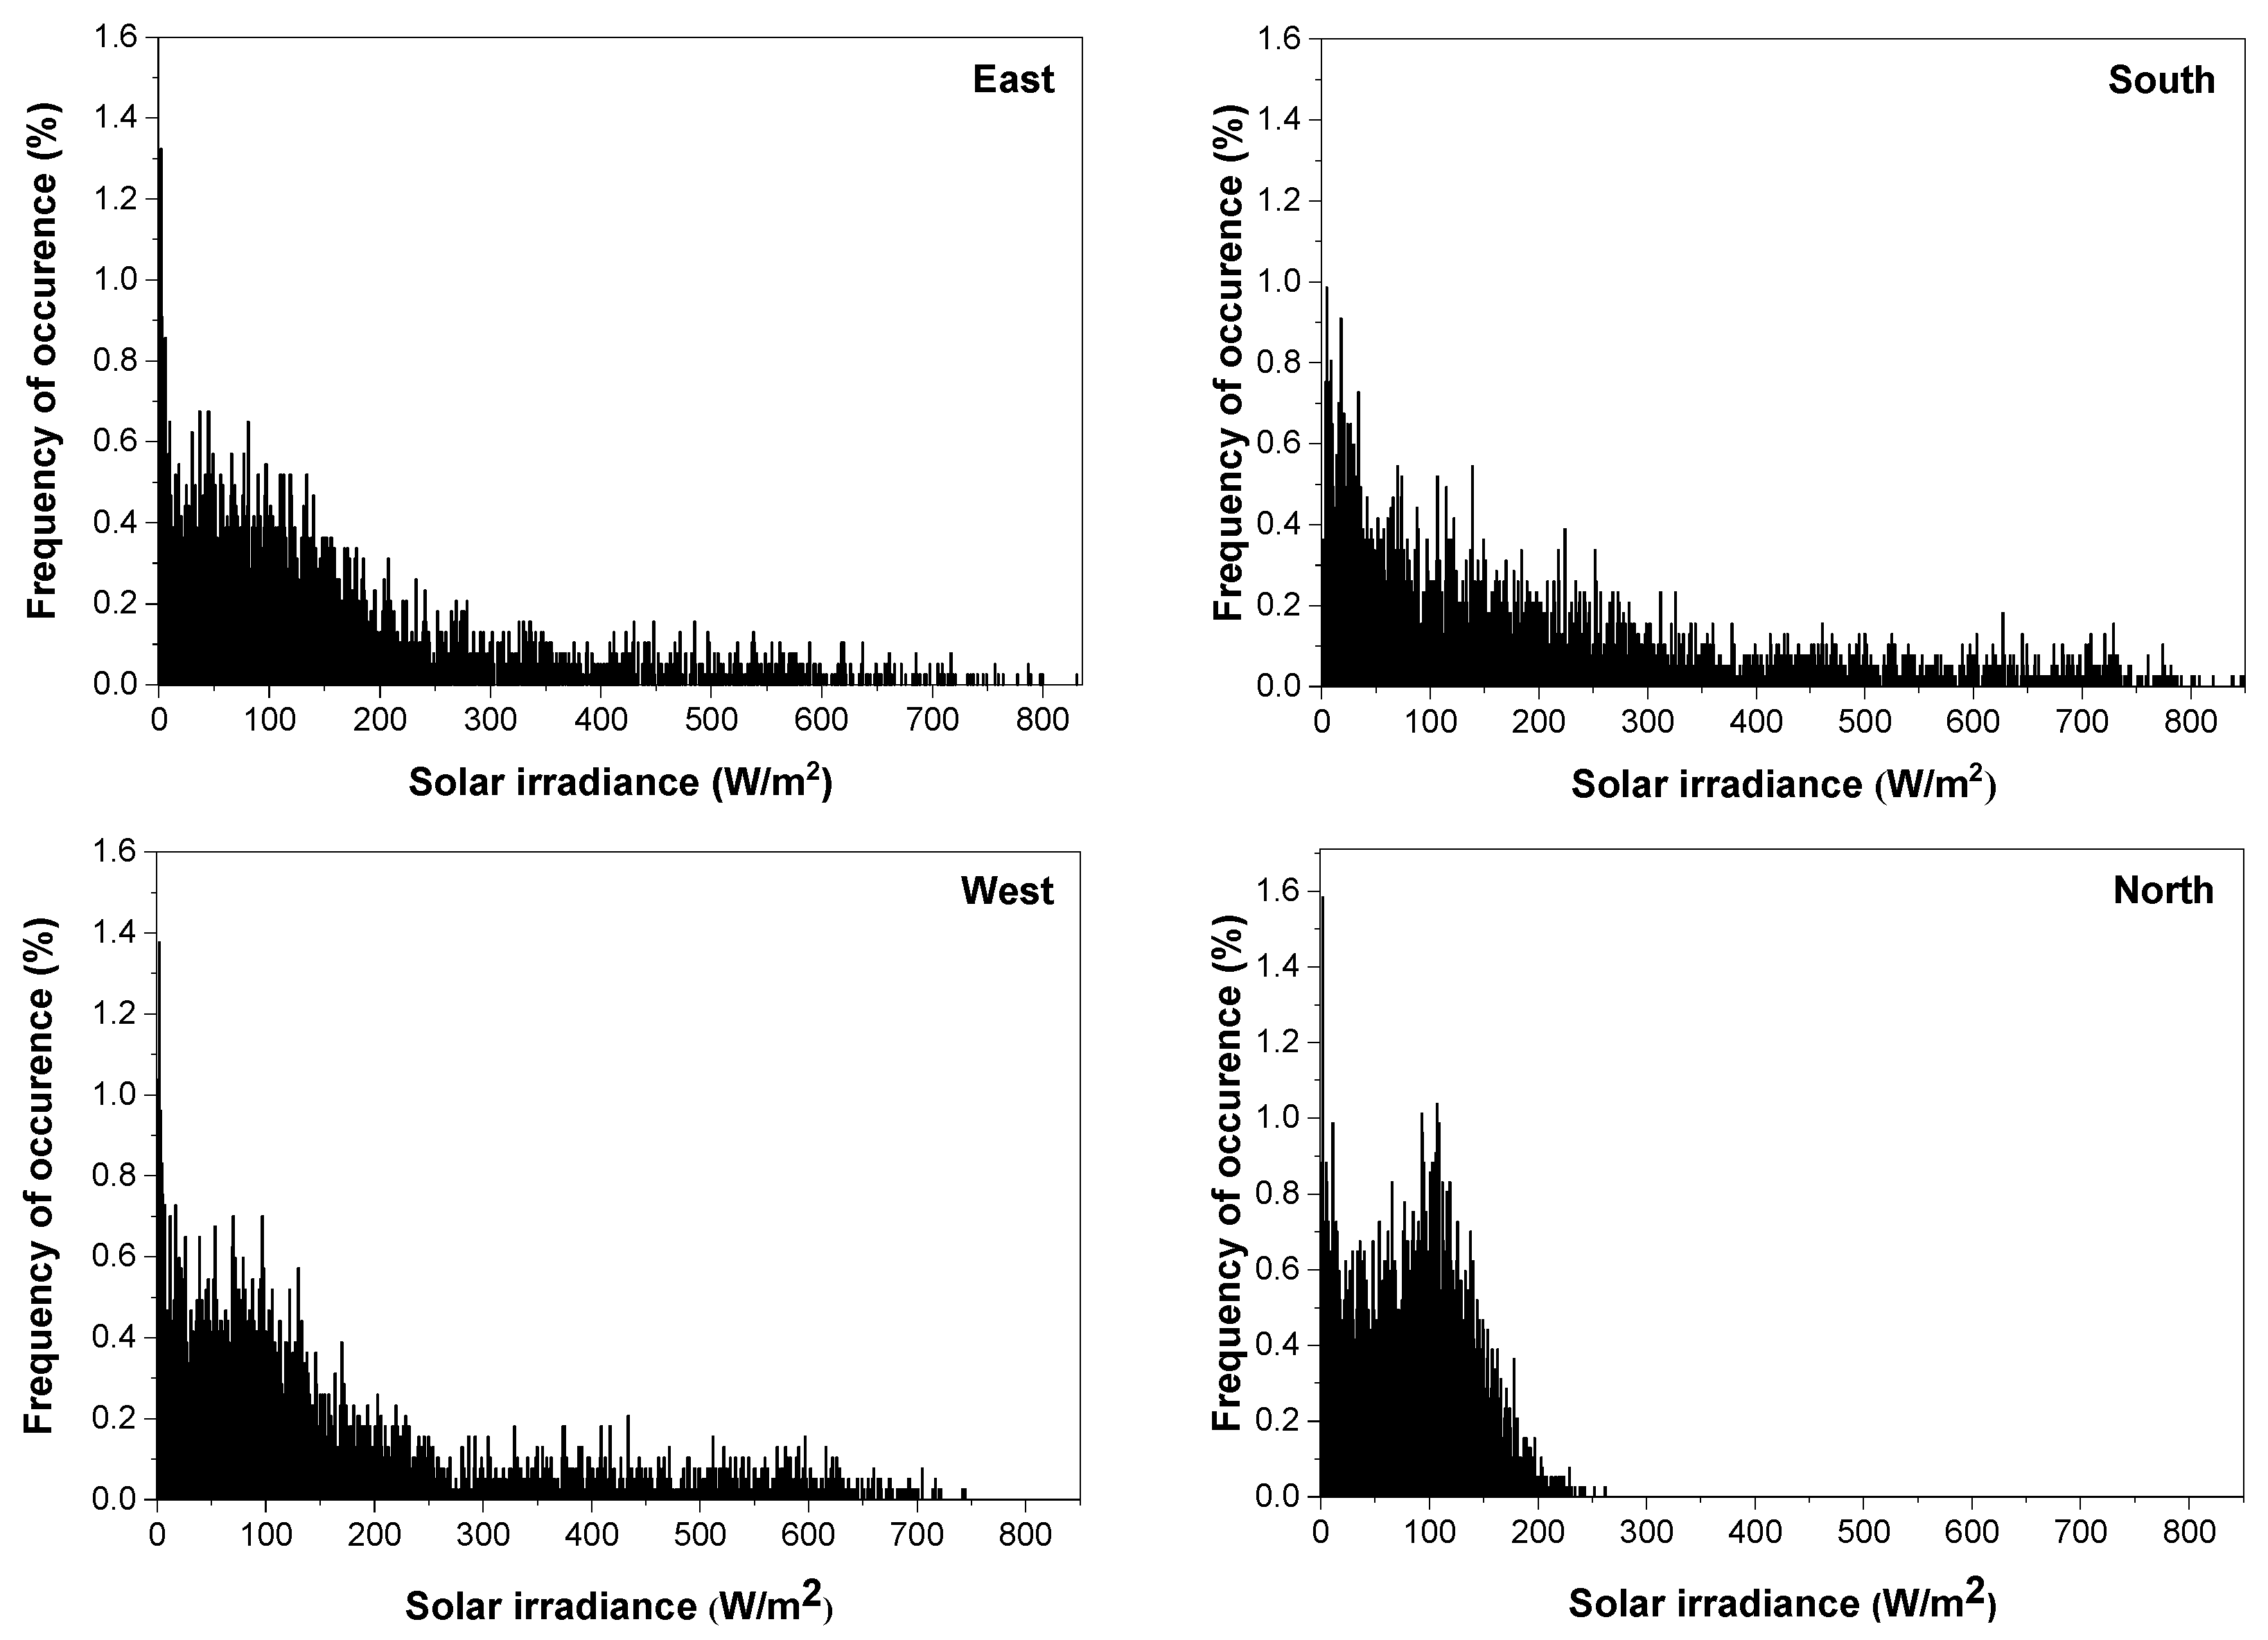
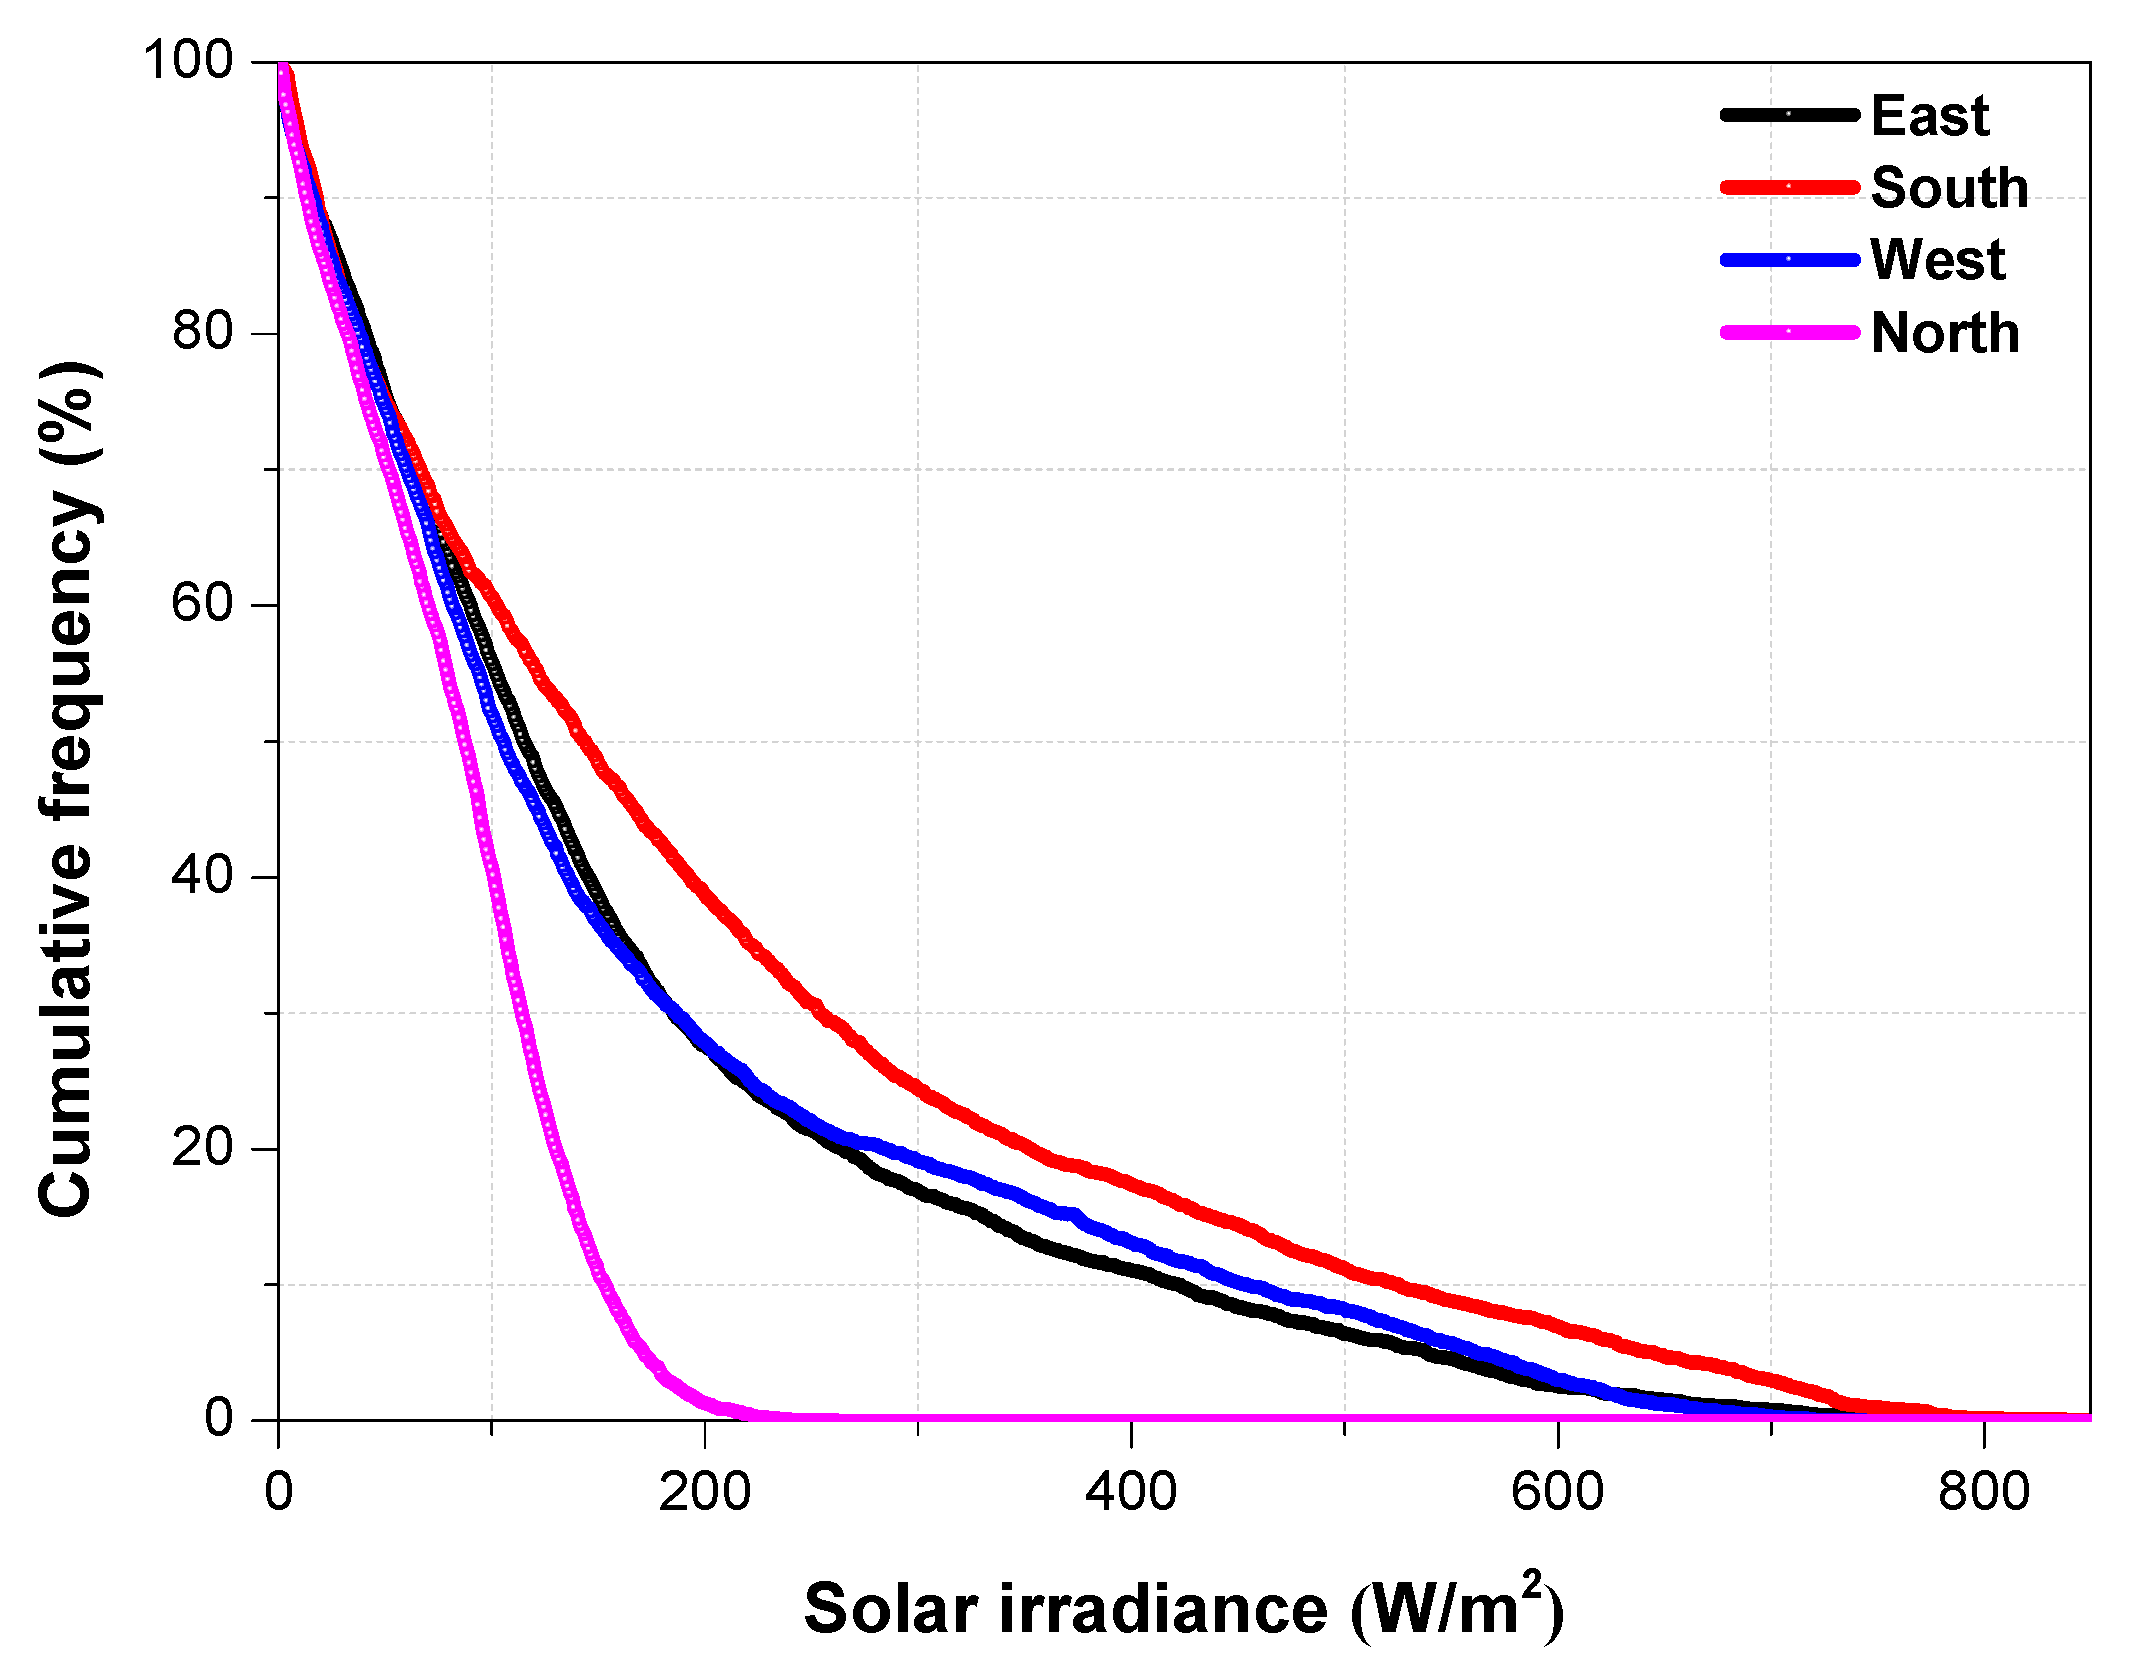
3.1.3. Vertical Solar-Radiation Data

Figure 8 and Figure 9 present the FOC and CF of the global solar radiation (GVT) on the four principal vertical surfaces (i.e., N, E, S and W). Similarly, Table 3 provides descriptive statistics of GVT. Figure 8 and Table 3 show that the maximum solar radiation of 847.3 Wh/m2 was found on the south surface. The north surface has its maximum value at 261 Wh/m2, which is less than half the maximum solar radiation on other surfaces. The mean values also ranged from 205.9 to 84.3 Wh/m2 for the south and north surfaces. A key finding from the CF in Figure 9 is that about 90 Wh/m2 or more is experienced for more than 50% of the year. This value was attributed to Hong Kong’s high solar altitude during the mid-season and summer.

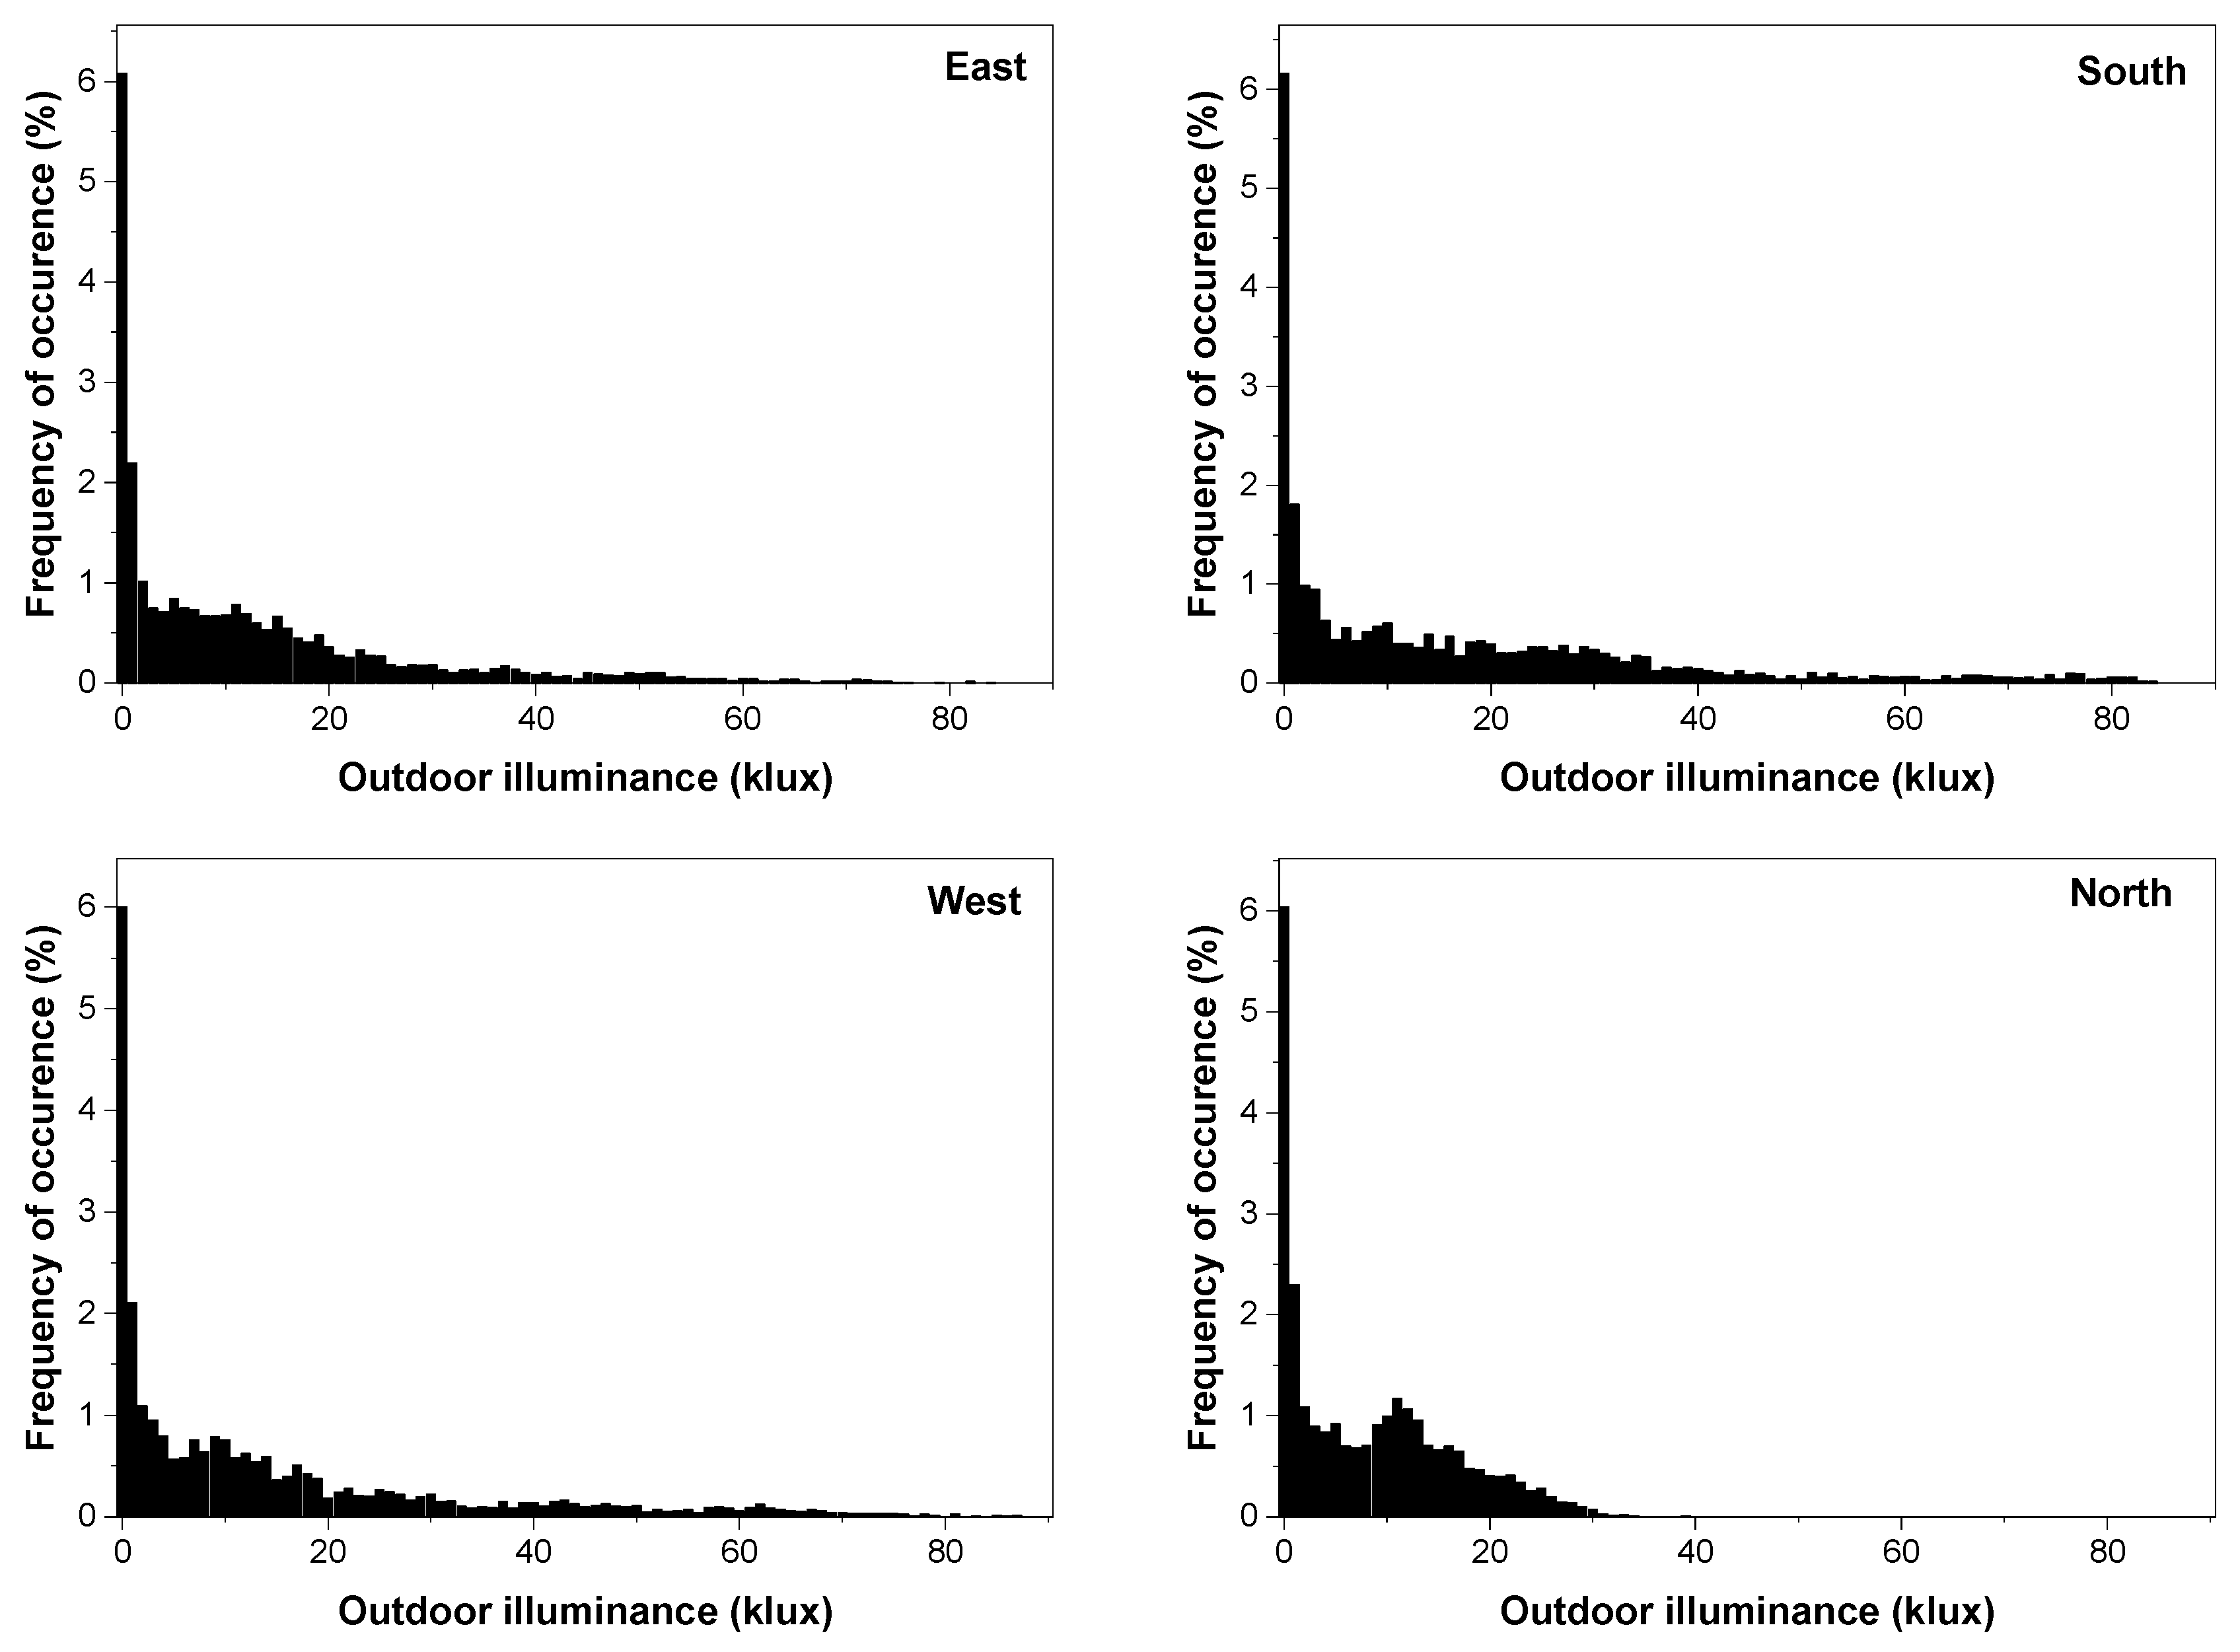
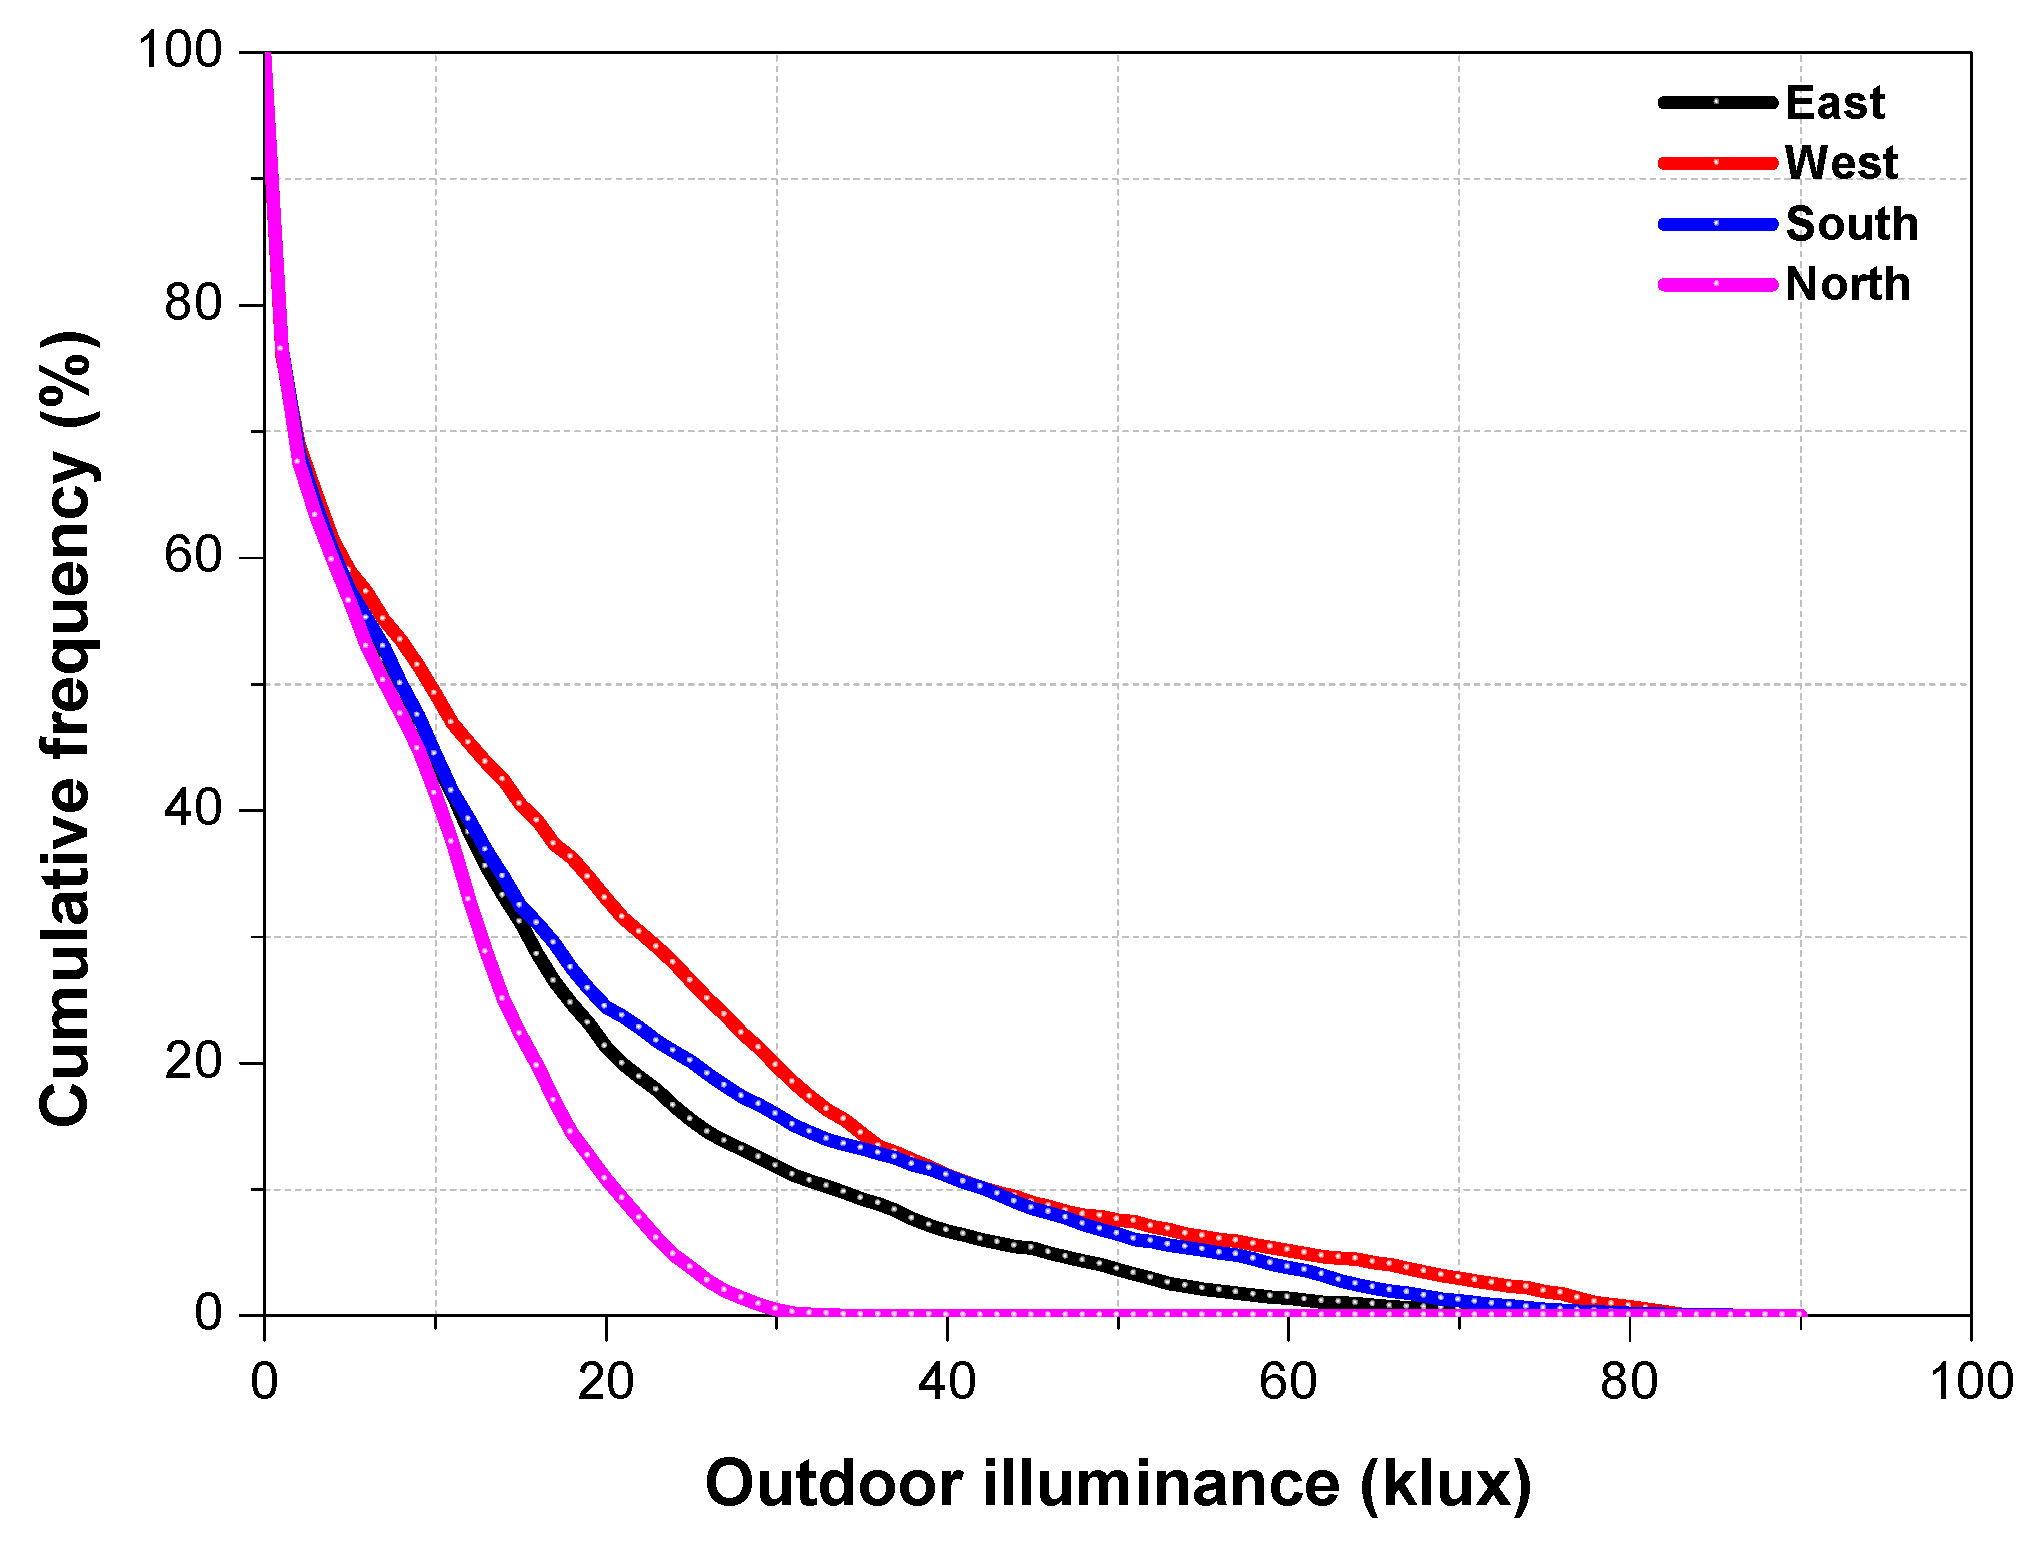
3.1.4. Vertical Outdoor-Illuminance Data

Figure 10 describes the FOC of the hourly vertical global illuminance (GVL). The north surface has its maximum illuminance value at 38.7 klux, while the east, west, and south have maximum values of 83.5 klux, 86.3 klux, and 83.4 klux, respectively. Thus, the maximum illuminance on the north surface is less than twice that of any other surface. For all four vertical surfaces, a large portion of the data were below 30 klux, indicating that diffuse illuminance is the main component in Hong Kong. The CF of the hourly GVL on the four vertical surfaces is presented in Figure 11. It was observed that when the illuminance was less than 4 klux, there were no differences in CF among the four surfaces. This situation indicates the presence of overcast sky conditions. However, orientation effects are more evident at higher illuminance, which is frequently infiltrated by direct sunlight. Furthermore, the north surface illuminance value varies because it is mainly diffuse.

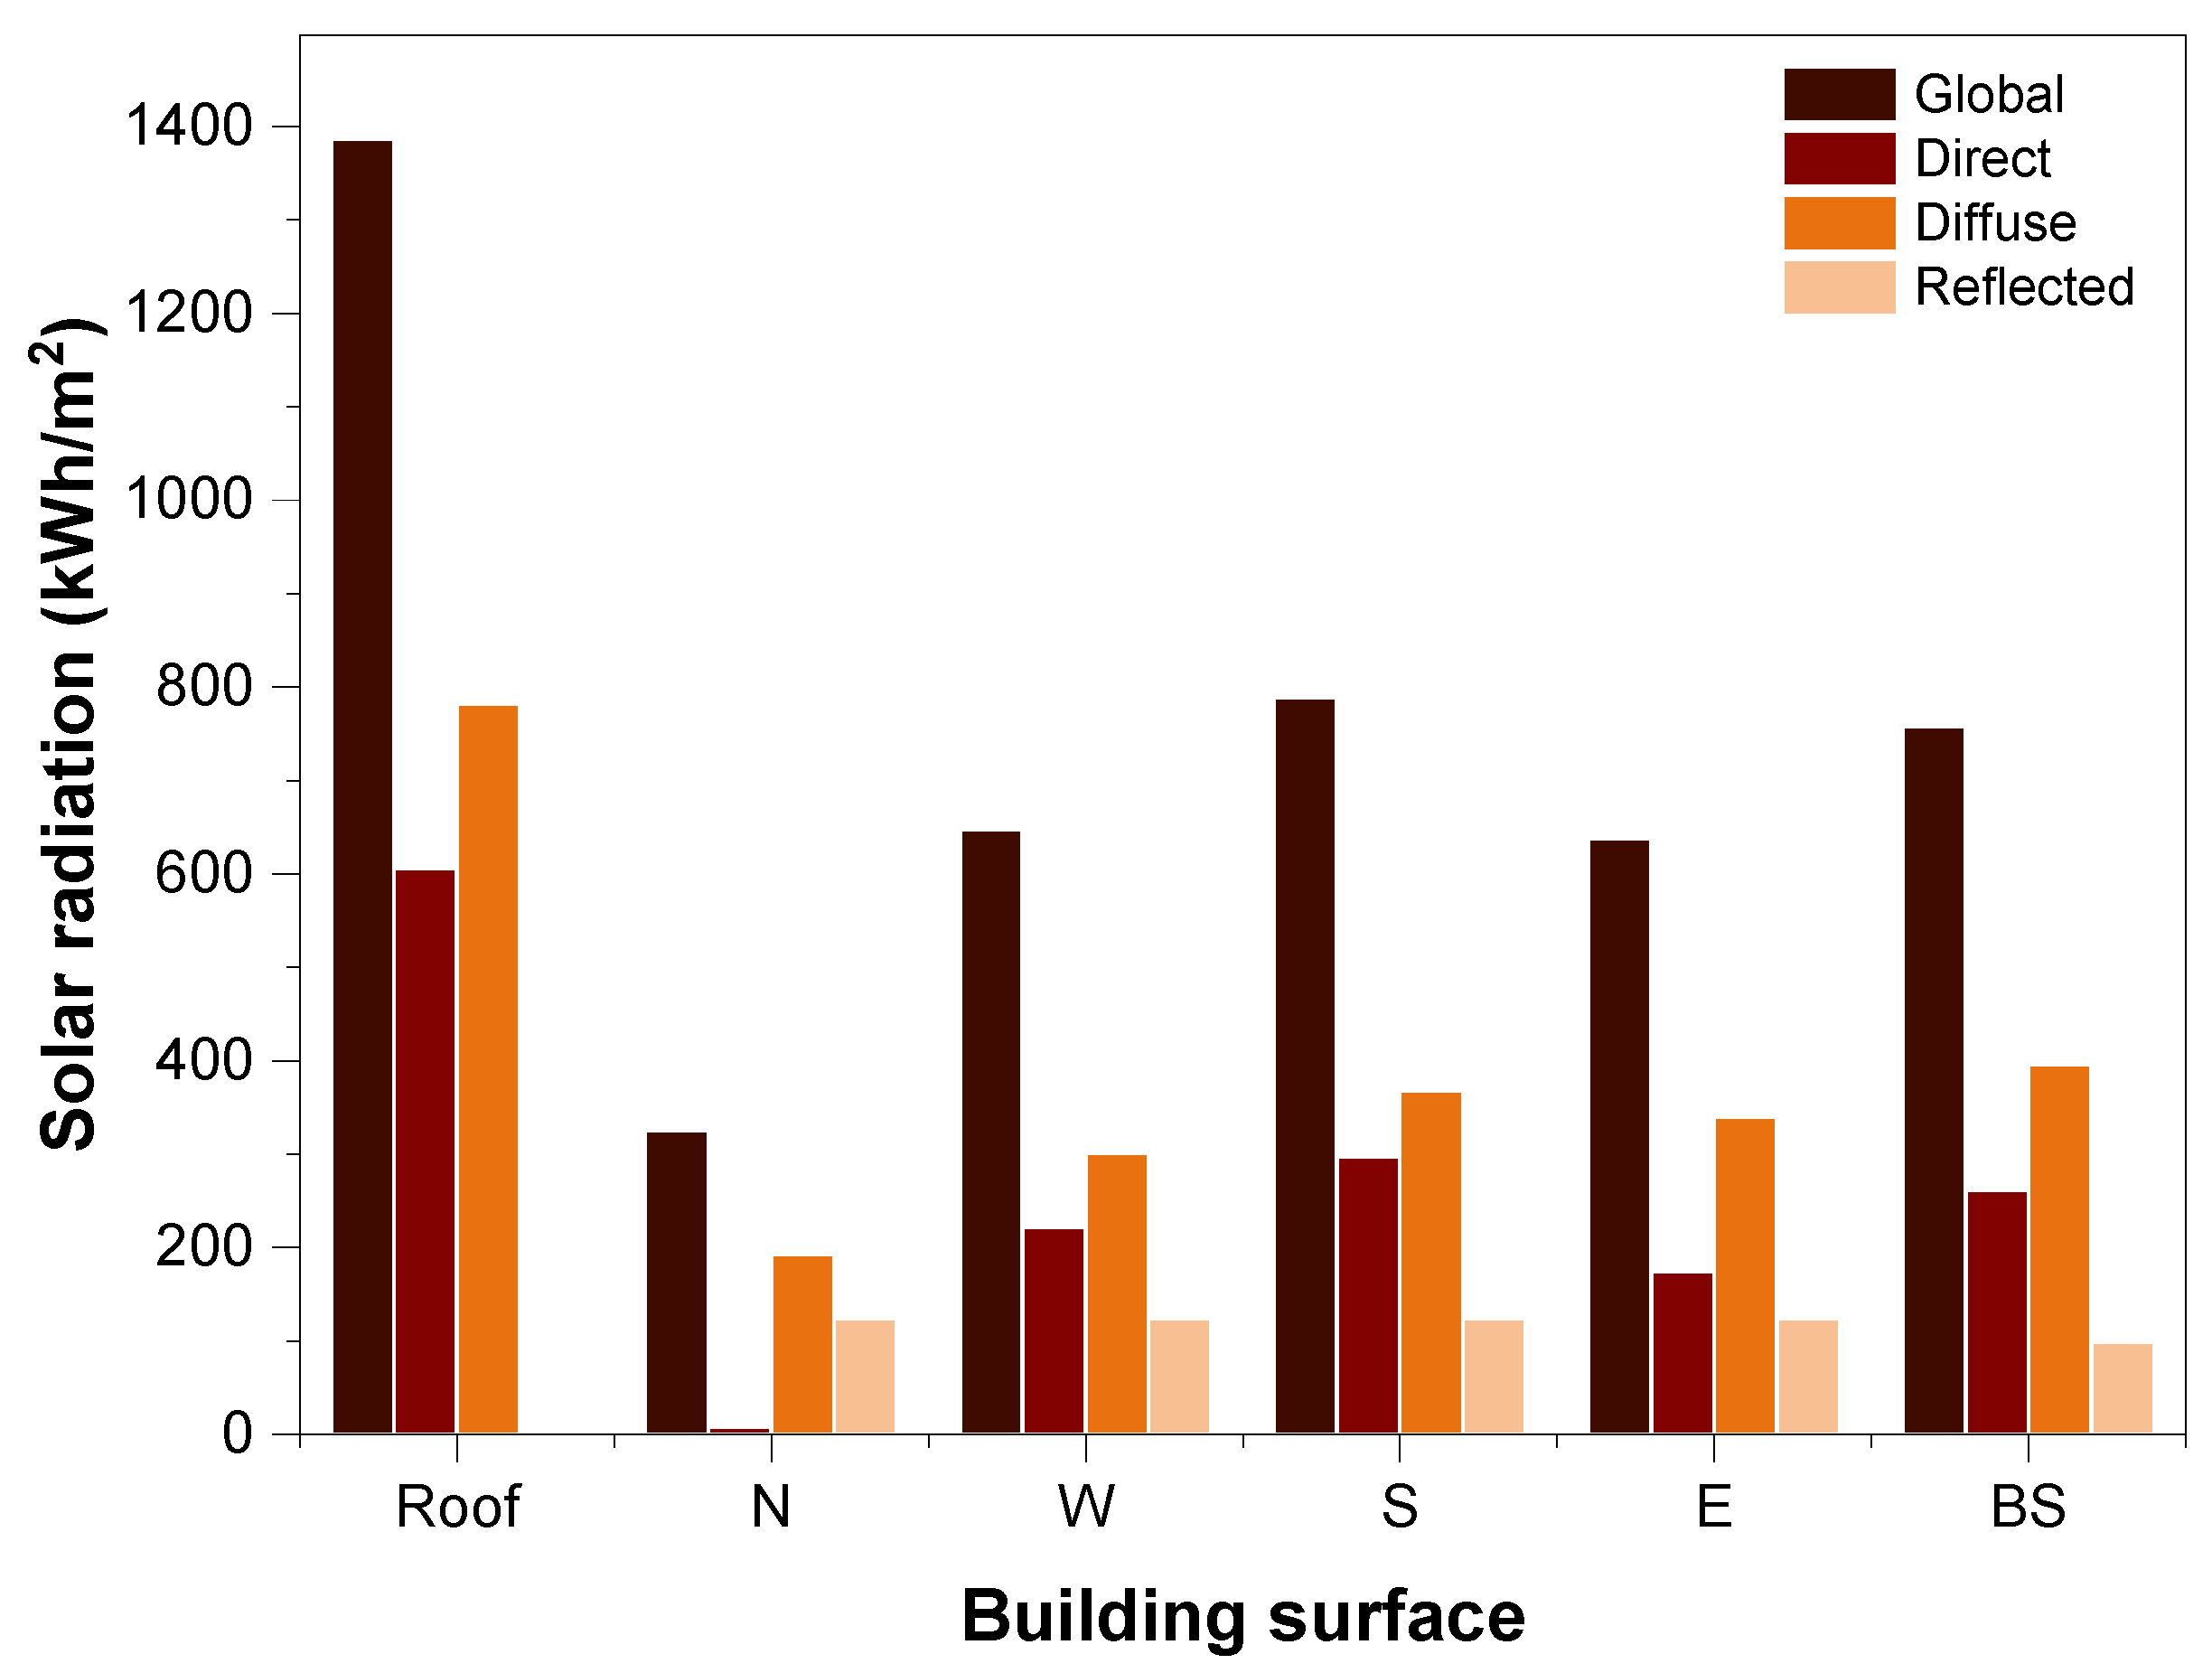
3.2. Results of Analysis of Solar Radiation on Building Skins

The GVT comprises the direct, diffuse and reflected components. As in Figure 12, the maximum annual global, direct and diffuse solar radiation was found on the roof; values of 1386.9, 605.5 and 781.5 kWh/m2 per annum (pa), respectively, were obtained. These results fall within the range of the annual radiation values obtained by Gholami and Rostvik [10] in the analysis of annual solar radiation in Europe. When each vertical surface and BS were compared, the south and north orientations received the most and least incident radiation, respectively. Thus, while the south surface is suitable for achieving maximum annual energy output from BIPV, the north surface is not. However, unlike the south, west, and east surfaces, the north surface requires less protection from solar-heat gain all year round. Furthermore, the annual incident DVT is higher on the BS than on the four principal surfaces. These higher values were attributed to the contribution of the incident radiation on the roof, which has a larger surface area than other surfaces. In particular, the annual hourly GVT was 757.4 kWh/m2 pa, which was 31.7 kWh/m2 less than the south façade and higher than the west and east façades. The findings from the BS analysis also suggest that using BIPV for the entire BS is more appropriate for low-rise buildings. This is because these low-rise buildings have larger roof areas than vertical surfaces. Nevertheless, it might not be appropriate for taller high-rise buildings due to the smaller roof area. Studies show that in addition to the south façade, other façades, especially those of the west and east, can also be used for BIPV placement. Using BIPV for such façades has been shown to have theoretical and economic potential [11]. Since the current findings show that the annual incident GVT is higher for the whole BS than other unconventional façades, there is potential for using BIPV for BS in Hong Kong.

3.3. Results from Analysis of the Contribution of the Solar Components to GVT

The data were further probed to determine each solar radiation component’s contribution to GVT. As shown in Table 4, the DVT contributes more to solar radiation for all surfaces. Thus, harnessing the DVT is a useful energy-saving measure, especially since DVT forms the main radiation entering room interiors. Moreover, most solar systems require DVT. It was also observed that only a small portion of the direct component is incident on the north façade. Similar findings from the north façade and reflected components have been reported in similar studies [10].

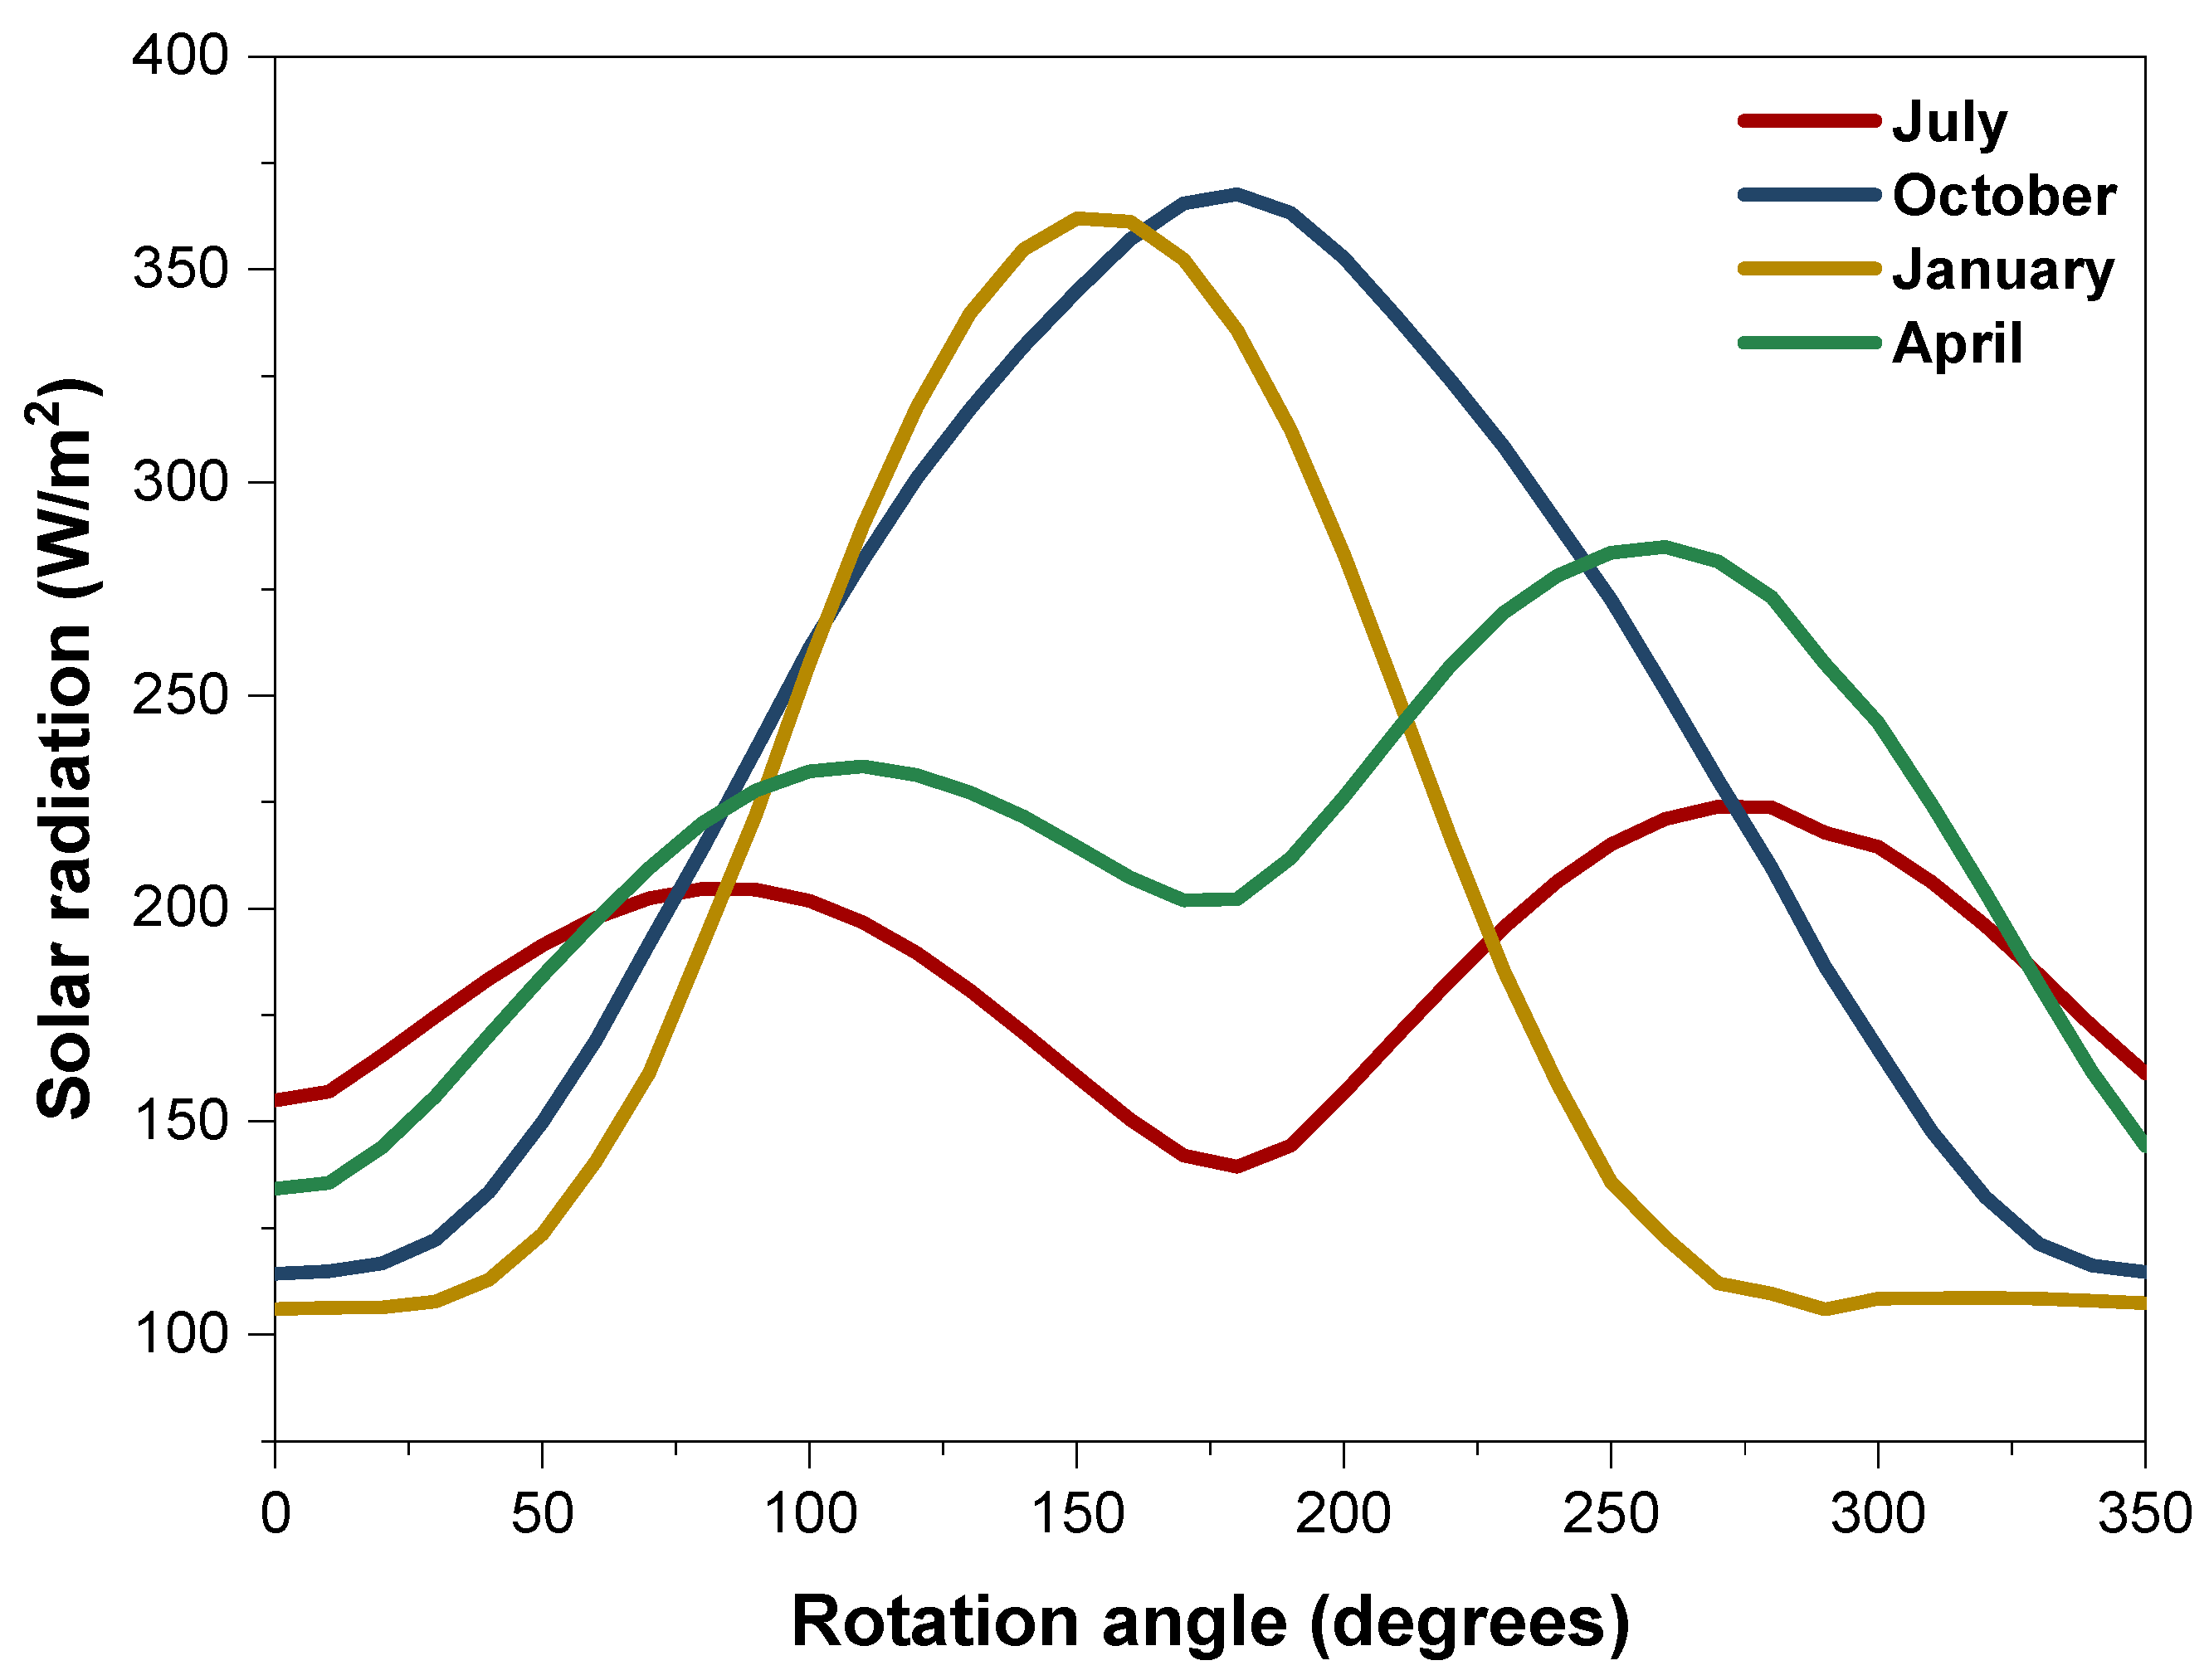
3.4. Results for the Relationship between Solar Radiation and Building Orientation

Figure 13 presents the monthly average incident GVT for the seasonal representative months as a building is rotated clockwise from 0 to 350 degrees. It was observed that the summer and spring months (i.e., July and April) had similar sinusoid-shaped solar radiation patterns. Two peak values, at 80° and 270° for July and 110° and 260° for April, were also noticed. The lowest solar radiation was found along the north surface (i.e., 0°) for April and the south (i.e., 180°) for July. Similarly, the autumn and winter months (i.e., October and January) were investigated and showed a similar Gaussian-shaped solar radiation pattern. The highest solar radiation was found at 180° for October and 150° for January. Furthermore, the lowest solar radiation was found at 0° for October and 290° for January. It was deduced that for individual months and seasons, the maximum average solar radiation might not be derived on the south surface, which typically has the highest amount of solar radiation. Similarly, other unconventional surfaces, in addition to the four principal surfaces, can provide high solar radiation for BIPV. These findings also have passive design implications. For example, there is more solar heat gain (Q) when a building is oriented towards the south in the autumn and winter seasons. However, Q may be relevant for increasing the indoor temperature during cool seasons. This increase in temperature improves the thermal conditions of rooms and might reduce the cost of warming up spaces. Similarly, the north orientations have low Q in cool seasons. Nevertheless, the possibility of space heating is eliminated, increasing the energy spent on heating. For the summer months, the south orientation provides less Q, which is preferable for indoor cooling. Moreover, solar shading is required in summer and spring if its orientation is towards the northwest. In practice, in addition to properly orientating the building, passive solar designs involve planning and orientating spaces within the building to harness or eliminate Q.

3.5. Results for Energy Implications of Solar Data on Semi-Transparent BIPV

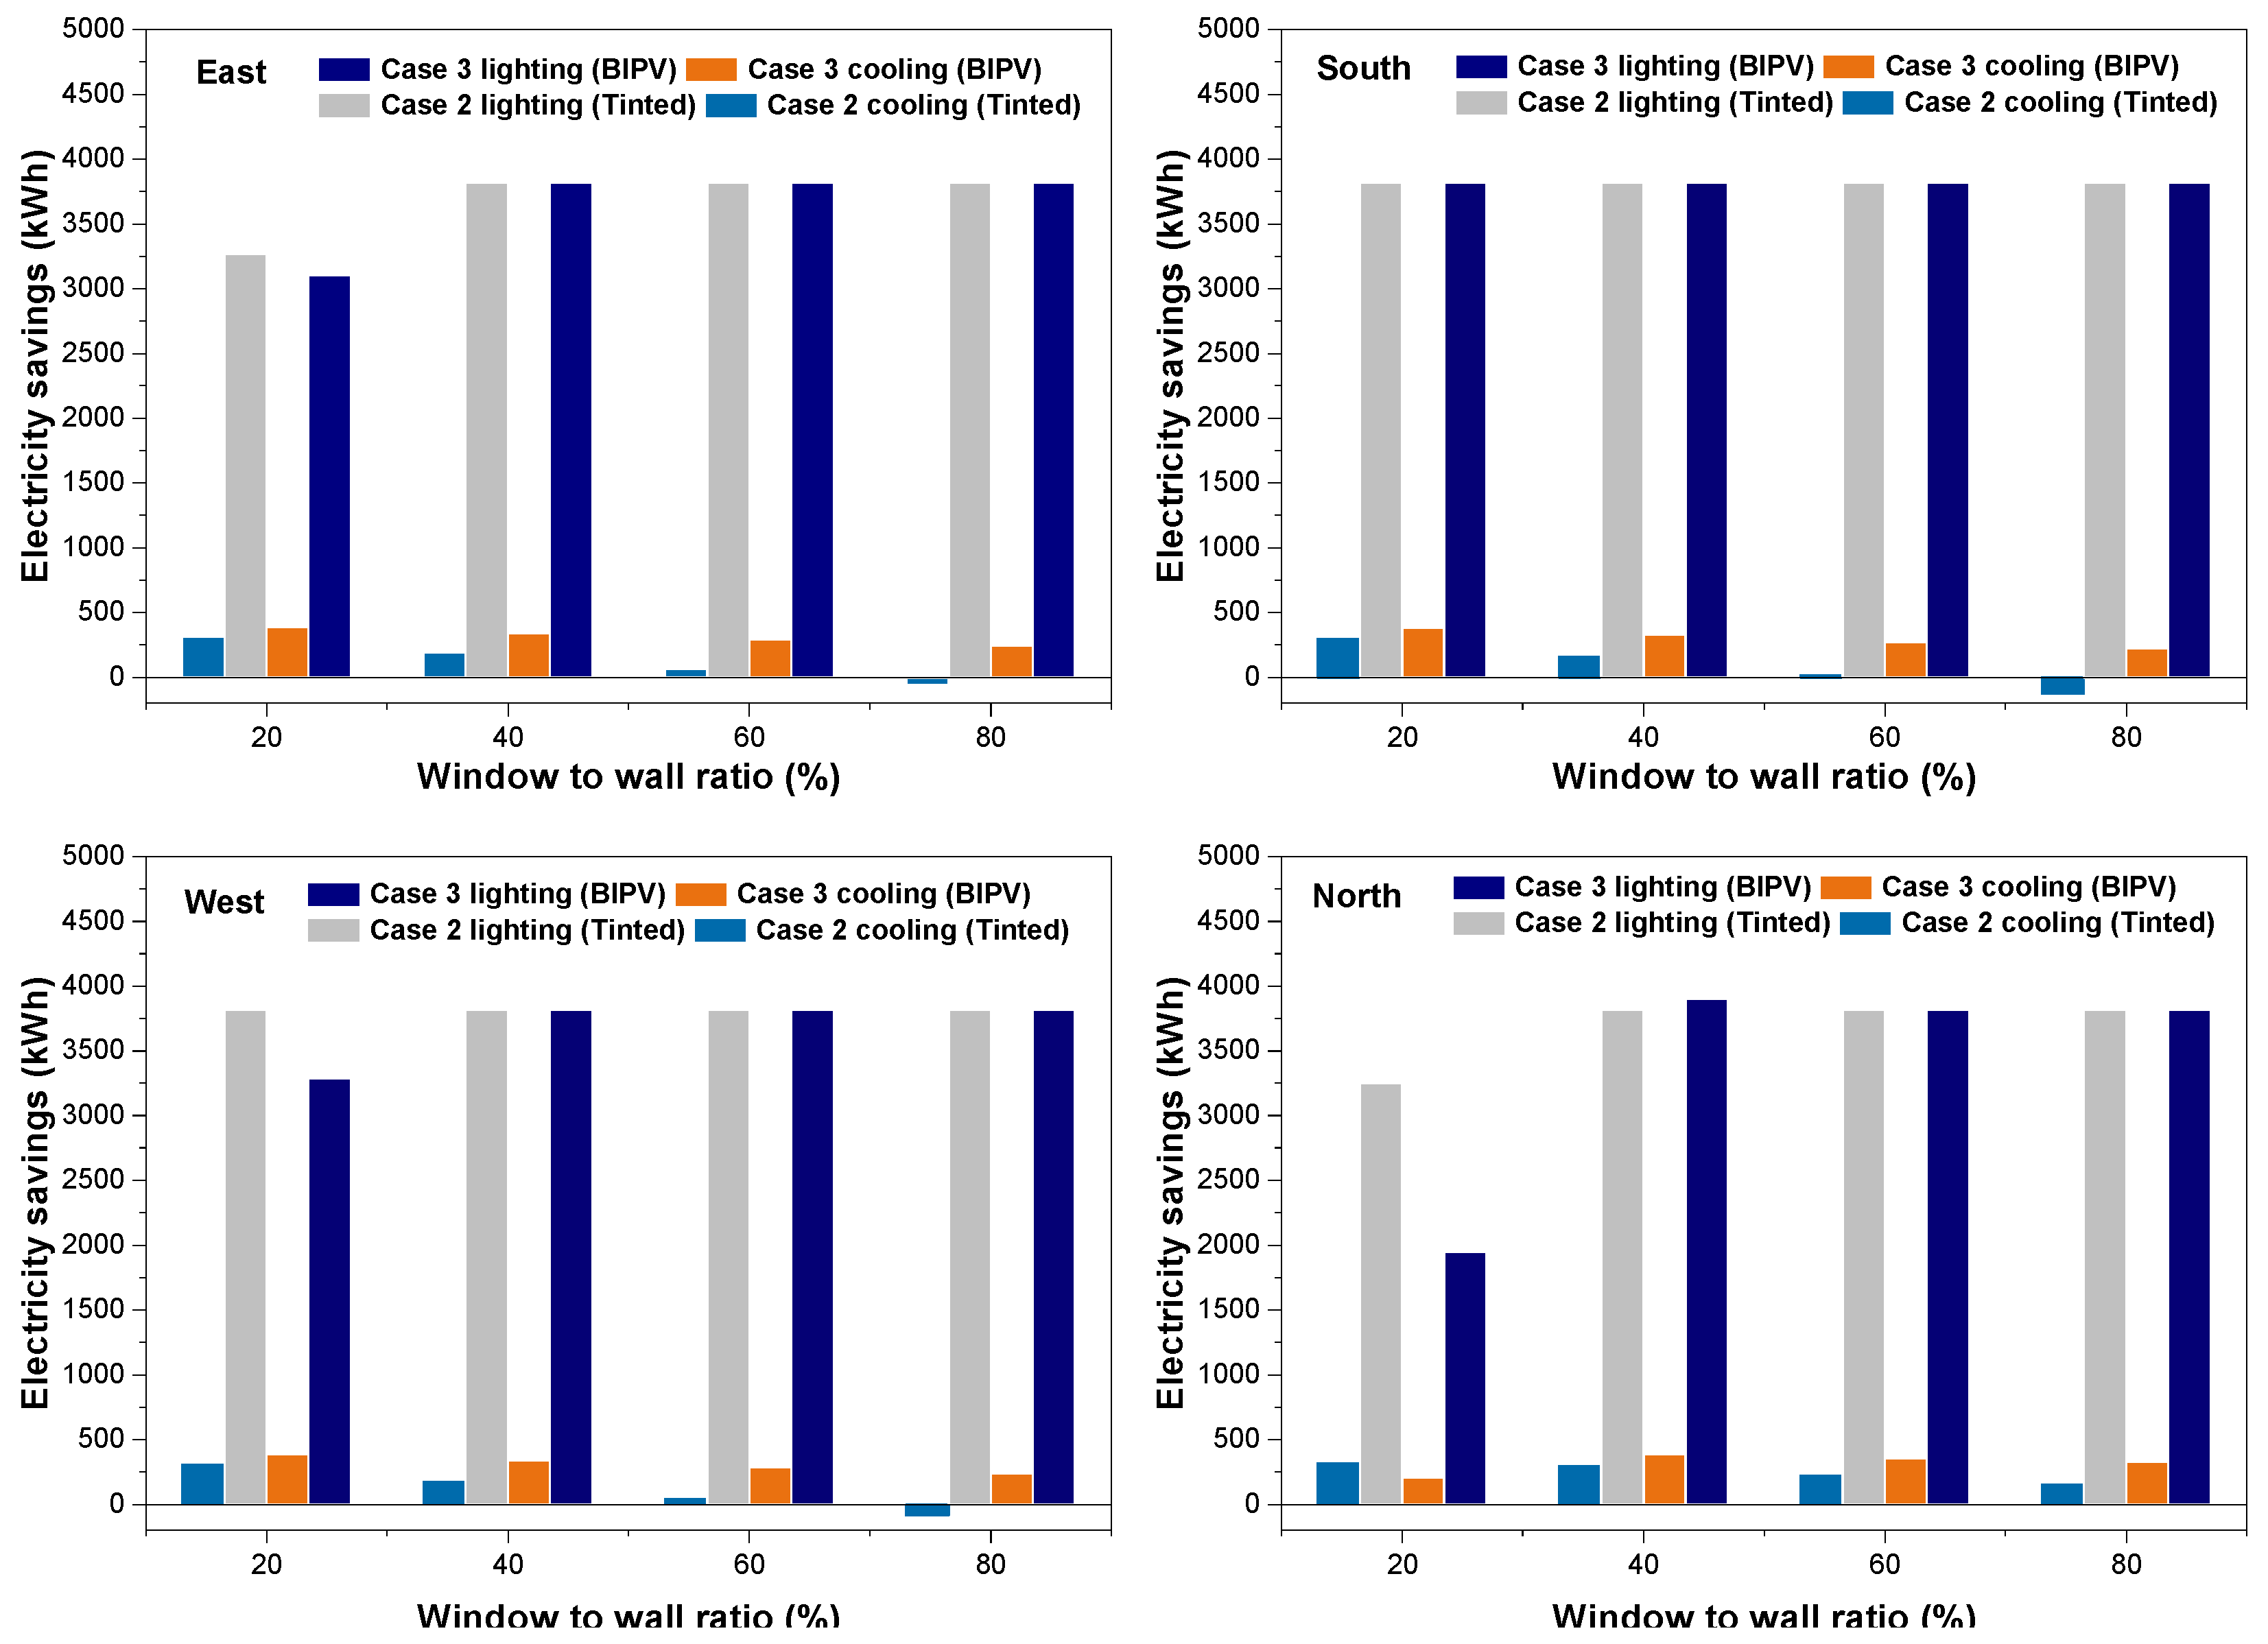
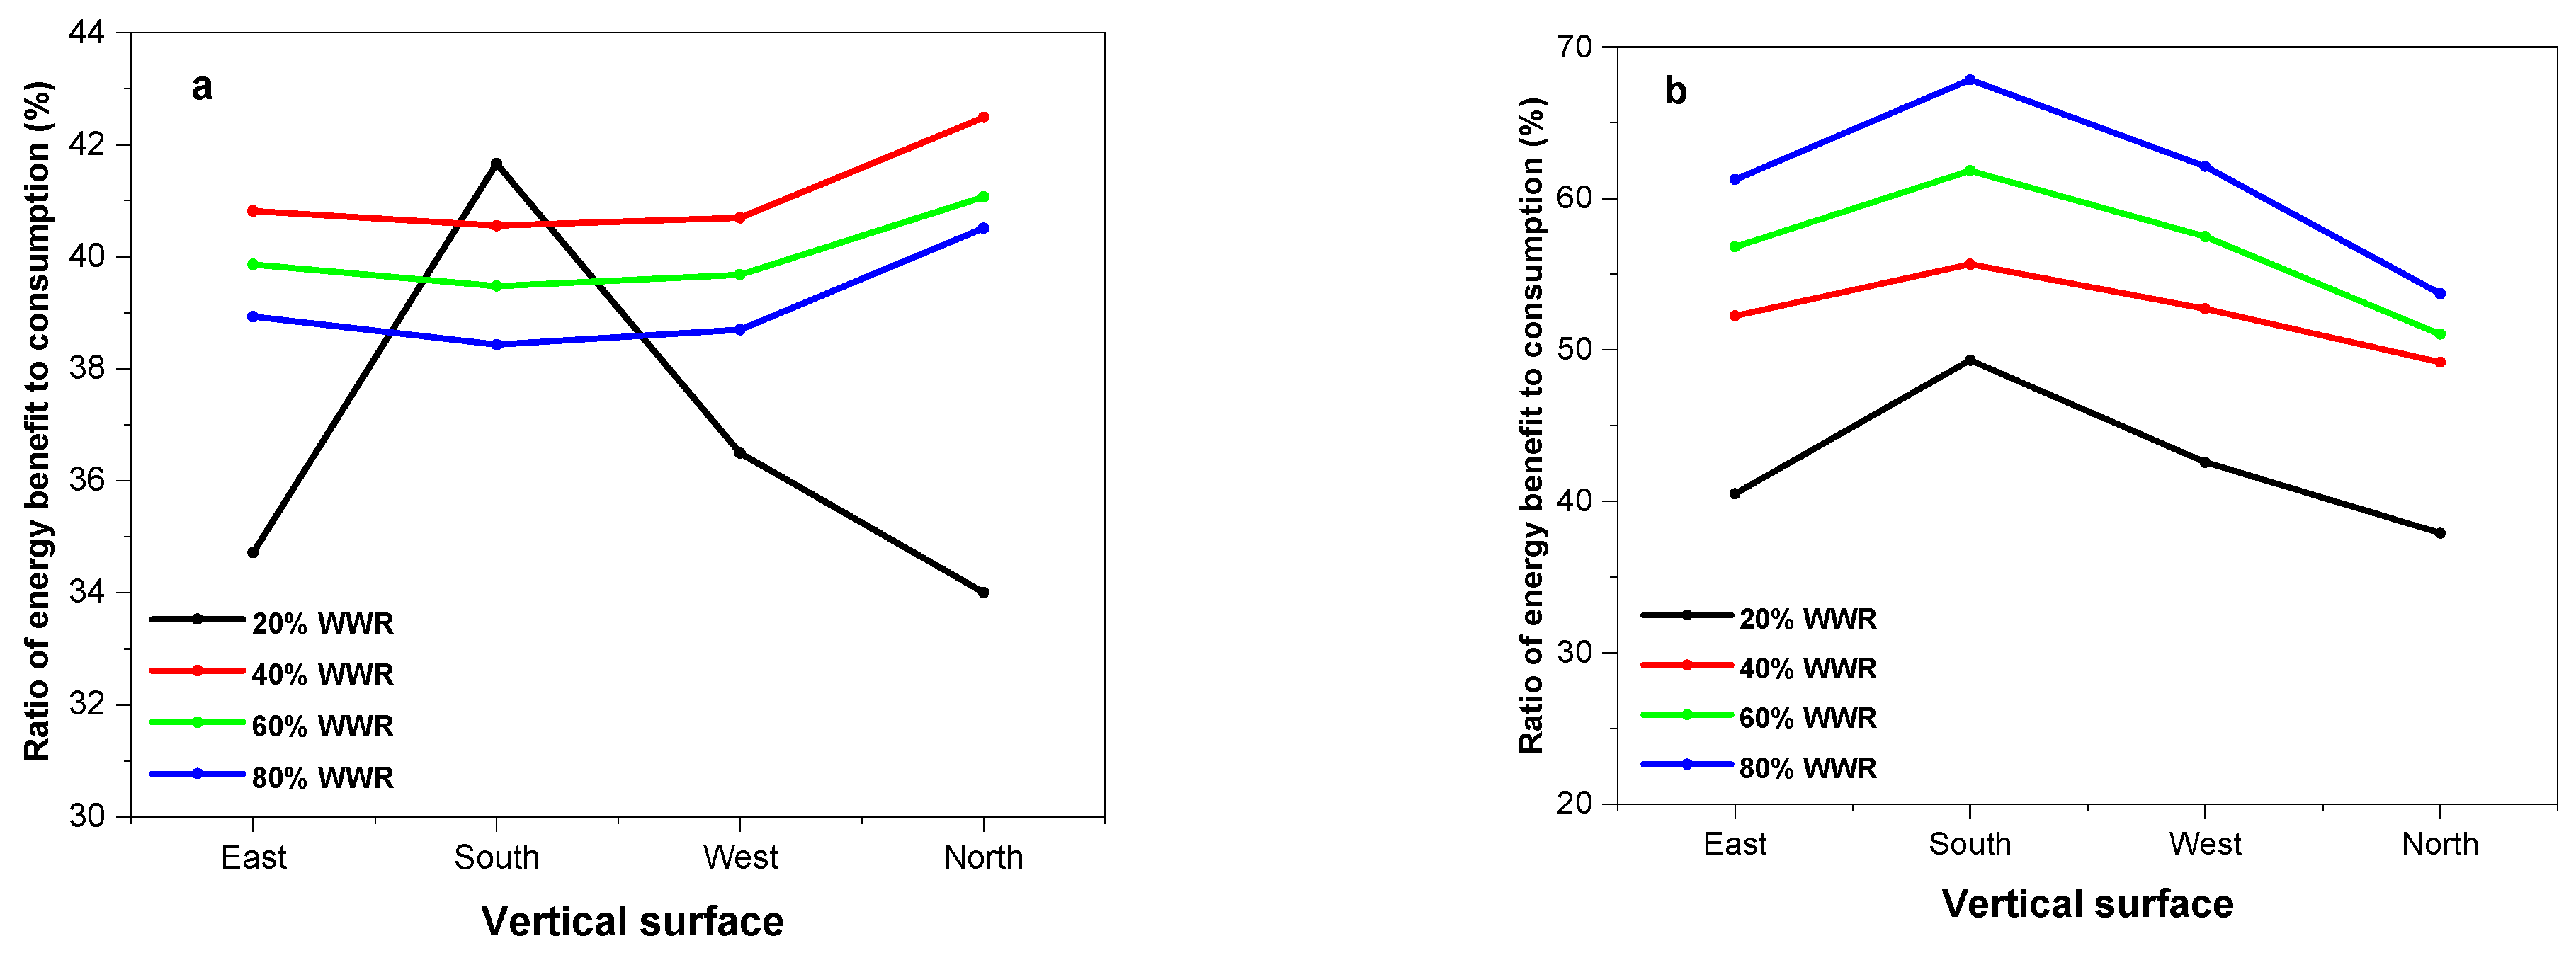
3.5.1. Electricity Benefits for Cooling and Lighting

The Q values during the nine-month cooling season were compared for Cases 2 and 3, as shown in Figure 14. The south façade was used as a representative façade for the other orientations. It was observed that for all the cases of WWR, the tinted glass allowed more Q than the semi-transparent BIPV. The peak Q was observed with the 80% WWR, with values of 2817.9 kWh for tinted glass and 1086.9 kWh for BIPV. These findings might be due to the higher SC of tinted glass. Figure 15 presents the increase in Q (i.e., the difference between the Q values of the tinted and BIPV glass) for the different WWRs during the nine-month cooling season. The findings show that the Q increased in line with increases in the WWR, with the south façade demonstrating the greatest increase in Q (i.e., 1730.9 kWh) and the north presenting the lowest (i.e., 882.7 kWh). A similar increase in Q due to an increase in glazing area has been reported in [45,46].
Figure 16 presents the electricity savings on cooling and lighting for Cases 2 and 3 compared to Case 1. Generally, the electricity due to Q in Case 1 was reduced when daylight-linked control was in operation for both cases. In fact, significant savings on cooling were made in the cases with lower WWR values. For all the cases, the savings were more evident in the north façade than in the other surfaces due to the lower Q. These savings reached about 317 kWh for the 20% WWR. Furthermore, in addition to the 20% WWR north case, introducing semi-transparent BIPV (i.e., Case 3) led to more savings. For example, 20% WWR cases in the south, west and east had an additional 87, 81 and 76 kWh, respectively, when the BIPV was introduced. Lastly, Cases 2 and 3 had lower or no energy savings on cooling when a larger WWR was used. Hence, the west façade of Case 2 had energy savings of 307 kWh with 20% WWR. Similar findings were found for the other façade orientations.
Furthermore, the additional lighting savings from using daylight-linked control are presented in Figure 16. Regarding the north and east cases with 20% WWR3252 and 3266 kWh pa were saved for Case 2, while 1951 and 3104 kWh pa were saved in Case 3. Nonetheless, these values increased with WWR. Furthermore, the tinted glass performed better in the case with 20% WWR in the north, east and west. The savings reduction in the north façade with 20% WWR and the better performance of the tinted glass in these cases was due to the lower Ein compared to the Es. Furthermore, the higher VT and fractional savings in the 20% WWR case contributed to the tinted glass’s better performance. For most orientations and WWRs, up to 3816 kWh pa was saved on lighting in Cases 2 and 3. The analysis also showed that for the 40 to 80% WWR, Case 3 outperformed Case 2. The maximum saving on cooling and lighting was 4285 kWh pa (i.e., north, 40% WWR, Case 3).
In summary, the analysis of the Q and cooling benefits showed that tinted glass has a higher SC than BIPV. This lower SC leads to reduced building-envelope load on the BIPV façade. Moreover, the cooling energy is directly proportional to the glazing area. Hence, the larger the WWR, the higher the expected energy consumption through cooling. This becomes essential when proposing large curtain walls with tinted glass, as usually adopted in most high-rise buildings in Hong Kong. A similar report by Kim et al. [47] also found increases in energy consumption with increases in WWR and reductions in energy consumption when a façade material as a lower SC. Furthermore, the total energy benefits from cooling and lighting showed that increasing the WWR does not necessarily lead to higher energy benefits. This is mainly due to the high cooling energy consumed when larger windows are used. Hence, for the south façade, the maximum energy benefits decreased from 4113 to 3691 kWh pa for Case 2 and 4185 to 4037 kWh pa for Case 3 when the WWR was increased from 20 to 80%.

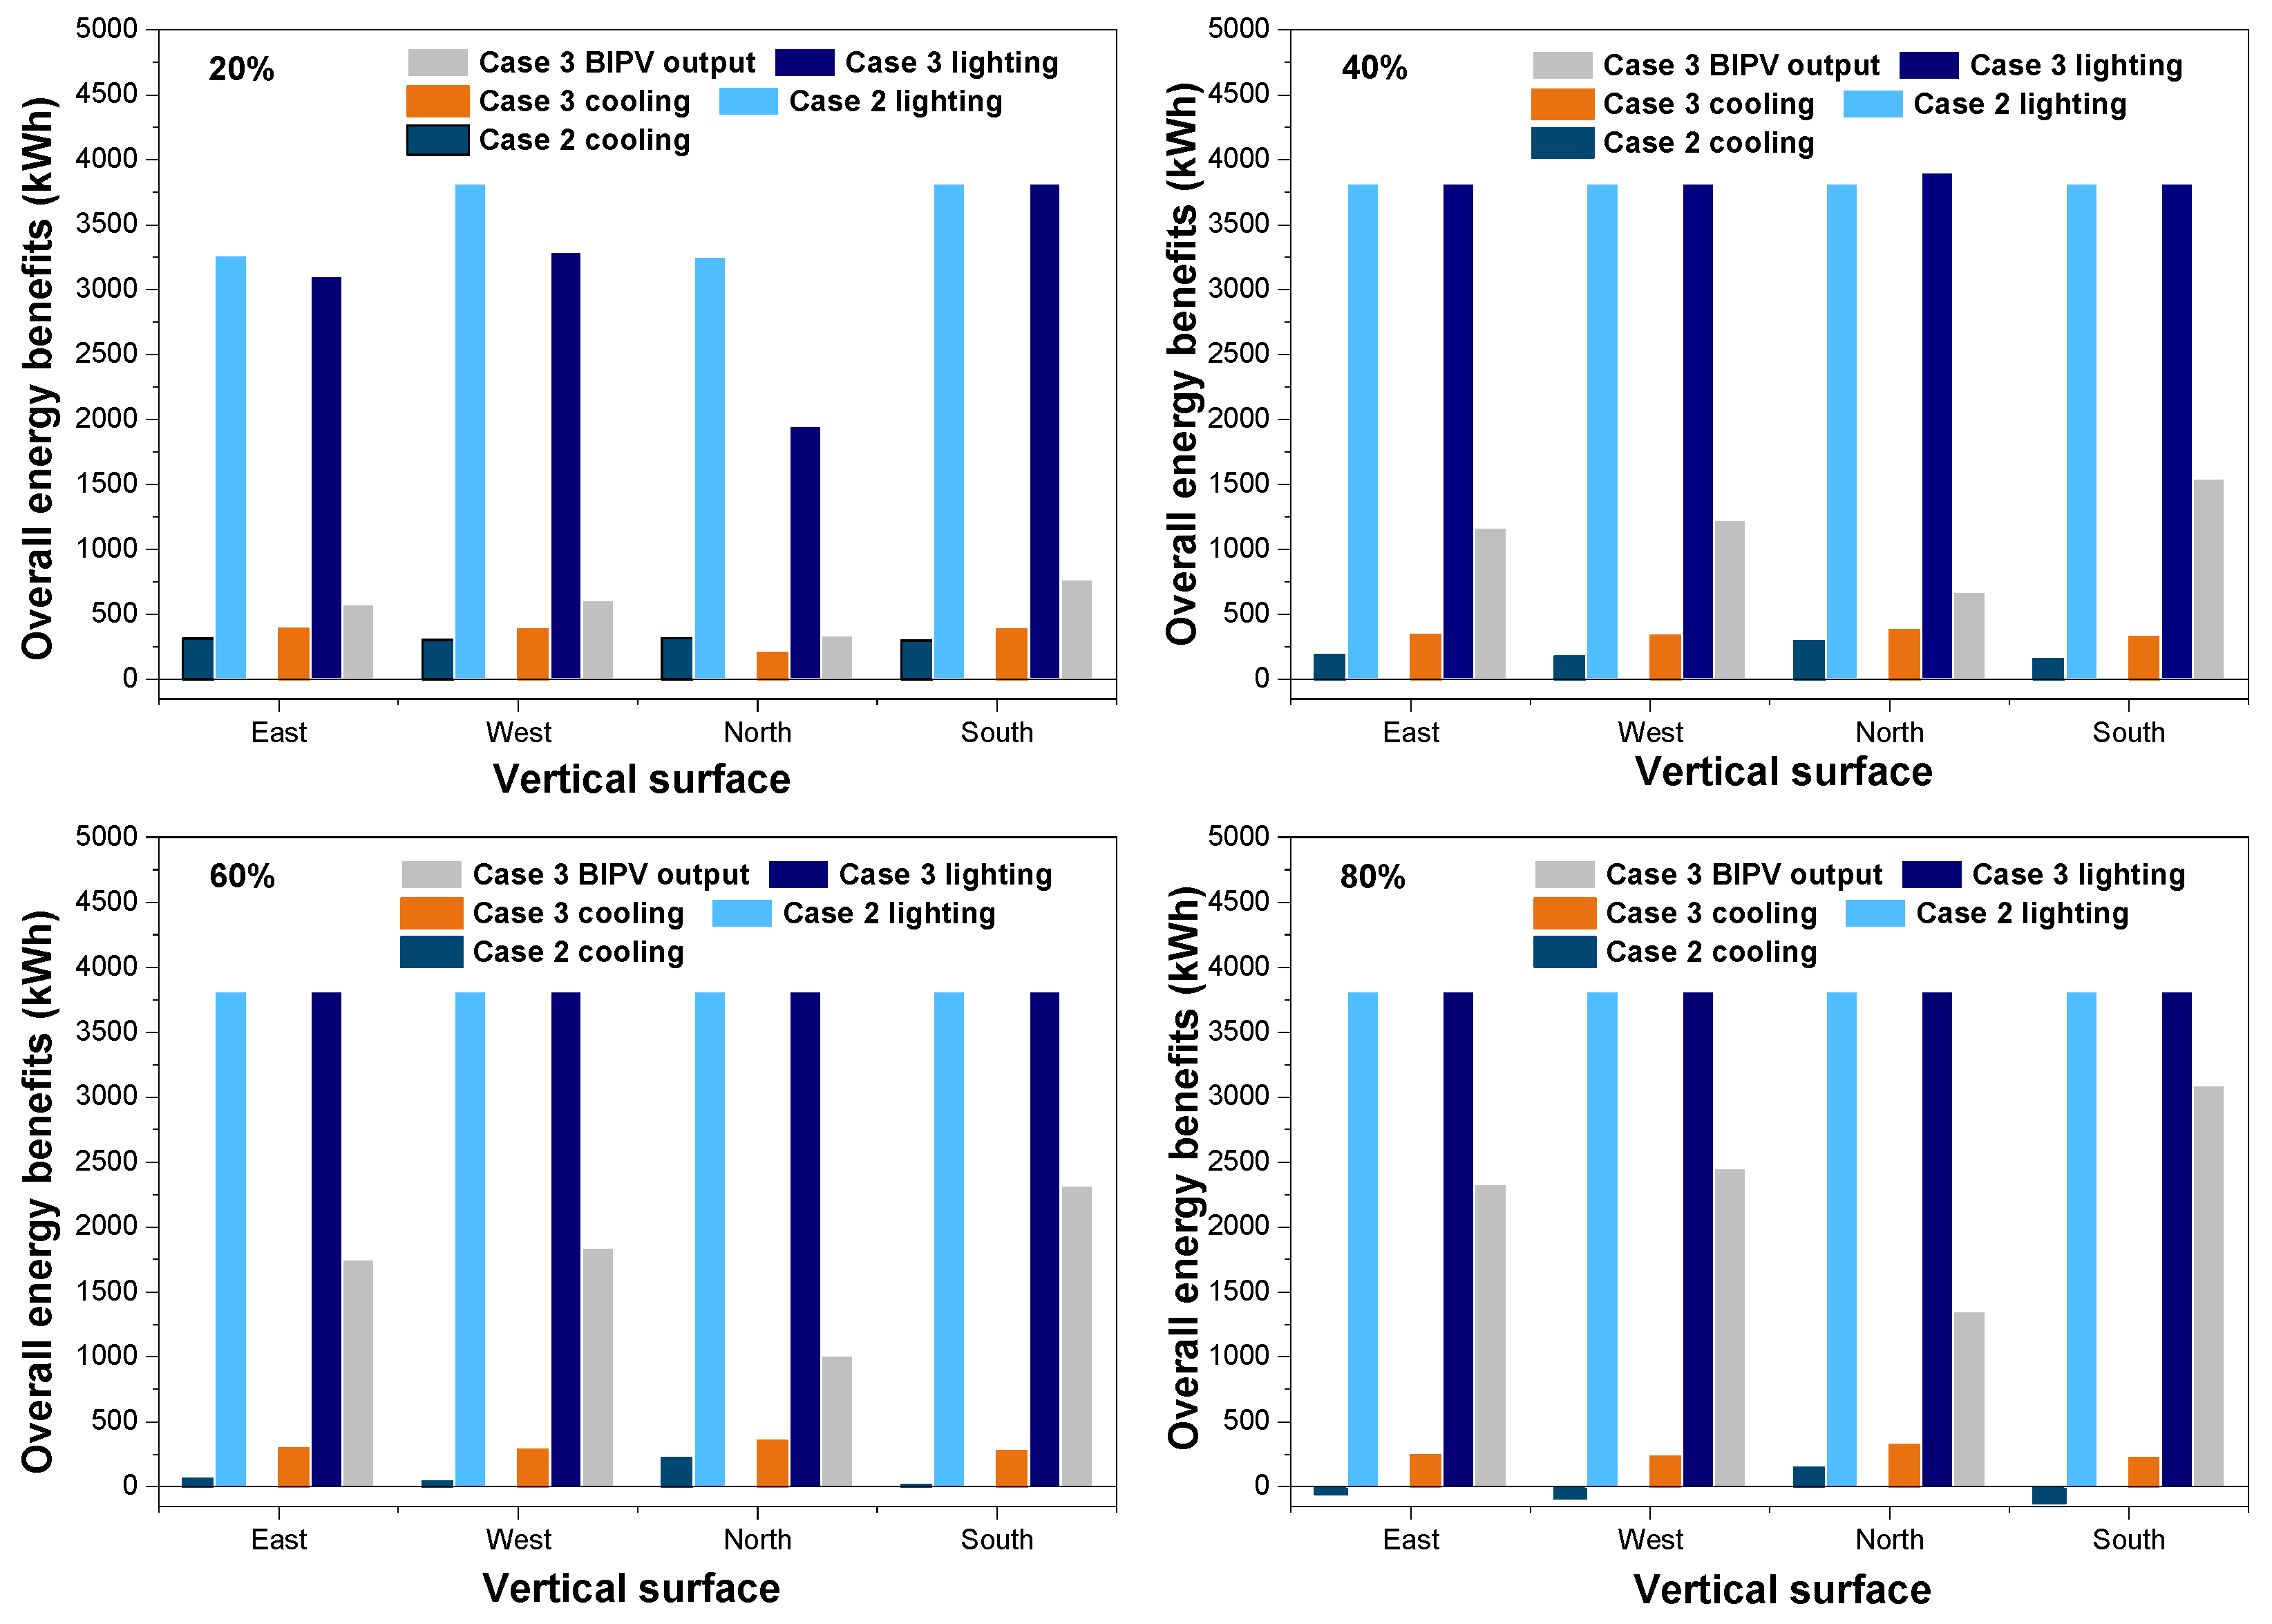
3.5.2. Overall Electricity Benefits

The overall electricity benefits represent the summation of the benefits derived from cooling, lighting and BIPV output, as presented in Figure 17. The energy generated from the BIPV ranged from 338 to 772 kWh pa (20%WWR), 676 to 1544 kWh pa (40% WWR), 1013 to 2317 kWh pa (60%WWR) and 1351 kWh to 3089 kWh pa (80% WWR), respectively. These values increased in the north, east, west, and south. This additional energy generated from the BIPV in Case 3 led to an increase in its energy benefit compared to Case 2. With the addition of the BIPV output, the overall benefits in Case 3 increased with the WWR, with the least benefits in the north and the most in the south. This finding also supports results from a previous work [23]. Similarly, Do et al. [48] reported the increase in energy benefit of BIPV in relation to the increase in WWR. For the 20% WWR, the benefits ranged from 3569 to 4113 kWh pa and 2495 to 4957 kWh pa for Cases 2 and 3, respectively. This value changed to 3973 to 4111 kWh pa for Case 2 and 4961 to 5690 kWh pa for Case 3 in the 40% WWR case. In larger-window areas, such as the 60% WWR, the range was 3832 to 4039 kWh pa for Case 2 and 5185 to 6409 kWh pa for Case 3. Lastly, the 80% WWR had the greatest benefits for Case 3. These values ranged from 5495 to 7126 kWh pa compared to the 3691 to 3967 kWh pa in Case 2.
A further comparison showed that Case 3 increased with WWR compared to Case 2. This is because Case 2 did not benefit from BIPV output, and featured more energy consumption through cooling. To investigate the energy implications for the increase in WWR, the ratio of energy benefits to consumption is presented in Figure 18. The energy consumption was the sum of electricity used for lighting and cooling. The BIPV case was accessed and it is assumed that energy generation is excluded from Figure 18a and included in Figure 18b. As shown in Figure 18a, it was observed that due to the higher energy consumption in the larger windows, the percentage ratio of the energy benefit was smaller, with an increase in WWR when energy was not generated. This became reversed when the output was included. This also applies to tinted glass, which lacks energy generation. Hence, increasing the WWR for non-energy-generating façades increases energy consumption, leading to increased carbon emissions and financial implications. In addition, Figure 18a shows the large percentage difference between the south façade and the other vertical surfaces for the 20% case. This difference was due to the fact that the additional energy benefits for the south façade were considerably greater than those for the other three façades. These benefits are traceable to the higher solar radiation and outdoor illuminance on the south façade, which is still sufficient to provide high energy benefits, even for a smaller window area of 20%. This was not the case for the other façades.

4. Conclusions

The availability of solar data will help in the design of solutions to the energy challenge in Hong Kong. Hence, solar radiation and outdoor illuminance were measured in Hong Kong between June 2019 and May 2020. The findings showed that the annual average horizontal global-, diffuse- and direct-irradiance values were 291.8 W/m2/day, 164.3 W/m2/day, and 127.5 W/m2/day, respectively. It was also observed that day lighting alone can provide a room with an indoor design illuminance of 500 lux for about 50% of the time, irrespective of the sky conditions. During the measuring period, the highest solar irradiance was observed on the south surface, with a value of 847.34 W/m2, which was due to the sun path in Hong Kong. The north surface had the lowest maximum solar irradiance, and this was less than half the maximum solar radiation experienced on the other surfaces. Furthermore, the vertical solar irradiance was about 90 W/m2 or more for over 50% of the year. The maximum outdoor illuminance for the vertical surfaces was investigated, and the north surface had the lowest value of 38.7 klux. Generally, most of the illuminance data were below 30 klux for all four vertical surfaces, indicating that diffuse illuminance was the major component in all the surfaces. The annual incident solar radiation and daylight illuminance were also assessed. It was observed that the roof (i.e., 1386.9 kWh/m2 pa) and south façade (i.e., 789.1 kWh/m2 pa) had the highest incident solar radiation. Further investigations showed that with an annual incident radiation of 757.4 kWh/m2 pa, the BIPV can be used for the entire BS in Hong Kong. The contribution of different solar radiation components to global radiation was evaluated. The analysis revealed that diffuse solar radiation contributes more to global solar radiation. The contribution of the diffuse component ranged from 46.5% (i.e., west façade) to 56.3% (i.e., roof). This was followed by the direct component, with values ranging from 2.4% (i.e., north façade) to 45.7% (i.e., roof). The reflected component had the lowest contribution, which ranged from 0 (i.e., roof) to 38.2 % (i.e., north façade). Finally, the effect of the façade and design parameters on the energy efficiency of the designs was investigated by assessing the energy implications for the lighting, cooling and semi-transparent BIPV output using a generic case study. The findings showed that the increase in WWR and SC increased the solar-heat gain and cooling load. These increases were also influenced by the orientation effect, especially on the south façade. Furthermore, the use of daylighting control allowed an increase in energy savings, irrespective of the building’s orientation. Importantly, semi-transparent BIPV façades with a large window-to-wall ratio (WWR) of 80% can provide an overall energy benefit of up to 7126 kWh pa. This energy benefit is huge compared to the 3967 kWh pa generated when the commonly adopted tinted glass is used. From the comparative analysis, it was established that semi-transparent BIPV, especially when applied to curtain-wall designs, is an alternative fenestration system for energy-efficient-building designs. Nevertheless, care should be taken when using BIPV as a large-window alternative.
This study provided recent findings on measured solar radiation and daylight data in Hong Kong. A method for generating data for unconventional building orientations was described. It is hoped that this information will be helpful in deriving the data needed for evaluating design schemes. Furthermore, the simple methodology presented for energy evaluation can help building designers to evaluate the energy performances of different designs during the conceptual stage of the design. It is also expected that the findings of this study will help to influence design and policy decisions regarding the use of BIPV in Hong Kong and other cities in sub-tropical climates. However, this study is limited to assessing solar energy’s geographical and technical potential for BIPV designs for all façades and BS. Future work will assess the theoretical potential of BIPV. Furthermore, the economic and other cost implications of using semi-transparent BIPV for BS and façades design will be explored in future studies. Importantly, the findings from the energy analysis may be limited to the present study. Thus, further studies will evaluate various building-envelope designs, parametric forms and façade parameters, since this will give a more robust conclusion. Furthermore, although the energy-analysis method presented in this study will be useful in the conceptual stage of design, for future work, computer-simulation programs will be adopted because this approach is preferable at the final design stages. Although this work was conducted in Hong Kong, the methodology presented can be extended to other cooling-dominated buildings, especially in tropical and subtropical regions.

Author Contributions

Conceptualization, D.H.W.L. and E.I.A.; methodology, D.H.W.L., E.I.A. and K.A.; software, E.I.A.; validation, D.H.W.L., E.I.A. and K.A.; formal analysis, E.I.A.; investigation, D.H.W.L., E.I.A. and K.A.; resources, D.H.W.L.; data curation, E.I.A.; writing—original draft preparation, E.I.A.; writing—review and editing, D.H.W.L., E.I.A. and K.A.; visualization, D.H.W.L. and E.I.A.; supervision, D.H.W.L.; project administration, D.H.W.L.; funding acquisition, D.H.W.L. All authors have read and agreed to the published version of the manuscript.

Funding

This research was funded by a Strategic Research Grant from the City University of Hong Kong (project no. 7005556).

Institutional Review Board Statement

Not applicable.

Informed Consent Statement

Not applicable.

Data Availability Statement

The data presented in this study are available on request from the corresponding author.

Acknowledgments

Emmanuel Imuetinyan Aghimien was supported by a City University of Hong Kong Postgraduate Studentship.

Conflicts of Interest

The authors declare no conflict of interest.

Nomenclature

AfThe floor area (m2)
AinTotal area of indoor surfaces (m2)
ApTotal solar-panel area (m2)
AwWindow area (m2)
BHIDirect beam irradiance (W/m2)
BVHorizontal diffuse illuminance (klux)
BVLVertical direct illuminance (klux)
BVTVertical direct irradiance (W/m2)
CFCumulative frequency (%)
CLDCloud cover (Oktas)
COPCoefficient of performance (-)
DHIHorizontal diffuse irradiance (W/m2)
DVHorizontal direct illuminance (klux)
DVLVertical diffuse illuminance (klux)
DVTVertical diffuse irradiance (W/m2)
EEnergy saving in electric lighting (kWh)
EcEnergy saving in electric lighting during the cooling season (kWh)
EinAverage illuminance on all the room surfaces (klux)
EoExtra-terrestrial radiation (W/m2)
EpPV peak output (kWh)
EvVertical illuminance on the window façade (klux)
FOCFrequency of occurrence (%)
FsFractional energy saving (-)
Fs՚Fractional energy saving during the cooling season (-)
GHIHorizontal global irradiance (W/m2)
GVHorizontal global illuminance (klux)
GVLVertical global illuminance (klux)
GVTVertical global irradiance (W/m2)
HTotal hours of electric-lighting operation (hour)
HcTotal hours of electric-lighting operation during the cooling season (hour)
hiHeat-transfer coefficients of the inside a glazing surface (W/m2K)
hoHeat-transfer coefficients of the outside a glazing surface (W/m2K)
HpSolar radiation for BIPV estimation (kWh/m2)
HSTPStandard solar radiation of the PV (kWh/m2)
IvSum of hourly diffuse and reflected radiation on the plane of the vertical glazing (W/m2)
LPDLighting-power density (W/m2K)
NiInward-flowing fraction of the absorbed radiation (-)
PRPerformance ratio (-)
QSolar heat gain kWh
RMean reflectance of all indoor surfaces (-)
R2Coefficient of determination
RfMinimum light-output ratio
RVTReflectance on the vertical surface (W/m2)
RwFractional power consumption
SCGlass-shading coefficient (-)
SHSunshine hour (hour)
SHGFSolar-heat-gain factor (W/m2)
TaHourly ambient temperature (OC)
TSTPStandard temperature (OC)
VSCVertical sky component (-)
VTLight transmittance (-)
ypPV efficiency (%)
Greek symbols
αSolar altitude (degrees)
αbAbsorption of the reference glazing for direct beam radiation (-)
δPTemperature coefficient of power (%)
ϴIncidence angle (degrees)
ρReflectivity of the ground (-)
τbTransmittance of the reference glazing for direct beam radiation (-)
ϕSolar azimuth angle (degrees)
ϕNRAzimuth angle of the surface normal (degrees)
χScattering angle (degrees)
Abbreviations
BIPVBuilding-integrated photovoltaic
BSBuilding skin
CO2Carbon dioxide
NZEBNet-zero-energy buildings

References

  1. Khan, S.A.; Alam, T.; Khan, M.S.; Blecich, P.; Kamal, M.A.; Gupta, N.K.; Yadav, A.S. Life Cycle Assessment of Embodied Carbon in Buildings: Background, Approaches and Advancements. Buildings 2022, 12, 1944. [Google Scholar] [CrossRef]
  2. Lin, Y.; Liu, J.; Gabriel, K.; Yang, W.; Li, C.-Q. Data-Driven Based Prediction of the Energy Consumption of Residential Buildings in Oshawa. Buildings 2022, 12, 2039. [Google Scholar] [CrossRef]
  3. Kuwahara, R.; Kim, H.; Sato, H. Evaluation of Zero-Energy Building and Use of Renewable Energy in Renovated Buildings: A Case Study in Japan. Buildings 2022, 12, 561. [Google Scholar] [CrossRef]
  4. Abrahamsen, F.E.; Ruud, S.G.; Gebremedhin, A. Assessing Efficiency and Environmental Performance of a Nearly Zero-Energy University Building’s Energy System in Norway. Buildings 2023, 13, 169. [Google Scholar] [CrossRef]
  5. Khan, S.U.; Khan, N.; Ullah, F.U.M.; Kim, M.J.; Lee, M.Y.; Baik, S.W. Towards intelligent building energy management: AI-based framework for power consumption and generation forecasting. Energy Build. 2023, 279, 112705. [Google Scholar] [CrossRef]
  6. Barone, G.; Buonomano, A.; Forzano, C.; Giuzio, G.F.; Palombo, A. Increasing self-consumption of renewable energy through the Building to Vehicle to Building approach applied to multiple users connected in a virtual micro-grid. Renew. Energy 2020, 159, 1165–1176. [Google Scholar] [CrossRef]
  7. Kuang, W.Y.; Illankoon, C.; Vithanage, S.C. Grid-Connected Solar Photovoltaic (PV) System for Covered Linkways. Buildings 2022, 12, 2131. [Google Scholar] [CrossRef]
  8. Sadatifar, S.; Johlin, E. Multi-objective optimization of building integrated photovoltaic solar shades. Sol. Energy 2022, 242, 191–200. [Google Scholar] [CrossRef]
  9. Osseweijer, F.J.; van den Hurk, L.B.; Teunissen, E.J.; van Sark, W.G. A comparative review of building integrated photovoltaics ecosystems in selected European countries. Renew. Sustain. Energy Rev. 2018, 90, 1027–1040. [Google Scholar] [CrossRef]
  10. Gholami, H.; Røstvik, N.H. The Effect of Climate on the Solar Radiation Components on Building Skins and Building Integrated Photovoltaics (BIPV) Materials. Energies 2021, 14, 1847. [Google Scholar] [CrossRef]
  11. Gholami, H.; Røstvik, H.N. Economic Analysis of BIPV Systems as a Building Envelope Material for Building Skins in Europe. Energy 2020, 204, 117931. [Google Scholar] [CrossRef]
  12. Celadyn, M.; Celadyn, W. Apparent Destruction Architectural Design for the Sustainability of Building Skins. Buildings 2022, 12, 1220. [Google Scholar] [CrossRef]
  13. Shao, Z.; Wang, B.; Xu, Y.; Sun, L.; Ge, X.; Cai, L.; Chang, C. Dynamic Concentrated Solar Building Skin Design Based on Multiobjective Optimization. Buildings 2022, 12, 2026. [Google Scholar] [CrossRef]
  14. Al-Ghussain, L.; Hassan, M.A.; Hamed, A. Modeling and Techno-Economic Optimization of Overhead Panels and Reflectors in Near-Wall Mounted PV Systems. Sol. Energy 2023, 249, 624–641. [Google Scholar] [CrossRef]
  15. Cao, Q.; Liu, Y.; Sun, X.; Yang, L. Country-Level Evaluation of Solar Radiation Data Sets Using Ground Measurements in China. Energy 2022, 241, 122938. [Google Scholar] [CrossRef]
  16. Ceballos, J.C.; Porfirio, A.C.S.; Oricchio, P.A.; Posse, G. Characterization of the Annual Regime of Surface Solar Irradiance over Argentine Pampean Region Using GL1.2 satellite-based data. Renew. Energy 2022, 194, 526–537. [Google Scholar] [CrossRef]
  17. Alabi, T.M.; Aghimien, E.I.; Agbajor, F.D.; Yang, Z.; Lu, L.; Adeoye, A.R.; Gopaluni, B. A Review on the Integrated Optimization Techniques and Machine Learning Approaches for Modeling, Prediction, and Decision Making on Integrated Energy Systems. Renew. Energy 2022, 194, 822–849. [Google Scholar] [CrossRef]
  18. Li, D.H.W.; Chen, W.; Li, S.; Lou, S. Estimation of Hourly Global Solar Radiation Using Multivariate Adaptive Regression Spline (MARS)—A Case Study of Hong Kong. Energy 2019, 186, 115857. [Google Scholar] [CrossRef]
  19. Aghimien, E.I.; Li, D.H.W.; Tsang, E.K.-W. Bioclimatic Architecture and Its Energy-Saving Potentials: A Review and Future Directions. Eng. Constr. Arch. Manag. 2021, 29, 961–988. [Google Scholar] [CrossRef]
  20. Fernández-Ahumada, L.M.; Ramírez-Faz, J.; López-Luque, R.; Márquez-García, A.; Varo-Martínez, M. A Methodology for Buildings Access to Solar Radiation in Sustainable Cities. Sustainability 2019, 11, 6596. [Google Scholar] [CrossRef]
  21. Lou, S.; Huang, Y.; Xia, D.; Lun, I.Y.F.; Li, D.H.W. A Study of the Skylight Coverage Ratio for Air-Conditioned Atriums in the Hot and Humid Regions. Int. J. Low-Carbon Technol. 2021, 16, 946–955. [Google Scholar] [CrossRef]
  22. To, C.; Li, J.; Kam, M. Towards Zero Carbon in a Hot and Humid Subtropical Climate. Procedia Eng. 2017, 180, 413–422. [Google Scholar] [CrossRef]
  23. Li, D.H.W.; Lam, T.N.T.; Chan, W.W.H.; Mak, A.H.L. Energy and Cost Analysis of Semi-Transparent Photovoltaic in Office Buildings. Appl. Energy 2009, 86, 722–729. [Google Scholar] [CrossRef]
  24. Mah, D.N.; Wang, G.; Lo, K.; Leung, M.K.H.; Hills, P.; Lo, A.Y. Barriers and Policy Enablers for Solar Photovoltaics (PV) in Cities: Perspectives of Potential Adopters in Hong Kong. Renew. Sustain. Energy Rev. 2018, 92, 921–936. [Google Scholar] [CrossRef]
  25. Wong, M.S.; Zhu, R.; Liu, Z.; Lu, L.; Peng, J.; Tang, Z.; Lo, C.H.; Chan, W.K. Estimation of Hong Kong’s Solar Energy Potential Using GIS and Remote Sensing Technologies. Renew. Energy 2016, 99, 325–335. [Google Scholar] [CrossRef]
  26. Qin, H.; Pan, W. Energy Use of Subtropical High-Rise Public Residential Buildings and Impacts of Energy Saving Measures. J. Clean. Prod. 2020, 254, 120041. [Google Scholar] [CrossRef]
  27. Li, D.H.W.; Lam, J.C. Measurements of Solar Radiation and Illuminance on Vertical Surfaces and Daylighting Implications. Renew. Energy 2000, 20, 389–404. [Google Scholar] [CrossRef]
  28. Lam, J.C.; Li, D.H. Study of Solar Radiation Data for Hong Kong. Energy Convers. Manag. 1996, 37, 343–351. [Google Scholar] [CrossRef]
  29. Li, D.H.W.; Lam, J.C.; Lau, C.C.S. A Study of Solar Radiation Daylight Illuminance and Sky Luminance Data Measurements for Hong Kong. Arch. Sci. Rev. 2002, 45, 21–30. [Google Scholar] [CrossRef]
  30. Ohunakin, O.S.; Adaramola, M.S.; Oyewola, O.M.; Matthew, O.J.; Fagbenle, R.O. The Effect of Climate Change on Solar Radiation in Nigeria. Sol. Energy 2015, 116, 272–286. [Google Scholar] [CrossRef]
  31. Wuebbles, D.J. Climate Change in the 21st Century: Looking beyond the Paris Agreement. In Climate Change Management; Springer International Publishing: Berlin/Heidelberg, Germany, 2018; pp. 15–38. [Google Scholar] [CrossRef]
  32. Wang, W.; Arya, C. Influence of High-Performance Façade on Heating/Cooling Load in Office Buildings in London and Hong Kong. In Proceedings of the BSO Conference: Third Conference of IBPSA England, Newcastle, UK, 12–14 September 2016; pp. 489–497. [Google Scholar]
  33. Aghimien, E.I.; Li, D.H.W. Application of Luminous Efficacies for Daylight Illuminance Data Generation in Subtropical Hong Kong. Smart Sustain. Built Environ. 2022, 11, 271–293. [Google Scholar] [CrossRef]
  34. Tregenza, P. Analysing Sky Luminance Scans to Obtain Frequency Distributions of CIE Standard General Skies. Light. Res. Technol. 2004, 36, 271–281. [Google Scholar] [CrossRef]
  35. Li, D.H.W.; Li, C.; Lou, S.W.; Tsang, E.K.W.; Lam, J.C. Analysis of Vertical Sky Components under Various CIE Standard General Skies. Indoor Built Environ. 2015, 25, 703–711. [Google Scholar] [CrossRef]
  36. Li, D.H.W.; Aghimien, E.I. Predicting Vertical Daylight Illuminance Data from Measured Solar Irradiance: A Machine Learning-Based Luminous Efficacy Approach. J. Sol. Energy Eng. 2023, 145, 031005. [Google Scholar] [CrossRef]
  37. Li, D.H.; Chau, N.T.; Wan, K.K. Predicting Daylight Illuminance and Solar Irradiance on Vertical Surfaces Based on Classified Standard Skies. Energy 2013, 53, 252–258. [Google Scholar] [CrossRef]
  38. Littlefair, P.J. The Luminance Distribution of an Average Sky. Light. Res. Technol. 1981, 13, 192–198. [Google Scholar] [CrossRef]
  39. Ahn, B.L.; Park, J.W.; Yoo, S.; Kim, J.; Leigh, S.; Jang, C. Savings in Cooling Energy with a Thermal Management System for LED Lighting in Office Buildings. Energies 2015, 8, 6658–6667. [Google Scholar] [CrossRef] [Green Version]
  40. Joseph, B.; Pogrebnaya, T.; Kichonge, B. Semitransparent Building-Integrated Photovoltaic: Review on Energy Performance, Challenges, and Future Potential. Int. J. Photoenergy 2019, 2019, 1–17. [Google Scholar] [CrossRef] [Green Version]
  41. Alabi, T.M.; Lu, L.; Yang, Z.; Zhou, Y. A Novel Optimal Configuration Model for a Zero-Carbon Multi-Energy System (ZC-MES) Integrated with Financial Constraints. Sustain. Energy Grids Netw. 2020, 23, 100381. [Google Scholar] [CrossRef]
  42. Kumar, N.M.; Samykano, M.; Karthick, A. Energy Loss Analysis of a Large Scale BIPV System for University Buildings in Tropical Weather Conditions: A Partial and Cumulative Performance Ratio Approach. Case Stud. Therm. Eng. 2021, 25, 100916. [Google Scholar] [CrossRef]
  43. Martín-Chivelet, N.; Guillén, C.; Trigo, J.F.; Herrero, J.; Pérez, J.J.; Chenlo, F. Comparative Performance of Semi-Transparent PV Modules and Electrochromic Windows for Improving Energy Efficiency in Buildings. Energies 2018, 11, 1526. [Google Scholar] [CrossRef] [Green Version]
  44. Yu, F.W.; Chan, K.T.; Sit, R.K.Y.; Yang, J. Review of Standards for Energy Performance of Chiller Systems Serving Commercial Buildings. Energy Procedia 2014, 61, 2778–2782. [Google Scholar] [CrossRef] [Green Version]
  45. Alwetaishi, M. Impact of Glazing to Wall Ratio in Various Climatic Regions: A Case Study. J. King Saud Univ. Eng. Sci. 2019, 31, 6–18. [Google Scholar] [CrossRef]
  46. Qiu, Z.; Wang, J.; Yu, B.; Liao, L.; Li, J. Identification of passive solar design determinants in office building envelopes in hot and humid climates using data mining techniques. Build. Environ. 2021, 196, 107566. [Google Scholar] [CrossRef]
  47. Kim, S.-H.; Kim, S.-S.; Kim, K.-W.; Cho, Y.-H. A study on the proposes of energy analysis indicator by the window elements of office buildings in Korea. Energy Build. 2014, 73, 153–165. [Google Scholar] [CrossRef]
  48. Do, S.L.; Shin, M.; Baltazar, J.-C.; Kim, J. Energy benefits from semi-transparent BIPV window and daylight dimming systems for IECC code-compliance residential buildings in hot and humid climates. Sol. Energy 2017, 155, 291–303. [Google Scholar] [CrossRef]
Figure 1. (a) Pyranometer sensor. (b) Lux meter sensor. (c) The Suntracker (STR-22G).
Buildings 13 00386 g001
Figure 2. Flow chart of energy-evaluation method.
Buildings 13 00386 g002
Figure 3. Plan view of base case study.
Buildings 13 00386 g003
Figure 4. Monthly average daily horizontal solar radiation between June 2019 and May 2020.
Buildings 13 00386 g004
Figure 5. Monthly average hourly solar radiation for July, October, January and April.
Buildings 13 00386 g005
Figure 6. Frequency of occurrence of (a) global-, (b) diffuse- and (c) direct illuminance.
Buildings 13 00386 g006
Figure 7. Cumulative frequency of horizontal outdoor illuminance.
Buildings 13 00386 g007
Figure 8. Frequency of occurrence of vertical global solar radiation.
Buildings 13 00386 g008
Figure 9. Cumulative frequency of vertical global solar radiation.
Buildings 13 00386 g009
Figure 10. Frequency of occurrence of vertical global outdoor illuminance.
Buildings 13 00386 g010
Figure 11. Cumulative frequency of vertical outdoor global illuminance.
Buildings 13 00386 g011
Figure 12. Annual incident solar radiation on building skins.
Buildings 13 00386 g012
Figure 13. Relationship between average GVT on building façades and building.
Buildings 13 00386 g013
Figure 14. Solar-heat gain for the south façade.
Buildings 13 00386 g014
Figure 15. Increase in solar-heat gain along the four principal surfaces.
Buildings 13 00386 g015
Figure 16. Cooling- and daylight-linked control-lighting savings for the different cases.
Buildings 13 00386 g016
Figure 17. Overall energy benefits for all cases.
Buildings 13 00386 g017
Figure 18. (a) BIPV output excluded. (b) BIPV output included.
Buildings 13 00386 g018
Table 1. Coefficients of A1, B1, C1, A2, B2 and C2.
Sky NumberA1B1C1A2B2C2
1 40%
20.52810.91060.30619870.7
3 46%
40.6265.9395.70.424222107
5 50%
60.6882.4191.90.549257146
70.826.7675.10.958336178
817.366.70.745294150
90.891−2.595.10.624243142
101.042.3375.92.01461246
111.3−2.4873.32427211
121.45−1.568.12.6510267
131.86−13.171.87801372
142.39−24.978.31.8499278
153.91−56.393.61.31445222
Table 2. Proposed case studies and scenarios based on different WWR.
Case Studies Window Façade PropertiesArchitecture/Design/Equipment PropertiesBIPV Output
SCVTOrientationDaylight-Linked Light ControlWWR (%)
Window Material20406080
Case 1Tinted0.70.5N, E, S, Wxx
Case 2Tinted 0.70.5N, E, S, Wx
Case 3BIPV 0.270.3N, E, S, W
x and ✓ represent the absence and presence of the parameters in the case, respectively.
Table 3. Descriptive statistical summary of hourly global irradiance.
Vertical Global Irradiance (Wh/m2)
EastSouthWestNorth
Maximum830.6847.3743.6261.0
Mean165.5205.9168.084.3
Standard Deviation160.9196.9169.951.7
Table 4. Annual incident solar radiation and daylight illuminance on building skins with the contribution of each component.
Annual Incident Solar Radiation Components
OrientationGlobal Solar Radiation (kWh/m2)Direct (%)Diffuse (%)Reflected (%)
Roof1386.943.756.30.0
North325.22.459.438.2
West647.534.346.519.2
South789.137.646.615.7
East638.327.353.219.5
Building Skin757.434.552.413.1
Disclaimer/Publisher’s Note: The statements, opinions and data contained in all publications are solely those of the individual author(s) and contributor(s) and not of MDPI and/or the editor(s). MDPI and/or the editor(s) disclaim responsibility for any injury to people or property resulting from any ideas, methods, instructions or products referred to in the content.

