1. Introduction
The construction industry, given its inherent characteristics, is often associated with higher risk than other industries [
1]. Notably, based on the findings of previous research, many accidents on construction sites (more than 70%) are directly related to workers’ unsafe behaviors [
2]. Furthermore, Tixier et al. [
3] pointed out that many workers do not engage in safety violations intentionally but rather display such behaviors because of a lack of adequate awareness of the risks.
To mitigate industrial accidents, the foremost and optimal approach is the complete elimination of hazards [
4]. However, given the inherent characteristics of construction sites, achieving total risk elimination or control often proves impractical [
5]. Therefore, in pursuit of reducing accidents, it is imperative to accurately perceive risks before any operation and implement effective safety measures to prevent potential accidents [
6]. Enhancing individual safety awareness and fostering collaborative work-sharing among workers via risk perception training is essential in recognizing these risks [
7]. A prime example of a risk perception training method is a toolbox meeting (TBM).
The TBM is a bottom-up safety management activity, convened before work starts, where workers gather around a team leader to mutually confirm and discuss job details and safety procedures [
8]. Essentially, a TBM facilitates communication among workers, enhancing and keeping their safety knowledge and information up to date. However, a prevailing issue is that the TBMs conducted at various sites lack uniformity across different team leaders, often proceeding merely as a formality without genuine communication and consensus-building among workers [
9]. Additionally, a limitation of TBMs is that when they are conducted without prior preparation, the progression lacks consistency and is not systematically structured [
9]. With the advent of technological advancements, smart safety management technology has gained widespread adoption [
10]. Simultaneously, the prevalence of smartphones has reached such a level that the majority of the populace now operates within a smartphone-centric environment [
11]. Considering this, our study aimed to confirm the effect of improving the safety awareness of construction workers by applying mobile TBM applications, which supplement the limitations of conventional TBM that proceed formally without prior preparation.
2. Literature Review
In this study, the difference between workers’ safety awareness and the effectiveness of TBM education was analyzed when using conventional TBM and mobile TBM. In this regard, we analyzed the limitations and implications of relevant previous studies and presented their main differences. The analysis included previous studies related to (i) safety management and TBMs at existing construction sites and (ii) studies on the use of smart safety management technology for safety management at construction sites.
Table 1 summarizes the relevant previous studies.
First, previous research focused on the analysis of conventional TBMs and safety management at construction sites. The predominant challenges identified in this foundational research centered on communication and information-sharing issues between team leaders and workers, as well as among the workers themselves during TBM [
5,
12,
13,
14,
15]. However, research showed a lack of exploring specific solutions or conducting post-solution evaluations. In addition, there was a broad consensus in the studies about the need for technology in construction site safety management, yet no instances of its use in TBMs were found.
Second, previous research focused on the use of smart safety management technology to ensure safety at construction sites. Analyses related to this subject suggested that the deployment of smart safety management technology could contribute to enhancing safety measures at construction sites [
16,
17,
18,
19]. However, there was a noticeable lack of detailed exploration of the tangible effects of this technology when applied. Although there has been previous research on mobile TBMs, the methodology used for the mobile TBMs adopted in these studies was notably unsystematic.
Consequently, regarding the part that presented the problem of communication as a limitation of TBM in previous studies, this study further attempts to solve the communication problem between workers and managers by presenting mobile TBM as a solution. In addition, there are currently few prior studies on mobile TBM, and no studies have conducted post-evaluation after conducting TBM via the application, so this study intends to analyze the effectiveness of TBM by applying mobile TBM and conducting post-evaluation.
3. Materials and Methods
3.1. Mobile TBM Application
At construction sites, risk perception training is employed before daily tasks commence to prevent accidents and ensure safety management. A prime example of this anticipatory risk awareness and sharing mechanism is the TBM [
8].
The Korea Occupational Safety and Health Agency (KOSHA) provides guidelines for a successful TBM. As per their guidelines, an effective TBM session should be conducted near the work site, led by a team leader, and consist of a small team ranging from 4 to 10 participants. The session is most effective when limited to approximately 10 min [
8].
However, there are two prominent issues with the current implementation of TBMs.
First, TBMs often lack structure because of inadequate preparation by supervisors. Second, there is a recurring problem of inadequate information sharing among TBM participants [
20]. Considering these limitations, this study attempted to merge a TBM with mobile technology, leading to the application of mobile TBMs at construction sites. This study investigated the effects of TBMs and the safety awareness of workers at sites where both conventional and mobile TBMs were held.
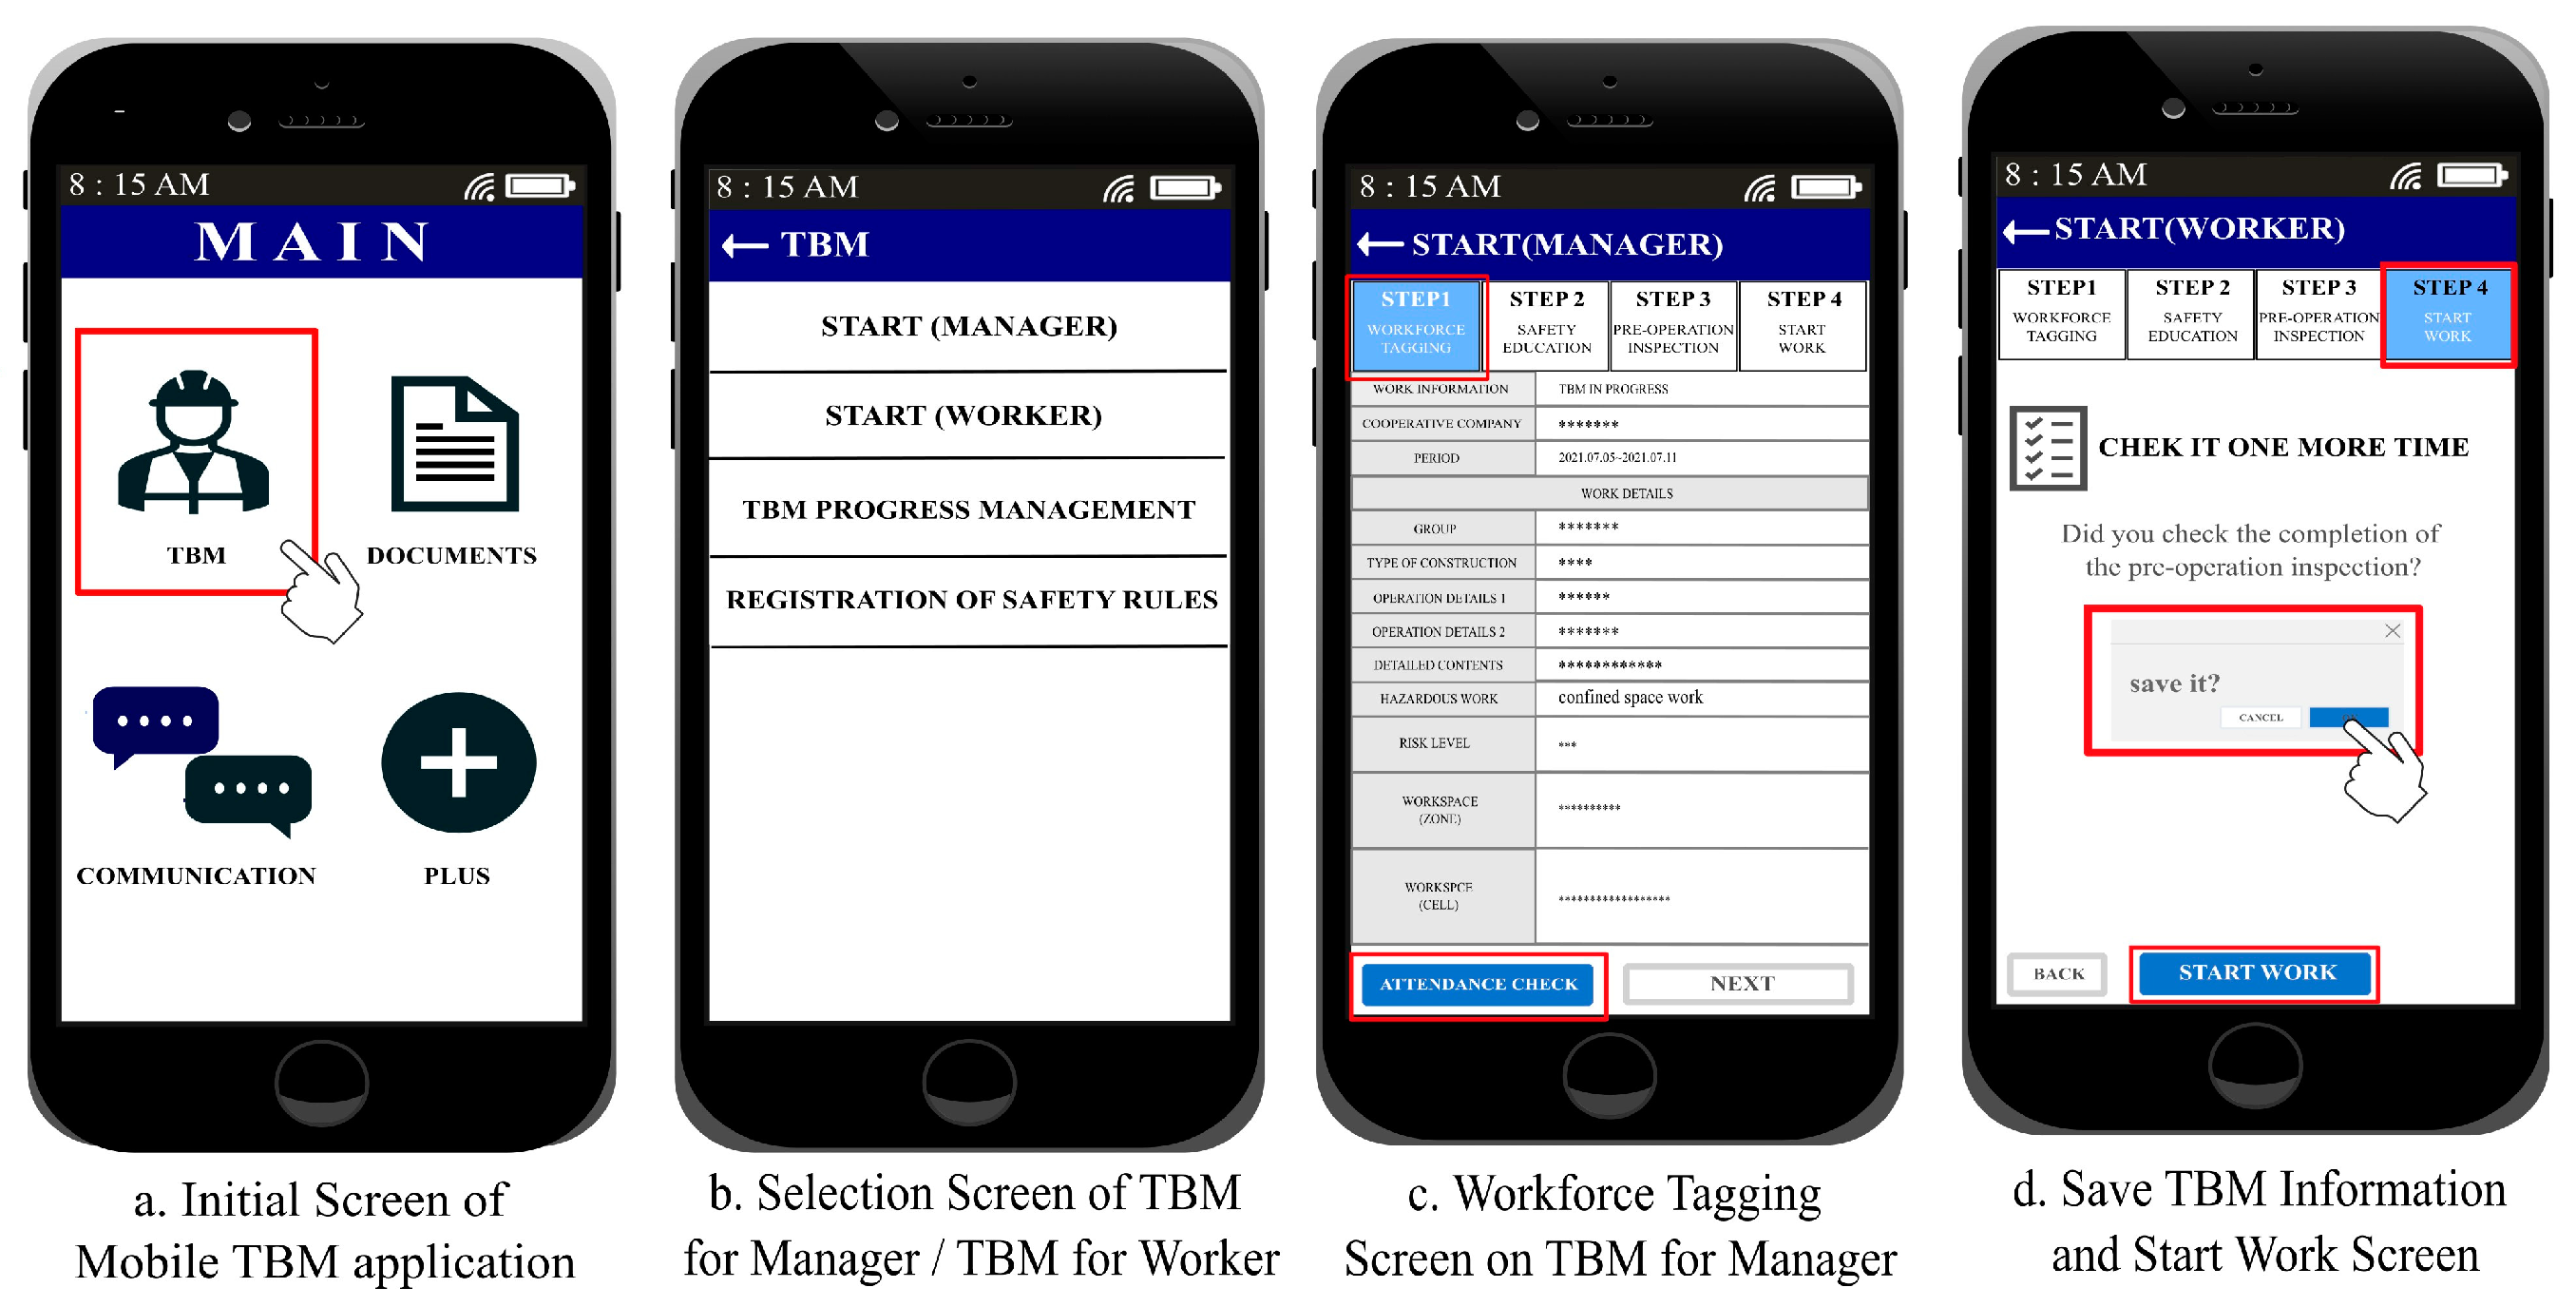
As shown in
Figure 1, the mobile TBM used in this study consisted of four steps: a worker attendance check, safety training, pre-task safety training, and task execution. In contrast to a conventional TBM, the team leader was required to pre-input the safety rules related to the tasks to be performed that day before commencing the TBM. Furthermore, the safety team had to register any notices or announcements for the day in advance before the TBM. The mobile TBM was also integrated with computational systems like risk assessment and permit-to-safety work (PTW) systems, which allowed managers to utilize safety management data without the need for additional paperwork.
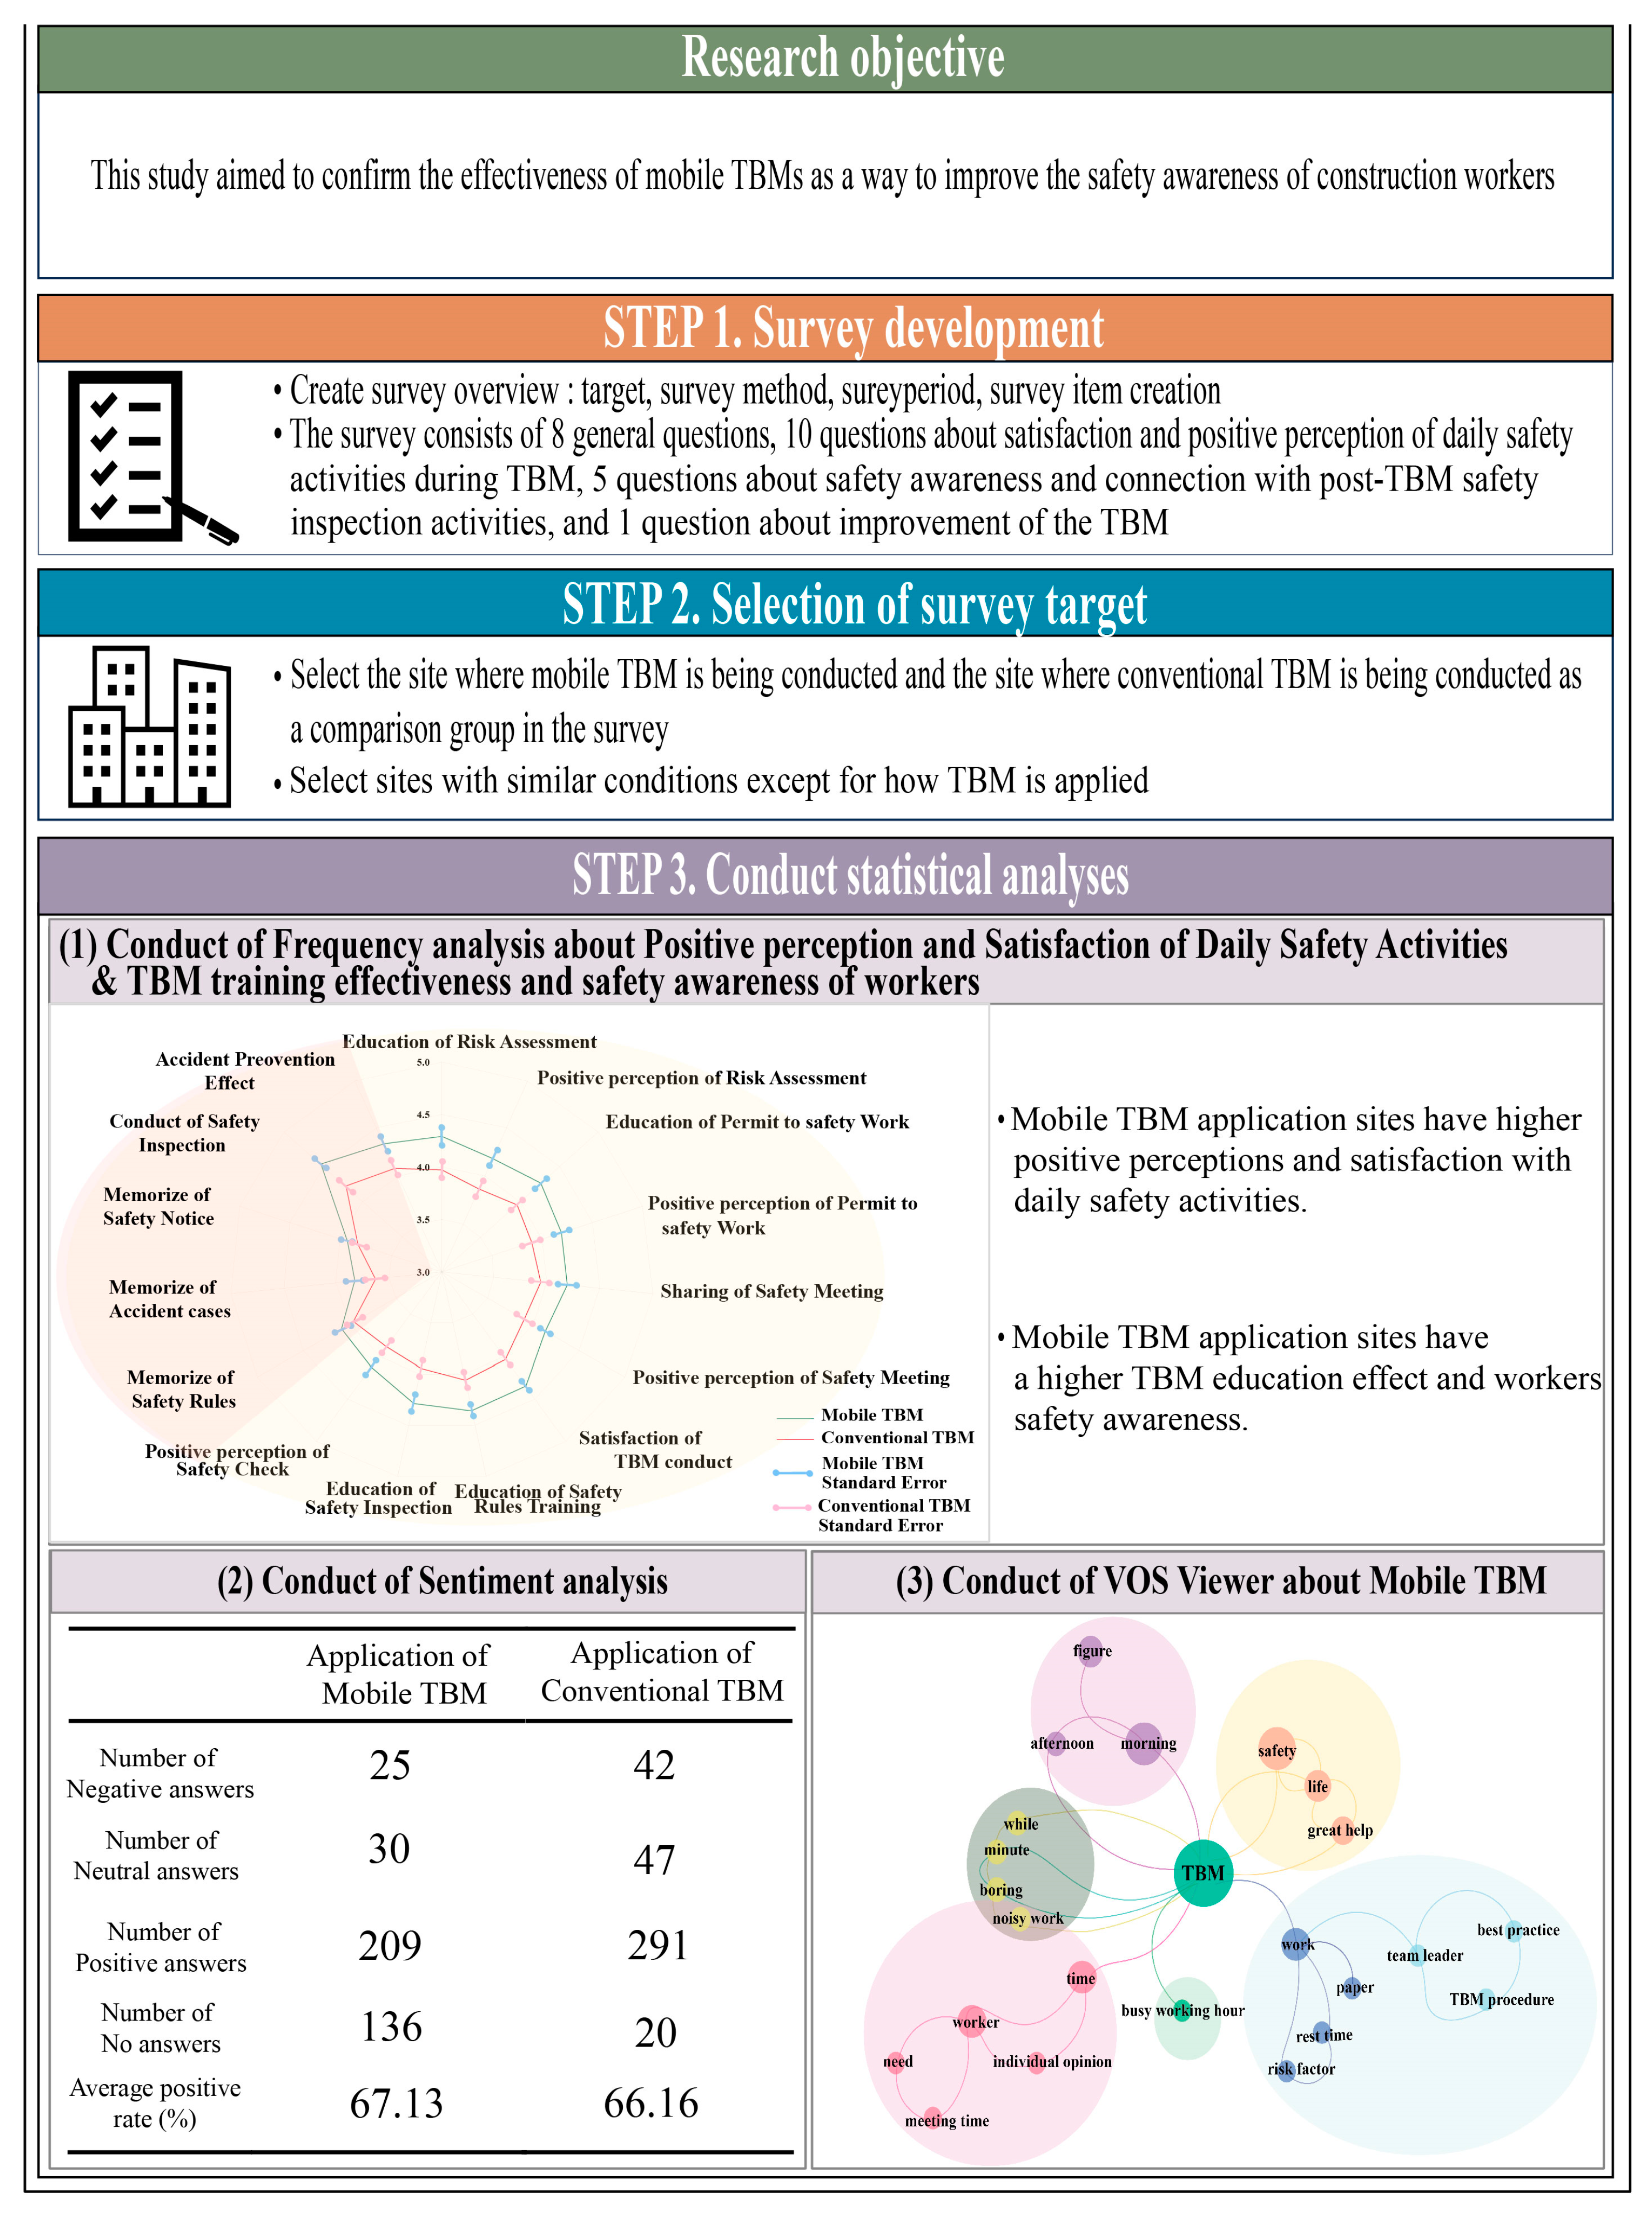
Figure 2 summarizes the research flow, which includes (i) survey development, (ii) survey target selection, and (iii) statistical analysis. For this analysis, we utilized four distinct statistical methods to evaluate the improvement in the safety awareness of workers and the efficacy of mobile TBMs compared to conventional TBMs.
3.2. Collection of Data
The respondents targeted in this survey consisted of supplier construction managers, team leaders, and workers. Surveys were distributed to 400 participants at each of the two sites, which implemented either mobile or conventional TBMs, for a total of 800 respondents. Of these, 74% of the respondents were workers, 12% were team leaders, and 14% were supplier construction managers. The survey, comprising 24 questions, was disseminated via a URL link. The survey was conducted during regular safety training sessions and took place during June and July of 2022.
The purpose of this survey was to compare the implementation methodologies for TBMs, the safety awareness of the workers, and the effectiveness of the safety training between sites that applied mobile and conventional TBMs. The questionnaire comprised 24 items across six sections: 3 items on general information, 4 on the appropriateness of TBM operations, 1 on the usability of smart devices, 10 on their satisfaction with daily safety activities and positive perception of TBMs, 5 on post-TBM safety inspection activities and safety awareness levels, and 1 on suggestions for potential improvements for TBMs. The items related to satisfaction, positive perception, safety inspection activities, and safety awareness were rated on a 5-point Likert scale [
21,
22]. The last item, regarding areas for TBM improvement, allowed respondents to provide subjective responses using keywords. In the analysis, a total of 21 items, specifically items 4–24, were considered, with general information items 1–3 excluded.
3.3. Selection of Survey Target
The two sites where the survey was conducted were both under the management of Company S, and they were industrial plant sites chosen as sites with similar conditions, except for the TBM progression method, as shown in
Table 2. These two sites were managed using the same safety management system, were primarily involved in machinery and equipment construction, and followed identical TBM procedures. At the site where conventional TBMs were implemented, a regular monthly training session was conducted for team leaders to educate them about the TBM procedures. Every morning at 7 a.m., all team members gathered for a safety briefing, followed by team-specific TBM meetings led by the team leaders. Therefore, the level of TBM execution at the site using conventional TBMs could vary depending on the team leader’s competence. At the site where mobile TBMs were implemented, a regular monthly training session was also conducted for team leaders, and morning briefings were held at 7 a.m., with teams gathering to conduct TBMs following the procedures provided by the mobile TBMs.
3.4. Statistical Analysis of Survey Results
In this study, a statistical analysis was conducted using SPSS 18. To ensure the accuracy of the survey responses, a reliability analysis was initially performed for each response. Subsequently, frequency analyses and
t-tests were conducted to analyze the differences in worker safety awareness and the effectiveness of the TBMs between the two survey groups. Finally, sentiment analyses and VOSViewer were employed to visualize the responses to the open-ended questions in the survey and identify improvement suggestions for TBMs.
Table 3 summarizes the results of the statistical analyses conducted for each survey item.
3.4.1. Reliability Analysis
A reliability analysis examines the consistency of a measurement tool or survey items in measuring [
24]. In this study, Cronbach’s Alpha was utilized as one of the methods for reliability analysis. Cronbach’s Alpha is a widely recognized approach for estimating internal consistency reliability, which allowed us to validate the reliability by estimating the internal consistency among individual items [
25]. Cronbach’s Alpha ranges between 0 and 1, with values closer to 1 indicating higher reliability. An Alpha coefficient of 0.6 or higher is generally considered acceptable. Cronbach’s Alpha can be calculated using the following formula:
Here, K represents the number of items, denotes the variance of the scores for the ith item, and signifies the variance of all the scores.
In this study, reliability analyses were conducted for survey items related to positive perception and satisfaction regarding daily safety activities, as well as items related to the effectiveness of TBM training and the safety awareness of workers. These analyses aimed to verify the consistency of the respondents’ responses.
3.4.2. Frequency Analysis
Frequency analysis is a method used to understand the distribution characteristics of each survey response [
26]. In this study, a frequency analysis was conducted to analyze the effectiveness of the TBMs by examining the proportions of responses from workers in the survey. Additionally, for the items using a 5-point Likert scale, a frequency analysis was used to calculate the means (M) for each of the two groups. Frequency analyses were performed for all the items to gain insights into the overall characteristics of the survey responses.
3.4.3. t-Test
A
t-test is one of the statistical hypothesis tests and is used to compare the means of two groups [
27]. In this study, an independent-sample
t-test was conducted to compare and analyze the differences in worker safety awareness and the effectiveness of TBMs between the sites with mobile and conventional TBMs to determine if there were significant differences between the two groups [
28].
3.4.4. Sentiment Analysis
Sentiment analysis is an analysis method that automatically classifies emotions in sentiment reviews using natural language processing or text analysis [
29]. Sentiment analysis involves identifying keywords during the preprocessing stage to emphasize the core message of the text. These keywords are then analyzed using natural language processing techniques to provide sentiment scores. A score close to 1 indicates a higher proportion of positive sentiment, while a score close to 0 suggests a closer association with negative sentiment [
30]. Sentiment analysis was applied to the short-answer question responses in the survey to assess the sentiment associated with the feedback from the participants.
3.4.5. VOSViewer
VOSViewer (version 1.6.19) is a software tool for constructing and visualizing networks, making it an excellent method for analyzing and visualizing desired data. And results showed the frequencies of keywords can be determined by their sizes. Additionally, clusters, which are categorized groups of keywords, can be identified by the colors of the keywords in the results, and the relationships between keywords are indicated by connecting lines [
31,
32]. In this study, VOSViewer was employed to perform text mining with a focus on keywords extracted from the short-answer question responses in the survey.
4. Results
This study aimed to investigate the effectiveness of mobile TBMs via a survey analysis, which was categorized into four major sections for statistical analyses. First, we conducted a statistical analysis on four survey items (q4–q7) from the perspective of the appropriateness of the TBM implementation. Second, we analyzed a total of 15 survey items (q9–q23) related to positive perceptions and satisfaction regarding daily safety activities, the effectiveness of TBM training, and the safety awareness of workers. Third, we examined workers’ perceptions of the use of mobile devices with one item (q8). Lastly, we analyzed and visualized the responses to an open-ended question (q24) to assess the positivity and areas of improvement for each type of TBM.
4.1. Results of Relating to the Appropriateness of TBM Operation
To assess the appropriateness of the TBM operations at the mobile and conventional TBM sites, this study conducted a survey and performed a frequency analysis. The frequency analysis was conducted for four general items, excluding q1–q3.
Figure 3 presents the results of the frequency analysis for these four general items. Each item is represented from (a) to (d), with the red bars indicating responses from the mobile TBM site and the blue bars representing responses from the conventional TBM site. The y-axis of each item indicates the number of respondents, while the x-axis represents the choices for each survey item.
In
Figure 3, the (a) panel presents that at both sites, the team leaders were the primary individuals responsible for TBMs, accounting for 73.3% of the responses. Notably, at the mobile TBM site, team leaders accounted for 83.5%, while at the conventional TBM site, the percentage of team leader-led TBMs was 63%, indicating a 20.5% higher prevalence at the mobile TBM site.
In
Figure 3, the (b) panel presents the number of individuals involved in TBM activities at both the mobile and conventional TBM sites; 5–10 people accounted for the highest percentage at 52.5%. Among these, the mobile TBM site had 74.25%, while the conventional TBM site had 30.75%, with the mobile TBM site showing a 43.5% higher rate. Additionally, at the conventional TBM site, the response of more than 20 people was more than 20%.
Figure 3, (c) panel presents the worker participation rates during TBMs. At both types of sites, the responses indicating that safety rules were always discussed during TBMs accounted for 60.3%. Notably, at the mobile TBM site, this response was 73.75%, whereas it was 46.75% at the conventional TBM site, indicating a 27.0% higher rate at the mobile TBM site.
Lastly, as shown in
Figure 3d, the frequency analysis results regarding the time taken for TBMs showed that at the mobile TBM site, 10–15 min was the most common duration at 49.75%. Conversely, at the conventional TBM site, 5–10 min was the most common duration at 50.5%.
4.2. Results of Positive Perception and Satisfaction with Daily Safety Activities and TBM Training Effectiveness and Safety Awareness of Workers
This survey assessed the positive perception and satisfaction with daily safety activities, as well as the effectiveness of the TBM training and safety awareness of workers at each site. Subsequently, we performed reliability analyses, frequency analyses, and t-tests.
Table 4 showed results of the reliability analysis results for the survey items related to positive perception and satisfaction with daily safety activities. The results yielded a Cronbach’s Alpha coefficient of 0.964, while the items related to the effectiveness of the TBM training and safety awareness of workers produced a coefficient of 0.752. Both coefficients exceeded the threshold of 0.6, confirming the consistency of the respondents’ answers.
As shown in
Figure 4, first, the yellow area on the right represents the questions on the positive perception and satisfaction with daily safety activities, while the red area on the left represents the questions on the effectiveness of the TBM training and safety awareness of workers. Secondly, the red radial graph signifies the average responses for each respective survey item for conventional TBMs, while the green radial graph represents the average responses for each respective survey item for mobile TBMs. Finally, light blue and pink bars on the graph represent the standard error for each item.
Table 5 presents the values corresponding to the graph in
Figure 4, indicating the average responses for each survey item across the application sites for both TBM types.
Overall, the analysis of the responses to the ten survey items related to positive perceptions and satisfaction with daily safety activities revealed that the site where mobile TBMs were implemented showed the result mean score was 4.24 compared to the site where conventional TBMs were applied showed the result mean score was 3.95. The results of the t-test analysis confirmed a significant difference between the two groups in their responses to the questions related to daily safety activities, with a p-value shown to be under 0.001.
Furthermore, in the responses to the five survey items regarding the TBM training effectiveness and safety awareness of workers, the result of the site that implemented mobile TBMs was 4.14, and the result of the site with conventional TBMs was 3.94. The t-test results indicated a significant difference between the two groups in their responses to these questions, with a p-value shown to be under 0.1.
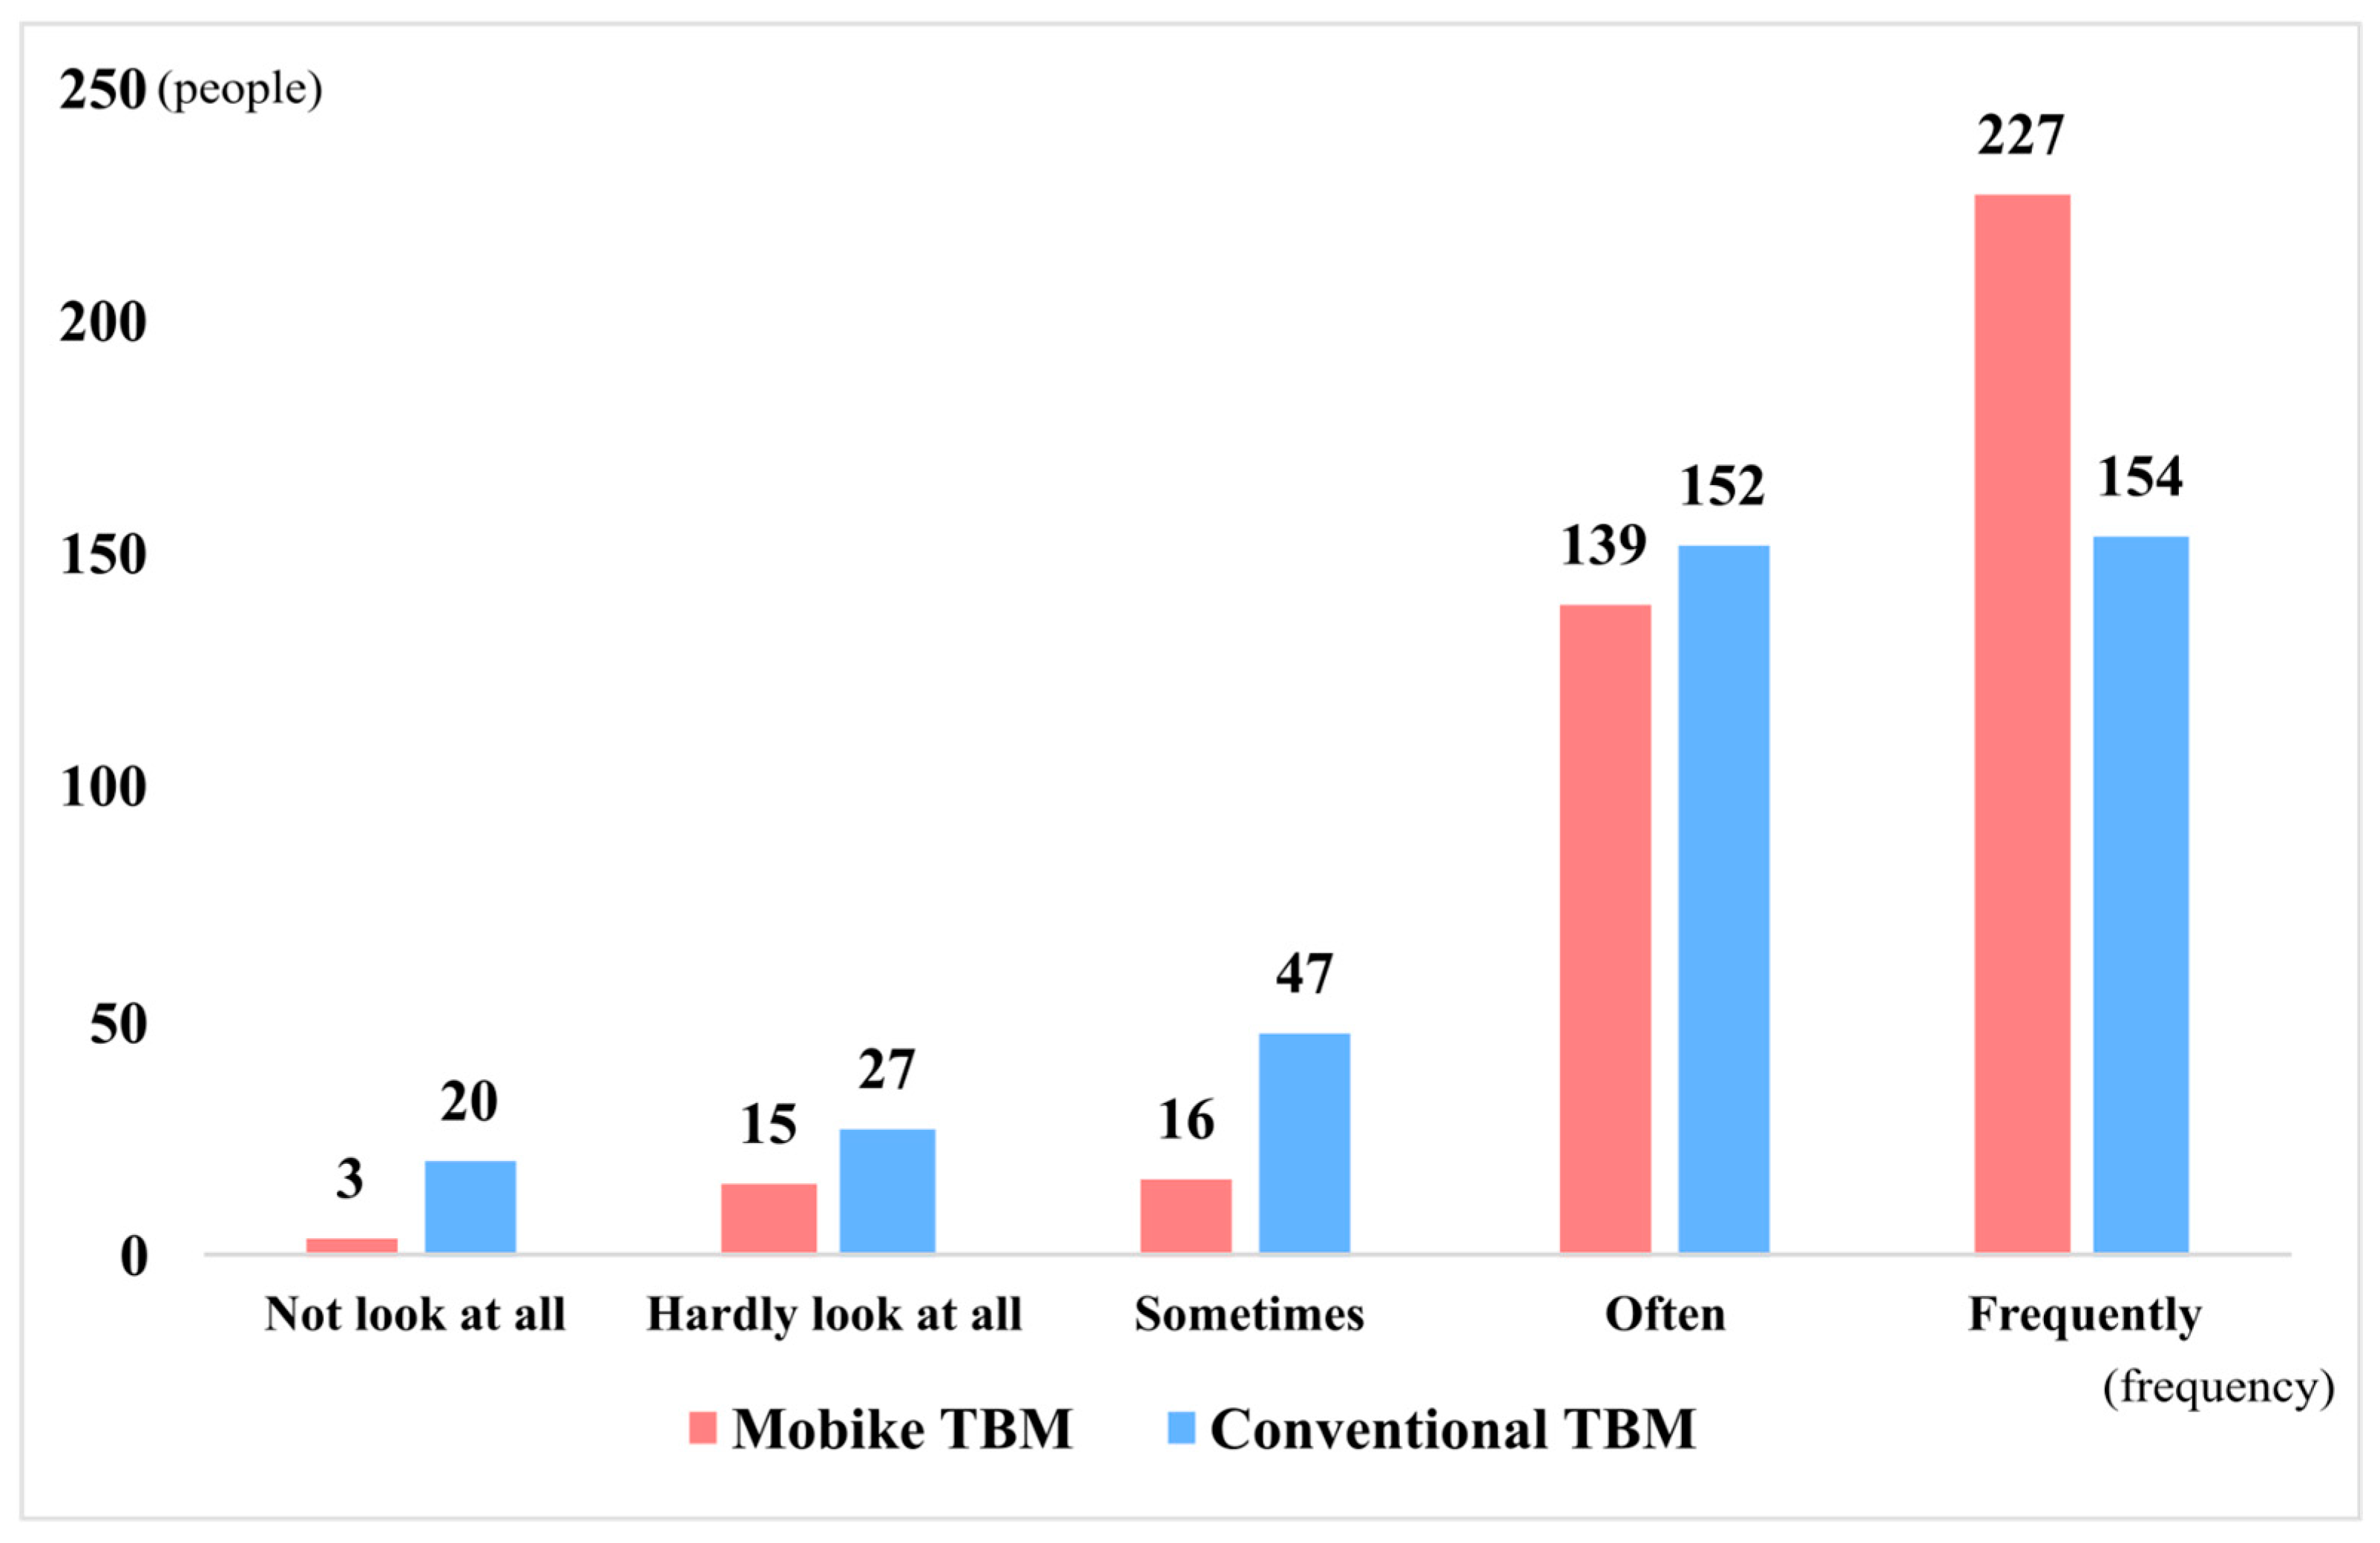
4.3. Results of Frequency of Use of Mobile Devices When Providing Safety Information
Figure 5 presents the results of the frequency analysis based on respondents’ feedback regarding their level of engagement when receiving safety information via smartphones. The results indicated a positive response, with 36.38% selecting “Often” and 47.63% choosing “Frequently”. In total, 84.01% of the respondents expressed a favorable inclination toward utilizing smartphones for safety information.
4.4. Results of Positive Rates and Improvements for TBMs
We performed a sentiment analysis and employed VOSViewer to assess and visually represent the open-ended question on improvement suggestions for both mobile and conventional TBMs.
As shown in
Table 6, the sentiment analysis revealed that 67.13% of the responses were positive for mobile TBMs, while 66.16% were positive for conventional TBMs.
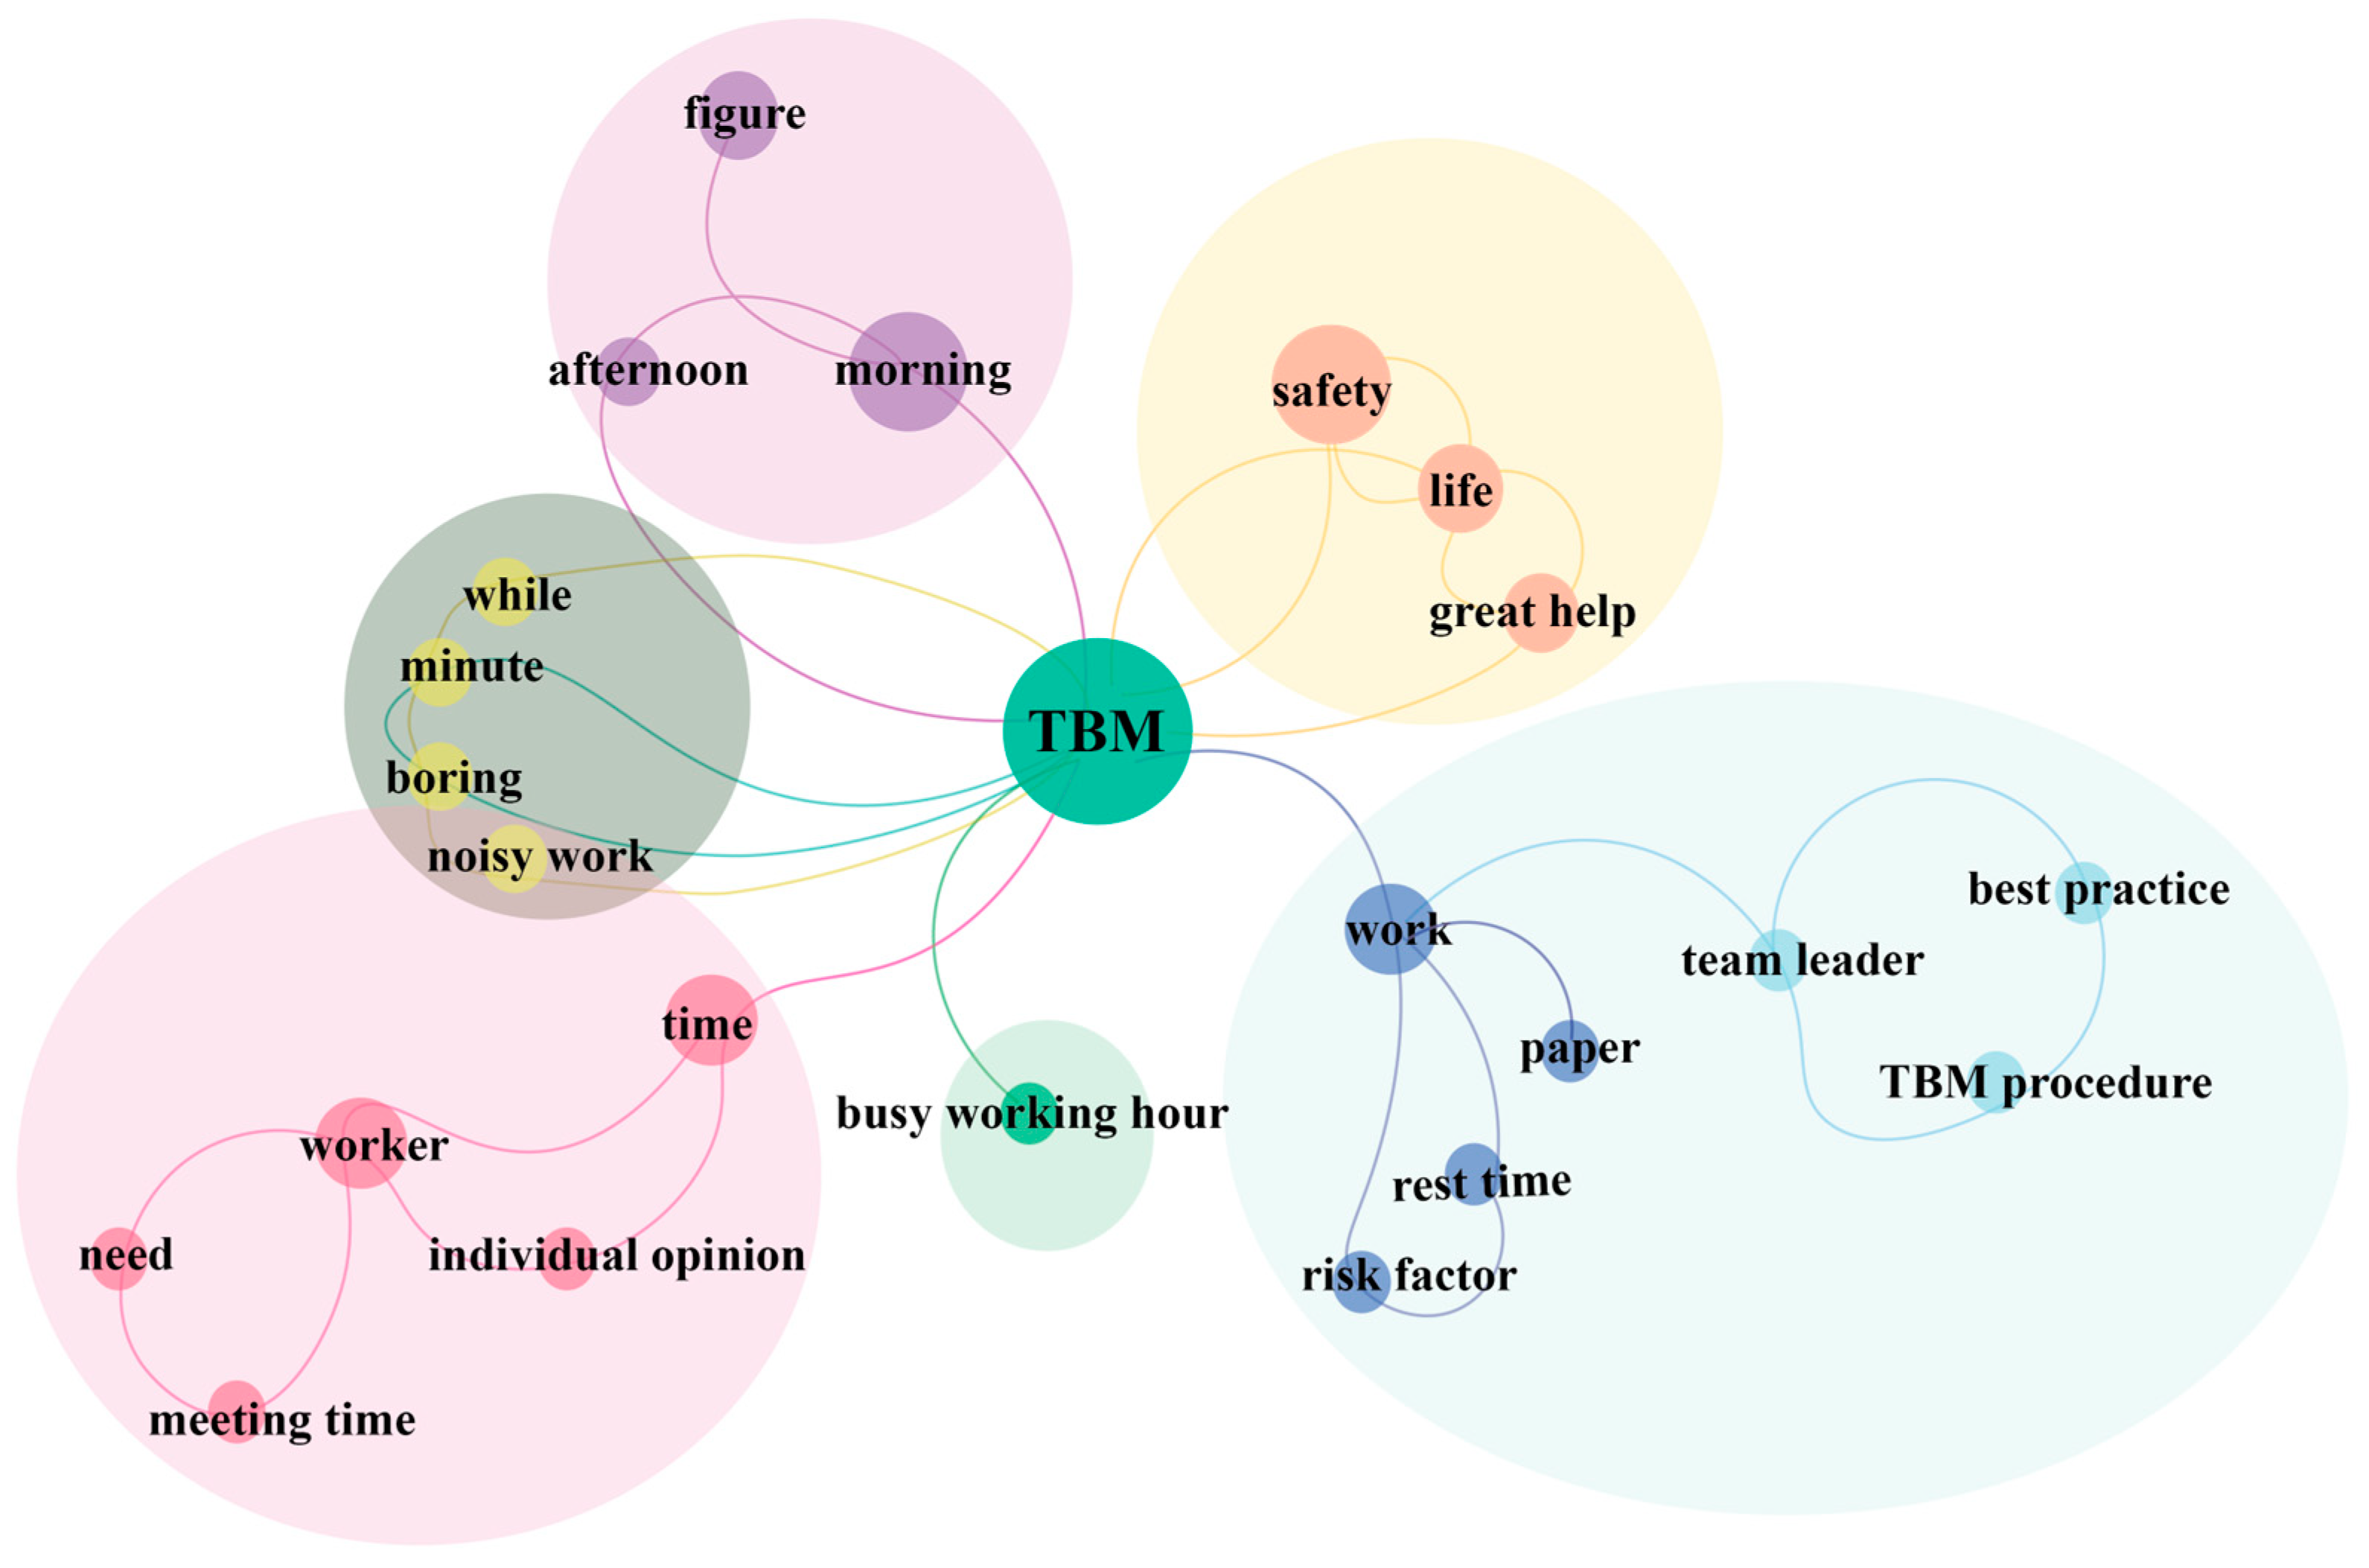
In
Figure 6, the results revealed the requests into six clusters based on color, indicating different categories of improvement suggestions. In
Figure 6, the red cluster highlights improvement requests related to time. The results of the VOSViewer analysis for improvement requests with conventional TBMs are presented in the
Supplementary Material (Figure S1).
5. Discussion
The following explanations are based on the analysis results related to the various aspects of the application of conventional and mobile TBMs. The analysis of survey responses revealed three key aspects related to the effectiveness of mobile TBMs.
First, according to the TBM guidelines provided by KOSHA, it is recommended that the TBM should be organized with a team leader at the center, and the ideal team size is 4–10 members. Moreover, Demirkesen and Arditi [
33] suggested that active worker participation in communication can reduce incidents and enhance safety awareness. Therefore, based on the analysis results presented in
Section 4.1, it can be inferred that the mobile TBMs followed the TBM guidelines set by KOSHA more than the conventional TBMs. Consequently, it can be concluded that operations at the mobile TBM site were better than those at the conventional TBM site.
Second, the analysis of the responses regarding positive perception and satisfaction related to daily safety activities conducted during TBMs revealed that the site where mobile TBMs were implemented showed a higher degree of positivity compared to the site where conventional TBMs were conducted. Consequently, coordinating mobile TBMs with daily safety activities should boost workers’ positive perceptions. Furthermore, this integration is expected to have a positive impact on the safety awareness and safety culture of workers.
Finally, the analysis revealed that the mobile TBM site had higher levels of TBM training effectiveness and individual safety awareness compared to the conventional TBM site. This suggests that mobile TBMs can contribute to the establishment of a safety culture where workers autonomously adhere to safety rules.
Additionally, an analysis of the open-ended responses revealed specific improvement suggestions for both types of TBMs. At the conventional TBM site, there were frequent requests to conduct TBMs by teams because of excessive participant numbers and suggestions to create manuals for TBM procedures. On the other hand, participants at the mobile TBM site expressed the need to address communication issues related to mobile device signal quality and the extended duration of TBMs. Both sites shared concerns about the limited space for TBM implementation. Consequently, addressing the improvement needs of mobile TBMs should involve enhancing the communication infrastructure and streamlining safety training topics to address communication issues and reduce time consumption. Notably, one of the reasons a mobile TBM takes longer than a conventional TBM is that, in a conventional TBM, the procedure can be streamlined or omitted based on the team leader’s preferences. However, given the inherent characteristics of a mobile TBM, such an omission or simplification is not possible. As it necessitates adherence to predetermined procedures, conducting a mobile TBM is considered to require more time.
6. Conclusions
Because of the inherent risks associated with the construction industry, it is crucial to reduce accidents via worker collaboration and improving individual safety awareness. TBMs are held before work at construction sites to encompass activities such as sharing tasks and enhancing safety awareness among workers. However, there are limitations to conventional TBMs because they are often conducted informally and lack systematic preparation, making them less structured. To address these limitations, this study aimed to examine the effectiveness of mobile-based TBMs in enhancing safety awareness among construction workers as a means of improving safety on construction sites. The study collected and analyzed data related to TBMs in the construction industry, developed survey questions, conducted surveys among relevant participants, and analyzed the responses. The study’s findings can be summarized in three main points.
First, the survey analysis indicated that mobile TBMs are more properly conducted than conventional TBMs in terms of key facilitators, the number of participants in TBM activities, and individual opinions voiced.
Second, the site employing mobile TBMs had higher levels of positive perception and satisfaction regarding daily safety activities (M = 4.24) compared to the site using conventional TBMs (M = 3.95).
Third, the site utilizing mobile TBMs reported higher scores in TBM training effectiveness and the safety awareness of workers (M = 4.14) compared to the site implementing conventional TBMs (M = 3.94).
The contribution of this study lies in its alignment with the growing trend of emphasizing smart safety management. This study suggested that improving TBM activities initiated by workers can help establish autonomous safety management systems and cultures, ultimately enhancing safety management standards. Moreover, the study confirmed that mobile TBMs are more effective in terms of the safety awareness of workers and TBM effectiveness compared to conventional TBMs.
To implicate this study, safety managers and decision-makers at construction sites can use this study as a reference when considering the adoption of smart safety management tools such as mobile TBMs. Notably, this study was distinct from previous research because it surveyed both workers and managers, providing evidence of the practicality of mobile TBMs.
However, this study had several limitations. Despite selecting sites with the most similar conditions possible for comparison, various complex factors, such as site conditions, TBM facilitators and managers, individual worker competencies, and the level of the site’s safety management system, were not fully considered.
Further research will solve the communication errors of mobile TBM by improving the limitations of mobile communication networks at construction sites. Secondly, further research will suggest ways to improve workers’ safety awareness by finding ways to communicate more actively between workers in the mobile TBM process.


