Abstract
Laminated glass (LG) windows significantly enhance building safety due to their ability to retain shattered glass within the interlayer, but their susceptibility to failure under blast loading remains a concern. Compared with simplified models, detailed constitutive modeling is essential to evaluate these complex scenarios, as experimental investigation faces limitations in spatial and temporal resolutions. This study presents a robust model-based simulation approach for predicting the brittle failure response of glass in blast-resistant LG windows. An elasto-damage relation for glass (EDG) was integrated with the finite element model (FEM) to predict the blast response. Validation against shock tube testing results was performed to ensure the reliability of the FEM. Material parameters for the polymeric interlayer were obtained through dynamic experiments, enabling a reasonable representation of its constitutive behavior using the Johnson–Cook (JC) model. Additionally, a numerical parametric study was conducted to investigate how different glass types influence blast resistance performance. Tempered glass stood out for its blast resistance compared with annealed and heat-strengthened glass, displaying superior strength against blast loads. The Rankine-based elasto-damage description provides a more precise representation of the failure response than commonly used approaches. These findings contribute to advancing model-based simulation approaches for designing better blast-resistant LG windows, ensuring safer buildings.
1. Introduction
Blast loads can cause significant damage, posing a threat to the safety of occupants if the structural components of a building fail to provide adequate protection [1,2]. In response to this challenge, laminated glass (LG) windows have gained popularity as a major structural component in high-rise buildings, airports, government facilities, and other structures that require a high level of security [3,4,5,6]. Unlike traditional glass windows, LG windows offer enhanced protection during major failure events [7,8,9]. They are specifically designed to withstand breakage and prevent the release of glass shards when subjected to impact or blast loads.
The design of LG windows involves sandwiching polymeric interlayers between multiple layers of glass. These interlayers serve as a bonding agent, effectively preventing the glass from shattering and dispersing upon failure and providing additional resistance through the membrane resistance of the polymer interlayer [3,10,11,12,13,14,15]. Various materials can be used to create these interlayers, including polyvinyl butyral (PVB), ionoplast, or thermoplastic polyurethane (TPU). The choice of interlayer material allows for different levels of protection to be achieved [5,16,17,18]. However, there are other failure modes that can still pose a danger to the surrounding environment when windows are subjected to extreme loading conditions, such as blast loading. Therefore, it is important for researchers to investigate the panel failure response under blast loading.
In a general blast loading event, there are two phases in the blast load history: a positive phase and a negative phase [19,20,21]. Although the positive phase of the blast load is usually more powerful and can cause severe damage, the negative phase should not be ignored when designing structures [22,23,24]. In fact, the negative phase can have a significant impact on the dynamic behavior of glass panels and might cause the glazing system to be driven outward. Also, the negative phase has a smaller amplitude, which can still create significant forces that must be resisted by the anchoring system [25,26].
Experimental studies have been conducted using different approaches to evaluate the behavior of LG panels under blast loads. One of the most common methods is the use of field tests, where actual LG windows are subjected to live blast loads to assess their performance. Additionally, shock tube tests have been employed to simulate blast loads on LG samples in a controlled laboratory setting. For example, Meyers et al. conducted shock tube testing on monolithic tempered glass windows of various shapes and sizes, recording air pressures in the chamber that lasted over 150 ms, which exceeded the scope of blast waves from high explosives [27]. Weissman et al. carried out field blast tests on monolithic annealed glass windows, assessing the performance of window frames made of wood and aluminum when arranged either face-on or side-on in the direction of the blast waves [28]. They proposed empirical design criteria based on the maximum overpressure capacity of the glass pane obtained in the blast tests, reporting the peak reflected pressure and glass failure state but failing to document other details, such as pressure time history and glass pane response history. Ge et al. conducted field blast tests on monolithic annealed glass windows to investigate fragment behavior [29]. Larcher et al. evaluated the response of an LG panel consisting of two layers of heat-strengthened glass and a PVB interlayer using a shock tube [30]. The results were then used to validate their numerical model. Similarly, Hooper et al. conducted a full-scale open-air blast test on PVB laminated glass and obtained deformation and shape measurements using high-speed digital image correlation [31].
Zhang et al. performed full-scale blast tests on monolithic tempered glass windows, using high-resolution high-speed cameras to monitor the glass window deformation-to-fracture processes in detail [32]. Wang et al. conducted experiments to investigate the response and blast-resistant capacity of laminated glass windows through both laboratory and field blasting tests [33]. The study evaluated the accuracy of design standards and the equivalent single-degree-of-freedom (SDOF) analysis, finding that the commonly used SDOF models underestimate glass panel responses. They suggested that detailed numerical simulations could yield more accurate pressure–impulse (P–I) diagrams and the numerical model should consider the pulling-out failure of the glass pane from its support. Bedon et al. (2018) conducted a comprehensive review into the performance of structural glass facades under extreme loads, addressing the design, research, issues, and trends [34]. They emphasized the vulnerability of glass due to its low tensile strength and brittle behavior, highlighting the need for fail-safe design criteria. The study underscores the lack of specific regulations for glazing facades and the insufficient focus on the structural capacity of building envelopes. The authors note increasing research interest, but stress the necessity for further efforts to establish comprehensive safety rules. The paper’s discussion on laminated glass behavior under blast loading and the challenges in numerical modeling contributes to our understanding of safety and resilience in extreme conditions.
Momeni and Bedon, in their 2023 paper, conducted a thorough exploration of the dynamic behavior of glass curtain wall systems, considering seismic, wind, blast, and impact loads [35]. Emphasizing the need for meticulous design, advanced materials, and rigorous testing to ensure the structural integrity and safety of these architectural features, the authors highlighted the significance of design standards and codes, providing essential guidance for engineers. Advocating for finite element analysis, they offered a cost-effective means to simulate and optimize system behavior. The paper underscores a multidisciplinary approach, combining structural engineering, material science, and architectural design to enhance resilience against dynamic challenges. Addressing glass material vulnerabilities, the study provides valuable insights for architects and engineers, positioning it as a crucial resource for optimizing the performance of glass curtain wall structures.
Due to the high cost of conducting blast tests and the negative impact on the environment, it is challenging to perform many tests to systematically evaluate the performance of laminated glass panels. Also, extrapolating the results obtained from these tests to other scenarios may not provide a reliable assessment of their blast-resistant capacity. The use of commercial software, like ANSYS 2022 R2 and Abaqus 2020, has been proven to accurately model different structures under varying loads [36]. Therefore, researchers have widely adopted numerical methods, which have been validated against available experimental data, to evaluate the performance of laminated glass panels. Larcher et al. examined the behavior of three models, including a solid element model, shell element model, and smeared model, and determined that the solid element model provided the most reasonable results [30]. Hooper et al. created a shell element model, in which the stiffness of the glass layer was set to zero after fracture, which produced results that were comparable to experimental results [37]. Zhang et al. investigated the failure mechanisms of laminated window systems using FE simulations and discovered that boundary conditions could have a significant impact on their behavior [38]. El-Sisi et al. (2023) investigated laminated glass (LG) dynamics, highlighting their efficacy in mitigating injury risks, particularly in explosive scenarios [39]. Their finite element models accurately predicted the resistance function, offering insights into glass and interlayer types. Explicit models excel in resolution, whereas implicit calculations maintain accuracy with faster processing times. The Ionoplast SentryGlas® interlayers have demonstrated superior strength, and increasing interlayer thickness enhances LG resistance. Hybrid interlayers maximize strength and bonding in a cost-effective manner. The study concluded that glass type minimally affects double-layer glass failure, but increasing thickness and stiffness enhance resistance.
The novelty of this work lies in its distinctive approach to modeling the failure response of laminated glass (LG) panels. Rather than conforming to the conventional use of the von Mises elastoplasticity criterion, as commonly found in the related literature, the authors introduced a fresh perspective by adopting the Rankine failure criterion for damage evolution. Importantly, the primary objective was not to directly compare the accuracy of the Rankine failure criterion to that of the von Mises criterion in modeling glass failure. Instead, the emphasis was on revealing the limitations of existing codes, such as Abaqus or ANSYS, where the failure criterion is typically formulated using the equivalent stress of elastoplasticity. Accordingly, the authors developed an elasto-damage glass (EDG) model subroutine based on the Rankine failure criterion to predict brittle failure in the glass layer of LG panels.
The primary objective of this paper was to employ FEM to evaluate the failure response of LG panels under blast loads. To accomplish this goal, the numerical model was validated using available shock tube tests on LG windows, which were exposed to various blast pressure levels [40]. The numerical model incorporates an elasto-damage formulation to quantitatively capture the brittle behavior associated with glass failure. To implement this model, the virtual user material subroutine (VUMAT) was integrated into the Abaqus software 2020 package. This enabled the simulation of glass failure within the LG window system. Additionally, a parametric study was conducted to explore the effect of different glass types on the system response. This investigation provides insights into how the choice of glass material affects the performance and behavior of LG windows under blast loads.
2. Experimental Work
In this section, we present the dynamic material characterization of the PVB interlayer using a drop-weight machine. Additionally, the shock tube tests used to validate the numerical modeling of the LG panels under blast loads are discussed.
2.1. Material Characterization
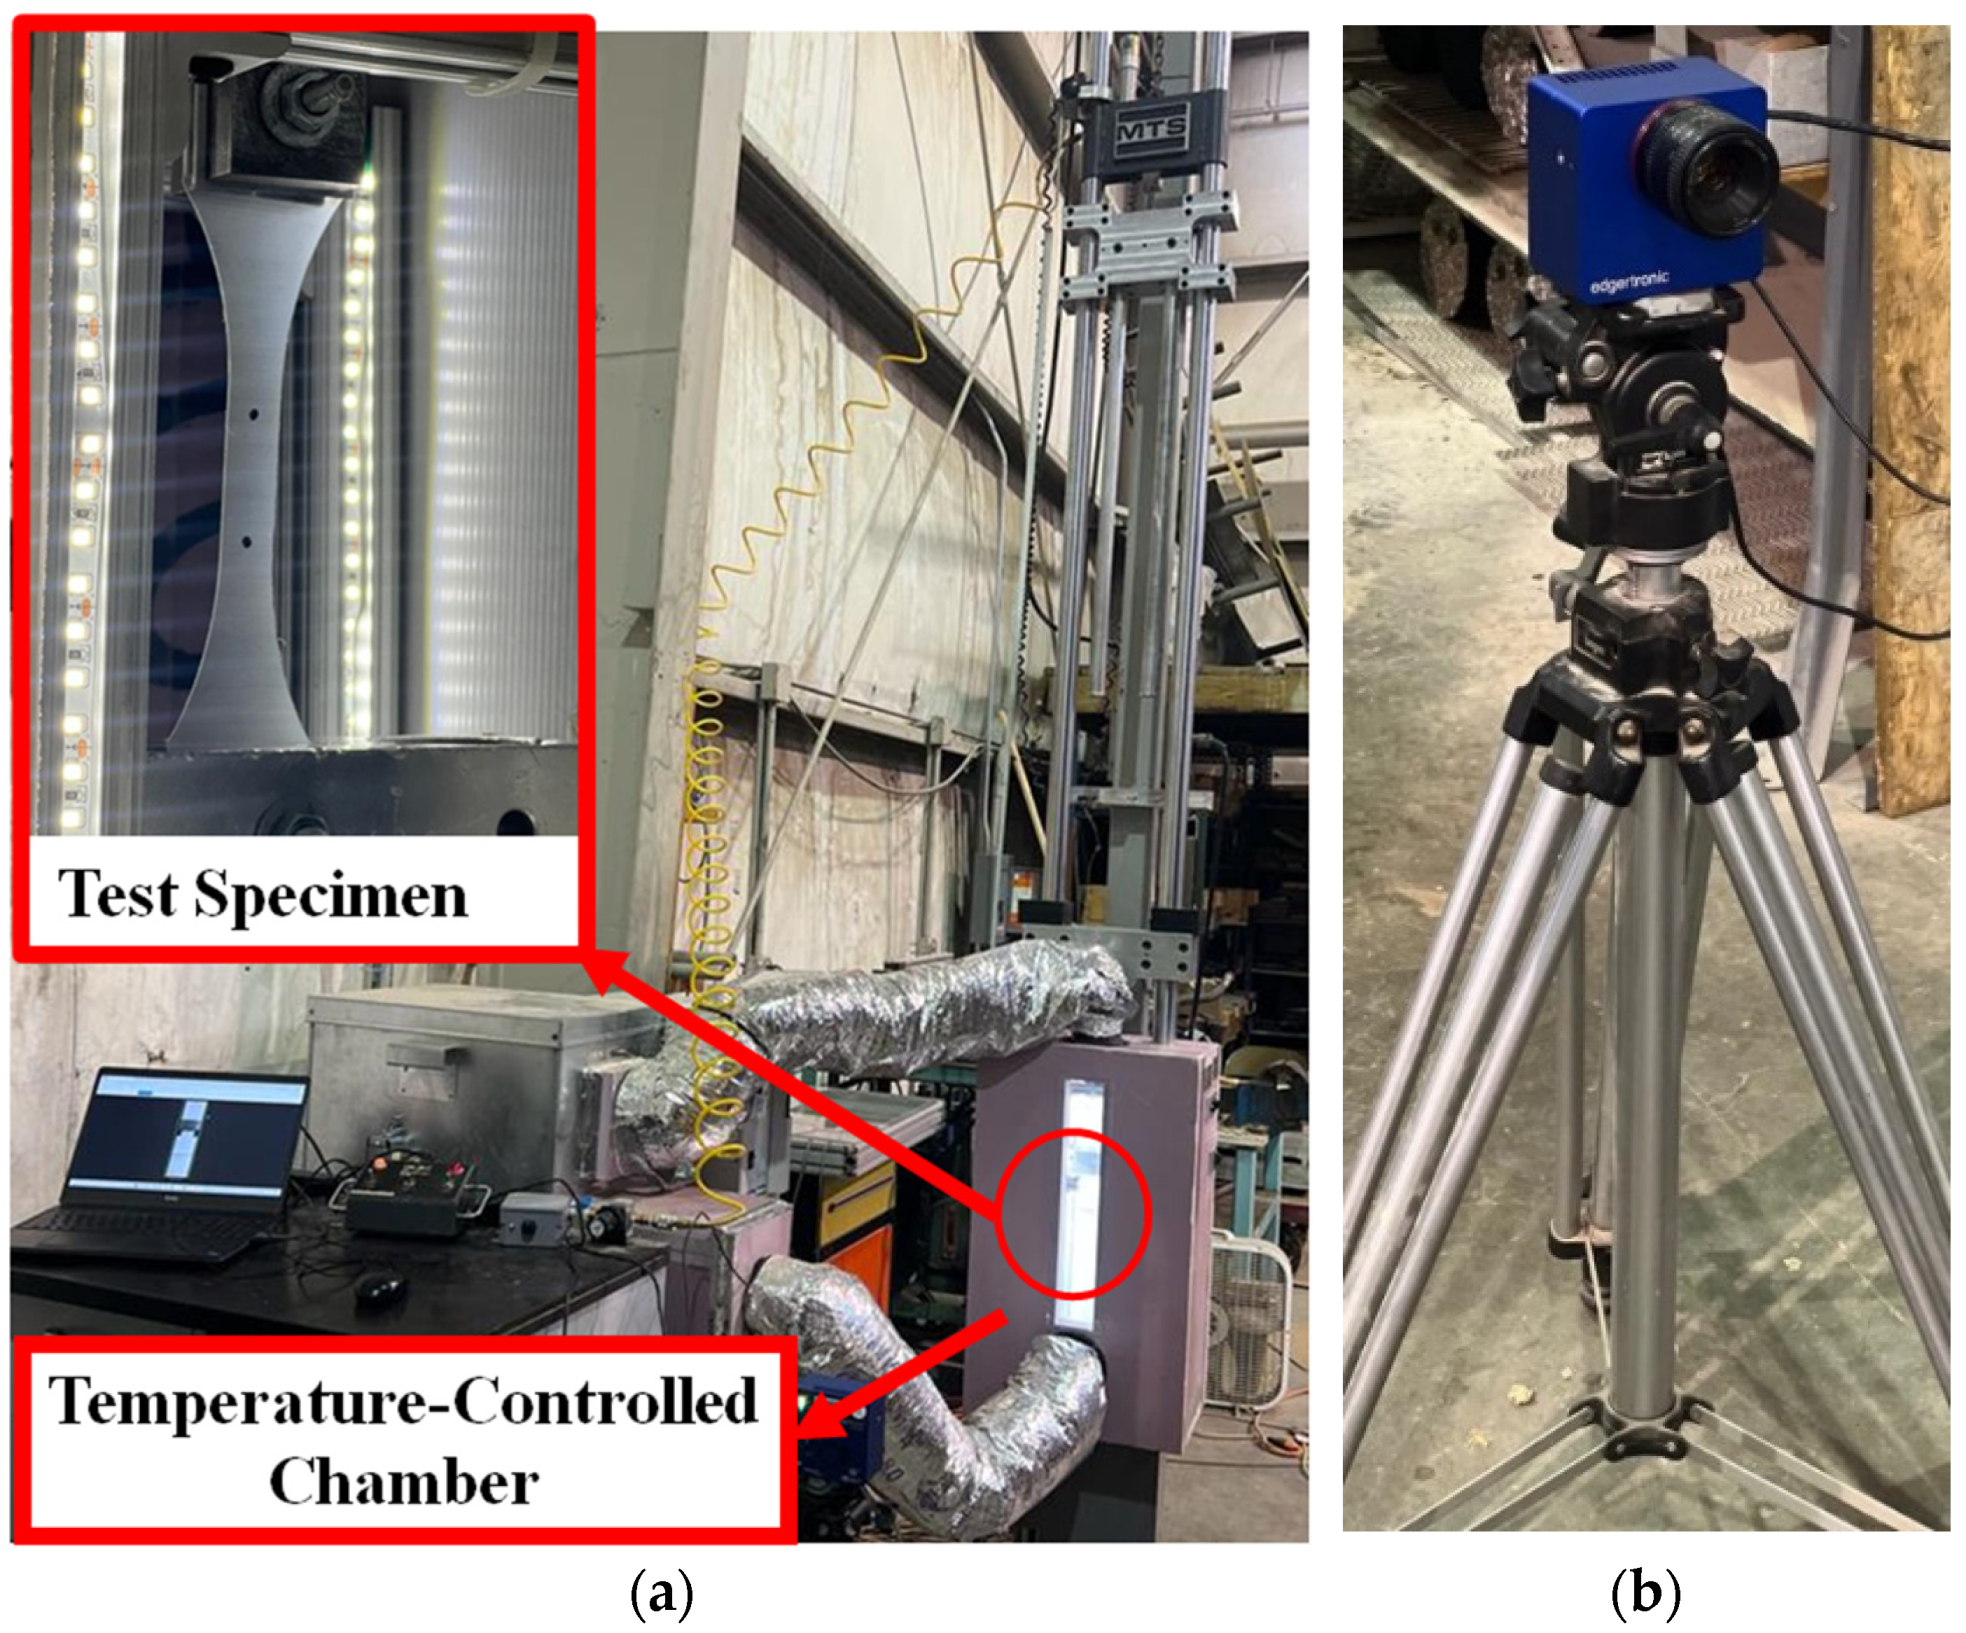
In this study, the dynamic response of the PVB interlayer at high strain rates was evaluated through dynamic tensile testing using a drop-weight device, as depicted in Figure 1a. The primary objective of this test was to obtain the stress–strain response of the PVB interlayer. Subsequently, the parameters of the Johnson–Cook (JC) constitutive model, which were incorporated into the FEM, were determined based on these results.

Figure 1.
Experimental evaluation of interlayer coupons: (a) drop-weight machine and (b) high-speed camera.
To measure the load during the tests, a piezoelectric load cell was employed, capturing data at a rate of 3000 points per second. The engineering stress was then calculated by dividing the load by the initial cross-sectional area within the gauge length region of the specimen. To track the elongation of the specimen, a high-speed camera (Figure 1b), at a rate of 3000 frames per second, was utilized. Load history was used to compute the maximum stress (σmax) and failure strain (εf) for the specimens tested. Young’s modulus (E) was determined by calculating the slope of the initial linear region observed in the stress–strain curves. Additional details regarding the dynamic testing of interlayer materials using the drop-weight machine can be found in [4,5,16].
To increase the bonding area to avoid any tearing of the specimens at the grips between the specimen and the aluminum tabs, a modified ASTM sample geometry [4] was tested. Some of the dimensions of the Type I standard specimen (ASTM D63810 2010) [41] were altered, as depicted in Figure 2.
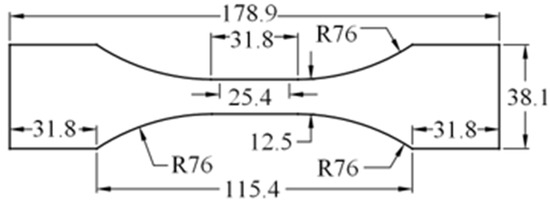
Figure 2.
Dynamic specimen geometry (dimensions are in mm).
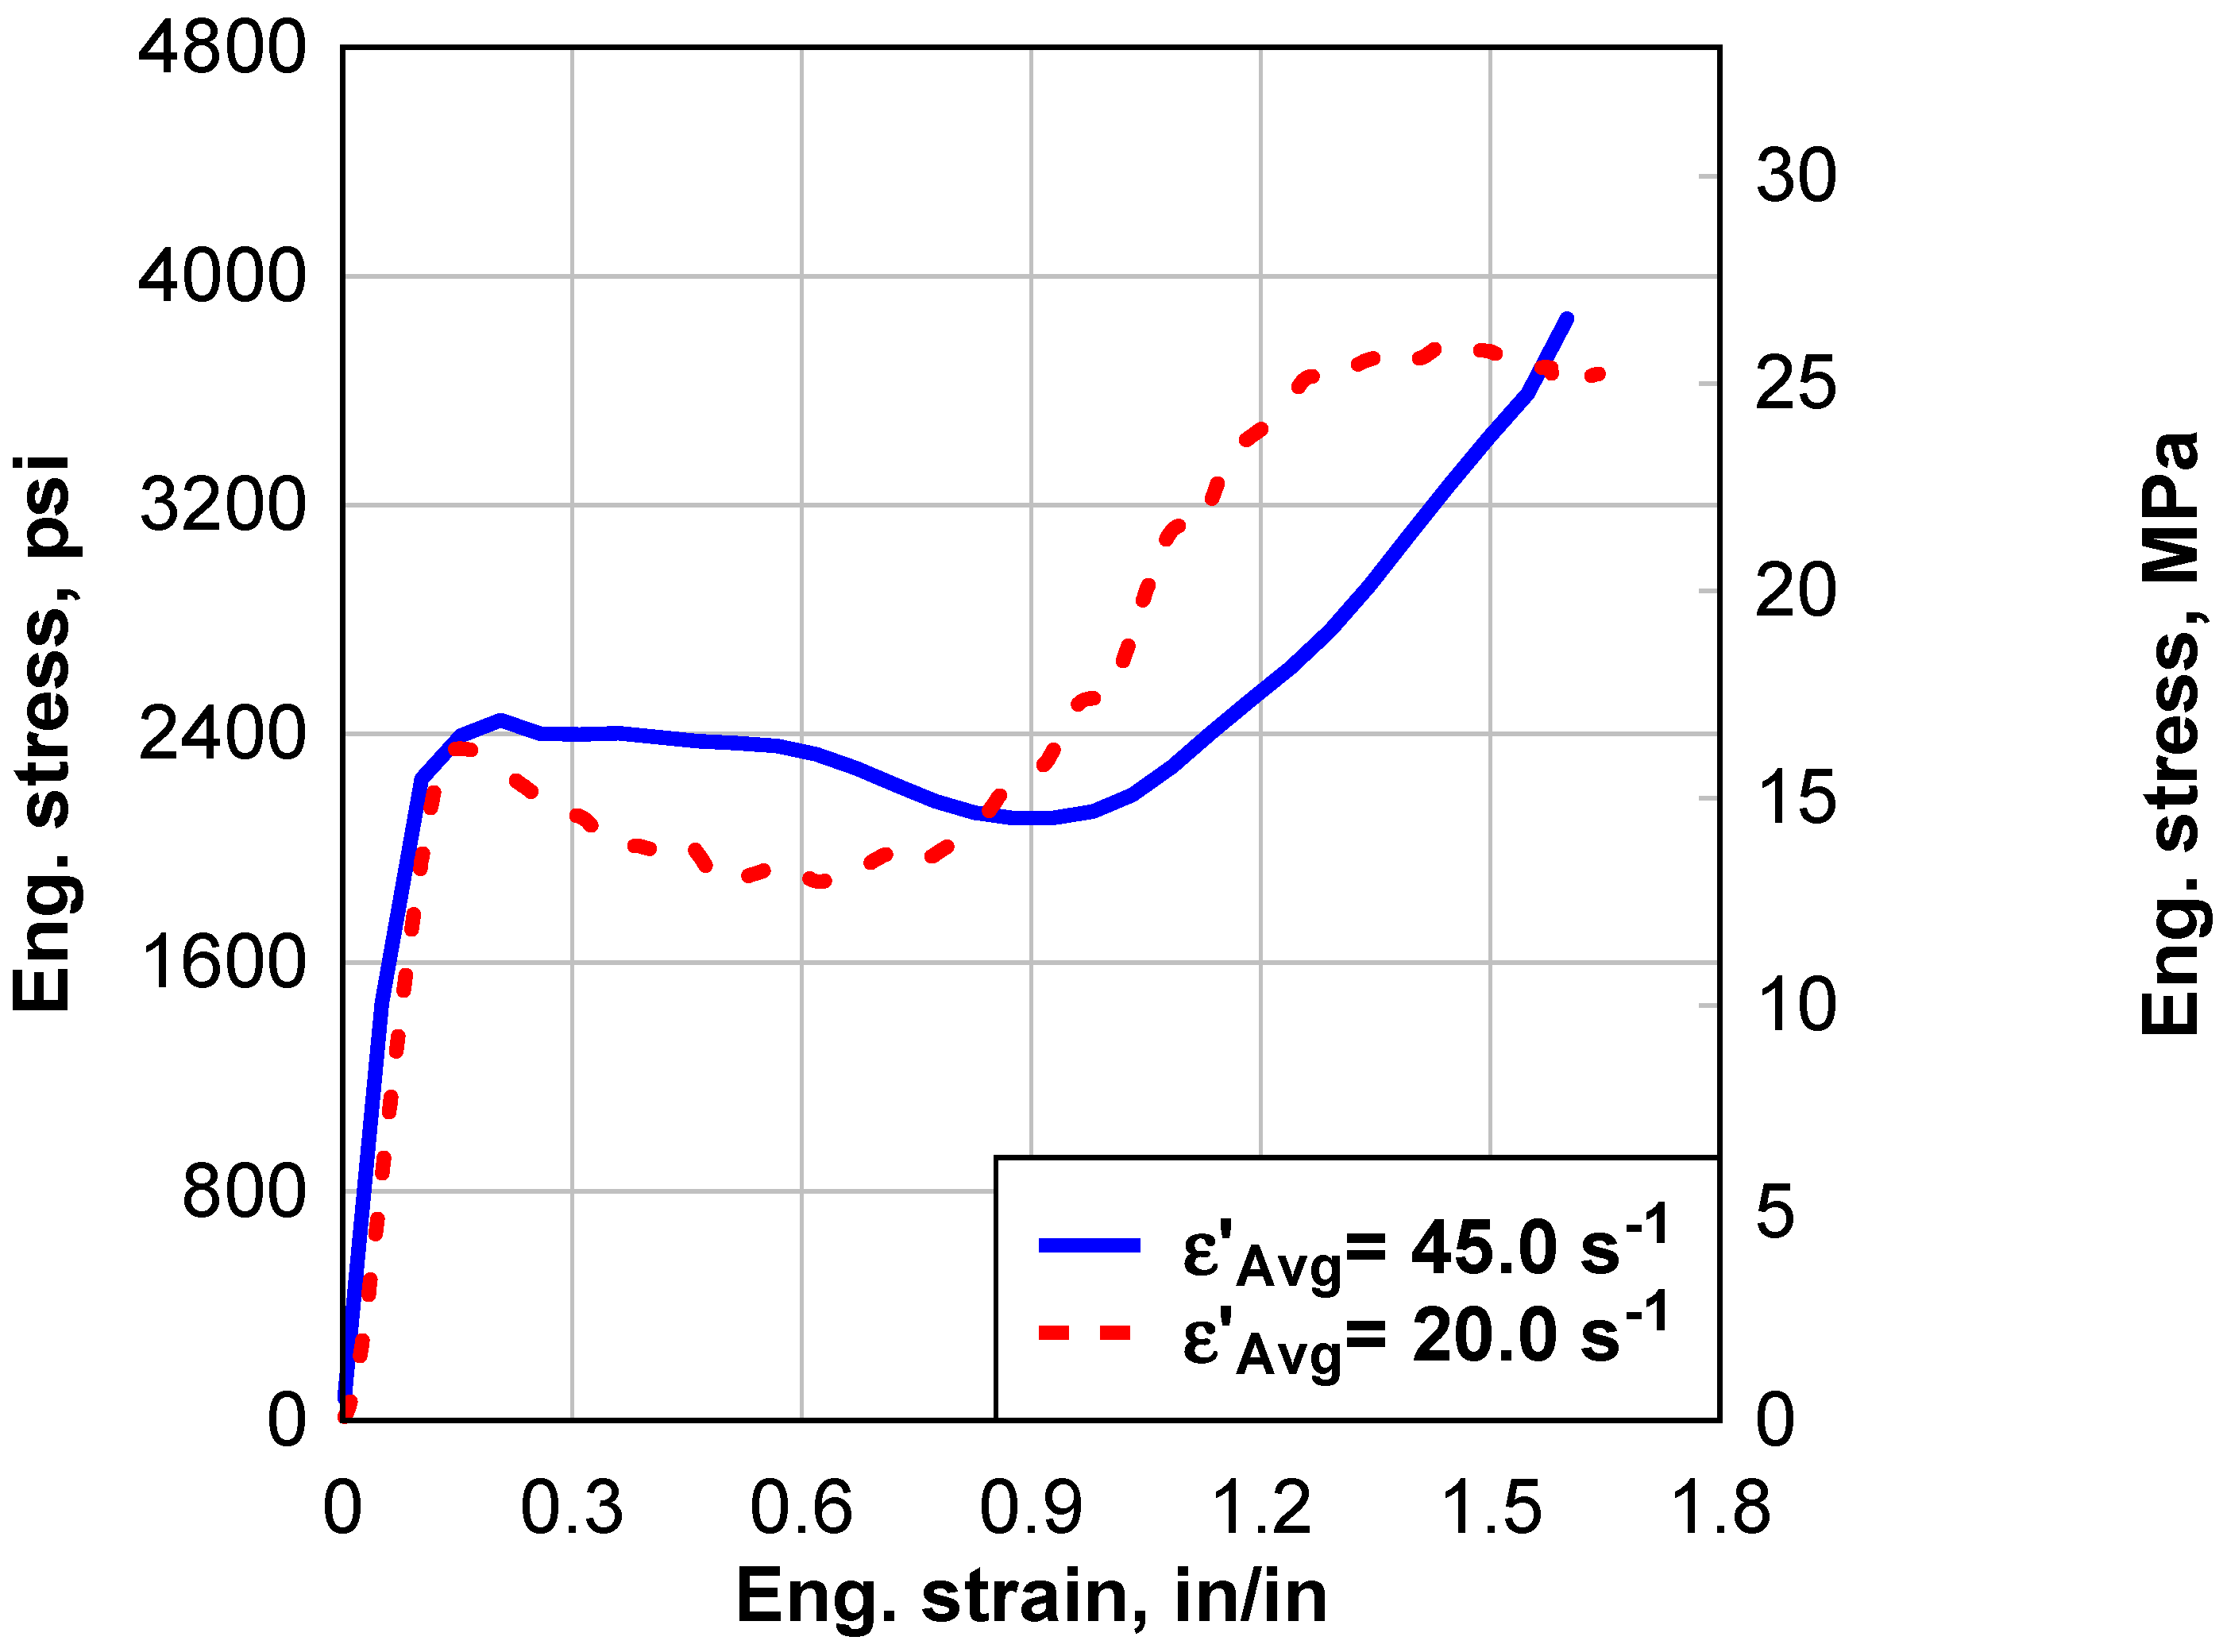
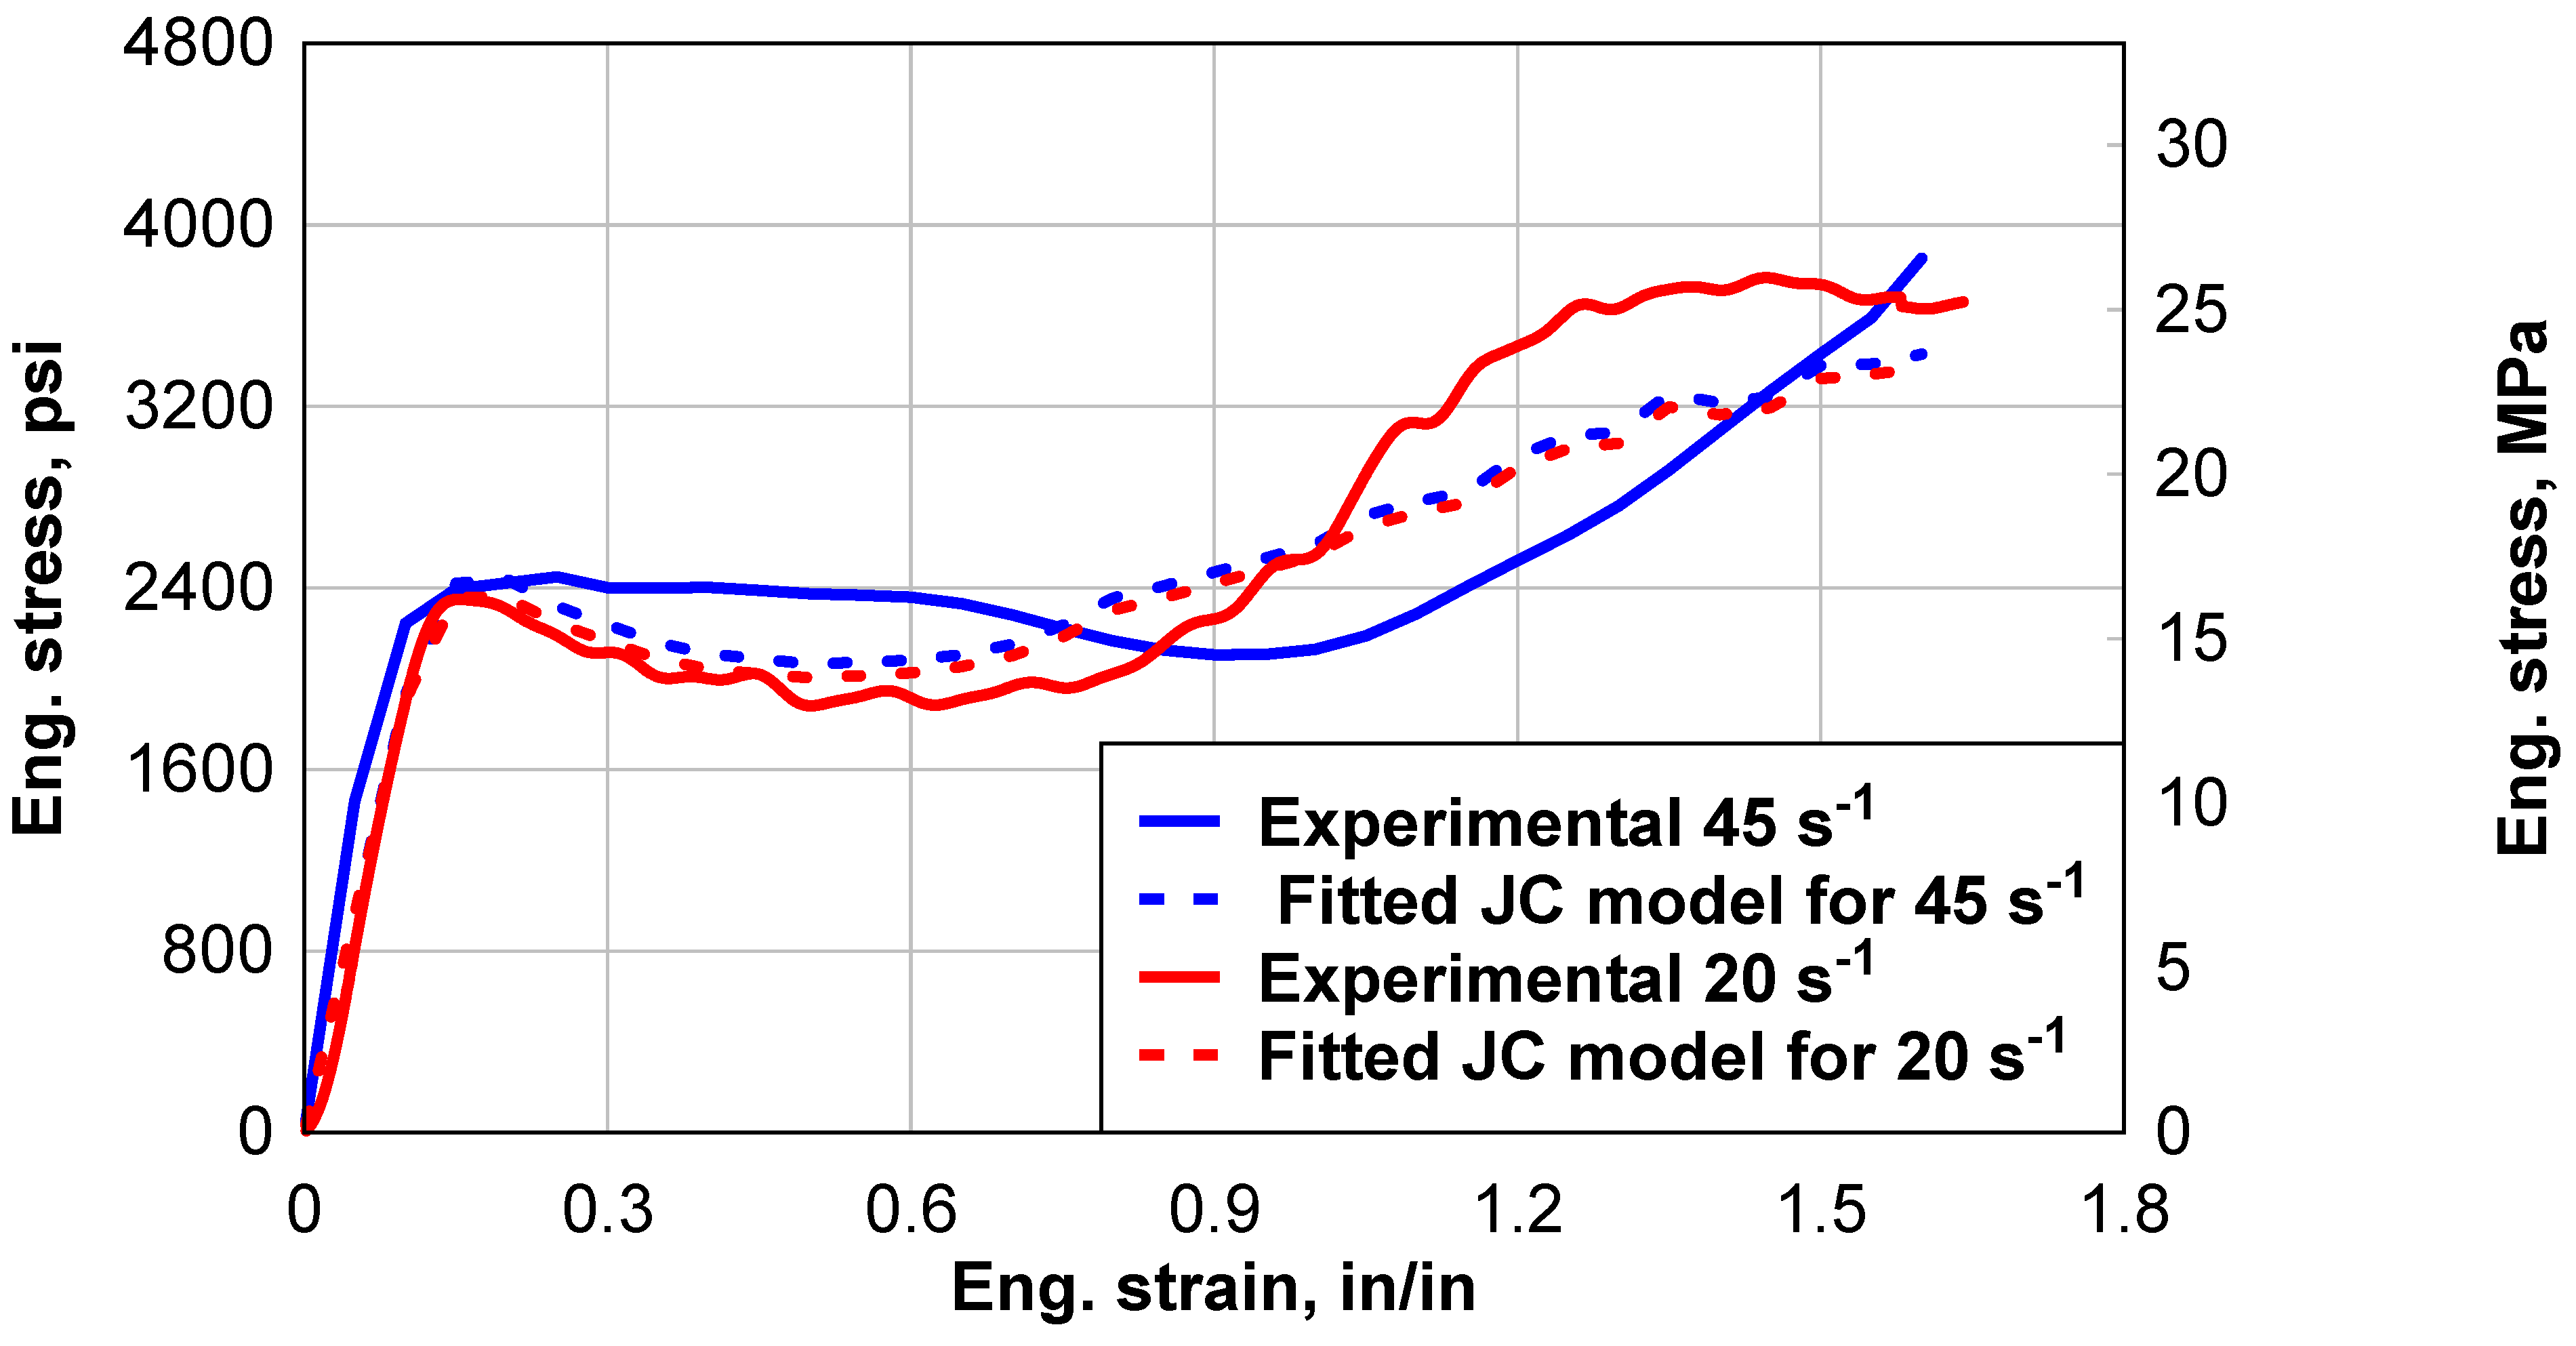
The experimental testing involved two groups, each consisting of three specimens, with each group targeting a different strain rate. The specimens used in both groups had a uniform thickness of 0.762 mm (0.03 inches). The first group was tested at a strain rate of 45 s−1, whereas the second group was tested at a strain rate of 20 s−1. This allowed for comparative analysis of the PVB interlayer’s response under different strain rate conditions.
2.2. Shock Tube Testing
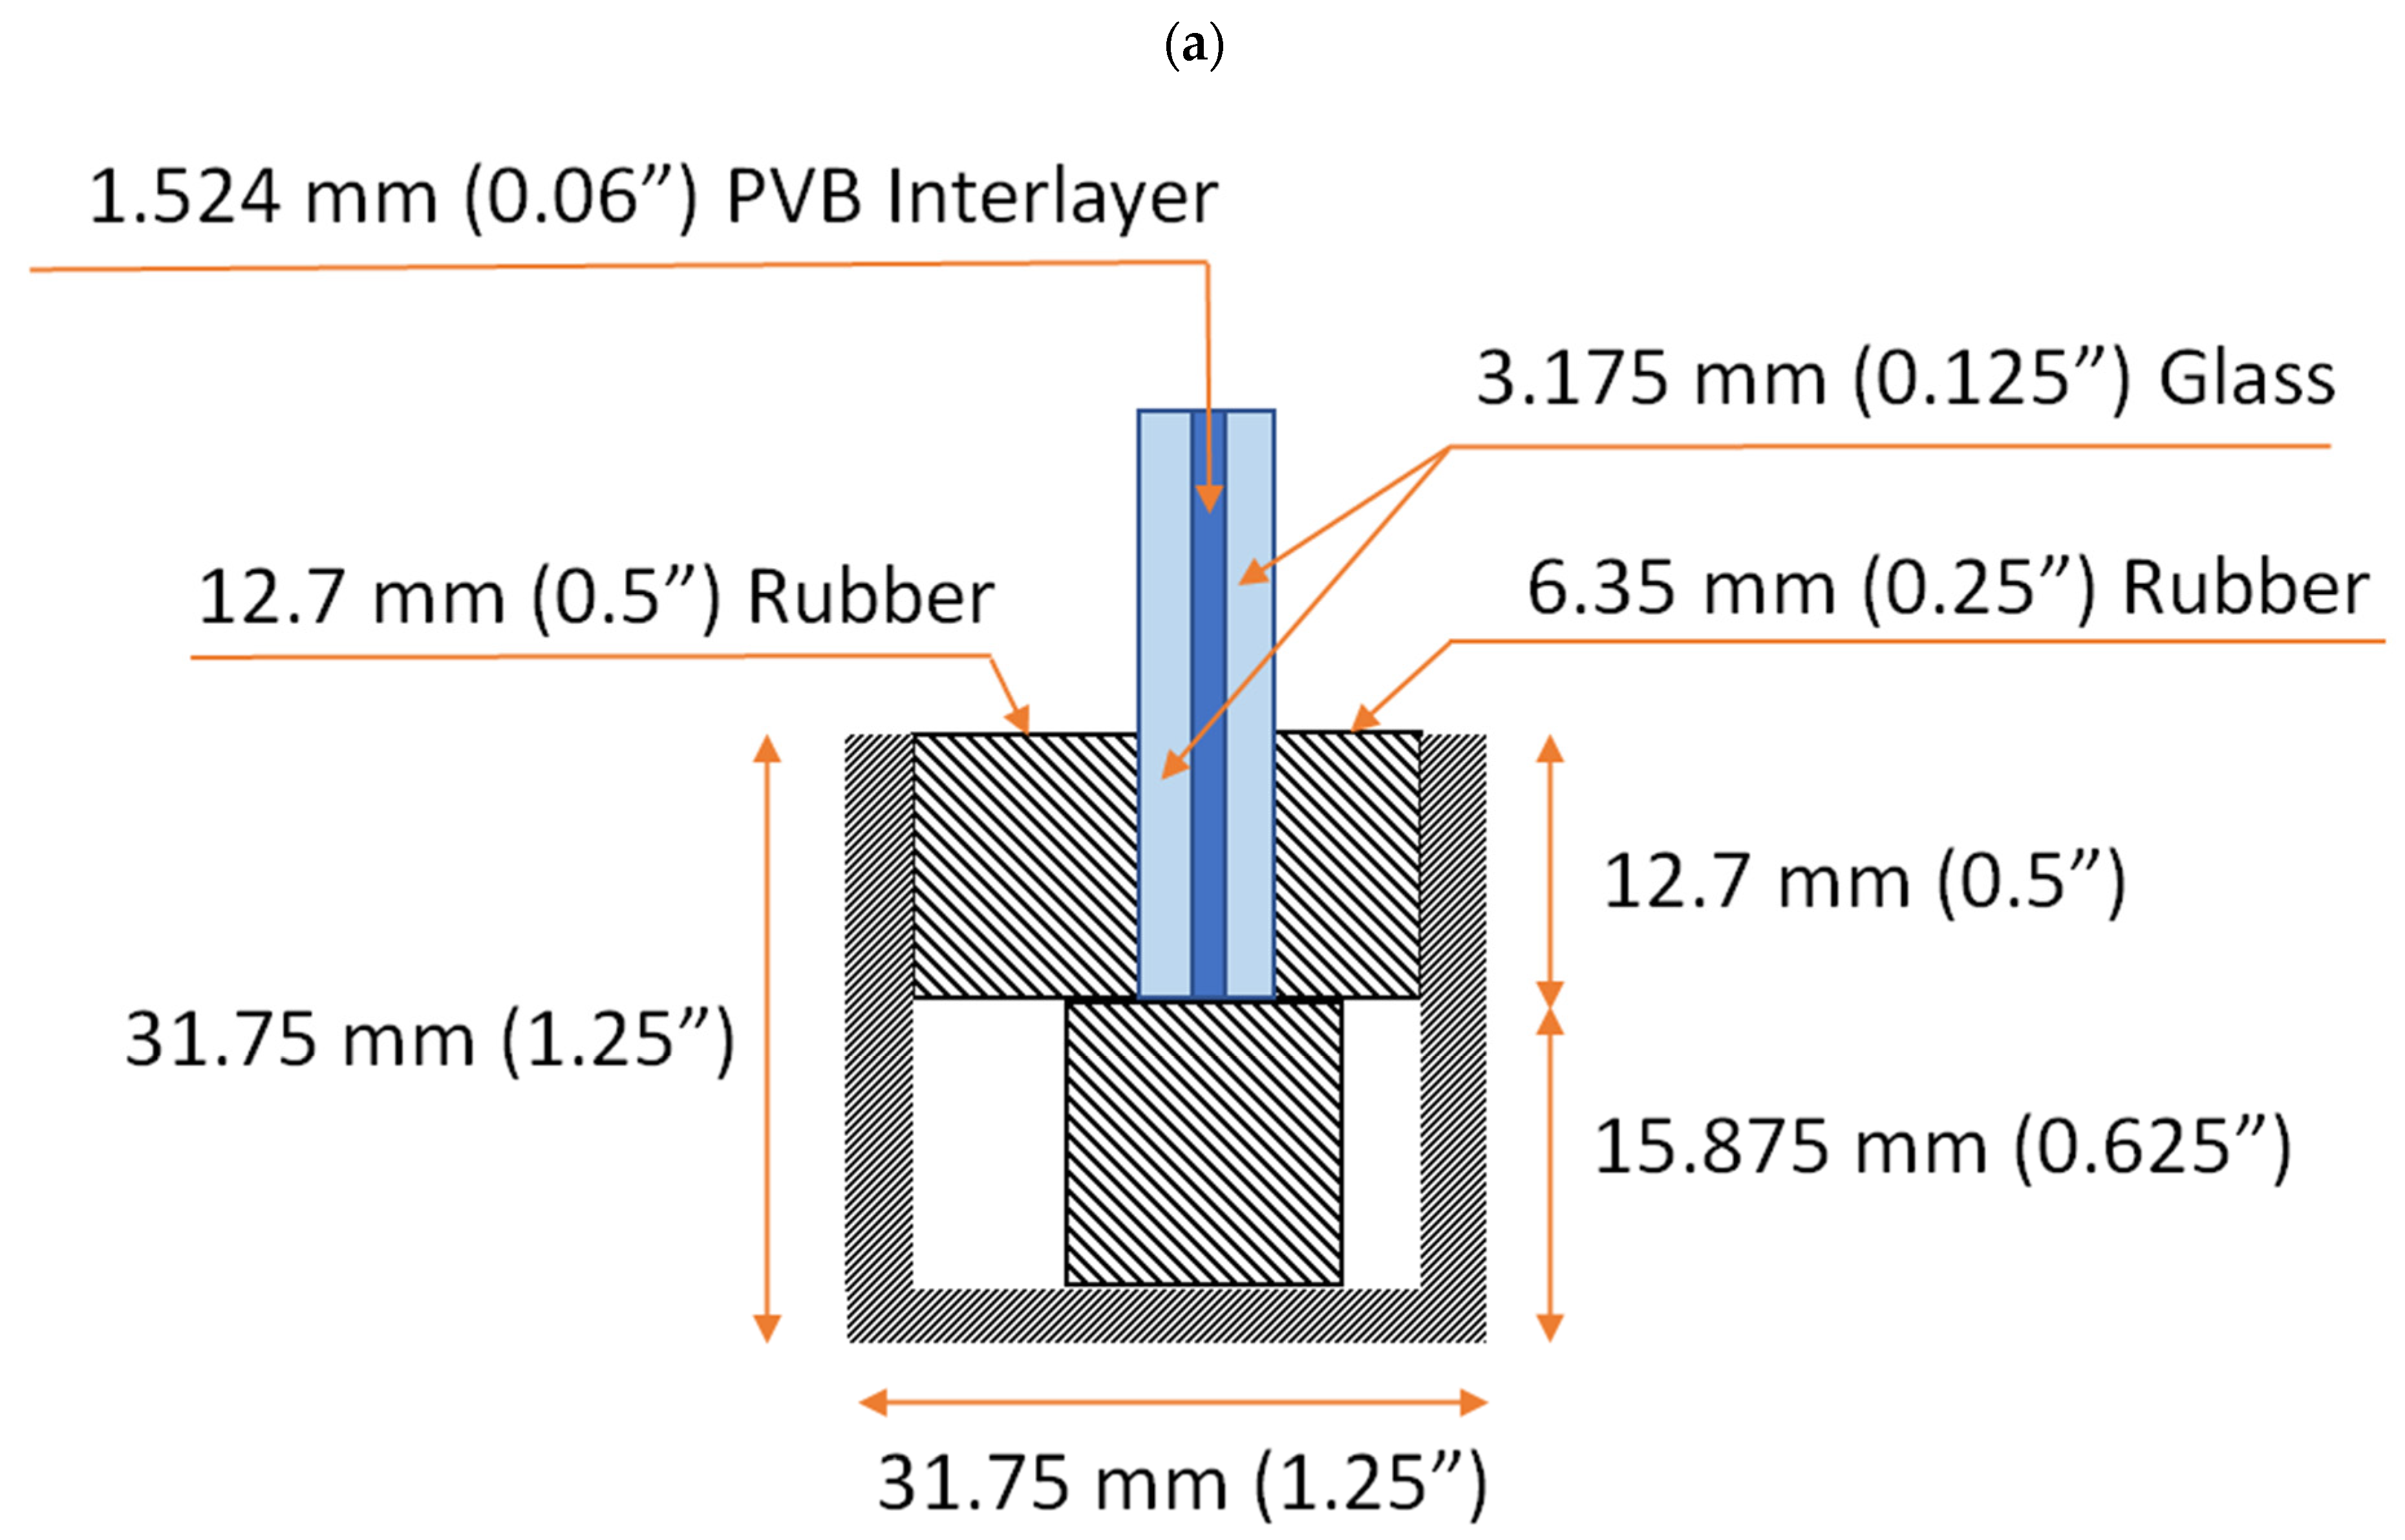
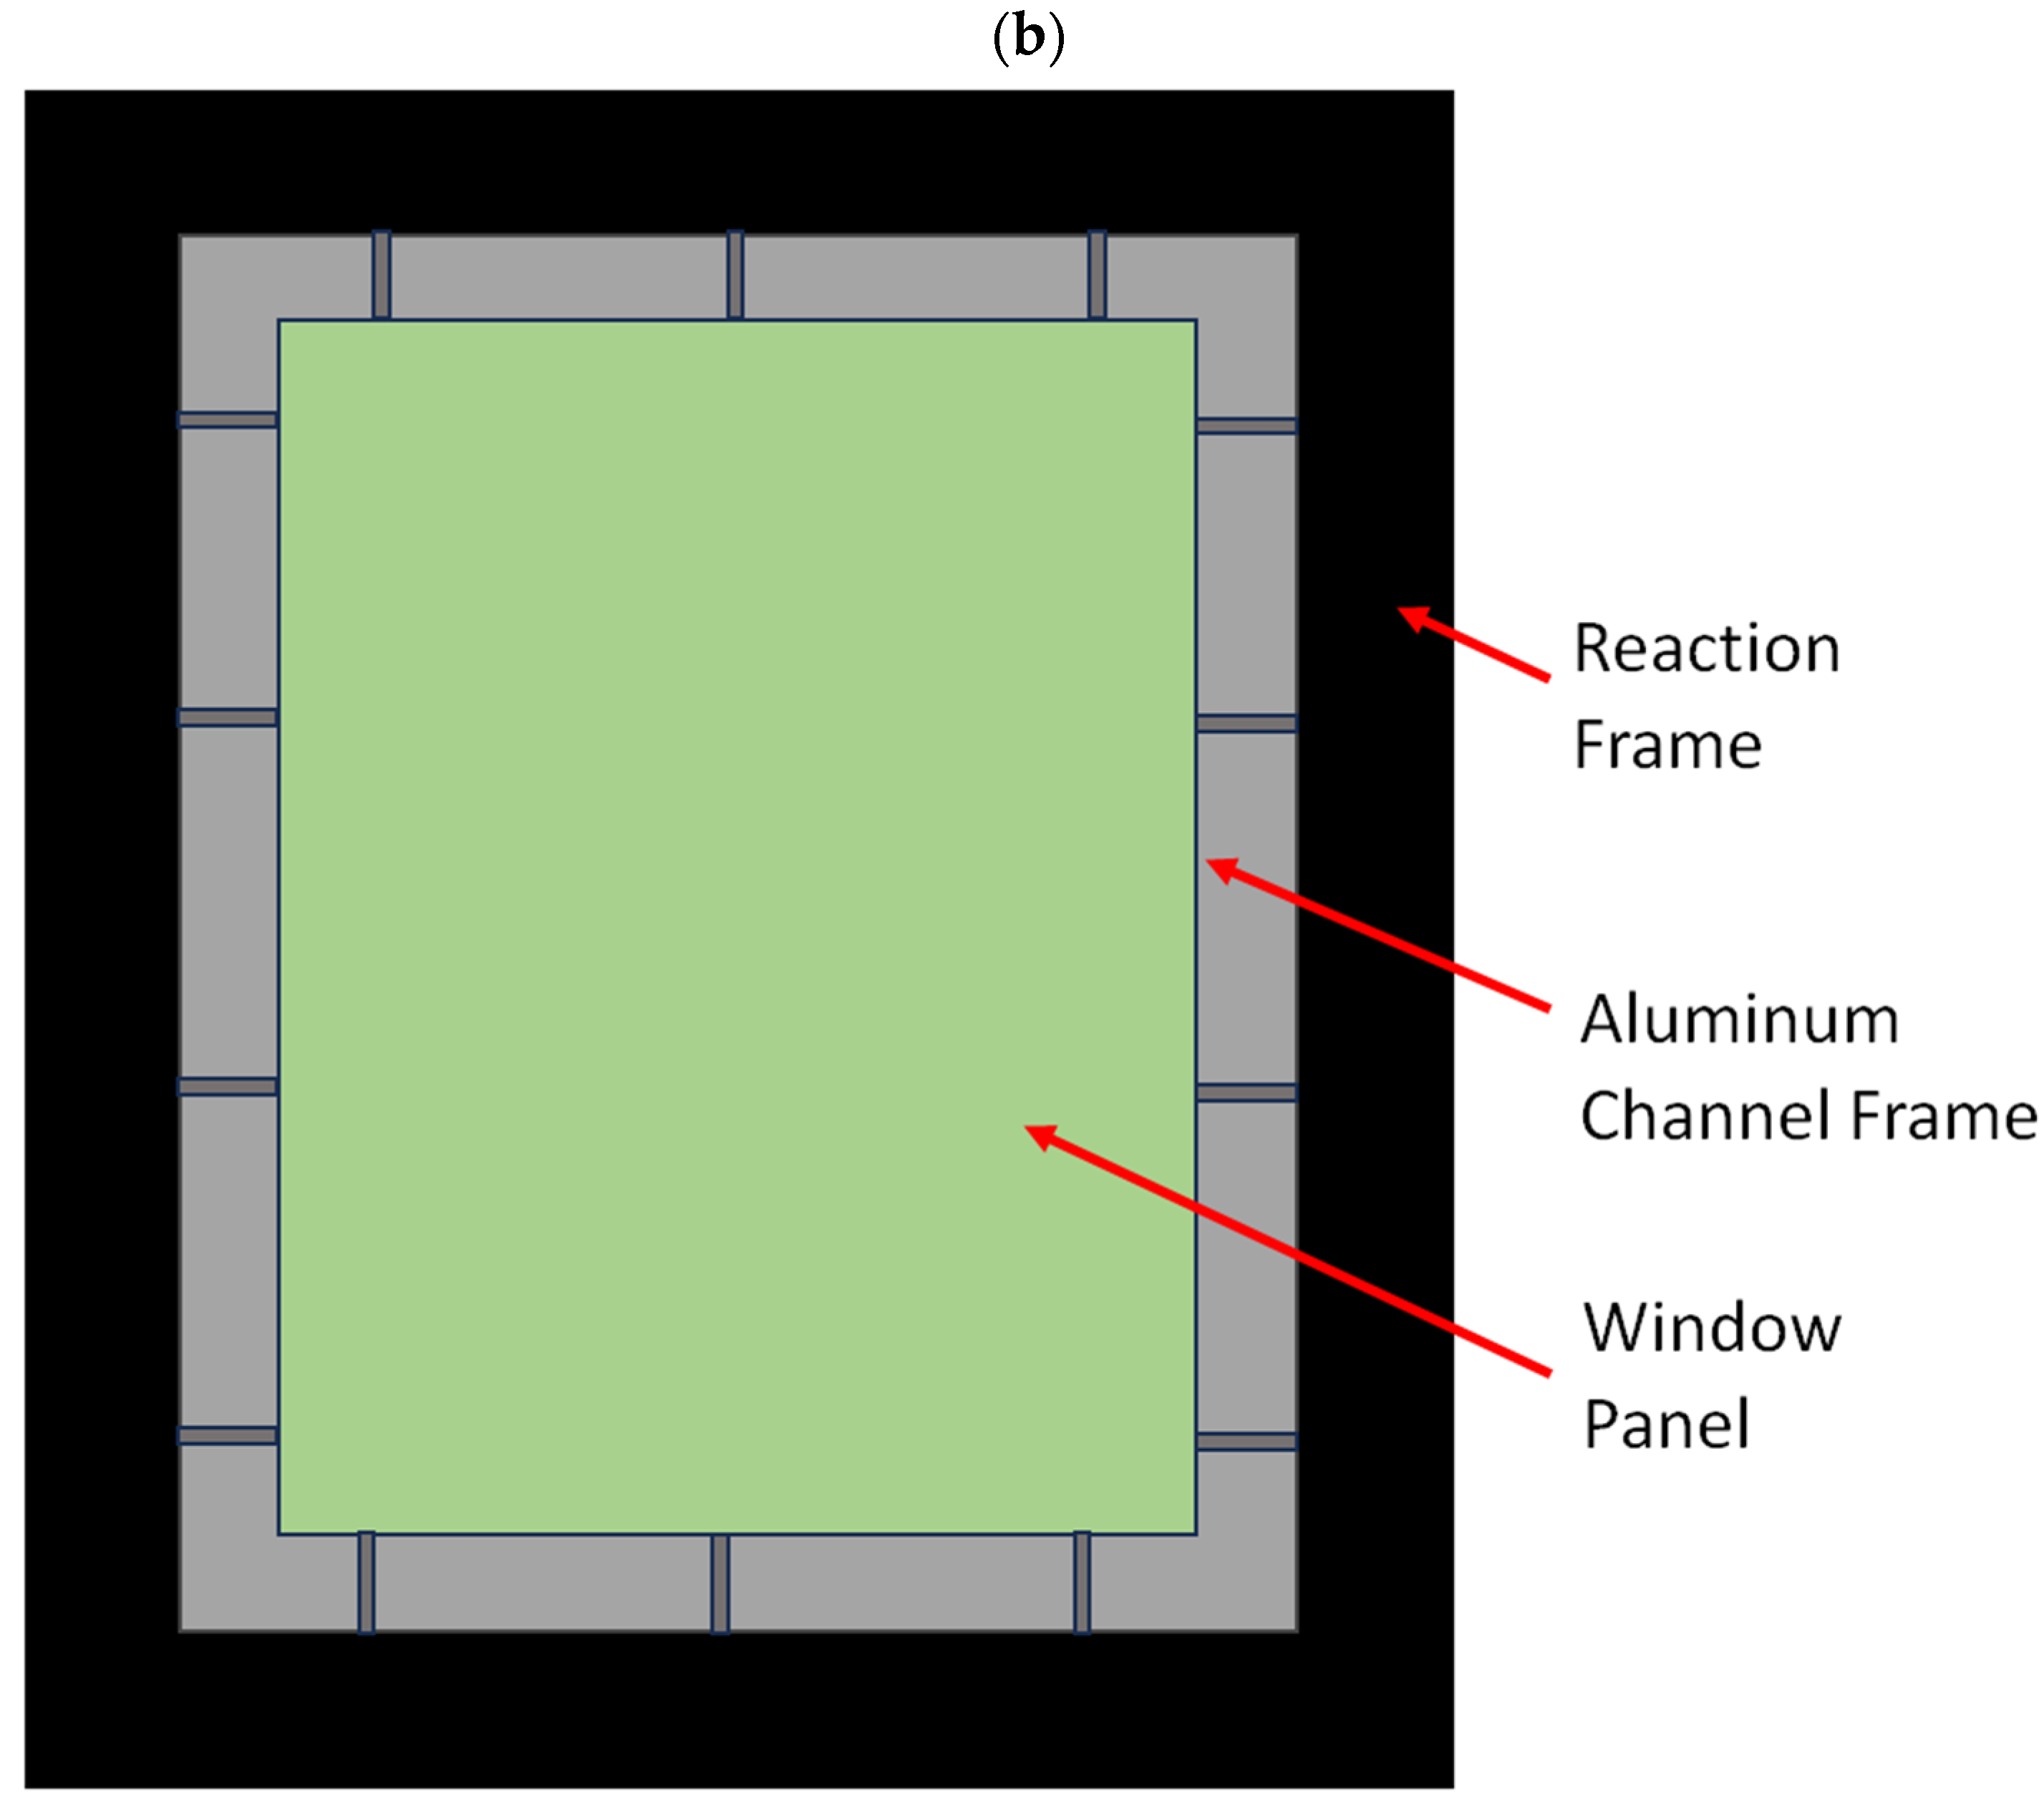
The experimental results for validation were obtained from Idriss and Lowak [40]. Shock tube blast testing was performed on laminated glass made of two layers of annealed glass sandwiching a PVB interlayer. The window panels were held by an all-around neoprene rubber gaskets bite, which snugly fit both the panel and the rubbers across the bite width inside an aluminum channel frame, as shown in Figure 3. More details about the procurement of the materials, as well as detailed illustrations of the aluminum frame mounted inside the reaction frame, can be found in reference [40].


Figure 3.
Laminate glass window setup during testing. (a) Schematic of the setup for glass frame engagement and (b) the mounted setup in the shock tube.
3. Numerical Modeling
Numerical modeling was performed using the commercial software Abaqus. Figure 4 shows the window panel model as developed for this study, with the corresponding mesh selection. Like the experimental setup described in the previous section, the panel system was composed of two glass layers, one polymer interlayer, and rubber gaskets, which were typically placed between the glass and the steel window frame to provide fixed support. The elasto-damage relation for glass (EDG) was developed and incorporated into VUMAT in Abaqus.
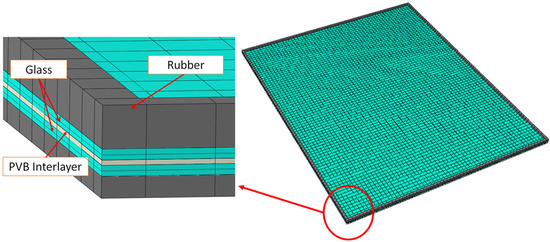
Figure 4.
Finite element model, mesh, and panel configuration.
Although shell elements are popular in modeling glass layers because only a small number of elements are needed to reduce the computational cost, they cannot capture cracking through the thickness of the glass [37,42,43,44,45]. Therefore, solid elements were selected [46]. A solid C3D8 element was utilized to model the laminated glass panels and the surrounding rubber strip. The C3D8 element is a three-dimensional eight-node brick element, where each node has three degrees of freedom for translation along the x, y, and z directions. Additionally, the C3D8 element has high computational efficiency and the ability to handle a wide range of loading conditions. These features render the element ideal for modeling solid structures subjected to blast loads, and in turn, have the capacity to capture the complex response of LG panels with significant accuracy.
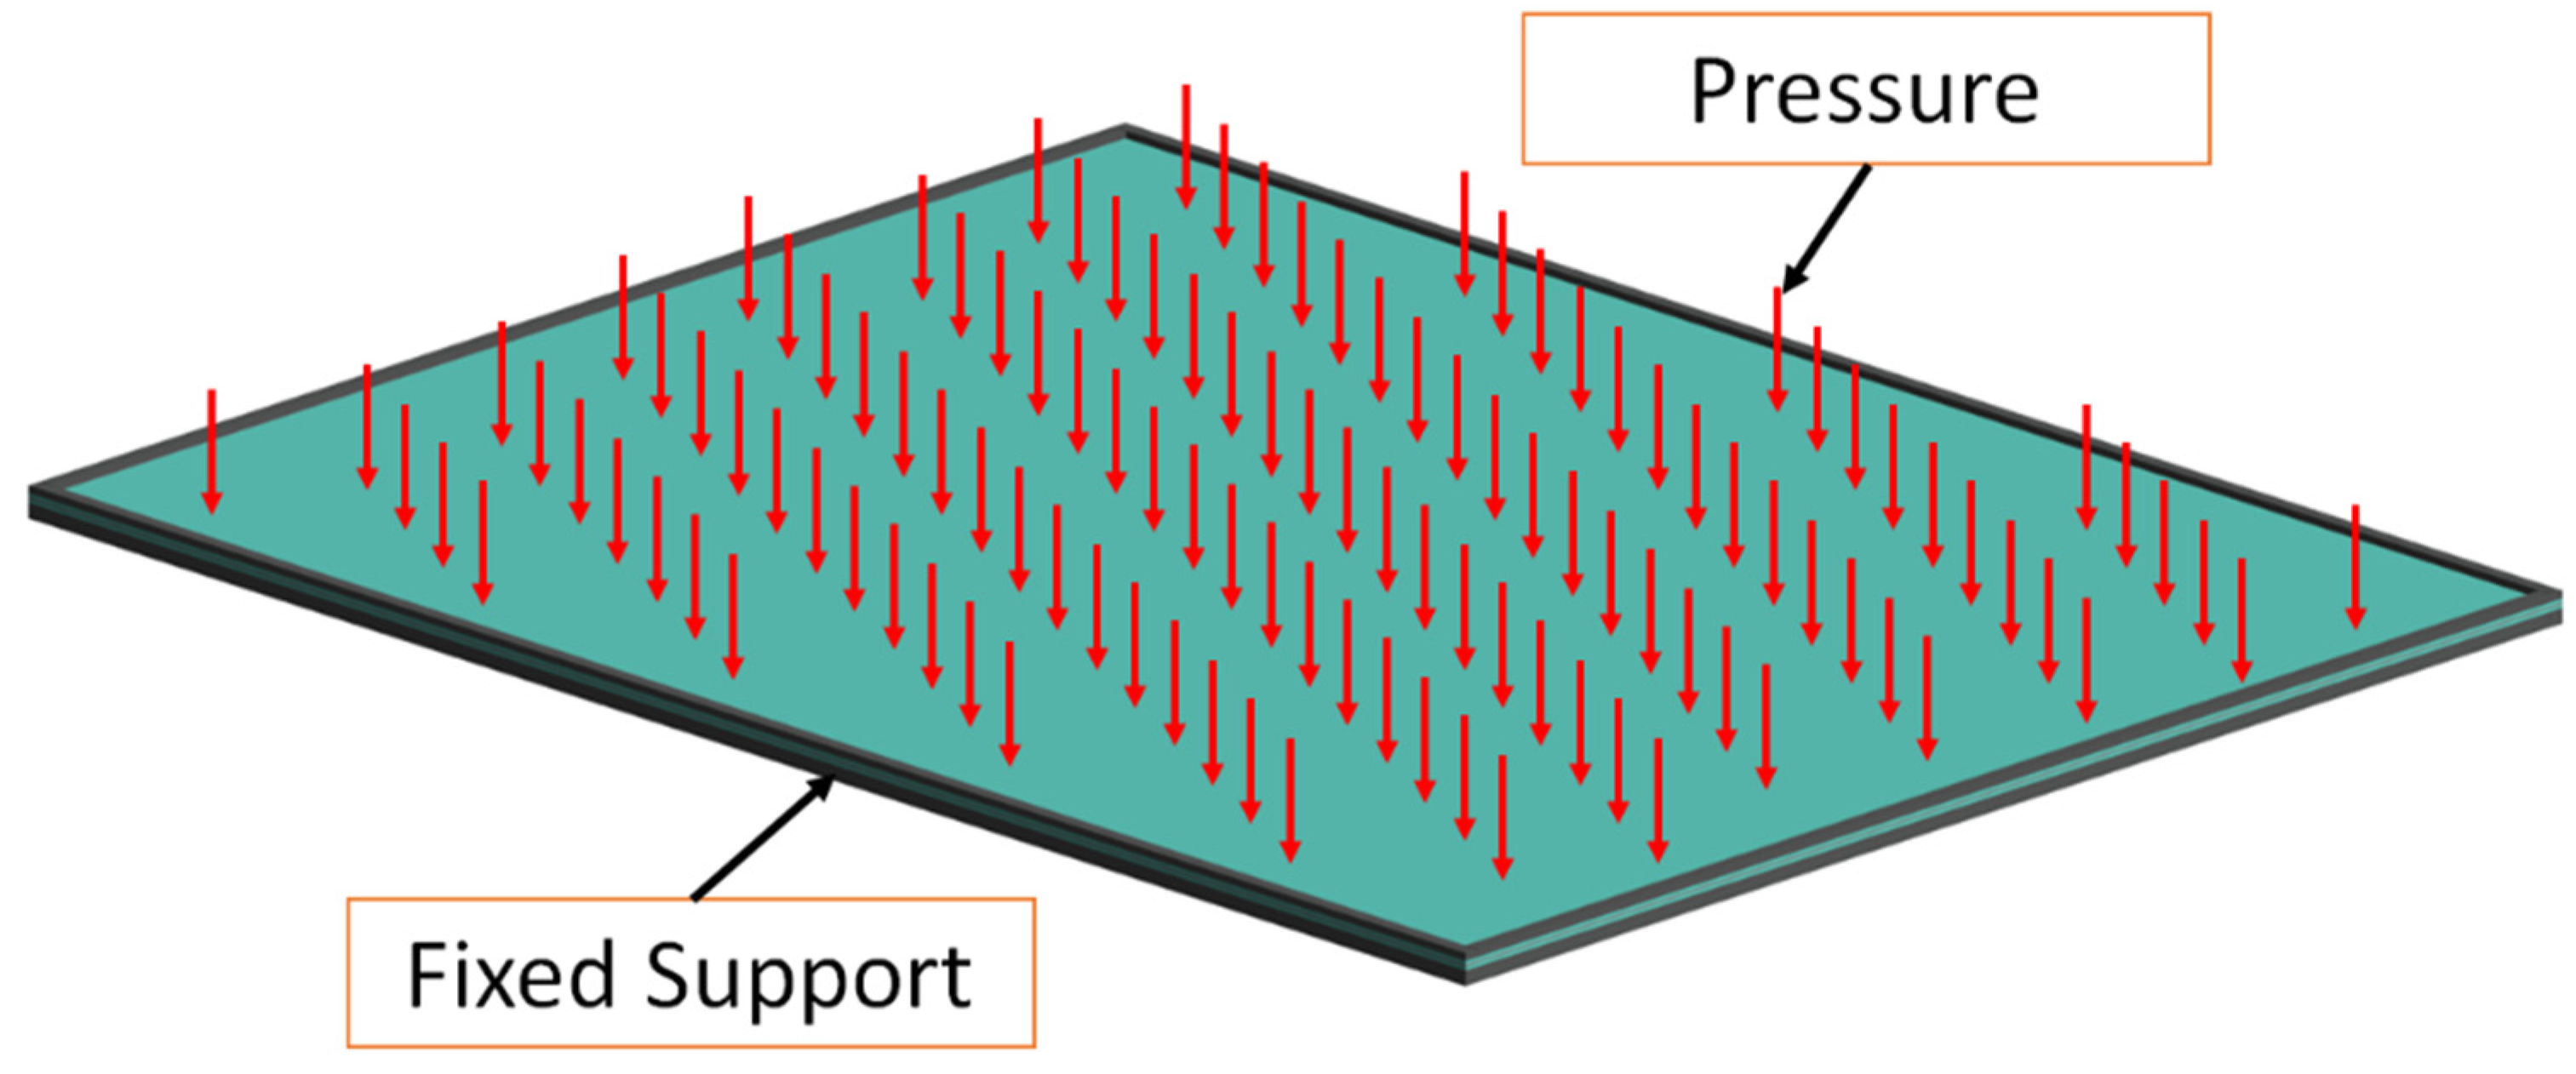
This study employed an explicit analysis, which helped to thoroughly examine the system dynamics. The shock tube’s real pressure history was used to apply the load, mimicking actual environmental conditions. Figure 5 demonstrates how this pressure was accurately applied to the surface of the LG panels, aiding in our understanding their structural response. Additionally, the rubber was subjected to a fixed support setup, as shown in Figure 5, revealing valuable insights into its behavior under specific conditions.

Figure 5.
The boundary conditions and the load applied to the LG specimen.
The strain rate of the laminated glass panels under blast loads typically ranges from 20 to 45 s−1, as noted by Nawar et al. in 2021 [3]. Chiara Bedon and Maria Santi indicated that, at this strain rate, there is no significant effect on the LG panels under blast loads [47]. Hence, this study did not consider the strain rate effect on glass. Two scenarios were considered to model the glass. The first used one of the Abaqus built-in material models that is commonly used in the literature. This built-in model is an isotropic elasticity model that adheres to the maximum tensile strain failure criterion. A prescribed failure strain value was used to trigger element erosion. Residual stress could be prescribed after the maximum tensile strain was reached. The other scenario used the developed EDG constitutive model by utilizing VUMAT in Abaqus. The in-house developed EDG–VUMAT subroutine code was selected to overcome a major limitation present in some of the elasto-damage models integrated into Ansys and Abaqus, which defines damage based on the equivalent plastic strain. The limitation is that such an assumption is based on determining the failure state with the deviatoric stress invariant of the von Mises type. The deviatoric stress component of the stress tensor does not include the hydrostatic component, but the hydrostatic stress component is mainly responsible for brittle failure under blast pressure, which is especially true for spalling due to impact or blast loading [48]. Therefore, a model that determines the material failure by comparing the experimental failure stress with the calculated maximum principal stress (Rankine Failure Criterion) is a reasonable formulation to capture brittle failure in glass.
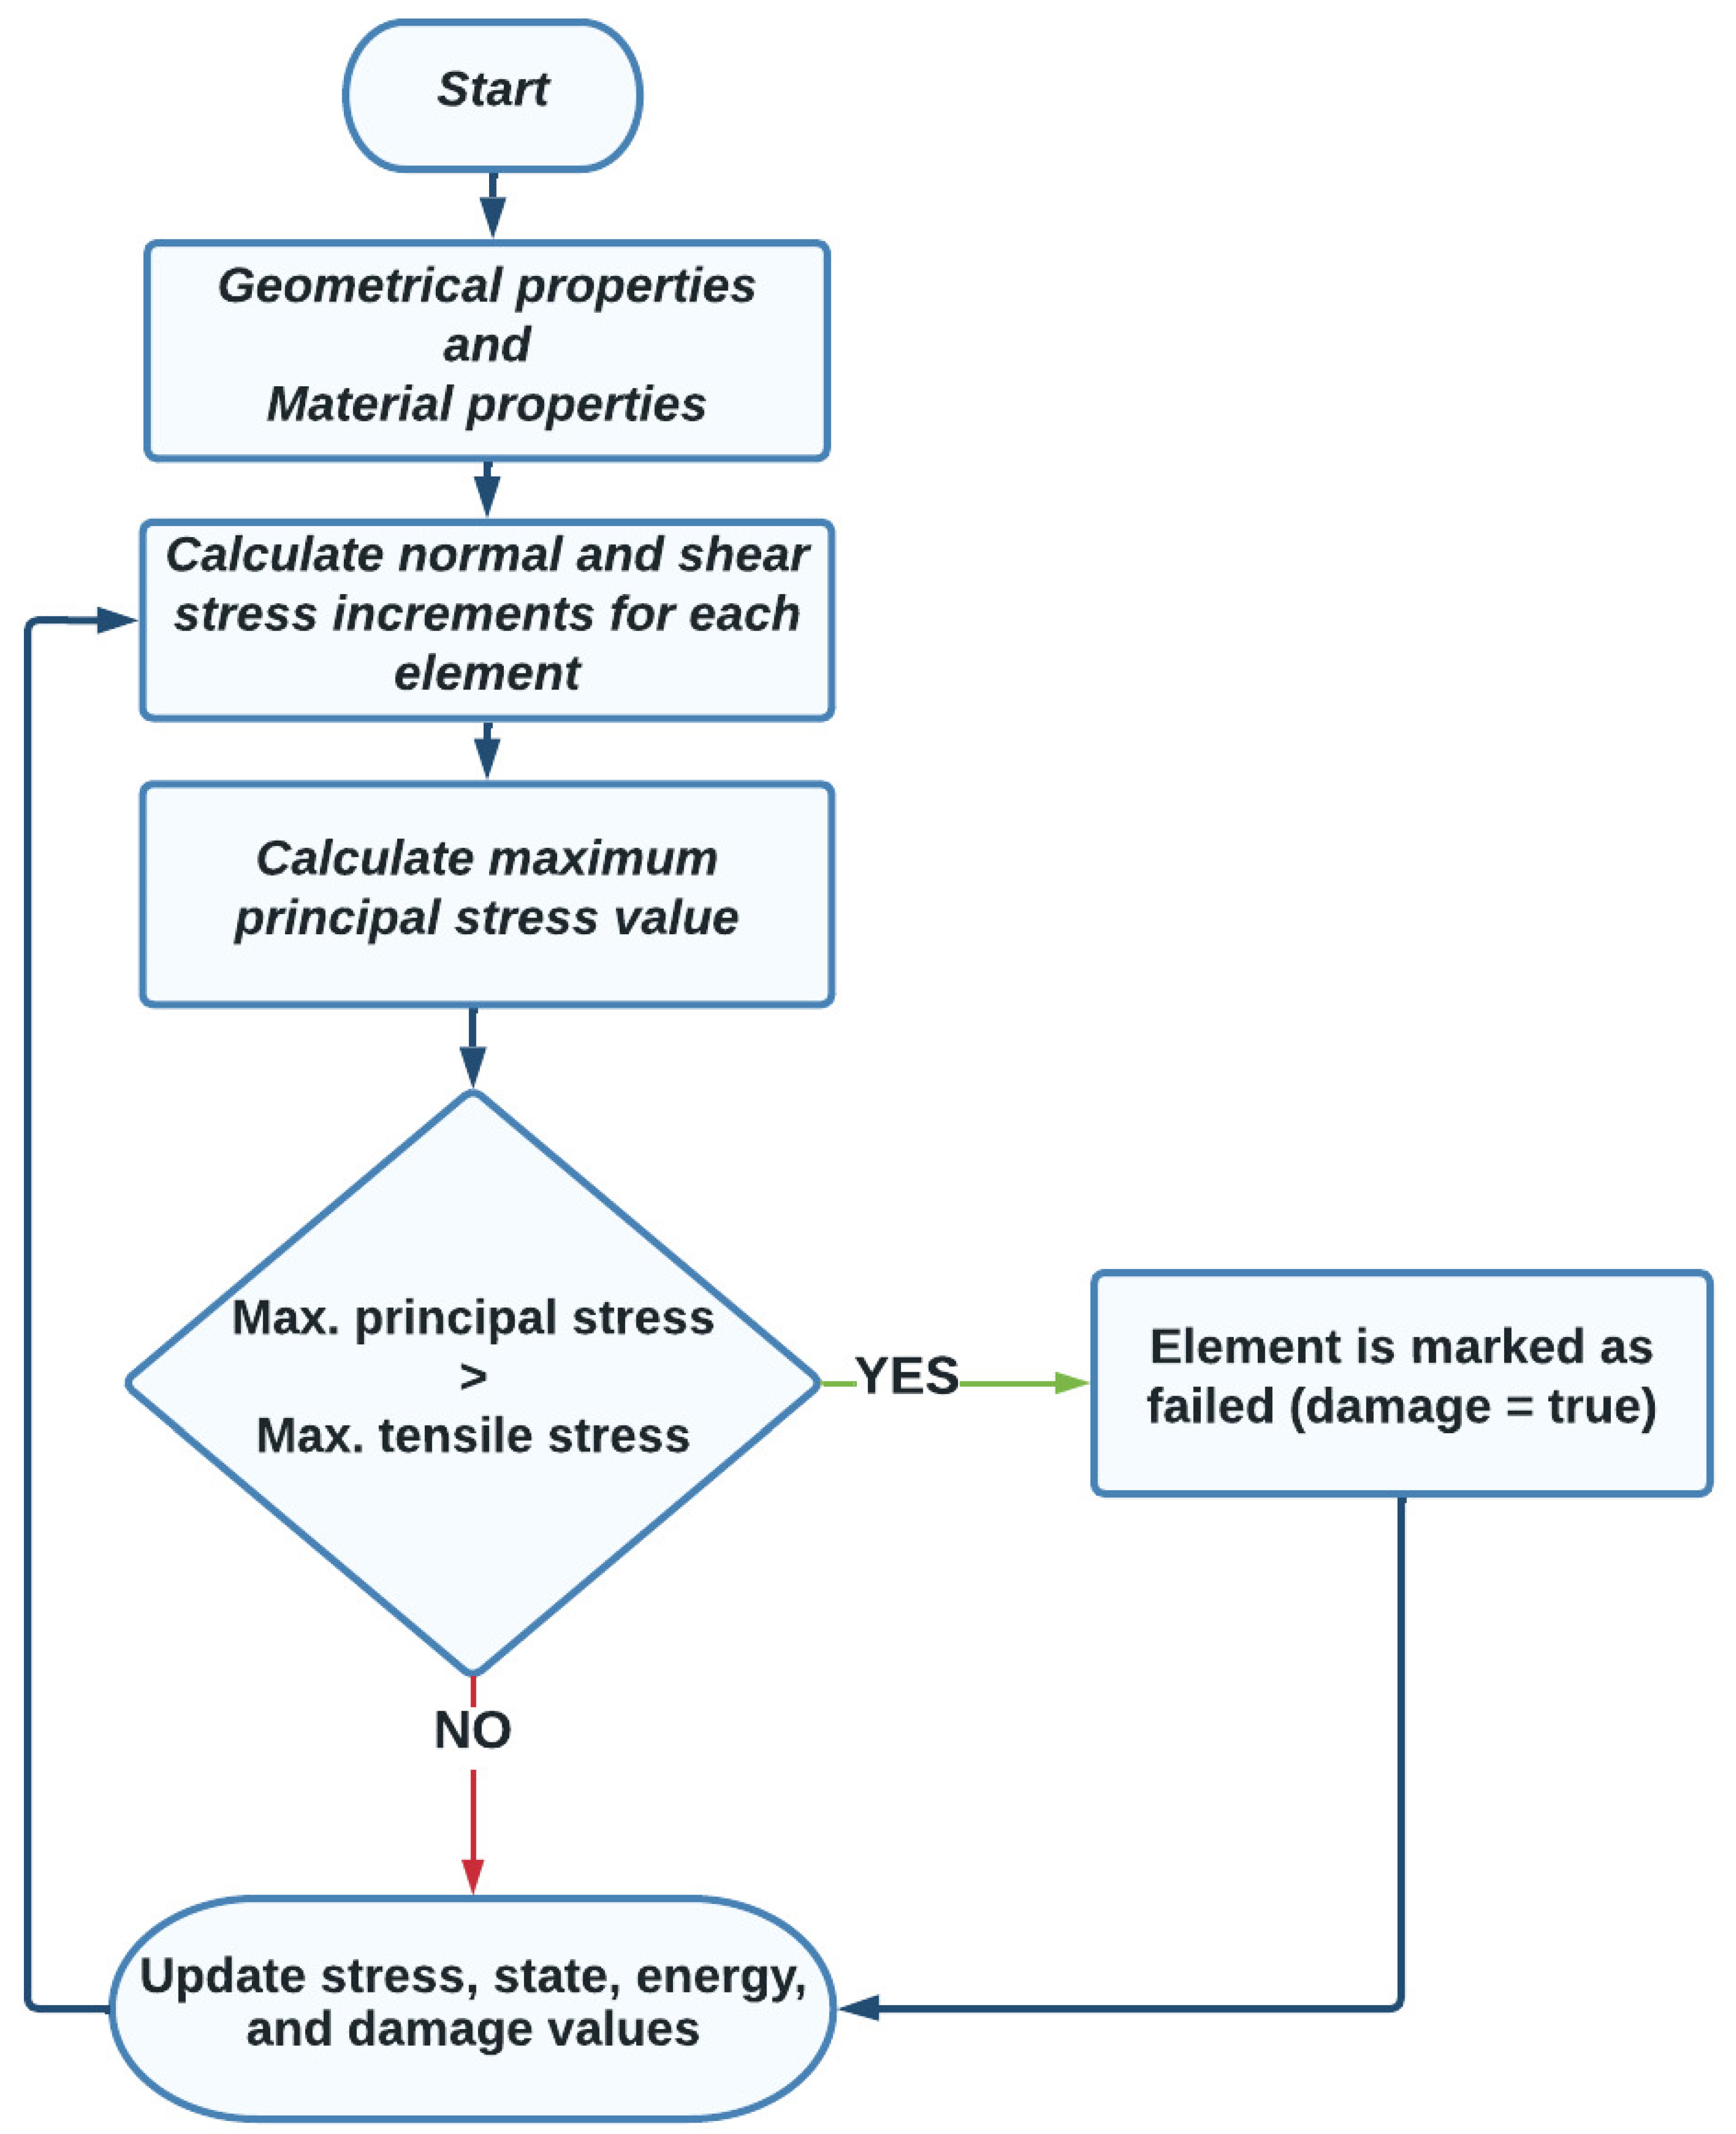
Figure 6 shows a flowchart describing the EDG subroutine. First, the subroutine defined the following inputs: the number of elements in the block (nblock), the number of displacement directions (ndir), the number of shear directions (nshr), the number of state variables (nstatev), the number of field variables (nfieldv), the number of material properties (nprops), an indicator for annealing (lanneal), the time at the current step (stepTime), the total simulation time (totalTime), the time increment (dt), the name of the material model (cmname), the coordinates of the material points (coordMp), the characteristic length of the elements (charLength), the material properties (props), the density of the elements (density), the incremental strain (strainInc), the incremental relative spin (relSpinInc), the stretch at the previous step (stretchOld), the deformation gradient at the previous step (defgradOld), the field variables at the previous step (fieldOld), the stress at the previous step (stressOld), the state variables at the previous step (stateOld), the internal energy at the previous step (enerInternOld), and the inelastic energy at the previous step (enerInelasOld).

Figure 6.
Flowchart of the EDG subroutine algorithm.
After defining the input data, the subroutine calculated the stress increment for each element based on the strain increment, Young’s modulus (props(1)), and Poisson’s ratio (props(2)). The stress increment was divided into hydrostatic and deviatoric components, and the deviatoric component was further split into shear stresses. The VUMAT utilized the VSPRINC function, available in Abaqus explicit, to calculate the principal stress. The maximum principal stress (MAXPRSTRESS) was then calculated from the principal stress. If MAXPRSTRESS exceeded the maximum tensile stress (props(4)) and the element had not already failed (stateOld(k, 2) > 0), the element was considered to have failed and its damage variable (stateNew(k, 1)) was set to zero. Otherwise, the damage variable was set to one. The subroutine also updated the state variables for each element, including the damage variable, the hydrostatic strain (stateNew(k, 2)), and the maximum principal stress (stateNew(k, 3)). Finally, the subroutine updated the internal energy of each element based on the stress and strain increments.
For the PVB interlayer material, the Johnson–Cook (JC) material model was utilized to describe its dynamic response. The JC model, shown in Equation (1), is a well-established model that describes the stress–strain behavior of materials undergoing plastic deformation [49].
The model relates stress (σ) to plastic strain (εp) and strain rate (), where the material constants A, B, C, and n determine the model’s accuracy. The developed model (a combination of the elasto-damage subroutine for glass and the JC model for the interlayer) was first verified through a convergence study to select the optimized FEM mesh size. After this, a validation study against the experimental data was performed to ensure the model’s workability. Finally, a parametric study investigating the effect of glass type was performed.
4. Experimental Results and Discussion
In this section, the results of the experimental investigation are presented, with a particular focus on the key findings, such as the deflection histories. The results of the material characterization are presented first. The results of the shock tube testing [40] are then presented.
4.1. Material Characterization Results
Figure 7 shows the stress–strain response, as obtained from the dynamic tensile tests for two different strain rate groups. The discussion of the stress–strain response involving the post-peak response is beyond the scope of this work. Therefore, the discussion is limited to the observations needed to determine the JC model parameters.
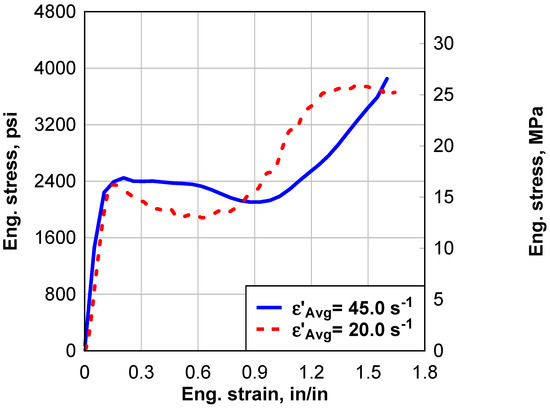
Figure 7.
Comparison of the engineering stress–strain response of PVB at different strain rates.
The location of the failure was recorded after each test. The failures were discovered to be inside the gauge length region of the specimens. Table 1 shows the average values for the three curves obtained from the three tested interlayers in each group. The strain energy was calculated from the area under the stress–strain curve.

Table 1.
Dynamic material characterization results of PVB.
4.2. Shock Tube Testing Results
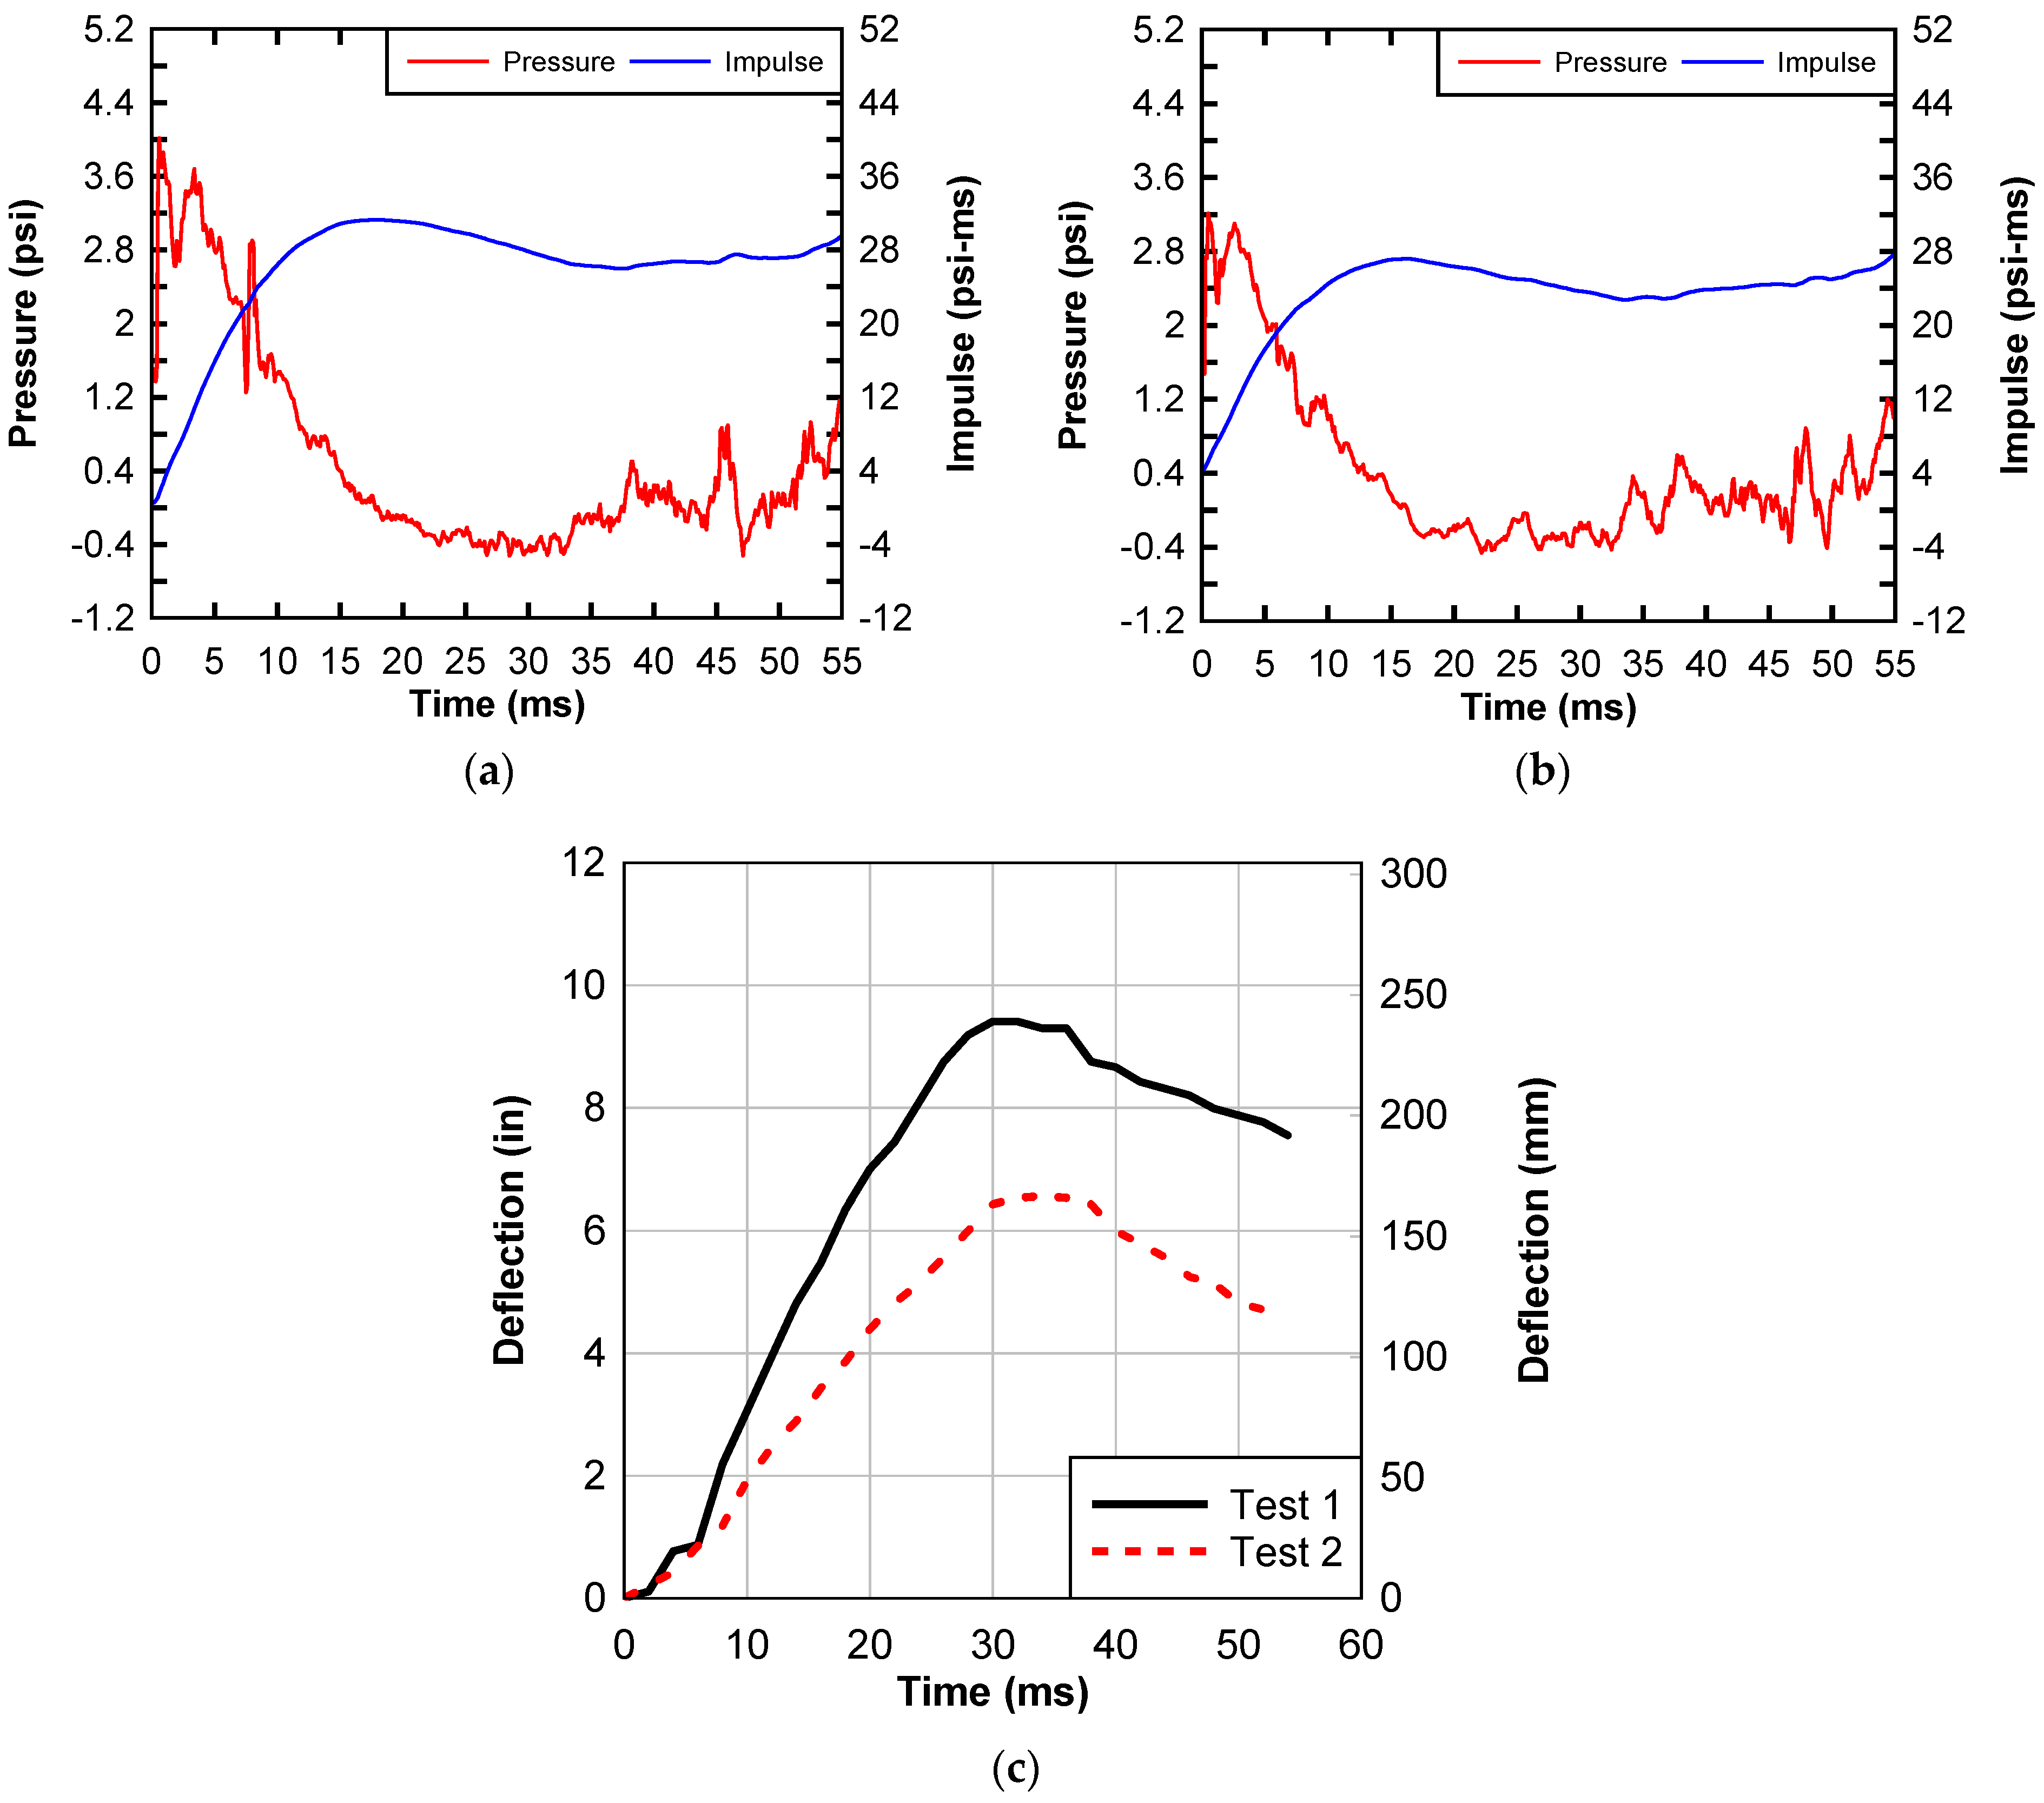
A summary of the results of the shock tube test, as reported by BakerRisk Engineering [40], is presented in this section. The measured applied pressures along with the corresponding impulses for both the first and second tests are shown in Figure 8a,b, and the corresponding measured dynamic deflections are shown in Figure 8c. The window panel in the first test suffered slight and partial detachment from the frame, with a peak deflection of 241 mm (9.5 in), whereas the window panel in the second test remained completely attached to the frame, with a peak deflection of 165 mm (6.5 in), which is 30% less than the first test.
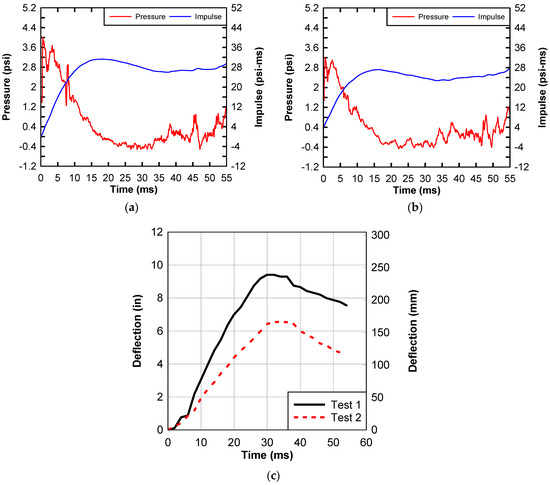
Figure 8.
Measured applied pressure for (a) the first test and (b) the second test. (c) Measured deflection for the first and second tests.
5. Numerical Results
In this section, a discussion of the numerical results is presented, with a specific focus on the verification and validation work. First, the results of the uniaxial dynamic tensile tests were used to determine the JC material constants for PVB, and they were calculated as shown in Table 2. The experimentally extracted stress–strain curves versus the JC-fitted stress–strain curves are shown in Figure 9. Figure 9 shows that JC model fitting captures the experimental results with reasonable accuracy for both tests. The maximum error tolerance was found to be around 10%, occurring at the instant of maximum stress. For the glass material models, the data used to define mass density, Young’s modulus, Poisson’s ratio, and maximum tensile stress are shown in Table 3 [50].
Table 2.
JC material constants for the PVB interlayer.
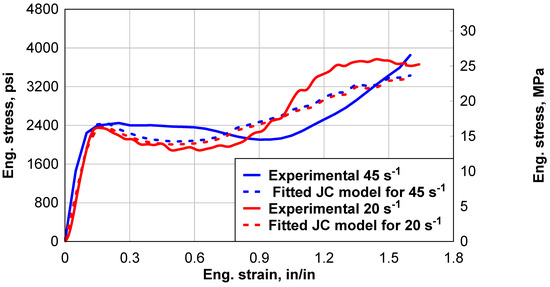
Figure 9.
The experimental PVB stress–strain relation versus the JC-fitted stress–strain relation.
Table 3.
Material properties of glass plies.
The chosen material model for the gasket rubber was a bilinear elasto-plastic model with the following input parameters: density 2770 kg/m3, Young’s modulus 35 MPa, Poisson’s ratio 0.495, and yield tensile stress 3450 MPa. This set of material properties provides a comprehensive description of the gasket’s behavior under different conditions, allowing for accurate modeling and analysis.
5.1. Validation of Numerical Model
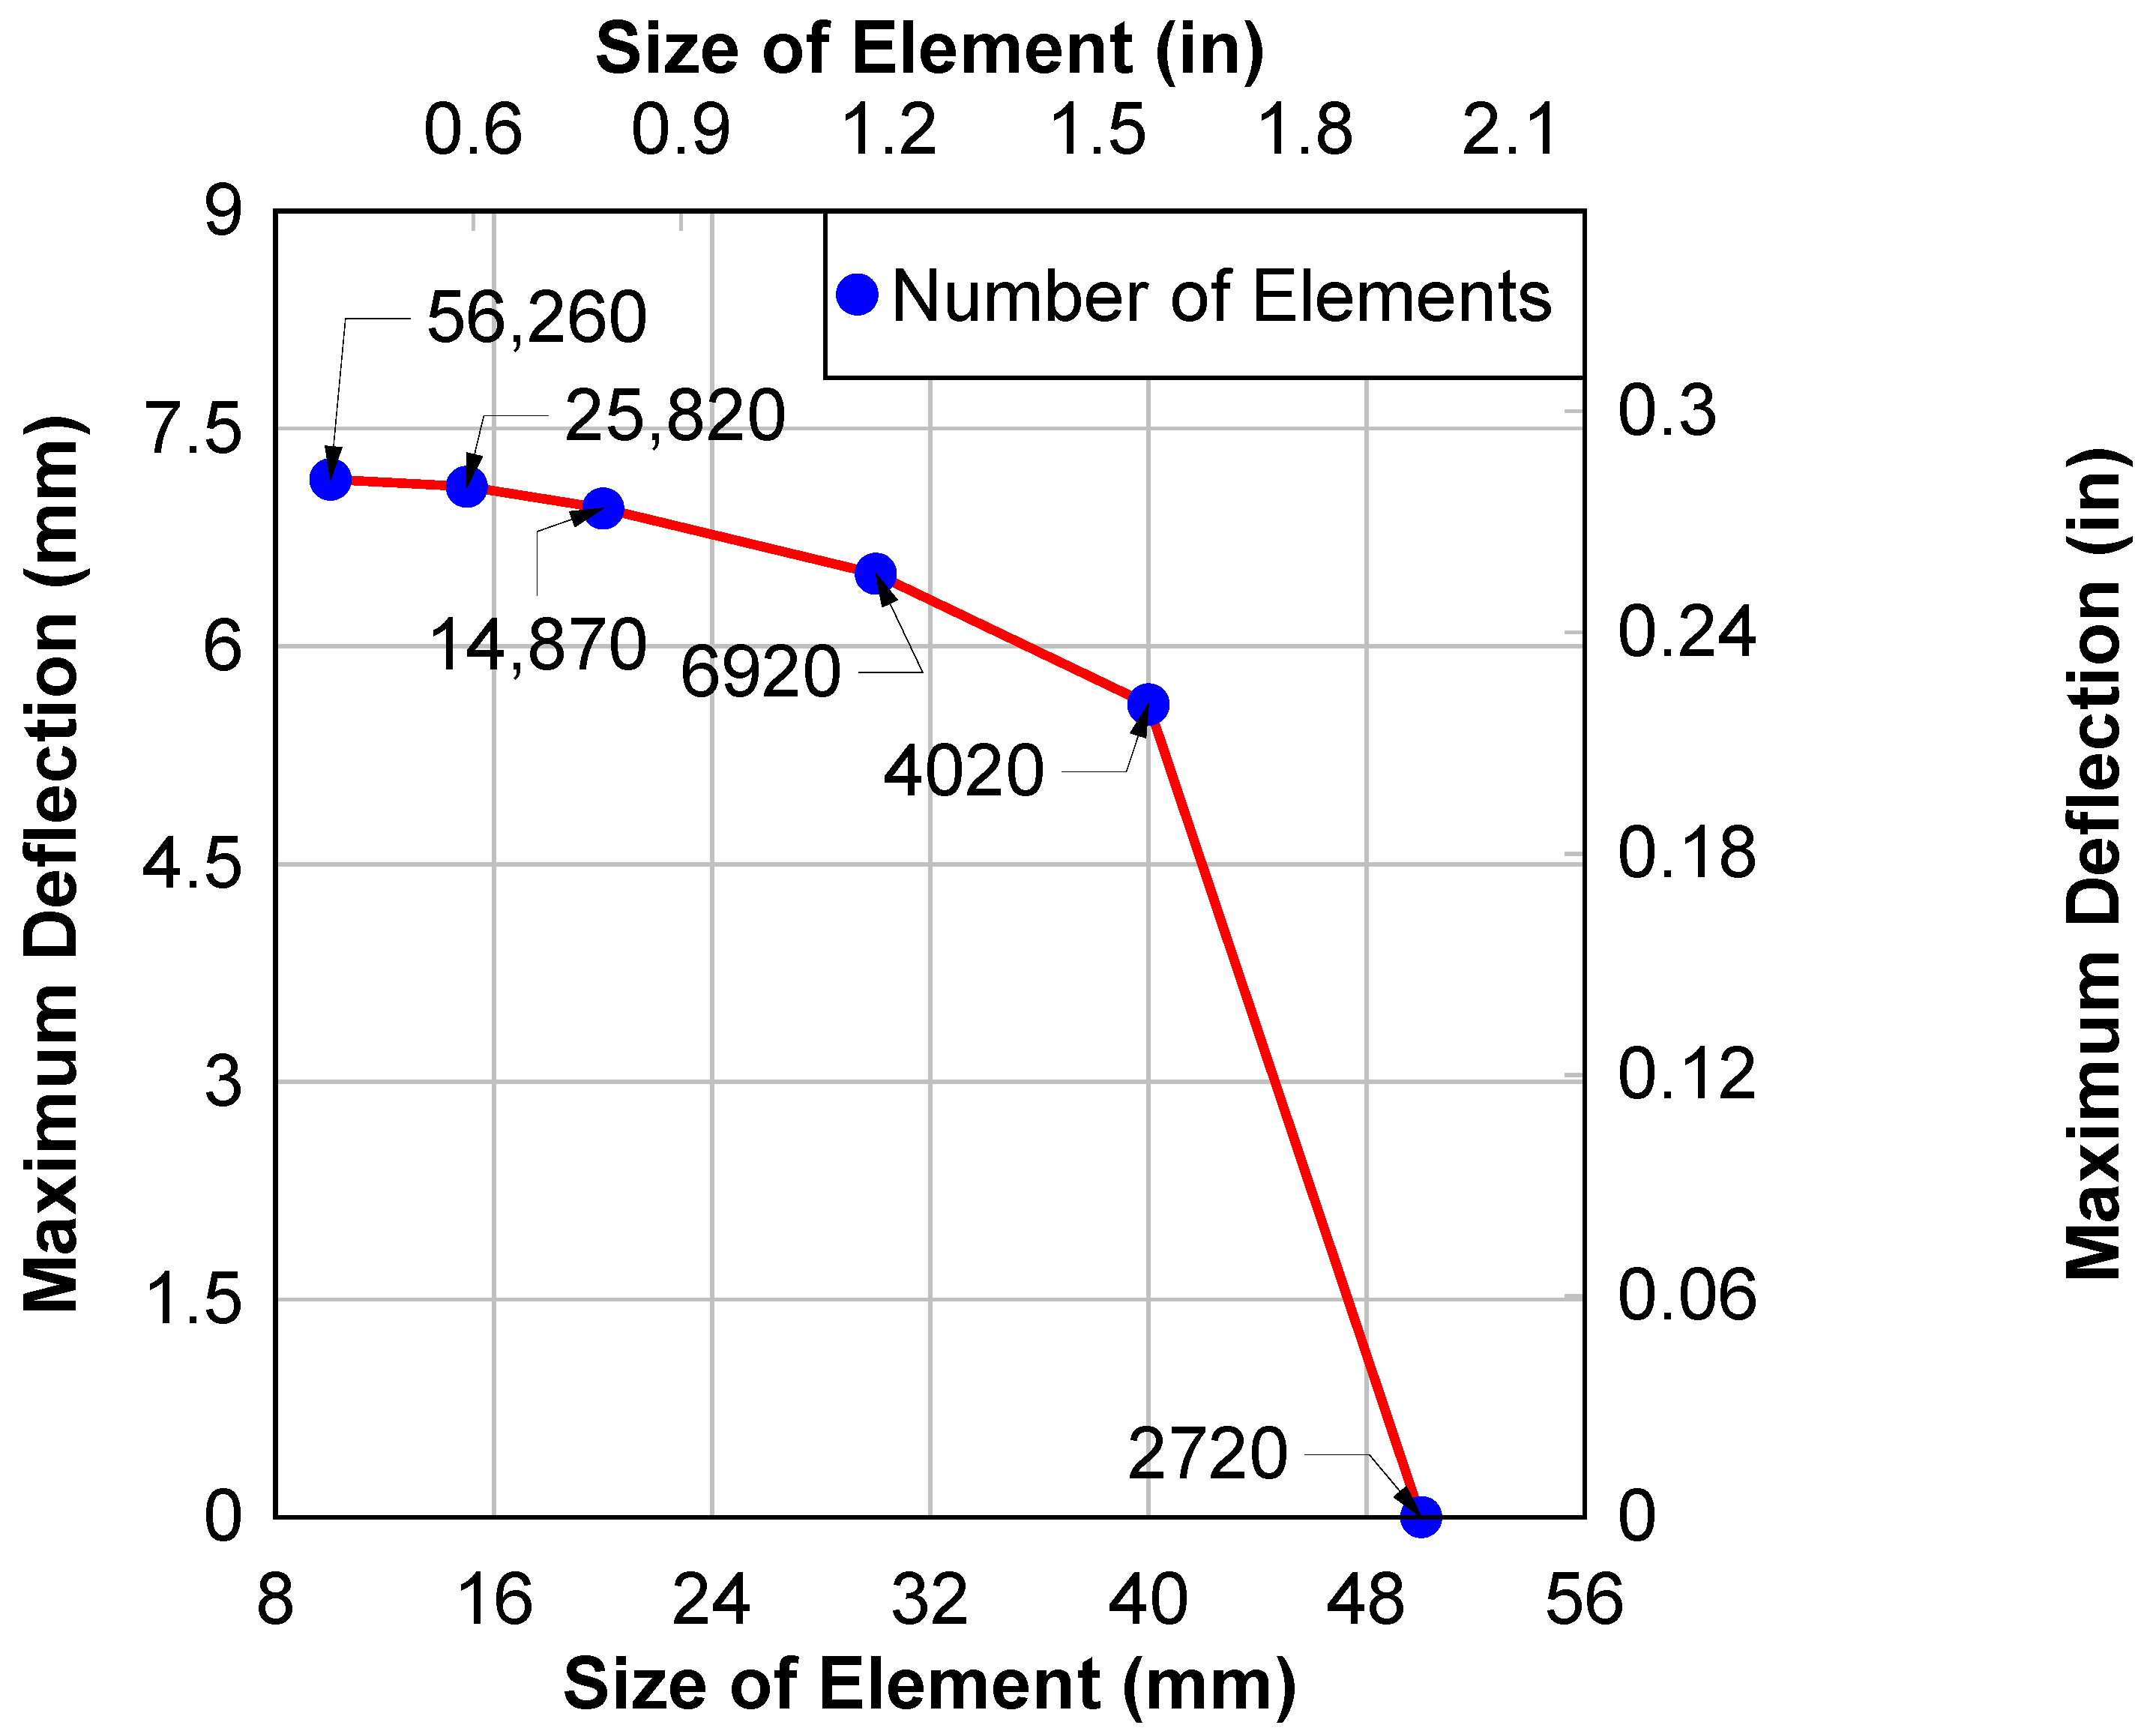
After obtaining all the needed parameters for the selected material models for glass and PVB, the precision and reliability of the simulation results were evaluated by performing a convergence analysis for the mesh size. Figure 10 shows the results of the convergence study, which aimed to report the maximum deflection as the mesh size was reduced. The obtained results were in good agreement with those of Larcher et al. [30], who demonstrated that the element size had a negligible impact on the results if the element size was less than 20 mm (0.787 in). A smaller element size of 15 mm (0.59 in) by 15 mm (0.59 in) was chosen to improve the representation of the crack pattern. Additionally, this decrease in size resulted in a more favorable aspect ratio for the solid elements.
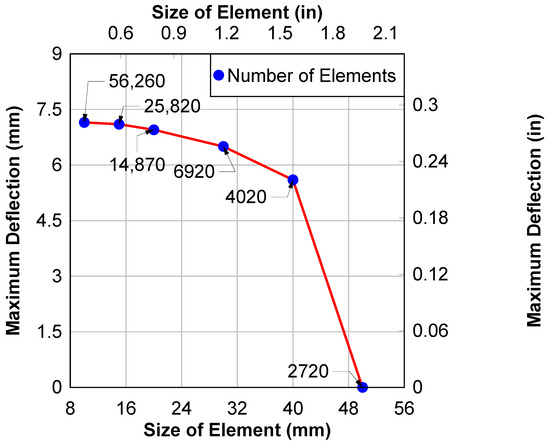
Figure 10.
Convergence study results.
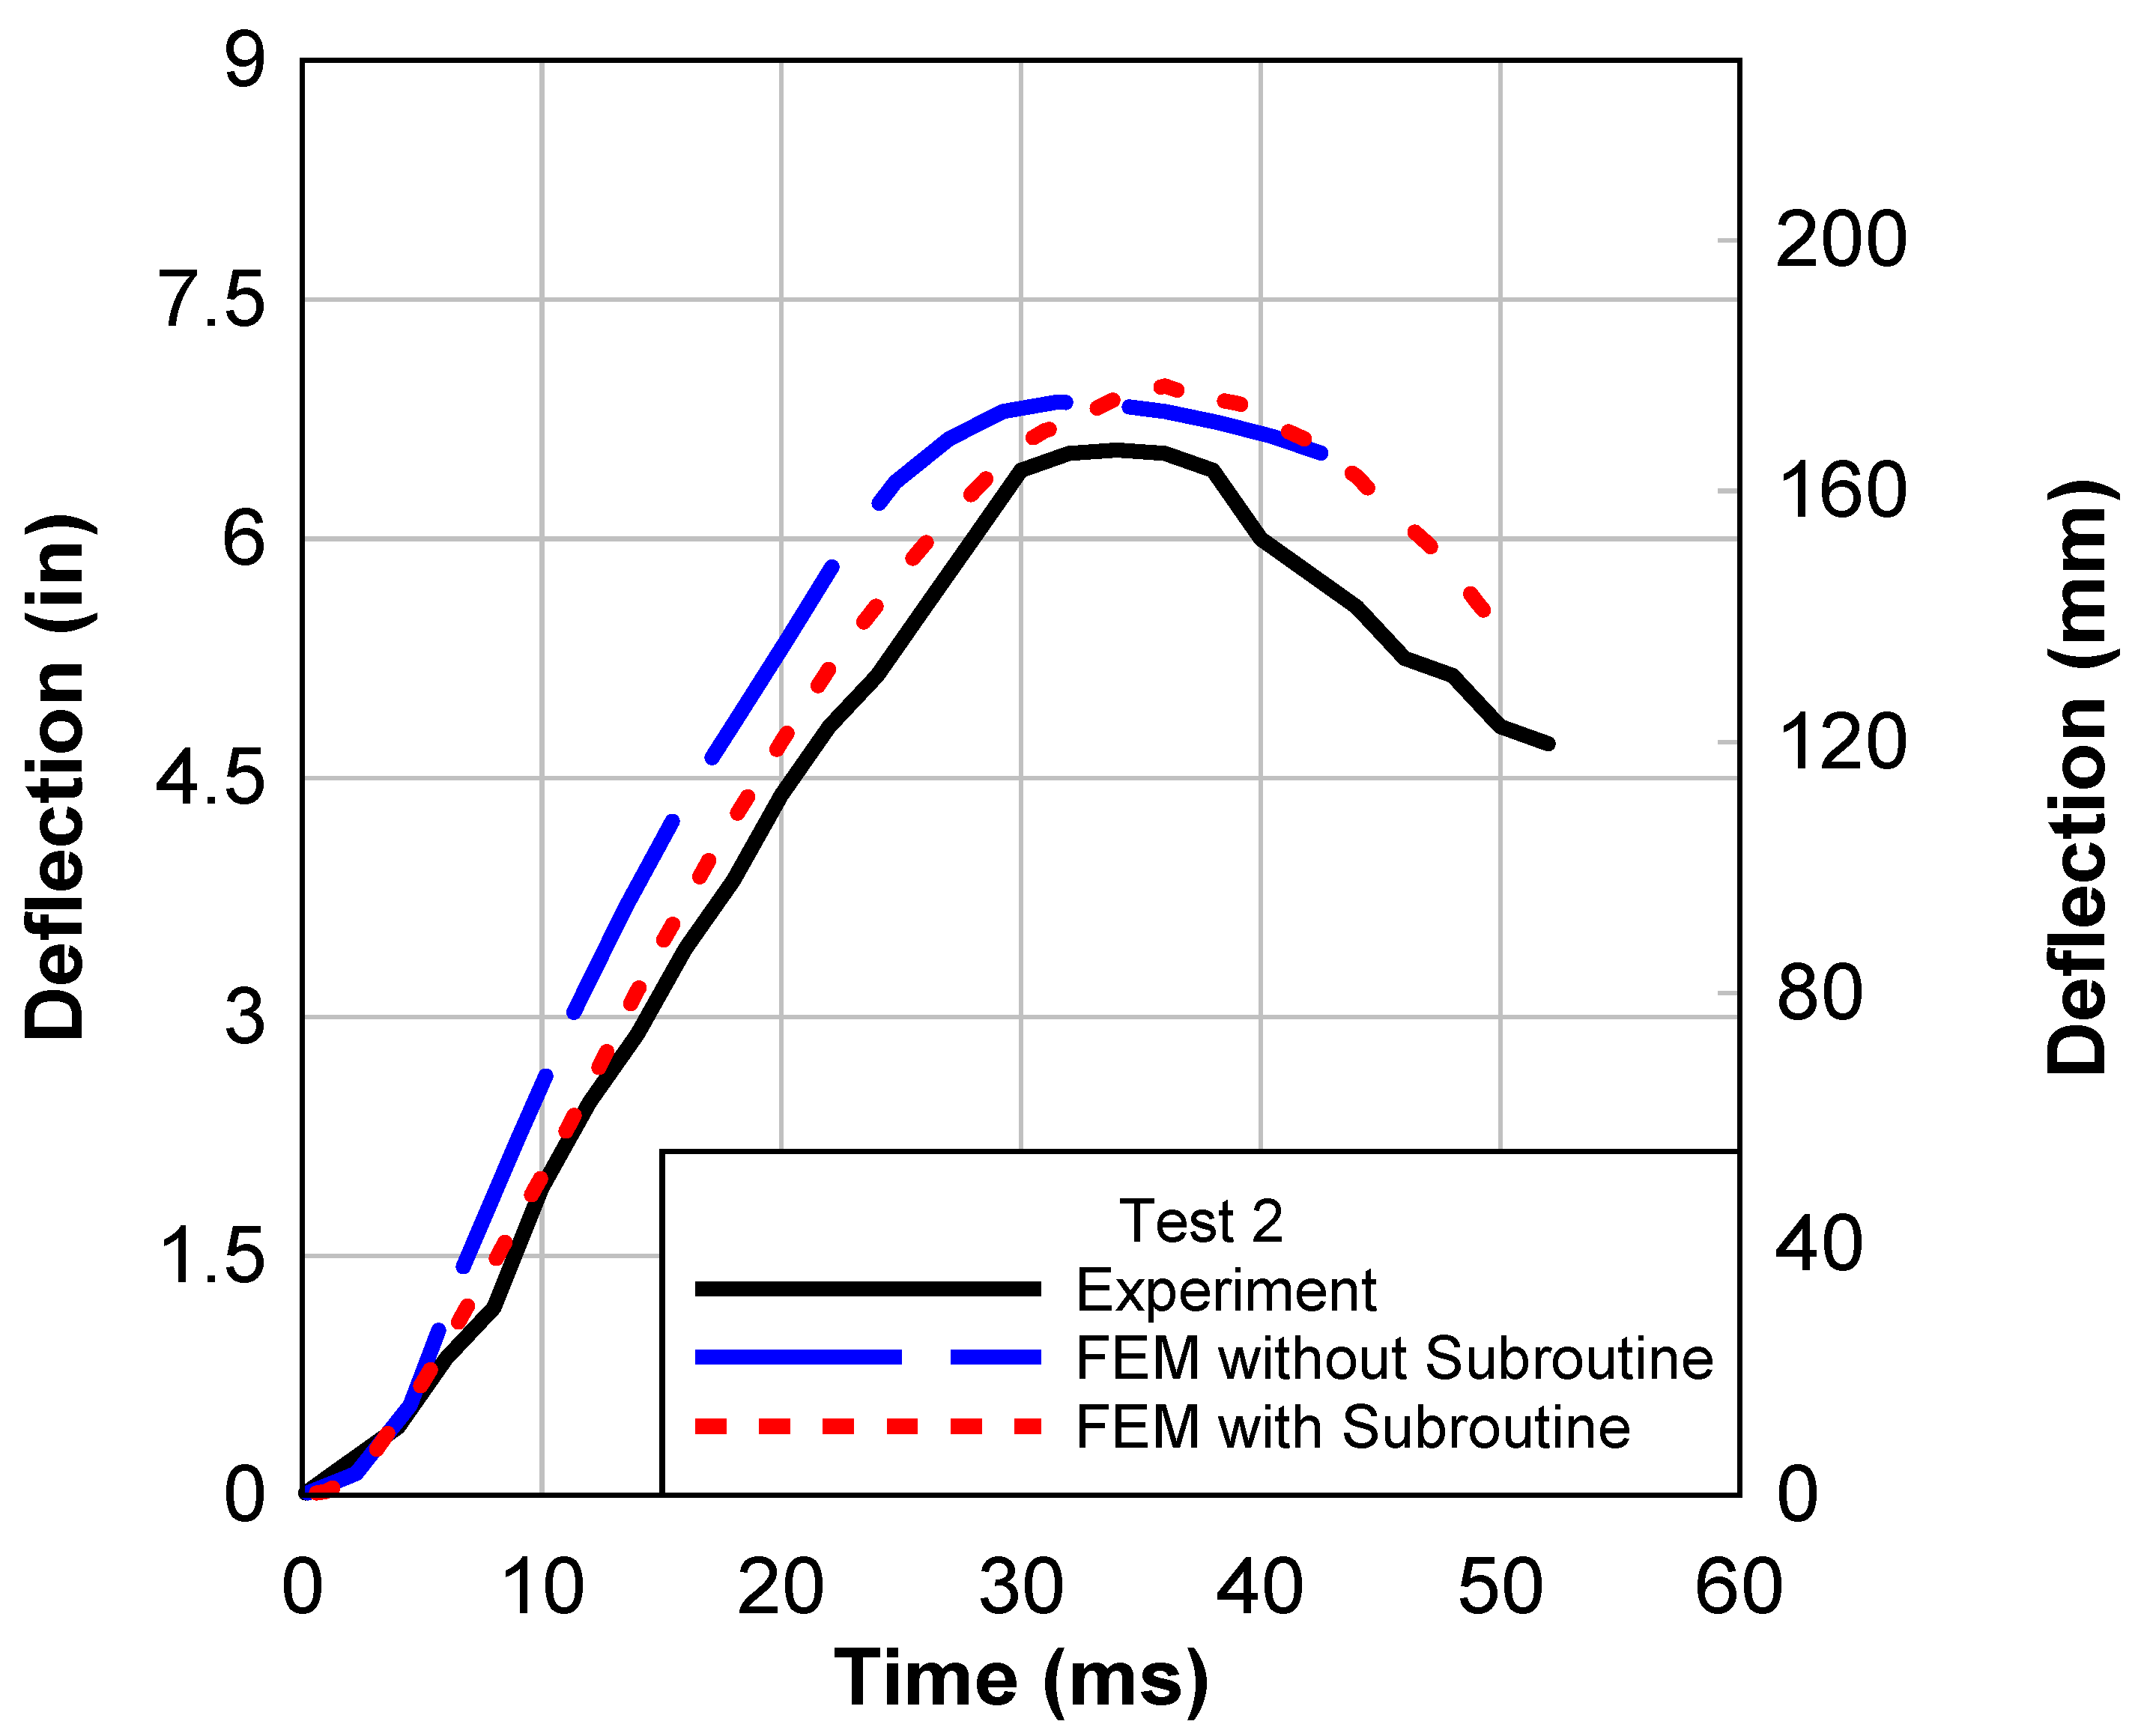
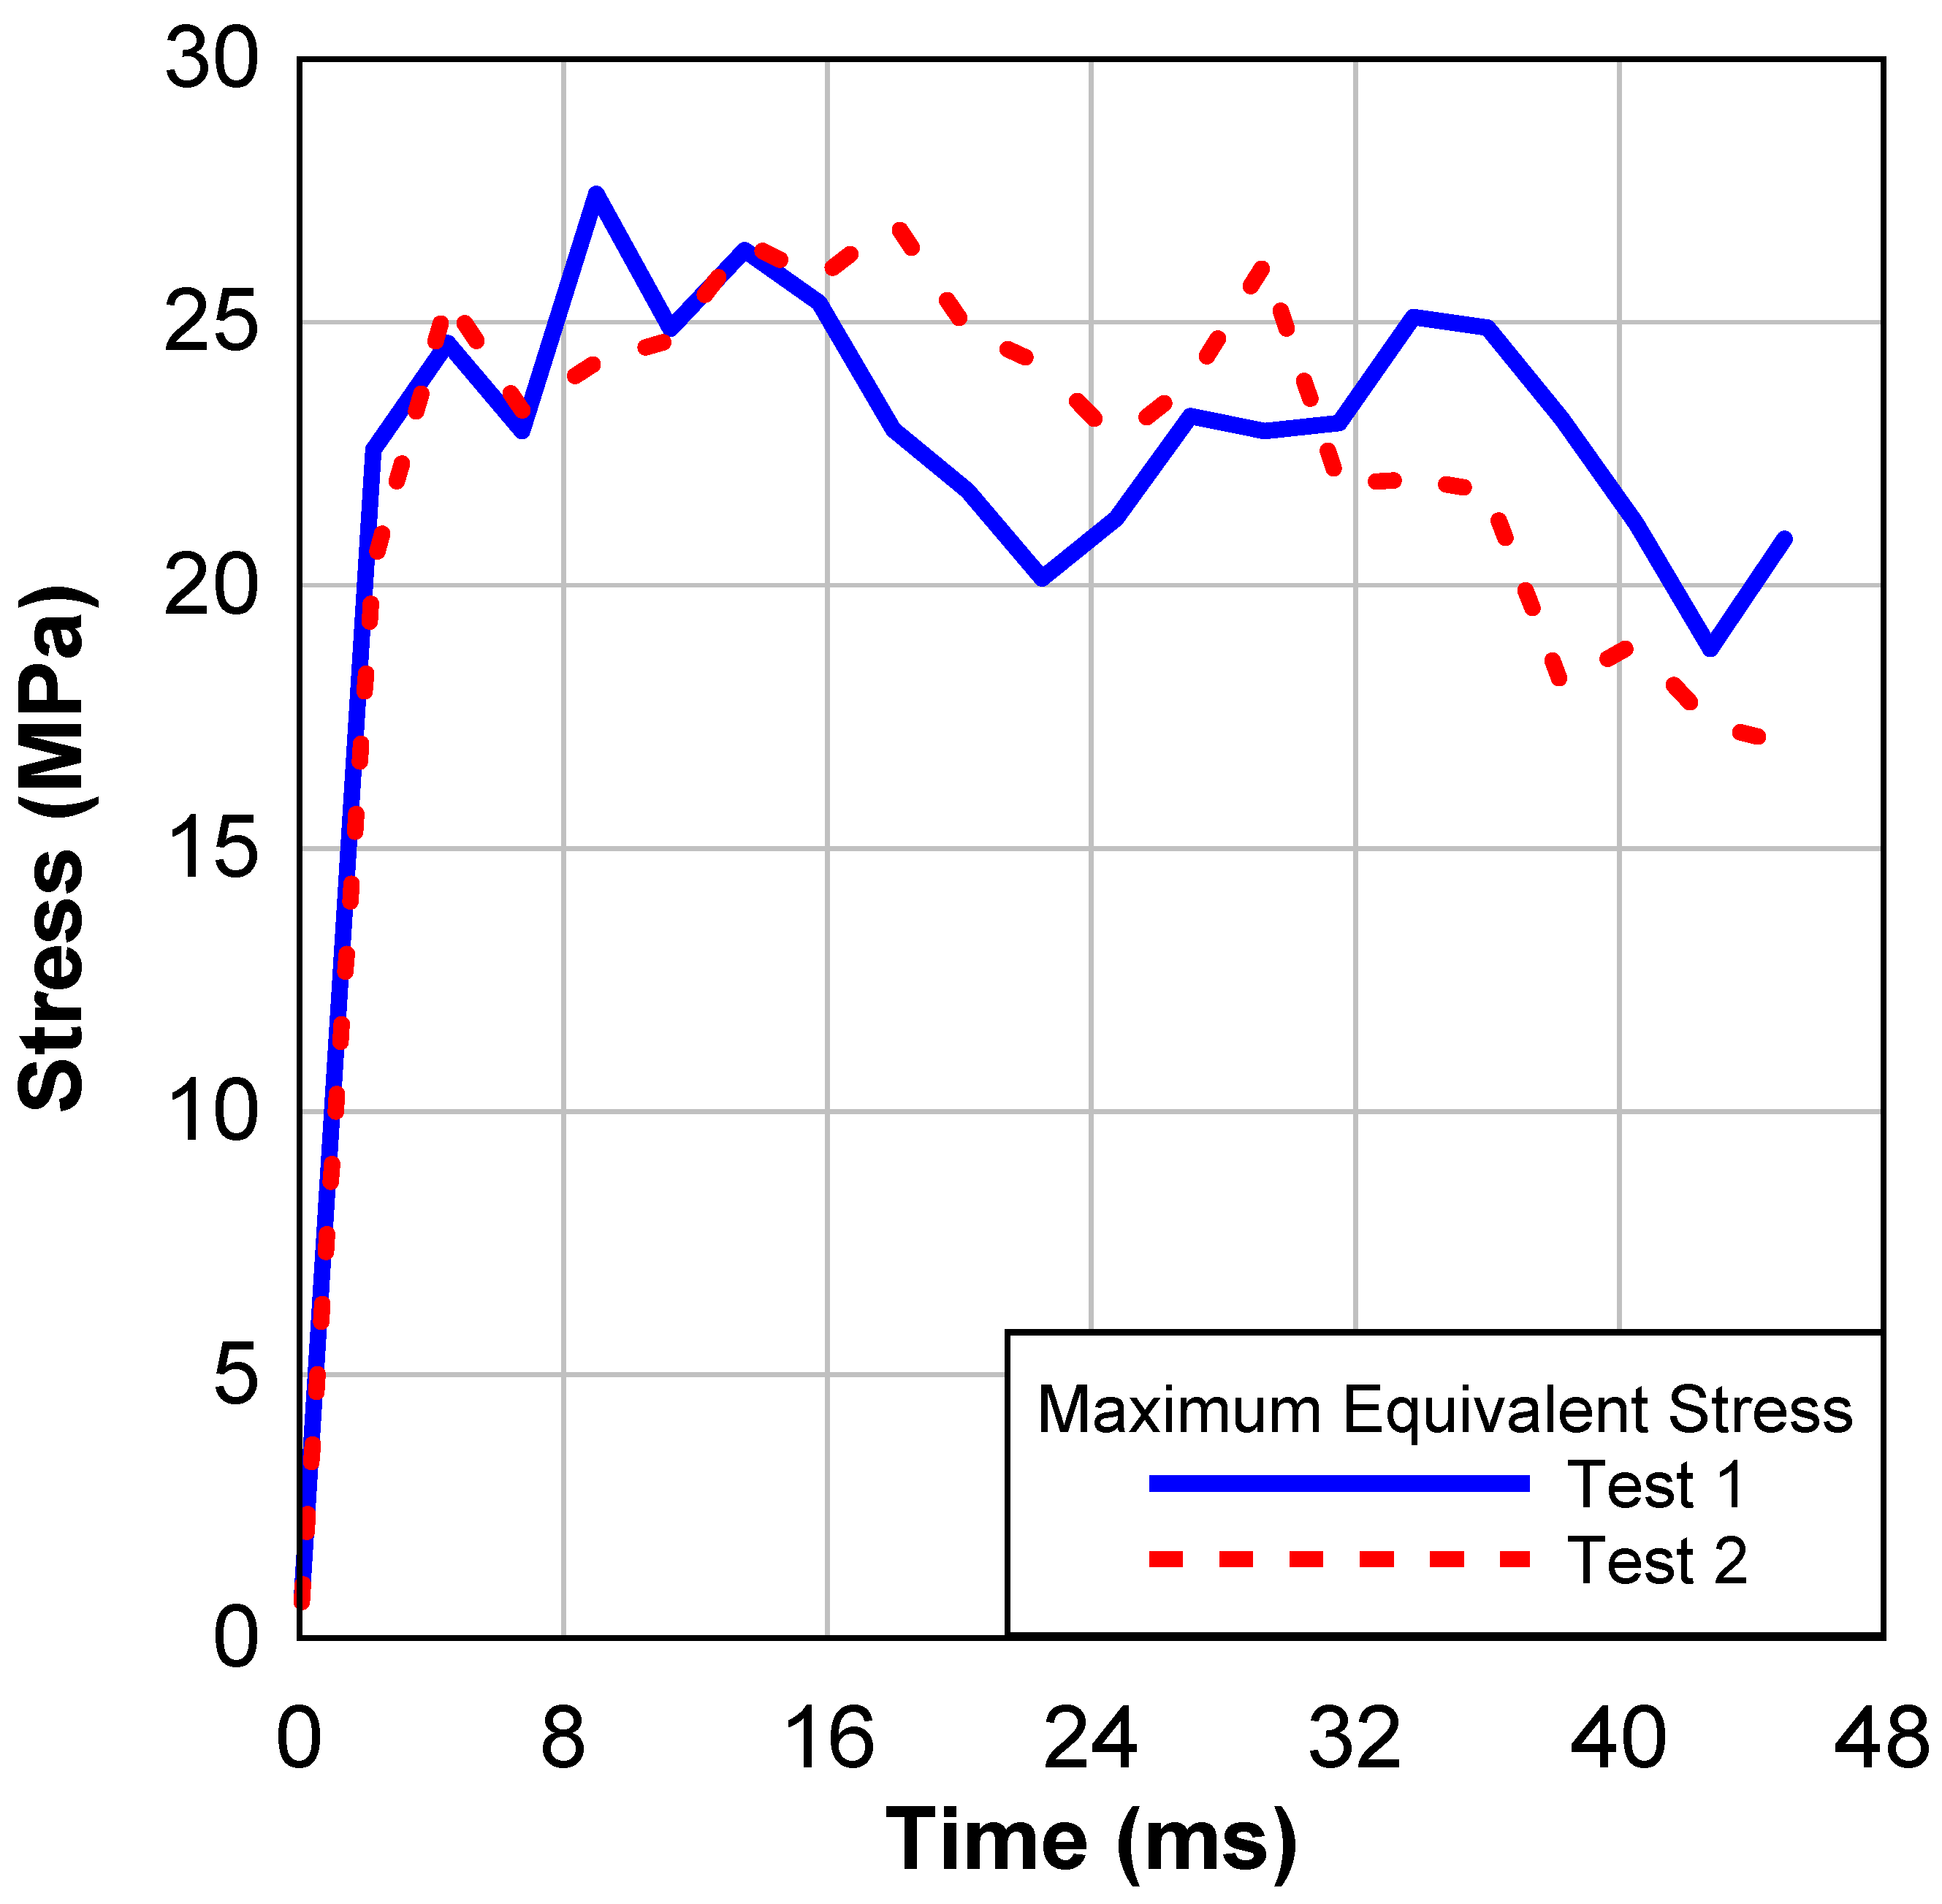
To validate the numerical models, a comparison between the experimental and numerical results for the deflections, particularly in the initial and post-peak responses, was performed. As shown in Figure 11 and Figure 12, the EDG–FEM numerical results and the experimental results for the LG panels exhibited satisfactory agreement (a maximum percent difference of 4% was obtained). This indicates that the EDG–VUMAT subroutine was able to capture the failure response of the system under blast loads. In fact, the experimental response and the EDG–FEM model matched very closely prior to the peak values. On the other hand, the built-in constitutive description in Abaqus did not produce the same satisfactory agreement. Both the pre-peak and post-peak responses have relatively large discrepancies for the built-in constitutive model. These observations agree with the discussion presented earlier regarding the unsuitable practice of using the equivalent plastic strain criterion to determine the brittle failure of glass. The accuracy of using the elasto-damage model highlights its potential for use in analyzing the behavior of LG windows under blast loads. Figure 13 depicts a comparison between the mode of failure observed in the experimental work and the finite element model for test 1. The finite element model with EDG successfully captured the failure of the LG panel, as well as detachment at the border of the panel. Figure 14 shows the maximum equivalent stress history for test 1 and test 2.
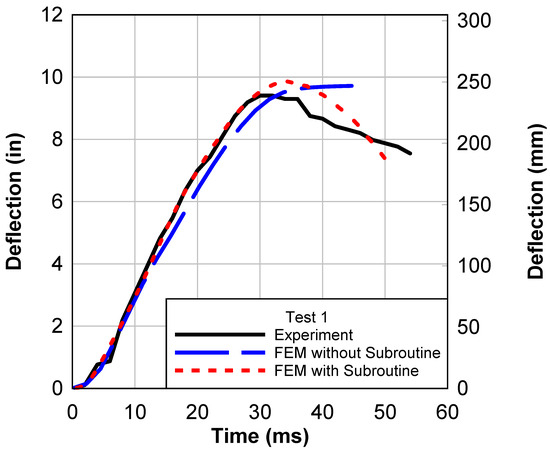
Figure 11.
Center deflection comparison for test 1.
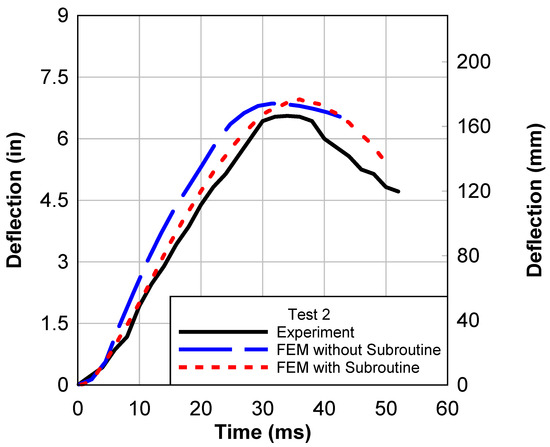
Figure 12.
Center deflection comparison for test 2.
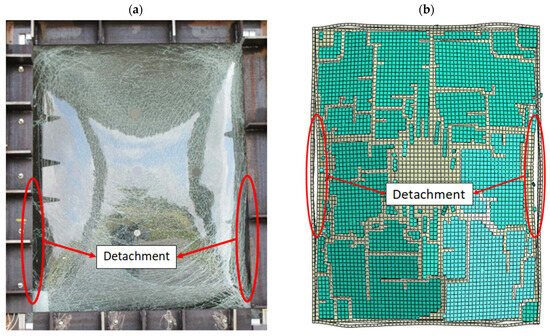
Figure 13.
Comparison between the mode of failure for test 1 from: (a) the experimental work and (b) the finite element model with EDG.
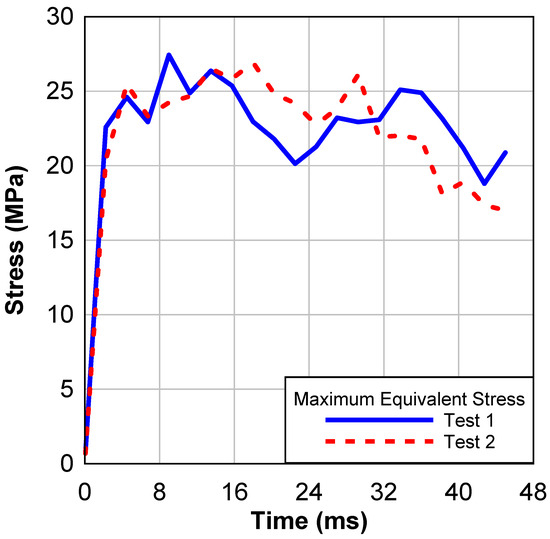
Figure 14.
Maximum equivalent stress history for test 1 and test 2.
5.2. Parametric Study on Effect of Glass Type
In the previous section, a verified subroutine was introduced to model the brittle failure of glass. This subroutine allowed for improved modeling results that accurately captured the actual experimental outcomes. With the successful validation of this subroutine, a parametric study is presented, focusing on the effect of glass type on the blast resistance response of LG panels. Table 4 presents the simulation matrix for the parametric study. All the models had a PVB interlayer with a thickness of 1.524 mm (0.06 in) and each of the glass panes had a thickness of 3.175 mm (0.125 in). The JC material model was used for the PVB interlayer and the corresponding constants are shown in Table 2.
Table 4.
Modeling matrix for the paramertic study.
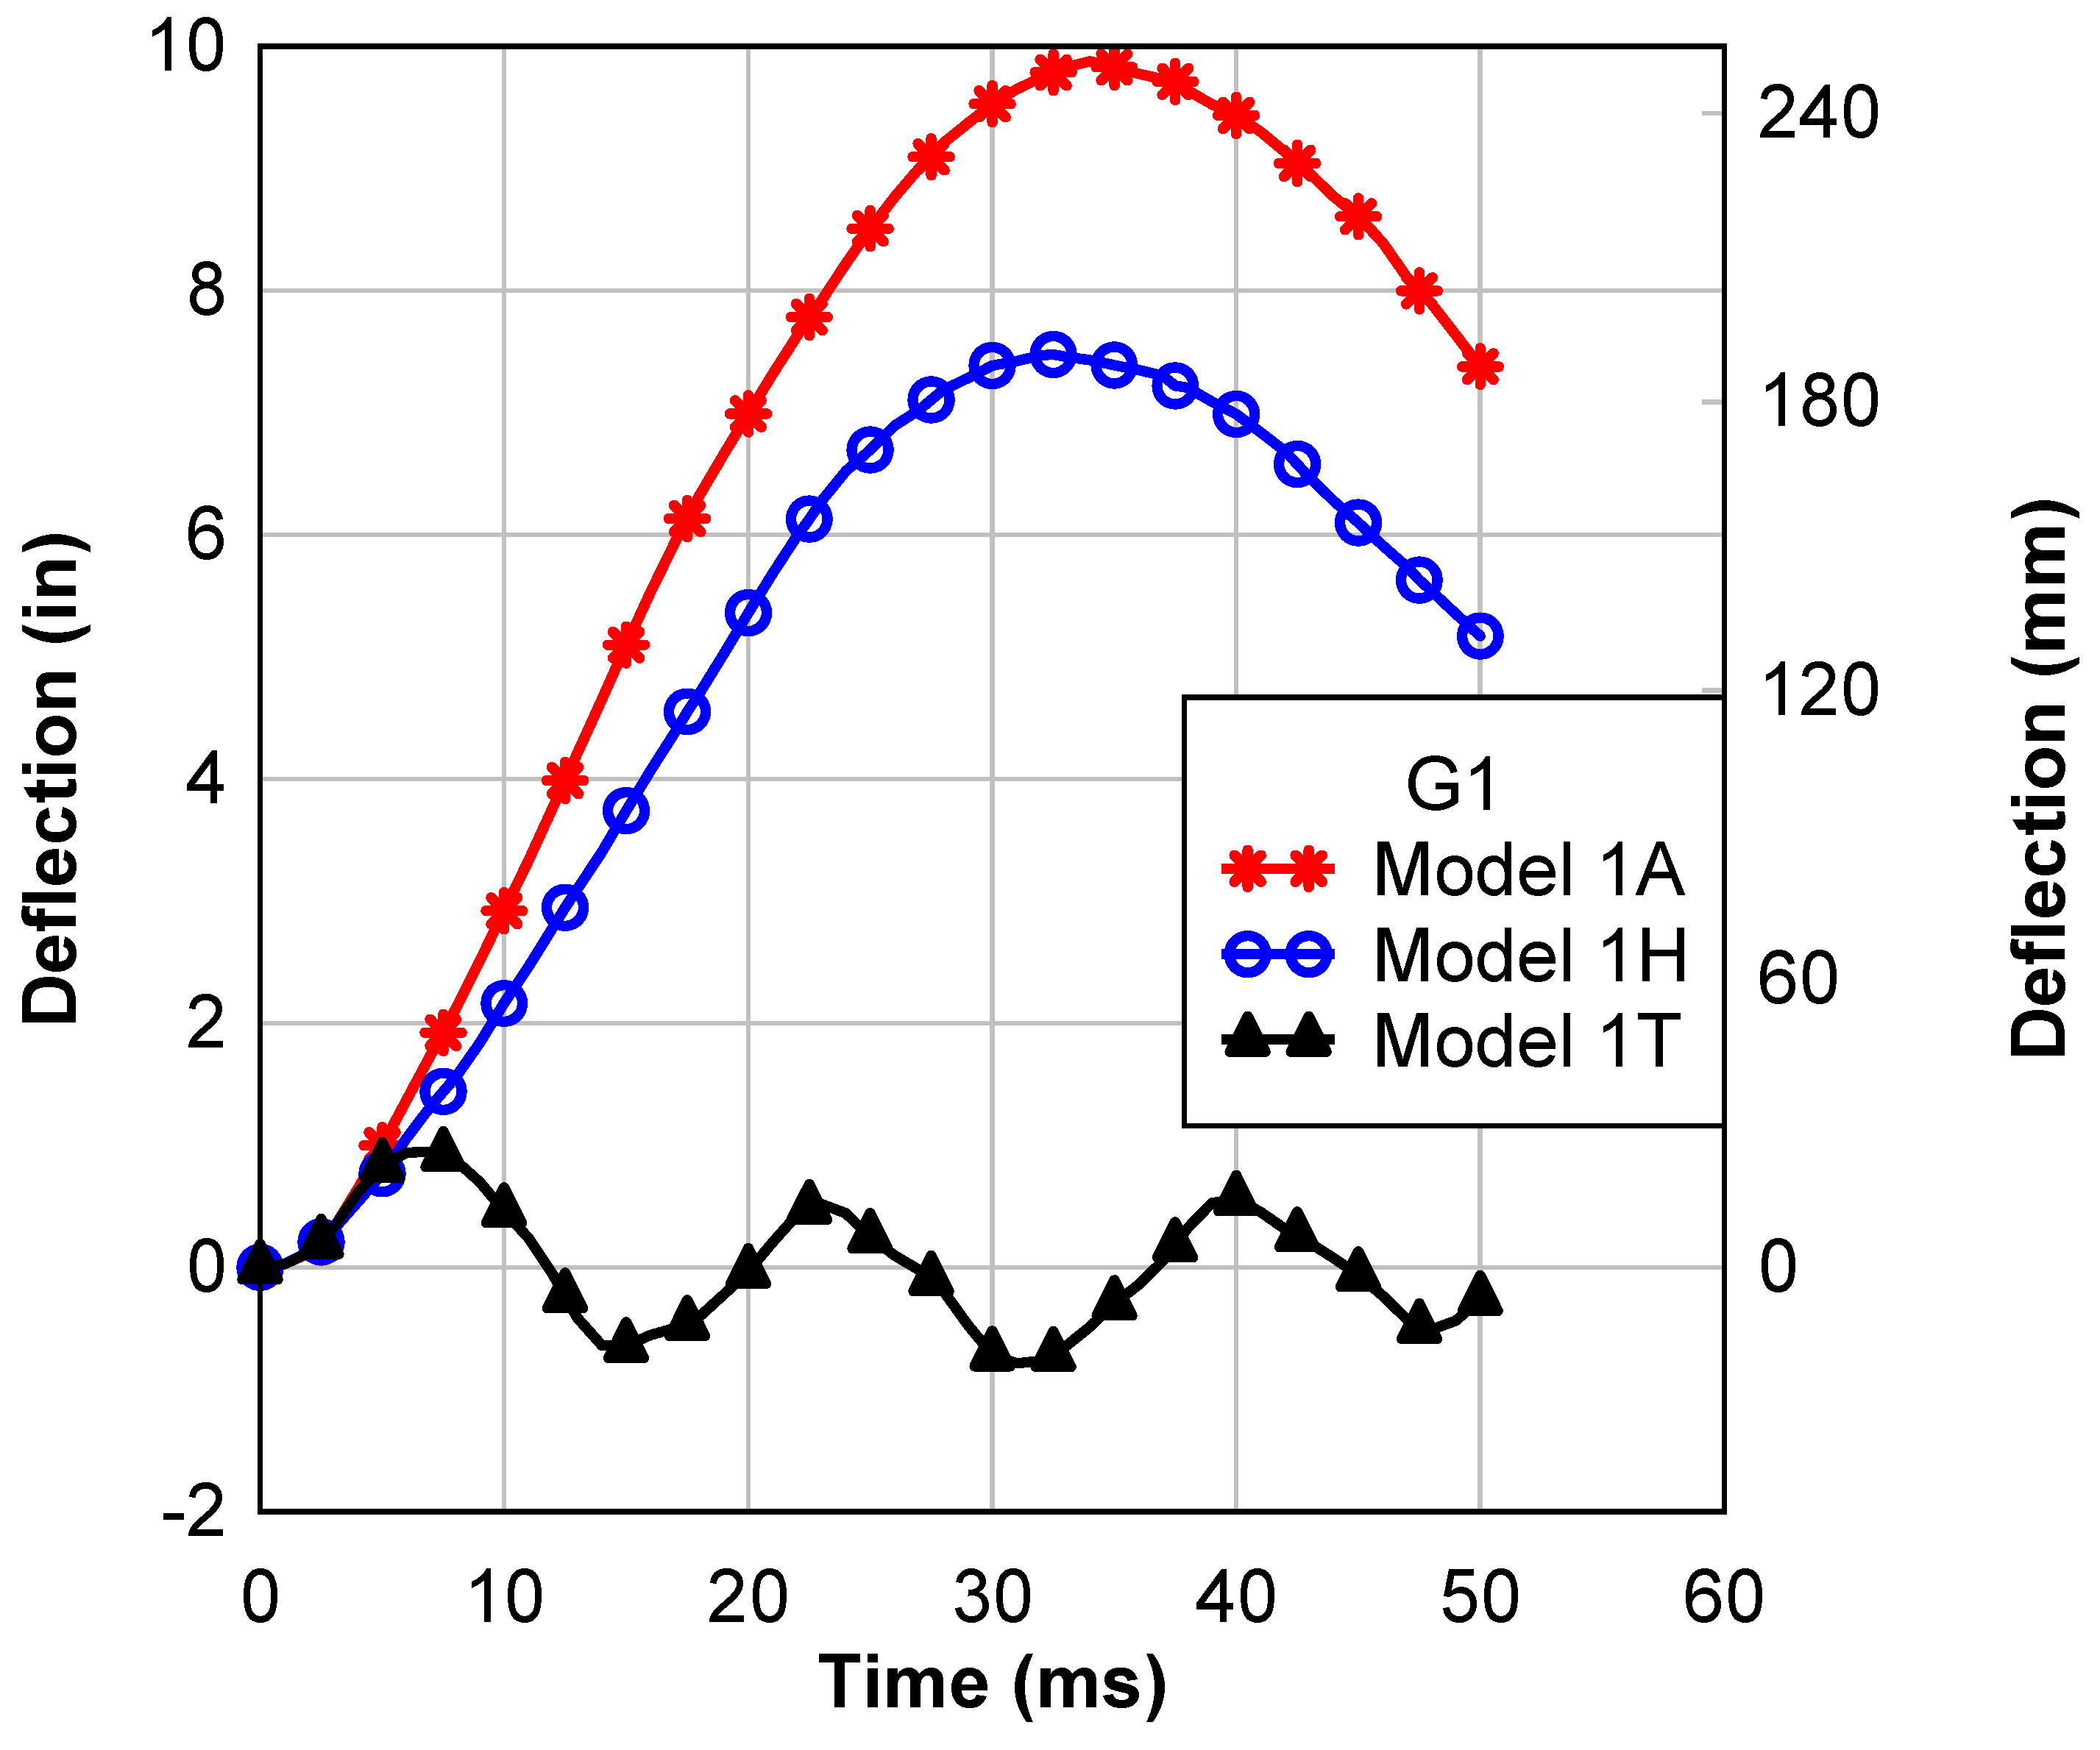
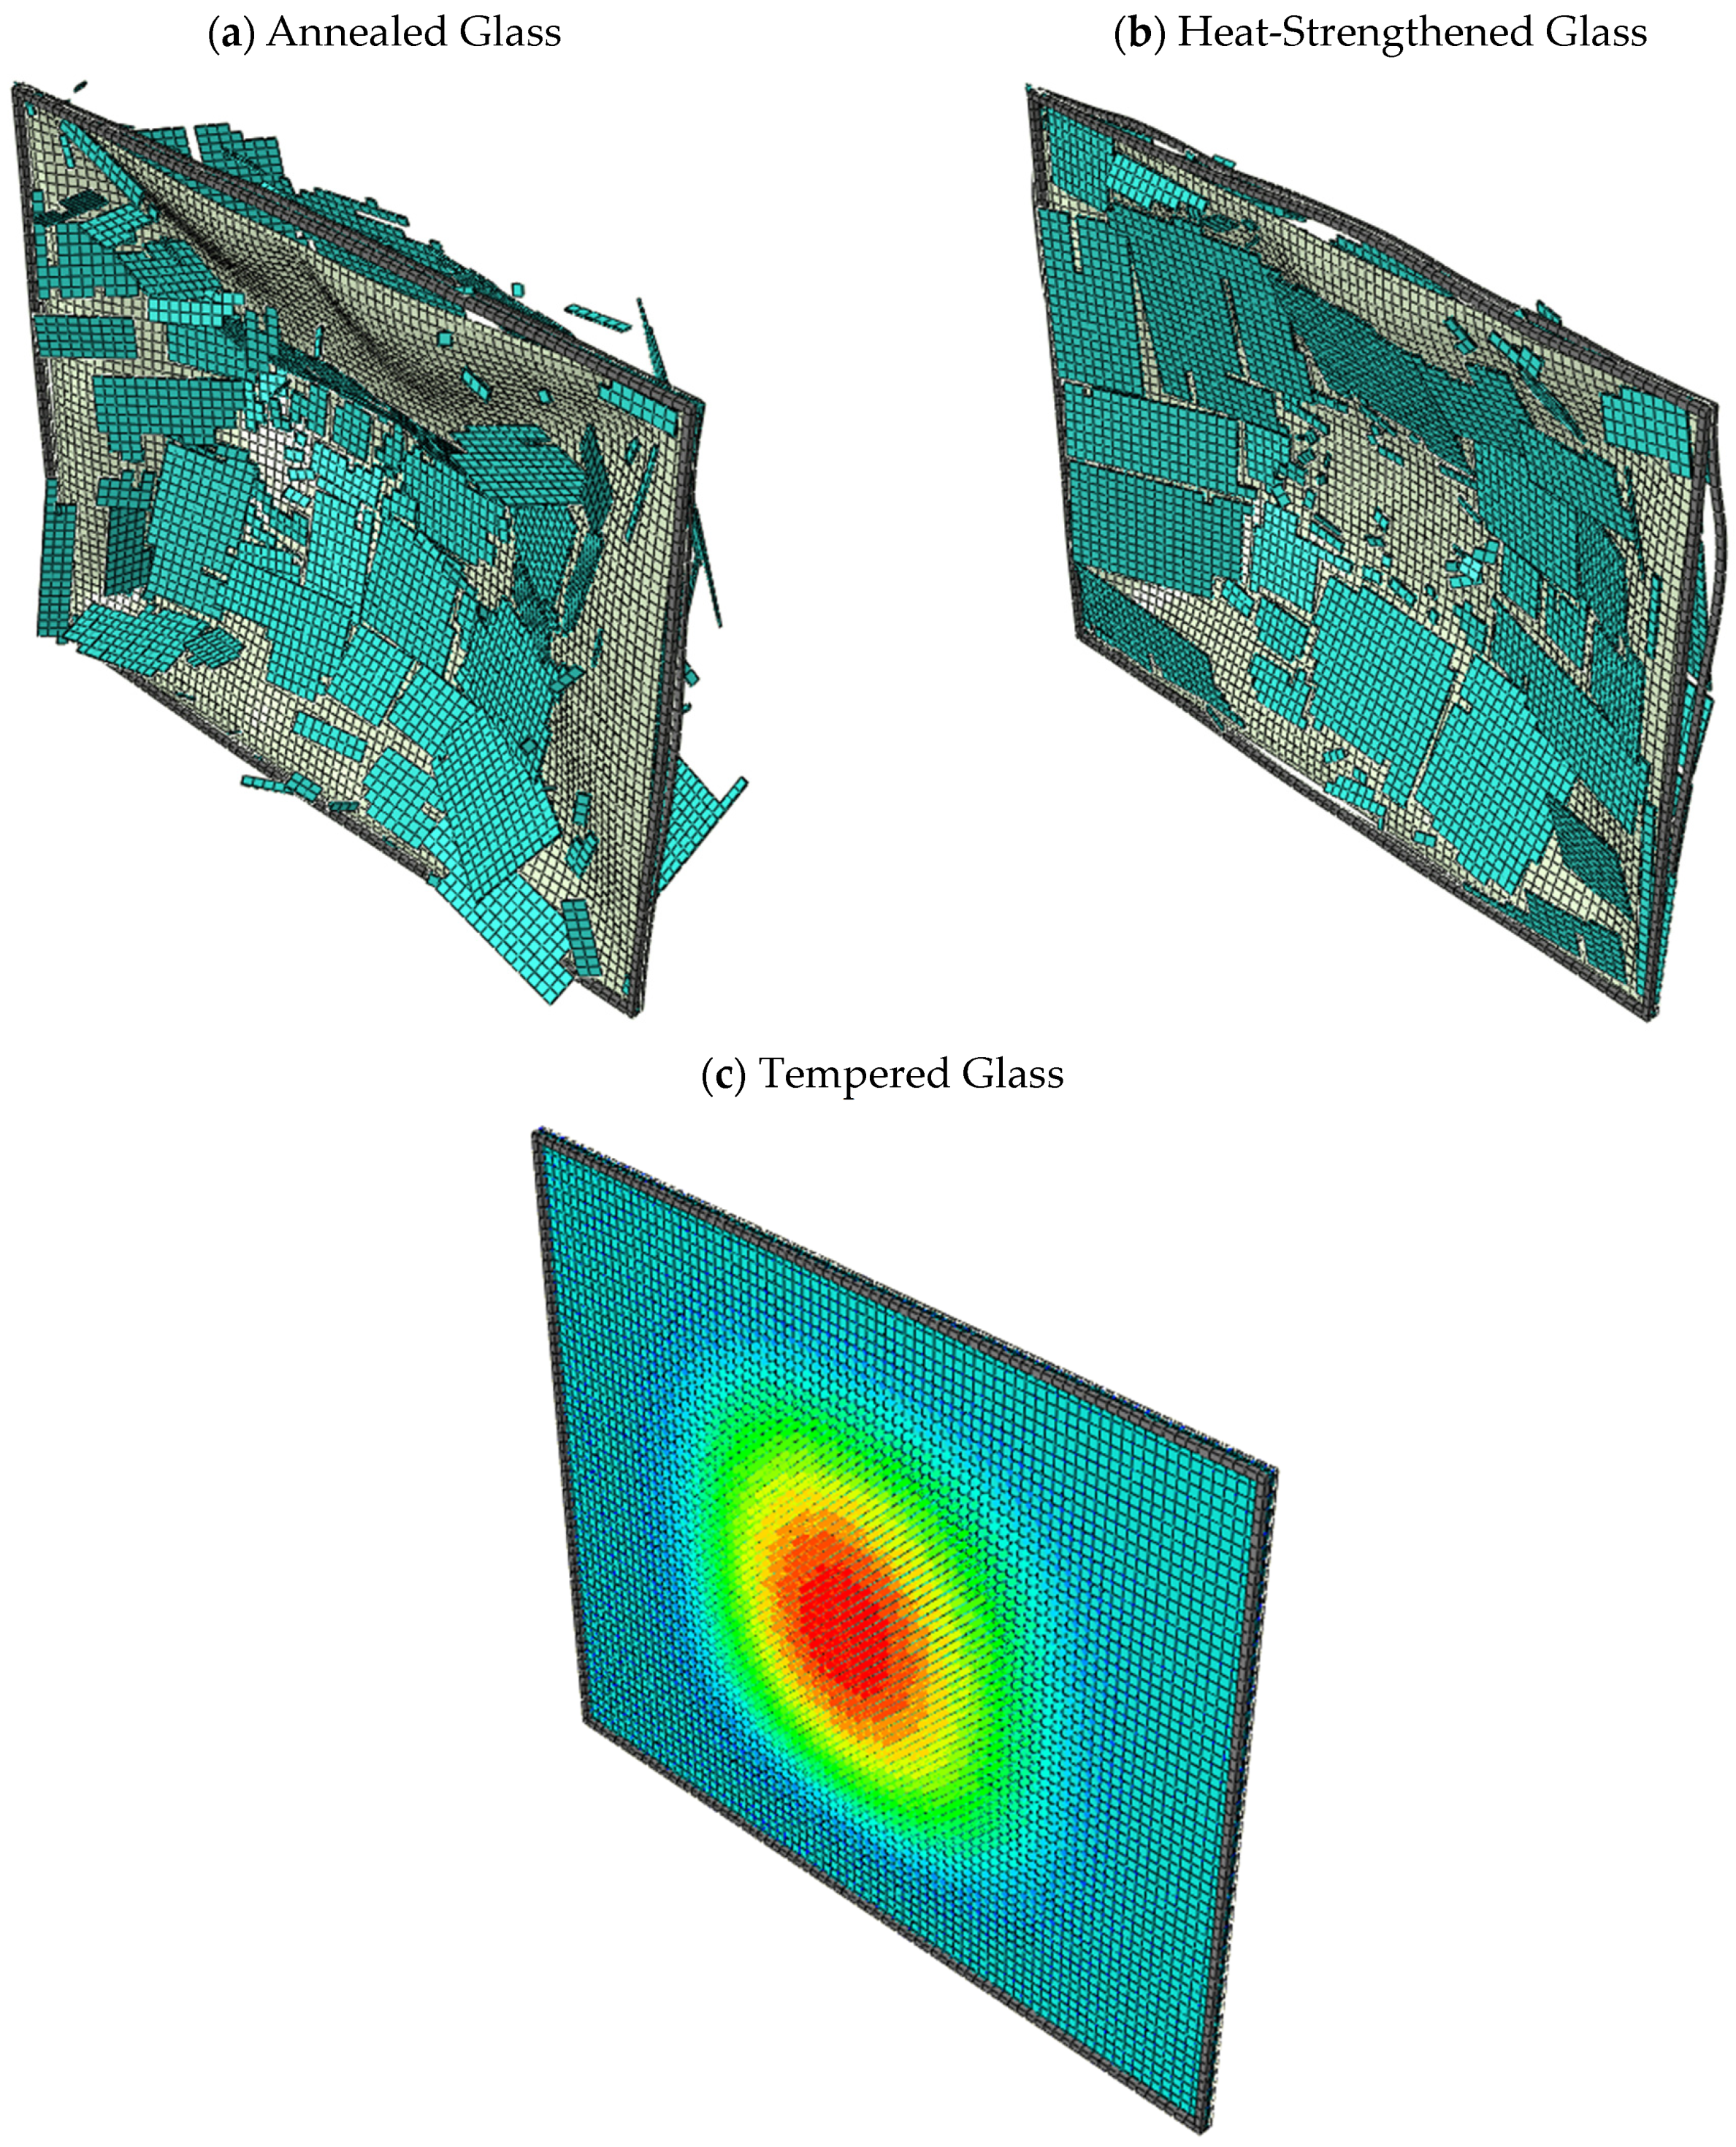
Figure 15 and Figure 16 depict comparisons of the deflections at the center of the six LG panels of groups G1 and G2, each featuring a different glass type, i.e., annealed, heat-strengthened, or tempered glass. These panels were subjected to the same blast pressure–time histories measured in test 1 and test 2 (Figure 8a,b). Figure 17 and Figure 18 show the deflection contours of all three panels studied in group G1. Significant damage was observed in the annealed and heat-strengthened panels. However, no damage was observed in the tempered glass panels, and thus deflection contours were added to Figure 17c and Figure 18c.

Figure 15.
Comparison between deflection histories for group G1.
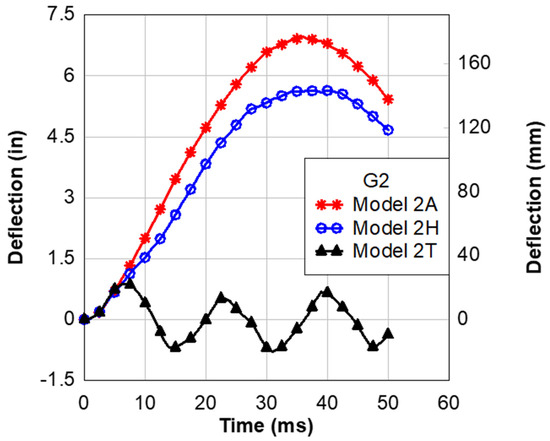
Figure 16.
Comparison between deflection histories for group G2.
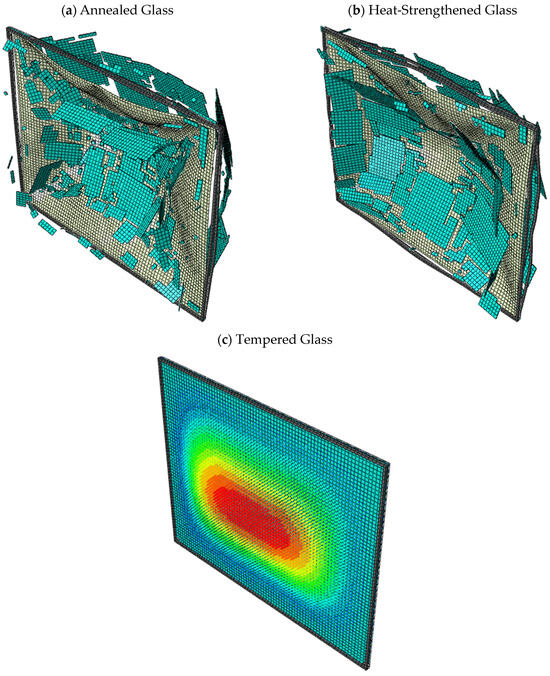
Figure 17.
Deflection shapes at failure for group G1: (a) model 1A, (b) model 1H, and (c) model 1T.
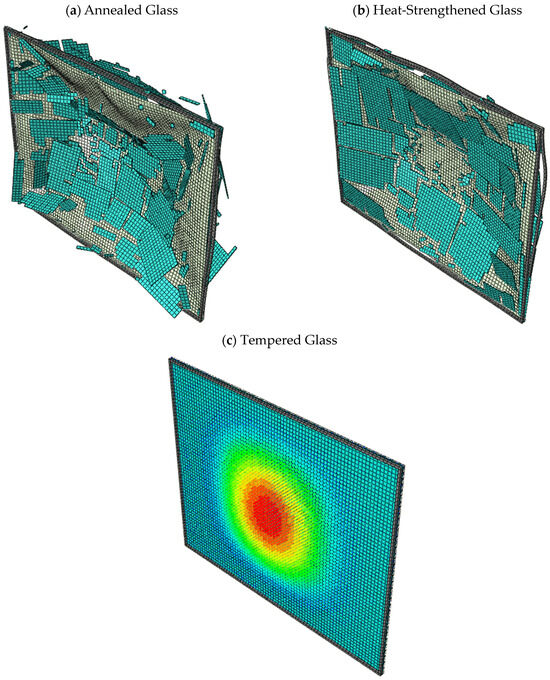
Figure 18.
Deflection shapes at failure for group G2: (a) model 2A, (b) model 2H, and (c) model 2T.
By examining the deflection values at the panel centers for different glass types under blast loading conditions, valuable insights were gained into the varying blast resistance responses of the LG panels. This study offers valuable information on how the choice of glass type influences the structural performance of LG panels when subjected to blast loads.
According to data from the developed EDG–FEM model, the panel with annealed glass exhibited a maximum deflection at the center of 251 mm (9.88 in) in model 1A and 176 mm (6.93 in) in model 2A. Figure 17a and Figure 18a illustrate that this panel sustained significant damage in both test scenarios. On the other hand, the panel with heat-strengthened glass experienced a maximum center deflection of 190 mm (7.47 in) in model 1H and 143 mm (5.64 in) in model 2H, with relatively less damage compared to the annealed glass panel, as depicted in Figure 17b and Figure 18b. In contrast, the tempered glass panel had a maximum center deflection of only 24 mm (0.94 in) in model 1T and 22 mm (0.89 in) in model 2T, with no observable damage to the panel, as shown in Figure 17c and Figure 18c. Essentially, the maximum deflection of the tempered glass panels was approximately seven times lower than that of the annealed glass panels and six times lower than that of the heat-strengthened panels.
The superior blast resistance of the tempered glass panel can be attributed to its high tensile stress capacity, which is four times that of annealed glass and twice that of heat-strengthened glass. This increased tensile strength results from a specialized heat treatment process that enhances the strength of the glass and its resistance to fracture. These findings highlight the significant impact of glass type on the blast resistance response of LG windows.
6. Conclusions
An FEM approach is proposed in this work to quantitively capture the brittle failure response of glass in blast-resistant LG windows. The proposed approach utilizes an in-house developed subroutine to model glass, integrated through the virtual user material (VUMAT) subroutine in Abaqus, based on the Rankine failure criterion. The model was validated against shock tube testing results, ensuring its reliability and applicability. Material parameters for the polymeric interlayer were calibrated through dynamic tensile experiments at different strain rates, enabling a reasonable description of its constitutive behavior using the JC material model.
Additionally, a parametric study was conducted to investigate the influence of glass type on the blast resistance performance of LG panels. The results show that tempered glass exhibited remarkable resistance to blast loading compared to annealed glass and heat-strengthened glass. Unlike the annealed and heat-strengthened glass panels, tempered glass did not fail, demonstrating its superior strength and ability to withstand the applied blast loads. The failure of the glass in the annealed and heat-strengthened panels resulted in complete rupture and, in many cases, disengagement from the frame.
The findings emphasize the importance of utilizing reasonable material models in model-based simulations. The elasto-damage description based on the Rankine failure criterion provides a more precise representation of the failure response than commonly used approaches, such as the built-in equivalent plastic strain or stress failure criteria. These insights could contribute to advancing model-based simulation approaches for designing blast-resistant LG windows and highlight the need for improved modeling practice. Future efforts are required to better understand the failure mechanisms of LG windows under a broad range of loading rates.
Author Contributions
Conceptualization, A.E. (Alaa Elsisi), H.S. and Z.C.; Methodology, A.E. (Ahmed Elbelbisi), M.H.S. and Z.C.; Software, A.E. (Ahmed Elbelbisi) and A.E. (Alaa Elsisi); Validation, A.E. (Ahmed Elbelbisi) and A.E. (Alaa Elsisi); Investigation, M.H.S.; Writing—original draft, A.E. (Ahmed Elbelbisi); Writing—review & editing, A.E. (Alaa Elsisi), M.H.S., H.S. and Z.C.; Supervision, H.S. and Z.C.; Project administration, H.S. All authors have read and agreed to the published version of the manuscript.
Funding
This research received no external funding.
Data Availability Statement
The raw/processed data and codes required to reproduce these findings are available from the authors upon reasonable request. The data are not publicly available due to privacy.
Conflicts of Interest
The authors declare no conflict of interest.
References
- Norville, H.S.; Harvill, N.; Conrath, E.J.; Shariat, S.; Mallonee, S. Glass-Related Injuries in Oklahoma City Bombing. J. Perform. Constr. Facil. 1999, 13, 50–56. [Google Scholar] [CrossRef]
- Martín, M.; Centelles, X.; Solé, A.; Barreneche, C.; Fernández, A.I.; Cabeza, L.F. Polymeric interlayer materials for laminated glass: A review. Constr. Build. Mater. 2020, 230, 116897. [Google Scholar] [CrossRef]
- Nawar, M.; Salim, H.; Newberry, M.; El-Sisi, A. High strain rate response of laminated glass interlayer materials. Constr. Build. Mater. 2021, 299, 123934. [Google Scholar] [CrossRef]
- El-Sisi, A.; Newberry, M.; Knight, J.; Salim, H. Nawar, Static and high strain rate behavior of aged virgin PVB. J. Polym. Res. 2022, 29, 39. [Google Scholar] [CrossRef]
- Elbelbisi, A.; El-Sisi, A.; Knight, J.; Philipps, J.C.; Newberry, M.; Salim, H. Influence of panels size on the static and dynamic performance of laminated glass panels. Constr. Build. Mater. 2023, 399, 132562. [Google Scholar] [CrossRef]
- Shetty, M.S.; Wei, J.; Dharani, L.R.; Stutts, D.S. Analysis of Damage in Laminated Architectural Glazing Subjected to Wind Loading and Windborne Debris Impact. Buildings 2013, 3, 422–441. [Google Scholar] [CrossRef]
- Nawar, M.; Salim, H.; Lusk, B.; Kiger, S. Numerical Simulation and Verification of Curtain Wall Systems under Shock Pressure. Pract. Period. Struct. Des. Constr. 2014, 19, 04014008. [Google Scholar] [CrossRef]
- Nawar, M.; Salim, H.; Lusk, B.; Perry, K.; Kiger, S.; Miller, G. Modeling and testing of laminated curtain wall systems under blast loading. In Proceedings of the Structures Congress 2013: Bridging Your Passion with Your Profession-Proceedings of the 2013 Structures Congress, Pittsburgh, PA, USA, 2–4 May 2013; pp. 170–180. [Google Scholar] [CrossRef]
- Bedon, C.; Noè, S.; Fasan, M.; Amadio, C. Role of In-Field Experimental Diagnostic Analysis for the Derivation of Residual Capacity Indexes in Existing Pedestrian Glass Systems. Buildings 2023, 13, 754. [Google Scholar] [CrossRef]
- Amadio, C.; Bedon, C. Blast Analysis of Laminated Glass Curtain Walls Equipped by Viscoelastic Dissipative Devices. Buildings 2012, 2, 359–383. [Google Scholar] [CrossRef]
- Biolzi, L.; Simoncelli, M. Overall response of 2-ply laminated glass plates under out-of-plane loading. Eng. Struct. 2022, 256, 113967. [Google Scholar] [CrossRef]
- Chen, X.; Chen, S.; Zhang, Y.; Wang, Z. Blast Resistance of Ionomer-Laminated Glass and the Effect of Negative Blast Pressure. J. Struct. Eng. 2023, 149, 4022221. [Google Scholar] [CrossRef]
- Xia, W.; Yue, Z.; Zang, M. Impact Fracture Simulation of Laminated Glass Based on Thick Shell Elements and a Cohesive Zone Model. Materials 2023, 16, 6966. [Google Scholar] [CrossRef]
- Liu, W.; Shi, Y.; Hao, H.; Cui, J. Experimental and numerical study on dynamic behavior of laminated glass window under combustible gas explosions. Eng. Struct. 2024, 300, 117159. [Google Scholar] [CrossRef]
- El-Belbisi, A. Strengthening of Pre-stressed Steel--Concrete Composite Beams Using Carbon Fiber Tendons—A Parametric Study. Arch. Med. 2018, 4, 7. [Google Scholar]
- Knight, J.T.; El-Sisi, A.A.; Elbelbisi, A.H.; Newberry, M.; Salim, H.A. Mechanical Behavior of Laminated Glass Polymer Interlayer Subjected to Environmental Effects. Polymers 2022, 14, 5113. [Google Scholar] [CrossRef]
- Eslami, M.; Mosalam, K.M.; Kodur, V.; Young, C.C. Multi-performance blast pressure-duration curves for point-supported laminated and monolithic glass panes. Eng. Struct. 2023, 293, 116620. [Google Scholar] [CrossRef]
- Ahani, A.; Ahani, E. An overview for materials and design methods used for enhancement of laminated glass. Hybrid Adv. 2023, 3, 100063. [Google Scholar] [CrossRef]
- CBedon; Larcher, M.; Bez, A.; Amadio, C. Numerical Analysis of TGU Windows under Blast–GLASS-SHARD Outlook. In Proceedings of the Challenging Glass Conference Proceedings, Ghent, Belgium, 8–24 June 2022; Volume 8. [Google Scholar]
- Norville, H.S.; Conrath, E.J. Blast-Resistant Glazing Design. J. Archit. Eng. 2006, 12, 129–136. [Google Scholar] [CrossRef]
- Norville, H.S.; Conrath, E.J. Considerations for Blast-Resistant Glazing Design. J. Archit. Eng. 2001, 7, 80–86. [Google Scholar] [CrossRef]
- Biggs, J.M. Introduction to Structural Dynamics; McGraw-Hill Companies: New York, NY, USA, 1964. [Google Scholar]
- Krauthammer, T.; Altenberg, A. Negative phase blast effects on glass panels. Int. J. Impact Eng. 2000, 24, 1–17. [Google Scholar] [CrossRef]
- Wei, J.; Dharani, L.R. Response of laminated architectural glazing subjected to blast loading. Int. J. Impact Eng. 2006, 32, 2032–2047. [Google Scholar] [CrossRef]
- Morison, C. The Resistance of Laminated Glass to Blast Pressure Loading and the Coefficients for Single Degree of Freedom Analysis of laminated Glass. Ph.D. Thesis, Cranfield University, Cranfield, UK, 2007. [Google Scholar]
- Hidallana-Gamage, H.D.; Thambiratnam, D.P.; Perera, N.J. Failure analysis of laminated glass panels subjected to blast loads. Eng. Fail. Anal. 2014, 36, 14–29. [Google Scholar] [CrossRef]
- Meyers, G.E.; Baldwin, D.; Mlakar, P. State of the Art of Blast Resistant Windows; Defense Technical Information Centre (DTIC): Fort Belvoir, VA, USA, 1994; p. 25. [Google Scholar]
- Weissman, S.; Dobbs, N.; Stea, W.; Price, P. Blast Capacity Evaluation of Glass Windows and Aluminum Window Frames; Ammann and Whitney: New York, NY, USA, 1978. [Google Scholar]
- Ge, J.; Li, G.-Q.; Chen, S.-W. Theoretical and experimental investigation on fragment behavior of architectural glass panel under blast loading. Eng. Fail. Anal. 2012, 26, 293–303. [Google Scholar] [CrossRef]
- Larcher, M.; Solomos, G.; Casadei, F.; Gebbeken, N. Experimental and numerical investigations of laminated glass subjected to blast loading. Int. J. Impact Eng. 2012, 39, 42–50. [Google Scholar] [CrossRef]
- Hooper, P. Blast Performance of Silicone-Bonded Laminated Glass; Department of Mechanical Engineering: London, UK, 2011; p. 304. [Google Scholar]
- Zhang, X.; Hao, H. Experimental and numerical study of boundary and anchorage effect on laminated glass windows under blast loading. Eng. Struct. 2015, 90, 96–116. [Google Scholar] [CrossRef]
- Zhang, X.; Hao, H.; Wang, Z. Experimental study of laminated glass window responses under impulsive and blast loading. Int. J. Impact Eng. 2015, 78, 1–19. [Google Scholar] [CrossRef]
- Bedon, C.; Zhang, X.; Santos, F.; Honfi, D.; Kozłowski, M.; Arrigoni, M.; Figuli, L.; Lange, D. Performance of structural glass facades under extreme loads—Design methods, existing research, current issues and trends. Constr. Build. Mater. 2018, 163, 921–937. [Google Scholar] [CrossRef]
- Momeni, M.; Bedon, C. Review on Glass Curtain Walls under Different Dynamic Mechanical Loads: Regulations, Experimental Methods and Numerical Tools. In Facade Design—Challenges and Future Perspective; Bedon, C., Kozlowski, M., Stepinac, M., Eds.; IntechOpen: Rijeka, Croatia, 2023. [Google Scholar] [CrossRef]
- Elbelbisi, A.H.; El-Sisi, A.A.; Hassan, H.A.; Salim, H.A.; Shabaan, H.F. Parametric Study on Steel–Concrete Composite Beams Strengthened with Post-Tensioned CFRP Tendons. Sustainability 2022, 14, 15792. [Google Scholar] [CrossRef]
- Del Linz, P.; Hooper, P.A.; Arora, H.; Smith, D.; Pascoe, L.; Cormie, D.; Blackman, B.R.K.; Dear, J.P. Reaction forces of laminated glass windows subject to blast loads. Compos. Struct. 2015, 131, 193–206. [Google Scholar] [CrossRef]
- Zhang, X.; Hao, H. The response of glass window systems to blast loadings: An overview. Int. J. Prot. Struct. 2016, 7, 123–154. [Google Scholar] [CrossRef]
- El-Sisi, A.; Bowman, A.; Elbelbisi, A.; Elkilani, A.; Robert, S.; Salim, H.; Nawar, M. Performance of LG window systems with different materials under extreme static loading. Constr. Build. Mater. 2023, 409, 133923. [Google Scholar] [CrossRef]
- Idriss, J.S.; Lowak, M.J. Empirical Evaluation of Glazing Systems in Response to Blast Loads. In Structures Congress; American Society of Civil Engineers: Reston, VA, USA, 2014; pp. 258–269. [Google Scholar] [CrossRef]
- ASTM D638-10; Standard Test Method for Tensile Properties of Plastics. Annual Book of ASTM Standards. ASTM International: West Conshohocken, PA, USA, 2010.
- Xu, J.; Li, Y.; Liu, B.; Zhu, M.; Ge, D. Experimental study on mechanical behavior of PVB laminated glass under quasi-static and dynamic loadings. Compos. B Eng. 2011, 42, 302–308. [Google Scholar] [CrossRef]
- Timmel, M.; Kolling, S.; Osterrieder, P.; Du Bois, P.A. A finite element model for impact simulation with laminated glass. Int. J. Impact Eng. 2007, 34, 1465–1478. [Google Scholar] [CrossRef]
- Pyttel, T.; Liebertz, H.; Cai, J. Failure criterion for laminated glass under impact loading and its application in finite element simulation. Int. J. Impact Eng. 2011, 38, 252–263. [Google Scholar] [CrossRef]
- Peng, Y.; Yang, J.; Deck, C.; Willinger, R. Finite element modeling of crash test behavior for windshield laminated glass. Int. J. Impact Eng. 2013, 57, 27–35. [Google Scholar] [CrossRef]
- Elbelbisi, A.; El-Sisi, A.; Mahmoud, M.E.; Newberry, M.; Salim, H. Influence of interlayer types and thicknesses on the blast performance of laminated glass panels. Structures 2023, 57, 105231. [Google Scholar] [CrossRef]
- Bedon, C.; Santi, M.V. Vulnerability and Structural Capacity Assessment of Historic Glass Facades under Bird-Strike. Math. Probl. Eng. 2022, 2022, 6059466. [Google Scholar] [CrossRef]
- Chen, Z.; Schreyer, H.L. Formulation and Computational Aspects of Plasticity and Damage Models with Application to Quasi-Brittle Materials; Sandia National Laboratories (SNL-NM): Albuquerque, NM, USA, 1995. [Google Scholar]
- Hooper, P.A.; Sukhram, R.A.M.; Blackman, B.R.K.; Dear, J.P. On the blast resistance of laminated glass. Int. J. Solids Struct. 2012, 49, 899–918. [Google Scholar] [CrossRef]
- Nawar, M.; Salim, H.; Lusk, B.; Kiger, S. Modeling and shock tube testing of architectural glazing systems for blast resistance. J. Struct. Eng. 2015, 141, 04014174. [Google Scholar] [CrossRef]


Disclaimer/Publisher’s Note: The statements, opinions and data contained in all publications are solely those of the individual author(s) and contributor(s) and not of MDPI and/or the editor(s). MDPI and/or the editor(s) disclaim responsibility for any injury to people or property resulting from any ideas, methods, instructions or products referred to in the content. |
© 2023 by the authors. Licensee MDPI, Basel, Switzerland. This article is an open access article distributed under the terms and conditions of the Creative Commons Attribution (CC BY) license (https://creativecommons.org/licenses/by/4.0/).